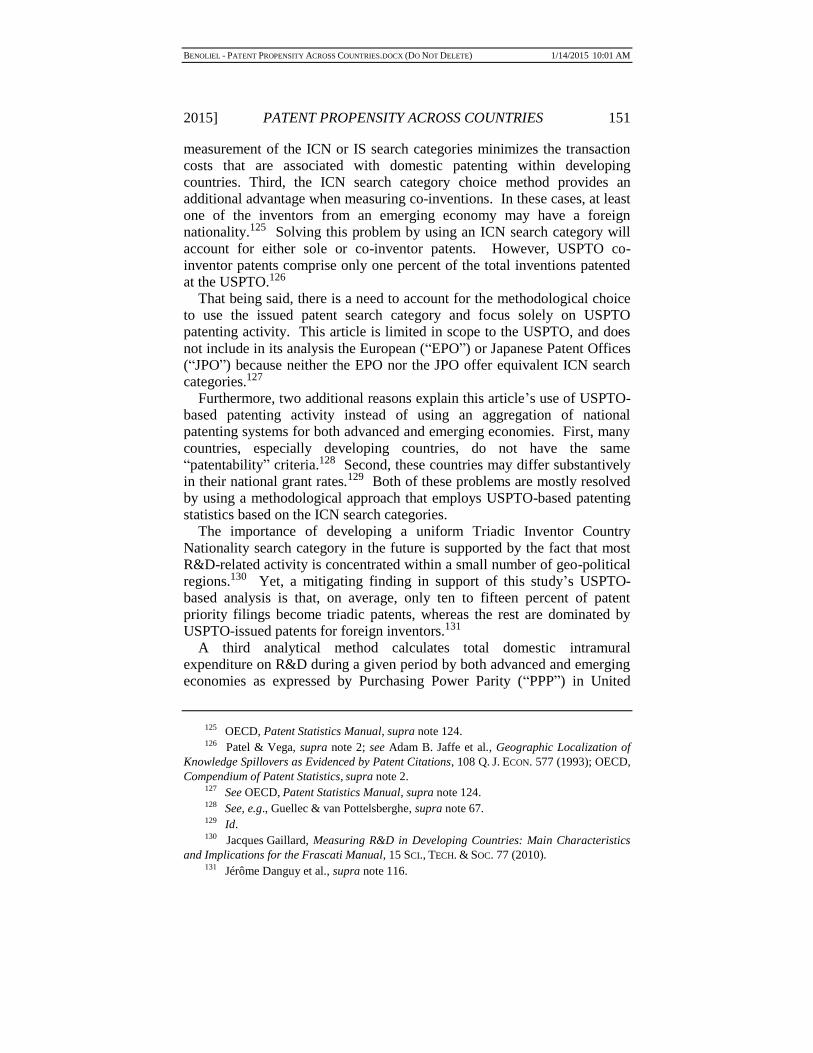
the impact of institutions on patent … impact of institutions on patent propensity across...
TRANSCRIPT

BENOLIEL - PATENT PROPENSITY ACROSS COUNTRIES.DOCX (DO NOT DELETE) 1/14/2015 10:01 AM
129
THE IMPACT OF INSTITUTIONS ON PATENT
PROPENSITY ACROSS COUNTRIES
Daniel Benoliel*
INTRODUCTION .......................................................................................... 130 I. INNOVATION-BASED GROWTH AND INSTITUTIONAL ANALYSIS ........... 134
A. Multinational Enterprises ......................................................... 134 B. The Domestic Business Sector .................................................. 140 C. The Government Sector ............................................................ 144
II. THE MODEL .......................................................................................... 147 A. Overview .................................................................................... 147 B. Methodology .............................................................................. 147 C. Findings ..................................................................................... 153
1. The Null Hypothesis (H0): Gap between Impact of Sectors over Patent Propensity .......................................... 153
2. The First Hypothesis (H1): The Business Sector in Emerging Economies ........................................................ 156
3. The Second Hypothesis (H2): Government Sector in Advanced Economies ........................................................ 161
III. THEORETICAL RAMIFICATIONS ........................................................... 164 CONCLUSION ............................................................................................. 167 APPENDIX A .............................................................................................. 169
ABSTRACT
This article offers a novel critique of the impact of institutions on the propensity to patent across countries. Patenting policy is known to carry
* Assistant Professor, University of Haifa Faculty of Law. This paper was presented at the
2013 Israeli Intellectual Property Academic Association Annual Meeting. I wish to
acknowledge the comments and assistance that I received from Susy Frankel, Lior Zemer,
Reto Hilty, Assaf Jacob, Niva Elkin Koren, and Uri Benoliel. For statistical support, I wish
to thank Pavel Goldstein as well as Professor Ayala Cohen and Dr. Etti Dove of the Statistics
Laboratory at the Faculty of Industrial Engineering and Management, the Technion – Israel
Institute of Technology. I also wish to thank my research assistant, David Hurtado. Any
inaccuracies are my responsibility.
BENOLIEL - PATENT PROPENSITY ACROSS COUNTRIES.DOCX (DO NOT DELETE) 1/14/2015 10:01 AM
130 BOSTON UNIVERSITY INTERNATIONAL LAW JOURNAL[Vol. 33:129
deep-rooted institutional implications. Yet in the case of developing countries, the United Nations created only loose policy concerning the role of the government, the business sector, and multinational enterprises in promoting patenting activity. The United Nations’ implicit laissez-faire approach to regulating the business sector equates developing countries with advanced ones. Within developing countries, twenty-four emerging
economies are presumed to have evolved into hotbeds for meaningful innovation, but little thought has thus far been given as to how their institutional particularities promote patenting as a proxy for domestic innovation.
Advanced economies and emerging economies diverge over how the innovation activity of their government and business sectors impacts the
propensity to patent. In emerging economies, there is a negative relationship between the innovation activity of the business sector and the propensity to patent. For advanced economies, on the other hand, there is a negative relationship between the innovation activity of the government and patent propensity. This article argues for a reexamination of the policy concerning the role of institutions in incentivizing patenting activity as a
proxy for domestic innovation in emerging economies.
INTRODUCTION
This article offers an empirical and theoretical critique of the impact of institutions on patent propensity across countries. To date, innovation-based economic growth theory has emphasized how multinational enterprises (“MNEs”) worldwide should promote research and development
(“R&D”), and particularly internationalized R&D conducted by MNEs.1 Internationalized R&D activity strongly correlates with increased patenting activity, which is measured by comparable national patent propensity rates. Yet the present day literature in support of R&D activity focuses mostly on advanced or developed countries. Thus, it is not surprising that there are a large number of scientific studies analyzing the experience of advanced
economies overall, or that several of these studies show an increasing internationalization of innovative activity by MNEs in these countries.2 In
1 Frieder Meyer-Krahmer & Guido Reger, New Perspectives on the Innovation
Strategies of Multinational Enterprises: Lessons for Technology Policy in Europe, 28 RES.
POL’Y 751 (1999). 2 Org. for Econ. Co-operation and Dev. [OECD], Compendium of Patent Statistics
(2008) [hereinafter OECD, Compendium of Patent Statistics], available at http://www.oecd.
org/science/inno/37569377.pdf; Alexander Gerybadze & Guido Reger, Globalization of
R&D: Recent Changes in the Management of Innovation in Transnational Corporations, 28
RES. POL’Y 251, 251 (1999); Pari Patel, Localized Production of Technology for Global
Markets, 19 CAMBRIDGE J. ECON. 141 (1995); Pari Patel & Modesto Vega, Patterns of
Internationalization of Corporate Technology: Location vs. Home Country Advantages, 28

BENOLIEL - PATENT PROPENSITY ACROSS COUNTRIES.DOCX (DO NOT DELETE) 1/14/2015 10:01 AM
2015] PATENT PROPENSITY ACROSS COUNTRIES 131
emerging countries, internationalized R&D may appear to be the leading institutional choice as opposed to government, higher education, or domestic business sector R&D. Motorola’s first-foreign owned R&D lab in China since 1993 is one such example. In India, General Electric engages in diverse R&D activities in areas such as aircraft engines, consumer durables, and medical equipment. Finally, the pharmaceutical companies
AstraZeneca, Eli Lilly, GlaxoSmithKline, Novartis, Pfizer, and Sanofi-Aventis conduct clinical research in India.3
Not surprisingly, internationalized R&D has also been the general, albeit mostly implicit, policy of different United Nations organs in recent years. The preference for internationalized R&D is apparent in the 2005 United Nations Millennium Project,4 as well as in the policies of the World
Intellectual Property Organization (“WIPO”)5 and the United Nations Economic Commission for Africa.6 Rooted in dependency theories of
RES. POL’Y 145 (1999). 3 See United Nations Conference on Trade and Dev., New York, U.S., July 2005,
World Investment Report 2005: Transnational Corporations and the Internationalization of
R&D, U.N. Doc. UNCTAD/WIR/2005 (2005) [hereinafter World Investment Report 2005]. 4 U.N. Millennium Project, Task Force on Sci., Tech. and Innovation, Innovation:
Applying Knowledge in Development, at 123 (Jan. 17, 2005) [hereinafter Applying
Knowledge in Development], available at http://www.unmillenniumproject.org/documents/
Science-complete.pdf (“[A] thriving private sector depends fundamentally on adequate
infrastructure, human capital, and research and development. . . . Through support for higher
education and for research and development outlays, the government lays the groundwork
for economic growth through technological advance.”). 5 See World Intellectual Prop. Org. [WIPO], The Economics of Intellectual Property:
Suggestions for Research in Developing Countries and in Countries with Economies in
Transition, at 22 (Jan. 2009) [hereinafter WIPO, The Economics of Intellectual Property],
available at http://www.wipo.int/export/sites/www/ip-development/en/economics/pdf/wo
_1012_e.pdf (focusing on developing countries mostly while reemphasizing that R&D is the
most important economic indicator on how effective the innovation process is); see generally
WIPO, The 45 Adopted Recommendations under the WIPO Development Agenda (2007)
[hereinafter WIPO, 45 Adopted Recommendations], available at http://www.wipo.int/ip-
development/en/agenda/recommendations.html (“To encourage Member States, especially
developed countries, to urge their research and scientific institutions to enhance cooperation
and exchange with research and development institutions in developing countries, especially
LDCs.”). 6 See Applying Knowledge in Development, supra note 4 (emphasizing the role of
innovation and underlying investment needs as a basis for economic transformation). But
see, e.g., INNOVATION AND THE DEVELOPMENT AGENDA 136 (Erika Kraemer-Mbula & Watu
Wamae eds., 2009); Rasigan Maharajh & Erika Kraemer-Mbula, Innovation Strategies in
Developing Countries, INST. FOR ECON. RESEARCH ON INNOVATION, http://www.ieri.org.za/
sites/default/files/IERI_WP_2009_003.pdf (last visited Sept. 24, 2014); Andreanne Léger &
Sushmita Swaminathan, Innovation Theories: Relevance and Implications for Developing
Country Innovation (Ger. Inst. for Econ. Research, Discussion Paper No. 743, 2007).
BENOLIEL - PATENT PROPENSITY ACROSS COUNTRIES.DOCX (DO NOT DELETE) 1/14/2015 10:01 AM
132 BOSTON UNIVERSITY INTERNATIONAL LAW JOURNAL[Vol. 33:129
development that perceived developing countries as dependent on developed countries, the Trade-Related Aspects of Intellectual Property Rights (“TRIPS”) agreement’s implicit pledge for freer trade was meant to encourage the business sector to foster domestic innovation in developing countries backed by patenting activity.7 TRIPS primarily followed and continues to follow the World Bank and the United Nations Conference on
Trade and Development’s (“UNCTAD”) labeling of technology transfer as a reactive form of innovation-based economic growth.8 Rather than promoting domestic innovation through enhancing technological capacity within developing countries, under TRIPS, innovation was to be received by developing countries and, at most, adapted.9 Thus, the business sector was expected to foster international trade in technology.10 However, a
more careful look reveals that the business sector both domestically and from overseas has partially fallen short of these high expectations.
This article compares two groups of countries: the twenty-four emerging economies that the International Monetary Fund (“IMF”) lists as leading the developing world in innovation activity and the thirty-two established, advanced economies.11 This article also analyzes statistical trends in the
propensity to patent as a proxy for domestic innovation by the government and the business sector (both domestic and foreign, largely through MNEs) between 1996 and 2011.
Any effective innovation strategy requires coordination of multiple layers of institutional policies.12 The concern over the role that these institutional
7 Agreement on Trade-Related Aspects of Intellectual Property Rights, Apr. 15, 1994,
Marrakesh Agreement Establishing the World Trade Organization, Annex 1C, 1869
U.N.T.S. 299 [hereinafter Agreement on Trade-Related Aspects of Intellectual Property
Rights]. 8 See World Bank, Innovation Policy: A Guide for Developing Countries, at 116
(2010); INT’L CTR. FOR TRADE AND SUSTAINABLE DEV., INTELLECTUAL PROPERTY RIGHTS:
IMPLICATIONS FOR DEVELOPMENT (2003), available at http://www.ictsd.org/sites/default/
files/research/2008/06/pp_3ch_01.pdf. 9 See supra note 8. 10 See generally Patel & Vega, supra note 2. 11 As of July 16, 2012, advanced economies include: Australia, Austria, Belgium,
Canada, Cyprus, Czech Republic, Denmark, Finland, France, Germany, Greece, Iceland,
Ireland, Israel, Italy, Japan, South Korea, Luxemburg, Malta, the Netherlands, New Zealand,
Norway, Portugal, Singapore, Slovak Republic, Slovenia, Spain, Sweden, Switzerland,
Taiwan, the United Kingdom, and the United States. See Data and Statistics, INT’L
MONETARY FUND, http://www.imf.org/external/data.htm (last visited Oct. 1, 2014).
Emerging economies include: Mexico, Argentina, Pakistan, Brazil, Peru, Bulgaria,
Philippines, Chile, Poland, China, Romania, Estonia, Russia, Hungary, South Africa, India,
Thailand, Indonesia, Turkey, Latvia, Ukraine, Lithuania, Venezuela, and Malaysia. Id. 12 See, e.g., European Comm’n, The Globalising Learning Economy: Implications for
Innovation Policy (Dec. 1997), available at http://www.globelicsacademy.org/2011_pdf/
BENOLIEL - PATENT PROPENSITY ACROSS COUNTRIES.DOCX (DO NOT DELETE) 1/14/2015 10:01 AM
2015] PATENT PROPENSITY ACROSS COUNTRIES 133
actors have in promoting patenting activity stems from their impact on domestic innovation in developing countries. This corresponds with Ed Mansfield’s definition of patent propensity as the percentage of patentable inventions that are in fact patented.13
The analysis in this article departs conceptually from neoclassical economic growth theory and the present-day preference for MNE-based
R&D in developed and developing countries. In so doing, this article uses a model that comprises two R&D-related variables: the financing and the performance of Gross Domestic Expenditure on R&D (“GERD”) in three types of innovating sectors: the government sector, the business sector, and private investment from abroad by MNEs. The local and foreign business sectors are frequently combined into one general business sector.14
Developing countries stand out in their ability to attract foreign direct investment (“FDI”), trade, and technology.15 Arguably, they also differ in their overall abilities to innovate and make use of intellectual property protection. Traditional approaches to understanding these differences are
Lundvall%20Borras%201997.pdf; Sanjaya Lall & Morris Teubal, “Market-Stimulating”
Technology Policies in Developing Countries: A Framework with Examples from East
Asia, 26 WORLD DEV. 1369 (1998) (for the context of East Asia); Isabel Maria
Bodas Freitas & Nick von Tunzelmann, Alignment of Innovation Policy Objectives: A
Demand Side Perspective (Danish Research Unit for Indus. Dynamics, Working Paper No.
13-02, 2008). In his seminal book on the fastest growing markets among the billions of poor
people at the bottom of the financial pyramid, C. K. Prahalad models innovation through
distributive justice policies that are also profitable while adhering to the central role of
institutions and governments in particular. COIMBATORE KRISHNARAO PRAHALAD, THE
FORTUNE AT THE BOTTOM OF THE PYRAMID: ERADICATING POVERTY THROUGH PROFITS 81-84
(Steve Kobrin ed., 2005); see also INNOVATION AND THE DEVELOPMENT AGENDA, supra note
6, at 142. 13 See Edward Deering Mansfield, Patents and Innovation: An Empirical Study, 32
MANAGEMENT SCI. 173 (1986). At the firm level, patent propensity means the percentage of
innovative firms in a sector that has applied for at least one patent over a defined period of
time. Compare Isabelle Kabla, The Patent as Indicator of Innovation, 1 INSEE STUD. ECON.
STAT. 56 (1996), with Georg Licht & Konard Zoz, Patents and R&D: An Econometric
Investigation Using Applications for German, European, and US Patents by German
Companies (Zentrum fur Europaische Wirtschaftsforschung, ZEW Discussion Paper No. 96-
19, 1996). 14 This analysis uses the 2011 United Nations Educational, Scientific and Cultural
Organization (“UNESCO”) Science and Technology (“S&T”) Statistical Report referring to
“Table 27: GERD by sector of performance and Table 28: GERD by source of funds.” See
U.N. Educ., Sci., and Cultural Org. [UNESCO], UNESCO Science Report, at 482 (2010),
available at http://unesdoc.unesco.org/images/0018/001899/189958e.pdf. Table 27 does not
include data on performance by entities from abroad. Id. The summation of domestic and
foreign business sectors are only found in Table 28. Id. 15 See Daniel Benoliel & Bruno Salama, Towards an Intellectual Property Bargaining
Theory: The Post-WTO Era, 32 U. PA. J. INT’L L. 265, 275-90 & nn. 25-90 (2010).
BENOLIEL - PATENT PROPENSITY ACROSS COUNTRIES.DOCX (DO NOT DELETE) 1/14/2015 10:01 AM
134 BOSTON UNIVERSITY INTERNATIONAL LAW JOURNAL[Vol. 33:129
characteristically based on the classic North-South dichotomy, or some variation thereof.16 Of the 162 developing countries, only twenty-five (all emerging economies but one) make up about ninety percent of developing countries’ GDP.17 Only the twenty-four emerging economies are presently perceived as a breeding ground for significant innovation in the developing world.18 Therefore, this article focuses on these twenty-four emerging
economies while evaluating the impact of competing institutions on the propensity to patent as proxy for domestic innovation.
I. INNOVATION-BASED GROWTH AND INSTITUTIONAL ANALYSIS
Over the past twenty years, member countries of the Organization of Economic Co-operation and Development (“OECD”) have experienced an increase in business-sector R&D.19 Foreign R&D, mostly associated with
MNEs, has been stable, whereas government-sponsored R&D has decreased.20 This section reviews the literature on the three types of institutions that promote patenting activity: MNEs, the domestic business sector, and the government sector.
A. Multinational Enterprises
In recent years, the finance of R&D by MNEs has assumed a greater
importance in several countries. To illustrate, an OECD report indicates that between 1995 and 2004, the amount that Western European multinationals spent on R&D outside their home countries increased from twenty-six percent to forty-four percent.21 Similarly, between 1995 and
16 See Paul Krugman, A Model of Technology Transfer, and the World Distribution of
Income, 87 J. POL. ECON. 253, 254-55 (1979). 17 See World Bank, The Growth Report: Strategies for Sustained Growth and Inclusive
Development, at 111 (June 2008), available at http://siteresources.worldbank.org/
EXTPREMNET/Resources/489960-1338997241035/Growth_Commission_Final_Report
.pdf (adding that the ten largest developing countries account for about seventy percent of
developing countries’ GDP). 18 Grace Segran, As Innovation Drives Growth in Emerging Markets, Western
Economies Need to Adapt, INSEAD KNOWLEDGE (Jan. 25, 2011), http://knowledge.insead.
edu/entrepreneurship-innovation/western-economies-need-to-adapt-804; see also SUBHASH
C. JAIN, EMERGING ECONOMIES AND THE TRANSFORMATION OF INTERNATIONAL BUSINESS
(2006). Similarly, Alice Amsden identifies twelve countries that have acquired considerable
manufacturing experience: China, Indonesia, India, South Korea, Malaysia, Taiwan,
Thailand, Argentina, Brazil, Chile, Mexico, and Turkey. ALICE H. AMSDEN, THE RISE OF
“THE REST”: CHALLENGES TO THE WEST FROM LATE-INDUSTRIALIZING ECONOMIES (2001). 19 See, e.g., World Investment Report 2005, supra note 3, at 3. 20 Id. 21 See Bronwyn Hall, The Internationalization of R&D 2 (UNU-Merit, Working Paper
No. 2011-049, 2010).

BENOLIEL - PATENT PROPENSITY ACROSS COUNTRIES.DOCX (DO NOT DELETE) 1/14/2015 10:01 AM
2015] PATENT PROPENSITY ACROSS COUNTRIES 135
2004, the amount that Japanese multinationals spent on R&D outside Japan rose from five percent to eleven percent, and by North American multinationals, from twenty-three percent to thirty-two percent.22 Since then, these same multinationals have continued to increase their investments in developing countries, especially in Brazil, India, and China.23 For instance, a report published by Goldman Sachs in 2010
identifies several R&D facilities in China, India, and Brazil financed by Ford, IBM, Pfizer, Microsoft, Intel, Cisco, and Boeing.24
The principal idea behind innovation theory is that MNEs play a central role in fostering innovation, which results in economic growth.25 The connection between economic growth and innovation was first explored by Cambridge University economist Nicholas Kaldor in 1957. As Kaldor
theorized, differing rates of technology adoption explained the diverging level of development across countries.26 The underlying idea was that
22 Id. 23 See Douglas Gilman, The New Geography of Global Innovation, INNOVATION
MANAGEMENT.SE, http://www.innovationmanagement.se/2010/10/07/the-new-geography-of-
global-innovation-from-the-global-markets-institute-at-goldman-sachs (last visited Oct. 11,
2014). 24 Hall, supra note 21, at 2. An additional source of R&D funding comes from
“nonprofit institutions,” including charitable trusts. Some of these trusts were created by
wealthy individuals following success in the private sector. See CHRISTINE GREENHALGH &
MARK ROGERS, INNOVATION, INTELLECTUAL PROPERTY AND ECONOMIC GROWTH 89 (2010). 25 For UNESCO S&T data and indicators for R&D funding from abroad analyzed in
the statistical model in Part II, see OECD, Proposed Standard Practice for Surveys on
Research and Experimental Development: Frascati Manual, § 229 (6th ed. 2002)
[hereinafter Frascati Manual], available at http://www.oecd-ilibrary.org/science-and-
technology/frascati-manual-2002_9789264199040-en. Concerning R&D statistics within the
UNESCO dataset that are analyzed in the empirical model in Part II, “abroad” refers to “[a]ll
institutions and individuals located outside the political borders of a country; except
vehicles, ships, aircraft and space satellites operated by domestic entities and testing grounds
acquired by such entities.” Id. In addition, “abroad” includes “[a]ll international
organizations (except business enterprises), including facilities and operations within a
country’s borders.” Id. For additional discussion, also see id. at 72-73. Funding sources
include overseas business enterprises, other national governments, private non-profit, higher
education, and overseas international organizations. Id. at 73. 26 See Nicholas Kaldor, A Model of Economic Growth, 67 ECON. J. 591 (1957). The
latter analysis has been measured using rampant patent statistics methodology. See Charles I.
Jones & Paul M. Romer, The New Kaldor Facts: Ideas, Institutions, Population, and Human
Capital 8 (Nat’l Bureau of Econ. Research, Working Paper No. 15094, 2009). To illustrate,
Stanford University professors Charles Jones and Paul Romer recently exemplified the usage
of patent statistics over Kaldor’s growth theory. See id. (offering cross-country patent
statistics for measuring international flows of ideas alongside trade and FDI as key facets for
economic growth).
BENOLIEL - PATENT PROPENSITY ACROSS COUNTRIES.DOCX (DO NOT DELETE) 1/14/2015 10:01 AM
136 BOSTON UNIVERSITY INTERNATIONAL LAW JOURNAL[Vol. 33:129
investment and learning were interrelated and that the rate at which they took place determined technological progress.27 Investment in research and development would orient the direction of technological change in every country.28
In a highly cited 1995 study of the trade-related impact of international R&D spillovers on a country’s total factor productivity (“TFP”),29 David T.
Coe and Elhanan Helpman further emphasized the importance of foreign R&D capital stock.30 Focusing solely on developed countries, Coe and Helpman measured the importance of R&D capital stock by calculating the elasticity of a country’s TFP with respect to R&D capital stock. The evidence suggested that there was a close link between productivity and R&D capital stock. A country’s TFP depends not only on its own R&D
capital stock, as suggested by the theory, but also on the R&D capital stock of its trade partners.31 Simply put, roughly one quarter of the total remuneration of R&D investment in a G7 country accrued to its trade partners.32 Finally, Coe and Helpman estimated that the foreign R&D capital stock may have been at least as important as the domestic R&D capital stock in smaller countries.33 In the larger G7 countries, the domestic
27 Kaldor, supra note 26, at 591. 28 Id. 29 TFP is a function of the domestic R&D capital stock and a measure of the foreign
R&D capital stock, where all the measures of R&D capital were constructed from the
business sector’s R&D activities. See David. T. Coe & Elhanan Helpman, International
R&D Spillovers, 39 EUR. ECON. REV. 859, 859 (1995). 30 Foreign R&D has a stronger effect on domestic productivity as the share of domestic
imports in GDP increases. See id. at 874. It is estimated that the rate of return of R&D is
123 percent for the G7, and eighty-five percent for the other fifteen countries analyzed by
Coe and Helpman. Id. Of equal importance, the spillover return from the G7 is thirty-two
percent, implying that roughly a quarter of the benefits from R&D in G7 countries accrues to
their trading partners. Id. 31 Id. at 875. 32 Id. at 874. 33 Id. at 861. But see Chiwha Kao & Min-Hsien Chiang, International R&D Spillovers:
An Application of Estimation and Inference in Panel Cointegration, 61 OXFORD BULL. ECON.
STAT. 691, 691-709 (1999) (using a different empirical methodology thus finding co-
integration between the TFP and R&D variables, using co-integration tests that are
appropriate for panel data); Wolfgang Keller, Are International R&D Spillovers Trade-
Related? Analyzing Spillovers among Randomly Matched Trade Partners, 42 EUR. ECON.
REV. 1469 (1997) (casting doubt on Coe and Helpman’s finding concerning the effect of
foreign R&D spillovers by showing that significant foreign R&D spillovers can be obtained
when the weights in the construction of the spillover are random rather than based on import
shares); Frank Lichtenberg & Bruno van Pottelsberghe, International R&D Spillovers: A
Comment, 42 EUR. ECON. REV. 1483 (1998) (criticizing Coe and Helpman’s weighting of the
foreign R&D stocks by means of the proportion of total imports originating from the foreign
R&D sources); Bruno van Pottelsberghe & Frank Lichtenberg, Does Foreign Direct
BENOLIEL - PATENT PROPENSITY ACROSS COUNTRIES.DOCX (DO NOT DELETE) 1/14/2015 10:01 AM
2015] PATENT PROPENSITY ACROSS COUNTRIES 137
R&D capital stock may have been even more significant.34 To date, the innovation-based economic growth literature has emphasized
how R&D, and internationalized R&D in particular, should be promoted by MNEs worldwide.35 Yet across the board, present day literature merely focuses on advanced or developed countries.36 Anecdotally, it appears that internationalized R&D in emerging economies has triumphed.37 Examples
include Motorola’s first foreign-owned R&D lab in China since 1993, the R&D activities of General Electric in India in areas as diverse as aircraft engines, consumer durables, and medical equipment, and clinical research by pharmaceutical companies such as AstraZeneca, Eli Lilly, GlaxoSmithKline, Novartis, Pfizer, and Sanofi-Aventis in India.38
Not surprisingly, internationalized R&D has also been the general policy
of different United Nations organs in recent years. Internationalized R&D is present in the 2005 United Nations Millennium Project,39 the views of WIPO,40 and even the United Nations Economic Commission for Africa.41 A more careful look reveals that the United Nations’ implied policy of support to MNEs in the promotion of innovation in the developing world seems to have fallen short of meeting its high expectations.
First, at present, MNEs hardly invest in emerging economies although a few developing countries have evolved into hotbeds for meaningful innovation, and are leading the developing world.42 For instance, UNCTAD’s seminal 2005 World Investment Report shows that only China,
Investment Transfer Technology Across Borders?, 83 REV. ECON. STAT. 490, 497 (2001)
(providing evidence for outward FDI as an overlooked channel of international R&D
spillovers). When they re-estimate the Coe and Helpman specification with a dynamic
ordinary least squares (“DOLS”) estimator, which is not biased in small samples unlike the
ordinary estimator, they no longer obtain a significant effect for the trade-related foreign
R&D spillover. See id. 34 See Coe & Helpman, supra note 29, at 861. But see Keller, supra note 33. 35 Meyer-Krahmer & Reger, supra note 1, at 776. 36 Id. 37 See World Investment Report 2005, supra note 3. 38 See id. 39 Applying Knowledge in Development, supra note 4, at 123. 40 See, e.g., WIPO, World Intellectual Property Report: The Changing Face of
Innovation, at 23-72 (2011) [hereinafter WIPO, The Changing Face of Innovation],
available at http://www.interface.ulg.ac.be/docs/wipo.2011.pdf; WIPO, The Economics of
Intellectual Property, supra note 5, at 22; WIPO, 45 Adopted Recommendations, supra note
5. 41 See Applying Knowledge in Development, supra note 4, at 123 (emphasizing the role
of innovation and underlying investment needs as a basis for economic transformation). But
see, e.g., INNOVATION AND THE DEVELOPMENT AGENDA, supra note 6; Léger &
Swaminathan, supra note 6. 42 Meyer-Krahmer & Reger, supra note 1.
BENOLIEL - PATENT PROPENSITY ACROSS COUNTRIES.DOCX (DO NOT DELETE) 1/14/2015 10:01 AM
138 BOSTON UNIVERSITY INTERNATIONAL LAW JOURNAL[Vol. 33:129
the Republic of Korea, Taiwan, and Brazil came close to or exceeded $5 billion in total gross yearly expenditure on GERD as of 2002 (the latest available year of UNCTAD’s report).43 Ironically, this level of R&D expenditure has been hailed as a successful internationalization of the R&D process.44
Yet even in large emerging economies, such as India, Mexico, and the
Russian Federation, MNEs have invested well below $5 billion in R&D.45 Further, in the relatively poorer emerging economies of Southeast Europe and the former Soviet Bloc’s Commonwealth of Independent States (“CIS”), MNEs have invested even less.46 This trend explains why in the United States, most patents assigned to entities in the twenty-five countries, which make up ninety percent of developing countries’ GDP, were rarely
owned by foreign affiliates.47 Instead, the patents were principally owned by domestic enterprises and public institutions.48
Second, only a limited number of MNEs originate from the developing world. UNCTAD’s 2005 report shows that over eighty percent of the 700 largest R&D spending firms come from only five advanced economies: the United States, Japan, Germany, the United Kingdom, and France, in
43 See World Investment Report 2005, supra note 3, at 119-20 & tbl.III.1. For an
interesting study of the internationalization of R&D over two different time periods, see
Hall, supra note 21, at 3, 22 fig.1. As Hall explains, two basic facts about the distribution of
GDP and R&D performance are apparent during these two time periods. Id. at 3. The first is
that R&D performance is slightly more concentrated than GDP (Gini coefficients of 0.78 in
1999 and 0.75 in 2005 as opposed to 0.69 in both years for GDP). Id. Second, R&D has been
becoming less concentrated over time, even during this brief six-year period, in contrast to
the GDP concentration, which has remained essentially unchanged. This change, although it
appears small, reflects the internationalization of R&D that has taken place during the same
period. Id. 44 See also GREENHALGH & ROGERS, supra note 24, at 344. (acknowledging that
according to UNCTAD’s 2005 report, “the speed of the internationalization of R&D [has]
increased substantially in recent years”). 45 Id. 46 Id. 47 Id. at 134 (for data collected from 2001 to 2003, and referring in Table IV.11 to
South Africa, Egypt, Kenya, Taiwan, Republic of Korea, China, Singapore, Hong Kong
(China), India, Malaysia, Turkey, Thailand, Philippines, Saudi Arabia, Indonesia, Brazil,
Mexico, Argentina, Bahamas, Bermuda, Cuba, Chile, Russian Federation, Ukraine, and
Bulgaria). Only in Bulgaria and Brazil did foreign affiliates account for more than twenty
percent of all patents assigned. Id. In India and Cuba, public research institutions accounted
for the largest shares (sixty-eight percent and eighty-four percent respectively) of those
countries’ totals. Public research institutions in Singapore, the Russian Federation, and
Ukraine also receive a significant proportion of the patents assigned by the United States
Patent and Trademark Office (“USPTO”). Id. 48 Id.

BENOLIEL - PATENT PROPENSITY ACROSS COUNTRIES.DOCX (DO NOT DELETE) 1/14/2015 10:01 AM
2015] PATENT PROPENSITY ACROSS COUNTRIES 139
descending order.49 Only one percent of the top 700 MNEs are based in developing countries or Southeast Europe and the CIS.50 Nearly all MNEs originating from developing countries come from Asia, notably from Taiwan and the Republic of Korea.51
Lastly, most of the 700 largest R&D spenders are concentrated in relatively few industries and offer little adaptability for the plethora of
innovative activities occurring in emerging economies.52 In 2003, more than half of the 700 largest R&D spenders operated in only three industries: information technology hardware, automotive, and pharmaceuticals and biotechnology.53 Clearly, this industrial concentration is insufficient to meet the innovation and growth needs of the entire group of emerging economies.
In sum, the role of MNEs in fostering innovation in emerging economies is disputable at best. As even the UNCTAD 2005 World Investment Report indicates, few developing countries participate in R&D internationalization.54 Furthermore, it remains questionable whether MNEs contribute to an increase in the propensity in these countries to patent as a proxy for meaningful domestic innovation. The statistical model that this
article presents in Part II corroborates this fact, and compares the situation in developing countries to that in advanced economies.
49 Id. tbl.IV.2. The IMF’s Balance of Payments Manual (5th ed. 1993) and the OECD
Benchmark Definition of Foreign Direct Investment (3d ed. 1995) provide guidelines for
compiling FDI flows. International Monetary Fund [IMF], Balance of Payments Manual
(1993); OECD, Benchmark Definition of Foreign Direct Investment (1995). The largest
transnational corporations (“TNCs”) remain geographically concentrated in a few home
countries. Id. The United States dominated the list with twenty-five entries. Id. Hong Kong,
China, and Singapore remained the most important home economies, with ten and nine
entries in the list respectively. Id. Taiwan, with eight companies in the top fifty, became the
home economy with the third largest contingent of TNCs on the list largely owing to its
electronics companies. Id. The growth of this economy was mainly at the expense of South
Africa, which had four companies listed in the top fifty in 2003 compared to seven in 2002.
See World Investment Report 2005, supra note 3, at 16-17. 50 GREENHALGH & ROGERS, supra note 24, at 120. Several countries have moved up
the ranks since the late 1990s. Id. 51 Id. at 121. Only one multinational corporation comes from Africa and two are from
Latin America. Id. 52 Id. 53 Id. 54 See World Investment Report 2005, supra note 3 (adding that the fact that some
developing countries are now perceived as attractive locations for highly complex R&D
permits countries to develop the capabilities that are needed to connect with the global R&D
systems of TNCs).
BENOLIEL - PATENT PROPENSITY ACROSS COUNTRIES.DOCX (DO NOT DELETE) 1/14/2015 10:01 AM
140 BOSTON UNIVERSITY INTERNATIONAL LAW JOURNAL[Vol. 33:129
B. The Domestic Business Sector
In institutional analysis, another sector that fosters innovation is the domestic business sector.55 The domestic business sector is unquestionably influential in the propensity to patent in both developed and developing countries, abridging the North-South divide. In the institutional realm of imperfect alternatives, the question remains: What role does the domestic
business sector play in promoting domestic innovation and patent propensity in developing countries compared to the role of governments and MNEs?
Notwithstanding its deep-rooted innovation implications, the TRIPS Agreement is a point of departure concerning the role of the domestic business sector.56 Rooted in dependency theories of development, the
TRIPS Agreement was predominantly accepted as a trade-related compromise.57 Ironically the TRIPS Agreement’s idealistic pledge for freer trade may possibly undermine the role of the business sector in directly fostering innovative activity. TRIPS follows the World Bank and UNCTAD in categorizing technology transfer as a reactive form of innovation-based economic growth for developing countries.58 Rather than
promoting domestic innovation by promoting local technological capacity, innovation is to be received and, at most, adapted.59 Under the TRIPS Agreement, the business sector was intended to foster technologically-based trade.60 Thus, the growth of domestic innovation through an enhanced patenting yield in developing countries was possibly challenged.
55 For UNESCO S&T data and indicators for business enterprise intramural
expenditure on R&D (“BERD”), analyzed in Part II’s statistical model, see Frascati Manual,
supra note 25, § 163. R&D expenditure in the business sector in the context of R&D
statistics refers to “[a]ll firms, organizations and institutions whose primary activity is the
market production of goods or services (other than higher education) for sale to the general
public at an economically significant price.” Id. It also includes “[t]he private non-profit
institutions mainly serving them.” Id. For additional discussion, see id. at 54-56. 56 Agreement on Trade-Related Aspects of Intellectual Property Rights, supra note 7. 57 See JAYASHREE WATAL, INTELLECTUAL PROPERTY RIGHTS IN THE WTO AND
DEVELOPING COUNTRIES 20 (2001) (explaining how developed countries agreed to phase out
their quotas under the Agreement on Textiles and Clothing (“ATC”) on the most sensitive
items of textiles and clothing in exchange for developing countries’ acceptance of the
phasing-in of product patents for pharmaceuticals, which they perceived as the most
important patent-related good); see also Frederick M. Abbott, The WTO TRIPS Agreement
and Global Economic Development, in PUBLIC POLICY AND GLOBAL TECHNOLOGICAL
INTEGRATION 39, 39-40 (Frederick M. Abbott & David J. Gerber eds., 1997); Charles S.
Levy, Implementing TRIPS – A Test of Political Will, 31 LAW & POL’Y INT’L BUS. 789, 790
(2000). 58 See supra note 8. 59 Id. 60 Id.
BENOLIEL - PATENT PROPENSITY ACROSS COUNTRIES.DOCX (DO NOT DELETE) 1/14/2015 10:01 AM
2015] PATENT PROPENSITY ACROSS COUNTRIES 141
In a 2012 report, WIPO enumerates several important factors that curb innovation in the developing world.61 The first factor, poor involvement of the business community in innovative activity, demonstrates the importance of institutional choice in developing countries.62 The report goes on to indicate a need for an enhanced private-public partnership.63 Yet the preference continues to be business-led innovation. For example, WIPO
does not suggest the implementation of a separate regulatory regime for the government sector in engaging in or even financing innovative activity in developing countries. The report further notes that the impact of business R&D is much greater than the impact of public R&D as the latter undesirably “take[s] a long time to materialize.”64 Nonetheless, business-led innovation continues to pose a policy challenge. The expansion of trade
and capital flows—as the TRIPS Agreement contemplates—should not preclude the promotion of local innovative efforts.65 To the contrary, economic liberalization makes it necessary for the business sector in developing countries to acquire the technological and innovative capabilities necessary to becoming or remaining competitive.66
A sharper institutional choice arises in innovation-based economic
growth literature where the effect of business R&D on productivity in developed countries has been intensively investigated. This investigation has been performed for four levels of aggregation: the business unit, the firm, the industry, and the country. But as previously mentioned, most empirical analysis in innovation-based economic growth literature focused on advanced economies, especially the United States. All of this analysis
not only confirmed the importance of business R&D but also found that the estimated elasticity of output with respect to business R&D varied from ten percent to an impressive thirty percent rate of return.67
61 See WIPO, The Economics of Intellectual Property, supra note 5, at 9. 62 Id. (stating in its first recommendation: “[p]oor involvement of the business
community in innovation policy elaboration and implementation (including funding of
innovation projects)”). 63 Id. (stating in its second recommendation: “[p]oor development of public-private
partnerships,” and in its fifth recommendation: “[i]nadequate level of interaction between
public and private research centres”). 64 See WIPO, The Changing Face of Innovation, supra note 40, at 142 (“The
contribution of public R&D can take also a long time to materialize.”). 65 Cf. World Investment Report 2005, supra note 3. 66 Id. 67 Id. at 4; Dominique Guellec & Bruno van Pottelsberghe, The Impact of Public R&D
Expenditures on Business R&D (OECD Sci., Tech. and Indus., Working Paper No. 2000/4,
2000) (offering estimates based on a panel dataset composed of sixteen major OECD
countries between 1980 and 1998, and suggesting that, in these countries, the domestic
business sector, the government, and foreign R&D contribute significantly to output on
multifactor productivity growth); M. Ishaq Nadiri, Innovations and Technological Spillovers

BENOLIEL - PATENT PROPENSITY ACROSS COUNTRIES.DOCX (DO NOT DELETE) 1/14/2015 10:01 AM
142 BOSTON UNIVERSITY INTERNATIONAL LAW JOURNAL[Vol. 33:129
Economists Luc Soete and Parimal Patel performed the earliest panel data analysis for five countries, which confirmed the impact of business-sector R&D on innovation-based economic growth.68 In turn, Columbia University economist Frank Lichtenberg was probably the first to analyze a large country dataset,69 using a cross section of fifty-three countries to corroborate the impact of business-related R&D on labor productivity.70
Additionally, economists David Coe and Elhanan Helpman, as well as Walter Park, were the first to combine a large number of countries with a time series analysis.71 In doing so, Coe, Elhanan, and Park found that business R&D played a significant role in fostering productivity.72
At about the same time, Professor Bronwyn Hall used a separate market-value approach to assess the R&D returns in U.S. manufacturing firms
between 1973 and 1991.73 Hall’s approach revealed that R&D spending
(Nat’l Bureau of Econ. Research, Working Paper No. 4423, 1993). This large variation is
naturally due to the fact that studies differ over the econometric specification, data sources,
number of economic units, and measurement methods for R&D. Similarly, Zvi Griliches and
Jacques Mairesse found that U.S. manufacturing firms’ rates of return to private R&D were
around twenty to forty percent. See Zvi Griliches & Jacques Mairesse, Heterogeneity in
Panel Data: Are There Stable Production Functions? (Nat’l Bureau of Econ. Research,
Working Paper No. 2619, 1998); see also Zvi Griliches & Jacques Mairesse, R&D and
Productivity Growth: Comparing Japanese and the United States Manufacturing Firms, in
PRODUCTIVITY GROWTH IN JAPAN AND THE UNITED STATES 317 (Charles R. Hulten ed., 1990)
(also finding rates of return in the range of thirty to forty percent for the Japanese business
sector). Bronwyn Hall and Jacques Mairesse found returns to French firms in the 1980s
between twenty-two and thirty-four percent. See Bronwyn H. Hall & Jacques Mairesse,
Exploring the Relationship Between R&D and Productivity in French Manufacturing Firms,
65 J. ECONOMETRICS 263, 263-93 (1995). Finally, Dietmar Harhoff found a rate of return of
around twenty percent for German firms from 1979 to 1989. Dietmar Harhoff, R&D and
Productivity in German Manufacturing Firms, 6 ECON. INNOVATION & NEW TECH. 29, 29-49
(1998). 68 See Luc Soete & Pari Patel, Importations Technologiques et Croissance
Economique, 36 REVUE ECONOMIQUE 975 (1985). 69 See Frank Lichtenberg, R&D Investment and International Productivity Differences,
in ECONOMIC GROWTH IN THE WORLD ECONOMY: SYMPOSIUM 1992 89 (Horst Seibert ed.,
1993). 70 Id. 71 A time series is a sequence of data points, which are typically assessed at successive
points in time. These points are spaced at uniform time intervals. 72 See Coe & Helpman, supra note 29 (finding that domestic R&D contributes
significantly to productivity growth and that this impact is substantially higher for the G7
than for other developed countries); Walter G. Park, International R&D Spillovers and
OECD Economic Growth, 33 ECON. INQUIRY 571 (1995). 73 See Bronwyn Hall, The Stock Market’s Valuation of R&D Investment During the
1980s, 83 AM. ECON. REV. 259 (1993).
BENOLIEL - PATENT PROPENSITY ACROSS COUNTRIES.DOCX (DO NOT DELETE) 1/14/2015 10:01 AM
2015] PATENT PROPENSITY ACROSS COUNTRIES 143
was positively associated with share market value.74 In fact, current R&D spending was found to have a stronger association with share market value than R&D stock (calculated by depreciating past R&D at fifteen percent), which indicated that the financial market considers current R&D a better indicator of future performance.75 Hall’s ultimate conclusion was that the magnitude of the association between R&D spending and share market
value suggests that the returns to R&D are two to three times greater than returns for a normal investment.76
Studies into the impact of business R&D on productivity returned supportive findings overall. However, none of these studies compared the impact of business R&D between developing countries and developed countries, notwithstanding that domestic innovation is predominantly
patent-based in Southeast Europe and the CIS countries.77 As UNCTAD’s 2005 World Investment Report indicates, the share of business-sector R&D in the latter group of developing countries reached only 5.4 percent in 1996 and 7.1 percent in 2002.78
As Part II of this article will demonstrate empirically, innovation-based economic growth relates to a greater reliance by developing countries on
government R&D. Alice Amsden offered additional confirmation of this idea.79 As she explains in her seminal book, The Rise of “The Rest,” which traces the post-war experiences of certain developing countries in the early stages of their development, institutions in the form of markets were rudimentary at best.80 Thus the development of protected property rights was part of the progress toward deeper and more ideal market structures.81
Like the TRIPS Agreement’s trade-based narration of economic growth for developing countries today, the latter narration is also a process of creating firm-specific proprietary skills that are distortionary (price exceeds marginal cost) as they gradually confer innovation-based market power.82
74 Id. 75 Id. 76 Id.; see Bronwyn H. Hall, Industrial Research During the 1980s: Did the Rate of
Return Fall?, 1993 BROOKINGS PAPERS ON ECON. ACTIVITY 289 (1993) (connoting a
temporal decline in returns in the computing/electronics sector due to the beginning of the
personal computer revolution). 77 Cf. World Investment Report 2005, supra note 3, at 106. 78 Id. 79 See AMSDEN, supra note 18, at 286-87. 80 Id. 81 See id. 82 Cf. id.
BENOLIEL - PATENT PROPENSITY ACROSS COUNTRIES.DOCX (DO NOT DELETE) 1/14/2015 10:01 AM
144 BOSTON UNIVERSITY INTERNATIONAL LAW JOURNAL[Vol. 33:129
C. The Government Sector
Lastly, institutional analysis incorporates a third sector that fosters innovation: the government sector.83 Compared to the impact of the business sector or MNEs on innovation, there have been few studies into the effects of governmental R&D on fostering domestic innovation.84 Focusing primarily on advanced economies, and the United States in
particular, James Adams found that knowledge, measured by accumulated academic scientific papers, significantly contributed to the growth of productivity in U.S. manufacturing.85 Another study by Erik Poole and Jean-Thomas Bernard on military innovations in Canada found that defense-related innovation had a significant, negative effect on the multifactor productivity growth of four industries between 1961 and
1985.86 Additionally, Ishaq Nadiri and Theofanis Mamuneas found that public R&D and public infrastructure affected the cost structure of U.S. manufacturing.87 Their results support the conclusion that public R&D has important effects on industry and correlates with a considerable “social” rate of return.88 In comparison, Walter Park contended that public R&D loses its significant impact on productivity growth when business R&D is
83 For UNESCO S&T data and indicators analyzed in Part II’s statistical model, see
Frascati Manual, supra note 25, § 184. Government intramural expenditure on R&D
(“GOVERD”) or R&D expenditure in the government sector includes
all departments, offices and other bodies which furnish but normally do not sell to the
community, those common services, other than higher education, which cannot
otherwise be conveniently and economically provided, as well as those that administer
the state and the economic and social policy of the community. Public enterprises are
included in the business sector. . . . [It also includes] the non-profit institutions (NPIs)
controlled and mainly financed by government but not administered by the higher
education sector.
Id. 84 For a historical account of the United States in the twentieth century, see generally
DAVID C. MOWERY & NATHAN ROSENBERG, TECHNOLOGY AND THE PURSUIT OF ECONOMIC
GROWTH (1989). For contributions dealing with particular sectors and industries, see ROGER
R. NELSON, GOVERNMENT AND TECHNICAL PROGRESS: A CROSS-INDUSTRY ANALYSIS (1982).
For the post-Cold War climate and its effect on government support, especially in the United
States, see LINDA R. COHEN AND ROGER G. NOLL, THE TECHNOLOGY PORK BARREL (1997). 85 James Adams, Fundamental Stocks of Knowledge and Productivity Growth, 98 J.
POL. ECON. 673, 673 (1990). 86 Erik Poole & Jean-Thomas Bernard, Defense Innovation Stock and Total Factor
Productivity Growth, 25 CAN. J. ECON. 438, 438 (1992). 87 See M. Ishaq Nadiri & Theofanis P. Mamuneas, The Effects of Public Infrastructure
and R&D Capital on the Cost Structure and Performance of U.S. Manufacturing Industries
(Nat’l Bureau of Econ. Research, Working Paper No. 3887, 1991). 88 See Walter Park, International R&D Spillovers and OECD Economic Growth, 33
ECON. INQUIRY 571 (1995).

BENOLIEL - PATENT PROPENSITY ACROSS COUNTRIES.DOCX (DO NOT DELETE) 1/14/2015 10:01 AM
2015] PATENT PROPENSITY ACROSS COUNTRIES 145
included among the explanatory variables.89 Park supported this finding with a panel data analysis of ten OECD countries.90 Park’s findings received further support from earlier econometric studies examining the negative productivity growth payoff from government expenditures for industrial R&D conducted by Harvard University economist Zvi Griliches,91 and economists Eric Bartelsman,92 Frank Lichtenberg, and
Donald Siegel.93 Additional studies have confirmed that the coefficients on federally funded R&D are statistically insignificant.94
According to Alice Amsden, the control mechanism of countries at early stages of development has transformed the incompetence associated with government interference into a communal good, “just as the ‘invisible hand’ market-driven control mechanism transformed the chaos and selfishness of
market forces into general well-being.”95 During the post-war period, the role of the government was mainly oriented towards getting the best terms for a reactive form of technology transfer as well as slowly increasing investments in R&D and formal education.96 By comparing the “integrationist” transitions in Argentina, Brazil, and Mexico against the “independent” transitions in China, India, South Korea, and Taiwan,
Amsden was able to explain that the stark differences between these two groups resulted from the shift to a proactive innovative policy in the post-war era in the latter.97 Industrialization history bears witness to the benefits which accrued to numerous emerging economies that began to develop new technology.98 This innovative activity was perceived as a necessary condition for sustainable national growth.99
Additionally, economic historian Alexander Gerschenkron, who
89 Id. 90 Id. This finding does not apply to advanced economies. 91 See, e.g., Zvi Griliches, R&D and Productivity: Econometric Results and
Measurement Issues, in HANDBOOK OF THE ECONOMICS OF INNOVATION AND TECHNOLOGICAL
CHANGE 52 (Paul Stoneman ed., 1995); Zvi Griliches & Frank Lichtenberg, R&D and
Productivity Growth at the Industry Level: Is There Still a Relationship?, in R&D, PATENTS
AND PRODUCTIVITY 465 (Zvi Griliches ed., 1984). 92 Eric J. Bartelsman, Federally Sponsored R&D and Productivity Growth (Finance
and Econ. Discussion Series, No. 121, 1990). 93 See Frank Lichtenberg & Donald Siegel, The Impact of R&D Investment on
Productivity – New Evidence Using Linked R&D-LRD Data, 29 ECON. INQUIRY 203 (1991). 94 See Paul A. David, Bronwyn H. Hall & Andrew A. Toole, Is Public R&D a
Complement or Substitute for Private R&D? A Review of the Econometric Evidence, 29 RES.
POL’Y 497, 498 (2000). 95 See, AMSDEN, supra note 18, at 8. 96 Id. at 239. 97 Id. at 240-45. 98 Id. 99 Id.
BENOLIEL - PATENT PROPENSITY ACROSS COUNTRIES.DOCX (DO NOT DELETE) 1/14/2015 10:01 AM
146 BOSTON UNIVERSITY INTERNATIONAL LAW JOURNAL[Vol. 33:129
introduced the theory of economic backwardness and the process of catching up in the early 1960s, argued that countries undergoing industrialization will have different experiences depending on their “degree of economics backwardness” when they begin industrializing.100 Accordingly, the later a country industrializes, the more that country’s government will intervene in the country’s economy.101 This is due to the
increasingly capital-intensive nature of production methods. As the absolute capital requirements increase over time, new institutional arrangements will emerge that will create a larger role for government intervention in economic growth.102
There has been a large range of case studies adhering to Gerschenkron’s idea of “catch up flexibility.” As Gerschenkron postulated, both economic
backwardness and government intervention to achieve economic promotion differ widely across developing countries.103 At one extreme is what political scientist Eswaran Sridharan calls “the state-backed electronics industry” in Brazil.104 In Brazil’s electronic industrialization, practically all R&D efforts came from state enterprises and national firms.105 Only under significant policy pressure and after many years did MNEs begin to lead
R&D in the economic industrialization of Brazil.106 On the other end of the spectrum lies more than two decades of government-led protection in Malaysia which has failed to foster any significant levels of innovation-based economic growth.107 The Malaysian International Trade and Industry Minister finally acknowledged that public efforts to expand the local automotive industry, with emphasis on the National Car, have failed to
yield the desired results.108
100 Economics backwardness is not clearly defined by Gerschenkron, but he relates it to
income per capita, amount of social overhead capital, literacy, savings rates, and level of
technology. See ALEXANDER GERSCHENKRON, ECONOMIC BACKWARDNESS IN HISTORICAL
PERSPECTIVE (1962). Gerschenkron’s analysis came as a reaction to uniform development
stages theories, such as WALT WHITMAN ROSTOW, THE STAGES OF ECONOMIC GROWTH: A
NON-COMMUNIST MANIFESTO (1960). Since many of these indicators are positively
correlated, income per capita can serve as a substitute for economic backwardness. See id. 101 See GERSCHENKRON, supra note 100. 102 Id. 103 Id. 104 Id. at 89; ESWARAN SRIDHARAN, THE POLITICAL ECONOMY OF INDUSTRIAL
PROMOTION: INDIAN, BRAZILIAN, AND KOREAN ELECTRONICS IN COMPARATIVE PERSPECTIVE
90 (1994). 105 GERSCHENKRON, supra note 100, at 89. 106 Id. 107 Tilman Altenburg, Building Inclusive Innovation Systems in Developing Countries:
Challenges for IS Research, in HANDBOOK OF INNOVATION SYSTEMS AND DEVELOPING
COUNTRIES 33, 38 (Bengt-Åke Lundvall et al. eds., 2009). 108 Id. at 38.
BENOLIEL - PATENT PROPENSITY ACROSS COUNTRIES.DOCX (DO NOT DELETE) 1/14/2015 10:01 AM
2015] PATENT PROPENSITY ACROSS COUNTRIES 147
Another important example is the Indian space program. The Indian space program has failed to become a successful commercial enterprise despite heavy subsidization since the 1950s.109 As Gerschenkron predicted, the distance from the world technological frontier and the degree of government intervention are not strongly correlated in a developing country with a high degree of “economic backwardness.”110 However, it remains
unclear whether renewed attempts to industrialize innovation-based economies will continue to benefit from government intervention.111
II. THE MODEL
A. Overview
Part II of this article presents an empirical model of the patenting-related institutional concerns that were explained in Part I. This model compares
the innovative industrial sectors of the thirty-two advanced economies with those of the twenty-four emerging economies from 1996 to 2011. Additionally, the model analyzes possible statistical connections between the government and the business sector (foreign and domestic) and the propensity to patent as a proxy for domestic innovation in both the advanced-economy and emerging-economy country groups.
In making this comparison, the model incorporates two R&D-related indicators, the financing and the performance of the GERD, across the three innovating sectors: the government sector, the business sector, and private foreign investment by MNEs. For the sake of simplicity, the business sector and private foreign investment by MNEs are analyzed together as a single business sector.112
B. Methodology
The model adheres to four methodological principles. First, the model’s analysis uses a formal statistical inference method to estimate the effect and
109 Id. (referring to Angathevar Baskaran, From Science to Commerce: The Evolution
of Space Development Policy and Technology Accumulation in India, 27 TECH. SOC’Y 155
(2005)). 110
GERSCHENKRON, supra note 100, at 89; see AMSDEN, supra note 18, at 286.
Amsden contemplates that the relative role of the state in fostering economic growth
probably decreases as the role that foreign firms play in fostering innovation increases. Id.
This leads to Amsden’s corollary that the later a country industrializes, the greater the
probability that its major manufacturing firms will be foreign-owned. Id. This important
concern remains outside the scope of this article, which focuses on innovation-based
economic growth. 111 Cf. id. at 285. 112 See supra note 16.
BENOLIEL - PATENT PROPENSITY ACROSS COUNTRIES.DOCX (DO NOT DELETE) 1/14/2015 10:01 AM
148 BOSTON UNIVERSITY INTERNATIONAL LAW JOURNAL[Vol. 33:129
associated statistical significance of the two hypotheses below. The statistical comparison of patent propensity rates between these innovating countries is modeled by determining the number of patents corresponding to each pair (year, country) based on the country, the year, the GERD invested (taking into account the three year average delay at the United States Patent and Trademark Office (“USPTO”)), and the type of patent.113
In the econometric model appropriate for present panel data, the dependent variable is the expected number of patents issued each year.114 The explanatory variables include country, GERD (as an offset), year, and type, changing throughout time. The model takes into account the serial correlations between the yearly observations due to the longitudinal structure of the panel data.115
The following panel data counting method relates to the choice of a patent-category search with the USPTO dataset. The model analyzes
113 The type of effect is statistically assumed to be changing throughout time. 114 The statistical assumption is that the number is distributed as a Negative Binomial.
The latter type of distribution is a distribution of the discrete probability of the number of
successes in a sequence of Bernoulli trials before a specified (non-random) number of
failures (denoted) occur. In statistical terms, a Bernoulli trial is each repetition of an
experiment involving only two outcomes. See JOSEPH M. HILBE, NEGATIVE BINOMIAL
REGRESSION 185-87 (2007). 115 The statistical comparison between government/business and finance/performance
between the two groups of advanced and emerging economies is modeled as follows. A
Negative Binomial regression provided the best fit for the finance/performance data. The log
link was assumed and a log GERD of four years was used before as the offset variable. The
random effects of the year variable were included in the models to account for
the quantitative heterogeneity among the countries. The fixed effects of year and economy
type variables and their interaction term were used. The model takes into account the serial
correlations between the yearly observations due to the longitudinal structure of the panel
data. The differences between two types of economies were tested using contrasts defined
for each of the year points. The p-values were adjusted for multiple testing using simulation
procedures described by Don Edwards and Jack Berry to test the relationship between the
types of sectors per their finance and performance of R&D activities, and the number of
patents per GERD by economy type. See Don Edwards & Jack J. Berry, The Efficiency of
Simulation-Based Multiple Comparisons, 43 BIOMETRICS 913 (1987). Given that the
dependent variable counts events (yearly issued USPTO patents per GERD by national
inventor country, labeled as each country’s yearly patent propensity rate), the model applies
a regression method specifically designed to cope with this kind of data. In contrast to the
Poisson distribution, for which the mean is restricted to equal the variance, the Negative
Binomial distribution is able to account for a variance that is larger than the mean (over
dispersion). Due to the over dispersion of the model’s dependent variables, the model uses
a negative binomial regression model for the panel data. Four different models for
finance/performance variables were applied. The fixed effects of year, economy type, log-
transformed finance/performance variables and their interaction term were used. The
dependent slopes between finance and performance with patents per GERD were tested
using contrasts.
BENOLIEL - PATENT PROPENSITY ACROSS COUNTRIES.DOCX (DO NOT DELETE) 1/14/2015 10:01 AM
2015] PATENT PROPENSITY ACROSS COUNTRIES 149
USPTO-issued patents because they effectively serve as a proxy for R&D-related state-of-the-art quality output assurance, which is uniquely incorporated into the model. The reason for specifically examining USPTO patents is because patent series are normally subject to a significant prejudice, with most patents producing low or no value and only a few patents carrying a high economic or financial value. Thus far, patent
statistics studies have rarely tested the quality sensitivity of the results of their patent count methodology or their data source.116 Using only USPTO patent data provides a qualitative improvement over earlier studies because this method counts patents on archetypical, state-of-the-art technology rather than the mere filing of a patent application. This methodological shift from the traditional system of counting all patent applications arose
from a concern over the possibility that a quantity of innovative activity does not begin or otherwise conclude the patenting process.117 Thus, only state-of-the-art technology that completes the USPTO patenting process is counted by the model. Measuring patent applications as an indication of quality innovation provides limits for patent statistics.118
Another approach found within the patent statistics literature is partly
able to meet this qualitative challenge. Instead of seeking to make inferences about the propensity to patent by estimating the patent production function, data is collected based on directly inquiring with firms about the portion of innovations that they normally patent.119 This alternate
116 See Jérôme Danguy et al., The R&D-Patent Relationship: An Industry Perspective,
14 EIB PAPERS 170 (2010); OECD, OECD Science, Technology and Industry Scoreboard
2011: Innovation and Growth in Knowledge Economies (Sept. 20, 2011), available at
http://www.oecd.org/science/inno/oecdsciencetechnologyandindustryscoreboard2011innovat
ionandgrowthinknowledgeeconomies.htm. 117 See, e.g., Bronwyn H. Hall et al., The NBER Patent Citations Data File: Lessons,
Insights and Methodological Tools 4 (Nat’l Bureau of Econ. Research, Working Paper No.
849, 2001). 118 Patent statistics literature has irregularly considered this limitation. The earliest and
most important contribution was Zvi Griliches, Patent Statistics as Economic Indicators: A
Survey, 28 J. ECON. LIT. 1661 (1990). See also Daniele Archibugi & Mario Pianta,
Measuring Technological Change Through Patents and Innovation Surveys, 16
TECHNOVATION 451 (1996). 119 Alfred Kleinknecht, Kees van Montfort, and Erik Brouwer offer to replace
patent/R&D rate analysis with measurements of expenditure on innovation (including non-
R&D-expenditure), sales of innovative products known (indicators of imitation), and
innovation not introduced earlier by competitors (indicators of “true” innovation). See Alfred
Kleinknecht, Kees van Montfort & Erik Brouwer, The Non-Trivial Choice Between
Innovation Indicators, 11 ECON. INNOVATION & NEW TECH. 109, 113-14 (2002) (analyzing
five alternative innovation indicators: R&D, patent applications, total innovation expenditure
and shares in sales taken by imitative and by innovative products measured in the
Netherlands).
BENOLIEL - PATENT PROPENSITY ACROSS COUNTRIES.DOCX (DO NOT DELETE) 1/14/2015 10:01 AM
150 BOSTON UNIVERSITY INTERNATIONAL LAW JOURNAL[Vol. 33:129
approach provides the ability to calculate a propensity to patent that is closely in line with the theoretical definition of the propensity to patent as the fraction of innovations that are accounted for as USPTO-issued patents.
There are two additional methodological challenges concerning patent propensity measurement of developing countries. The first is measuring patent propensity rates as a percentage of innovations leading to the filing
of a patent application.120 Yet in the case of developing countries, many patent applications often do not lead to patent issuance, either nationally or at the USPTO level.121 This study therefore corresponds with the previously mentioned methodological definition of the propensity to patent as the percentage of patentable inventions actually patented.122
A second patent panel data counting method related to the particularities
of the USPTO dataset involves analyzing patents separated by USPTO Inventor Country Name (“ICN”) or United States Inventor State (“IS”) search categories. These categories denote the country or state of residence of the inventor at the date the patent was issued.123 The ICN search category indicates the inventiveness of the local laboratories and labor force of each country. This second counting method was not used in earlier
studies to determine the propensity to patent. The new counting method offers three important advantages in comparison to the aforementioned methods of accounting for patent applications or other quantitative variations. First, this method replaces the “Patent Affiliate” or “Owner” alternative USPTO search categories, which mostly represent patenting activity by MNEs originating in advanced economies.124 Second, the
120 See, e.g., Anthony Arundel & Isabelle Kabla, What Percentage of Innovations are
Patented? Empirical Estimates for European Firms, 27 RES. POL’Y 127 (1998); Emmanuel
Duguet & Isabelle Kabla, Appropriation Strategy and the Motivations to Use the Patent
System: An Econometric Analysis at the Firm Level in French Manufacturing, 49 ANNALS
ECON. & STAT. 289 (1998); Mansfield, supra note 13; Wesley M. Cohen, Richard R. Nelson
& John P. Walsh, Protecting Their Intellectual Assets: Appropriability Conditions and Why
U.S. Manufacturing Firms Patent (Nat’l Bureau of Econ. Research, Working Paper No.
7552, 2000). 121 See Arundel & Kabla, supra note 120. 122 Mansfield, supra note 13. 123 Patent Full-Text and Image Database – Tips on Fielded Searching: Inventor
Country (ICN), U.S. PATENT AND TRADEMARK OFFICE, http://www.uspto.gov/patft/help/
helpflds.htm#Inventor_Country (last visited Oct. 11, 2014). 124 EMMANUEL HASSAN, OHID YAQUB & STEPHANIE DIEPEVEEN, INTELLECTUAL
PROPERTY AND DEVELOPING COUNTRIES: A REVIEW OF THE LITERATURE (2010); Anna Bergek
& Maria Bruzelius, Patents with Inventors from Different Countries: Exploring Some
Methodological Issues Through a Case Study 6 (June 27, 2005) (unpublished manuscript),
available at http://www.druid.dk/uploads/tx_picturedb/ds2005-1519.pdf; OECD, Patent
Statistics Manual (2009), available at http://browse.oecdbookshop.org/oecd/pdfs/free/9209
021e.pdf.
BENOLIEL - PATENT PROPENSITY ACROSS COUNTRIES.DOCX (DO NOT DELETE) 1/14/2015 10:01 AM
2015] PATENT PROPENSITY ACROSS COUNTRIES 151
measurement of the ICN or IS search categories minimizes the transaction costs that are associated with domestic patenting within developing countries. Third, the ICN search category choice method provides an additional advantage when measuring co-inventions. In these cases, at least one of the inventors from an emerging economy may have a foreign nationality.125 Solving this problem by using an ICN search category will
account for either sole or co-inventor patents. However, USPTO co-inventor patents comprise only one percent of the total inventions patented at the USPTO.126
That being said, there is a need to account for the methodological choice to use the issued patent search category and focus solely on USPTO patenting activity. This article is limited in scope to the USPTO, and does
not include in its analysis the European (“EPO”) or Japanese Patent Offices (“JPO”) because neither the EPO nor the JPO offer equivalent ICN search categories.127
Furthermore, two additional reasons explain this article’s use of USPTO-based patenting activity instead of using an aggregation of national patenting systems for both advanced and emerging economies. First, many
countries, especially developing countries, do not have the same “patentability” criteria.128 Second, these countries may differ substantively in their national grant rates.129 Both of these problems are mostly resolved by using a methodological approach that employs USPTO-based patenting statistics based on the ICN search categories.
The importance of developing a uniform Triadic Inventor Country
Nationality search category in the future is supported by the fact that most R&D-related activity is concentrated within a small number of geo-political regions.130 Yet, a mitigating finding in support of this study’s USPTO-based analysis is that, on average, only ten to fifteen percent of patent priority filings become triadic patents, whereas the rest are dominated by USPTO-issued patents for foreign inventors.131
A third analytical method calculates total domestic intramural expenditure on R&D during a given period by both advanced and emerging economies as expressed by Purchasing Power Parity (“PPP”) in United
125 OECD, Patent Statistics Manual, supra note 124. 126 Patel & Vega, supra note 2; see Adam B. Jaffe et al., Geographic Localization of
Knowledge Spillovers as Evidenced by Patent Citations, 108 Q. J. ECON. 577 (1993); OECD,
Compendium of Patent Statistics, supra note 2. 127 See OECD, Patent Statistics Manual, supra note 124. 128 See, e.g., Guellec & van Pottelsberghe, supra note 67. 129 Id. 130 Jacques Gaillard, Measuring R&D in Developing Countries: Main Characteristics
and Implications for the Frascati Manual, 15 SCI., TECH. & SOC. 77 (2010). 131 Jérôme Danguy et al., supra note 116.

BENOLIEL - PATENT PROPENSITY ACROSS COUNTRIES.DOCX (DO NOT DELETE) 1/14/2015 10:01 AM
152 BOSTON UNIVERSITY INTERNATIONAL LAW JOURNAL[Vol. 33:129
States dollars using the 2005 price level.132 By converting competing national currencies into U.S. dollars, this method largely eliminates the differences in price levels among countries and country groups.133
Moreover, when Gross National Product (“GNP”) expenditure for different national price indices is converted into a common currency to determine PPP, the GNP expenditure is effectively expressed at the same
set of national prices so that comparisons between countries reflect only differences in the volume of GERD-related goods and services purchased. This method thereby normalizes the patent propensity rate comparison between emerging and advanced country group classifications.134
A fourth methodology uses statistical imputation to resolve patterns of patenting of GERD-related missing gaps between each year, country, and
country group. Patent data at the USPTO website is available with no missing values for the entire sixteen years between 1996 and 2011.135 GERD-related data spans fifteen years between 1996 and 2010 with missing values. In a few country cases, the range of available data over time is too narrow and there is no reliable imputation, such as the sparse GERD data from the Philippines, which the present analysis identified.
Whenever imputation methodology is statistically permissible, the following rules are appropriate. First, if there is missing data before the first available data point, the study uses the rule, “first data carried before,” and assigns the same value to all data points before the first available point. Second, if there is missing data after the last available data point, the study uses the rule “last data carried over,” thereby assigning the same value to all
data points after the last point available. Third, if there is missing data between two data points, the model employs an interpolation between the two data points.136
In general, the methodology used in the model adheres to the conceptualization and critique put forth by two OECD statistical manuals used by this article. The first is the OECD Frascati Manual on R&D and
GERD-related statistics.137 The second manual is the OECD/Eurostat Oslo
132 UNESCO, 63 Terms for Science and Technology, http://glossary.uis.unesco.org/
glossary/map/terms/177 (last visited Oct. 11, 2014). This methodology was adapted from
Frascati Manual, supra note 25, § 423. 133 Frascati Manual, supra note 25, § 423. 134 Id. 135 U.S. PATENT & TRADEMARK OFFICE, PATENT AND TRADEMARK FISCAL YEAR
STATISTICS IN ANNUAL USPTO PERFORMANCE AND ACCOUNTABILITY REPORTS (2013),
available at http://www.uspto.gov/web/offices/ac/ido/oeip/taf/ann_rpt_intermed.htm. 136 Seven countries, Ireland, Japan, Luxembourg, Malaysia, Malta, Pakistan, Peru, and
Switzerland, were removed from the analysis because of insufficient data. Imputation
procedures were applied for the remaining countries. 137 See Frascati Manual, supra note 25.

BENOLIEL - PATENT PROPENSITY ACROSS COUNTRIES.DOCX (DO NOT DELETE) 1/14/2015 10:01 AM
2015] PATENT PROPENSITY ACROSS COUNTRIES 153
Manual on innovation-related statistics.138 In principle, both manuals emphasize the need to move toward empirical observations and away from normative posturing by stakeholders, role players, and policy makers.139 The OECD’s Frascati Manual has been the default standard for the international measurement of R&D and GERD of OECD member states and associated observer states for the last fifty years.140 The Frascati
Manual is complemented by two additional OECD manuals. The first complimentary manual is the United Nations Educational, Scientific and Cultural Organization (“UNESCO”) Technical Paper No. 5, Measuring R&D: Challenges Faced by Developing Countries.141 This manual provides guidance on a number of methodological challenges that are relevant to developing countries and which may not have received elaborate
treatment in the Frascati Manual.142 The second manual is the OECD’s Patent Statistics Manual of 2009, which provides users and producers of patent statistics with basic guidelines for compiling and analyzing patent data.143 Both manuals confirm that the Frascati Manual is the most widely accepted international standard for R&D and GERD-related surveys.144
C. Findings
1. The Null Hypothesis (H0): Gap between Impact of Sectors over Patent Propensity
The null hypothesis, H0, represents this article’s main argument that advanced and emerging economies diverge over how their government and business sectors finance and promote domestic innovation (as a proxy through yearly patent propensity rates).145
The first set of findings, as shown in Table 1 in Appendix A,146 demonstrates that the correlation between government sector R&D and a
138 OECD & Eurostat, Oslo Manual: Guidelines for Collecting and Interpreting
Innovation Data (3d ed. 2005) [hereinafter Oslo Manual]. 139 See, e.g., Frascati Manual, supra note 25; Oslo Manual, supra note 138. 140 See generally Benoît Godin, On the Origins of Bibliometrics, 68 SCIENTOMETRICS
109 (2006). 141 UNESCO, Measuring R&D: Challenges Faced by Developing Countries (Technical
Paper No. 5, 2010) [hereinafter UNESCO, Technical Paper No. 5], available at http://www.
uis.unesco.org/Library/Documents/tech%205-eng.pdf. 142 Id. 143 OECD, Patent Statistics Manual, supra note 124, at 5. 144 UNESCO, Technical Paper No. 5, supra note 141. This article adheres to these
methodologies while using Statistical Analysis System (“SAS”) software. 145 This null hypothesis sets the default assumption thereof, either because it is believed
to be true or because it is to be used as a basis for argument, but has not yet been proved. 146 See infra Appendix A, Table 1.

BENOLIEL - PATENT PROPENSITY ACROSS COUNTRIES.DOCX (DO NOT DELETE) 1/14/2015 10:01 AM
154 BOSTON UNIVERSITY INTERNATIONAL LAW JOURNAL[Vol. 33:129
3.0
3.5
4.0
1996 1997 1998 1999 2000 2001 2002 2003 2004 2005 2006 2007 year
Emerging Advanced
Finance by government (distribution along the time)
Log f
inance b
y g
overn
ment
country’s propensity to patent is significantly higher in emerging economies compared to advanced economies. The boxplots in Tables 3 and 4 below depict the differences in finance and performance by the government sector.
Table 3: Finance by Government (1996-2011)
Table 4: Performance by Government (1996-2011)
The differences between advanced and emerging economies were also tested in finance and performance by the business sector. Business finance in advanced economies was greater than in emerging economies. Yet no significant statistical difference was found between the two types of economies with regard to business performance as depicted in Table 2 in
1
2
3
4
1996 1997 1998 1999 2000 2001 2002 2003 2004 2005 2006 2007 year
Emerging Advanced
Performance by government (distribution along the time)
Log p
erf
orm
ance b
y g
overn
ment
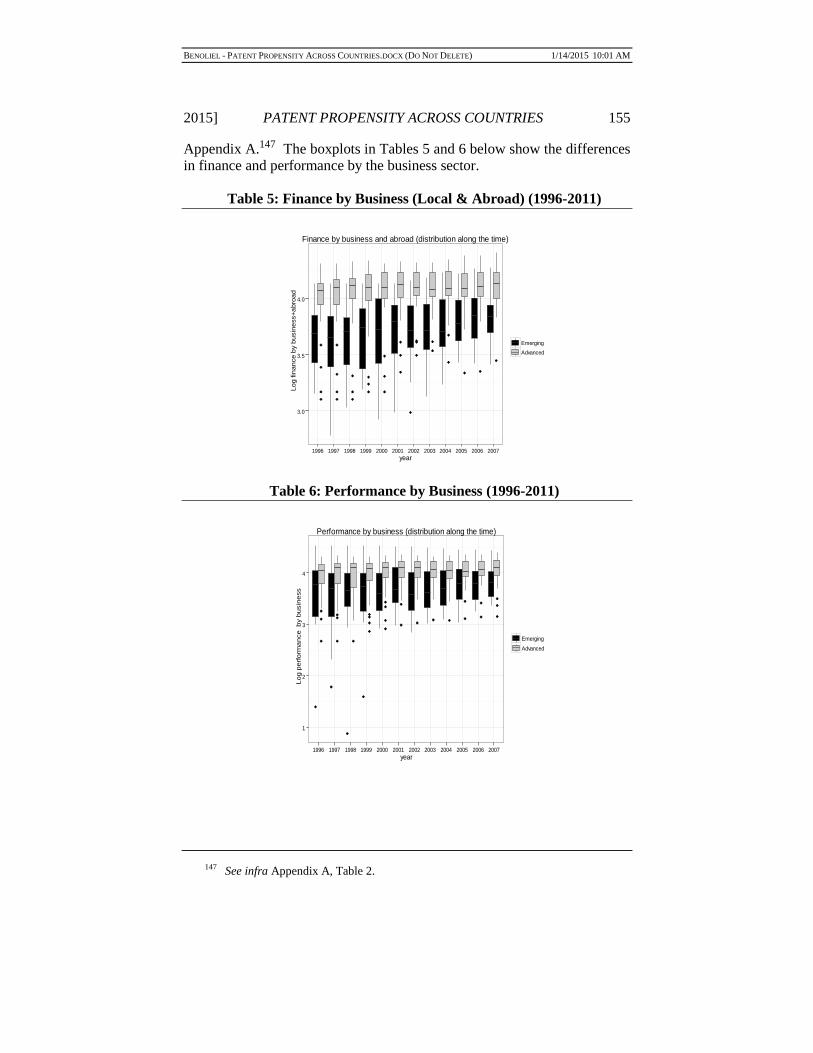
BENOLIEL - PATENT PROPENSITY ACROSS COUNTRIES.DOCX (DO NOT DELETE) 1/14/2015 10:01 AM
2015] PATENT PROPENSITY ACROSS COUNTRIES 155
3.0
3.5
4.0
1996 1997 1998 1999 2000 2001 2002 2003 2004 2005 2006 2007
year
Lo
g fin
an
ce
by b
usin
ess+
ab
roa
d
Emerging
Advanced
Finance by business and abroad (distribution along the time)
1
2
3
4
1996 1997 1998 1999 2000 2001 2002 2003 2004 2005 2006 2007
year
Lo
g p
erf
orm
an
ce
b
y b
usin
ess
Emerging
Advanced
Performance by business (distribution along the time)
Appendix A.147 The boxplots in Tables 5 and 6 below show the differences in finance and performance by the business sector.
Table 5: Finance by Business (Local & Abroad) (1996-2011)
Table 6: Performance by Business (1996-2011)
147 See infra Appendix A, Table 2.
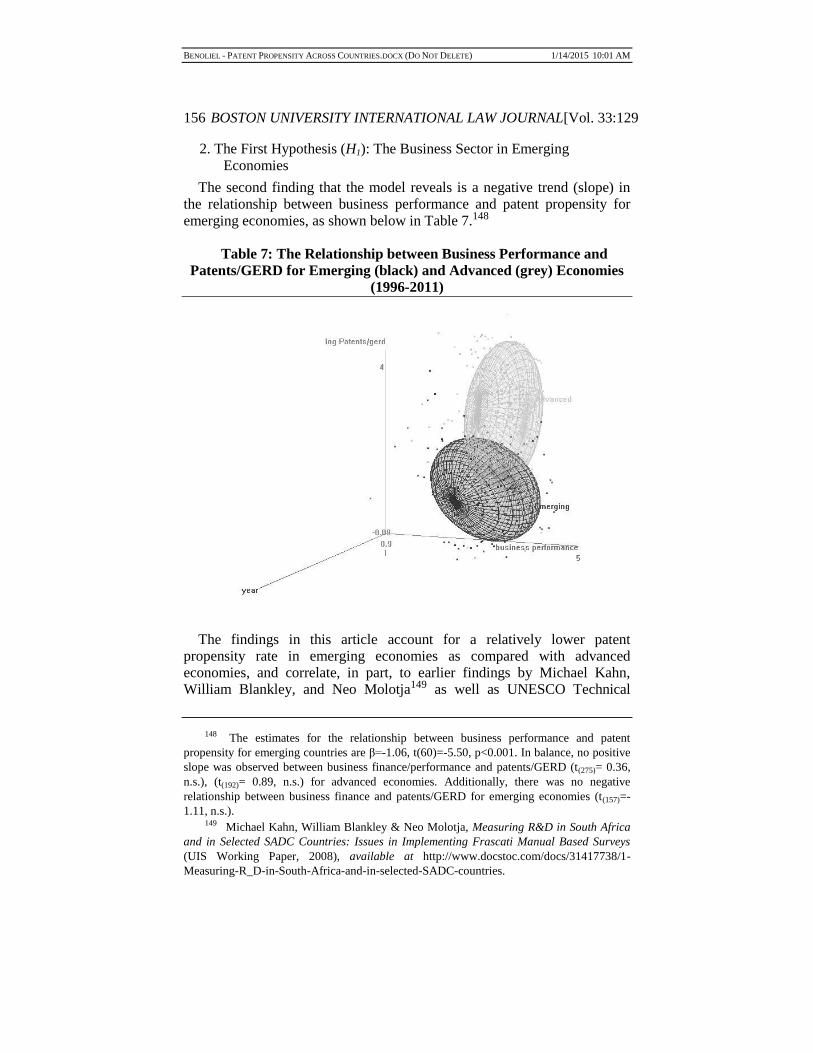
BENOLIEL - PATENT PROPENSITY ACROSS COUNTRIES.DOCX (DO NOT DELETE) 1/14/2015 10:01 AM
156 BOSTON UNIVERSITY INTERNATIONAL LAW JOURNAL[Vol. 33:129
2. The First Hypothesis (H1): The Business Sector in Emerging
Economies
The second finding that the model reveals is a negative trend (slope) in the relationship between business performance and patent propensity for
emerging economies, as shown below in Table 7.148
Table 7: The Relationship between Business Performance and
Patents/GERD for Emerging (black) and Advanced (grey) Economies
(1996-2011)
The findings in this article account for a relatively lower patent
propensity rate in emerging economies as compared with advanced economies, and correlate, in part, to earlier findings by Michael Kahn, William Blankley, and Neo Molotja149 as well as UNESCO Technical
148 The estimates for the relationship between business performance and patent
propensity for emerging countries are β=-1.06, t(60)=-5.50, p<0.001. In balance, no positive
slope was observed between business finance/performance and patents/GERD (t(275)= 0.36,
n.s.), (t(192)= 0.89, n.s.) for advanced economies. Additionally, there was no negative
relationship between business finance and patents/GERD for emerging economies (t(157)=-
1.11, n.s.). 149 Michael Kahn, William Blankley & Neo Molotja, Measuring R&D in South Africa
and in Selected SADC Countries: Issues in Implementing Frascati Manual Based Surveys
(UIS Working Paper, 2008), available at http://www.docstoc.com/docs/31417738/1-
Measuring-R_D-in-South-Africa-and-in-selected-SADC-countries.
BENOLIEL - PATENT PROPENSITY ACROSS COUNTRIES.DOCX (DO NOT DELETE) 1/14/2015 10:01 AM
2015] PATENT PROPENSITY ACROSS COUNTRIES 157
Paper No. 5.150 According to the results of this study, the business sector in emerging economies finances and performs much less GERD-related innovative activity than the government sector.151 Additionally, the results may substantiate the primary findings of the UNCTAD 2005 World Investment Report: that the emerging economies’ share in business R&D spending is far lower than the total global business spending on R&D.152
Such a finding may also correspond with UNESCO’s Technical Paper No. 5, which found that that GERD-related, innovative activity in the business sectors of emerging economies was commissioned ad hoc to deal with production issues, which made it infrequent, informal, and difficult to analyze.153
Finally, the findings in Tables 3 to 7 correspond with WIPO’s 2011
report on innovation.154 The WIPO report shows that governments, rather than universities, are often the main R&D actors in emerging economies.155 That is, industry often contributes little to scientific research.156 As the WIPO report demonstrates, government funding is responsible for about fifty-three percent of the total R&D in middle income countries for which data is available.157 As a country’s wealth diminishes, governmental
endowment approaches one hundred percent, particularly for R&D in the agricultural and health sectors.158 In Argentina, Bolivia, Brazil, India, Peru, and Romania, the share of public-sector R&D often surpasses seventy percent of total R&D.159 For example, the public sector funded one hundred percent of R&D in Burkina Faso in the last year for which data is available.160
Furthermore, econometric studies conducted at the firm and industry level provide fewer irrefutable results regarding the constructive impact of
150 UNESCO, Technical Paper No. 5, supra note 141. 151 Id. 152 World Investment Report 2005, supra note 3. 153 UNESCO, Technical Paper No. 5, supra note 141. 154 World Investment Report 2005, supra note 3. 155 Id. 156 See WIPO, The Changing Face of Innovation, supra note 40. Basic research is
mainly conducted by the government sector. Id. at 140-41. 157 Id. 158 Id. at 143. 159 Exceptions are Malaysia, China, the Philippines, and Thailand where, for both R&D
funding and performance, the business sector has the largest share. See id. at 141. 160 Id. More particularly, the WIPO report shows that in low and middle income
countries for which data is available, public research is also responsible for the majority of
basic R&D. See id. (offering the examples of close to one hundred percent in China, close to
ninety percent in Mexico, about eighty percent in Chile and the Russian Federation, and
about seventy percent in South Africa).
BENOLIEL - PATENT PROPENSITY ACROSS COUNTRIES.DOCX (DO NOT DELETE) 1/14/2015 10:01 AM
158 BOSTON UNIVERSITY INTERNATIONAL LAW JOURNAL[Vol. 33:129
public R&D.161 More specifically, public R&D does not contribute directly to economic growth; rather, public R&D promotes increased private spending on R&D.162 In other words, “crowding in” of private R&D takes place as public R&D raises the returns on private R&D.163
What explains the highly controversial role played by the business sector in emerging economies? Again, The Rise of “the Rest” by Alice Amsden
sheds some light on this question.164 Amsden labels emerging economies as “late-industrializing economies.”165 Examples of late-industrializing economies are the newcomers from the Southeast Asian economies and other emerging economies.166 Amsden explains that the government sector—more than the business sector in countries comprising “the rest”—all intervened in their countries’ markets in deep and deliberate ways.167
As a result, the economies of “the rest” had too few knowledge-based assets, particularly intellectual property assets that would typically be attributed to the business sector.168 Lack of knowledge-based assets prevented “the rest” from selling goods at world market prices even in modern labor-intensive industries.169
Amsden follows the intellectual trail that began to focus on the
institutional causes of uncertainty and diversity in the economics of innovation. This scholarly change in thought became part of a wider shift in economics towards understanding the role of nonmarket institutions in economic growth. This shift was started in Herbert Simon’s work on organizations at the Behavioral School at Carnegie Mellon and the seminal work of economists Richard Cyert and James March,170 March and
Simon,171 and the early 1980s contributions by Daniel Levinthal and March on the role that non-market institutions play in fostering economic
161 See id. at 142 (“The contribution of public R&D can take also a long time to
materialize.”). 162 Id. 163 For an overview of the literature, see Paul A. David & Bronwyn H. Hall, Property
and the Pursuit of Knowledge: IPR Issues Affecting Scientific Research, 35 RES. POL’Y 767
(2006). In turn, some public R&D may crowd out private R&D if it is not focused on basic
(pre-commercial) R&D. Id. 164 See AMSDEN, supra note 18. 165 Id. 166 Id. at 99. 167 Id. at 284. 168 Id. 169 Id. 170 RICHARD M. CYERT & JAMES G. MARCH, A BEHAVIORAL THEORY OF THE FIRM
(Herbert A. Simon ed., 1963). 171 JAMES G. MARCH & HERBERT A. SIMON, ORGANIZATIONS (1958).
BENOLIEL - PATENT PROPENSITY ACROSS COUNTRIES.DOCX (DO NOT DELETE) 1/14/2015 10:01 AM
2015] PATENT PROPENSITY ACROSS COUNTRIES 159
growth.172 The theory that governments are the catalysts of innovation in developing
countries, rather than private enterprise, merely entails a second-best mechanism for incentives to innovate. There is a lack of intellectual property incentives in the backdrop of what Amsden labels as “knowledge-based assets.”173 In such countries, second-best innovation policies are
advanced mostly by archetypical government political pulling found in the setting of frequent macroeconomic static efficiency flaws, and government rent-seeking.174 In reality, most innovation in these countries is fostered in the shadow of the intellectual property innovation-incentive mechanisms. In developing countries, a system of economic incentives resides in temporary economic market concentrations and deeply rooted state
monopolies which exist outside of industrial intellectual property law.175 Simply put, governments can create economic clogs by waiving patents and temporary legal monopolies offered by industrial intellectual property rights. The return on innovation-based investment within developing countries is nearly certain. Surely, this alternative incentive mechanism in the emerging economies of developing countries co-exists with on-going
bilateral and multilateral intellectual property endeavors—both endogenous and exogenous to the TRIPS Agreement.
To conclude, the relatively lower patent propensity witnessed in emerging economies is likely caused by a suboptimal process of second-best government pulling of innovation activity. This is aggravated by a deficient intellectual property regulatory framework that is promoted by the
WTO apparatus and the TRIPS Agreement in general. In claiming that different government innovation policies replace intellectual property policies, this study relates to the earlier development economics works of Pierre Schlag,176 Curtis Milhaupt, and others.177 The study confirms that
172 Daniel Levinthal & James G. March, A Model of Adaptive Organizational Search, 2
J. ECON. BEHAVIOR & ORG. 307 (1981). From the very outset, institutional theorists were
mostly committed to capitalist developed countries while building on Ronald Coase’s earlier
idea of transaction costs to explore the nature of institutions in The Nature of the Firm, 4
ECONOMICA 386 (1937). Thus, institutional theorists made much headway in explaining the
role of nonmarket institutions in economic growth in developed countries. DOUGLAS NORTH,
INSTITUTIONAL CHANGE AND ECONOMIC PERFORMANCE (1990); OLIVER WILLIAMSON,
MARKETS AND HIERARCHIES, ANALYSIS AND ANTI-TRUST IMPLICATIONS: A STUDY IN THE
ECONOMICS OF INDUSTRIAL ORGANIZATIONS (1975). For a later expansion of work on the role
of institutions in fostering economic growth, see OLIVER WILLIAMSON, THE ECONOMIC
INSTITUTIONS OF CAPITALISM (1985) [hereinafter WILLIAMSON, THE ECONOMIC INSTITUTIONS
OF CAPITALISM]. 173 See AMSDEN, supra note 18, at 3. 174 Id. 175 WILLIAMSON, THE ECONOMIC INSTITUTIONS OF CAPITALISM, supra note 172. 176 Pierre Schlag, An Appreciative Comment on Coase’s The Problem of Social Cost: A

BENOLIEL - PATENT PROPENSITY ACROSS COUNTRIES.DOCX (DO NOT DELETE) 1/14/2015 10:01 AM
160 BOSTON UNIVERSITY INTERNATIONAL LAW JOURNAL[Vol. 33:129
ever-present political determination has noticeably led governments of many developing countries to promote growth.
This growth occurs alongside substitutions in private law, contract law, and property law mostly as an alternative “first-best solution” for the requisition of growth by these governments.178 Each time governments are short-sighted they may fall for regulatory expropriation of innovation
activity.179 Otherwise, governments would decide not to expropriate every time they viewed such courses of action as politically untimely, as they often do when they believe that they can become international exporters of innovation-based goods.180
The phenomena of political determination and political pull have mostly been witnessed in developed countries. A primary example of this may be
found in the electronics industry throughout the first two decades of the post-war era, particularly with regard to semiconductors and computers.181 Military and space programmers operated as an influential mechanism that defined technological targets, while at the same time financed R&D and assured public procurement.182 Another example is the appearance of synthetic chemistry in Germany in the post-Bismarckian era. In this case,
the political will is what again pulled towards self-reliance on the German financial system.183 Experimental data is gradually being accumulated on certain high-tech sectors such as the aerospace and pharmaceutical sectors. Maintaining high levels of political pull will lead to government regulation in both the developed and developing world.184
The “political pull” theory of innovation activity in developing
countries—where political causality is often king—could indeed be related
View from the Left, 1986 WIS. L. REV. 919 (1986). 177 CURTIS J. MILHAUPT & KATHARINA PISTOR, LAW AND CAPITALISM: WHAT
CORPORATE CRISES REVEAL ABOUT LEGAL SYSTEMS AND ECONOMIC DEVELOPMENT AROUND
THE WORLD (2008); Ronald Gilson & Curtis J. Milhaupt, Economically Benevolent
Dictators: Lessons for Developing Democracies, 59 AM. J. COMP. L. 227 (2011). 178 MILHAUPT & PISTOR, supra note 177. 179 Schlag, supra note 176. 180 Id. 181 See Giovanni Dosi, Institutions and Markets in a Dynamic World, 56 MANCHESTER
SCH. 119 (1988) [hereinafter Dosi, Markets in a Dynamic World]; Giovanni Dosi, The
Nature of the Innovation Process, in TECHNICAL CHANGE AND ECONOMIC THEORY 221
(Giovanni Dosi et al. eds., 1988) [hereinafter Dosi, Nature of Innovation]. 182 See Dosi, Markets in a Dynamic World, supra note 181; Dosi, Nature of Innovation,
supra note 181. 183 See generally CHRISTOPHER FREEMAN, TECHNOLOGY POLICY AND ECONOMIC
PERFORMANCE (1987); V.M. WALSH, TRENDS IN INVENTION AND INNOVATION IN THE
CHEMICAL INDUSTRY (1979). 184 Lacey Glen Thomas III, Implicit Industrial Policy: The Triumph of Britain and the
Failure of France in Global Pharmaceuticals, 3 INDUS. & CORP. CHANGE 451 (1994).
BENOLIEL - PATENT PROPENSITY ACROSS COUNTRIES.DOCX (DO NOT DELETE) 1/14/2015 10:01 AM
2015] PATENT PROPENSITY ACROSS COUNTRIES 161
to slow-moving bureaucratic national institutions and governments. In other words, and to borrow from Christopher Freeman, national institutions that mitigate innovation have thus far gained the reputation of being very slow to change.185 Freeman posited that government innovation policies often persist for a century despite changes in macroeconomic conditions and other areas of government policy.186
In general, the situations of emerging economies illustrate how the business sector is suboptimally related to the increase in patent propensity rates as a proxy for domestic innovation. These findings are in line with the partial and preliminary findings of UNCTAD and WIPO. Overall, the evidence demonstrates that a government-led archetype of political pulling leads to a reduction of innovative activity. This reflects the aforementioned
second-best solution, rather than what international intellectual property law ought to require. In sum, emerging economies performing GERD-related innovative activity with business sector support have lower patent propensity rates than advanced economies with similar support.
3. The Second Hypothesis (H2): Government Sector in Advanced
Economies
The third finding is a negative trend (slope) in the relationship between government performance and patent propensity among advanced
economies.187 Additionally, no positive relationship exists between a government’s finance or performance and patent propensity among emerging economies, as shown below in Table 8.188
185 Id. 186 FREEMAN, supra note 183. For later economic growth literature adaptations, see
RICHARD R. NELSON, NATIONAL INNOVATION SYSTEMS: A COMPARATIVE ANALYSIS (1993);
MICHAEL E. PORTER, THE COMPETITIVE ADVANTAGE OF NATIONS (1990); Richard R. Nelson,
The Coevolution of Technology, Industrial Structure and Supporting Institutions, 3 INDUS. &
CORP. CHANGE 47 (1994). For more information on the expanding National Innovation
Systems theory, see BENGT-ÅKE LUNDVALL, NATIONAL SYSTEMS OF INNOVATION: TOWARDS
A THEORY OF INNOVATION AND INTERACTIVE LEARNING (1992); Bengt-Åke Lundvall,
Innovation as an Interactive Process: From User-Producer Interaction to the National
System of Innovation, in TECHNICAL CHANGE AND ECONOMIC THEORY 221, 221-35 (Giovanni
Dosi et al. eds., 1988); Bengt-Åke Lundvall, Product Innovation and User-Producer
Interaction, in 31 INDUSTRIAL DEVELOPMENT RESEARCH SERIES 28-29 (1985). 187 The estimates for government performance among advanced economies are (β=-
0.67, t(53)=-4.2, p<0.001). On the other hand, there is no statistical indication for a negative
slope between government finance and patents/GERD among advanced economies (t(320)=-
0.99, n.s.). 188 The estimates for government finance and performance in emerging economies are
(t(200)=-0.35, n.s.) and (t(83)=-0.74, n.s.) for government performance.

BENOLIEL - PATENT PROPENSITY ACROSS COUNTRIES.DOCX (DO NOT DELETE) 1/14/2015 10:01 AM
162 BOSTON UNIVERSITY INTERNATIONAL LAW JOURNAL[Vol. 33:129
Table 8: The Relationship between Government Performance and
Patents/GERD for Emerging (black) and Advanced (grey) Economies
(1996-2011)
The second hypothesis compares the role of the government sector in financing and performing GERD-related innovative activity in emerging and advanced economies. Generally, governments are assumed to be benign institutions that are driven by their desire to exploit social welfare
(even when their limited ability to execute such exploitation is recognized). This supposition plainly differs from research on neopatrimonialism and from rent-seeking that emphasizes the function of the state—particularly in developing countries—as an entity that follows its individual monetary and political interests and might still demonstrate predatory behavior.189
One very important question remains: What explains the negative impact
of government sector R&D on propensity to patent in advanced economies? WIPO’s findings partially answer this question. In its 2011 report, WIPO indicates that the government sector in high-income economies is responsible for about twenty to forty-five percent of annual total R&D
189 See, e.g., Altenburg, supra note 107, at 33 (referring to SHMUEL N. EISENSTADT,
TRADITIONAL PATRIMONIALISM AND MODERN NEOPATRIMONIALISM (1973)); see also
MARKUS LOEWE ET AL., THE IMPACT OF FAVORITISM ON THE BUSINESS CLIMATE: A STUDY OF
WASTA IN JORDAN (2007); MILHAUPT & PISTOR, supra note 177.

BENOLIEL - PATENT PROPENSITY ACROSS COUNTRIES.DOCX (DO NOT DELETE) 1/14/2015 10:01 AM
2015] PATENT PROPENSITY ACROSS COUNTRIES 163
expenditure.190 Governments usually provide the majority of the funds for low patent intensity forms of basic research in advanced economies. Basic research shows less patenting activity compared to experimental or applied research. Governments in advanced economies possibly decrease the average rates of patent propensity in these countries. For example, in 2009, the public sector performed, on average, more than seventy-five percent of
all basic research for experimental and theoretical work in advanced economies.191
Additional preliminary evidence may further expand the present finding within the parameters of the second hypothesis. The present hypothesis solely reflects the government sector’s role in decreasing patent propensity rates in advanced economies. It does not offer clear evidence of the
government sector’s impact on the propensity to patent in emerging economies. Yet indirect findings of alternative datasets from sources outside of UNESCO’s S&T data set concerning GERD indicators and innovation-based indicators may complete this analysis.
Thus, the UNCTAD 2005 World Investment Report’s focus on worldwide R&D measurements is instrumental to this analysis.192 Despite
being incomplete in its coverage of emerging economies, the report offers two highly instructive findings. These findings include the relatively low intensity of R&D activity measured per industry, and the low quality of R&D in developing countries in comparison to advanced economies. Additional empirical research may substantiate these findings in the future.193
The low R&D intensity in developing countries may explain the lower patent propensity rates in those countries.194 As the report shows, most developing economies begin industrializing by manufacturing the simplest technologies on the basis of low intensity R&D.195 These simple technologies include textiles, clothing, food-processing, and wood products.196 Some of these technologies indeed move up the scale into
heavy process industries such as metals, petroleum refining, and metal
190 WIPO, The Economics of Intellectual Property, supra note 5, at 141. 191 See OECD, Compendium of Patent Statistics, supra note 2. Depending on the
country, it accounts for about forty percent (Republic of Korea) to close to one hundred
percent (Slovakia) of all basic research performed. See WIPO, The Economics of Intellectual
Property, supra note 5, at 140. 192 World Investment Report 2005, supra note 3. 193 Id. at 109. 194 Id. 195 See id. at 108-09. Table III.3 shows the classification of manufacturing industries by
R&D capacity index. Id. at 102. 196 Id.

BENOLIEL - PATENT PROPENSITY ACROSS COUNTRIES.DOCX (DO NOT DELETE) 1/14/2015 10:01 AM
164 BOSTON UNIVERSITY INTERNATIONAL LAW JOURNAL[Vol. 33:129
products.197 Hardly any simple technology users that turn into competent users of “medium-high” technologies manufacture added advanced intermediary and capital goods. These goods include chemicals, automobiles, and industrial machinery.198 Industries will develop competitive capabilities in high-technology industries only if they are backed by institutions that support intellectual property rights. Similar to
advanced economies, the high-technology industries in developing countries may include aerospace, microelectronics, and pharmaceuticals.199
The UNCTAD investment report offers a second highly instructive
finding concerning developing countries: that R&D in developing countries, compared with advanced economies, is of relatively low quality. MNEs have only targeted certain developing countries, such as those in Latin
America and the Caribbean, for limited R&D FDI.200 FDI in developing countries is typically confined to the adaptation of technology or products for local markets rather than intensive R&D for medium or high technology industries.201 In Latin America, for example, this process is known as “tropicalization.”202 The situation in Latin American further illustrates how foreign affiliates play a relatively large role in business enterprise R&D in
Brazil and Mexico; a moderate role in Argentina; and a lower role in Chile.203 Finally, the lower quality R&D in developing countries correlates with the lower rates of patent propensity in those countries relative to the patent propensity rates of advanced economies.
III. THEORETICAL RAMIFICATIONS
The core empirical findings above show the potential benefits that could
be gained by conducting additional studies. To begin, a broad concern remains as to whether spillovers or externalities derived from R&D activity affect economic growth. Economic growth is measured through total factor productivity not only between advanced economies, but also between advanced and emerging economies.
Certainly, the diffusion of GERD-related knowledge across countries
between the North-South divide presents the potential that absorptive capacity is a conditioning factor. So far, however, empirical studies have
197 Id. 198 Id. at 102, 108-09. 199 Id. 200 Id. at 143. 201 Id. 202 Id. 203 See id. (referring to Mario Cimoli, Networks, Market Structures and Economic
Shocks: The Structural Changes of Innovation Systems in Latin America (Laboratory of
Econ. and Management, Working Paper No. 2002/13, 2000)).
BENOLIEL - PATENT PROPENSITY ACROSS COUNTRIES.DOCX (DO NOT DELETE) 1/14/2015 10:01 AM
2015] PATENT PROPENSITY ACROSS COUNTRIES 165
only investigated the question of whether R&D spillovers exist between advanced economies. For instance, Coe and Helpman analyzed twenty-one OECD economics between the years of 1970 and 1990.204 Their rather limited findings upheld the conclusion that increasing open trade increased R&D spillovers between advanced countries.205 Other studies have extended Coe and Helpman’s initial work to data sets with two206 or more
countries and looked at other factors affecting R&D spillovers, such as education levels in OECD countries207 and public-sector R&D among advanced economies.208
A second area of research addresses the relationship between public and private R&D in developing countries. Economists, continuing in the tradition of the advanced economy-based research by David Blank and
George Stigler in 1957, periodically study a selection of data to determine whether the connection between government and business sector R&D investment can be characterized as “complementarity” rather than by “substitution.”209 Many recent econometric studies, for example, document positive, statistically significant spillover effects from the stimulation of private R&D investment by publicly funded development of scientific
knowledge.210
204 See Coe & Helpman, supra note 29. 205 Id. at 861. 206 See Rachel Griffith et al., Innovation and Productivity Across Four European
Countries (Nat’l Bureau of Econ. Research, Working Paper No. 12722, 2006) (upholding
substantial R&D spillovers between U.S. manufacturing to U.K. firms and showing that
U.K. firms that undertake R&D in the United States appear to benefit the most). 207 See Hans J. Engelbrecht, International R&D Spillovers, Human Capital and
Productivity in OECD Economies: An Empirical Investigation, 41 EUR. ECON. REV. 1479
(1997). 208 See Dominique Guellec & Bruno van Pottelsberghe, From R&D to Productivity
Growth: Do the Institutional Settings and the Source of Funds of R&D Matter?, 66 OXFORD
BULL. ECON. & STAT. 353 (2004). Economic studies have further examined the particular
impact of academic research on business related R&D, again solely within the context of
advanced economies. For further research on R&D spillovers within the context of
advanced economies, see James D. Adams, Fundamental Stocks of Knowledge and
Productivity Growth, 98 J. POL. ECON. 673 (1990) (finding that basic research has a
significant effect on increasing industrial productivity although the effect may be delayed for
20 years); Zvi Griliches, R&D and the Productivity Slowdown, 70 AM. ECON. REV. 343
(1980); Kul B. Luintel & Mosahid Khan, Basic, Applied and Experimental Knowledge and
Productivity: Further Evidence, 111 ECON. LETTERS 7174 (2011); Edwin Mansfield,
Academic Research and Industrial Innovation: An Update of Empirical Findings, 26 RES.
POL’Y 773, 773-76 (1998) (surveying R&D executives from seventy-six randomly selected
firms, and estimating that ten percent of industrial innovation was dependent on the
academic research conducted within the fifteen years prior). 209 David, Hall & Toole, supra note 94, at 499. 210 Id. (referring to Zoltan J. Acs et al., Real Effects of Academic Research: Comment,
BENOLIEL - PATENT PROPENSITY ACROSS COUNTRIES.DOCX (DO NOT DELETE) 1/14/2015 10:01 AM
166 BOSTON UNIVERSITY INTERNATIONAL LAW JOURNAL[Vol. 33:129
The same could be said about a significantly more widespread body of past case studies that examine the benefit of government-sponsored research programs and ventures on commercial technological innovation.211 Yet, the accumulated findings for and against public and private R&D complementarity since the mid-1960s reveals very little for developing countries.212 As these studies mostly focus on U.S.-funded research
performed in academic institutions or quasi-academic, public institutes, they hardly address the impacts of publicly sponsored R&D conducted in developing countries and the comparison with advanced economies.213
A third avenue of research revolves around the interplay between governmental R&D and the question of governance. Over the past two decades, governance has moved from the fringes of academia to the center
of developmental discourse.214 The underlying assumption is that governance in developing countries often remains inefficient or ineffective. Yet, researchers have only generally accounted for the impact of suboptimal governance on the developing world. The effect of suboptimal governance, in theory, should be greater on developing countries as their R&D policies are part of their overall domestic innovation activity. A stable economy
rests on a foundation of good governance, including transparent and predictable decision-making and policy implementation, and the oversight of institutions that are capable of guarding against arbitrariness and ensuring accountability for government-sector resource allocation.215 Yet, additional exploration is required before any policy recommendations are made on the basis of this research.
Finally, development economics has yet to account for the particularities concerning the boundary between R&D and other technological innovation found in pre-production development activities. Distinguishing between “research” and “development” in technology-intensive industries is especially tricky because much of the R&D work involves a close
82 AM. ECON. REV. 363 (1991)); James D. Adams, Fundamental Stocks of Knowledge and
Productivity Growth, 98 J. POL. ECON. 673 (1990); Adam B. Jaffe, Real Effects of Academic
Research, 79 AM. ECON. REV. 957 (2007); Andrew A. Toole, Public Research, Public
Regulations and Expected Profitability: The Determinants of Pharmaceutical and
Development Investment (Stanford Inst. for Econ. Pol’y Research, Working Paper, 1999). 211 See supra note 210; see also ALBERT N. LINK & JOHN T. SCOTT, PUBLIC
ACCOUNTABILITY: EVALUATING TECHNOLOGY-BASED INSTITUTIONS (1998); COMPUTER SCI.
& TELECOMMS. BD. NAT. ACAD. OF SCI., FUNDING A REVOLUTION: GOVERNMENT SUPPORT
FOR COMPUTING RESEARCH (1999). 212 David, Hall & Toole, supra note 94, at 500. 213 Id. at 499. 214 See, e.g., Brian Levy, Development Trajectories: An Evolutionary Approach to
Integrating Governance and Growth, 15 ECON. PREMISE 1 (2010). 215 See id.
BENOLIEL - PATENT PROPENSITY ACROSS COUNTRIES.DOCX (DO NOT DELETE) 1/14/2015 10:01 AM
2015] PATENT PROPENSITY ACROSS COUNTRIES 167
interaction between researchers in both the private and public sectors and often includes close collaboration with customers and suppliers.216 Thus, the needs in developing countries remain regrettably unmet. This regulatory challenge ultimately impacts these countries’ propensities to patent.
CONCLUSION
Patenting policy is known to carry deep-rooted institutional implications. Yet in the case of emerging economies, the United Nations is only very loosely concerned with the role that institutions play in promoting patenting activity. Prior innovation-based economic growth theory has emphasized how R&D and, in particular, internationalized R&D should be promoted by MNEs worldwide. Such R&D activity is also strongly correlated with a
higher yield of patenting activity measured by comparable national patent propensity rates. Yet, current literature focuses on advanced countries and does not offer a comparison between these countries. It is thus not surprising that there are a large number of scientific studies on this occurrence in advanced economies and that several of these studies show an increasing internationalization of innovative activity by MNEs in advanced
economies. Numerous examples give the impression that internationalized R&D and the propensity to patent in emerging economies has triumphed. Not surprisingly, this has also been the general policy of different United Nations organs and other intergovernmental organizations, such as the United Nations Millennium Project, WIPO, and the United Nations Economic Commission for Africa. Rooted in dependency theories of
development, the TRIPS Agreement attempts to foster freer trade to create a role for the business sector to lead emerging economies in developing domestic innovative activity and an increased amount of patenting activity. TRIPS primarily corresponded and still corresponds with the World Bank and UNCTAD’s labeling of technology transfer as a reactive form of innovation-based economic growth for developing countries. Thus, rather
than promoting domestic innovation through local technological capacity, innovation would be received and, at most adapted, but not developed internally. The business sector was only meant to foster technologically-based trade. Yet, it is unclear that the role of MNEs and the business sector in promoting innovation in the developing world has met the TRIPS Agreement’s high expectations.
This article presents two main findings. First, in accounting for relatively lower patent propensity rates in emerging economies compared to advanced economies, the business sector in emerging economies finances and performs relatively much less GERD-related innovative activity. This
216 Id.
BENOLIEL - PATENT PROPENSITY ACROSS COUNTRIES.DOCX (DO NOT DELETE) 1/14/2015 10:01 AM
168 BOSTON UNIVERSITY INTERNATIONAL LAW JOURNAL[Vol. 33:129
finding may substantiate the primary findings of the UNCTAD 2005 World Investment Report in which the share of emerging economies in global business R&D spending (with emphasis on advanced economies) is lower than the total R&D spending.217 Moreover, these findings implicitly correspond with WIPO’s 2011 report on innovation.218 The WIPO report shows that governments rather than universities are often the main R&D
actors in low and middle income economies.219 In many cases, industry often contributes little to scientific research. Second, this article reflects the government sector’s connection with decreasing patent propensity rates in advanced economies. It surely does not offer clear evidence of the government sector’s impact on the propensity to patent in emerging economies.
To conclude, the relatively lower patent propensity in emerging economies seemingly relates to a suboptimal process of second-best government political pulling of innovation activity. This second-best political pulling is influenced by deficiencies in the intellectual property regulatory framework that the WTO and the TRIPS Agreement promote. In general, emerging economies illustrate how the business sector is
suboptimally related to the increase in patent propensity rates as a proxy for domestic innovation.
217 World Investment Report 2005, supra note 3. 218 WIPO, The Economics of Intellectual Property, supra note 5. 219 Id.

BENOLIEL - PATENT PROPENSITY ACROSS COUNTRIES.DOCX (DO NOT DELETE) 1/14/2015 10:01 AM
2015] PATENT PROPENSITY ACROSS COUNTRIES 169
APPENDIX A
Table 1: Country Type Differences in Government Performance and
Finance
Finance Performance Estimatea SE Estimate SE
time 1 0.3119*** 0.09355 0.5420** 0.1962
time 2 0.3651*** 0.09349 0.6702*** 0.1962
time 3 0.3390*** 0.09357 0.6485*** 0.1961
time 4 0.3521*** 0.09376 0.6962*** 0.1962
time 5 0.3721*** 0.09397 0.7321*** 0.1968
time 6 0.3970*** 0.09420 0.7154*** 0.1974
time 7 0.3949*** 0.09421 0.7491*** 0.1975
time 8 0.3788*** 0.09419 0.7389*** 0.1976
time 9 0.3433*** 0.09454 0.7214*** 0.1982
time 10 0.3332** 0.09460 0.6995*** 0.1984
time 11 0.3555*** 0.09483 0.7387*** 0.1987
time 12 0.3873*** 0.09479 0.7196** 0.1991
** p<0.01, ***p<0.001 e estimate of difference between the two types of economies
Table 2: Country Type Differences in Business Performance and Finance
Finance Performance Estimate SE Estimate SE
time 1 -0.3154** 0.09510 -0.2772 0.1407
time 2 -0.3874*** 0.09541 -0.3534 0.1408
time 3 -0.3667*** 0.09508 -0.3045 0.1405
time 4 -0.3449*** 0.09480 -0.2740 0.1403
time 5 -0.3638*** 0.09459 -0.3176 0.1402
time 6 -0.3653*** 0.09441 -0.3093 0.1400
time 7 -0.3705*** 0.09440 -0.3682 0.1403
time 8 -0.3357*** 0.09430 -0.3245 0.1401
time 9 -0.3050*** 0.09391 -0.2871 0.1399
time 10 -0.2839*** 0.09384 -0.2340 0.1396
time 11 -0.2805*** 0.09359 -0.2333 0.1395
time 12 -0.2949*** 0.09371 -0.2107 0.1396
** p<0.01, ***p<0.001