the impact of letter spacing on reading: a test of the ... · a test of the bigram coding...
TRANSCRIPT

The impact of letter spacing on reading:A test of the bigram coding hypothesis
ICM Research Center, UMRS 975, INSERM, Paris, France, &Faculté de Médecine Pitié-Salpêtrière,
Université Pierre-et-Marie-Curie,IFR 70, Paris, FranceFabien Vinckier
Faculté de Médecine Pitié-Salpêtrière,Université Pierre-et-Marie-Curie,
IFR 70, Paris, FranceEmilie Qiao
Cognitive Neuroimaging Unit, INSERM, Gif sur Yvette, France,CEA, DSV, I2BM, NeuroSpin Center,
Gif sur Yvette, France, &Collège de France, Paris, FranceChristophe Pallier
Cognitive Neuroimaging Unit, INSERM, Gif sur Yvette, France,CEA, DSV, I2BM, NeuroSpin Center,
Gif sur Yvette, France, &Collège de France, Paris, FranceStanislas Dehaene
ICM Research Center, UMRS 975, INSERM, Paris, France,Faculté de Médecine Pitié-Salpêtrière,
Université Pierre-et-Marie-Curie, IFR 70, Paris, France, &AP-HP, Department of Neurology, Hôpital de la Salpêtrière,
Paris, FranceLaurent Cohen
Identifying letters and their relative positions is the basis of reading in literate adults. The Local Combinations Detectormodel hypothesizes that this ability results from the general organization of the visual system, whereby object encodingproceeds through a hierarchy of neural detectors that, in the case of reading, would be tuned to letters, bigrams, or otherletter combinations. Given the increase of receptive fields by a factor of 2 to 3 from one neural level to the next, detectorsshould integrate information only for letters separated by at most 2 other characters. We test this prediction by measuringthe impact of letter spacing on reading, purifying this effect from confounding variables. We establish that performancedeteriorates non-linearly whenever letters are separated by at least 2 blank spaces, with the concomitant emergence of aword length effect. We then show that this cannot be reduced to an effect of physical size nor of visual eccentricity. Finally,we demonstrate that the threshold of about 2 spaces is constant across variations in font size. Those results support thehypothesis that the fast recognition of combinations of nearby letters plays a central role in the coding of words, such thatinterfering with this representation prevents the parallel analysis of letter strings.
Keywords: letter spacing, reading, bigram
Citation: Vinckier, F., Qiao, E., Pallier, C., Dehaene, S., & Cohen, L. (2011). The impact of letter spacing on reading:A test of the bigram coding hypothesis. Journal of Vision, 11(6):8, 1–21, http://www.journalofvision.org/content/11/6/8,doi:10.1167/11.6.8.
Introduction
When children start learning to read, they scan lettersone at a time, resulting in a strong positive correlation ofreading latencies with word length (Aghababian & Nazir,2000). Over years of training, the ability develops toidentify all the letters in a word in parallel, so that the
length effect decreases and eventually vanishes in expertreaders (Weekes, 1997). According to the local combina-tion detector (LCD) model, such parallel letter encoding isallowed by the fact that, in expert readers, whole wordsare processed as single visual objects, based on therecycling of neural mechanisms that underlie the per-ception of complex objects in general (Dehaene, Cohen,Sigman, & Vinckier, 2005). Object encoding takes place
Journal of Vision (2011) 11(6):8, 1–21 http://www.journalofvision.org/content/11/6/8 1
doi: 10 .1167 /11 .6 .8 Received January 25, 2010; published May 12, 2011 ISSN 1534-7362 * ARVO
Downloaded From: http://jov.arvojournals.org/pdfaccess.ashx?url=/data/Journals/JOV/932793/ on 01/19/2016

in the ventral visual pathway, through a hierarchy ofconverging neural detectors with increasingly widerreceptive fields, tuned to increasingly larger object parts(Serre, Oliva, & Poggio, 2007). In the case of words, suchhierarchically embedded object parts may consist in letterfragments, full letters, bigrams (i.e., pairs of letters), andeven larger chunks such as morphemes, for whichdetectors may develop through intensive training. Asubset of the ventral pathway critical to word reading isthought to be located in the left fusiform region, as shownby converging activation studies and lesion data (Cohenet al., 2000; Gaillard et al., 2006).Whenever parallel letter processing is impeded, due to
stimulus degradation (or to left fusiform lesions), adultreaders revert to a piecemeal serial reading mode, asrevealed by the resurgence of a word length effect (Ellis,2004). Various types of degradation may yield serialreading: (1) low-level degradation such as low-contrastdisplays (Legge, Ahn, Klitz, & Luebker, 1997); (2) the useof unfamiliar formats to which the visual system has notbeen trained, e.g., mIxEd case (Lavidor, 2002), verticallyprinted words (Bub & Lewine, 1988), or words displayedin the left visual field (Lavidor & Ellis, 2002); (3) theinsertion of blank space between consecutive letters(Cohen, Dehaene, Vinckier, Jobert, & Montavont, 2008),which is the focus of the present study. Whatever thedegradation method, readers must serially attend to lettersor word fragments whenever letters cannot be effectivelyprocessed in parallel over the whole string (Cohen &Dehaene, 2009).Degradation by means of letter spacing deserves to be
singled out, as it gives a window into a core feature ofvisual word perception. Indeed, a consequence of thehierarchical organization of the visual cortex is that objectparts can be chunked together into a single perceptualobject only if they are sufficiently close together. Aprinciple of retinotopic organization permeates throughoutthe visual system (Hasson, Levy, Behrmann, Hendler, &Malach, 2002): neurons respond to stimuli within a local“receptive field,” support or compete with other neuronscoding for nearby locations through medium-range hori-zontal connections, and project to hierarchically higherareas in a retinopy-preserving manner, such that receptivefields broaden by a factor of 2 or 3 at each synapticstep (Rolls, 2000). From this known organization, wepredicted that a bigram detector, tuned for instance tobigram “BA,” should not be able to respond identicallywhatever the position of the “B” to the left of an “A”(Dehaene et al., 2005). Rather, letter spacing shouldmatter, and a neuron responsive to “BA” should only beable to cumulate input from hierarchically earlier detec-tors for letters “B” and “A” when their receptive fields areclose enough. Hence, a 4-letter word with widely spacedletters should not be treated as a single visual object but asa series of 4 distinct items whose identification requiresserial attention. Accordingly, patients with an impaired
control of attentional scanning are unable to read wordswith spaced letters while they are flawless with normalwords (Vinckier et al., 2006). On this account, the reasonwhy spacing letters impairs word reading is not simplybecause such format is unusual but mainly because letterdetectors whose receptive fields are too far apart cannotconverge on higher level detectors.Is it possible to predict the critical letter spacing
threshold above which reading should be disrupted? Giventhe increase of receptive fields in IT cortex by a factor ofabout 2.5 from one neural level to the next (Rolls, 2000),the LCD model proposes that bigram detectors integrateletter information over a range of 2–3 letter positions(Dehaene et al., 2005). They should, therefore, fail todetect their preferred letter pairs whenever the componentletters are separated by a blank space too large to allowtwo letters to fall within its receptive field. For ahypothetical receptive field of 3 letter positions, a spacingof two letter widths should be sufficient to induce abreakdown of parallel reading, while a spacing of oneletter width should not have the same impact.In two previous studies, we examined the impact on
reading performance and brain activation of variousmodes of word degradation, including letter spacing(Cohen et al., 2008; Vinckier et al., 2006). As expected,a threshold of about 2 blank spaces was indeed necessaryfor reading performance to deteriorate and for a lengtheffect to emerge, both in normal subjects studied withfMRI and in a patient with parietal damage. However, themain goal of those studies was to demonstrate theintervention of parietal areas whenever stimulus degrada-tion requires the serial deployment of attention to wordparts rather than to investigate the role of letter spacingper se. As a consequence, we did not establish beyonddoubt whether letter spacing was really the critical fea-ture or whether performance degradation resulted fromcorrelated parameters such as overall stimulus size oreccentricity.In the present paper, our aim is to disentangle the
intrinsic impact of letter spacing on reading from the con-tribution of potential artifacts and to determine the min-imum spacing that is required to deteriorate readingperformance and induce a length effect. Our expectationsare that letter spacing should interfere with readingindependently from correlated parameters and that thespacing threshold should be of about 2 blank spaces.
Experiment 1
The goal of this first experiment was to establishwhether introducing blank space between letters deterio-rates reading performance and yields a word length effectand to estimate the value of the critical spacing threshold.Spacing letters has the inescapable consequence of
Journal of Vision (2011) 11(6):8, 1–21 Vinckier et al. 2
Downloaded From: http://jov.arvojournals.org/pdfaccess.ashx?url=/data/Journals/JOV/932793/ on 01/19/2016

increasing the physical size of letter strings. In order totease apart the role of spacing and of size, we, therefore,used a control condition in which the size of stimuli wasincreased by an equal amount by using larger fonts, whilekeeping a normal spacing between letters.Note that our aim was to study the early, visual, com-
ponent of word reading. Therefore, rather than asking sub-jects to read words aloud, we used a lexical decision task.This task allows for a precise measurement of responselatencies to printed words, requiring full encoding of thestimuli, while avoiding several sources of variabilityassociated to oral output (Ferrand & New, 2003).Naturally, we expected (and verified in Experiment 2b)that our conclusions do apply to more natural readingconditions.
MethodsParticipants
Twelve right-handed native French speakers partici-pated in this experiment (7 men and 5 women; mean age24 years). All had normal or corrected-to-normal visionand were naive about the aims of the experiment.
Materials
Three sets of 50 four-, six-, and eight-letter high-frequency words were created (frequency of 20–50 permillion; New, Pallier, Brysbaert, & Ferrand, 2004). Thethree sets were matched for word frequency (P = 0.28),letter frequency (P = 0.46), and bigram frequency (P =0.49; Table 1). Three sets of 50 pseudowords werecreated, matched one by one with words in terms ofconsonant–vowel structure, both phonologically andorthographically (e.g., MOUTON and DAIRET). Thequality of pseudowords as potential French words waschecked by three naive native French speakers. Sixty-fivepercent of pseudowords had real words among their closeorthographic neighbors, defined as substitution neigh-bors (e.g., OTARUE d OTARIE), deletion neighbors(COURAGNE d COURAGE), or addition neighbors(MIER d MIMER). We also checked that all pseudo-words shared their first and last letters with at least onefamiliar French word of the same length (e.g., CITROLand CHEVAL). Targets were presented in uppercase Arial,
white on a black background, within the central 10 degreesof the visual field.Stimuli were presented in two possible modes (Spac-
ing and Font Size), with five possible values of thescaling factor (Figure 1). At scaling 0, Font Size andSpacing condition were identical, consisting of strings ofnormally spaced 7-pt letters (letter height and maximumwidth: 0.27-). In the Spacing mode, increasing the scalingfactor was achieved by increasing the number of blankspaces (1 to 4) between letters, while keeping letter sizeconstant. In the Font Size mode, increasing the scalingfactor was achieved by increasing the size of letters so asto match the length of letter strings at the same scalingfactor in the Spacing mode, while keeping a normalspacing of letters.
Procedure
Each trial started with a 690-ms fixation point, whichwas replaced by a word or a pseudoword, centered onfixation. Subjects were instructed to maintain their gazeon the fixation point all through experimental blocks(there was a break every 150 trials). They were asked toperform a lexical decision task and to respond by pressinga button with their left hand for pseudowords and withtheir right hand for real words. The target remained visibleuntil subjects responded.All words and pseudowords were presented once in the
Spacing mode and once in the Font Size mode. In eachmode, a given item was associated with a randomlyselected scaling factor. Stimuli were presented in adifferent random order to each subject. An additional setof 20 training trials was run before the experimental list.
Results
Error rates and median correct RTs for real words werecomputed for each subject and each condition and wereentered in ANOVAs with 3 within-subject factors (pre-sentation mode, scaling factor, and length in number ofletters) and subjects as random factor (Figure 2 and Table 2).Note that only responses to real words were includedin the analysis because response times to pseudowordsmay mostly reflect the failure to contact the lexicon after a
Letters’ textual frequency Bigrams’ textual frequency Morphologically simple
Four letters (first set) 80,036 9474 50/50Six letters (first set) 81,395 9994 47/50Eight letters (first set) 81,849 9915 45/50Four letters (second set) 81,216 9808 150/150Six letters (second set) 83,710 10,017 142/150
Table 1. Word properties.
Journal of Vision (2011) 11(6):8, 1–21 Vinckier et al. 3
Downloaded From: http://jov.arvojournals.org/pdfaccess.ashx?url=/data/Journals/JOV/932793/ on 01/19/2016

given time. Therefore, responses to pseudowords showlittle influence of low-level visual properties of the stimuli,which are the focus of the current study.
Error rates
All subjects made less than 10% errors. There was nosignificant effect of length and no interaction involvingthis factor. There was an interaction of presentation modeand scaling factor (F(4, 44) = 5.3; P = 0.001). In theSpacing mode, error rate increased with scaling (F(4, 44) =7.59; P G 0.001), while it did not differ across scalingvalues in the Font Size condition (P 9 0.1).
Response times
Reaction time data showed essentially the same patternas error rates, plus an impact of word length. There wasan interaction of presentation mode, scaling, and length(F(8, 88) = 7.34; P G 0.001), and the two modes were,therefore, analyzed separately.In the Font Size mode, there was no effect of
length or scaling and no interaction of those factors.In the Spacing condition, RTs increased with largerspacing (F(4, 44) = 54.2; P G 0.001) and with words ofincreasing length (F(2, 22) = 28; P G 0.001). There was aninteraction of those 2 factors (F(8, 88) = 13.2; P G 0.001),as the effect of word length emerged and increased onlyfor scaling factors of 2 or more. Pairwise comparisonsshowed that latencies increased between consecutivescaling values from 1 to 4 (1 to 2: 50 ms; F(1, 11) =7.1; P = 0.004; 2 to 3: 43 ms; F(1, 11) = 16; P G 0.001; 3to 4: 80 ms; F(1, 11) = 49; P G 0.001). The differencebetween scaling 0 and 1 was small (11 ms) and non-significant (P 9 0.1).
Figure 2. Results of Experiment 1. Error rates and RTs increasedwhenever letters were separated with at least 2 blank spaces,while they were not affected by increasing font size. Moreover, forspacing values of 2 or more, a word length effect emerged.
Figure 1. Structure of stimuli for Experiment 1. In order to teaseapart the role of letter spacing and of physical stimulus length, thesize of letter strings was varied either by separating letters by upto 4 blank spaces or by increasing the size of the font. Stimuliwere presented centrally.
Journal of Vision (2011) 11(6):8, 1–21 Vinckier et al. 4
Downloaded From: http://jov.arvojournals.org/pdfaccess.ashx?url=/data/Journals/JOV/932793/ on 01/19/2016

Analyses restricted to each value of scaling showedthat the length effect was significant for values 2 to 4(2: F(2, 22) = 12.8; P G 0.001; 3: F(2, 22) = 10.2; P G 0.001;4: F(2, 22) = 47.3; P G 0.001). The size of the length effectincreased with scaling (R = 0.82, P G 0.001; Figure 2).
Discussion
In summary, error rates and RTs increased wheneverletters were separated with at least 2 blank spaces, whilethey were not affected by increasing font size. Moreover,for spacing values of 2 or more, a word length effectemerged. This length effect then increased with widerspacing. Most importantly, simply manipulating the sizeof letters while keeping them normally spaced had noimpact on performance, demonstrating that the effect ofspacing was not an artifact related to word size.
Those results are consistent with the general predictionthat spacing letters should impair reading performanceand induce an effect of length. Both performancedegradation and the length effect appeared for the samevalue of spacing, supporting the idea of a commonunderlying mechanism. Furthermore, the value of thisspacing threshold, around two, fitted our quantitativeexpectations based on the physiology of the ventral visualcortex.However, an alternative account of the increasing
reading difficulty associated with spacing should beconsidered. A consequence of introducing blank spacebetween letters is to move letters farther away fromfixation on average. As visual acuity decreases witheccentricity, performance degradation could be due toperipheral viewing and not to spacing per se. This loss ofacuity would not affect performance in the Font Sizecondition, because the shift to the periphery is compen-sated by the associated increase in the size of letters. It
Error rate
Spacing condition
Scaling value
No. of letters 0 1 2 3 4 All
4 4.2% 4.2% 5.0% 9.2% 15.0% 7.5%6 3.3% 2.5% 4.2% 4.2% 11.7% 5.2%8 0.0% 1.7% 1.6% 7.5% 5.8% 3.3%All 2.5% 2.8% 3.6% 7.0% 10.8% 5.3%
Error rate Font size conditionScaling value
No. of letters 0 1 2 3 4 All4 3.3% 4.2% 1.7% 6.7% 0.8% 3.3%6 4.2% 0.0% 0.8% 4.2% 5.0% 2.8%8 3.3% 0.0% 2.5% 1.7% 0.8% 1.7%All 3.6% 1.4% 1.7% 4.2% 2.2% 2.6%
Mean RT Spacing conditionScaling value
No. of letters 0 1 2 3 4 All4 625 623 650 668 695 6526 652 659 687 730 796 7058 615 643 737 806 952 751All 630 642 691 735 814 703
Mean RT Font size conditionScaling value
No. of letters 0 1 2 3 4 All4 626 597 624 640 617 6216 629 624 623 619 613 6218 647 622 623 641 636 634All 634 614 623 633 622 625
Table 2. Results of Experiment 1.
Journal of Vision (2011) 11(6):8, 1–21 Vinckier et al. 5
Downloaded From: http://jov.arvojournals.org/pdfaccess.ashx?url=/data/Journals/JOV/932793/ on 01/19/2016

should be noted that, even if performance degradationpartly reflects the eccentricity of the outermost letter, suchan effect may, in principle, coexist with an actual effect ofletter spacing. Indeed, the results observed in the Spacingcondition provide some indications that RTs were notfully determined by the location of the outermost letters.Thus, RTs were significantly shorter for 8-letter stimuli atscaling 1 (643 ms) than for (a) 4-letter stimuli at scaling 3(668 ms), (b) 4-letter stimuli at scaling 4 (695 ms), and (c)6-letter stimuli at scaling 2 (687 ms; all P G 0.05). Thiswas true even though the location of the outermost letterwas approximately 7.5 letter for all of those conditions,showing that performance did not depend only onmaximum eccentricity.Those arguments are, however, not sufficient to disen-
tangle the contributions of eccentricity and spacing, whichwas the aim of Experiment 2a. As a point of method, notethat in Experiment 1, stimuli remained visible untilsubjects responded, and the occurrence of eye movementscould not be excluded in spite of task instructions. In thefollowing experiments, stimuli were briefly flashed, so asto prevent eye movements.
Experiment 2a
The goal of Experiment 2a was to determine whetherthe degradation of reading performance induced byspacing letters resulted solely from the average shift ofletters to the periphery of the visual field induced byspacing or from this effect plus a specific effect ofspacing. To this end, eccentricity and spacing weremanipulated so as to yield contrasting predictions.Schematically, for each value of letter spacing, perfor-mance was compared between spaced stimuli and stimuliwith contiguous letters but with a larger average lettereccentricity. If performance is worse for spaced stimulithan for the corresponding displaced stimuli, it wouldimply that spacing has a deleterious effect of its own,above and beyond the effect of eccentricity. Because theimpact of eccentricity on reading performance differsacross the two visual hemifields, with a more severedegradation with increasing eccentricity in the left than inthe right hemifield (Ellis, 2004), the manipulation ofeccentricity and spacing was fully crossed with thehemifield in which words were presented.
MethodsParticipants
Eighteen subjects participated in this experiment (11 menand 7 women, mean age 23 years), obeying the same cri-teria as in Experiment 1.
Materials
We used a subset of the words and pseudowords fromExperiment 1, including only the 4- and 6-letter stimuli.Targets were presented in uppercase Arial 7-pt font, whiteon a black background, within the central 10 degrees ofthe visual field.Stimuli were presented in two possible modes (Spacing
and Displacement), with five possible values of the scalingfactor, in either the left or the right visual hemifield(Figure 3). At scaling 0, Spacing and Displacementconditions were identical, consisting of strings of con-tiguous 7-pt letters (letter height and maximum width:0.27-) displayed in one hemifield. In the Spacing mode,increasing the scaling factor was achieved by increasingthe width of the blank space between letters (0.6, 1.2, 1.8,and 2.4 spaces). In the Displacement mode, increasing thescaling factor was achieved by shifting stimuli away fromfixation, while keeping a normal spacing of letters.For any given value of the scaling factor, the lateral
edge of all targets was aligned with the lateral edge of 6-letter words in the spacing mode. Therefore, all targetswere justified at a same maximal eccentricity (Figure 3).
Procedure
Each trial started with a 690-ms fixation point. It wasreplaced by a word or a pseudoword that remainedvisible for 170 ms, in order to avoid saccades andfoveation of stimuli. Subjects were instructed to performa lexical decision task and to respond by pressing abutton with their left hand to pseudowords and with theirright hand to real words. The next trial was triggered bythe response.All words and pseudowords were presented once in the
Spacing mode and once in the Displacement mode. Ineach mode, a given word was associated with a randomlyselected scaling factor and with a randomly selectedhemifield. Stimuli were presented in a different randomorder to each subject. An additional set of 60 trainingtrials was run before the experimental list.
Results
Error rates and median correct RTs for real words werecomputed for each subject and each condition and wereentered in ANOVAs with 4 within-subject factors(number of letters, scaling factor, presentation mode,hemifield) and subjects as random factor. There was asignificant interaction of hemifield, mode, scaling, andlength for both error rates (F(4, 68) = 2.6; P = 0.042) andresponse times (F(4, 60) = 4.33; P = 0.004), and theresults were analyzed separately for the two hemifields(Figure 4 and Table 3).
Journal of Vision (2011) 11(6):8, 1–21 Vinckier et al. 6
Downloaded From: http://jov.arvojournals.org/pdfaccess.ashx?url=/data/Journals/JOV/932793/ on 01/19/2016

Error ratesThere was an overall right-hemifield advantage as
commonly reported in reading experiments (F(1, 17) =6.8; P = 0.018).Left hemifield: There was a significant interaction of
scaling and mode (F(4, 68) = 2.6; P = 0.04). Error rate
increased with scaling (F(4, 68) = 11.8; P G 0.001) in boththe Spacing and Displacement modes (F(4, 68) = 10.8;P G 0.001 and F(4, 68) = 4.5; P = 0.003, respectively). Forscaling value of 0.6, there was a marginally significanteffect of mode (F(1, 17) = 4.0; P = 0.061), with somewhathigher error rates in the Displacement condition. Only for
Figure 3. Structure of stimuli for Experiment 2a. In order to tease apart the role of letter spacing and of eccentricity, stimuli weremanipulated either by separating letters by up to 2.4 blank spaces or by displacing stimuli toward the periphery of the visual field. Stimuliwere flashed in the left or right hemifield.
Figure 4. Results of Experiment 2a. Both letter spacing and stimulus displacement had a deleterious impact on reading performance. Theeffect of spacing was mostly visible above a value of 1.8 spaces. Beyond this threshold, reading was more difficult for spaced than for thecorresponding displaced stimuli, although in displaced stimuli, letters were, on average, more eccentric than in spaced stimuli.
Journal of Vision (2011) 11(6):8, 1–21 Vinckier et al. 7
Downloaded From: http://jov.arvojournals.org/pdfaccess.ashx?url=/data/Journals/JOV/932793/ on 01/19/2016

Error rate
Left hemifield: Spacing condition
Scaling value
No. of letters 0 0.6 1.2 1.8 2.4 All
4 7.8% 2.2% 18.7% 13.3% 24.4% 13.3%6 10.0% 7.8% 14.3% 25.6% 37.6% 19.1%All 8.9% 5.0% 16.5% 19.5% 31.0% 16.2%
Error rate Left hemifield: Displacement conditionScaling value
No. of letters 0 0.6 1.2 1.8 2.44 3.3% 7.8% 13.3% 17.4% 15.6% 11.5%6 7.8% 11.9% 11.9% 10.9% 24.4% 13.4%All 5.6% 9.9% 12.6% 14.2% 20.0% 12.4%
Error rate Right hemifield: Spacing conditionScaling value
No. of letters 0 0.6 1.2 1.8 2.4 All4 2.2% 4.4% 10.0% 21.1% 38.9% 15.3%6 0.0% 0.0% 4.4% 12.2% 22.2% 7.8%All 1.1% 2.2% 7.2% 16.7% 30.6% 11.5%
Error rate Right hemifield: Displacement conditionScaling value
No. of letters 0 0.6 1.2 1.8 2.44 5.4% 4.4% 10.0% 6.7% 12.2% 7.7%6 0.0% 4.4% 7.8% 4.4% 5.6% 4.4%All 2.7% 4.4% 8.9% 5.6% 8.9% 6.1%
Mean RT Left hemifield: Spacing conditionScaling value
No. of letters 0 0.6 1.2 1.8 2.4 All4 697 671 705 735 749 7126 724 694 773 791 926 782All 710 683 739 763 838 747
Mean RT Left hemifield: Displacement conditionScaling value
No. of letters 0 0.6 1.2 1.8 2.44 662 708 781 777 882 7626 690 744 808 829 823 779All 676 726 794 803 853 770
Mean RT Right hemifield: Spacing conditionScaling value
No. of letters 0 0.6 1.2 1.8 2.4 All4 631 721 725 786 862 7456 644 668 697 744 801 711All 638 695 711 765 831 728
Mean RT Right hemifield: Displacement conditionScaling value
No. of letters 0 0.6 1.2 1.8 2.4 All4 679 708 728 773 739 7256 651 674 704 717 743 697All 665 691 716 745 741 711
Table 3. Results of Experiment 2a.
Journal of Vision (2011) 11(6):8, 1–21 Vinckier et al. 8
Downloaded From: http://jov.arvojournals.org/pdfaccess.ashx?url=/data/Journals/JOV/932793/ on 01/19/2016
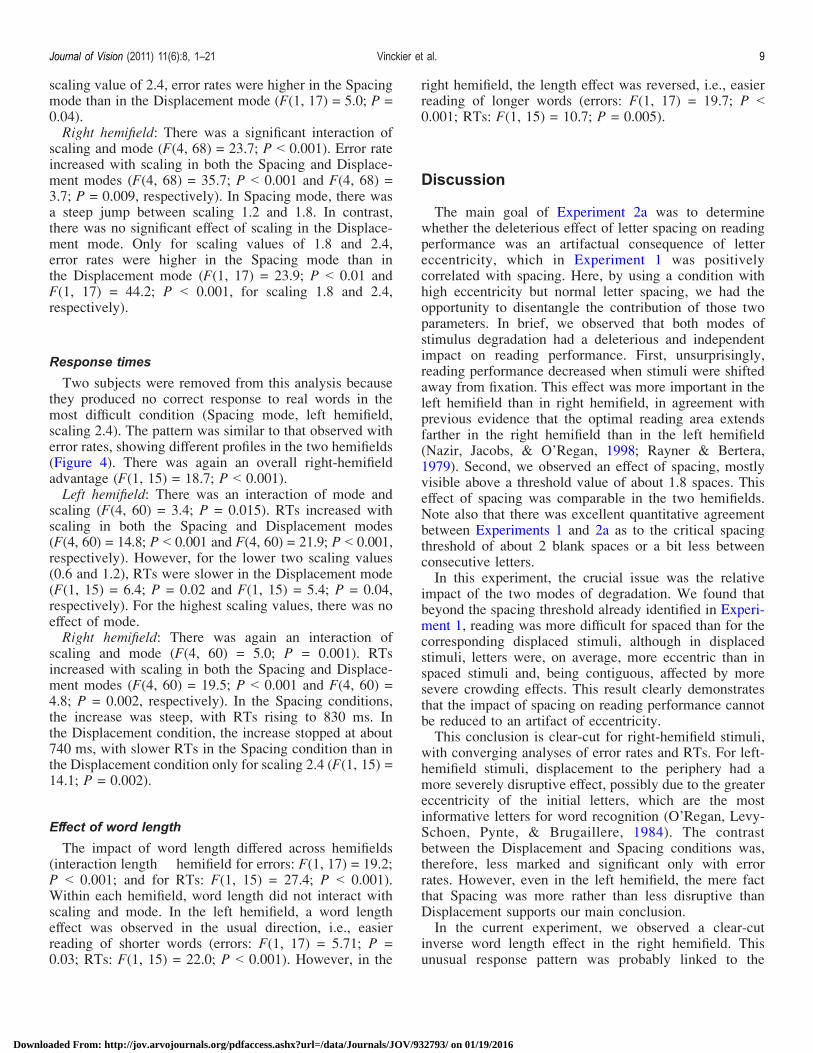
scaling value of 2.4, error rates were higher in the Spacingmode than in the Displacement mode (F(1, 17) = 5.0; P =0.04).Right hemifield: There was a significant interaction of
scaling and mode (F(4, 68) = 23.7; P G 0.001). Error rateincreased with scaling in both the Spacing and Displace-ment modes (F(4, 68) = 35.7; P G 0.001 and F(4, 68) =3.7; P = 0.009, respectively). In Spacing mode, there wasa steep jump between scaling 1.2 and 1.8. In contrast,there was no significant effect of scaling in the Displace-ment mode. Only for scaling values of 1.8 and 2.4,error rates were higher in the Spacing mode than inthe Displacement mode (F(1, 17) = 23.9; P G 0.01 andF(1, 17) = 44.2; P G 0.001, for scaling 1.8 and 2.4,respectively).
Response times
Two subjects were removed from this analysis becausethey produced no correct response to real words in themost difficult condition (Spacing mode, left hemifield,scaling 2.4). The pattern was similar to that observed witherror rates, showing different profiles in the two hemifields(Figure 4). There was again an overall right-hemifieldadvantage (F(1, 15) = 18.7; P G 0.001).Left hemifield: There was an interaction of mode and
scaling (F(4, 60) = 3.4; P = 0.015). RTs increased withscaling in both the Spacing and Displacement modes(F(4, 60) = 14.8; P G 0.001 and F(4, 60) = 21.9; P G 0.001,respectively). However, for the lower two scaling values(0.6 and 1.2), RTs were slower in the Displacement mode(F(1, 15) = 6.4; P = 0.02 and F(1, 15) = 5.4; P = 0.04,respectively). For the highest scaling values, there was noeffect of mode.Right hemifield: There was again an interaction of
scaling and mode (F(4, 60) = 5.0; P = 0.001). RTsincreased with scaling in both the Spacing and Displace-ment modes (F(4, 60) = 19.5; P G 0.001 and F(4, 60) =4.8; P = 0.002, respectively). In the Spacing conditions,the increase was steep, with RTs rising to 830 ms. Inthe Displacement condition, the increase stopped at about740 ms, with slower RTs in the Spacing condition than inthe Displacement condition only for scaling 2.4 (F(1, 15) =14.1; P = 0.002).
Effect of word length
The impact of word length differed across hemifields(interaction length � hemifield for errors: F(1, 17) = 19.2;P G 0.001; and for RTs: F(1, 15) = 27.4; P G 0.001).Within each hemifield, word length did not interact withscaling and mode. In the left hemifield, a word lengtheffect was observed in the usual direction, i.e., easierreading of shorter words (errors: F(1, 17) = 5.71; P =0.03; RTs: F(1, 15) = 22.0; P G 0.001). However, in the
right hemifield, the length effect was reversed, i.e., easierreading of longer words (errors: F(1, 17) = 19.7; P G0.001; RTs: F(1, 15) = 10.7; P = 0.005).
Discussion
The main goal of Experiment 2a was to determinewhether the deleterious effect of letter spacing on readingperformance was an artifactual consequence of lettereccentricity, which in Experiment 1 was positivelycorrelated with spacing. Here, by using a condition withhigh eccentricity but normal letter spacing, we had theopportunity to disentangle the contribution of those twoparameters. In brief, we observed that both modes ofstimulus degradation had a deleterious and independentimpact on reading performance. First, unsurprisingly,reading performance decreased when stimuli were shiftedaway from fixation. This effect was more important in theleft hemifield than in right hemifield, in agreement withprevious evidence that the optimal reading area extendsfarther in the right hemifield than in the left hemifield(Nazir, Jacobs, & O’Regan, 1998; Rayner & Bertera,1979). Second, we observed an effect of spacing, mostlyvisible above a threshold value of about 1.8 spaces. Thiseffect of spacing was comparable in the two hemifields.Note also that there was excellent quantitative agreementbetween Experiments 1 and 2a as to the critical spacingthreshold of about 2 blank spaces or a bit less betweenconsecutive letters.In this experiment, the crucial issue was the relative
impact of the two modes of degradation. We found thatbeyond the spacing threshold already identified in Experi-ment 1, reading was more difficult for spaced than for thecorresponding displaced stimuli, although in displacedstimuli, letters were, on average, more eccentric than inspaced stimuli and, being contiguous, affected by moresevere crowding effects. This result clearly demonstratesthat the impact of spacing on reading performance cannotbe reduced to an artifact of eccentricity.This conclusion is clear-cut for right-hemifield stimuli,
with converging analyses of error rates and RTs. For left-hemifield stimuli, displacement to the periphery had amore severely disruptive effect, possibly due to the greatereccentricity of the initial letters, which are the mostinformative letters for word recognition (O’Regan, Levy-Schoen, Pynte, & Brugaillere, 1984). The contrastbetween the Displacement and Spacing conditions was,therefore, less marked and significant only with errorrates. However, even in the left hemifield, the mere factthat Spacing was more rather than less disruptive thanDisplacement supports our main conclusion.In the current experiment, we observed a clear-cut
inverse word length effect in the right hemifield. Thisunusual response pattern was probably linked to the
Journal of Vision (2011) 11(6):8, 1–21 Vinckier et al. 9
Downloaded From: http://jov.arvojournals.org/pdfaccess.ashx?url=/data/Journals/JOV/932793/ on 01/19/2016

unusual word display, with short and long words alignedby their peripheral edge rather by their initial letter as inmost studies. At first sight, this inverse effect could be dueto the fact that in the right hemifield the initial letters weremuch more eccentric and, therefore, more difficult toidentify, in short than in long words, particularly in thespacing mode. However, this simple hypothesis may notbe sufficient. It would predict that in the right visual field,for a given number of letters and a given scaling (i.e., fora given maximum eccentricity), words with spaced letters(i.e., in Spacing mode) should be easier to read than wordswith contiguous letters (i.e., in Displacement mode), justbecause the latter start farther away from fixation.Naturally, this prediction should hold for spacing valuesbelow the putative threshold of 2 spaces, i.e., whenspacing does not have a deleterious effect by itself.Actually, as shown in Table 3, those two types of trialsdid not differ: for 4- and 6-letter words, at scaling 0.6 and1.2, latencies did not differ between the Spacing andDisplacement modes. This seems to disconfirm the ideathat the inverse length effect would reflect the eccentricityof the first letter. However, the spaced and displacedwords that we just compared differed in several respects inaddition to the eccentricity of their first letter: they werenot comparable in spacing, crowding, mean eccentricity,or physical width. Actually, the present experiment byitself was inappropriate to study and understand theinfluence of word length, which was partially confoundedwith other visual factors, which may interact in a waydifficult to predict quantitatively. Interestingly, theSERIOL model of word reading incorporates a lexicalaccess component that would generate an inverse lengtheffect (Whitney & Lavidor, 2004). Detectors for longerwords would “settle” faster in the lexicon, due to theirsmaller number of competitors. This inverse length effectwould be cancelled out by a serial letter encodingcomponent that would take longer time for longer words.Schematically, the combination of those two influenceswould not operate identically in the two hemifields,explaining the usual pattern of asymmetry, i.e., a lengtheffect restricted to the left hemifield. However, although itpredicts an asymmetry in length effect, it is not clearwhich of this model’s parameters should be modified toyield the present pattern of results. In Experiment 3below, we will provide additional evidence that eccen-tricity of the initial letter is an important determinant oflength effects.Experiment 1 demonstrated that spacing letters by at
least two blank spaces slows down reading, with thesimultaneous emergence of a word length effect. We tookthis result as support to our hypothesis that whenever theinterval between letters is larger than about 2 spaces,parallel reading collapses and readers resort to serialreading. Experiment 2a showed that the impact of spacingon reading performance was not an artifact of lettereccentricity, a parameter that, in centrally presentedwords, is correlated with spacing.
There is, however, an alternative interpretation to thedifference between spaced and displaced words asobserved in Experiments 1 and 2a. This alternative restson two plausible assumptions. The first assumption is thatwords are read serially whenever letters are remote fromfixation, even for normally spaced letters (at least wheneccentricity is not compensated for by an increase in fontsize as in Experiment 1). The second assumption is thatserial letter scanning takes more time and is more errorprone for physically longer words, i.e., when attentionmovements must cover a larger expense of space. Then, athigh scaling values in Experiment 2a, both spaced anddisplaced words would be read serially, but spaced wordswould be more difficult due to their larger physical size(and not to spacing per se). Note that according to thishypothesis, the effect of spacing would be an artifact ofphysical size distinct from the one considered in Experi-ment 1. Experiment 3 was aimed at assessing thisalternative interpretation of Experiment 2a. However,before presenting and assessing this alternative account,we wanted to check whether, beyond lexical decision, thecritical results of Experiment 2a generalized to morenatural reading conditions.
Experiment 2b
The goal of Experiment 2b was to replicate the resultsof Experiment 2a using a more natural word naming task.As reading aloud should involve the same input process-ing as lexical decision, we expected to observe the sameeffects of spacing as before.
MethodsParticipants
The subjects were the same as in Experiment 2a. Theyparticipated in Experiment 2b just after completion ofExperiment 2a.
Materials
A set of 5-letter high-frequency words was created(frequency of 20–50 per million; New et al., 2004).
Procedure
Targets were presented as in Experiment 2a. For anygiven value of the scaling factor, the lateral edge of alltargets was aligned with the lateral edge of 6-letter wordsin the spacing mode. Subjects were instructed to namestimuli aloud. The next trial was triggered by the response.All words were presented once in the Spacing mode and
once in the Displacement mode. In each mode, a given
Journal of Vision (2011) 11(6):8, 1–21 Vinckier et al. 10
Downloaded From: http://jov.arvojournals.org/pdfaccess.ashx?url=/data/Journals/JOV/932793/ on 01/19/2016

word was associated with a randomly selected scalingfactor and with a randomly selected hemifield. Stimuliwere presented in a different random order to each subject.
Results
Error rates were computed for each subject and eachcondition and were entered in ANOVAs with 3 within-subject factors (scaling factor, presentation mode, hemi-field) and subjects as random factor. Note that even in themost difficult condition (Spacing mode at scaling 2.4 inthe left hemifield), subjects correctly identified more than70% of the words (Table 4). There was a significantinteraction of mode and scaling (F(4, 68) = 4.0; P =0.005) and a main effect of hemifield (F(1, 17) = 6.24; P =0.02), with a right-hemifield advantage.Error rates increased with scaling in both the Spacing
and Displacement modes (F(4, 68) = 12.74; P G 0.001 andF(4, 68) = 2.9; P = 0.03, respectively). In the Spacingconditions, the increase was steep, with error rates risingto 28%. In the Displacement condition, the increasestopped at about 17%, with higher error rates in theSpacing condition than in the Displacement conditiononly for scaling 2.4 (F(1, 17) = 14.3; P = 0.002).
Discussion
The main goal of Experiment 2b was to replicate theresults of Experiment 2a with a more natural reading task.As expected, we observed the same effect of spacing thanin Experiment 2a. Beyond the spacing threshold identified
in Experiments 1 and 2a, reading was more difficult forspaced than for the corresponding displaced stimuli,although in displaced stimuli, letters were, on average,more eccentric than in spaced stimuli. We now turn to theassessment of an alternative account of our results, aspresented in the conclusion of Experiment 2a.
Experiment 3
The goal of Experiment 3 was to determine whether, inlaterally presented words, reading performance wasdependent on the physical length of words rather than onthe spacing of letters. To this end, spacing and physical sizewere manipulated so as to yield contrasting predictions.Schematically, we compared 4-, 6-, and 8-letter words withan identical physical size, which was achieved by a widerspacing of letters in 4- than in 6- than in 8-letter words. Iffor peripheral words performance depends only on physicalsize, performance should be comparable irrespective of thenumber of letters. Conversely, if spacing per se has acritical impact on reading, then words with the smallerspacing, i.e., 8-letter words, should be paradoxically easierto read despite their larger number of letters.
MethodsParticipants
Twelve subjects participated in this experiment (5 menand 7 women, mean age 22 years), obeying the samecriteria as in previous experiments.
Error rate
Left hemifield: Spacing condition
Scaling value
No. of letters 0 0.6 1.2 1.8 2.4 All
5 6.1% 6.9% 7.70% 26.9% 28.0% 17.0%
Error rate Left hemifield: Displacement conditionScaling value
No. of letters 0 0.6 1.2 1.8 2.4 All5 5.6% 5.6% 11.1% 16.7% 16.7% 11.1%
Error rate Right hemifield: Spacing conditionScaling value
No. of letters 0 0.6 1.2 1.8 2.4 All5 5.6% 0.0% 6.1% 13.6% 25.0% 10.1%
Error rate Right hemifield: Displacement conditionScaling value
No. of letters 0 0.6 1.2 1.8 2.4 All5 4.4% 1.4% 3.6% 7.8% 5.6% 4.6%
Table 4. Results of Experiment 2b.
Journal of Vision (2011) 11(6):8, 1–21 Vinckier et al. 11
Downloaded From: http://jov.arvojournals.org/pdfaccess.ashx?url=/data/Journals/JOV/932793/ on 01/19/2016

Materials
We used a subset of the stimuli of Experiment 1,consisting in 40 items from each of the 6 lists of 50 four-,six-, or eight-letter words and pseudowords. Targets werepresented in uppercase Arial 7-pt font, white on a blackbackground, within the central 10 degrees of the visualfield. Four values of physical size were used, correspond-ing to the dimension of normally printed 8-, 12-, 15-, and18-letter words. The spacing between letters was adjustedin order for 4-, 6-, and 8-letter stimuli to fit exactly in eachphysical size. Therefore, for each physical size, 4-, 6-, and8-letter stimuli occupied exactly the same display area(Figure 5). This procedure resulted in spacing valuesranging from 0 (for 8-letter words with a physical sizeof 8) to 4.7 spaces (for 4-letter words with a physical sizeof 18; Table 5). Stimuli were presented in the left or righthemifield, like in the Spacing mode from Experiment 2a,i.e., adjacent to the fixation point.
Procedure
The task and trial structure were the same as inExperiment 2a. All words and pseudowords were pre-sented once in the left hemifield and once in the righthemifield. In each hemifield, a given word was associatedto a randomly selected physical size. Stimuli werepresented in a different random order to each subject. Anadditional set of 48 training trials was run before theexperimental list.
Results
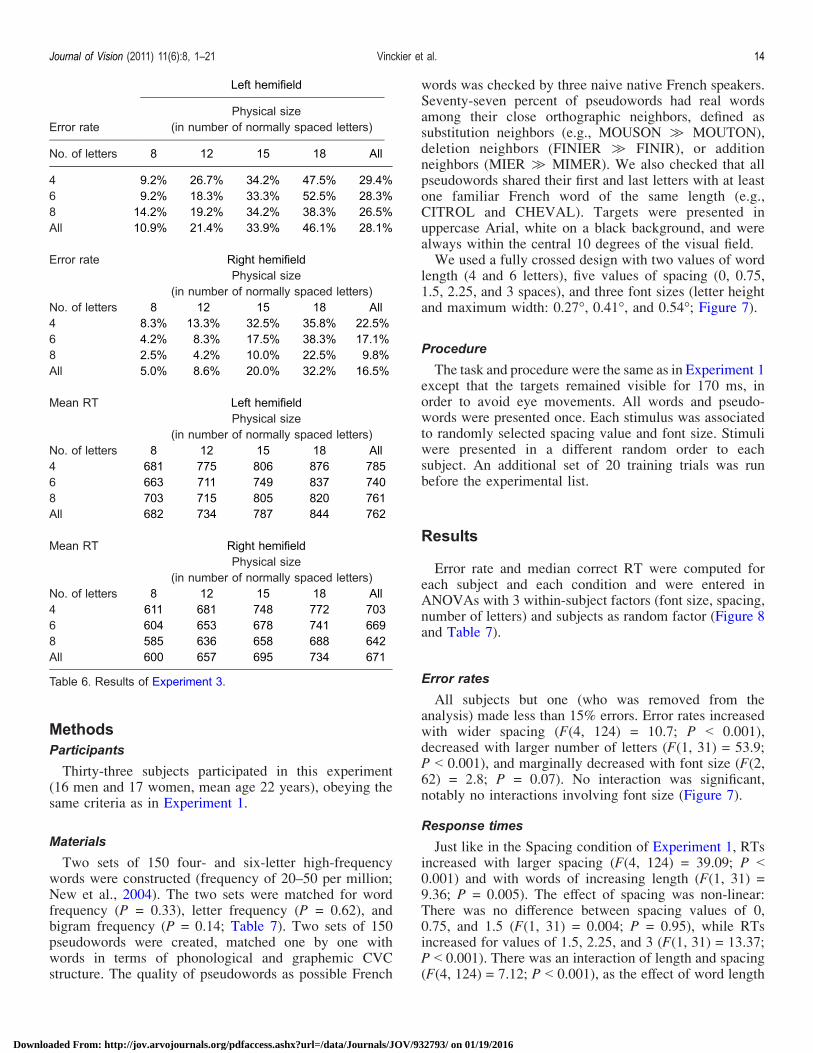
Error rates and median correct RTs for real words werecomputed for each subject and each condition and wereentered in ANOVAs with 3 within-subject factors (numberof letters, physical size, hemifield) and subjects as randomfactor (Figure 6 and Table 6).
Error rates
There was a right-hemifield advantage (F(1, 11) = 14.0;P = 0.003) and an interaction of number of letters andphysical size (F(6, 66) = 2.9; P = 0.02). For small physicalsize (8 letters), there was no effect of number of letters(P 9 0.1), whereas there was an effect of number of lettersfor all larger physical sizes (F(2, 22) = 4.2, P = 0.03;F(2, 22) = 3.7 P = 0.04; and F(2, 22) = 6.2; P = 0.07 forphysical sizes 12, 15, and 18, respectively).
Responses times
One subject was removed from this analysis because heproduced no correct response in two of the most difficultleft-hemifield conditions (8 letters, size 15; and 6 letters,size 18). There were no significant interactions. Therewas the usual right-hemifield advantage (F(1, 10) = 23.63;P G 0.001). Latencies increased with larger physical size(F(3, 30) = 23.1; P G 0.001). Finally; latencies were slowerfor words with fewer letters (F(2, 20) = 9.67; P = 0.0012;similar to the pattern of errors, there was a tendency for thislength effect to be larger in the right hemifield than in theleft hemifield; interaction F(2, 20) = 2.7; P = 0.09).
Length effect
In Experiment 2a, we observed a reversal of the wordlength effect across hemifields. In the right hemifield,
Figure 5. Structure of stimuli for Experiment 3. In order to tease apart, in laterally presented words, the role of letter spacing and ofphysical length, we compared 4-, 6-, and 8-letter words with an identical physical size, which was achieved by a wider spacing in wordswith fewer letters. This was done while independently varying the physical length of stimuli. Stimuli were flashed in the left or righthemifield.
No. of spacesPhysical size
(in number of normally spaced letters)
No. of letters 8 12 15 18
4 1.3 2.7 3.7 4.76 0.4 1.2 1.8 2.48 0.0 0.6 1.0 1.4
Table 5. Structure of stimuli of Experiment 3.
Journal of Vision (2011) 11(6):8, 1–21 Vinckier et al. 12
Downloaded From: http://jov.arvojournals.org/pdfaccess.ashx?url=/data/Journals/JOV/932793/ on 01/19/2016

contrary to the usual pattern, shorter words were moredifficult to read than longer words. We hypothesized thatthis was due to the fact that in the right hemifield, theinitial letter was more peripheral for short than for longwords. If this account is correct, words displayed in theRVF with their initial letter at a constant eccentricityshould show the usual length effect. The present experi-ment gave us an opportunity to test precisely thissituation. We compared responses to 4-letter words fittedin the physical size of 12 vs. 6-letter words fitted in thephysical size of 18. Those two types of stimuli hadapproximately the same space between letters (2.7 and2.4 spaces, respectively). In the right visual field, six-letterwords yielded higher error rates (F(1, 11) = 16.8; P =0.0018) and marginally longer latencies (F(1, 10) = 4.23;P = 0.067) than four-letter words. Conversely, whenrestricting the analysis to right-hemifield stimuli with aspacing smaller than 2 spaces, there was no significanteffect of word length (P 9 0.1). In summary, whenever theeccentricity of the first letter is kept constant, there is noinverse length effect in the right hemifield.
Discussion
Overall, reading performance deteriorated when wordswere physically larger. Naturally, for words of a given num-ber of letters, physical size is proportional to letter spacing,and the role of the two parameters cannot be dissociated.However, the critical result is that, for any given physicalsize, performance deteriorated for words comprising fewer
letters (an inverse length effect), i.e., for larger valuesof spacing. It is now possible to answer the question thatmotivated Experiment 3. Even for laterally presented words,performance depends critically on spacing, an effect thatcannot be reduced to the effect of physical size.Note that there was a tendency for the inverse length
effect to be larger in the right hemifield than in the lefthemifield. A natural account of this asymmetry is that theinverse length effect was partially cancelled by the usuallength effect prevailing in the LVF. It is now safe to con-clude from the above experiments that reading perfor-mance deteriorates whenever a critical of space is introducedbetween letters and that this effect cannot be reducedto artifacts of physical size or eccentricity. However, animportant point still needs clarification. According to thehypotheses presented in the Introduction section, thisthreshold should scale with letter size. Thus, it should beabout 2 spaces, irrespective of font size, rather thandefined by some fixed angular value. However, the firstthree experiments used the same font size (letter heightand maximum width: 0.27-) for all stimuli with spacedletters. The aim of the next experiment is to assess thevalue of the spacing threshold with other font sizes.
Experiment 4
In order to study the interaction of spacing withabsolute font size, we designed a fully crossed experimentcombining five degrees of spacing with three font sizes.
Figure 6. Results of Experiment 3. Overall reading performance deteriorated when words were physically longer. The critical result is that,for any given physical size, performance was worst for words comprising fewer letters, i.e., for larger values of spacing, confirming that theimpact of spacing cannot be reduced to the effect of physical length.
Journal of Vision (2011) 11(6):8, 1–21 Vinckier et al. 13
Downloaded From: http://jov.arvojournals.org/pdfaccess.ashx?url=/data/Journals/JOV/932793/ on 01/19/2016
MethodsParticipants
Thirty-three subjects participated in this experiment(16 men and 17 women, mean age 22 years), obeying thesame criteria as in Experiment 1.
Materials
Two sets of 150 four- and six-letter high-frequencywords were constructed (frequency of 20–50 per million;New et al., 2004). The two sets were matched for wordfrequency (P = 0.33), letter frequency (P = 0.62), andbigram frequency (P = 0.14; Table 7). Two sets of 150pseudowords were created, matched one by one withwords in terms of phonological and graphemic CVCstructure. The quality of pseudowords as possible French
words was checked by three naive native French speakers.Seventy-seven percent of pseudowords had real wordsamong their close orthographic neighbors, defined assubstitution neighbors (e.g., MOUSON d MOUTON),deletion neighbors (FINIER d FINIR), or additionneighbors (MIER d MIMER). We also checked that allpseudowords shared their first and last letters with at leastone familiar French word of the same length (e.g.,CITROL and CHEVAL). Targets were presented inuppercase Arial, white on a black background, and werealways within the central 10 degrees of the visual field.We used a fully crossed design with two values of word
length (4 and 6 letters), five values of spacing (0, 0.75,1.5, 2.25, and 3 spaces), and three font sizes (letter heightand maximum width: 0.27-, 0.41-, and 0.54-; Figure 7).
Procedure
The task and procedure were the same as in Experiment 1except that the targets remained visible for 170 ms, inorder to avoid eye movements. All words and pseudo-words were presented once. Each stimulus was associatedto randomly selected spacing value and font size. Stimuliwere presented in a different random order to eachsubject. An additional set of 20 training trials was runbefore the experimental list.
Results
Error rate and median correct RT were computed foreach subject and each condition and were entered inANOVAs with 3 within-subject factors (font size, spacing,number of letters) and subjects as random factor (Figure 8and Table 7).
Error rates
All subjects but one (who was removed from theanalysis) made less than 15% errors. Error rates increasedwith wider spacing (F(4, 124) = 10.7; P G 0.001),decreased with larger number of letters (F(1, 31) = 53.9;P G 0.001), and marginally decreased with font size (F(2,62) = 2.8; P = 0.07). No interaction was significant,notably no interactions involving font size (Figure 7).
Response times
Just like in the Spacing condition of Experiment 1, RTsincreased with larger spacing (F(4, 124) = 39.09; P G0.001) and with words of increasing length (F(1, 31) =9.36; P = 0.005). The effect of spacing was non-linear:There was no difference between spacing values of 0,0.75, and 1.5 (F(1, 31) = 0.004; P = 0.95), while RTsincreased for values of 1.5, 2.25, and 3 (F(1, 31) = 13.37;P G 0.001). There was an interaction of length and spacing(F(4, 124) = 7.12; P G 0.001), as the effect of word length
Error rate
Left hemifield
Physical size(in number of normally spaced letters)
No. of letters 8 12 15 18 All
4 9.2% 26.7% 34.2% 47.5% 29.4%6 9.2% 18.3% 33.3% 52.5% 28.3%8 14.2% 19.2% 34.2% 38.3% 26.5%All 10.9% 21.4% 33.9% 46.1% 28.1%
Error rate Right hemifieldPhysical size
(in number of normally spaced letters)No. of letters 8 12 15 18 All4 8.3% 13.3% 32.5% 35.8% 22.5%6 4.2% 8.3% 17.5% 38.3% 17.1%8 2.5% 4.2% 10.0% 22.5% 9.8%All 5.0% 8.6% 20.0% 32.2% 16.5%
Mean RT Left hemifieldPhysical size
(in number of normally spaced letters)No. of letters 8 12 15 18 All4 681 775 806 876 7856 663 711 749 837 7408 703 715 805 820 761All 682 734 787 844 762
Mean RT Right hemifieldPhysical size
(in number of normally spaced letters)No. of letters 8 12 15 18 All4 611 681 748 772 7036 604 653 678 741 6698 585 636 658 688 642All 600 657 695 734 671
Table 6. Results of Experiment 3.
Journal of Vision (2011) 11(6):8, 1–21 Vinckier et al. 14
Downloaded From: http://jov.arvojournals.org/pdfaccess.ashx?url=/data/Journals/JOV/932793/ on 01/19/2016

emerged and increased only for spacing values of 2.25 and3 (P = 0.0028 and P = 0.0015, respectively). Latencieswere slightly longer for the smaller font (mean 601 ms)than for the two larger fonts (mean 588 and 591 ms;F(2, 62) = 4.09; P = 0.02). Crucially, there was no
interaction involving font size: As visible in Figure 7, thespacing threshold was always about 2 spaces, irrespectiveof the absolute size of the font. For each of the 3 font sizesconsidered separately, the length effect was absent for allspacing values G2 and significant or marginal for spacingvalues 92.
Discussion
In summary, Experiment 4 replicated the fundamentaleffect of letter spacing on reading performance, i.e.,emergence of a length effect and performance deterio-ration for spacing of at least 2 spaces. The novel finding,however, is that this pattern prevailed irrespective ofabsolute font size: the threshold was constant whenexpressed in terms of number of spaces, while it variedby a factor of 2 in angular size.
Additional analyses with mixed-effectsmodels
We complemented the classical ANOVAs reportedabove with analyses using linear mixed models, withitems and subjects as crossed random factors (Baayen,Davidson, & Bates, 2008). The aim of these additionalanalyses was to study the respective contributions ofcorrelated factors such as eccentricity, physical width, andspacing. More specifically, they may allow us to discrim-inate between alternative accounts of the emergence of alength effect: We claimed that there is an interaction ofspacing with the number of letters, as a length effectemerges for spacing of about 2 spaces and above.However, alternatively, this interaction could be describedas an interaction of spacing with physical width or ofspacing with maximum eccentricity. As we did not fullydecorrelate number of letters, spacing, and eccentricity/physical width within a single experiment, these alternative
Error rate
Font size 0.27
Scaling value
No. ofletters 0 0.75 1.5 2.25 3 All
4 8.4% 10.0% 10.0% 12.8% 10.9% 10.4%6 5.3% 4.4% 5.3% 6.6% 11.9% 6.7%All 6.9% 7.2% 7.7% 9.7% 11.4% 8.6%
Error rate Font size 0.41Scaling value
No. ofletters
0 0.75 1.5 2.25 3 All
4 5.6% 10.0% 9.1% 10.6% 11.9% 9.4%6 1.9% 6.2% 4.4% 6.6% 9.1% 5.6%All 3.8% 8.1% 6.8% 8.6% 10.5% 7.5%
Error rate Font size 0.54Scaling value
No. ofletters
0 0.75 1.5 2.25 3 All
4 7.8% 7.5% 8.7% 10.6% 10.3% 9.0%6 1.6% 3.4% 3.4% 7.5% 8.1% 4.8%All 4.7% 5.5% 6.1% 9.1% 9.2% 6.9%
Mean RT Font size 0.27Scaling value
No. ofletters
0 0.75 1.5 2.25 3 All
4 579 570 591 602 618 5926 558 580 598 644 673 611All 569 575 594 623 645 601
Mean RT Font size 0.41Scaling value
No. ofletters
0 0.75 1.5 2.25 3 All
4 562 563 588 577 615 5816 562 559 598 599 653 594All 562 561 593 588 634 588
Mean RT Font size 0.54Scaling value
No. ofletters
0 0.75 1.5 2.25 3 All
4 562 562 582 598 617 5846 551 568 585 620 665 598All 556 565 584 609 641 591
Table 7. Results of Experiment 4.
Figure 7. Structure of stimuli for Experiment 4. In order to studythe interaction of spacing with absolute font size, we used fivedegrees of letter spacing with three font sizes in a fully crosseddesign. Stimuli were presented centrally.
Journal of Vision (2011) 11(6):8, 1–21 Vinckier et al. 15
Downloaded From: http://jov.arvojournals.org/pdfaccess.ashx?url=/data/Journals/JOV/932793/ on 01/19/2016

interpretations are difficult to disentangle. However, thisissue can be addressed by pooling data across experi-ments. This is what we did, performing separate analysesfor words presented centrally (Experiments 1 and 4) andfor words presented laterally, in the RVF or the LVF(Experiments 2 and 3), using mixed-effect regressionmodels, with random intercepts for subjects and items.These analyses were applied to the reaction time datarestricted to trials with real words and where the partic-ipant’s response was correct. RTs were log-transformedprior to analysis to reduce the skewness of the distribution.
Experiments 1 and 4
Data from Experiments 1 and 4 (i.e., centrally presentedwords) were pooled. Word length and maximal eccen-tricity, both expressed in number of letters, were included
as regressors. We also used a dummy factor “thresholdedspacing,” which was equal to zero for spacing values G2and equal to spacing otherwise. We then compared all thepossible models with and without interactions. We reporthere the model with the lowest Akaike InformationCriterion (AIC), i.e., with the best trade-off of accuracyand complexity of the model. This model includedmain effects of word length, maximal eccentricity, andthresholded spacing, plus the interaction of thresholdedspacing and length. We applied the Markov Chain MonteCarlo (MCMC) sampling method (with a sample size of10,000) to obtain P-values for the coefficients (Baayenet al., 2008). Note that the physical width of the stringswas not included in the model because it was equal to themaximal eccentricity divided by 2.In this analysis, RTs increased with thresholded spacing
(pMCMC G 0.001) and with maximal eccentricity(pMCMC G 0.001; Table 8). There was no significant
Figure 8. Results of Experiment 4. The emergence of a length effect and performance deterioration for spacing of at least 2 spaces werereplicated. This pattern prevailed irrespective of absolute font size: the threshold was constant when expressed in terms of number ofspaces, while it varied by a factor of 2 in angular size.
Journal of Vision (2011) 11(6):8, 1–21 Vinckier et al. 16
Downloaded From: http://jov.arvojournals.org/pdfaccess.ashx?url=/data/Journals/JOV/932793/ on 01/19/2016

main effect of length (pMCMC 9 0.1). However, as inprevious analyses, length positively interacted withthresholded spacing (pMCMC G 0.001). Note that wealso examined a variant of this model, which included theinteraction of thresholded spacing and maximal eccen-tricity, as this model had a minimally higher AIC. Theresults of this alternative model were essentially identical,and the additional interaction was not significant(pMCMC 9 0.1).1
Experiments 2 and 3
Data from Experiments 2 and 3 (i.e., laterally presentedwords) were pooled. Word length, minimal and maximaleccentricity, and thresholded spacing were included asregressors. We performed this analysis separately for theleft and right hemifields. We compared different models(including the full model with all interactions and modelswith any combination between (i) interaction of thresh-olded spacing and length, (ii) interaction of maximaleccentricity and length, and (iii) the triple interaction) andkept the model with the lowest AIC in both hemifields.This model included main effects of word length, maximaleccentricity, and thresholded spacing. It did not include themain effect of minimal eccentricity nor any interaction. Weapplied the Markov Chain Monte Carlo (MCMC) samplingmethod (with a sample size of 10,000) to obtain P-valuesfor the coefficients (Baayen et al., 2008).In this analysis, RTs increased with maximal
eccentricity (pMCMC G 0.001 in the right and in theleft hemifield, respectively) and with thresholded spac-ing (pMCMC = 0.01 and pMCMC G 0.001 in the rightand left hemifields, respectively; Table 8). In the left
hemifield, RTs increased with length (pMCMC = 0.005),whereas RTs decreased with length in the right hemifield(pMCMC G 0.001).
Discussion of additional analyses
The results of the mixed-model analyses were consis-tent with the previous classical analyses. When wordswere presented centrally (Experiments 1 and 4), a maineffect of spacing and an interaction between spacing andnumber of letters were observed. With lateral presentation(Experiments 2 and 3), the mixed-effects model confirmthe main effect of spacing, independently from maximaleccentricity. In summary, we showed that the effects ofinterest (letter spacing and its interaction with length) arestill significant when also modeling the contribution ofeccentricity. One should note that although our resultsbroadly fit the LCD model, one prediction was notfulfilled. We have found an interaction of number ofletters and spacing for the central presentation, but thisinteraction was not significant with lateralized presenta-tion, particularly in the right visual field. This lack ofinteraction is difficult to interpret. Naturally, the modelmay be inaccurate, and the reading process may notchange qualitatively with spacing. For instance, the effectof spacing could be due to increased attentional demand(to group the stimulus as an object) and would notqualitatively change the nature of orthographic analysis.However, such an additional constant attentional costwould not explain the interaction observed with centralwords, in our data and in other studies (Cohen et al., 2008;
Experiments 1 and 4
Estimate (*10j3) CI (*10j3) t-value
No. of letters j1.3 [j4.2; 1.7] j0.8Maximal eccentricity 3.9 [2.5; 5.2] 5.5Thresholded spacing 8.5 [5.4; 11.5] 5.4Thresholded spacing: length 4.9 [3.7; 6.1] 8.1
Experiments 2 and 3: Left hemifieldEstimate (*10j3) CI (*10j3) t-value
Length 5.6 [1.6; 9.5] 2.8Maximal eccentricity 5.3 [4.2; 6.5] 9.4Thresholded spacing 8.1 [3.8; 12.4] 3.7
Experiments 2 and 3: Right hemifieldEstimate (*10j3) CI (*10j3) t-value
Length j6.7 [j10.5; j2.8] j3.4Maximal eccentricity 6.8 [5.8; 7.8] 13Thresholded spacing 5.2 [1.2; 9.2] 2.6
Table 8. Results of mixed model.
Journal of Vision (2011) 11(6):8, 1–21 Vinckier et al. 17
Downloaded From: http://jov.arvojournals.org/pdfaccess.ashx?url=/data/Journals/JOV/932793/ on 01/19/2016

Vinckier et al., 2006). Rather, there may be methodo-logical reasons for not observing this subtle effect, such asthe alignment of words by their peripheral edge, withminimal and mean eccentricity larger for short words.Furthermore, only one above-threshold value of spacingwas used in lateralized presentation, and this lack ofinteraction could, thus, be due to a lack of power. Thispoint should be the object of further investigation.
General discussion
Summary of the results
In the present series of experiments, we measured theimpact of letter spacing on reading performance andprogressively purified this effect from a number ofpossible confounding variables. In Experiment 1, weestablished the core phenomenon, namely, that perfor-mance deteriorates non-linearly whenever letters are sepa-rated by at least 2 blank spaces, with the concomitantemergence of a word length effect. We showed that thiseffect cannot be reduced to an effect of physical word size,a variable correlated with spacing. Indeed, increasingword size by increasing font size, but without spacingletters, had no impact on reading. In Experiment 2a, weaddressed the role of a further potential confoundingparameter, namely, eccentricity. Spacing makes someletters migrate to the periphery of the visual field and,thus, enter in a region of lower visual acuity. By movingnon-spaced stimuli to lateral regions of the visual field, wepitted spacing and eccentricity against each other andconcluded that the impact of spacing cannot be reduced toa spurious effect of peripheral vision. Experiment 2breplicated the results of Experiment 2a with a morenatural reading task. In Experiment 3, we furtherseparated spacing from word size by equating size across4-, 6-, and 8-letter words. The results again showed thatthe effect of spacing cannot be reduced to an effect ofphysical size. Finally, in Experiment 4, we showed thatthe critical threshold of 2 spaces was constant acrossvariations in font size.
Task and material
In the present experiments, our aim was to study theearly, visual, component of word reading. To this end, wemanipulated purely visual parameters (spacing, eccentric-ity, side) and measured their impact on lexical decision.We, therefore, expect that our conclusions should apply toany reading task sharing the same visual component,includingmore natural tasks such as reading aloud or readingfor comprehension. Note that we used orthographically
and phonologically plausible pseudowords in order toprevent any low-level response strategy. We have indica-tions that our results do generalize beyond the lexicaldecision task. First, the main results of Experiment 2awere replicated in Experiment 2b using an overt readingtask. Second, a spacing threshold of about 2 spaces waspreviously observed using a semantic decision task andalso using overt reading in a patient with parietal damage(Vinckier et al., 2006).In all experiments, we have used upper case stimuli. It
might be argued that such format is relatively infrequentin daily life. However, there are converging indicationsthat upper case words are not more difficult to read. Meanlatencies do not differ between upper case and lower casewords (Qiao et al., 2010). Moreover, the absence of aword length effect in normal reading conditions, as shown,e.g., in the present study, confirms that expert parallelreading prevails also with upper case words. Moreover,functional imaging studies have evidenced subliminalcross-case priming (e.g., radio 9 RADIO) in the ventralvisual system, suggesting that the case quickly becomesirrelevant starting from early visual stages of wordprocessing (Dehaene et al., 2004).
Reading spaced letters: Physiologicalmechanisms
The fast and parallel reading performance whosedevelopment culminates in literate adults is thought toresult from a progressive tuning of the ventral visualsystem (Dehaene et al., 2010). This training, however, isrestricted to the familiar reading format, namely, horizon-tally printed strings of contiguous letters in the central andright parafoveal portions of the visual field. In order tocope with degraded or unfamiliar displays, includingwords with spaced letters, readers resort to serial scanningof word fragments, explaining both the overall slowingand the positive correlation with the number of letters.There is functional imaging and neuropsychologicalevidence that this compensation process is based uponparietal attention-related mechanisms. Above a thresholdof about 2 spaces between consecutive letters, concom-itant with performance reduction, there is a suddenincrease in BOLD signal in bilateral posterior intraparietalareas that do not belong to the typical reading network(Cohen et al., 2008). The causal role of parietal cortex wasdemonstrated in a patient with bilateral parietal lesions,whose reading performance dropped dramatically as soonas letter spacing passed the very same threshold of about2 spaces. Thus, both fMRI and neuropsychology suggestthat slow reading with a length effect reflects the deploy-ment of attention-dependent spatial scanning strategiesunder parietal guidance, a process that is triggered whenspacing exceeds the capacity of the ventral cortex forparallel reading and invariant word recognition. Applied
Journal of Vision (2011) 11(6):8, 1–21 Vinckier et al. 18
Downloaded From: http://jov.arvojournals.org/pdfaccess.ashx?url=/data/Journals/JOV/932793/ on 01/19/2016

to the present experiment, this conclusion implies that theinvariance of the ventral visual system for letter spacingcollapses suddenly above a critical threshold value ofabout 2 spaces.
The bigram coding hypothesis
A threshold value slightly below 2 spaces matches anexplicit prediction of the LCD framework (Dehaene et al.,2005). According to this model, detectors of single letters,with a local receptive field, converge to create the slightlylarger receptive fields of open bigram detectors sensitiveto the spatial configuration of two letters. As mentioned inthe Introduction section, based on the increase ofreceptive fields in the IT cortex by a factor of about 2.5from one neural level to the next (Rolls, 2000), the LCDmodel proposes that blank spaces of 2 spaces should besufficient to disrupt bigram detectors (Dehaene et al.,2005), precluding parallel encoding of letters into largerunits. This value is, thus, a plausible though approximateestimator of the limits of the letter grouping ability of theventral pathway.One important consequence of the present research is to
support the hypothesis that the fast recognition ofcombinations of letters plays a central role at some stagein the coding of written words, to such an extent thatinterfering with this representation drastically impedes theparallel analysis of letter strings. It should, however, benoted that, strictly speaking, the present experimentscannot determine the exact nature of this combinatorialthat is disrupted by spacing. It could be pairs of letters(bigrams) but also perhaps a subset of these (e.g., onlyconsonant bigrams; Perea, Acha, & Carreiras, 2009) oreven larger units such as morphemes. Bigram coding hasbeen proposed to play an important role in several recentmodels of orthographic processing (Grainger, Granier,Farioli, Van Assche, & van Heuven, 2006; Grainger &Whitney, 2004; Whitney, 2001) and is supported byseveral empirical findings. The number of shared bigramscan explain the amount of priming for subliminal words andtheir substrings (e.g., the fact that “grdn” primes “garden”;although see also Davis & Bowers, 2006; Grainger et al.,2006; Grainger & Holcomb, 2009; Humphreys, Evett, &Quinlan, 1990; Peressotti & Grainger, 1999; Schoonbaert& Grainger, 2004). Bigram frequency is a strong predictorof the activation of the visual word form area, a part of theventral visual cortex that houses an orthographic repre-sentation of letter strings (Binder, Medler, Westbury,Liebenthal, & Buchanan, 2006; Vinckier et al., 2007).There is also support for the notion that the reading systemquickly parses visual strings into subsequences corre-sponding to morphemes such as frequent prefixes andsuffixes (Burani, Marcolini, De Luca, & Zoccolotti, 2008;Christianson, Johnson, & Rayner, 2005; Frost, Deutsch,Gilboa, Tannenbaum, & Marslen-Wilson, 2000), even if
these are only “pseudomorphemes” semantically inappro-priate in the current word context (Longtin, Segui, &Halle, 2003; Rastle, Davis, & New, 2004). Clearly, furtherresearch will be needed to determine the exact level oforthographic coding that is disrupted by spacing.
Size invariance of the reading threshold
Finally, why is the spacing threshold of about 2 spacesinvariant for changes in the size of letters, as shown inExperiment 4? This issue is not explicitly dealt with bythe LCD model, but two observations may clarify thispoint. First, according to the LCD model, there is, at theearliest levels of the neural hierarchy, a tolerance forsmall variations in the position and size of visual features.The progressive increase in this tolerance up to detectorsfor letters and bigrams should contribute to an overall sizeinvariance of word recognition processes. Second, readershave actually been exposed to letters of various sizes, anddifferent neurons may well have become tuned to lettersand bigrams of various dimensions. This is in agreementwith monkey data showing that anterior IT neurons havereceptor fields ranging from 3- to 26- and appropriate forthe detection of objects of different angular sizes (Op DeBeeck & Vogels, 2000). In this view, size invarianceemerges progressively at increasingly higher stages of thevisual hierarchy, responsible for letter detection andbeyond. This is in agreement with the increase ofinvariance for size along the posterior to anterior axis ofthe lateral occipital cortex (Eger & Kell, 2008), a visualarea involved in invariant object recognition and that isabutting and partially overlapping with the VWFA.Considering both early and late sources of size invariance,the main explanation for the invariance of the spacingthreshold is simply that the receptive fields of bigramdetectors are more than twice larger than the receptive fieldsof the letter detectors from which they receive their input.
Conclusion
Invariance is a fundamental requirement in readingVwemust be capable of identifying words in spite of majorchanges in size, location, and spacing. The detection ofspecific combinations of letters such as bigrams maycrucially contribute to the progressive construction of aninvariant representation that preserves the identity of theletter string (Dehaene et al., 2005; Grainger & Whitney,2004). The present experiments, however, identify a clearlimitation of this architecture: word recognition is onlyinvariant across small changes in letter spacing, whilelarger spaces severely disrupt reading and impose a switchto a radically distinct serial processing mode.
Journal of Vision (2011) 11(6):8, 1–21 Vinckier et al. 19
Downloaded From: http://jov.arvojournals.org/pdfaccess.ashx?url=/data/Journals/JOV/932793/ on 01/19/2016

Acknowledgments
This research was funded by the Agence Nationale pourla Recherche (ANR, CORELEX project).
Commercial relationships: none.Corresponding author: Laurent Cohen.Email: [email protected]: AP-HP, Department of Neurology, Hopital de laSalpetriere, Paris, 75013, France.
Footnote
1In order to determine whether the interaction of
spacing and length depended only on the trials in whichwords were most difficult to read (i.e., long words withwidely spaced letters), we run the LME analysis ofExperiments 1 and 4, removing the three extremeconditions, i.e., 8-letter words with a spacing of 3 or 4spaces and 6-letter words with a spacing of 4 spaces. Theresults of this analysis were essentially the same as with thefull set of data. Particularly, the optimal model remainsunchanged, and the interaction of spacing and lengthremains significant, demonstrating that this effect cannotbe reduced to the extreme conditions of Experiment 1.
References
Aghababian, V., & Nazir, T. A. (2000). Developingnormal reading skills: Aspects of the visual processesunderlying word recognition. Journal of ExperimentalChild Psychology, 76, 123–150.
Baayen, R. H., Davidson, D. J., & Bates, D. M. (2008).Mixed-effects modeling with crossed random effectsfor subjects and items. Journal of Memory andLanguage, 59, 390–412.
Binder, J. R., Medler, D. A., Westbury, C. F., Liebenthal, E.,& Buchanan, L. (2006) Tuning of the human leftfusiform gyrus to sublexical orthographic structure.Neuroimage, 33, 739–748.
Bub, D. N., & Lewine, J. (1988). Different modes of wordrecognition in the left and right visual fields. Brainand Language, 33, 161–188.
Burani, C., Marcolini, S., De Luca, M., & Zoccolotti, P.(2008). Morpheme-based reading aloud: Evidencefrom dyslexic and skilled Italian readers. Cognition,108, 243–262.
Christianson, K., Johnson, R. L., & Rayner, K. (2005).Letter transpositions within and across morphemes.
Journal of Experimental Psychology: Learning,Memory, and Cognition, 31, 1327–1339.
Cohen, L., & Dehaene, S. (2009). Ventral and dorsalcontributions to word reading. In M. S. Gazzaniga(Ed.), Cognitive neuroscience (4th ed., pp. 789–804).The MIT Press.
Cohen, L., Dehaene, S., Naccache, L., Lehericy, S.,Dehaene-Lambertz, G., Henaff, M. A., et al. (2000).The visual word form area: Spatial and temporalcharacterization of an initial stage of reading innormal subjects and posterior split-brain patients.Brain, 123, 291–307.
Cohen, L., Dehaene, S., Vinckier, F., Jobert, A., &Montavont, A. (2008). Reading normal and degradedwords: Contribution of the dorsal and ventral visualpathways. Neuroimage, 40, 353–366.
Davis, C. J., & Bowers, J. S. (2006). Contrasting fivedifferent theories of letter position coding: Evidencefrom orthographic similarity effects. Journal ofExperimental Psychology: Human Perception &Performance, 32, 535–557.
Dehaene, S., Cohen, L., Sigman, M., & Vinckier, F.(2005). The neural code for written words: Aproposal. Trends in Cognitive Sciences, 9, 335–341.
Dehaene, S., Jobert, A., Naccache, L., Ciuciu, P., Poline,J.-B., Le Bihan, D., et al. (2004). Letter binding andinvariant recognition of masked words: Behavioraland neuroimaging evidence. Psychological Science,15, 307–313.
Dehaene, S., Pegado, F., Braga, L. W., Ventura, P., Filho,G. N., Jobert, A., et al. (2010). How learning to readchanges the cortical networks for vision and language.Science, 3, 1359–1364.
Eger, E., & Kell, C. A. (2008). Kleinschmidt A. Gradedsize sensitivity of object-exemplar-evoked activitypatterns within human LOC subregions. Journal ofNeurophysiology, 100, 2038–2047.
Ellis, A. W. (2004). Length, formats, neighbours, hemi-spheres, and the processing of words presentedlaterally or at fixation. Brain and Language, 88,355–366.
Ferrand, L., & New, B. (2003). Syllabic length effects invisual word recognition and naming. Acta Psycho-logica, 113, 167–183.
Frost, R., Deutsch, A., Gilboa, O., Tannenbaum, M., &Marslen-Wilson, W. (2000). Morphological priming:Dissociation of phonological, semantic, and mor-phological factors. Memory and Cognition, 28,1277–1288.
Gaillard, R., Naccache, L., Pinel, P., Clemenceau, S.,Volle, E., Hasboun, D., et al. (2006). Direct intra-
Journal of Vision (2011) 11(6):8, 1–21 Vinckier et al. 20
Downloaded From: http://jov.arvojournals.org/pdfaccess.ashx?url=/data/Journals/JOV/932793/ on 01/19/2016

cranial, fMRI and lesion evidence for the causal roleof left inferotemporal cortex in reading. Neuron, 50,191–204.
Grainger, J., Granier, J. P., Farioli, F., Van Assche, E., &van Heuven, W. J. (2006). Letter position informationand printed word perception: The relative-positionpriming constraint. Journal of Experimental Psy-chology: Human Perception and Performance, 32,865–884.
Grainger, J., & Holcomb, P. J. (2009). An ERP inves-tigation of orthographic priming with relative-positionand absolute-position primes. Brain Research, 1270,45–53.
Grainger, J., & Whitney, C. (2004). Does the huamn mnidraed wrods as a wlohe? Trends in Cognitive Sciences,8, 58–59.
Hasson, U., Levy, I., Behrmann, M., Hendler, T., &Malach, R. (2002). Eccentricity bias as an organizingprinciple for human high-order object areas. Neuron,34, 479–490.
Humphreys, G. W., Evett, L. J., & Quinlan, P. T. (1990).Orthographic processing in visual word identification.Cognitive Psychology, 22, 517–560.
Lavidor, M. (2002). An examination of the lateralizedabstractive/form specific model using MiXeD-CaSeprimes. Brain and Cognition, 48, 413–417.
Lavidor, M., & Ellis, A. W. (2002). Word length andorthographic neighborhood size effects in the left andright cerebral hemispheres. Brain and Language, 80,45–62.
Legge, G. E., Ahn, S. J., Klitz, T. S., & Luebker, A.(1997). Psychophysics of reading: XVI. The visualspan in normal and low vision. Vision Research, 37,1999–2010.
Longtin, C.-M., Segui, J., & Halle, P. A. (2003).Morphological priming without morphological rela-tionship. Language and Cognitive Processes, 18,313–334.
Nazir, T. A., Jacobs, A. M., & O’Regan, J. K. (1998).Letter legibility and visual word recognition. Memoryand Cognition, 26, 810–821.
New, B., Pallier, C., Brysbaert, M., & Ferrand, L. (2004).Lexique 2: A new French lexical database. Behav-ioral Research Methods, Instruments, and Computer,36, 516–524.
Op De Beeck, H., & Vogels, R. (2000). Spatial sensitivityof macaque inferior temporal neurons. Journal ofComputerized Neurology, 426, 505–518.
O’Regan, J. K., Levy-Schoen, A., Pynte, J., & Brugaillere, B.(1984). Convenient fixation location within isolated
words of different length and structure. Journal ofExperimental Psychology: Human Perception andPerformance, 10, 250–257.
Perea, M., Acha, J., & Carreiras, M. (2009). Eye move-ments when reading text messaging. Quarterly Jour-nal of Experimental Psychology, 62, 1560–1567.
Peressotti, F., & Grainger, J. (1999). The role of letteridentity and letter position in orthographic priming.Perception & Psychophysics, 61, 691–706.
Qiao, E., Vinckier, F., Szwed, M., Naccache, L.,Valabregue, R., Dehaene, S., et al. (2010). Uncon-sciously deciphering handwriting: Subliminal invari-ance for handwritten words in the visual word formarea. Neuroimage, 15, 1786–1799.
Rastle, K., Davis, M. H., & New, B. (2004). The broth inmy brother’s brothel: Morpho-orthographic segmen-tation in visual word recognition. PsychonomicBulletin and Review, 11, 1090–1098.
Rayner, K., & Bertera, J. H. (1979). Reading without afovea. Science, 206, 468–469.
Rolls, E. T. (2000). Functions of the primate temporallobe cortical visual areas in invariant visual objectand face recognition. Neuron, 27, 205–218.
Schoonbaert, S., & Grainger, J. (2004). Letter positioncoding in printed word perception: Effects of repeatedand transposed letters. Language and CognitiveProcesses, 19, 333–367.
Serre, T., Oliva, A., & Poggio, T. (2007). A feedforwardarchitecture accounts for rapid categorization. Pro-ceedings of the National Academy of Sciences of theUnited States of America, 104, 6424–6429.
Vinckier, F., Dehaene, S., Jobert, A., Dubus, J. P.,Sigman, M., & Cohen, L. (2007). Hierarchical codingof letter strings in the ventral stream: Dissecting theinner organization of the visual word-form system.Neuron, 55, 143–156.
Vinckier, F., Naccache, L., Papeix, C., Forget, J.,Hahn-Barma, V., Dehaene, S., et al. (2006). “What”and “Where” in word reading: Ventral coding ofwritten words revealed by parietal atrophy. Journalof Cognitive Neuroscience, 18, 1998–2012.
Weekes, B. S. (1997). Differential effects of number of letterson word and nonword naming latency. QuarterlyJournal of Experimental Psychology, 50A, 439–456.
Whitney, C. (2001). How the brain encodes the order ofletters in a printed word: The SERIOL model andselective literature review. Psychonomic Bulletin andReview, 8, 221–243.
Whitney, C., & Lavidor, M. (2004). Why word lengthonly matters in the left visual field. Neuropsycholo-gia, 42, 1680–1688.
Journal of Vision (2011) 11(6):8, 1–21 Vinckier et al. 21
Downloaded From: http://jov.arvojournals.org/pdfaccess.ashx?url=/data/Journals/JOV/932793/ on 01/19/2016