the impact of logistics performance on the success of
TRANSCRIPT

The Impact of Logistics Performance on the
Success of Trade Agreements
The Honors Program
Senior Capstone Project
Student’s Name: Kevin Arbeiter
Faculty Sponsor: Dr. Michael Gravier
April, 2017

Table of Contents Abstract ..................................................................................................................................... 1 Introduction ............................................................................................................................... 2 Literature Review ...................................................................................................................... 4 Data Inconsistencies ................................................................................................................ 13 Methodology & Results .......................................................................................................... 13
Quantitative Analysis 1 ....................................................................................................... 13 Quantitative Analysis 2 ....................................................................................................... 17
Conclusion .............................................................................................................................. 19 Appendices .............................................................................................................................. 22
Appendix A – Nations of the Tripartite Free Trade Agreement ......................................... 23 Appendix B – Countries by Existing Trade Agreement ..................................................... 24 Appendix C – LPI Rankings by Country ............................................................................ 25 Appendix D – Net Trade vs. LPI Linear Regression .......................................................... 26 Appendix E – Net Trade vs. LPI Nonlinear Regression ..................................................... 27 Appendix F – Net Trade vs. Customs LPI Nonlinear Regression ...................................... 29 Appendix G – Net Trade vs. Infrastructure LPI Nonlinear Regression .............................. 31 Appendix H – Net Trade vs. International Shipments LPI Nonlinear Regression ............. 33 Appendix I – Net Trade vs. Logistics Competence LPI Nonlinear Regression.................. 35 Appendix J – Net Trade vs. Tracking & Tracing LPI Nonlinear Regression ..................... 37 Appendix K – Net Trade vs. Timeliness LPI Nonlinear Regression .................................. 39 Appendix L – Quantitative Analysis 2 Remaining 21 Variables ........................................ 41 Appendix M – Overall LPI vs. 21 Variables (<.05 Significance) ....................................... 42 Appendix N – Overall LPI vs. 21 Variables (<.02 Significance) ....................................... 43
References ............................................................................................................................... 44

The Impact of Logistics Performance on the Success of Trade Agreements Senior Capstone Project for Kevin Arbeiter
- 1 -
ABSTRACT
The purpose of this capstone project is to determine whether or not it is possible to
predict the success and effectiveness of new trade agreements by looking at fundamental factors
associated with efficient supply chain management. Typically, free trade agreements are
analyzed using economic factors such as Gross Domestic Product or labor gains and losses.
When this is done to determine whether or not a trade agreement is successful, it is usually
backwards looking and too late for a country to opt out without economic repercussions. The
aim of this study is to determine whether it is possible to predict the potential success of a free
trade agreement. Furthermore, rather than using economic indicators to make predictions, I
have decided to use supply chain, specifically logistics, metrics to conduct this study. Using
logistics metrics is a better representation than economics, not only because the economics
metrics mentioned are lagging indicators, but also because without sound logistics and the
capability to move goods from point A to B, a trade agreement would fail. This study is
comprised of two different quantitative analyses. First, I look at the Logistics Performance
Index (LPI) compared to Net Trade to see if a relationship existed. The next step was to
determine what factors drive LPI growth and should be a country’s focus for improving. The
trade agreement focused on in this study was the Tripartite Free Trade Agreement
encompassing 27 countries in Africa.

The Impact of Logistics Performance on the Success of Trade Agreements Senior Capstone Project for Kevin Arbeiter
- 2 -
Figure 1 is a map of the 27 nations in the TFTA (Appendix A)

The Impact of Logistics Performance on the Success of Trade Agreements Senior Capstone Project for Kevin Arbeiter
- 3 -
INTRODUCTION
Since the late 1900’s, global trade has risen steadily (Ortiz-Ospina, E. & Roser, M.,
2016). As countries began to rely more and more on one another for commodities and goods,
they began to create free trade agreements (FTA’s). These agreements were aimed at lowering
any barriers to trade such as tariffs and customs procedures. As positive as FTA’s may seem,
critics will argue that many agreements are lopsided, with some nations benefiting at the
expense of others (Level, 2016). As such, this study looks to determine how successful an
FTA will be before its creation. Currently, there is little research compiled related to how
supply chain performance influences a trade agreement. This study is aimed at beginning to
fill that knowledge gap. The study differs from others of its kind in that it will be looking at
the agreement from a standpoint of supply chain management, more specifically, logistics. In
order for a trade agreement to be successful, goods must be moved from country to country.
Without strong logistics in place, these goods will be unable to get from point A to point B,
and the agreement will fail. It is crucial that a nation has strong logistics.
The focus of this study is centered on the newly created African Tripartite Free Trade
Agreement (TFTA) for two main reasons. First, the entire continent has generally been lagging
behind the rest of the world as far as growth and development is concerned (Merten, 2015).
This study has the potential to help these 27 nations and their citizen’s rise out of poverty and
improve logistics and standard of life. Furthermore, this is one of the few agreements without
a fully developed nation, such as the United States, involved. When a developed nation is
involved, the results of a trade agreement are more likely to be skewed. In the case of the North
America Free Trade Agreement (NAFTA), the U.S. was much further developed then Mexico
and Canada when the agreement was formed. While all the countries have reaped tremendous
rewards from the agreement, the United States was able to help its counterparts improve along
the way. According to Robert Blecker, “NAFTA did foster greater U.S.-Mexican integration
and helped transform Mexico into a major exporter of manufactured goods” (North, 2016). By
observing an agreement with only developing nations, a more accurate representation of what
nations must do to succeed together should be discovered.

The Impact of Logistics Performance on the Success of Trade Agreements Senior Capstone Project for Kevin Arbeiter
- 4 -
When it comes to trade agreements, a key factor is supply chain performance
(Hoekman). After all, if goods cannot be moved from country to country efficiently, a trade
agreement is pointless. If this proves to be an accurate way to predict the success of the
TFTA, it is possible that the same method can be replicated for future trade agreements
around the world. The Logistics Performance Index encompasses many aspects of supply
chain and logistics, making it a strong representation of how each country is performing
(Arvis, J., Saslavsky, D., Ojala, L., Shepherd, B., Busch, C., & Raj, A., 2014).
This is an extensive study comprising of two in depth literature reviews followed by
two quantitative analyses. The first literature review is aimed at identifying which variables
would be used. As this is a unique study, the second literature review was conducted with the
goal of justifying the use of each variable. After completing this step, a linear regression using
net trade as the dependent variable and Logistics Performance Index (LPI) as an independent
variable assessed whether or not LPI could drive trade growth (Arvis, Saslavsky, Ojala,
Shepherd, Busch, & Raj, 2014). Finally, a nonlinear regression was run to determine which
specific variables drive LPI. The goal of these studies was to determine where countries should
focus investments and improvements to help drive a successful trade agreement.
LITERATURE REVIEW
Introduction
Trade agreements have become the norm in today’s world. Being able to conduct
business across the globe, forming partnerships with other nations was inevitable. Both
intercontinental and regional, many countries hold membership to numerous trade agreements.
Recently, these agreements have come under much scrutiny. The debate on free trade
agreements makes this research project all the more relevant. By being able to predict the level
of success of an agreement, it will be possible to determine the true benefit of entering an
agreement before a country actually has to commit.
Being a Global Supply Chain Management major, my focus will lie primarily in how
the agreements will impact a countries logistics performance index (LPI). The LPI is a weighted
average of six supply chain components – customs, infrastructure, ease of shipping

The Impact of Logistics Performance on the Success of Trade Agreements Senior Capstone Project for Kevin Arbeiter
- 5 -
arrangements, quality of logistics services, tracking and tracing, and timeliness (Arvis, J.,
Saslavsky, D., Ojala, L., Shepherd, B., Busch, C., & Raj, A., 2014). As the underlying theme is
regional trade, trade volumes will be analyzed including GDP.
From a manufacturing standpoint, Africa has always been an interesting topic to me.
Many anticipated that some of continent’s countries would rise in manufacturing as China has,
leading to an economic boom. These countries would have lower costs due to largely to low
cost labor and little business regulation. To date, and for unknown reasons, this movement has
not occurred on the significant scale expected. The obvious question becomes, “Why not?”
coupled with the question of, “Is it still possible?” A large-scale trade agreement may be the
catalyst needed to propel Africa forward in its development.
It is my hope that this study will succeed in offering predictions on success before
countries have to devote resources towards making a trade agreement a reality. If the costs to
achieve and implement an agreement are higher than the net benefit of the agreement, it may
not be worthwhile for that country to participate.
Background/History
There does not appear to be any studies with the goal of predicting widespread trade
agreement success, especially using supply chain metrics. Many of the existing studies focus
on one or two countries to determine if they have achieved economic success, but there is no
focus on all of the member countries or supply chains. A major development from the ethnic
fractionalization standpoint has been the updated studies and formulas used to quantify cultural
differences. Ethnic fractionalization deals with the number, sizes, socioeconomic distribution,
and geographical location of distinct cultural groups, usually in a state or some otherwise
delineated territory (Ethnic Fractionalization). The specific cultural features might refer to
language, skin color, religion, ethnicity, customs and tradition, history, or another distinctive
criterion, alone or in combination. Frequently these features are used for social exclusion and
the monopolization of power (Gale, 2008). One such method developed by Fearon (2003)
appears to be considerably more accurate than the previous Ethno-Linguistic Fractionalization
(ELF) metric. This advancement will work very well during the quantitative portion of my
study.
Ethnic Fractionalization:

The Impact of Logistics Performance on the Success of Trade Agreements Senior Capstone Project for Kevin Arbeiter
- 6 -
Africa represents an interesting situation in terms of global perception. Many
“outsiders” view the continent as one location, rather than each of the 53 countries as individual
entities. This is very different than any other multi-country continent. Lumping all people under
one group portrays a scenario that could not be further from the truth. Africa, in fact, is the most
diverse continent on the planet in terms of regional ethnic groups (Fearon, 2003). Tanzania
alone has 22 different ethnic groups based on Fearon’s classification methods. Not only do the
individual countries have multiple ethnicities, the 27 countries I am studying stretch across
western Africa from the north to the south. Any region this large will have a diverse population.
If these groups are unable to interact with one another without conflict, the trade agreement will
be doomed from the start.
When conducting this study, it is crucial to look at these groups individually and give
the respect that the culture deserves. It is likely that cultural diversity can play a role in the
various levels of development and success each individual country may experience from the
trade agreement. So far, there have been a number of studies that have tried to quantify ethnic
fractionalization. Fearon (2003), investigated 160 countries in the world in an effort to update
the antiquated ELF measure from a study done by Easterly and Levine in the 1990s (Easterly
& Levine, 1997). Fearon specifically acknowledges the difficulty in gathering data for much of
sub-Saharan Africa, as there are no accurate reports of the various groups at the time of the
study. If Ethnic diversity is as large a problem as Fearon suggests, it may also pose challenges
to improving trade and inter-country growth. Fearon acknowledges that surveying would be the
best method of data collection for this study; however, without the resources available, he relied
on secondary sources. With this method, Fearon was able to identify 822 different ethnic groups
around the world. For a group to qualify in this study, the group had to make up at least one
percent of that nation’s population. In order to develop his index, Fearon used a common
measure of fractionalization. Basically, the probability that two individuals randomly chosen
are from different ethnic groups (Fearon, 2003).
Montalvo and Reynal-Querol (2005) attempted to uncover the same consequences of
ethnic heterogeneity. The two hypothesize that an ethnically polarized society may negatively
impact the rate of investment. It may also lead to rent-seeking situations that escalate into
conflict (Montalvo, & Reynal-Querol, 2005). In this case, the two believe that a polarization

The Impact of Logistics Performance on the Success of Trade Agreements Senior Capstone Project for Kevin Arbeiter
- 7 -
measure can better predict potential conflict than a fractionalization measure. Referring to other
reports, the two researchers suggest that ethnic and linguistic fractionalization have a negative
effect on the quality of government, but religious fractionalization does not (Montalvo, &
Reynal-Querol, 2005). This raises the interesting question of how ethnicities are defined.
Montalvo, Reynal-Querol, & Fearon all pose this issue in their studies. Fearon refers to attempts
at classification as a slippery slope, while Montalvo & Reynal-Querol highlight six distinct
characteristics of classification: race, color, culture, language, ethnic origin, and nationality. As
mentioned, the issue of classification is compounded in Africa where information is not always
accurate. Montalvo & Reynal-Querol determine it best to look at this issue in two different
lights. They argue that polarization can better show the potential for conflict in a country. It
was concluded that, in highly heterogenic countries there is no correlation between
fractionalization and polarization. The results of this study agree with Fearon that
fractionalization does have a negative impact on growth (although not for the reasons they
believed) and that polarization also has a negative effect because, “It reduces the rate of
investment and increases public consumption and the incidence of civil wars” (Montalvo &
Reynal-Querol, 2005, pg. 318).
Posner (2004) measured the ethnic fractionalization in Africa specifically in 2004.
Posner argues that the commonly used Ethno-Linguistic Fractionalization (ELF) measure is an
inaccurate method for measuring the impact of ethnic diversity on economic growth. This is
consistent with the views of Fearon, Montalvo, and Reynal-Querol, as all believe the ELF
measure is antiquated and the data used to calculate the values is “suspect” (Posner, 2004).
Rather than continue to use this method that aims to show the ethnic layout of a country in one
statistic, Posner develops a new method known as the Politically Relevant Ethnic Groups
(PREG) measure. Posner specifically acknowledges Fearon as “going the furthest in addressing
this problem by creating an index of cultural diversity based on an assessment of the cultural
distance between groups…” (Posner, 2004, 862). Posner’s method will provide another
alternative to ELF, but will require an in depth review to make sure it is accurate. I have not
found mention of the PREG model in any other sources I am referencing.
Elbadawi and Sambanis (2000) have done significant research into why there
are a number of civil wars raging across Africa. While many believe this is due to rivaling
The Impact of Logistics Performance on the Success of Trade Agreements Senior Capstone Project for Kevin Arbeiter
- 8 -
cultures that cannot coexist, the two believe otherwise. As it turns out, the warring may be due
to high levels of poverty, political failure, and the dependence on natural resources (Elbadawi
& Sambanis, 2000). Contrary to popular belief, it is argued that having multiple cultures may
actually help peace and compromise. With the majority of African nations’ economies routed
in the export of resources, it comes as no surprise that there would be a war over resources. Add
a governing style of dictatorship to the mix, and the perfect storm is created for a conflict
(Elbadawi & Sambanis, 2000).
Present-Day African Growth
The nations in Africa have been improving yearly, although this may not be visible to
many people from the outside, and there is still a long way to go to catch up with the rest of the
world economy. Kimenyi, Lewis, and Routman (2012) acknowledge that developing an intra-
African trade agreement is not a fix-all. It is however, a great starting point. The continent as a
whole will become more competitive due to economies of scale and the survival of the fittest
mentality of markets. As a direct result, the success will spur investment, thus helping to
transform the region. Witney Schneidman (2016) also questions whether forming a trade bloc
of just African nations is the smartest move. While Schneidman (2016) acknowledges that it is
a great step for the nations in Africa internally, it may isolate them from the international stage.
As they focus on the development of this agreement, they risk losing trade partners from the
developed world. This agreement represents a key point in the future of the region. It has the
potential to spur growth in half of the countries in Africa, making it very appealing to do
business. At the same time, the nations have to make sure they do not become so focused on
intra-African success that they miss out on international opportunities.
Index Reports
In order to test the quantitative portion of this study, numerous indices will be
used to run regression models aimed at determining which variables be significant in predicting
trade agreement success, specifically focusing on supply chain metrics. The data includes the
Logistics Performance Index (LPI), Ease of Doing Business, net trade, and ethnic
fractionalization. Additionally, the World Bank compiles development data relevant to this
study. The LPI is a study compiled every two years by the World Bank and ranks countries
supply chain performance on a scale of 1-5 with 5 being the best. The final score is an average

The Impact of Logistics Performance on the Success of Trade Agreements Senior Capstone Project for Kevin Arbeiter
- 9 -
based on the scores of six supply chain metrics – Customs, Infrastructure, International
Shipments, Logistics Competence, Tracking & Tracing, and Timeliness. These metrics are
crucial for a country to be able to handle high volumes of trade moving across its borders. This
data is compiled by conducting interviews with companies that operated day-to-day within each
nation (Arvis, Saslavsky, Ojala, Shepherd, Busch, & Raj, 2014). The Ease of Doing Business
report is compiled by ranking economies on their ease of doing business from 1-190 (Economy
Rankings). The rankings are determined by sorting the aggregate distance to frontier scores on
10 topics, each consisting of several indicators, giving equal weight to each topic. The distance
to frontier score shows the gap existing between a country’s actual economic performance and
that of the best practice across all indicators. GDP and GDP per capita data was pulled from
The World Bank’s website along with the trade volumes. The ethnic fractionalization values
will come from Fearon’s study completed in 2003. Both single regressions as well multi-
variable regressions will be conducted to determine the significance of each factor identified in
relation to the LPI.
Trade Agreements
With the basis of this entire study surrounding trade agreements and the success that
they may have, it is important to take an in-depth look at current agreements in Africa, as well
as general information on the formation of blocs and whether trade agreements have been
inherently beneficial or harmful. One interesting aspect to this project is that each of the
countries forming the Tripartite Free
Trade Agreement (TFTA) are already in
another trade agreement. Some even
hold membership in two. The three other
agreements are the South African
Development Community (SADC), the
East African Community (EAC), and
the Common Market for Eastern and
Southern Africa (COMESA). As the
names suggest, each of these agreements
also consists of only African countries.
Figure 2: TFTA Nations current FTA memberships http://www.europarl.europa.eu/RegData/etudes/BRIE/201
5/551308/EPRS_BRI(2015)551308_EN.pdf (Appendix B)

The Impact of Logistics Performance on the Success of Trade Agreements Senior Capstone Project for Kevin Arbeiter
- 10 -
COMESA is by far the largest current agreement, with 20 of the TFTA nations belonging to it.
Fourteen nations hold membership in SADC and only six nations are in EAC. Almost half of
the countries belong to two of the trade blocs and the rest are exclusively in one.
It will be important to investigate the status of the current agreements, not only to see
what the boosts in trade have been, but also to see if they will continue to exist after the TFTA
is finalized. Another important aspect to consider is if trade agreements in general, provide
common benefits to members. In Trade Blocs: Relevant for Africa? Jan Gunning illustrates this
issue saying that, “Trade blocs will often result in very unequally divided benefits or, indeed
(as we have just seen), in some members of the members gaining while other countries in the
bloc lose” (2001 pg.319). The EAC was a perfect example of this. Because Kenya became the
manufacturing hub for Tanzania and Uganda, the two countries felt Kenya was gaining more
wealth out of the agreement. As a result, the original EAC agreement all but failed, with
Tanzania closing its border with Kenya (Gunning, 2001). Alternatively, agreements can help
with tariff harmonization and benefit economies. By gaining access to new markets,
competition will grow in the market and companies will gain access to economies of scale
(Gunning, 2001).
Plant and Taghian (2008), examined success factors in trade blocs. This study has a
larger focus on the economic aspect of a trade agreement. A benefit to this study, is that it
focuses on regional agreements, much like the TFTA, rather than inter-continental blocs. Based
on the model they have proposed, Plant and Taghian believe it is possible to predict the success,
although it does not appear they actually applied the model to a specific agreement. Yeats
(2004) also attempted to forecast the outcome of Africa Regional Trade Agreements. Rather
than use explicitly quantitative data, he focused on qualitative aspects. There are a few issues
highlighted in this report that may hinder the ability to build a strong agreement according to
Yeats. First, there is very little intra-African trade to begin with. The trade that does occur
between countries is very regional, focused around bordering nations, which could help to
explain the patterns of the current agreements in place (Yeats, 2004). With little product
diversity, it is difficult for the countries to experience benefits from lowering tariffs and trading
with one another. With this being a regional agreement, they will still face high tariff levels on
the imports from the rest of the world.

The Impact of Logistics Performance on the Success of Trade Agreements Senior Capstone Project for Kevin Arbeiter
- 11 -
Rodriguez and Rodrik (2001) offer a different perspective on trade agreements, arguing
that they may not actually be that beneficial. The two caution that eliminating tariffs may not
be a fix-all solution. While they are not claiming to be experts in economic policy, they do offer
evidence of a greater benefit to having some level of tariffs. In fact, in the late 1800s, many
European countries re-imposed tariffs in an effort to protect their own industries from an influx
of cheaper American goods (Rodriguez & Rodrik, 2001). In many African nations, the focus
must be on stimulating their own economies to improve the status of the country. Keeping some
level of tariffs in place may help with this. Not only will it keep the low cost imports from
infiltrating and undercutting a country’s own manufacturing operations, the revenues can be
used on logistics projects to improve infrastructure and quality of life.
Hoekman, Olarreaga, and Zedillo (2007) present the opposite argument to Rodriguez
and Rodrik. In their report, Global Trade and Poor Nations, the three maintain that the
wealthiest nations have all of the influence in any trade agreement formed. Furthermore, if a
trade agreement is going to be successful, these top countries must lower tariffs and eliminate
subsidies to allow developing nations a chance to compete (Hoekman, Olarreaga, & Zedillo,
2007). This offers a contradicting statement: wealthy nations will begin to suffer from the
cheaper goods while developing nations will experience the majority of the benefit.
Justifying the Logistics Performance Index
After settling on using the LPI for both portions of the quantitative analysis – first as
the independent variable to determine a relationship with net trade and second as the dependent
variable to determine what factors drive LPI – it became apparent that justification was
necessary. Because the LPI is based on survey results, some of the responses can be viewed as
subjective or inconsistent.
Gray and Slapin (2010) were examining the effectiveness of regional trade agreements.
In order to do so, they chose to survey experts in country. Their main justification for using this
method is the fact that all trade agreements are structured differently and have different goals
for success. Because of this, it can be difficult to develop a standard quantitative value to
determine effectiveness. By using a survey method, the authors are able to gain accurate insights
into the results of agreements in each region. “Expert surveys offer considerable leverage in
environments where hard data for the types of things we want to measure simply do not exist.
The Impact of Logistics Performance on the Success of Trade Agreements Senior Capstone Project for Kevin Arbeiter
- 12 -
By talking directly to the individuals who have worked with these organizations — either as
negotiators, consultants, or actual staff members — we are able to get a clear picture of the
actual functioning of these agreements on many dimensions” (Gray & Slapin, 2010). Using this
logic, I am able to justify using the survey-based LPI. Not only is information difficult to get
from Africa, those who are surveyed are in the country operating day in and day out. They are
the true experts on the logistics in the regions they operate.
Conclusion
The literature review played a crucial role in determining the hypotheses of this study.
Based on the existing research, and the data found, the following hypotheses were developed:
1. If the Logistics Performance Index score of nations in a free trade agreement increase,
then Net Trade will rise, leading to FTA success.
2. If nations work to improve a number of the World Bank Country Development
Indicators, then their LPI will increase.
These sources will play a critical role in answering the hypotheses. Whether it is background
information to have a better understanding, or arguments offering multiple viewpoints, the
literature is crucial to presenting a thorough argument for the success of trade agreements.
There were two interesting discoveries found when going through the sources. First is
the fact that every single country joining the TFTA is already a member of at least one other
regional trade bloc. Each varying in size, it will be interesting to dig deeper to find out why
these countries are forming yet another bloc.
The second is the present situation across much of Africa. It seems that the media
generally depicts the nations in this region as deep in turmoil and unrest, and with a very low
quality of life. While these countries may be less developed than other regions of the world,
many are actually in better shape than acknowledged. The region is not governed solely by
dictator and tribal conflict as reported, but is, rather, a continuously developing area. Part of
this may come from the education influx during the colonial period, and some may be from
general advancement and investment. All in all, Africa is much better off than many people
believe.

The Impact of Logistics Performance on the Success of Trade Agreements Senior Capstone Project for Kevin Arbeiter
- 13 -
DATA INCONSISTENCIES
One of the largest challenges associated with this study was being able to find complete,
accurate data for the 27 nations making up the TFTA. Only 24 of the 27 nations had an LPI
report completed with values. The three countries excluded from the study were South Sudan,
Swaziland, and Seychelles. Knowing that a regression becomes more accurate with the more
data points, it was imperative to find thorough data. When downloading the World Bank data,
there were numerous missing values across many countries and many variables. In some
instances, relevant variables had to be omitted due to a lack of data. One such example was
kilometers of railroad. This was only reported by a handful of countries to begin with. Many of
these variables either are not reported consistently, or not even traced in these nations. Before
the final sorting of the World Bank data, when there were still about 45 variables, it was
necessary to come up with a way to populate as many fields missing data as possible. For each
metric missing, I went back to the World Bank site and searched for the specific variable and
that country. I then looked to see if that data had been reported at all in either the past 5-10
years or in the two years since the 2014 data I was using. If a value existed, it was included. By
doing this I was able to maintain 24 nations for my study. Had nations with only complete 2014
data been used, there would have been 11 nations in the regressions. This would not have been
enough data points to gain a true representation of which variables were most important. As
this data is tracked and become more complete in the region the model could be rerun to
compare results. Other trade agreements should also be easier to analyze from a data availability
standpoint.
METHODOLOGY & RESULTS
Quantitative Analysis 1
Before going into the methodology and results associated with this study, it is important
to outline the overall aim. By the end of this process supply chain factors that can be directly
linked to the overall success of a free trade agreement will be discovered. When entering a trade
agreement, each participating nation may develop different goals and desired outcomes for that
specific nation. In order to standardize success, a free trade agreement will be considered

The Impact of Logistics Performance on the Success of Trade Agreements Senior Capstone Project for Kevin Arbeiter
- 14 -
successful for each nation if that nation sees an increase in net trade (USD). Net trade is simply
total imports + total exports. This represents the best measure for success as it is simple to
calculate and the true goal of any trade agreement.
The first quantitative study conducted was using overall LPI as the independent variable
and net trade as the dependent variable. Both datasets were from 2014 to ensure consistency
and the data went beyond the 27 nations of the TFTA. For this study, it was necessary to use
data on as many countries as possible to find the true relationship between net trade and LPI.
After combining the data sets, there ended up being 133 countries with data for 2014. Overall
LPI for each of the 133 nations can be viewed in appendix C. The analysis software used for
regressions was SAS Enterprise Guide. After importing this data, a linear regression on the two
variables was conducted (Appendix D). This regression had a p-value <.0001, proving it to be
a significant test. The adjusted R-squared value was lower than anticipated at only 0.3081.
While a lower R-squared can be expected when only two variables are run, the more error
explained, the better.
The net trade data fits a power law distribution. In simpler terms, trade fits the 80/20
rule. This rule states that 80% of an event can be attributed to 20% of the total observations (80-
20 Rule). In this case, 80% of global trade can be attributed to 20% of the nations. When looking
at the 133 nations, total trade was $44.16 trillion. 80% of this value is $35.32 trillion. The top
25 nations, 19%, made up $35.39 trillion. From here, it became apparent that a non-linear
regression would be the proper selection to gain the most accurate results. Using the common
Marquardt Regression, the same variables were run again (Gavin 2017). As seen in figure 3,
there is a strong best fit line showing a
direct relationship between trade and
overall LPI. This study showed
significance again <.0001 (Appendix E).
Having this result, it was possible to further
examine the distributions of the top 25
nations versus the remaining 108 used in
the study. Plotting this data in Tableau, I
Figure 3: Nonlinear Regression – Net Trade vs. Overall LPI

The Impact of Logistics Performance on the Success of Trade Agreements Senior Capstone Project for Kevin Arbeiter
- 15 -
was able to get a better sense of this trend (Figure 3).
Figure 4 shows the nations broken out into the 80/20 rule. The top 25 nations in red, and
the rest in blue. It appears that there is a general
threshold at LPI values of 3.25. If a country can
reach this point, trade seems to increase
signficantly. The majority of the top 25 nations
can be found to the right of the 3.25 mark,
signifying that they are the strongest logistics
performers. There are, however, five exceptions.
Russia, Saudi Arabia, Brazil, India, and Mexico,
all category 1 nations, fall to the left of the 3.25
LPI threshold. While at first a surprised, it was
determined that this most likely occurred due to
the countries being heavy commodity exporters.
Russia and Saudi Arabia, for example, rely on oil exports for their trade. The major logistics
component required to accomplish this is pipelines from the oil refineries to shipping ports.
While other infrastructure and measures may be low, pipelines allow them to export high
amounts of commodities.
In an effort to better determine how LPI impacts trade, the LPI was broken into its six
sections: Customs, Infrastructure, International Shipments, Logistics Competence, Tracking &
Tracing, and Timeliness. Each of these metrics was run against net trade using the same
nonlinear regression as with overall LPI. The goal of this is to identify which of the six may
require a higher LPI value (1-5) scale to increase trade. Knowing this may shift a nations focus
on investments and improvements to improve overall LPI as efficiently as possible.
Starting with a nonlinear regression for net trade and customs (Appendix F), the results
showed a slightly lower score necessary to reach the threshold. The threshold mark is just about
3.1 before the sharp increase in dollars traded. It is anticipated that this level will go up for each
of the 27 nations of the TFTA. Since a major goal of trade agreements is lowering barriers to
trade, it is anticipated that customs procedures will become less cumbersome for these nations
and this metric will increase rapidly. This regression had a significance level <.0001 also. The
Figure 4: Nonlinear Regression with color-coded nations

The Impact of Logistics Performance on the Success of Trade Agreements Senior Capstone Project for Kevin Arbeiter
- 16 -
lowest score was a 1.50 (Republic of the Congo) and the highest score was a 4.21 (Norway)
(Arvis, Saslavsky, Ojala, Shepherd, Busch, & Raj, 2014).
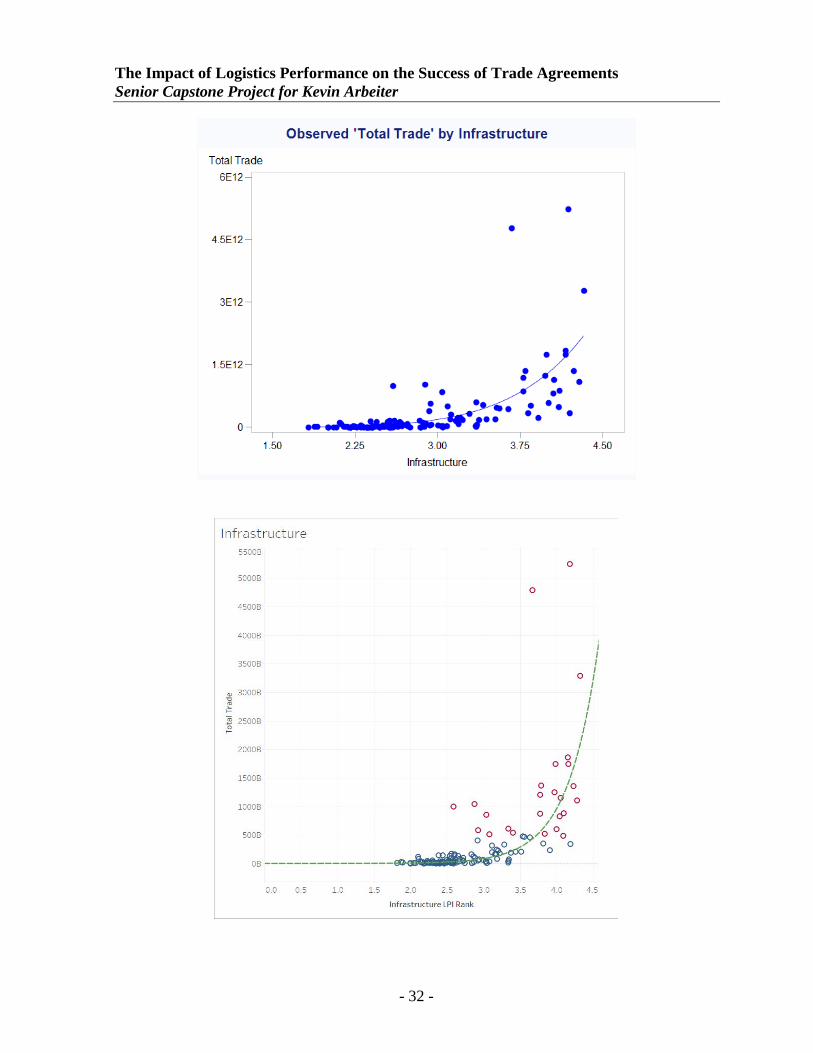
Moving to infrastructure, there were similar results. 3.25 appears to be the threshold to
reach. This was a surprisingly low value. Without strong infrastructure, it becomes very difficult
to move goods from point A to point B. If this is unable to be done, there is no trade occuring
and no trade growth overall. It was initially anticipated that infrastructure would equivalent to
the overall LPI threshold. With a p-value <.0001, this nonlinear regression was also proven
significant (Appendix G). The lowest ranking for infrastructure was 1.50 (Somalia) and the
highest was 4.32 (Germany) (Arvis, Saslavsky, Ojala, Shepherd, Busch, & Raj, 2014).
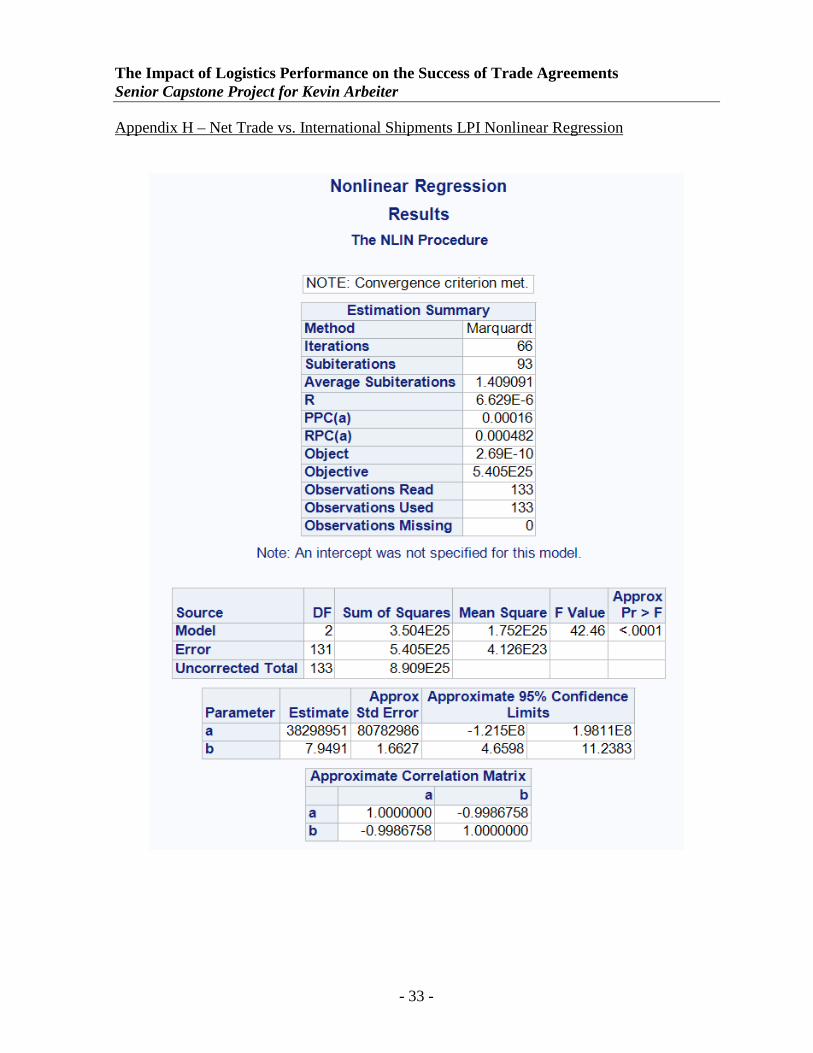
When observing the same study for international shipments, the regression appears to
show that the threshold is close to 3.2 (Appendix H). The same power law distributoin is
occuring as with the others. It is expected that this will be one of the easiest metrics for nations
to raise as the whole purpose of a trade agreement is to encourage international trade. As trade
levels increase, the international shipments will increase, helping to increase scores overall.
Again, this regression also proved significant with a p-value <.0001. The lowest ranked nation
had a score of 1.70 (Democratic Republic of Congo) and the highest score was 3.82
(Luxembourg) (Arvis, Saslavsky, Ojala, Shepherd, Busch, & Raj, 2014).
Moving into logistics competence, this study shows a threshold at scores of 3.0. This
regression shows a specific threshold. Whereas the other components were more gradual
increases, logistics competence seems to be very clear as to the line to achieve. All but one of
the 25 top trading nations has a score above 3.0 for logistics competence. As can be seen in
appendix F, this marquardt regression is significant with a p-value <.0001 (Appendix I). The
lowest recorded value is 1.75 (Somalia) and the highest is 4.19 (Norway) (Arvis, Saslavsky,
Ojala, Shepherd, Busch, & Raj, 2014).
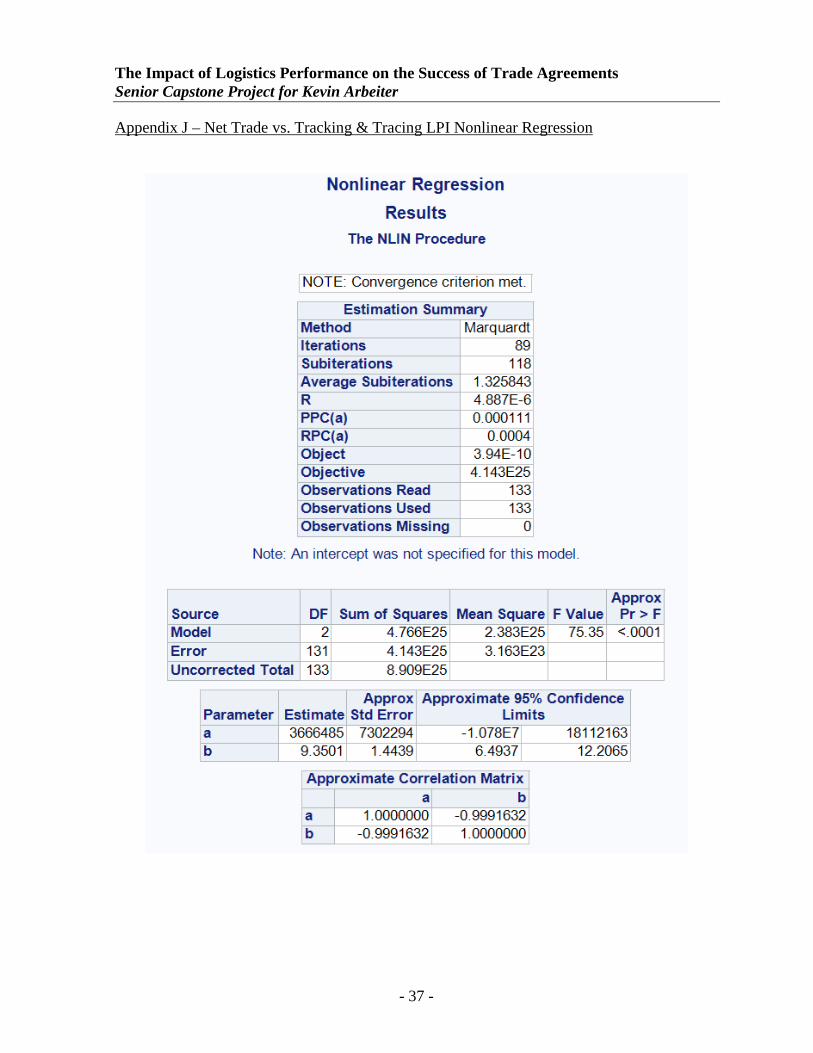
Moving to the fifth variable that makes up LPI, tracking & tracing, it again appears that
the threshold is in the 3.1 – 3.3 range. This is the point where the biggest shift in the best fit line
begins. As with each regression, the p-value of this test is <.0001 showing significance
(Appendix J). The lowest ranked country for tracking & tracing is a 1.75 (Somalia) with the
highest at 4.17 (Germany) (Arvis, Saslavsky, Ojala, Shepherd, Busch, & Raj, 2014).
The Impact of Logistics Performance on the Success of Trade Agreements Senior Capstone Project for Kevin Arbeiter
- 17 -
The final metric going into LPI, Timeliness had one of the highest thresholds. The LPI
score at the threshold was approximately 3.45. This was surprising as this metric does not have
as much to do with a nations investments and improvements. It seems like this metric would
rely more on the companies operating. However it shows, with significance (p-value <.0001),
that the higher the score, the better (Appendix K). The low score for this category was 1.88
(Somalia) while the high was 4.71 (Luxembourg) (Arvis, Saslavsky, Ojala, Shepherd, Busch,
& Raj, 2014).
Through these regression models, it has been determined that the Logistics Performance
Index is a driver of trade. From the further analyses breaking down the LPI into its six
segments, it does not appear that any one metric is significantly more important than another.
Nations in the TFTA should focus on one area at time to improve a segment, rather than
devoting less resources to each segment.
Quantitative Analysis 2
After determining that LPI and Net Trade were directly related, it was possible to take
this study a step further and determine what the top factors driving LPI in the TFTA would be.
The goal of this portion of the study was to determine where nations should focus their efforts
to improve, in order to make the greatest impact. Initially, 950 variables relating to each of the
27 countries were pulled from The World Bank Country Indicators dataset and combined with
Fearon’s Ethnic Fractionalization data and the Ease of Doing Business data. Running another
regression with this many variables having only 27 nations would not have provided accurate
results. Possibly unrelated variables could be left in or clustered when they did not actually
belong. It was necessary to first cut down the number of variables that would be run against
LPI. A ranking system was created to make this process easier. Going through the variables,
each variable was assigned a number – one, two, or three. If a variable received a one, it
indicated a direct supply chain related variable that would automatically be included in the final
regression. Any variables that received a two ranking would be looked at further to determine
whether or not they actually belonged in the final regression. Lastly, any three rankings were
automatically excluded from the regression. These were variables such as birth rate, % of
population with HIV, average length of life, and numerous others that did not directly pertain
to supply chain or logistics. Additional variables excluded were those related to trade levels as
The Impact of Logistics Performance on the Success of Trade Agreements Senior Capstone Project for Kevin Arbeiter
- 18 -
trade was already used as the dependent variable in the first quantitative study. After going
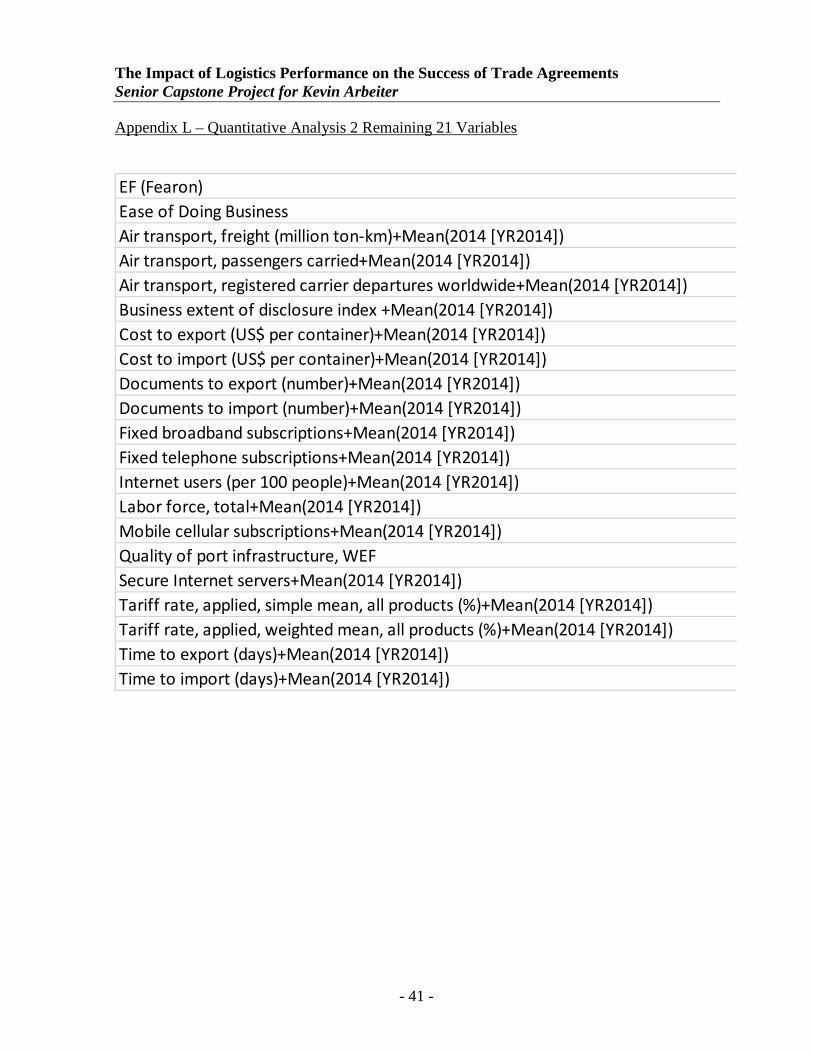
through this process multiple times, there were 21 variables of the original 952 left to be run
against overall LPI (Appendix L).
With these variables another regression was run, again using SAS Enterprise Guide. The
overall LPI ranking for the 27 nations became the dependent variable and the 21 variables from
the World Bank were used as independent variables. For this regression, a linear backwards
regression model was used. Every iteration of this regression removes variables that do not
meet the default significance level <.05. The first time this regression was executed, 15 of the
21 variables still remained (Appendix M). While each of these variables was significant, it was
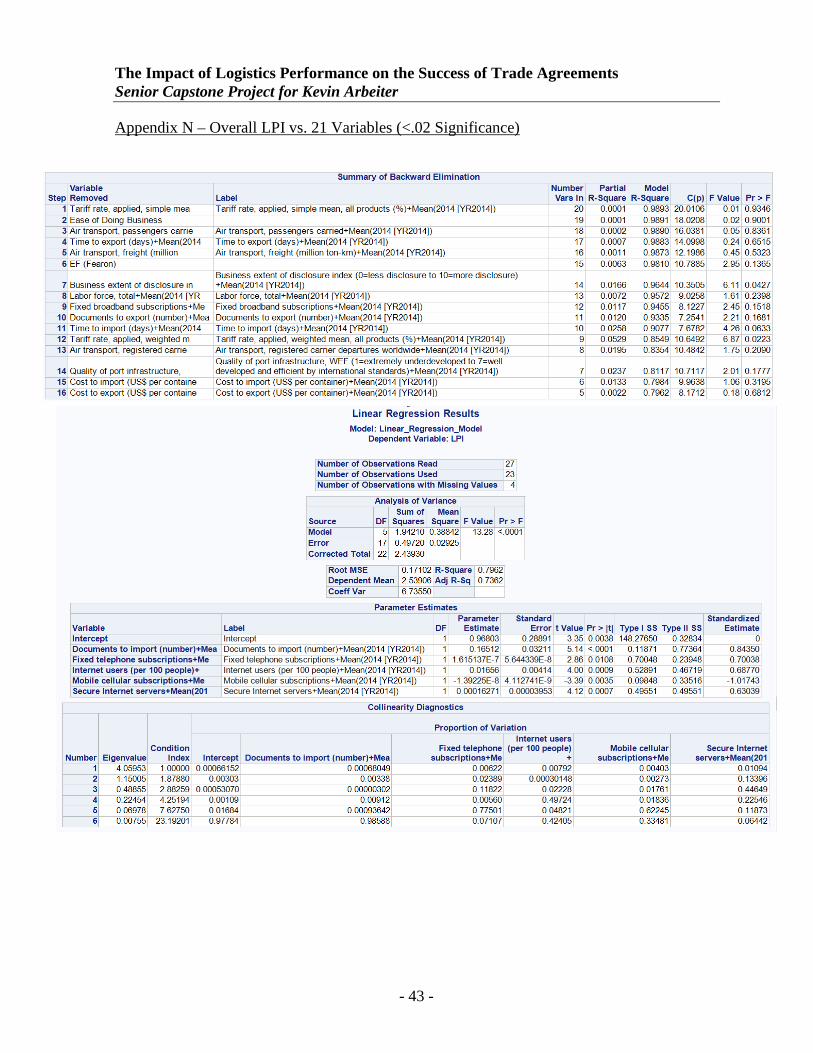
determined that the group was too large for a nation to focus on and improve all of them. To
narrow in even further, the same regression was run with one change: instead of setting the
significance p-value to <.05, it was adjusted to <.02. Five variables remained in the model as
significant (Appendix N):
1. Documents to Import (Number)
2. Fixed Telephone Subscriptions
3. Internet Users (per 100 people)
4. Mobile Cellular Subscriptions
5. Secure Internet Servers
These five variables make sense as drivers of LPI performance as they fit into some of the six
LPI categories well. The number of documents required to import goods is directly related to
customs, international shipments, and even timeliness. The remaining four variables can be
related to the ability to track & trace shipments and infrastructure primarily. This regression
had an adjusted R-squared value of 0.7362. This means that the majority of possible error has
been explained and the regression results are strong. Combined with an overall significance of
<.0001 this is a valid regression model.
The results of this study, while significant, had some surprises. The first quantitative
analysis aimed at showing a relationship between net trade and LPI was as expected. As
Hoekman stated, logistics plays an important role in trade between nations (Hoekman). Without
strong logistics performance, efficient trade cannot be conducted. When looking at the second
study identifying variables, ethnic fractionalization seemed to be an important factor that was

The Impact of Logistics Performance on the Success of Trade Agreements Senior Capstone Project for Kevin Arbeiter
- 19 -
expected to remain significant. Only one source seemed to question whether EF actually played
a role in conflicts and inability for different groups to work with one another. It is possible that
the reason for slower growth to this point is unrelated to the cultural group’s ability to come to
an agreement. The five variables determined as most significant in the second study fit into the
six metrics that make up the LPI. Documents required to import (number) is directly related to
customs, timeliness, and international shipments. The fewer documents needed with each
shipment, the faster and easier goods move through customs. The remaining four variables
identified – fixed telephone subscriptions, internet users (per 100 people), mobile cellular
subscriptions, and secure internet servers – fit directly into tracking & tracing, and
infrastructure. In order to follow shipments, a business must be connected to the region. In order
to get connected, telephone and internet infrastructure must be improved. While the first study
conducted did not show any of the six LPI metrics being much more important than another,
these variables seem clustered into some of the metrics. This study provides strong results for
nations looking to improve their potential for success in trade agreements.
CONCLUSION
As the data has shown, this study has proven that there are certain logistics factors that
drive an increase in net trade. As trade agreements are centered on improving trade between
two or more nations, the ability to determine how successful an agreement could be is crucial.
When looking at the Tripartite Free Trade Agreement in Africa, it becomes clear that many of
the nations need to make significant improvement in logistics performance in order to have a
successful agreement. From the first quantitative analysis completed, the data shows that the
Logistics Performance Index does directly impact overall trade. The LPI threshold for a nation
to reach in order to see a true increase in trade appears to be about 3.25. When breaking the LPI
into its six parts, similar results are seen. For the most part, all six metrics have similar
thresholds that would lead to trade increases. Proving that LPI can drive trade established a
solid foundation for the remainder of this study.
After identifying 21 variables related to supply chain management, the second portion
of this study was run to determine what the top factors driving LPI in the TFTA nations were.
In the case of these 27 nations, five variables remained in the backwards regression with
The Impact of Logistics Performance on the Success of Trade Agreements Senior Capstone Project for Kevin Arbeiter
- 20 -
significance. If the nations focus on these five variables, they should see a rise in overall LPI
and, in turn, a rise in net trade levels. If this occurs, the TFTA will be deemed a successful trade
agreement and can be expanded. In order for this to work each nation must invest in these five
areas. If some nations decide not to make the investment, it could hinder the overall success of
its surrounding nations. This study was successful in proving that logistics metrics are a direct
driver of trade agreement success.
There are some limitations associated with this project. As it is a unique study, the only
way to see if the results are accurate is by waiting and following the TFTA. It can be difficult
to find data and information on Africa due to how underdeveloped the continent currently is. If
there is data available, there is a chance that it will not be as accurate as information coming
the European countries or the U.S. Another thing to consider when looking at data on Africa is
that it could change quickly. With so many groups all vying for power, it is not uncommon to
have multiple coups occur over a short period of time.
Additionally, the TFTA represents an interesting agreement. To start, it is only
comprised of African nations. What is more, all the participants already belong to at least one
of three existing agreements. This could skew the results when trying to predict a model that
works for any agreement. In many agreements, there is at least one developed nation that can
help the others significantly. South Africa is the closest African Nation to being fully developed.
Also, some of these countries may have already experienced the success of being a trade partner.
This could impact how successful they will be going into the future.
Going forward, there are additional steps that can be taken to better enhance this study.
For starters, the TFTA has not existed long enough, it was signed on July 10, 2015, to have
concrete data on the results of the agreement. I would like to continue monitoring this agreement
to determine if the model develop is accurate. Additionally, in the future I expect the data
reported from Africa to become more accurate and more readily available. As this happens,
there may be more supply chain variables to add into the second quantitative analysis and
expand on what a nation should focus on. As there are numerous different free trade agreements
around the world, it could be beneficial to run this model on other agreements to see if the
results hold true. Whether it is the same five variables that every trade agreement should focus

The Impact of Logistics Performance on the Success of Trade Agreements Senior Capstone Project for Kevin Arbeiter
- 21 -
on, or if it changes base on agreement, this would be an important advancement to the overall
study.

The Impact of Logistics Performance on the Success of Trade Agreements Senior Capstone Project for Kevin Arbeiter
- 22 -
APPENDICES

The Impact of Logistics Performance on the Success of Trade Agreements Senior Capstone Project for Kevin Arbeiter
- 23 -
Appendix A – Nations of the Tripartite Free Trade Agreement

The Impact of Logistics Performance on the Success of Trade Agreements Senior Capstone Project for Kevin Arbeiter
- 24 -
Appendix B – Countries by Existing Trade Agreement

The Impact of Logistics Performance on the Success of Trade Agreements Senior Capstone Project for Kevin Arbeiter
- 25 -
Appendix C – LPI Rankings by Country

The Impact of Logistics Performance on the Success of Trade Agreements Senior Capstone Project for Kevin Arbeiter
- 26 -
Appendix D – Net Trade vs. LPI Linear Regression

The Impact of Logistics Performance on the Success of Trade Agreements Senior Capstone Project for Kevin Arbeiter
- 27 -
Appendix E – Net Trade vs. LPI Nonlinear Regression

The Impact of Logistics Performance on the Success of Trade Agreements Senior Capstone Project for Kevin Arbeiter
- 28 -

The Impact of Logistics Performance on the Success of Trade Agreements Senior Capstone Project for Kevin Arbeiter
- 29 -
Appendix F – Net Trade vs. Customs LPI Nonlinear Regression

The Impact of Logistics Performance on the Success of Trade Agreements Senior Capstone Project for Kevin Arbeiter
- 30 -

The Impact of Logistics Performance on the Success of Trade Agreements Senior Capstone Project for Kevin Arbeiter
- 31 -
Appendix G – Net Trade vs. Infrastructure LPI Nonlinear Regression
The Impact of Logistics Performance on the Success of Trade Agreements Senior Capstone Project for Kevin Arbeiter
- 32 -
The Impact of Logistics Performance on the Success of Trade Agreements Senior Capstone Project for Kevin Arbeiter
- 33 -
Appendix H – Net Trade vs. International Shipments LPI Nonlinear Regression

The Impact of Logistics Performance on the Success of Trade Agreements Senior Capstone Project for Kevin Arbeiter
- 34 -

The Impact of Logistics Performance on the Success of Trade Agreements Senior Capstone Project for Kevin Arbeiter
- 35 -
Appendix I – Net Trade vs. Logistics Competence LPI Nonlinear Regression

The Impact of Logistics Performance on the Success of Trade Agreements Senior Capstone Project for Kevin Arbeiter
- 36 -
The Impact of Logistics Performance on the Success of Trade Agreements Senior Capstone Project for Kevin Arbeiter
- 37 -
Appendix J – Net Trade vs. Tracking & Tracing LPI Nonlinear Regression

The Impact of Logistics Performance on the Success of Trade Agreements Senior Capstone Project for Kevin Arbeiter
- 38 -

The Impact of Logistics Performance on the Success of Trade Agreements Senior Capstone Project for Kevin Arbeiter
- 39 -
Appendix K – Net Trade vs. Timeliness LPI Nonlinear Regression

The Impact of Logistics Performance on the Success of Trade Agreements Senior Capstone Project for Kevin Arbeiter
- 40 -
The Impact of Logistics Performance on the Success of Trade Agreements Senior Capstone Project for Kevin Arbeiter
- 41 -
Appendix L – Quantitative Analysis 2 Remaining 21 Variables
EF (Fearon)Ease of Doing BusinessAir transport, freight (million ton-km)+Mean(2014 [YR2014])Air transport, passengers carried+Mean(2014 [YR2014])Air transport, registered carrier departures worldwide+Mean(2014 [YR2014])Business extent of disclosure index +Mean(2014 [YR2014])Cost to export (US$ per container)+Mean(2014 [YR2014])Cost to import (US$ per container)+Mean(2014 [YR2014])Documents to export (number)+Mean(2014 [YR2014])Documents to import (number)+Mean(2014 [YR2014])Fixed broadband subscriptions+Mean(2014 [YR2014])Fixed telephone subscriptions+Mean(2014 [YR2014])Internet users (per 100 people)+Mean(2014 [YR2014])Labor force, total+Mean(2014 [YR2014])Mobile cellular subscriptions+Mean(2014 [YR2014])Quality of port infrastructure, WEFSecure Internet servers+Mean(2014 [YR2014])Tariff rate, applied, simple mean, all products (%)+Mean(2014 [YR2014])Tariff rate, applied, weighted mean, all products (%)+Mean(2014 [YR2014])Time to export (days)+Mean(2014 [YR2014])Time to import (days)+Mean(2014 [YR2014])

The Impact of Logistics Performance on the Success of Trade Agreements Senior Capstone Project for Kevin Arbeiter
- 42 -
Appendix M – Overall LPI vs. 21 Variables (<.05 Significance)
The Impact of Logistics Performance on the Success of Trade Agreements Senior Capstone Project for Kevin Arbeiter
- 43 -
Appendix N – Overall LPI vs. 21 Variables (<.02 Significance)

The Impact of Logistics Performance on the Success of Trade Agreements Senior Capstone Project for Kevin Arbeiter
- 44 -
REFERENCES
"80-20 Rule." Investopedia. N.p., 27 Oct. 2014. Web. 21 Apr. 2017.
Arvis, J., Saslavsky, D., Ojala, L., Shepherd, B., Busch, C., & Raj, A. (2014). The Logistics
Performance Index and Its Indicators (Rep.). Washington, DC: The World Bank.
Retrieved August 27, 2016.
Ayittey, G.B. (1991). Africa Betrayed. New York: St. Martin’s Press.
Cartey, W., & Kilson, M. (1970). The Africa Reader: Colonial Africa. New York: Vintage
Books
Collings, R.O., Burns, J.M., & Ching, E.K. (1994). Historical Problems of Imperial Africa.
New Jersey: Markus Wiener Publishers
Doing Business 2015: Going Beyond Efficiency (12th ed., Rep.). (2014). Washington, DC:
World Bank Group. doi:10.1596/978-1-4648-0351-2
Dollar, D., & Kraay, A. (2004). Trade, Growth, and Poverty. The Economic Journal, 114,
F22-F49
Easterly, William, and Ross Levine. Africa S Growth Tragedy: Policies and Ethnic Divisions.
Charlottesville: U of Virginia, Thomas Jefferson Center for Political Economy, 1997.
Apr. 1997. Web. 12 Jan. 2017.
"Economy Rankings." Ranking of Economies - Doing Business - World Bank Group. The
World Bank, n.d. Web. 20 Apr. 2017.
Elbadawi, I., & Sambanis, N. (2000). Why are there so many civil wars in Africa?
Understanding and preventing violent conflict. Journal of African Economics, 9(3),
244-269. doi:10.1093/jae/9.3.244
"Ethnic Fractionalization." International Encyclopedia of the Social Sciences.
Encyclopedia.com, n.d. Web. 20 Apr. 2017.
Fearon, J. D. (2003). Ethnic and Cultural Diversity by Country. Journal of Economic Growth,
8, 195-222.
Gale, Thomas. "Ethnic Fractionalization." International Encyclopedia of the Social Sciences.
Encyclopedia.com, 2008. Web. 20 Mar. 2017.

The Impact of Logistics Performance on the Success of Trade Agreements Senior Capstone Project for Kevin Arbeiter
- 45 -
Gann, L.H., & Duignan, P. (1969). Colonialism in Africa: 1870 – 1960. Volume 1: The
History and Politics of Colonialism 1870-1914. Cambridge at the University Press.
Gavin, H.P. (2017). "The Levenberg-Marquardt Method for Nonlinear Least Squares Curve-
fitting Problems." (n.d.): n. pag. Duke University. Department of Civil and
Environment Engineering. Web. 21 Apr. 2017.
Gunning, J. W. (2001). Trade Blocs: Relevant for Africa? Journal of African Economics,
10(3), 311-335. doi:10.1093/jae/10.3.311
Hoekman, B. "A 21st Century Trade Agenda: Global Supply Chains and Logistics
Services." World Trade Organization. N.p., n.d. Web. 21 Apr. 2017.
Hoekman, B. M., Olarreaga, M., & Zedillo, E. (2007). Global trade and poor nations: The
poverty impacts and policy implications of liberalization. Washington, D.C.:
Brookings Institution Press.'
Kimenyi, M. S., Lewis, Z. A., Routman, B., Page, J., Smith, J., Kamau, A., . . . Adewuyi, A.
O. (2012). Accelerating Growth through Improved Intra-African Trade. African
Growth Initiative at Brookings, 1-32. Retrieved April 27, 2016.
"Level the Playing Field for Trade." U.S. Chamber of Commerce. U.S. Chamber of
Commerce, 12 May 2016. Web. 20 Apr. 2017.
Morten, J. (2015) Africa: Why Economists Get It Wrong. London: Zed. [Print]
Montalvo, J. G. & Reynal-Querol, M. (2005). Ethnic diversity and economic development.
Journal of Development Economics, 76(2), 293-323.
doi:10.1016/j.jdeveco.2004.01.002
North America. (2016) "NAFTA's Impact on the U.S. Economy: What Are the Facts?" =
Wharton School of Business. Retrieved April 20, 2017.
Ortiz-Ospina, E. & Roser, M. (2016) – ‘International Trade’. Published online at
OurWorldInData.org. Retrieved from: https://ourworldindata.org/international-trade
[Online Resource]
Plant, Elaine, and Mehdi Taghian. Regional Trade Agreements: Performance Evaluation and
Research Agenda. Thesis. 2008.
Posner, D. N. (2004). Measuring Ethnic Fractionalization in Africa. American Journal of
Political Science, 48(4), 849-863. doi:10.1111/j.0092-5853.2004.00105.x
The Impact of Logistics Performance on the Success of Trade Agreements Senior Capstone Project for Kevin Arbeiter
- 46 -
Rodriguez, F., & Rodrik, D. (2001). Trade Policy and Economic Growth: A Skeptic's Guide
to Cross-National Evidence. National Bureau of Economic Research, 261-338.
doi:10.3386/w7081
Sapiro, M. (2014). Why Trade Matters. Global Economy and Development at Brookings.
Retrieved April 27, 2016.
Schneidman, W. (2016, April 14). Africa, TPP, and TTIP: Integration or Isolation? Retrieved
April 27, 2016, from http://www.brookings.edu/blogs/africa-in-
focus/posts/2016/04/14-africa-tpp-ttip-integration-isolation-schneidman
Transparency International - The Global Anti-Corruption Coalition. (n.d.). Retrieved April 27,
2016, from http://www.transparency.org/
Wiafe-Amoako, F. (2015). The World Today Series: Africa. Maryland: Rowman & Littfield
Publishing Group.
Yeats, A. J. (1998). What Can Be Expected from African Regional Trade Arrangements?:
Some Empirical Evidence. Policy Research Working Papers. doi:10.1596/1813-9450-
2004