the impact of oil price shocks on canadian national and ... policy brief the impact of oil price...
TRANSCRIPT

INTRODUCTION
Since 2000, Canada’s economy has become increasingly dependent on the energy sector for growth.1 While several studies have examined the relationship between Canadian GDP and oil prices,2 few investigate the implications for provincial economies. Resource and energy endowments are unevenly distributed within the Canadian federation3 and recent declines in global commodity prices have diverse repercussions for provincial revenues, expenditures and households’ well-being. This Policy Brief presents quantitative estimates of the effect of lower resource prices on provincial household incomes and the excess volatility generated by the resource sector. The results identify the important role of the energy and resource sectors within national and inter-provincial policy discussions, and aid provincial policy-makers and managers as they grapple with current and future changes in energy markets.
This Brief starts by outlining the recent declines in global oil prices and their implications for aggregate Canadian GDP. Next, for each province, the share of the energy and resource sectors as a fraction of GDP and the sectors’ contribution to the variance in the province’s output is evaluated. Finally, the implications of oil price changes for provincial household incomes are presented.
GLOBAL OIL PRICES AND THEIR EFFECT ON CANADIAN GDP
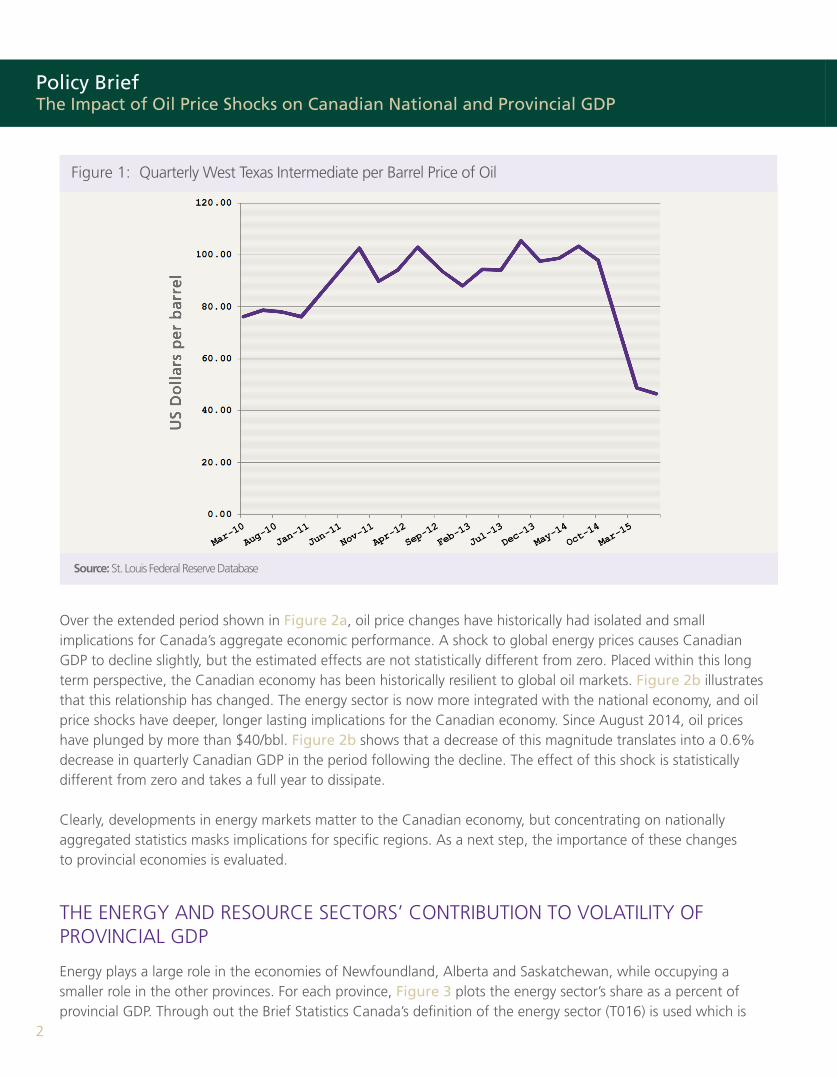
Global energy markets experienced dramatic shifts from 2014 to 2015. Figure 1 plots the quarterly West Texas Intermediate (WTI) per barrel price of oil from 2010 through the third quarter of 2015.4 Driven by a combination of increasing supply, largely from OPEC and US producers, and decreasing demand in China, prices declined by more than 50% within a six month period.5 This drop follows a five year period of relative stability where the oil and gas sector occupied an increasing share of Canadian GDP.6 While lower international oil prices have a stimulative effect on the global economy, they are expected to “weigh significantly” on energy exporters such as Canada.7 Within this context, it is important to understand both the effect on Canada’s GDP and the differential outcomes for households in various regions of the country.
A series of vector autoregression (VAR) models demonstrate the effect of an unexpected $20.00 decline in the WTI price per barrel of oil (approximately half of the 2015 fall). Figures 2a and 2b trace the statistical predictions of the current and future path of real quarterly GDP in response to a one standard deviation decrease in the real price of oil (equivalent to approximately $20/bbl).8 The solid line reflects the predicted effect, whereas the dashed lines illustrate the 95% statistical confidence bands. Figure 2a contains results derived from a longer time series, spanning from the first quarter of 1961 to the first quarter of 2015, while Figure 2b restricts the model to the post-2000 period.
The Impact of Oil Price Shocks on Canadian National and Provincial GDP
Policy BriefJanuary 2016
2
Policy BriefThe Impact of Oil Price Shocks on Canadian National and Provincial GDP
Over the extended period shown in Figure 2a, oil price changes have historically had isolated and small implications for Canada’s aggregate economic performance. A shock to global energy prices causes Canadian GDP to decline slightly, but the estimated effects are not statistically different from zero. Placed within this long term perspective, the Canadian economy has been historically resilient to global oil markets. Figure 2b illustrates that this relationship has changed. The energy sector is now more integrated with the national economy, and oil price shocks have deeper, longer lasting implications for the Canadian economy. Since August 2014, oil prices have plunged by more than $40/bbl. Figure 2b shows that a decrease of this magnitude translates into a 0.6% decrease in quarterly Canadian GDP in the period following the decline. The effect of this shock is statistically different from zero and takes a full year to dissipate.
Clearly, developments in energy markets matter to the Canadian economy, but concentrating on nationally aggregated statistics masks implications for specific regions. As a next step, the importance of these changes to provincial economies is evaluated.
THE ENERGY AND RESOURCE SECTORS’ CONTRIBUTION TO VOLATILITY OF PROVINCIAL GDP
Energy plays a large role in the economies of Newfoundland, Alberta and Saskatchewan, while occupying a smaller role in the other provinces. For each province, Figure 3 plots the energy sector’s share as a percent of provincial GDP. Through out the Brief Statistics Canada’s definition of the energy sector (T016) is used which is
Figure 1: Quarterly West Texas Intermediate per Barrel Price of Oil
Source: St. Louis Federal Reserve Database

January 2016
3
the combination of the following sub-sectors: oil and gas extraction (211), coal mining (2121), other metal ore mining (21229), support activities for mining, oil and gas extraction (21311A), electric power generation, transmission and distribution (2211), natural gas distribution (2212), petroleum refineries (32411), and pipeline transportation (486). Over the last twenty years, Newfoundland has seen the most dramatic change with the economic share of the energy sector increasing from 11% to over 30% of GDP. In 2011, resources in Alberta and Saskatchewan corresponded to 30% and 22.7% of GDP, respectively.9 Energy contributes less than 7% of total provincial output in all other provinces.
Yet, while the share of provincial output from energy is important for policy-makers, levels are only one part of a larger story. The energy and resource sectors’ contribution to the volatility of provincial economies is a persistent concern that has occupied the attention of both researchers and decision-makers.10 To date however, few systematic methodologies measure this volatility. This section applies a variance decomposition to directly measure the energy and resource sectors’ contribution to the variance of provincial GDP, ultimately yielding clear and robust estimates that can contribute
to provincial policy discussions.11 The resource sector in the following analysis is defined as Statistics Canada’s mining, quarrying, and oil and gas extraction sector (21).
For each province over 1997-2011, Table 1 presents three statistics for each of the energy and resource sectors. The first value is the mean share of the sector as a percent of the provincial economy. For the energy sector this reflects an average of the data presented in Figure 3. The second statistic represents the sector’s contribution to the volatility of each province’s GDP. Specifically, the volatility of provincial GDP is separated or decomposed into the share coming from either the resource or energy sector and the share originating from all other sectors. Finally, the third statistic is called the coefficient of excess volatility which is the ratio of share of variance to share of GDP estimates. For a given level of importance of the sector in each province’s economy, the coefficient of excess volatility states how much extra volatility in total GDP is attributable to the sector. A value of one indicates volatility propotional to the share of GDP whereas a value greater than one signifies a disproportionately large contribution to the variance of provincial GDP.
Figure 2: Effect of $20/bbl. Reduction in Oil Prices on Canadian GDP
Source: Author calculations

4
Policy BriefThe Impact of Oil Price Shocks on Canadian National and Provincial GDP
Figure 3: Provincial Resource Sector as a Share of Provincial GDP
Source: Author calculations
Newfoundland
PEI
Nova Scotia
New Brunswick
Quebec
Ontario
Manitoba
Saskatchewan
Alberta
British Columbia
0.234
0.001
0.028
0.013
0.005
0.006
0.018
0.159
0.221
0.031
0.762
0.007
0.177
0.023
0.005
0.012
0.040
0.421
0.508
0.023
3.3
7.0
6.3
1.8
1.0
2.0
2.2
2.3
2.3
0.7
0.297
-
0.065
0.071
0.044
0.025
0.056
0.271
0.338
0.065
0.888
-
0.291
0.040
0.038
0.005
0.130
0.114
0.274
0.094
3.0
-
4.5
0.6
0.9
0.2
2.3
0.4
0.8
1.4
Share of GDPShare of Variance
Resource Sector Energy Sector
Excess VolatilityCoefficient Share of GDP
Share of Variance
Excess VolatilityCoefficient
Table 1: Contribution of Energy and Resource Sectors to the Volatility of Provincial GDP, 1997-2014
Source: Author’s calculations using Statistics Canada Table 379-0030

5
January 2016
OIL PRICES AND PROVINCIAL HOUSEHOLD INCOMES
Household spending comprises a large proportion of provincial GDP. The next set of figures show the response of annual household incomes in Alberta, Saskatchewan and Ontario to a shock to oil prices.12 All figures represent orthogonalized impulse response functions from a series of vector autoregressions and should be interpreted as follows: a one standard deviation shock to the price of oil (equal to approximately $20/bbl) generates the time
path for future household income that is plotted in the figure.
ALBERTA
Figure 4 illustrates the implications for Alberta household income of a $20/bbl reduction in the price of oil. The left panel uses data from 1950 through 2013. The right panel restricts analysis to the post-2000 period. Both cases show that falling oil prices generate statistically significant drops in income. Over the 1950-2013 period, a $20 drop in the price of oil yields a 1% decrease in household income. The effect of this shock persists for two years before incomes revert to their steady state levels. Shocks in the post-2000 period have larger consequences with deeper income losses for Albertans. The model predicts that the recent fall in oil prices from approximately $100/bbl in August 2014 to less than $60/bbl should yield nearly a 5% decrease in Alberta household income, a decline that will not recover until 2017.
ONTARIO
Figure 5 illustrates the implications of a shock to oil prices for Ontario household incomes. Over the 1950-2013 period, there is virtually no effect of the recent decline in oil prices on Ontarian incomes. Limiting the analysis to the most recent 15 years demonstrates how Canada’s energy sector is changing the fortunes across Canada – even in provinces with small resource sectors. While the results are not statistically significantly different from a no effect scenario, falling oil prices predict a 0.5% fall in household income for Ontarians. Even a province that historically has focused on manufacturing may now be adversely affected by lower oil prices.
Table 1 shows several key facts about provincial economies. First, for energy dependent provinces such as Newfoundland, Alberta and Saskatchewan, fluctuations in the resource sector explain the majority of the variance in provincial output. In Newfoundland, fluctuations in the sector explain 76.2% of GDP volatility. Alberta and Saskatchewan have similar experiences with natural resources explaining 50.8% and 42.1% of GDP variance, respectively, during the 1997-2011 period. Second, the inclusion of stable industries such as electricity generation, pipelines, and energy-related manufacturing and the exclusion of mining and quarrying markedly reduces the volatility. This can be seen by comparing the excess volatilities of
the resource and energy series. The coefficient of excess volatility equals 3.0, 0.8, and 0.4 for Newfoundland, Alberta and Saskatchewan, respectively. Overall, the coefficients of excess volatility demonstrate that the resource sector contributes a disproportionate share to output variance in every province except British Columbia and Quebec. The disproportionate contribution of the resource sector to the variance in provincial GDP suggests that global factors such as the recent decline in oil prices have larger implications for provincial energy policy today compared with previous decades.

6
Policy BriefThe Impact of Oil Price Shocks on Canadian National and Provincial GDP
Figure 4: Effect of $20/bbl. Oil Price Reduction on Alberta Household Income
Figure 5: Effect of $20/bbl. Oil Price Reduction on Ontarian Household Income
SASKATCHEWAN
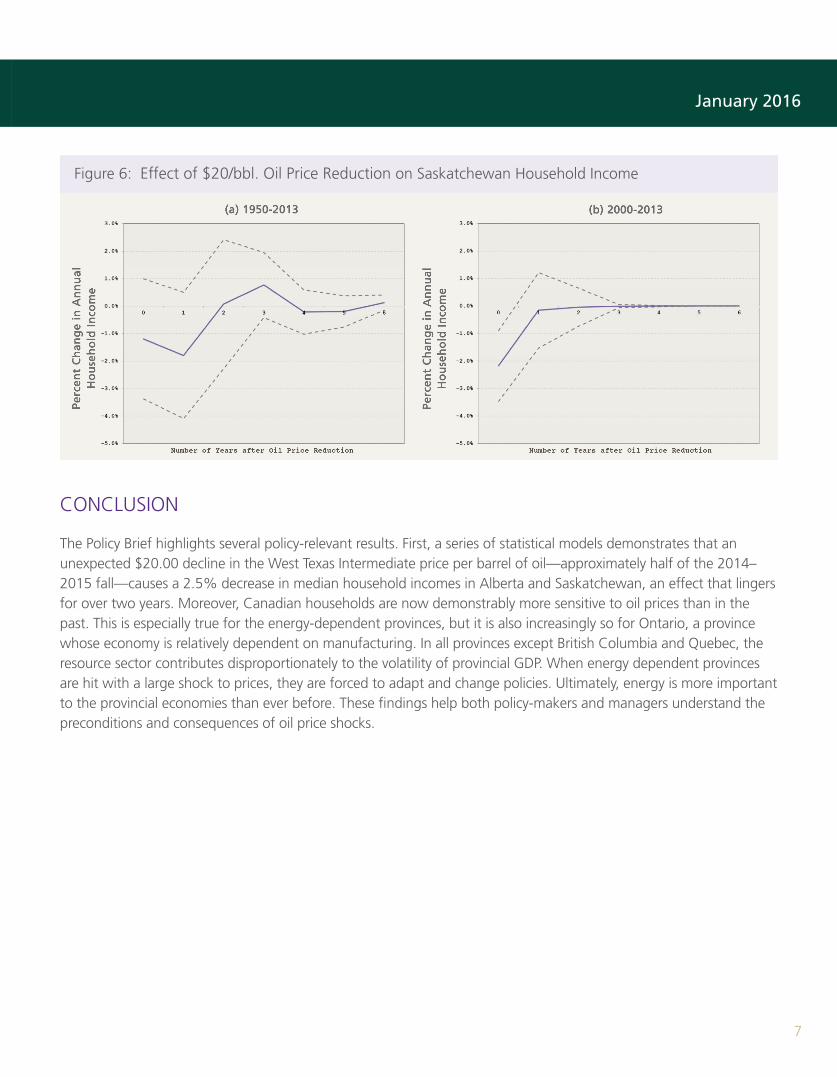
Figure 6 shows how Saskatchewan’s fortunes are increasingly tied to Canada’s energy economy. Over the 1950-2013 period, price reductions initially yield a statistically insignificant 1% drop in income and, after a two year lag, incomes recover and experience positive effects. Historically, agriculture has comprised a large share of Saskatchewan’s economy, and fuel is a key input into production. Lower fuel prices, therefore, may translate into higher incomes. Like the rest of Canada, however, Saskatchewan has become increasingly dependent on oil and gas production. In 2013 for instance, the energy sector comprised 22.6% of Saskatchewan’s economy, while agriculture, even during a stretch of high agricultural commodity prices, contributed 11.0%. This dependence on the energy sector portends a greater effect of recent oil price declines. The right panel shows that a $40 drop in the price of oil leads to more than a 4% decline in Saskatchewan household income in the post-2000 period.
7
January 2016
CONCLUSION
The Policy Brief highlights several policy-relevant results. First, a series of statistical models demonstrates that an unexpected $20.00 decline in the West Texas Intermediate price per barrel of oil—approximately half of the 2014–2015 fall —causes a 2.5% decrease in median household incomes in Alberta and Saskatchewan, an effect that lingers for over two years. Moreover, Canadian households are now demonstrably more sensitive to oil prices than in the past. This is especially true for the energy-dependent provinces, but it is also increasingly so for Ontario, a province whose economy is relatively dependent on manufacturing. In all provinces except British Columbia and Quebec, the resource sector contributes disproportionately to the volatility of provincial GDP. When energy dependent provinces are hit with a large shock to prices, they are forced to adapt and change policies. Ultimately, energy is more important to the provincial economies than ever before. These findings help both policy-makers and managers understand the preconditions and consequences of oil price shocks.
Figure 6: Effect of $20/bbl. Oil Price Reduction on Saskatchewan Household Income

8
Policy BriefThe Impact of Oil Price Shocks on Canadian National and Provincial GDP
REFERENCES
Bank of Canada, 2015. “Monetary Policy Report.” Bank of Canada.Emery, Herb, and Ron Kneebone. 2011. “Alberta’s problems of plenty.” Policy Options, 32(5): 10-16.Fremeth, Adam, Guy Holburn, Pradeep Ventatesh, and Andre Wilkie. 2014. “Developing Global Market Access for Canada’s Oil and Gas Industry.” Ivey Energy Policy and Management Centre.Homann, Florian, and Thomas Lemieux. 2014. “Unemployment in the Great Recession: a comparison of Germany, Canada and the United States.” National Bureau of Economic Research.Landon, Stuart, and Constance Smith. 2010a. “Energy prices and Alberta government revenue volatility.” CD Howe Institute Commentary, 13.Landon, Stuart, and Constance Smith. 2010b. Government Revenue Volatility in Alberta. University of Alberta Press Edmonton. MacDonald, Ryan. 2015. “Constructing Provincial Time Series: A Discussion of Data Sources and Methods.” Statistics Canada.Plourde, Andre, et al. 2010. “Oil and Gas in the Canadian Federation.” University of Alberta, Department of Economics.Shenfeld, Avery, Peter Buchanan, and Warren Lovely. 2014. “No Barrel of Fun: What Weaker Crude Means for Canada.” CIBC World Markets.
NOTES
1See Fremeth et al. (2014)2See Bank of Canada (2015); Shenfeld, Buchanan and Lovely (2014)3For example, Plourde et al. (2010)4The data used in this analysis were retrieved from several sources. Time series on the West Texas Intermediate(WTI) per barrel price of oil are from the St Louis Federal Reserve’s Database and the Wall Street Journal. Information on Canadian and provincial GDP, output from the resource sector and real provincial household incomes are from Statistics Canada. See McDonald, 2015.5See Bank of Canada (2015)6See Fremeth et al. (2014)7See page 9 of Bank of Canada (2015)8Descriptions of the empirical methodologies and data sources are contained in the Appendix.9The visible jump in 1997 for Alberta and Saskatchewan is due to Statistics Canada redefining the variables usedin this analysis.10For example, Emery and Kneebone (2011); Landon and Smith (2010a,b); Plourde et al. (2010)11See Homann and Lemieux (2014)12While not explicitly discussed, comparable figure for all other provinces are contained in the Appendix.

January 2016
A-1
APPENDIX
A.1 Variance Decomposition and the Coefficient of Excess VolatilityChanges in provincial GDP over time can be written as the sum of the change in the contribution from the resource sector, R, and other sectors, O: ΔGDP =ΔR+ΔO. The variance of the change in provincial output then is:
V ar(ΔGDP) = Cov(ΔGDP,ΔR + ΔO) = Cov(ΔGDP,ΔR) + Cov(ΔGDP,ΔO)
Dividing both the right- and left-hand sides by V ar(ΔGDP) gives:
1 = br + bo
where br, which equals , is the share of variance in provincial GDP that is attributableto the variance in provincial resource sector. This value then is determined by regressing changesin the resource sector on changes in GDP:
ΔR = α + brΔGDP + ε. (1)
I also consider the “excess volatility” of the resource sector. This value is found by taking theratio of br from (1) to a scenario where the resource sector occupies a constant share of GDP,sr and hence does not contribute any excess volatility to provincial economies. If the resourcesector is a constant fraction of GDP, then R = srGDP and Cov(R,GDP) = srV ar(GDP), so
br = = = sr. So, if br > sr then there is “excess variation” in overall GDP
that can be attributed to the resource sector. Cyclically sensitive sectors have a larger br relative
to sr , so the ratio of excess volatility, > 1.
A.2 Vector Autoregressions and Impulse Response Functions for Household IncomeAll impulse response functions are based on reduced-form vector autoregressions of the form:
Δ ln yit = α + Ai Δln yt-i + εit
where yt reflects a vector of variables in natural logarithms, Ai is a matrix of coecients and p isthe lag length. Tests revealed unit roots for all series in levels; as a result, the models are estimatedin first-differences, represented by the Δ operator.
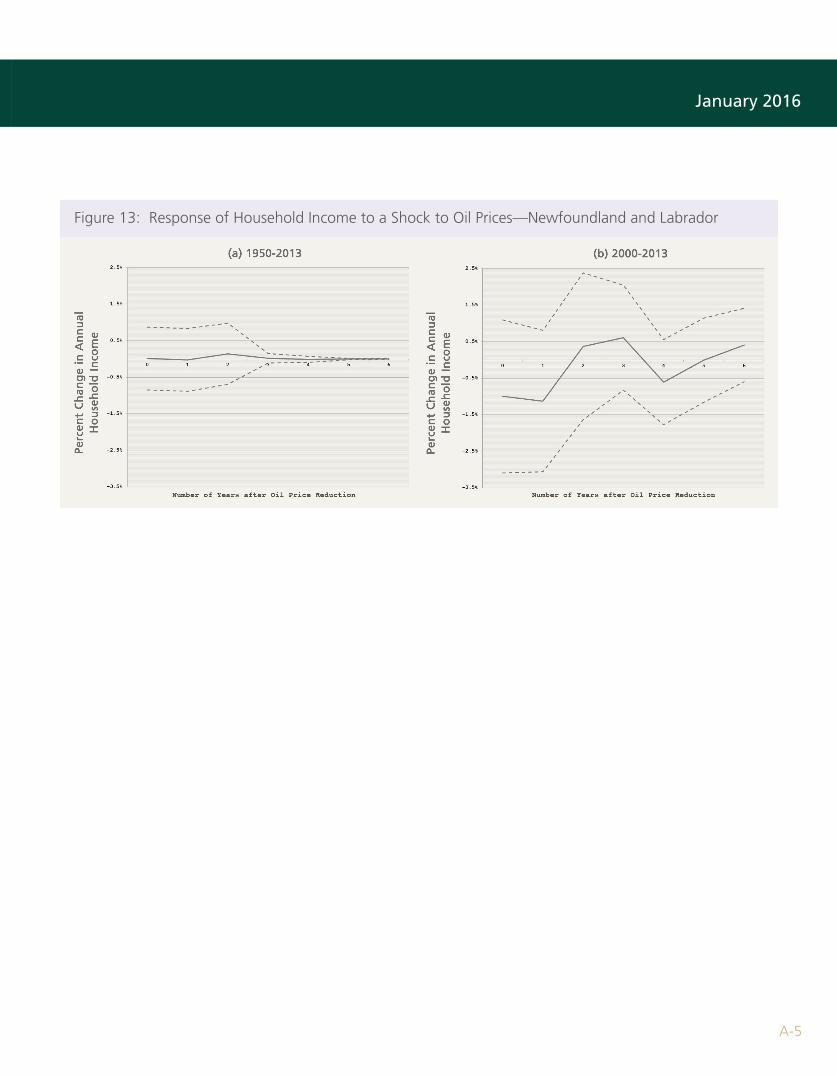
Figures 2–13 display orthogonalized impulse response functions. These impulse response functions measure the effect of an unexpected change in one variable—oil prices—influences, say, GDP. That is, impulse response functions do not show relationship between oil prices and GDP, per se, rather they reflect only the unanticipated shock. The term orthogonalized therefore means that only shocks to oil prices are considered.
Cov(ΔGDP,ΔR)V ar(ΔGDP)
Cov(R,GDP)V ar(GDP)
p
∑i=1
srV ar(GDP)V ar(GDP)
br
sr
Policy BriefThe Impact of Oil Price Shocks on Canadian National and Provincial GDP
A-2
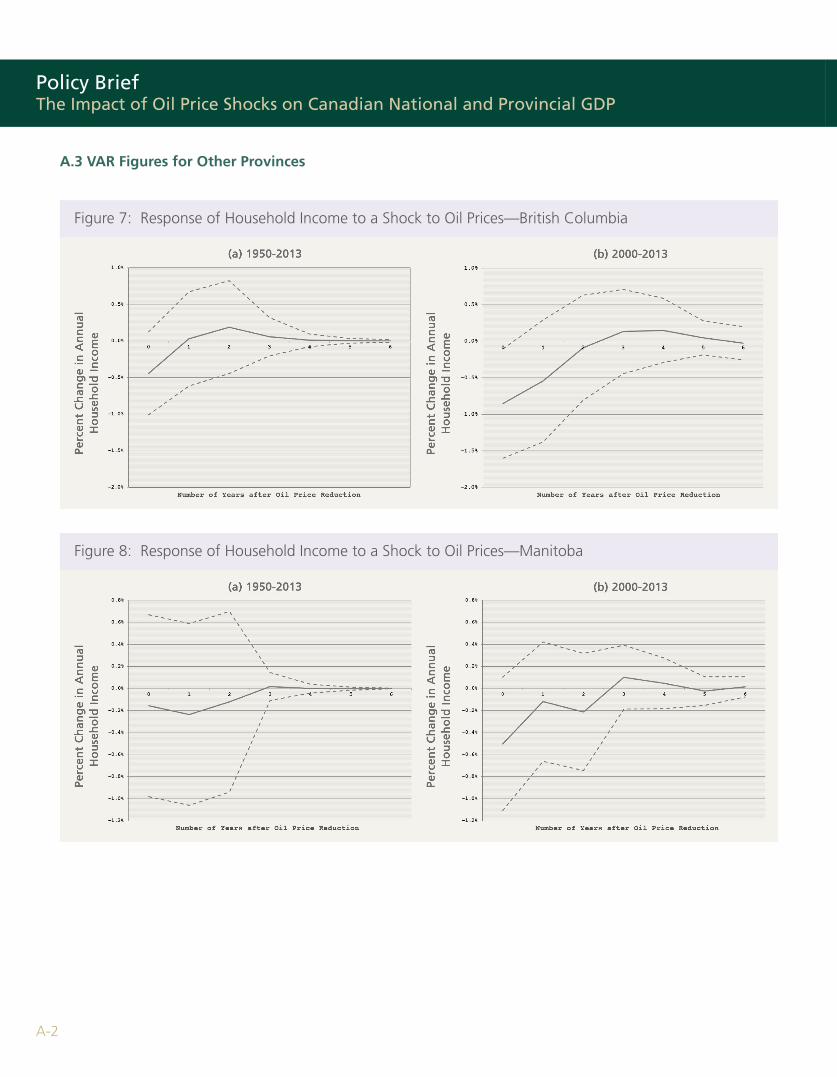
A.3 VAR Figures for Other Provinces
Figure 7: Response of Household Income to a Shock to Oil Prices—British Columbia
Figure 8: Response of Household Income to a Shock to Oil Prices—Manitoba

January 2016
A-3
Figure 9: Response of Household Income to a Shock to Oil Prices—Quebec
Figure 10: Response of Household Income to a Shock to Oil Prices—New Brunswick
Policy BriefThe Impact of Oil Price Shocks on Canadian National and Provincial GDP
A-4
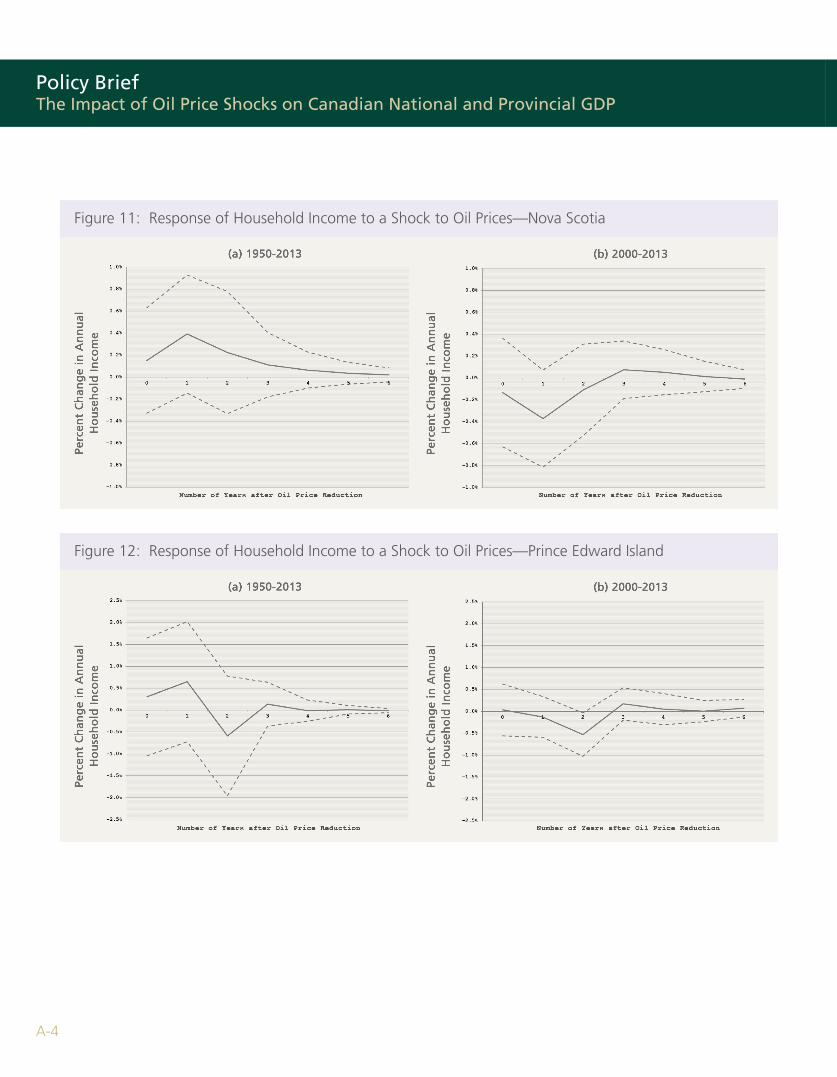
Figure 11: Response of Household Income to a Shock to Oil Prices—Nova Scotia
Figure 12: Response of Household Income to a Shock to Oil Prices—Prince Edward Island
January 2016
A-5
Figure 13: Response of Household Income to a Shock to Oil Prices—Newfoundland and Labrador

AUTHOR
Brandon Schaufele, Assistant Professor and Ivey Energy Consortium Fellow, Ivey Business School
ABOUT THE IVEY ENERGY POLICY AND MANGEMENT CENTRE
The Ivey Energy Policy and Management Centre is the centre of expertise at the Ivey Business School focused on national energy business issues and public policies. It conducts and disseminates first class research on energy policy; and promotes informed debate on public policy in the sector through supporting conferences and workshops that bring together industry, government, academia and other stakeholders in a neutral forum. The Centre draws on leading edge research by Ivey faculty as well as by faculty within Western University.More information is available at www.ivey.ca/energy