the impact of population increase aroud lake babati
TRANSCRIPT

THE IMPACT OF POPULATION INCREASE AROUD LAKE BABATI
HONGOA, PIUS SIMON
THE DISSERTATION SUBMITTED IN PARTIAL FULFILMENT OF THE
REQUIREMENTS FOR THE DEGREE OF MASTERS OF SCIENCE IN
ENVIRONMENTAL STUDIES OF
THE OPEN UNIVERSITY OF TANZANIA
2014
brought to you by COREView metadata, citation and similar papers at core.ac.uk
provided by Digital Library of Open University of Tanzania
ii
CERTIFICATION
I have critically read the dissertation report and satisfied that it is in acceptable
standard for a higher degree award.
-------------------------------------------------
Dr. Makundi A.E. (PhD)
(Supervisor)
Date: --------------------------

iii
COPYRIGHT
No part of this dissertation may be produced, stored in any retrieval system, or
transmitted in any form or by any means without the prior written permission of the
author or Open University of Tanzania on that behalf.

iv
DECLARATION
I, Hongoa Pius Simon, do hereby declare that this dissertation is my original work
under the supervision and guidance of Dr. Makundi A.E and has not been submitted
for a degree award at any other university.
…………………………….
Hongoa, Pius Simon

v
DEDICATION
To my beloved mother (the late) Doradine Emanuel Hongoa and My beloved father
Col (Rtd) Simon Lali Hongoa, who laid down the foundation of my education and
their tireless support.

vi
ACKNOWLEDGEMENT
I extend my sincere gratitude to God for the blessings and good health. This
dissertation would never have been in this shape, without the countless hours of
discussion and unwavering commitment of my supervisor Dr. Makundi A.E of the
Department of Life Science of Open University of Tanzania. His contribution and
guidance throughout the study enriched and created the foundation of this
dissertation, the support, assistance and professional inputs provided before and
during the writing of this dissertation remain a permanent asset for reporting other
scientific works in future.
My father Col (Rtd) S.L Hongoa as well as brothers and Sisters – special thanks.
My Mother “May her soul rest in eternal peace”.
Special appreciation goes to Mr. Kasimu S. (The Director of Regional Center -
Manyara) and all other Open University staffs at Manyara center. Also I extend my
appreciation to the village leaders of Bagara, Ngarenaro, and Nakwa in Bagara
ward in Babati district for their support in laying the foundation of this research.
My appreciation and thanks should also go to the Babati town Council for their
support during data collection. I am also indebted to my family for their prayer and
moral support throughout the study period. To every one I say, thank you very
much, you have been wonderfully to me.
vii
ABSTRACT
Lakes are amongst the most productive ecosystems of the Earth. Despite its
potential in supporting people’s livelihood in Babati, Lake Babati is being
converted into other land uses due to ever increasing population in town. This work
evaluates the impacts of population increase around Lake Babati in Babati Town
Council. Primary data were gathered by administering the questionnaire to a sample
of 100 households. Participatory rural appraisal techniques, participant observation
and checklist were employed in data collection. The land use types and land use
changes was examined through analysis of satellite imageries. This was attained by
making use of ArcGIS10. The results from the present study showed that there was
a strong relationship (p≤0.05) between education level, occupation and awareness
status of respondent on environmental issues. Also there was a strong association
between the anthropogenic activities in particular agriculture/brick making and lake
degradation. Lack of awareness under the role of environmental sustainability on
lake resources was found to hinder the involvement of local people to Lake Babati
conservation. Thus, this study recommends that, natural resources management
(including lakes) should be incorporated in the program of study of all education
levels to foster awareness raising campaign on role of lake benefits to local people’s
livelihoods. Also proper land use practices should be promoted so as to reduce the
impacts that has been caused on the lake Babati due to poor land use practices in
the study area.

viii
TABLE OF CONTENT
CERTIFICATION ....................................................................................................... ii
COPYRIGHT ............................................................................................................. iii
DECLARATION ........................................................................................................ iv
DEDICATION ..............................................................................................................v
ACKNOWLEDGEMENT .......................................................................................... vi
ABSTRACT .............................................................................................................. vii
TABLE OF CONTENT ............................................................................................ viii
LIST OF TABLES ...................................................................................................... xi
LIST OF FIGURES ................................................................................................... xii
LIST OF APPENDICES ........................................................................................... xiii
LIST OF ABBREVIATIONS AND ACRONYMS ................................................. xiv
CHAPTER ONE ...........................................................................................................1
1.0 INTRODUCTION .............................................................................................1
1.1 Background Information ....................................................................................1
1.2 Statement of the Problem ...................................................................................3
1.3 Significance of the study ..................................................................................5
1.4 Objectives of the Research ................................................................................6
1.4.1 Specific objectives were ....................................................................................6
1.5 Research question were .....................................................................................6
CHAPTER TWO ..........................................................................................................8
2.0 LITERATURE REVIEW ..................................................................................8
2.1 Water Resource, Human Settlement and Development. ...................................8
2.2 Human land use and Land degradation ...........................................................10

ix
2.3 Urbanization and Solid Waste Disposal ..........................................................12
2.3.1 Types of solid wastes .......................................................................................13
2.4 Population Expansion around Lake Babati ......................................................14
2.5 Resources and Environmental Management....................................................16
2.6 Knowledge gap ................................................................................................18
CHAPTER THREE ....................................................................................................19
3.0 MATERIALS AND METHODS ....................................................................19
3.1 The study area ..................................................................................................19
3.2 Methods ...........................................................................................................21
3.2.1 Data Collection ................................................................................................21
3.2.2 Household Survey ...........................................................................................21
3.2.2 GIS Arc view and remote sensing ...................................................................24
3.3 Study Design ....................................................................................................24
3.4 Data Analysis ...................................................................................................25
3.5 Data Presentation .............................................................................................27
3.6 Validity and reliability .....................................................................................27
3.7 Limitations of the study ...................................................................................28
CHAPTER FOUR ......................................................................................................29
4.0 RESULTS ........................................................................................................29
4.1 The influence of demographic variables on awareness status of local
community on environmental management of Lake Babati ...........................29
4.2 Human activities responsible for degradation of Lake Babati .........................31
4.3 Changes in the Physical Features of Lake Babati ............................................38
CHAPTER FIVE ........................................................................................................42

x
5.0 DISCUSSION ..................................................................................................42
CHAPTER SIX ...........................................................................................................53
6.0 CONCLUSION AND RECOMENDATION ..................................................53
6.1 Suggestions for future research .......................................................................54
REFERENCE .............................................................................................................55
APPENDICES ............................................................................................................64

xi
LIST OF TABLES
Table 1 Highlighting the main source of MSW; the waste generators
and types of solid waste generated..........................................
13
Table 2 Study area stratification............................................................ 25
Table 3 The influence of demographic variables on awareness status
of respondent............................................................................
30
Table 4 Residence Duration, Average size of land and Distance from
Lake Water................................................................................
33

xii
LIST OF FIGURES
Figure 1 A map of Babati Town showing study area................................... 20
Figure 2 Main Economic Activities responsible for Lake Babati
degradation......................................................................................
32
Figure 3 Onion (Alium cepa) farming as one of unsustainable agricultural
activities along the buffer zone of Lake Babati..............................
34
Figure 4 Earth brick industry found in the buffer zone around Lake Babati 36
Figure 5 Acacia logs (bottom) for burning the kiln found at Lake buffer
zone................................................................................................
37
Figure 6 Changes on Lake Babati 1970, 1990 and 2010: By 1990 the
digitized map show extension of lake area due to excessive
floods...............................................................................................
39
Figure 7 Satellite image showing the landscape and various human
activities carried out in the lake Babati catchment area (Source.
Arc view GIS 9.1 (2014))...............................................................
40
Figure 8 The elevation cross-section of Lake Babati showing the depth of
the Lake Babati...............................................................................
41

xiii
LIST OF APPENDICES
Appendix 1: Questionnaire…………………………………………….66

xiv
LIST OF ABBREVIATIONS AND ACRONYMS
MSW: Municipal Solid Waste
UNCED: United Nations Conference on Environment and Development
URT: United Republic of Tanzania
Anon: Anonymous
1
CHAPTER ONE
1.0 INTRODUCTION
1.1 Background Information
Environmental issues are firmly entrenched at the centre of the world stage in all
spheres of development activities (Child, 2004 and Wang et al., 2008). Increasing
urbanization and rapid population growth around water bodies like lake areas puts
extra stress on the need for finding and implementing sustainable solutions to prevent
environment contamination (Roxendal, 2012). The pressure of this rapidly increasing
population on the available resources will be too great to sustain desirable livelihood
in the area (Pardo, 2009 and Maltby, 2000). For example, Lake Victoria basin is used
as a source of food, energy, drinking and irrigation water, shelter, transport, and as a
repository for human, agricultural and industrial waste (Strandberg 2004, Robert
2009 and Sandstorm 1995). With the populations of the riparian communities
growing at rates among the highest in the world, the multiple activities in the lake
basin have increasingly come into conflict. This has contributed to exposé the lake
environmentally unstable (Strandberg, 2004 and Lyding, 2009). Massive blooms of
algae have developed, and come increasingly to be dominated by the potentially
toxic blue-green variety (Jonas and Annete, 2010). Over fishing and oxygen
depletion due to eutrophication at lower depths of the lake threaten the artisan
fisheries and biodiversity (Over 200 indigenous species in lake Babati are said to be
facing possible extinction) (Strandberg, 2004). Lake Babati is a fresh water lake
located in the eastern part of the East Rift Valley, 168 km from Arusha at an
elevation of 1,346 m on longitude 35° 45° E and latitude 4° 15° S, The lake is rich in

2
fish like Nile tilapi (Oreochromis niloticus), African catfish (Clarias gariepinus),
fresh water shrimp (Palaemonetes paludosus) and other species like Hippopotamus
amphibius, otter (Aonyx capeusia) ducks and flamingo (Camilla, 2011). It provides
water with polar pH between 7.4 and 8.0 suitable for both domestic and economic
uses but the major town’s water sources are surface rivers, streams and springs
originating mainly from Mrara Hills. Mrara stream and Nangara stream are among
the town’s water sources. The permanent water table ranges between 3 – 18 meters
below ground level.
As for Lake Babati, fishing may not exactly have much hope of ever becoming a
sustainable activity, being practiced seasonally. Still, the lake has great potential of
being another tourist attraction site for Babati due to its beautiful surroundings and
breathtaking scenery (URT, 2006). Lake Babati is covered by sub-merged plant
(Eichhornia crassipes, Callitriche, Potamogeton illinoensis e.t.c), emerged plants
(Bacopa caroliniana, Blurish etc) and floating plant (Azolla caroliniana, Utricularia,
Nymphaea odorata). Around the lake there is grass, shrubs and trees and the
catchment/landscape is covered by farming and forest (Sandstom, 1995).
Given the current rate of population increase, water resource utilization in and
around most of Rift Valley Lakes is not sustainable (Gunya, 2009 and Ramachangra,
2000). The intensification of agriculture around the lake coupled with application of
fertilizers and pesticides will lead to the silting and eutrophication, that is already
happening in Mang’ola at Lake Eyasi and Mto wa Mbu at Lake Manyara where
irrigated farming is practiced (Yanda and Madulu, 2005, and Sandstom, 1995).

3
Siltation in the lake is quite high and during the last couple of years the depth in the
lake has decreased from 6 – 8m on in 1970’s up to 3 – 4m deep in recent years
(Anon, 2013). The area of the lake has also fluctuated during the last couple of years,
from 5 km² to18 km² in 1990. The only seasonal outlet of Lake Babati is in the
Kiongozi/Farahani River (Gerdén, et al., 1992).
Lake Babati is one of dozens of water bodies known as the Rift Valley Lakes that
span the eastern side of the African Continent from Mozambique to the Red Sea. The
lake is the lifeblood of the town of Babati in Manyara-Tanzania (Jake, 2009) and is
used by people as a source of income through primarily fishing activities and fish
mongering. Other activities culminated by the lake water are such as horticulture,
beekeeping, brick making and construction of infrastructure but also for watering
animals (Lyding, 2009).
The purpose of this study was to determine the impact of population change on
environmental degradation of Lake Babati and to suggest improvement strategies
that may lead to sustainable utilization of available scarce resources to improve the
economy and livelihood of the nearby communities.
1.2 Statement of the Problem
Previous research has found that lakes provide a wide range of environmental
services from which people benefit, and upon which all life depends (McCartney et
al. 2004; URT 2007). The importance of wetlands is not only accounted by being
highly productive, biologically rich and providing many ecological services, but also

4
their support to both biodiversity and the economy. They are natural assets which
make significant contributions to the Tanzania’s national economy (Munishi et al.
2003; URT 2007).
According to the 2002 population census, Babati town has a population of 31,077
people of which 28,000 equivalent to 90% of the total population live in the town
proper, covering the areas of Babati, Maisaka, and Bagara. 3,077 people, equivalent
to 10% live in the peri - urban area of Nangara village. The town’s population
Growth Rate is estimated at 3.8% annually (URT, 2003).
Since 2002 Babati was promoted and become headquarter of Manyara Regional,
many people from other regions immigrate into the town for business, work and
looking for other opportunities. By 2009, population in Babati Town was estimated
to be 74,000 of which 40,000 live in town proper and 34,000 in peri-urban (URT,
2003).
The increase of population might be caused by many factors including the decision
of allocating the headquarters of Manyara Region and Babati District, development
of infrastructure ie construction of tarmac roads, development of water facilities
(BAWASA), presence of enough food supply and fertile soil which support
productivity of agricultural products (URT, 2003; URT, 2013 and Nyoke 2012).
The recently increase in population and rapid urbanization of Babati town while in
the catchment area there has been excessive landscape changes as a result of

5
agriculture practices, brick making, livestock keeping, deforestation, waste disposals
and over fishing which lead to flooding in 1964, 1979 and 1990 (Sandstom, 1995)
and most recently 2002.
Lake Babati biodiversity is under stress from a number of factors. For example, in
the Lake Babati watershed, invasive species, habitat loss, degradation and
fragmentation, rapid residential growth and infrastructure development,
unsustainable agriculture practices, pollution of tributaries and open waters, altered
hydrology, mining and harvest of fish and forests (Anon, 2006).
Little has been done on the effect of population increase on changes of lake physical
features due to human social economic activities but the extent of the impact of the
population increase on Lake Babati environmental is not clear. It is the concern of
this study to determine the current status on the effect of rapid population increase in
Babati town to Lake Babati environmental management, its socio-economic
consequences and implication towards environment sustainability.
1.3 Significance of the study
The study would help the government, planners, policy makers, agricultural officials,
experts and development agents to design strategies to improve policies to cub the
problem of Lake environmental degradation and enhance investment programs and
projects that may bring positive synergies to restore fish, timber, soil productivity,
enhance food security, and avert the vicious cycle of poverty and natural resource
degradation.

6
Furthermore, the analysis contributes to the general literature on land and soil
degradation. This is essential to long-term progress because of the scarcity of
primary data at the farm and household level to address lake degradation toward
smooth environmental sustainability strategies in Babati District, and in other places
with similar characteristics.
1.4 Objectives of the Research
The general objective of this study was to determine the impact of rapid population
increase around Lake Babati.
1.4.1 Specific objectives were
i. To determine awareness status of local community on environmental
management of Lake Babati
ii. To identify, various human activities that have been responsible for
degradation of Lake Babati.
iii. To explore the changes on biodiversity and physical features of the lake over
a considerable period of time as a result of human activities.
1.5 Research question were
i. What is the awareness level of local community on environmental
management of Lake Babati based on indicators such as number of seminars
and awareness creation campaign, number of house hold with environmental
management projects, governance and by laws?

7
ii. What are various human activities which has been responsible for degradation
of Lake Babati based on indicators such as agriculture and livestock keeping,
fishing, hunting and tourism, settlement and urbanization and disposal of
domestic waste?
iii. What are the changes in the physical features of the lake over 50 years based
on indicator such as Lake Depth, Lake Size and out let, and Landscape
(catchment area)?

8
CHAPTER TWO
2.0 LITERATURE REVIEW
2.1 Water Resource, Human Settlement and Development.
People tend to settle and clusters in places that have the resources they need to
survive and thrive (Clark, 2010). Water resources like springs, river and lake are
among the factors that influence most of human to settle on an area like Babati
Town. Large groups of people often migrate (move) to a place that has the resources
they need or want and migrate away from a place that lacks the resources they need.
Economic activities in a region relate to the resources in that region (Baldus, 2001).
Economic activities that are directly related to Lake Babati resources include
farming, fishing, ranching, timber processing, brick making, mining, and tourism
(Anon, 2013).
Natural resource conflicts have been an inherent phenomenon of human history
(Redfern, et al., 2005), ‘development’ in contemporary societies intensifies it
because of the qualitative shift in the scale, intensity and modes of resource
transformation and use (Redfern, et al., 2008 and Glover, et al., 2012). Hence it
generates higher stakes and interests as opposed to other modes of resources use and
which have the potential of generating more intense conflict (Glover, et al., 2010)
Natural water resource and wetlands areas have been under many uses since
immemorial time for socio-cultural and economic benefits to society (Nielsen, et al.,
2010 and Glover, et al., 2010). This started as early as human being started his social
economic activities such as agricultural practices without conserving the natural

9
resources water being inclusive (Tolunay, et al., 2007 and Baur et al., 2000). Some
measure were used by our ancestors to conserve the natural resources; measures like
terracing methods which helped people to stop facilitating environmental degradation
and avoid them to conduct social economic activities in water sources (Salafsky and
Wollenberg, 2000).
It is important to understand that while resources are very important, it is not the
presence of or lack of natural resources within a country that makes a country
prosperous. In fact some of the wealthier countries lack natural resources, while
many poorer countries have abundant natural resources (Giliba et al., 2011 and
Isango 2007).
The threat of multidimensional global crisis has therefore been a key theme within
debates about sustainability (DeGeorges et al., 2009). A crisis of development,
environmental quality and of threats to the materials benefits supported by natural
biogeochemical processes and sink (Adams 2001 and Chid 2004). It has also been
recognized that tight and complex links exist between development, environment and
poverty (Vosti, 1995 and Blaikie 1995). The poor often endure degraded
environments, and in some instances contribute to their further degradation (Adams,
2001). Urban air and water pollution are both rising rapidly, even in those countries
in which economic growth is taking place and the degradation of agricultural, forest
and wetland resources is extending the depth and wideness of deficiency in many
rural areas (Baldus, 2007). Access to and controls over cultivable land, fuel wood or
other usable attributes of nature is uneven. Blaikie and Brooffield (1987), argue that

10
‘land degradation can undermine and frustrate economic development, while low
levels of economic development can in turn have a strong causal impact on the
incidence of land degradation.
Environment provides the natural resources for the process of Development on the
other hand; the development process modifies the natural resources and
environmental quality to meet human needs (Lundi and Trene, 2008). The goal of
both environmental and development is the same, to improve human well being.
Poverty has been termed the worst enemy of environment because it gives rise to
poor life styles in terms of production, consumption and living conditions. Poor life
styles cause environmental degradation in terms of depletion of resources which
eventually reduce production and perpetuate poverty (Muthoka, 1998).
2.2 Human land use and Land degradation
Today’s landscapes result from many causes, including variability in abiotic
conditions such as climate, topography and soils; biotic interactions that generate
spatial patterning even under homogeneous environmental conditions; past and
present patterns of human settlement and land use; and the dynamic of natural
disturbance and succession (Turner, et al., 2011). Patterns of land use can alter both
the rate and direction of natural processes and land use patterns interact with the
abiotic template to create the environment in which organisms must live, reproduce
and disperse. Land use refers to the way in which and the purpose for which humans
employ the land and its resources (Kansiime et al 2007 and Gunya, 2009). For
example, humans may use land for housing, industry, recreation and food production.

11
Land use change is used to encompass all the ways in which human uses of the land
have varied through time, the ways in which humans use land are important
contributors to landscape pattern and process (Turner, et al., 2011).
Land degradation leads to a significant reduction of the productive capacity of land.
Human activities contributing to land degradation include unsustainable agricultural
land use, poor soil and water management practices, deforestation, removal of
natural vegetation, frequent use of heavy machinery, overgrazing, improper crop
rotation and poor irrigation practices. Natural disasters, including drought, floods and
landslides also contribute (Turner, et al., 2011).
Land and soil degradation, reoccurring drought, small farm plots, high population
density and input shortage including draught animal and improved seed are the major
agricultural problems of the Africa (Pu et al., 2012). These agricultural production
problems are enhanced with poor delivery of research technology and extension
support. Cash income for household financial requirements is mainly generated from
sale of livestock and crop products (Blata, 2010).
There are dramatic land use changes in Babati Town especially in the catchment area
of Lake Babati in the period 1990 –2010 and these changes have negative impacts in
terms of loss of natural habitats for both flora and fauna, causing negative impacts to
both aquatic species and people (Lyding, 2009; Hariohay, 2013). Conservation
educations, land use planning, family planning to reduce rate of natural population

12
growth and income generating projects should be emphasized in the conservation of
the lake Babati environment (Hariohay, 2013).
2.3 Urbanization and Solid Waste Disposal
One of the major impacts of urbanization in Africa is the increased generation of
solid waste, threatening ecosystems and undermining economic activities such as
fisheries and tourism. The dumping of solid wastes in rivers, lake beaches and in the
sea has become common practice, as reported in the Comoros and Madagascar
(Sandstom, 1995).
The contemporary urbanization process in many low and middle income countries
are affected by globalization and imply a concentration of infrastructural and service
investments. The result has been improved availability and access to infrastructure
and a variety services and goods. Through migration and infrastructural investments
the per - urban population and the rural population are gradually integrated to urban
areas, often in slums (Hurtig, 2009) .
The amount of waste is increasing in the world due to changed consumption patterns
and increasing populations (Hariohay, 2013). This is a problem especially in poor
countries where the ability to handle the waste is limited due to financial and
management problems. The authorities of Babati at present have an opportunity to
adjust the waste disposal system before population density and mountain of waste
gets out of control (Hariohay, 2013).

13
2.3.1 Types of solid wastes
The major types of Municipal Solid Waste (MSW) are food wastes paper plastic,
rags metal and glass, with some hazardous wastes, households waste such as
electronic light bulbs, discarded medicines and automotive parts.
Table 1: Highlighting the main source of MSW; the waste generators and types
of solid waste generated
Sources Types of wastes generators Types of solid wastes
Residential
Single and multi family
dwelling
Food wastes, paper, cardboard,
plastics, glass, metals, ashes,
textiles, special wastes, bulky items,
consumers electronic, oil, tires and
household hazardous wastes
Commercial
Stores, Hotels Restaurants,
markets, office buildings
Paper, cardboard, plastic, Wood,
Food wastes, glass, metal, special
wastes, hazardous wastes.
Municipal
services
Street cleaning, land
scalping, parks, beaches,
recreational areas.
Tree trimming, general wastes from
Park, beaches and recreational areas.
Source: UNCED Report, 1992
Municipal solid wastes (MSW)-consists of Household waste, construction and
demolition debris’s, sanitation residue, and waste from streets (Table 1). This
garbage is generated mainly from residential and commercial complexes. With rising
of urbanization and change of lifestyle and food habitats MSW has been increasing

14
rapidly and its composition changing. In 1947 cities and town of India generated an
estimated 6 million tones solid wastes, In 1997 it was about 48 million tones, more
than 25 % of the Municipal solid waste is not collected at all,70% of the Indian cities
lack adequate capacity to transport and no sanitary land fill of wastes. The existing
landfills are neither well equipped nor well managed and not lived properly protect
against contamination of soil and ground water (Carl, 1999).
In Singapore; domestic as well as non-domestic, i.e. commercial and industry,
activities generate solid waste. In most Asian countries, there is generally no system
to identify the classify MSW into domestic, commercial and or industries wastes. All
types of solid waste are mixed together and not sorted at home or at other sources.
Thus there is no differentiation during collection by public or private contractors. In
some countries waste collected is taken to a common processing center for
separation, treatment and disposal (UN chronicle 2001).
2.4 Population Expansion around Lake Babati
Babati is a fast growing town. Since it became Town Council and Head Quarter for
Manyara Region in 2002, more people have moved to the town looking for work and
a lot of bureaucrats have also been transferred there. There are many challenges to a
growing town. Housing, transport and working opportunities are the main concerns.
But the waste management is also a challenge (URT, 2003).
Babati District was established by dividing the then Hanang District into two districts
- Babati and Hanang. The decision produced Babati District, which was officially

15
documented in the Government Official Gazette No. 403 on 1 October 1985. Babati
District became autonomous in July 1986 as a District Council (URT, 2003).
Babati is a small town in Babati District of Manyara Region of Tanzania. It is the
administrative capital of the district and also the administrative capital of Manyara
Region. The new status boosted the town into rapid growth. Since Babati town
received the role as district and regional capital, the urbanization process and
economical activities increased. Babati town is accessible from the main road
between the larger cities Arusha and Dodoma, which enable the food supply,
marketing and retailing of processed and readymade foods from outside to Babati
town (Lyding, 2009).
Migration of population in search of better source of water, land and other economic
opportunities is a widespread phenomenon in Africa with a long standing history.
Migration has led to intensive water conflict causal by the convergence of pastoralist
and farmers, traditional irrigation system and large scale irrigation system and other
uses including hydropower generation (Mbonile, 2007).
According to the 2002 Tanzania National Census, the population of the Babati
District was 303,013 people in 2010 the population of Babati Town council was
34,291 people according to the GeoNames geographical database, and according to
2012 Tanzania National Census, the population of the Babati Town council was
93,108 people and population of Babati District council is 312,392 people (URT,
2013).
16
2.5 Resources and Environmental Management
The activities carried out within and outside the area surrounding the lake include
uncontrolled grazing, cultivation, extraction of building minerals (sand and stone),
tree clearing, use of fishing gears and other human activities. This means that, any
degrading factor due to outside activities has great influence inside the Lake on water
purity, ecosystem performance and reduce water level (Anon, 2006).
The National Environmental Management Policy of 1997, National Fisheries Sector
Policy of 1997, National Human Settlement Policy of 2000 and all other relevant
policies guiding agriculture and socio-economic activity are used for the
management of the Lake Babati environment (URT, 1997). Under these Policies, the
communities are sensitized to form economic groups under which they can plan, and
implement their projects and plans. Under this approach projects are being monitored
and assessed for Environmental Conservation Integrities. However, Street, village
and wards Environmental Management committees have formed, trained and
empowered to monitor all development activities around the lake.
Major environmental hazards are deforestation, Lake siltation and flooding,
earthquakes, soil erosion and over fishing (Hariohay, 2013). There is basically land
conservation practices insisted in the Lake catchment area in order to reduce land
sliding and gully erosion which ultimately results into siltation processes to the Lake.
Under the Lake participatory conservation approaches, communities residing along
the Lake have been sensitized on the adverse effects of socio-economic activities to
the Lake and its ecosystem. For example, Community participation in fisheries

17
management (Co- management) is being tried in Lake Victoria, through co-
management, which is the sharing of responsibility between the government,
researchers and the resource users (Nyeko, 2012).
According to Mitchell (2002), that when conflict arises over resources allocation or
different interest regarding the environment, at least four approaches can be used to
deal with them. Political, Administrative, Judicial and Alternative dispute
Resolution. Some of approaches can be used together, political approaches involves
values and interest and the making decision. Decision makers are not specialist; they
receive advice from technical experts in resources and environmental management.
Administration approaches are best suited to what might be called routine as opposed
to strategies type of decision. Judicial approaches involves litigation and the canons,
this approaches are suited in dispute are so entrenched in their positions, the
approaches has the power to impose and enforce sanction (finer, prison sentences)
the judicial approaches is based on procedures and guidelines but it is time
consuming and very expensive (Gunya, 2009).
Mitchell (2002) explained that environmental change and violent conflict or resource
scarcity is the increasing likelihood of conflict among the people. Also human
activity can contribute to environmental change and decreases in the quality and
quantity of resources if they are used or harvested at rate faster than they can be
harvested and An access to resources or the environment it causes change. This is a
result of laws or property rights which leads to encourage concentration if supply to
few people leaving other subject to scarce.

18
2.6 Knowledge gap
Overpopulation and land use interactions have negative impact on the water
resources sustainability, but the extent and implication of these problems on Lake
Degradation, is still unclear because several studies have been conducted to analyze
the impacts of this problems over water resources (Gunya, 2009). Thus, most of the
wetlands have been vanished completely. At the same time the ability of the
remaining ones to provide valuable benefits has reduced significantly. This paper
examines the population increase, socio-economic activities, and land use changes
and their consequences on the Lake Babati in Babati Town Council in order to
provide enriched information for decision making with regard to lake resources uses
and proper land use plan.
Moreover, many of the problems associated with resource allocation and use have
been proven to have a political ecology scenario, with the major groups of actors
being residents, policy makers, council staff and local leaders.

19
CHAPTER THREE
3.0 MATERIALS AND METHODS
3.1 The study area
The study carried out at Babati District which is located below the Equator between
latitude 3° and 4° South and longitude 35° and 36° E, around Lake Babati in urban
and rural areas. The district covers an area of 6,069 km2 (2,343 sq m), a large
proportion (640 sq km) of which is covered by the water bodies of Lake Babati, Lake
Burunge and Lake Manyara. The head quarter of the district is in Babati town which
is located on the northern part of Lake Babati. The head quarter for Manyara region
is located at Babati town.
The Council is divided into two climatic zones namely highland and low-land zones.
The mean annual temperature is 23 0C, the coldest month being July with an average
temperature of 15 0C and warmest month is December with an average temperature
of 34 0C. The town receives two rainy seasons; short rains from October to
December and long rains from March to May with an average of annual rainfall of
1200 millimeters.
According to the National census of 2012, the 8 wards of Babati town council have a
total population of 93,108 people, out of which 47,313 are male and 45,795 are
female. Primary economic activities of people living around the study area include
fishing, livestock keeping and small holder agriculture production such crop as
maize, pigeon peas, lablab beans, beans and horticulture activities. These crops are

20
grown for subsistence and cash generation. Other economic activities include
business activities and brick making.
The reason for selecting the area is due to the fact that Babati town is one of the
urban centre with rapid population increase which accelerate high rate of
urbanization and is the area which lies along the shores of Lake Babati. Either the
area is potentially vulnerable to environmental pollution, management conflicts due
to increasing urbanization and social economic activities around the lake.
Figure 1. A map of Babati Town showing study area.
Source. Field Data arcview GIS 9.1 (2014)
Bagara Ward
Target Area
21
3.2 Methods
3.2.1 Data Collection
Both secondary and primary data were collected to capture information needed for
analysis. The secondary data was collected from different sources such as
government offices (like Street Executive Office, Ward Executive Office and
District), and some published and unpublished hard and soft information sources.
The information collected from secondary data includes fluctuation of the size of the
lake, depth of the lake and Lake Biodiversity. The primary data was collected
through a closed and open ended questionnaire in order to obtain quantitative and
qualitative data at a household level. The information collected using this method
includes. the current awareness level of local community on environmental
management of Lake Babati, socio-economic activities that are major basis for Lake
Babati environmental degradation, sustainable environmental management strategies
of the scarce resources at Lake Babati. A checklist was used to collect the data from
key actor which includes NGO’s, Government leaders at District and Local levels,
and influential local people.
3.2.2 Household Survey
Primary data was obtained through structured and semi-structured questionnaires
administered to various respondents. A structured survey questionnaire was used to
gather primary household data at the village level on economic activities, waste
disposal, management issues and policies, demographic data and level of awareness
on environmental management. Primary data also obtained by interviewing local
environmental agents. In addition, direct field observations and a number of informal

22
discussions with village elders, farmers groups, and extension workers was
conducted to cross-check and verify additional information of interest to this study.
The questionnaire prepared was tested, and amended to fulfill the objectives of the
present study. In the study area villages, up-to-date household list which obtained
from the respective office is used as a sample frame. With the lists, systematic
random sampling procedure used to select a total of 120 sample households which
was interviewed using a structured questionnaire.
It is known that sample size depends on variability of a population to be sampled
and taking time, cost and accessibility. Given the relative homogeneity of the
subsistence household in the study villages in terms of physical environmental
factors and resource endowments, this number was considered maximum which
could be handled effectively within the research time and budget.
a. Field observations
Another qualitative method of the study was direct observations on biodiversity of
the lake (fish and forest cover), soil erosions (brick making sites and water inlet
channels) and number of environmental management’s project in the study area.
Either observation was employed on activities and physical environment in the
catchments and buffer zone to determine the existing situation and compare with
what was narrated by the community either to observe various issues related to
environmental degradation of Lake Babati and environmental management
initiatives. A visit was made around the lake and on catchments areas. The aim of the
visit is to asses if this has any direct relationship with land use activities and if there

23
was any relationship between what the respondents had stated and the real situation
on the ground. Check list of various items was used as a tool for observation.
b. Focus Group Discussion
Various groups of people like farmers, livestock keepers, fishermen, urban dwellers,
Brick makers and key stakeholders in the study area including women, men and
elders were organized to get more information about awareness to environmental
degradation and its effects on biodiversity and lake physical features, if their practice
are environmental friendly or environmental unfriendly. These groups consisted of 5-
7 people each and were questions concerning Lake Babati environmental degradation
and management in the study area.
c. The Interviews
The data collection entailed intensive interviews (Appendix 1) with the household
heads or their closest deputies, using a structured questionnaire which was designed
as explained.
The questionnaire was detailed and consisted mainly of close-ended questions that
served to gather information on the basic demographic characteristics of the
household heads such as age, marital status, education, level of income,
environmental awareness, awareness of waste management issues, experience of
household as well as questions relating to basic socio- economic activities of the
household. Some open-ended questions were also included to facilitate oral
discussions and assessment of opinions. These conversations between interviewers

24
and interviewees were flexible and the responses were written down and utilized as
background information for the data interpretation
3.2.2 GIS Arc view and remote sensing
The geographical information system software was used to detect the changes on the
lake size, change in forest cover and changes on landscape due to human socio
economic activities. Previous data was compared to current aerial and sketch maps of
the study area. Some of the previous maps was obtained from Babati District- Map
room and from other map sources i.e. Google map, Land Sat aerial Photographs e.t.c.
3.3 Study Design
Probability and non-probability sampling techniques was used to select respondents.
Simple random sampling technique was used to select names of respondents in the
selected hamlets where respondents were assigned number and processed in excel
computer software to obtain sample without biases. Also with non- probability
sampling i.e Purposive sampling, stratified sampling and multi-stage sampling were
applied. Two or three sampling methods were applied together in some cases. For
example stratified sampling was used to select households from rural and urban area
while random sampling was used to select households for interview while the
purposive sampling was used to select key informants from street and ward leaders
etc.
The study area was stratified into two zones as urban lake area and rural lake area,
further stratification in each area was carried out as Lake buffer zone and non buffer

25
zone (Table 2). Both in each of the four zones all Hamlets was listed down and
assigned to a random number and one hamlet (from each of the four zones) where
selected. In each of the four selected hamlet 25 respondents where randomly selected
for questionnaire administration.
Table 2: Study area stratification
Urban Lake area Rural Lake area
“Mtaa” “Mtaa” Hamlet Hamlet
Buffer zone Catchment area Buffer zone Catchment area
25 25 25 25
The sample size was obtained from the total number of 7230 households in the study
area. To minimize errors and sample biasness from each household in each village,
households were equally selected using standard formula, n = N/ (1+N (e) 2
. Where,
n = sample size, N = total number of households, e = it is an acceptable error, i.e.
10% (0.1) used to obtain manageable respondents. Thus, n = 7230/ (1 + 7230(0.1)2)=
99 households plus other 12 informants i.e. District land officer, ward executive,
street executive officer x 3, lake resource officer, district community development
officer etc, making the total of 111 respondents.
3.4 Data Analysis
The survey generated both qualitative and quantitative data; the first task was to
summarize, categorize and code all qualitative responses into numeric values and
then enter them in Statistical Package of Social Science (SPSS) version 17.0.

26
Descriptive statistic was used to generate mean, percentages which are important for
comparison purposes; chi - square tests were used in determining the association of
different demographic variables and awareness status. Regression analysis was
carried out to determine the level of impact of main economic activities on the lake
degradation in the study area. The parameters set for degradation of the Lake Babati
shall give the magnitude of drop in relation to productivity, physical as well as
ecological products. Predictions will be made so as make proper recommendations to
save the lakes deteriorating biodiversity.
Non parametric statistics was mostly used when data were not normally distributed.
Significance level was set at p < 0.05. Imagery analysis was done through using
ArcGIS Desktop version 9.1(Lu et al, 2004).
Information obtained from unstructured interviews and informal interviews with
different elderly people in the village and officers which mostly where in form of
verbal/narrative information. These were written down during the survey and
summarized. This information is more qualitative in nature and was used to support
the coded qualitative and quantitative data analysis. Descriptive statistics; sum,
mean, and percentages presented in tables to enable easy interpretation and quick
visual comparisons of variables within the study area.

27
3.5 Data Presentation
Data output was presented in the forms of tables, graphs, figures and in text format.
3.6 Validity and reliability
Validity is the truthfulness or correctness of the measurement as planned or intended.
Seale (2004.74) gives seven (7) threats to (internal) validity thus history, maturation,
instability and regression, testing, instrumentation, selection and experimental
mortality. The study was designed and conducted within a short time but adequate
for respondents to answer the questions in which the threat of history as well as
maturation would not have influence. The questionnaire was pre-tested to both
professionals (specialists in the field) as well as would be respondents. This was to
guards against the threat of instrumentation as well as testing. Experimental motility
would have little if any effect since the study was not ‘experimental’ but a survey.
Reliability concerns the consistency with which research procedures deliver their
results (Seale 2004.72). It also relates to the repeatability of the findings under
similar conditions. Apart from statistical variations (number of respondents
increasing or decreasing), it is doubtful whether a similar study would yield very
different findings. Additionally, the same questions were asked to all respondents
and the questionnaire can be used elsewhere hence the study is repeatable. Study also
applied chi-square test of significance to determine generalize ability of findings. It
would be inaccurate though, to claim hundred percent reliability and validity.

28
3.7 Limitations of the study
There were a number of limitations in this study but the key ones are. The broadness
of the topic for it was not specific to one type of lake degradation, but perhaps this is
motivation for further studies in this area; the data collection setting where some
respondents were not only less conversant with English language but also
apprehensive about it; on instrumentation the questionnaire has been described by
many researchers to yield low response rates and this manifested in this study. The
other limitation was the combination of methods itself. Brysonan (2002) has argued
that research methods are ineluctably rooted in epistemological and ontological
commitments, the epistemological positions in which the two methods [quantitative
and qualitative] are grounded constitute irreconcilable views about how social reality
should be studied (Seale, 2004.294). Philip (1998) echoes this distinction and notes,
‘recognizing this destabilizes the distinction between the two approaches and
therefore their apparent incompatibility’. I tried to reconcile this dichotomy by
conforming to the institutional setting in which the study was carried out. That is, the
language factor militated against the use of pure qualitative research (especially
interviews) while the nature of the topic would not yield much using pure
quantitative method.

29
CHAPTER FOUR
4.0 RESULTS
4.1 The influence of demographic variables on awareness status of local
community on environmental management of Lake Babati
The results for the influence of demographic variables are shown in Table 3. Age,
sex, marital status have been shown to be statistically insignificant (p ≥ 0.05) on
level of awareness on environmental issues. On other hand, there was difference (p ≤
0.05) among the respondent with different level of education and occupation status of
respondent on awareness to environmental management. In term of association of
respondent environmental awareness based on location of respondent the study found
that there was no statistical significant difference between those located within
catchment area and buffer zone.
Results shows Local Government Authority, NGO’s and CBO’s are the only
organizations that were creating awareness and capacity building on environmental
issues in the study area by 49%, 31% and 20% respectively. The result also showed
that 64% of respondents did not attend environmental awareness campaigns that
were carried out in the area. Further more 26% of respondent had not heard existence
of such campaigns.
The study also revealed that community awareness toward environmental
governance and by Laws is not high since only 65% of respondent know the roles
and regulation related to fishing activities, residential development, agricultural

30
activities, waste disposal and wildlife management. Almost 35% of respondents lack
knowledge and therefore they are not aware of roles and regulation towards
environmental conservation.
Table 3. The influence of demographic variables on awareness status of
respondent
Variables
Cou
nt
Percent
(%)
Awareness level of
respondent on
environmental issues (%) p-value
High Medium Law
Age
(Years)
Less than 25 3 3 0 1 2
0.812
26-35 39 39 5 20 14
36-45 39 39 6 19 14
46 – 55 10 10 2 7 1
Above 56 9 0 1 5 3
Total 100 100 14 32 54
Gender Male 63 63 8 35 20
0.640
Female 37 37 6 17 14
Total 100 100 14 52 34
Marital
Status
Single 15 15 3 7 5
0.590
Married 64 64 7 36 21
Widow 12 12 1 6 5
Separated 9 9 3 3 5

31
Total 100 100 14 52 34
Occupatio
n
Farmer 51 51 3 26 22
0.001
Livestock keeper 10 10 2 4 4
Formal
Employment
29 29 9 14 6
Business man 9 9 0 7 2
Fisher man 1 1 0 1 0
Total 100 100 14 52 34
Education Primary 56 56 1 23 32
.000
Secondary 21 21 4 17 0
Higher 13 13 8 4 1
Tertiary 9 9 1 7 1
Literate without
formal education
1 1 0 1 0
Total 100 100 14 52 34
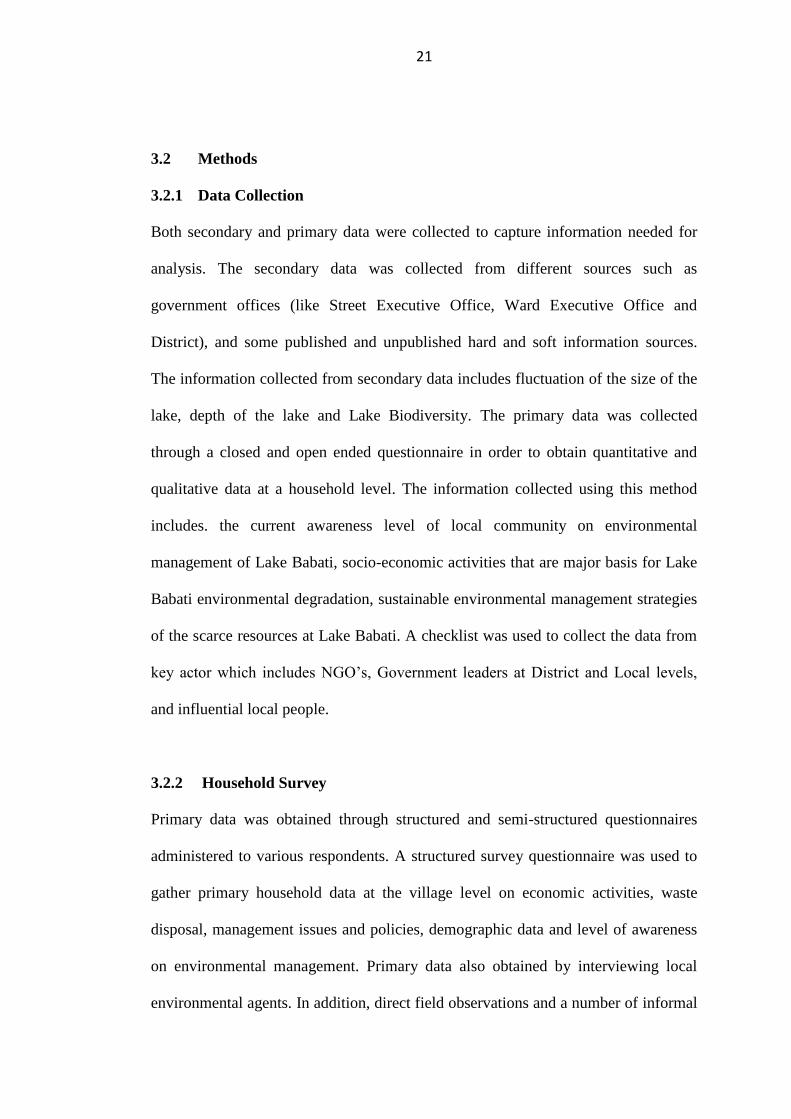
4.2 Human activities responsible for degradation of Lake Babati
Results for various economic activities carried out in the area are shown in Figure 2
below. Results showed that majority (91%) of respondents were engaged in various
economic activities such as crop production, livestock production and formal
employment, fishing, brick making while only a small (9%) proportion of old age
people were engaged in economic activities in the study area. There was no
significant differences in economic activities carried out by respondents in the study
area (X2= 0.139; p = 0.9330) which ranged from crop production (25.3%), livestock
32
keepers (21%), small-scale business (18.4%), employment (15.8%), fishing (11.6%)
and 7.9% of respondents were Brick Makers (Figure 2).
Figure 2: Main Economic Activities responsible for Lake Babati degradation
The study revealed that majority of respondent had lived in the study area for more
than ten years and owned less than two Ha of land (Table 4). This indicates that the
respondents are sufficiently knowledgeable in terms of time and space to provide
useful information with regard to the use of wetland resource in study area. These
results showed evidence that, people who live in a certain area for a longer period of
time accumulate experience and knowledge, on various matters with regard to
respective area of interest. Paradoxically, it may also indicate that people may have
enough time to cause significant impacts (positive or negative) at the study area.

33
Table 4. Residence Duration, Average size of land and Distance from Lake
Water
Variable Variable information
Mean Frequency Percentage (%) p-value
Resident Duration (years)
0.226 <5 16 16
5- 10 36 36
10+ 48 48
Total 2.78 100 100
Average size of land(ha)
0.140
<1 33 33.7
1-2 50 51
3-4 13 13.3
5+ 2 2
Total 1.84 98 100
Respondent residential distance from
lake water (M)
0.052 <60 7 7.3
60 -100 17 17.7
100+ 72 75
Total 2.68 96 100
Crop production and livestock keeping were key economic activities carried in the
area and followed by small business scale and fishing activities. Result shows

34
majority (96%) of respondent in the study area are engaged in small scale agriculture
specifically subsistence food crops farming where by majority 54.6% of respondent
cultivated cereals crops, 34% of respondent mentioned Legumes crops and only
11.4% of respondent in the study area grew horticulture crops. When asked if they
practice conservation agriculture in their agricultural activities, only 48(49.5%)
confirmed that they practice conservation agriculture and 50.5% of the respondent
did not practice conservations agriculture where by 25.8% are from Buffer zone and
24.7% are from catchment area. In addition, for respondents who practiced
conservation agriculture, it was found that 25% use uphill ridges method, 69.4%
contour barriers and only 27.8% practiced agro forest agriculture in their small scale
farms.
Figure 3: Onion (Alium cepa) farming as one of unsustainable agricultural
activities along the buffer zone of Lake Babati.

35
Result also showed that only 10.1 % (6.1% from Buffer Zone and 4% from
catchment area) of respondent in the study are practicing irrigation agriculture while
majority 89.9% of respondent are not practicing Irrigation agriculture in the study
area. When asked on the sources of water for irrigation schemes 40% of respondent
who practice irrigation agriculture indicated lake water, 20% used well water and
other 40% of respondent who practice irrigation agriculture mentioned piped water
where 20% from Buffer zone and Other 20% from catchment area.
Soil erosion in the study area was common since 39.8% of respondent in the study
area experienced soil erosion in their area where by 16.3% was from Buffer Zone
and 23.5% from catchment area. When asked about the main causes of soil
erosion/land degradation in the study area majority 41.2% of respondent stated
deforestation, 22% of respondent indicated unsustainable agricultural practices,
16.2% of respondent said Housing Development (Residential), 13.2% of respondent
mentioned Infrastructure Development and only 8.8% said live stock keeping.
The result also showed that 56% were livestock keepers and 24% were located
within buffer zone while 32% were located in the catchment areas. When asked
about the sources of food for their animals, majority (65.5% of responds) mentioned
from the lake Buffer zone while 21.8 % of respondent raised animals in the
catchment area while 12.7% are fed their stock from non catchment area. Likewise
the 56.4% of respondent use lake water for watering their animal while, 36.4% used
piped water and only 7.3% are watering from wells. The Study further found that
only 7.1% of respondent in the study area were practicing brick making activities,

36
where by 4% were within buffer zone area and remaining 3.1% were from catchment
area. The average mean of brick making site distance from Lake buffer zone is 2.48,
result found that 14.3% of brick makers are found within 50 m from lake water,
57.1% were found between 50 – 100 m which is sensitive ecological zone (Hippos
Range Reserve) and only 28.6% are conducting brick making in catchment area over
100 m away from lake water.
Figure 4: Earth brick industry found in the buffer zone around Lake Babati
Figure 4 above shows brick making activities within Lake buffer zone. In Figure 4
raw bricks stacked ashore waiting for curing a pile of Yellow fever acacia (Acacia
xanthphloea) cut down for bricks curing process.

37
Figure 5: Acacia logs (bottom) for burning the kiln found at Lake buffer zone.
In Figure 5 the brick kilns with yellow fever acacia ready for firing bricks in the
buffer zone. Both the processes have immense effects on the lakes degradation hence
its biotic survival.
The study also showed that only 15% of respondent in the study area were engaged
into fishing related activities where by 8% and 7% of those were fishing in Lake
Babati come from urban and Per Urban areas, respectively. It was also found that
there was illegal fishing in the study area as supported by 87(90.6) of respondent.
Either result showed that majorities (75%) of fishermen were using acceptable and
sustainable fishing gears while 25% of fishers were using unsustainable fishing
gears. Illegal fishing practiced in the lake Babati included fishing during off season,
use of dynamite and poisons.

38
Result showed that 100% of households involved in this study generated solid wastes
where by 48% produced less than Five kilogram while 22% produced 6 to 10
kilograms and 30% of respondent produced over 10 kg of solid waste per week.
The results also show that, 40% of the households placed wastes into polythene bags
at home premises, 10% households were collecting their solid wastes through
unloading wastes into transfer station /collection site, 20% households were
disposing solid waste by open dump, 18% households were used methods of
enclosure/field for disposed solid waste, and 12 % households were used method of
disposing by burning. The people in households do open burning their solid waste at
lower rate of 12%.
The findings also showed that, 45% of households used landfill dump as their
systems to managed solid wastes, 33% of households incinerate solid wastes, 19% of
households reuse solid waste and only 3% of households were prefer recycle system
to solid waste and on composition of solid wastes generated within the household
results of research shows that 41% households were generating plastic waste, 29%
households were generating compostable/domestic residual foods waste, 18%
households were generating cardboard waste, 6% households were generating metal
wastes, 34% households were generating glass waste and 2% households were
generating paper waste.
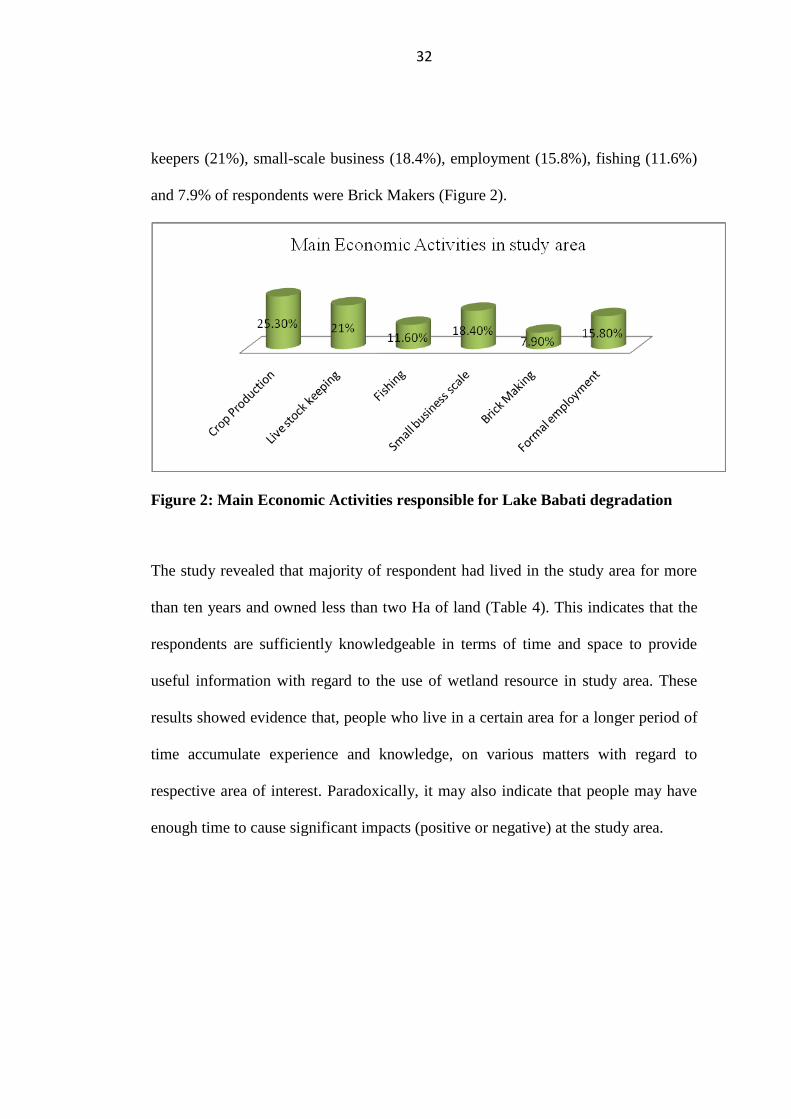
4.3 Changes in the Physical Features of Lake Babati
Lake Babati is reported to have flooded extensively in 1964, 1979, and 1990 (Gerden
et al., 1992). The lake area is about 18 square kilometers and its catchment area is
39
about 384 square kilometers. The dimensions of the lake in fluctuate from 16 and 19
km in length from 3 and 6 km in width reached after the 1990 floods is the largest it
has been in recent times. Figure 6 and 7 below shows the size of the lake between
1970, 1990, 2010 and 2014.
Figure 6 Changes on Lake Babati 1970, 1990 and 2010: By 1990 the digitized
map show extension of lake area due to excessive floods.

40
Figure 7: Satellite image showing the landscape and various human activities
carried out in the lake Babati catchment area (Source. Arc view GIS 9.1 (2014))
In1960’s the lake depth was between 6 – 8 m deep in the middle, due to siltation in
1974 the lake was only 5 m deep in the middle with its depth decreasing to 3 m at the

41
northern end and 1-1.5 m at the southern end (Nhwani, 1974). Currently the lake
depth has decreased from 6 – 8 m in 1970’s up to 3 – 4 m deep in recent years. Due
to decrease in the lake depth an artificial outlet was created in 1964 to empty the
flooded lake into Faharan River
Figure 8: The elevation cross-section of Lake Babati showing the depth of the
Lake Babati
Source. Arc view GIS 9.1 (2014)
The topography around the lake is slop and the catchment area of the lake Babati is
slowly being degraded of which lead to the total land cover change and change of
land scape due to deforstation and caupled with bad agricultural practices has
degraded the soil, leading to siltation in the lake being localized in urban area around
the lake while deforestation, soil erosion, infrastructure development and increasing
human and livestoct population have contributed to increased nutrient loading to the
lake from inlet channels. In aditional to that the atmospheric deposition of nutrient
from poor land use management within and outside the lake catchment.
42
CHAPTER FIVE
5.0 DISCUSSION
The finding from the present study support the research hypotheses that younger
people, women, and people of higher education levels have influence on awareness
status of local community on environmental management of Lake Babati.
In the present study only education and occupation was found to have an influence
on respondent level of awareness on environmental management. Equally those with
formal education were more aware of environmental management issues than those
engaged in fishing and brick making, primarily due to their high level of education.
Generally, respondents in Urban Lake area had more exposure about environment
issues and as a result, take more initiative to control the environmental problem
compared to respondents in rural lake area.
Such literacy rate indicates that, most respondents know how to read and write an
important input which may enable community to be aware, understand and adopt
new technologies more easily hence creating necessary strategies for improving
environmental management at lake Babati. Education is always regarded and valued
as a means of liberation from ignorance. It is perceived that education is among of
the factors that influence an individual’s perception for intervention before making
decision to take part in any undertakings. It also imparts the desire to learn more and
seek information regarding environmental conservation activities (Luhasi, 1998).
It was revealed from the present study that the great percentage of male were
involved and benefited from Lake Babati environmental degradation. It seems clearly

43
that men engage more in economic and agricultural activities as compared to women.
These findings concur with Otero and Downing (1989) who argued that women lack
control over economic resources and other environmental resources.
The results from the present study showed that majority of the respondents were in
the middle age group, which fall within the economically active and productive
group. These findings are supported by Basnayake and Gunaratne (2002) who argued
that the age of a person usually is a factor that can explain the level of production and
efficiency. Age influences experience, wealth and decision- making all of which has
an effect on the working capabilities of an individual, utilization of lake
environmental resources and therefore individual’s productivity age of respondent.
The level of awareness on environmental issues has increased significantly in recent
years (Ellul, 2014). Environmental awareness is one of components in strengthening
sustainable development in any Country (Giddings et al., 2002). The lack of
continuous and comprehensive environmental education in community makes the
youth overlook the importance of the environmental protection in their daily life.
This is because; they do not have continuous exposure to environmental issues and
awareness by exposure through formal or informal education (Hansen, 1991).
Although the local government has been conducting campaigns on awareness and
capacity building to solid waste management, the residence in Babati town are yet to
carry out proper disposal of solid waste disposal. The most important ingredients
that form the basis of a waste minimization drives in any municipality is surely the

44
awareness campaign. This is so true, simply because most people do not realize the
importance of waste minimization and how easily it can be accomplished sometimes
(Mvuma, 2002).
The present study has shown that majority of households own land and depend on it
for their livelihood, thus, any decision made by majority regarding use of their land
may have major positive or negative impact on wetland values in the study area. This
implies that good land management can have positive impact on wetland
management. As such decision made by majority in the course of land use and other
economic activities can affect water quality and other lake values. This argument is
similar to observation made by Falkenmark et al. (1999) who asserted that,
exploitation of land resources has undesirable effects on the ecosystems, thus it is
essential to understand how humans interfere with the landscape systems (Musamba
et al., 2011)
The diversity of economic activities in the study area indicated the need for more
land to accommodate various land uses and the need for space to dispose wastes
generated from these economic activities. This may increase the chances of lake
degradation as a result of pollution from these economic activities.
This implies that the degradation of wetland (water) quality due to a certain land use
type in upstream parts o a watershed can have negative effects on users in
downstream parts of the watershed and the degradation affects flow through the
watershed. These findings are similar to the study conducted by Baur et al. (2000)

45
and UN (2009) who argued that different land use systems may have different
impacts on wetland values direct or indirectly as a result of land use practices of the
stakeholders (upstream or down-stream). Results of this paper is similar to the
studies by Musamba et al. (2011), Copeland et al. (2010), Kangalawe and Liwenga
(2005) and Ramsar (2009) who assert that poor farming practices have led to land
degradation along with negative impacts on wetlands.
Results indicate that, the main land use types were farms, commercial areas,
infrastructures, settlements, and spiritual activities. In the present study it was also
shown that there was diversity of land use types in the study area which have been
changing since 1990’s to date. This implies that, there was a significant change in
land use with increase in population in catchment areas and decrease in some other
land use types such as farmland, settlement and infrastructure. Conversely, there was
a dramatic decrease in catchment area which was observed between years 1995, 2009
and 2014.
During late sixties and early seventies there was immigration of fisherman tribes
from Lake Nyasa and Victoria to Babati in search of fish. In those days there was
good catch, often the population of Babati was low. Decrease of fish catch led to
change in occupation and people change and took other activities in particular
farming in lake/buffer zone area. Other became earth brick makers to meet the over
increasing number of residences that require more house. Thus, the decrease in
wetland area was in line with decrease in its values such as ecological values
(breeding sites for fish and birds). Besides, this may also reduce the number of fish

46
catch in the respective period (temporally and spatially) and increase the costs of fish
catch effort which affected economic returns in fishing activities and the multiplier
effect might spread to other households (Musamba et al., 2011). Results of this study
can be compared with the study conducted in Vedaranniyam by Prabaharan et al.
(2010) who found that coastal zones are most vulnerable for land use changes in
rapid industrialization and urbanization area mainly influenced by various
anthropogenic activities.
The conversion of Lake Catchment to other uses might be due to rapid population
growth in the study area which increases pressure and the demand for natural
resources and wetland benefits to meet people’s basic needs. It can also be attributed
to negative attitude of local people towards wetlands as a wasteland. Results of this
study are in line with some previous studies (Kashaigili 2006; Kirsten 2005; URT
2007 and Canty 2006) which argued that wetlands have been converted to other uses
such as agriculture, settlement and infrastructure. While some wetland conversions
no doubt have been in the best interest of society, wetlands have too often been lost
for very limited benefits and even costs to society (Munishi et al. 2003; Turner et al.
2000).
Subsistence agriculture is the major activity within the Lake’s watershed. Ownership
and management jurisdiction of the lake’s aquatic resources has caused concern.
Pollution levels from farms and industries, and reclamation of wetlands for
agriculture raise concern. Poverty levels are pushing the landless to the ecologically
marginal wetlands.

47
Findings from present study revealed that crop production was significantly
(p=0.052) affecting the wetland by a high multiplicative factor. This shows that a
marginal increase in crop production characterized by poor land use practices has
highly affected Lake Babati . This can be attributed to the increase in household size
at the surveyed area which implies that there was high demand for food and other
household sustenance needs. Furthermore, the increase in household size marks the
increase in demand for land along with the use of agrochemicals to produce enough
food to feed the growing population.
Furthermore since cultivation is the major economic and social activity for the
majority of the communities adjacent to lake is a confirmation that pressure on the
natural resource base is high. Poor agricultural practices and pressure from
anthropogenic activities (in situ and external actions) on Lake Babati has jeopardized
its values. Either lack of capital to invest in different social economic undertakings
and infrastructure development leading to land degradation and other factors have
been pointed out by previous studies.
Apart from crop cultivation livestock keeping was another activity practices at the
lake area. The marginal increase in livestock size has caused impact on Lake Babati.
This can be attributed to large number of livestock in the study area. Livestock
grazing has significant impact on wetland and can damage reproductive habitats
(nests, burrow trampling, exposing spawning sites to desiccation and removal of
mating perches sites which may reduce habitat diversity. Mwakubo and Obare
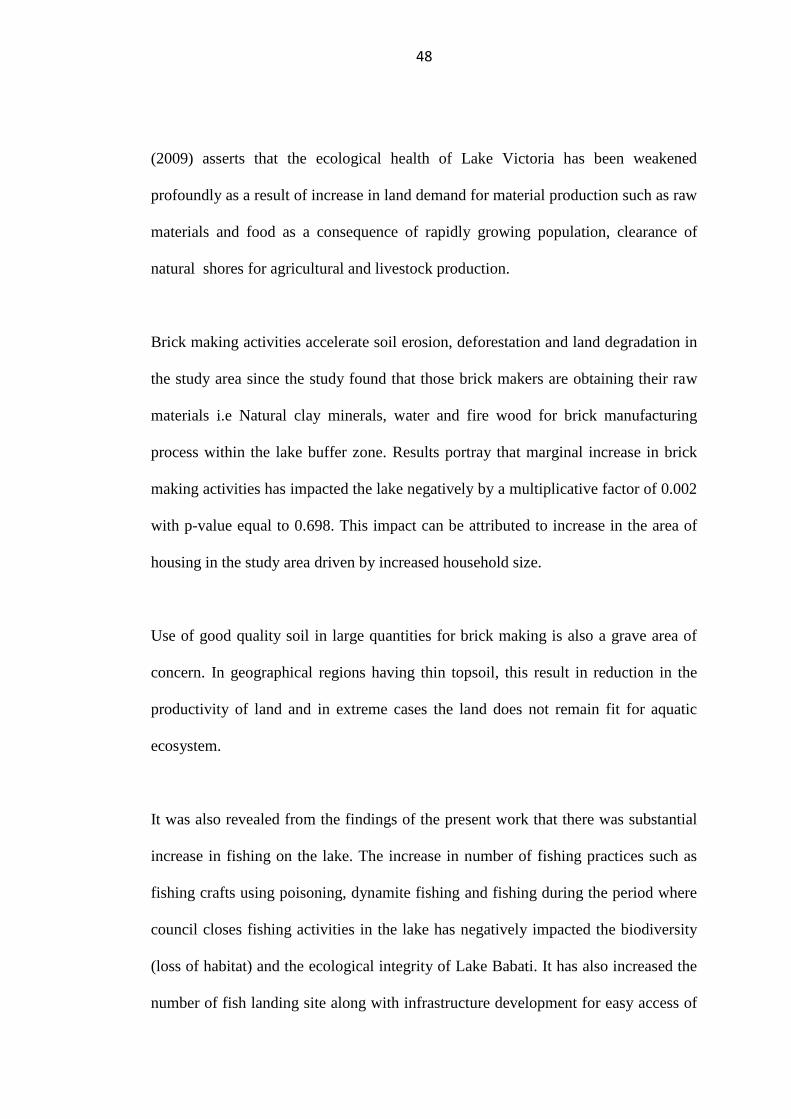
48
(2009) asserts that the ecological health of Lake Victoria has been weakened
profoundly as a result of increase in land demand for material production such as raw
materials and food as a consequence of rapidly growing population, clearance of
natural shores for agricultural and livestock production.
Brick making activities accelerate soil erosion, deforestation and land degradation in
the study area since the study found that those brick makers are obtaining their raw
materials i.e Natural clay minerals, water and fire wood for brick manufacturing
process within the lake buffer zone. Results portray that marginal increase in brick
making activities has impacted the lake negatively by a multiplicative factor of 0.002
with p-value equal to 0.698. This impact can be attributed to increase in the area of
housing in the study area driven by increased household size.
Use of good quality soil in large quantities for brick making is also a grave area of
concern. In geographical regions having thin topsoil, this result in reduction in the
productivity of land and in extreme cases the land does not remain fit for aquatic
ecosystem.
It was also revealed from the findings of the present work that there was substantial
increase in fishing on the lake. The increase in number of fishing practices such as
fishing crafts using poisoning, dynamite fishing and fishing during the period where
council closes fishing activities in the lake has negatively impacted the biodiversity
(loss of habitat) and the ecological integrity of Lake Babati. It has also increased the
number of fish landing site along with infrastructure development for easy access of

49
these sites. The marginal increase in fishing has impact the Lake along with the
degradation of lake values. Likewise, the use of illegal fishing gears (small meshed
nets) also might have detrimental effect on lake. The direct observation and
Participatory Rural Appraisal revealed that, some fishermen were using illegal ways
of fishing in line with illegal fishing gears which have destroyed some breeding sites
of fishes.
Human settlement impacted the Lake Babati and this impact can be attributed to
increase in the area of housing in the study area driven by increased household size,
urbanization, and solid waste discharge from these human settlements along with the
increase in hotels close to shorelines of the Lake. This implies that increase in
settlement has caused impact on Lake Babati. These results are in line with Rebelo et
al. (2010) and Wang et al. (2008) who argue that land reclamation and wetland
conversion for human settlement and other land uses has cause wetland
fragmentations together with their values. These results are in line with Rebelo et al.
(2010) and Wang et al. (2008) who portray that land reclamation and wetland
conversion for human settlement and other land uses has cause wetland
fragmentations together with their values.
Solid waste disposal significantly affecting the Lake Babati by a high multiplicative
factor. This impact can be attributed to increase in the area of housing and human
economic activities in the study area driven by increased population, urbanization,
and waste disposal from these human settlements along with the increase in hotels
close to shorelines of the Lake.

50
In the present study it was shown that although majority of people were aware of
proper disposal of solid wastes they could not put such knowledge to practice due to
poor existing infrastructure. Due to lack of regular collection and disposal of the
waste product some have develop a habit of throwing them into the lake.
The current tendency tremendously affect the environment because some solid waste
are not separated for careful disposal carefully they can destroy the lake since
materials such as plastic are non-degradable. There is no clear separate disposal
between solid waste and other urban waste material as an alternative they are both
mixed together however their decomposing process differs.
In the present study it was seen that the wetland area around the lake was under
threats of being completely degraded. Activities that pose threats to the integrity of
wetlands and its biodiversity at lake Babati and in Tanzania as a whole include but
not limited to. habitat change due to agriculture, grazing, housing and mining and
quarrying; cutting of aquatic and other vegetation for fuel, housing and commercial
activities; Improper fishing practices; siltation due to deposition of erosion materials
that reduce the depth of the wetlands; pollution by domestic sewage, industrial
effluent, and agrochemicals; siltation caused by poor agricultural methods and
eutrophication leading to oxygen depletion.
The challenges facing lake Babati also face other small freshwater bodies such as
Lake Rukwa, Lake Manyara , Lake Chala, Mtera Dam, and Nyumba ya Mungu Dam

51
where decline in water depth and eutrophication has resulted to massive bloom of
aquatic weeds(Lyding, 2009).
Biodiversity is the source of economic and ecological security of present and future
generations. Thus, the current and future economic, social and ecological
contributions of genes, species, and ecosystems make the conservation and
sustainable use of biodiversity, not just a technical concern but a political imperative
as well. Diversity and variety enable humanity to adapt to local, regional and global
changes.
Environmental challenges are threatening Lake Babati and its fauna. Water level in
the lake has decreased in recent years and the number of hippopotamus has dwindles.
In 1960s and 1970s, the lake was the sole home of hippopotamuses in northern
Tanzania. Today, that is a story of the past as a vast part of Lake Babati is now being
covered by weeds, twigs and shrubs, which are threatening to overlay the entire
water body. The number of hippopotamus has dropped to 150 from 400 in 1990s.
Local people and environmentalists link the cause with human induced activities and
climate change.
Lazaro Osiligi, is environmental officer at the Babati Town Council who has taken
issues of environmental conservation very seriously in the area, particularly Lake
Babati. He says “Lake Babati is an important habitat for hippopotamuses, fish and
other fauna. But, also plays a big role in creating micro-climate in the area”.

52
Basing on a study carried-out by James Kahurananga for the past 20 years, Osilig
says. “In trying to control and reducing the intensity of environmental hazards the
council mobilizing livestock farmers to change from traditional rearing where by big
stocks are free grazed into intensive system.“We also encourage fertility
improvement through agro forestry practices”.
Babati Town Director, Mkombole (Personal Communication) also admits that
hippopotamus in the lake are the victims of circumstances, as the lake is threatened
by environmental degradation. “Drought has hit the lake and water line has been
receding forcing the hippos into the centre of the lake where local people cannot see
them clearly,” he says, adding. “But, we have started working on challenges facing
the lake, including planting trees and grasses as well as fencing some parts of the
lake as part of conserving the lake.”, “We are going to carry-out serious campaign to
make sustainable management of the lake’s ecosystem,” Mkombole says, noting that
in recent years the council has been training youths from 39 villages and streets
surrounding Lake Babati in making contours for the purpose of soil conservation.
Other measures include training the community through farmers groups on Agro-
forestry technologies, as well as sensitizing communities living within the lake
catchment on the importance of conservation. “We have also mobilized fishermen
community to form Beach Management Units among themselves and train them on
the importance of sustainable fishing in order for them to get rid off illegal fishing,”
he says.

53
CHAPTER SIX
6.0 CONCLUSION AND RECOMENDATION
In the present study it is clear that the level of awareness on environmental issues has
increased significantly in recent years, environmental awareness is one of
components in strengthening sustainable development in the Country.
Poor agricultural practices, livestock keeping, brick making and solid waste disposal
observed as key activities that degraded the lake. Other activities that also degrade
the lake include unsustainable fishing activities. Consequently, there was a strong
relationship between land use changes and the anthropogenic activities. This was due
to the increase in demand for Lake Resources to sustain the rapid grown population
and infrastructure development which was the underlying cause for conversion of
wetland to other land use type and loss of wetland values. Despite its great potential
in supporting local people’s livelihood, the wetland was found to be decreasing year
due to various socio-economic activities.
This study recommends that, unless emphasis is put on the awareness raising
campaign on the role and wise use of Lake Babati resources, the wetland will
continue to be degraded and its impact will affect people in a vicious cycle. Good
land use practices should be promoted so as to reduce the impacts that has been
caused on the Lake Babati due to poor land use practices in the study area.

54
6.1 Suggestions for future research
In suggesting future research on this subject, I would focus more on the findings and
limitations encountered in this study. For instance issues like the nature of awareness
creation campaign, the reality/status of community based natural resources
management and biodiversity, water quality and biodiversity (specie abundances).
The study may have been adequate in combining methods but I would suggest other
qualitative methods as well like participatory observations not just interviews, these
were avoided on the basis of time and language barrier.

55
REFERENCE
Adams, W.M. (ed) (2001). Green Development. 2nd Edition; Environment and
Sustainability in the third word. New York. Pp 475.
Adhikari S., Bajracharaya R.M., Sitaula B.K. (2009). A review of carbon dynamics
and sequestration in wetlands. Journal of Wetlands Ecology, 2. 42-46.
Ali, A. and Lebel, T., (2009). The Sahelian standardized rainfall index. International
Journal of Climatology, 12(12). 1705 – 1714.
URT (2003). "Population of the United Republic of Tanzania by Sex and Number of
Households". p. 6. Archived from the original on 2 March 2003.
URT (2006). Unpublished Report on Babati Town Council Social- Economic Profile.
Babati Town Council Manyara. Pp 49.
Anon, (2013). Repot of Hippos under threat at Lake Babati decline. Manyara.
Anon. (1997). Ministry of Natural Resources and Environment; National
Environmental Policy. Dar es Salaam. United Republic Of TAnzania.
Baldus, R.D. (2001). Wildlife conservation in Tanganyika under German colonial
rule; Tanzanian - German Development Cooperation. Dar es Salaam, Tanzania.
Baur P., Mandeville N., Lankford B., and Boake R. (2000). Upstream/Downstream
Competition for Water in response to environmental problems. Environment
and Behavior, 22,387-407.
Blaikie, P.(ed)(1995). “Understanding Environmental issues”. People and
environment, London. Pp 1-30.
Blata, S.t. (2010). Land Degradation and Farmers perception. the case of Limo
WORDA Hadya Zone of SNNPR, Ethiopia. Pp. 78

56
Bryson S. & Kirby P. (2002). Measuring the magic. Evaluating and researching
young peoples’ participation in public decision making, London. Carnegie
young people initiative.Pp 23-27.
Camilla A. (2011). Becoming Wilderness. A topological Study of Tarangire
Northern Tanzania; Stockholm Studies in Human Geography; 21, pp228.
Canty M.J. and Nielsen A.A., (2006). Visualization and unsupervised classification
of changes in multispectral satellite imagery. International Journal of Remote
Sensing, 27. 3961-3975.
Carl B. (1999). “Brazil: Managing Pollution Problems,” The Brown Environmental
Agenda; 2.41.
Chid, B. (ed)(2004). Parks in Transition. Biodiversity, Rural Development and the
bottom line. South Africa. Pp 267.
Clark, W. (2010). Principles of Landscape Ecology. Nature Education knowledge
3(10).34.
Copeland H.E., Tessman S.A., Girvetz E.H., Roberts L., Enquist C., Orabona A.,
Patla S., Kiesecker J. (2010). A geospatial assessment on the distribution,
condition, and vulnerability of Wyoming’s wetlands. Ecological Indicators, 10.
869–879.
DeGeorges P.A and Reilly B.K., (2009). The Realities of Community Based Natural
Resource Management and Biodiversity Conservation in Sub-Saharan Africa.
Sustainability 1(10). 734-788.
Gerdén, C Å., Khawange GMO., Mallya J M., Mbuya J P,. Sauga R C. (1992). The
Wild Lake, Regional Soil Conservation Unit, SIDA. 27-34.

57
Giliba R.A., Mafuru C.S., Paul M., Kayombo C.J., Kashindye A.M., Chirenje L.I.,
and Musamba E.B., (2011). Human activities influencing deforestation on
Meru Catchment Forest Reserve, Tanzania. J Hum Ecol, 33(1). 17-20.
Glover, E.K. and Elsidding, E.A. (2012). The causes and consequences of
Environmental Changes in Gedaref, sudan. Land Degradation & Development
Journal, 23(4). 339 – 349.
Gunya, K.J. (2009). Participatory watershed management to decrease land
degradation and sediment transport in Kagera and Nyando catchments of Lake
Victoria basin . Science for Sustainable Development Master’s Thesis,
Linköping University. Pp 51.
Hariohay K.M., (2013). Impact of human settlements and land use changes in
kwakuchinja wildlife corridor, Northen Tanzania. Master’s thesis in Natural
Resources Managements Programme, Norwegian University of Science and
Technology, Faculty of Natural Sciences and Technology. Pp.45.
Hill T., and Lewicki P. (2007). Statistics Methods and Applications. Heidelberg.
StatSoft, Tulsa, OK. Pp 74.
Hitchcock, R.K. (2005). Sharing the land. Kalahari San property rights and resource
management. In Property and equality. Encapsulation, commercialization,
discrimination; 2005; (2)191-207.
Isango, J. (2007). Stand structure and tree species composition of Tanzania miombo
Woodlands. A case study from miombo Woodlands of community Based forest
Management in Iringa District. Working papers of the finish Forest Reseach
Institute 50.43-56.

58
Jake, R. (2009). water Resources Development in Ethiopia. issues of sustainabilities
and participation, Forum for social Studies, Addis Ababa.
Jonas Q.N and Annete R. (2010). “cultural barriers to climate change adaptation”. A
case study from northern Burkina Faso. Global Environmental change, 20
(1).142-145.
Kangalawe R.Y.M and Liwenga E.T., (2005). Livelihoods in the wetlands of
Kilombero Valley in Tanzania. Opportunities and challenges to integrated
water resource management. Physics and Chemistry of the Earth, 30. 968–975.
Kansiime F., Saunders M.J., Loiselle S.A. (2007). Functioning and dynamics of
wetland vegetation of Lake Victoria. An overview. Wetlands Ecology
Management, 15. 433–451.
Kashaigili J.J., (2006). Land Cover Dynamics and Hydrological Functioning of
Wetlands in the Usangu Plains in Tanzania. Ph.D. Dissertation, Unpublished.
SUA. Sokoine University of Agriculture, Morogoro, Tanzania.Pp67.
Kirsten D.S. (2005). Economic consequences of wetland degradation for local
populations in Africa. WWF International, Gland, Switzerland.
EcologicalEconomics, 53. 177–190.
Lu D., Mausel P., Brondizios E., Moran E. (2004). Change detection techniques.
International Journal of Remote Sensing, 25. 2365-2407.
Lundi J.F. and Treue.T(2008). Are we getting there? Evidence of decentralized forest
management from Tanzanian miombo Woodlands. World development.
36(12); 2780-2800.
59
Lyding, A. (2009). Factors conditioning the distribution of fresh water pulmonates,
Biomphalaria spp., Bulinus spp., and Lymnea spp., in Babati District,
Tanzania. Bacherlors of Arts dissertation Södertörn University. Pp 27.
Mbonile, M.J. (2007). "Population, Migration, and Water Conflicts in the Pangani
River Basin, Tanzania," in Report from Africa. Population, Health,
Environment, and Conflict, ECSP Report, pp. 20-28.
McCartney M, Masiyandima M, Houghton-Carr H (2004). Working wetlands.
Classifying wetland potential for agriculture. Journal of Ecology, 35. 223-241.
McNeely J.A, and Mainka S.A., (2009). Conservation for a New Era. Switzerland.
IUCN Gland.
Mitchell, M. (2002). “Progress in Water Demand Management in Syria”. In the
Proceedings of the Plan Bleu Forum on Water Demand Manage “Progress
towards Water Demand Management in the Mediterranean Region” held in
Fiuggi Italy, 3-5 October 2002. Pp 45-51.
Munishi P.K.T., Mvena Z.S.K., Kajembe G.C., Semu E., Maliondo S.M. (2003).
Conflicts and Conflict Management in the Use of Water Resources. A Case
Study of Ikowa and Masenge Catchments in Dodoma and Morogoro Tanzania.
Proceedings of the 4th
WATERNET/WARFSA Annual Symposium “Water,
Science, Technology and Policy – Convergence and Action by All”. Gaborone
Botswana, October 15 to 17, 2003.
Musamba E.B, Ngaga Y.M., Boon E.K. and Richard A. Giliba R.A., (2011). Impact
of Socio-economic Activities around Lake Victoria. Land Use and Land Use
Changes in Musoma Municipality, Tanzania. Department of Forest Economics,
Sokoine University of Agriculture, Tanzania,Department of Human Ecology,

60
Vrije Universiteit Brussel andForestry Training Institute, Arusha, Tanzania.
Journal of Human Ecology, 35(3). 143-154 (2011).
Muthoka M.G. (ed)(1998). Environmental Education Essential Knowledge for
Sustainable Development. Longhorn; Nairobi, Kenya. Pp 177.
Mvuma, G.G.K., 2002: Urban Poverty Reduction through Municipal Solid Waste
Management (MSWM): A Case Study of Maseru and Maputsoe in Lesotho.
Unpublished PhD thesis. Pp 115
Mwakubo S.M. and Obare G.A. (2009). Vulnerability, livelihood assets and
institutional dynamics in the management of wetlands in Lake Victoria
watershed basin. Wetlands Ecology Management, 17. 613–626.
Nyeko, J I. (2012). Community participation in fisheries management. prospects and
challenges for co-management. Fisheries Resources Department, Entebbe,
Uganda. Pp 51.
Pardo, G.J. Carero, J. Aiber and C. Zaragoza (2009). Nutrient Evolution in soil and
cereal yield under different Fertilization Type in Dry land. Nutrient Cycling in
Agro ecosystem, 84.267-279.
Prabaharan S., Srinivasa Raju K., Lakshumanan C., Ramalingam M. (2010). Remote
sensing and GIS applications on change detection study in coastal zone using
multi temporal satellite data. International Journal of Geometrics and
Geosciences, 1. 2-8.
Pu, B. and Kerry H. C,. (2012). “Pole of the West African Westerly jet in Sahel
Rainfall variations”. J.Climate, 25.2880-2896.

61
Ramachangra, G. (ed) (2000). The unquiet Woods. Ecological Change and Peasant
Resistance in the Himalaya. Oxford University Press. pp 240.
Rebelo L.M, McCartney MP, Finlayson CM (2010). Wetlands of Sub-Saharan
Africa. Distribution and contribution of agriculture to livelihoods. Wetlands
Ecol Manage, 18. 557–572.
Redfern J.V, Grant C.C, Gaylard A. and Getz W.M., (2005).”Surface water
Availability and the management of herbivore distributions in an African
savanna ecosystem” journal of Arid Environment, 63.406-424.
Richardson, J.L. and Richardson, A.E (1972). History of an African Rift Lake and Its
Climatic Implications Author(s). Ecological Monographs, 42(4), 499-534.
Robert, Z. H. (2009). Food Habitat Transitions in The Urban Area of Low – Income
Countries. A study on how globalization and urbanization influence food habits
among primary pupils in Babati town, Tanzania. Bachelor’s degreeThesis.
Södertörn University. Pp 55.
Roxendal, T. (ed) (2012). Designing Sustainable Wastewater. A case study at the
research farm Ceasip in Bolivia. Department of Energy and Technology,
Swedish University of Agricultural Sciences. Pp. 131.
Salafsky, N. and Wollenberg, E. (2000). Linking Livelihoods and Conservation. A
Conceptual Framework and Scale for Assessing the Integration of Human
Needs and Biodiversity. World Development. 28 (8); 1421-1438.
Sandstorm, K. (1995). The Recent Lake Babati Floods in Semi-Arid Tanzania. A
Response to Changes in Land Cover. Geografiska Annaler . 77(1/2). 35-44.

62
Seale, C, (ed) (2004) Researching Society and Culture, London. Sage publications
Ltd. 46Stephens, S. (1995), Children and the politics of culture. Rights, Risks
and Reconstructions, Princeton, NJ. Princeton University press.
Strandberg T. (2004). Sustainable development around the Lake Victoria basin. a
case study of farmer empowerment through participatory rural appraisal in the
VI Agroforestry Project Masaka/Rakai, Uganda. Master of Science Thesis,
Environmental Science Programme. Linköpings University. Pp 45.
Tolunay, A., Alkan, H., Korkmaz,M and Filizbilgin,S.(2007). Classification of
Traditional Agroforestry Practices in Turkey. International journal of Natural
and Engineering Science 1 (3).41-48.
Maltby E., van Ierland E.C. (2000). Ecological-economic analysis of wetlands.
Scientific integration for management and policy. Ecological Economics, 35.
7-23.
Turner, M., Gardner, R and Onell,R. (2011). Landscape Ecology in Theory and
Practice. New York, USA. Pp 401.
URT (2007). United Republic of Tanzania. National Wildlife Policy. Dar es Salaam,
Tanzania. Government Printer.
URT (2003). United Republic of Tanzania. National Bureau of Statistics. National
Population Census 2002. Dar es Salaam, Tanzania. Government Printer.
Wang Y, Yao Y and Ju M (2008); Wise use of wetlands. Current state of protection
and utilization of Chinese wetlands and recommendations for improvement.
Environmental Management, 41. 793–808.

63
Yanda, P.Z. and Madulu, N.F. (2005). Water resource management and biodiversity
conservation in the Eastern Rift Valley Lakes, Northen Tanzania. Physics and
Chemistry of the Earth; 30;717-725.
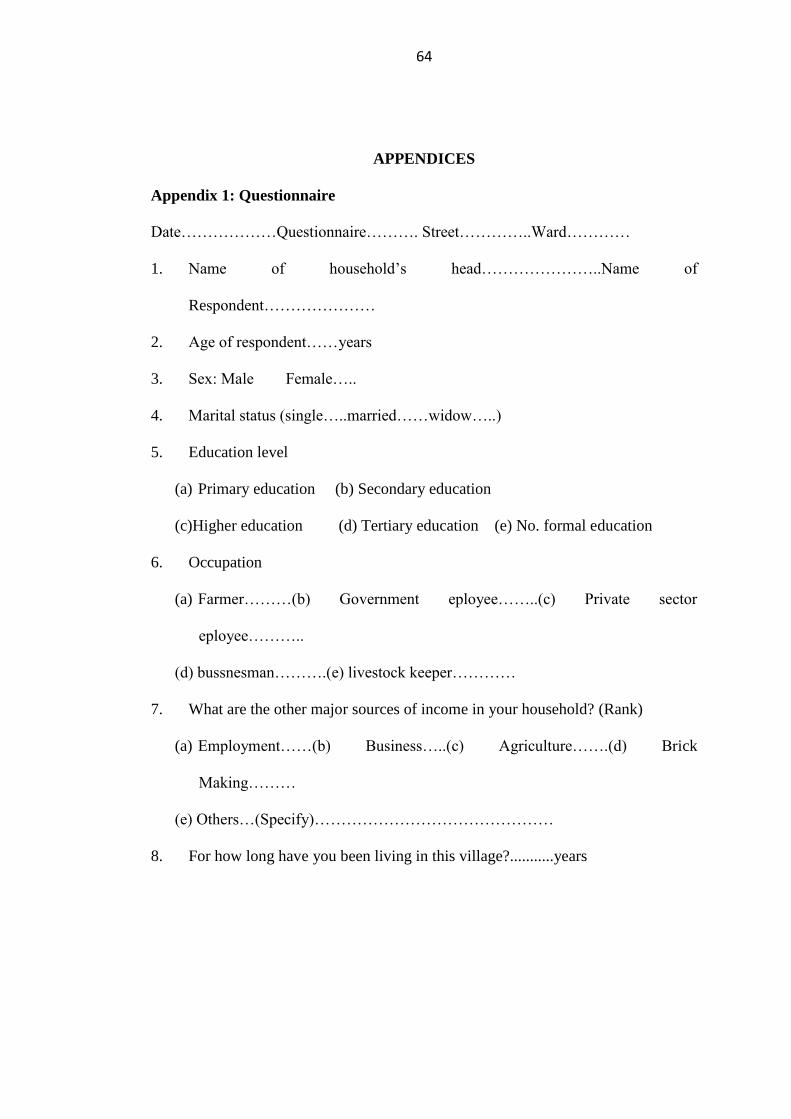
64
APPENDICES
Appendix 1: Questionnaire
Date………………Questionnaire………. Street…………..Ward…………
1. Name of household’s head…………………..Name of
Respondent…………………
2. Age of respondent……years
3. Sex: Male Female…..
4. Marital status (single…..married……widow…..)
5. Education level
(a) Primary education (b) Secondary education
(c)Higher education (d) Tertiary education (e) No. formal education
6. Occupation
(a) Farmer………(b) Government eployee……..(c) Private sector
eployee………..
(d) bussnesman……….(e) livestock keeper…………
7. What are the other major sources of income in your household? (Rank)
(a) Employment……(b) Business…..(c) Agriculture…….(d) Brick
Making………
(e) Others…(Specify)………………………………………
8. For how long have you been living in this village?...........years

65
General Question
9. Have you ever heard of the following environmental issues
S/N Env. Issue Yes No Status
1 Biodiversity
2 Habitat Destruction
3 Environmental
degradation
4 Pollution
5 Deforestation
6 Soil erosion
7 Waste Disposal
8 Over Fishing
9 Sustainable development
11. Have you ever heard of rules and regulations related to
S/N Regulation Yes NO
1 Fishing
2 Wetland management
3 Residential Development
4 Agriculture
5 Waste disposal
6 Wildlife management

66
12. how could you describe the condition of lake Babati (e.g fisheries,environment
etc) today? (a) Degraded……. (b) Not Degraded…..
13 Are by-laws for environmental conservation follwed? (a)Yes…..(b)No…….
If no, Why they not followed…………………………………………………………..
Agricultural Practices
14 (a) Do you practice agricultural activities? (i) Yes……(ii) No………...
(b) If Yes in (a) above, what is the total area of your cultivated land?..........Ha.
15.What is the distance from your farm to the lake buffer zone?..........m
16. Has the size of your cultivated land changed?
If yes has it: (i)increased……. (ii) decline……(iii)remained the same……..
17. What are the major crops grown on your farm in order of importance?
……………………………………………………………………………………….
18. Do you practice conservation agriculture? (a)Yes……(b) No……….
If yes , which conservation methods do you practice in your farm?
………………………………………………………………………………………….
.
19. (a) Did you practice integration agriculture in your area? (a) Yes…..(b) No…..
(b) Where is the source of water for irrigation activities?........................
20. Do you experience soil erosion in you farm/area? (a) Yes…….(b) No……..
21. What are the main causes of soil erosion/land degradation in your area?
………………………………………………………………………………………….
Livestock Keeping
22. Do you keep livestock? (a) Yes….. (b) No……
If yes in above, what is the number of species do you keep in your area

67
No Species No of species Source of food Source of
water
Cattle
Goat
Sheep
Pig
chicken
23. Do you practice brick making activities? (a) Yes…….(b) No…….
If yes above what is the distance is your site from the buffer zone………….m
24.Where is the source of firewood? (a) Lake Zone………(b) Non lake Zone……..
25.Do you practice fishing activities in lake Babati?
(a) Yes……(b) No……..
26. (i) is there any illegal fishing activities at lake babati? (a) Yes……(b) No……
(ii) If yes what are they?................................................................................
27. Are fishers use acceptable and sustainable Fishing gears? (a) Yes…… (b)
No……
Settlement and Urbanisation
28. do you have a building permit/ title deed of the land you own?........................
29. Where is the source of building materials
S/N Building Materials Sources
1 Stone
2 Quarry
3 Sand

68
4 Wood
5 Timber
30. how much domestic solid waste you produce per week…….kgs
31. how are you treating that solid domestic waste you produce?
…………………………………………………………………………
32. is unsustainable domestic waste disposal associated with lake babati
degradation in your
area?.....................................................................................................
33. What should be done to improve domestic waste management in your area?
…………………………………………………………………………………