the impact of price controls in two-sided markets ... card interchange fees in the united states and...
TRANSCRIPT
Finance and Economics Discussion SeriesDivisions of Research & Statistics and Monetary Affairs
Federal Reserve Board, Washington, D.C.
The Impact of Price Controls in Two-sided Markets: Evidencefrom US Debit Card Interchange Fee Regulation
Mark D. Manuszak and Krzysztof Wozniak
2017-074
Please cite this paper as:Manuszak, Mark D. and Krzysztof Wozniak (2017). “The Impact of Price Controls in Two-sided Markets: Evidence from US Debit Card Interchange Fee Regulation,” Finance andEconomics Discussion Series 2017-074. Washington: Board of Governors of the FederalReserve System, https://doi.org/10.17016/FEDS.2017.074.
NOTE: Staff working papers in the Finance and Economics Discussion Series (FEDS) are preliminarymaterials circulated to stimulate discussion and critical comment. The analysis and conclusions set forthare those of the authors and do not indicate concurrence by other members of the research staff or theBoard of Governors. References in publications to the Finance and Economics Discussion Series (other thanacknowledgement) should be cleared with the author(s) to protect the tentative character of these papers.

The Impact of Price Controls in Two-sided Markets:
Evidence from US Debit Card Interchange Fee
Regulation
Mark D. Manuszak and Krzysztof Wozniak∗
Abstract
We study the pricing of deposit accounts following a regulation that cappeddebit card interchange fees in the United States and provide the first empiricalinvestigation of the link between interchange fees and granular deposit accountprices. This link is broadly predicted by the theoretical literature on two-sidedmarkets, but the nature and magnitude of price changes are key empirical is-sues. To examine the ways that banks adjusted their account prices in responseto the regulatory cap on interchange fees, we exploit the cap’s differential ap-plicability across banks and account types, while accounting for equilibriumspillover effects on banks exempt from the cap. Our results show that bankssubject to the cap raised checking account prices by decreasing the availabilityof free accounts, raising monthly fees, and increasing minimum balance require-ments, with different adjustment across account types. We also find that banksexempt from the cap adjusted prices as a competitive response to price changesmade by regulated banks. Not accounting for such competitive responses un-derestimates the policy’s impact on the market, for both banks subject to thecap and those exempt from it.
∗Manuszak: Federal Reserve Board, [email protected]. Wozniak: Federal ReserveBoard, [email protected]. For comments and suggestions, we thank Wilko Bolt, JakubGorka, Jacob Gramlich, seminar participants at the Federal Reserve Board, and conference partici-pants at the Federal Reserve Bank of Richmond, the Deutsche Bundesbank, and De NederlandscheBank. Matthew Chen, Daniel Ebanks, Alex Spitz, and Daniel Nikolic provided outstanding researchassistance. All remaining errors are our own. The views expressed are those of the authors and donot necessarily reflect those of the Board of Governors of the Federal Reserve System, its staff, oranyone else associated with the Federal Reserve System.
1
I. Introduction
In a two-sided market, two groups of agents interact on a “platform,” and each group’s
welfare depends on the size of the other group. The theoretical literature predicts
that successful platforms may require transfers between the two groups in order to
promote participation on both sides of the market. However, the literature is not able
to provide a definite answer as to the optimal size of these payments, or even their
optimal direction in some cases, which makes the practical implementation of such
payments a potential source of controversy.
Such is the case for interchange fees and payment cards, which are often cited as a
canonical example of a two-sided market (Rochet and Tirole, 2006). Interchange fees,
paid by a merchant’s bank to a cardholder’s bank for each payment card transaction,
have long been controversial, with merchants arguing that their high level was inflating
their card transaction costs. A provision of the Dodd-Frank Wall Street Reform and
Consumer Protection Act of 2010, known as the Durbin Amendment, addressed this
controversy by instructing the Federal Reserve Board to draft regulations related to
debit card interchange fees. The resulting regulation, known as Regulation II or Reg
II, went into effect on October 1, 2011, and imposed a cap that effectively halved the
interchange fee for domestic debit card transactions involving banks that account for
the vast majority of transactions.1
During the rule-writing process, much of the debate over Reg II among inter-
ested parties concerned the potential impact of interchange fee regulation on prices
faced by cardholders, which were less well-understood than the link between inter-
change fees and merchant transaction costs that motivated the Durbin Amendment.
1 All types of depository institutions, including banks, savings institutions, and credit unions,are potentially subject to Reg II’s interchange fee cap. We use the term “bank” to refer to anytype of depository institution.
2
In the months preceding the regulation’s effective date, many market participants
and industry observers predicted that card-issuing banks would look to mitigate lost
interchange revenue through higher fees to accountholders, prompting headlines such
as “Bankers Should Call Every New Charge a ‘Durbin Fee’” in trade publications.2
Such a possibility is emphasized in the theoretical literature on payment cards as a
two-sided market (Baxter, 1983; Rochet and Tirole, 2002), which stresses that inter-
change fees alter revenue streams for card-issuing banks, who could adjust cardholder
terms and fees accordingly.3
Notwithstanding this theoretical link, the magnitude and form of adjustments
to cardholder fees, if any, are key empirical questions. Recent papers, including
Carbo Valverde, Chakravorti and Rodriguez Fernandez (2016), Kay, Manuszak and
Vojtech (2014), Wang, Schwartz and Mitchell (2014), and Evans, Chang and Joyce
(2015), provide empirical evidence of some effects of interchange fees in payment card
markets. However, none of these studies consider changes in specific account terms
and fees in response to interchange fee declines. As the debate over Reg II suggests,
these end-user fees are arguably a crucial item of interest when considering regulation
of payment cards or, more generally, two-sided markets.4
In this paper, we examine changes in account terms and fees in response to the
interchange fee caps under Reg II.5 We take advantage of a notable aspect of the
statute and resulting regulation, namely that banks with less than $10 billion in
2 American Banker, June 30, 2011.3 See Rysman and Wright (2014) for a summary.4 In recent years, a nascent empirical literature (for example, Kaiser and Wright, 2006; Jeziorski,
2014; Gentzkow, Shapiro and Sinkinson, 2014) has looked to estimate models of two-sidedmarkets and examine the theory’s predictions. This empirical work has complemented thecontinued growth of the theoretical literature on two-sided markets since the early summary ofRochet and Tirole (2006).
5 Our analysis of the granular implications of interchange fee restrictions for cardholder fees issimilar to Agarwal, Chomsisengphet and Mahoney (2015), who consider whether restrictionson credit card fees under the CARD Act altered other terms for credit cards, and to paperstesting the “waterbed effect” in mobile telephony (for example, Genakos and Valletti, 2011).
3

consolidated assets are exempt from the interchange fee cap. This exogenous variation
allows us to compare the pricing behavior of banks subject to the cap (“covered
banks”) to that of banks not subject to the cap (“exempt banks”) in order to separate
the response to Reg II from other contemporaneous factors.
A further key feature of this paper is that we account for equilibrium effects under
which exempt banks may adjust their pricing in response to price changes by covered
rivals.6 The possibility of equilibrium effects introduces an important consideration
for predicting and evaluating a regulation’s effect, namely that, in a competitive mar-
ket, an intervention may have an impact that goes beyond the targeted institutions.
Moreover, failure to account for these effects would not only disregard the impact
of the treatment on the non-treated, but would also yield biased estimates of the
treatment effect on the treated, as our empirical results ultimately show. To ac-
count for these effects, we exploit variation across exempt banks in their exposure to
competition from covered banks. This approach builds on that used in papers such
as Miguel and Kremer (2004) and Angelucci and De Giorgi (2009), but offers more
flexibility when the program design prevents clean separation of untreated units into
those exposed and unexposed to treated units.
We use a uniquely detailed panel data set of bank-level pricing that captures
multiple terms and fees across various account types, and we estimate how those
terms and fees responded to the regulation. The richness of our data allows us to
consider price adjustment in multiple dimensions, as well as to examine heterogeneity
in responses across account types. In addition, we ensure that other shocks correlated
with bank size are not biasing our results by comparing price changes for checking
6 This concern reflects the broader possibility of spillover effects of treatment. Such effects cantake many forms, from externalities to equilibrium pricing effects, and have been consider inmany applications in the economics literature on program evaluation (Angelucci and Di Maro,2015).
4

accounts with changes for savings accounts, the latter of which typically do not include
debit cards that would be affected by a cap on interchange fees. Finally, we account
for the possibility that bank responses may have anticipated or lagged the regulation’s
effective date.
Our empirical results broadly indicate that, in response to Reg II, covered banks
changed various account terms and fees in ways that increased prices for accounthold-
ers. In our most general specification, we find that covered banks were 35.2 percent
less likely after the regulation to offer noninterest checking accounts that did not in-
volve a monthly fee (that is, “free accounts”). This result suggests that, absent Reg
II, 65.2 percent of noninterest checking accounts offered by covered banks would have
been “free,” compared with the actual post-implementation figure of 30.0 percent.
Next, we find that, on average, covered banks raised monthly fees on noninterest
and interest checking accounts by $1.34 (or 20 percent) and $2.02 (or 17 percent),
respectively. These increases were large enough to fully recoup lost interchange fee
revenues for noninterest and interest checking accounts with five and eight $40 debit
card transactions per month, respectively.
Finally, we find that covered banks made it more difficult for accountholders to
avoid paying monthly fees; the average minimum balance to avoid a monthly fee
increased by over $400 (or 50 percent) for noninterest checking accounts, and by
nearly $1,700 (or 55 percent) for interest checking accounts. The nonlinear pricing
response suggests that consumer price sensitivity differs substantially between terms
and fees, as well as across different account types.
Our results further show that, depending on their competitive exposure to cov-
ered banks, exempt banks also raised their prices, although the magnitude of their
responses was generally lower than those of covered banks. For example, our re-
sults suggest that exempt banks fully exposed to competition from covered banks
5
would reduce the availability of free noninterest checking accounts 15.5 percent, com-
pared with a reduction of 35.2 percent for covered banks. We also underestimate the
responses of covered banks when we do not account for equilibrium pricing effects.
These findings provide direct evidence of equilibrium pricing effects in an oligopolistic
market and underscore the importance of these effects when considering the impact
of a policy such as Reg II.
II. Background
Debit cards facilitate the electronic transfer of funds from a consumer’s deposit ac-
count at a bank to a merchant’s deposit account in exchange for goods and services.7
Card-issuing banks provide deposit accounts, debit cards, and other account services
to consumers, while acquiring banks provide accounts and transaction-processing ser-
vices to merchants. Card networks, such as Visa, MasterCard, Star, or NYCE, provide
infrastructure and services to exchange information and funds between issuing and ac-
quiring banks. Networks also establish various rules and terms associated with card
acceptance and the conduct of transactions, including certain fees for cardholders’
banks (issuers) and merchants’ banks (acquirers).
The largest network-determined fees by aggregate value are interchange fees, which
acquirers pay to issuers on a per-transaction basis. In 2009, before Reg II, acquir-
ers paid issuers more than $16 billion in debit card interchange fees on 37.6 billion
card transactions, or roughly 43 cents per transaction (Federal Reserve Board, 2011).
Because acquirers generally pass these fees to merchants, they serve to increase mer-
chants’ costs of payment card transactions, causing interchange fees to be highly
controversial and leading to substantial acrimony and litigation between merchants
7 Prager et al. (2009) discuss the structure and operation of payment card networks. Hayashi,Sullivan and Weiner (2003) provide a detailed description of the debit card industry.
6
on one side and payment card networks and banks on the other.8
The Durbin Amendment to the Dodd-Frank Act proposed a regulatory solution to
merchant concerns about their costs of debit card transactions. Among other things,
the amendment instructed the Federal Reserve Board to write regulations to establish
“standards for assessing” whether debit card interchange fees are “reasonable and
proportional to the cost incurred by the issuer with respect to the transaction.”9 To
implement the amendment, the Board issued Reg II in June 2011, after receiving more
than 10,000 public comments on a proposed regulation. Under the regulation, debit
card interchange fees paid to certain issuers cannot exceed 21 cents per transaction
plus 0.05 percent of the transaction value with an effective date of October 1, 2011.
For an average $40 debit card transaction, this results in a maximum interchange fee
of 23 cents, a substantial cut from the pre-regulation fee.10
Reg II contains various exemptions from the interchange fee cap. For our purposes,
the relevant exemption is based on bank size. Per explicit instructions in the Durbin
Amendment, the cap does not apply to banks with consolidated assets below $10
billion. This exemption was introduced to prevent declines in interchange revenue for
small banks, but the rationale behind the specific threshold of $10 billion is unclear.11
For our analysis, this exemption creates one group of banks that is subject to a
8 Wildfang and Marth (2006) summarize historical litigation related to payment cards, muchof which concerns credit cards. As Hayashi and Maniff (2014) describe, central banks andcompetition authorities in various countries have intervened in payment card markets, oftenthrough interchange fee caps.
9 Hayashi (2012) and Hayashi (2013) discuss the Durbin Amendment and Reg II in more detail.10 The regulation includes a one cent increase in the base cap for fraud-prevention costs incurred
by issuers who meet certain fraud-prevention standards.11 In a letter to other lawmakers (Durbin, 2010), the amendment’s sponsor stated that the ex-
emption would cover “99% of all banks and credit unions” who “would not lose any interchangerevenues that they currently receive,” thereby “preserving the ability of small banks and creditunions to compete with big banks in issuing cards.” Before Reg II, the same interchange feeschedules applied to all banks, and one issue was whether networks would apply the cap toexempt banks. All networks have since established tiered fee schedules with no material changein average interchange fees for exempt banks (Federal Reserve Board, 2011).
7

limitation on interchange fees and another group that is not.
Account types also vary in the extent to which they involve debit cards and, thus,
are affected by Reg II’s interchange fee cap. For checking accounts, debit cards are
a core service; the ability to access funds easily for purchases and withdrawals is an
important feature of such accounts. In contrast, debit cards are typically not issued
for savings accounts, and interchange income is generally a negligible component of
revenue associated with these accounts. Although a savings account may include a
card that permits ATM access and point-of-sale transactions, this practice is uncom-
mon because of regulations that limit transactions and withdrawals for nontransaction
accounts.12 Consequently, through its regulation of a fee associated primarily with
checking accounts, Reg II also has differential applicability across account types for
covered banks.
Interchange fees play a central role in theoretical models of payment card networks,
which emphasize the card market’s two-sided nature (for example, Rochet and Tirole
(2002)). On one side of the market, interchange fees alter acquirers’ costs, influencing
the transaction fees they charge merchants. On the other side of the market, inter-
change fees provide a source of revenue that defrays issuers’ costs of card services
for accountholders, and, thus, influence fees that banks charge accountholders. As a
result, these theoretical models broadly predict that a reduction in interchange fees
will induce issuers to increase prices for accountholders.13
However, theoretical models of two-sided markets rely on an overly simple char-
12 Regulation D requires that a “savings deposit” account for purposes of reserve requirementspermit no more than six “convenient” transfers or withdrawals per month, whether by check,debit card, or similar order.
13 Much of the theoretical literature concerns the implications of interchange fees for the efficiencyof merchant and consumer decisions about card acceptance and usage. This literature generallyconcludes that interchange fees can internalize externalities across the two sets of end users, butthat privately set interchange fees may diverge from the social optimum. See Verdier (2011) orRysman and Wright (2014).
8
acterization of issuers, which diverges from reality in three important ways. First,
issuers use nonlinear, account-based pricing rather than per-transaction fees typically
assumed by the theory but rarely observed in reality. The theoretical literature on
nonlinear pricing emphasizes the sensitivity of consumer demand to different price
components. For the debit card industry, it predicts that higher costs will result in
increases in prices for which consumers’ demand is less sensitive, and lower or no rises
in prices to which the demand is more sensitive.
Second, issuers are multiproduct firms, cross-selling a variety of products in addi-
tion to card transactions. The theoretical literature on multiproduct pricing predicts
that a firm’s price for one good will internalize its impact on the demand for the
firm’s other products. In the debit card industry, this implies that, since a bank is
best positioned to offer additional services to consumers who are already its accoun-
tholders, the price for such an account is less likely to reflect higher costs than it
would otherwise.
Finally, issuers are heterogeneous firms, subject to idiosyncratic cost shocks based
on their status under the regulation, and compete for customers in the market for
banking services. An issuer’s prices are not determined in isolation by its costs and
the market demand, but rather jointly with other issuers’ prices. In a simple Cournot
setting, there is a single market price determined jointly by the market demand
function, as well as all firms’ cost functions. In more general models of oligopolistic
competition, each firm can set its own price, but such a price is still dependent on
those set by competitors. The implication for our analysis is that, for the debit card
industry where issuers compete in an oligopolistic fashion, we need to recognize that
prices set by covered issuers influence those set by their exempt competitors and,
hence, the regulatory shock to covered issuers and their prices may influence the
pricing of exempt banks.
9

III. Data
Our primary data come from RateWatch, a consultancy that specializes in the retail
banking industry. To provide information about pricing conditions, RateWatch con-
ducts periodic surveys of terms, fees, and interest rates for various loan and deposit
account products at individual branches of commercial banks, savings institutions,
and credit unions across the country. For account terms and fees, RateWatch typi-
cally surveys a sample of branches for each bank twice a year, with variation in the
precise timing of data collection across branches.14 The resulting data set is one of the
most detailed data sources on terms, fees, and rates for individual products, banks,
and geographical markets.
RateWatch bases its branch sample on client requests for information and analysis
about certain geographic markets. As such, the surveys are neither a random sample
of branches nor a comprehensive census. However, selection bias associated with
inclusion in the sample is mitigated by the fact that, once RateWatch surveys a
branch, it continues to collect information from that branch even absent data requests.
III.A. Sample and variable construction
We aggregate the data to the bank-quarter level by averaging each bank’s branch-level
observations in a given quarter.15 Aggregation to the bank level reflects an assumption
that strategic pricing responses to a broadly applicable regulation, such as Reg II,
occur at the bank level. In turn, aggregation by quarters smooths variation in data
collection times to yield a balanced panel data set, while providing observations at
14 This observation frequency differs from the weekly frequency of other data that RateWatchtracks, such as loan rates. This difference reflects the infrequency of changes in account termsand fees compared with changes in rates.
15 More precisely, we aggregate the branch-level data to the level of bank holding companies.
10
intervals around the effective date.
In our analysis, we look at pricing information for three deposit account products:
noninterest checking, interest checking, and savings. We focus on these account types
for a number of reasons. First, most banks offer these accounts, allowing RateWatch
to achieve extensive coverage of them. Second, each product type is largely standard-
ized, which permits comparison of a core set of terms and fees across banks. Finally,
as discussed in the previous section, Reg II affects checking and savings accounts
differently, which provides a source of identification in our model.
For each product, we use information on four basic terms and fees that RateWatch
tracks.16 First, we consider whether an account is free of a monthly fee (FreeAccount).
Next, for banks that charge a monthly fee, we use information about the fee size
(MonthlyFee). We further consider whether an accountholder can avoid the fee by
maintaining a minimum account balance (AvoidFee).17 Finally, for banks that allow
an accountholder to avoid the fee through a minimum balance, we include the balance
required to do so (MinBalance).
We do not observe per-transaction fees that banks could use to directly offset de-
creased interchange revenue for accounts that involve debit cards; however, anecdotal
evidence suggests these fees are rarely used. In addition, while we do not observe
debit card rewards that banks could also cut, data collected by the Board suggest
covered banks spent only a small portion of what they collected in interchange fees
on reward programs pre-Reg II.18
16 RateWatch requests information for accounts that a bank offers at the time of the survey. Theseterms and fees apply to new accounts and can apply to existing accounts if the bank providescustomers with 30 days advance notice about changes in terms and fees.
17 We do not have information about alternative ways that some banks may provide to avoid amonthly fee, such as having at least one direct deposit (for example, a paycheck). Althoughsome banks report this information in comment fields, RateWatch does not collect it as a regulardata element. If banks removed these account features after Reg II, our estimates will be alower bound on the regulation’s effect on the ability of accountholders to avoid fees.
18 In 2011, the average per-transaction cost of debit card reward programs for covered banks was
11

We combine the data on account terms and fees with information about a bank’s
status under Reg II.19 The vast majority of variation comes from the regulation’s
initial implementation. A small number of banks experience a status change in sub-
sequent years, and we account for the timing of those changes under the regulation.20
Our analysis of equilibrium pricing effects requires a measure of how strongly an
exempt bank competes with covered banks for retail customers. We construct such
a metric, called Exposure, using data on all banks, their branches, and the deposits
held at those branches from the FDIC’s Summary of Deposits (SOD).21 We combine
this information with geographic retail banking market definitions established by the
Federal Reserve for purposes of evaluating bank mergers.22 For every exempt bank,
we consider each retail banking market in which that bank operates and calculate
the percentage of total deposits in the market held at branches owned by covered
banks. We then average this percentage across all markets in which the exempt bank
is present, weighted by the fraction of its total deposits in each market. The Exposure
variable thus calculated is then merged with our main data set. In the Appendix, we
consider an alternative exposure measure based on number of branches rather than
deposits.
The final data set in our analysis is a panel of quarterly bank-level observations
from Q1 2009 through Q2 2014. This time frame corresponds to 11 quarters before
three cents (Federal Reserve Board, 2013).19 The Board releases lists of bank status under Reg II at
http://www.federalreserve.gov/paymentsystems/regii-interchange-fee-standards.htm.20 For the over 5,500 banks in our data, we observe six changes from exempt to covered status
and three changes from covered to exempt status over the years 2012 – 2014.21 The SOD reports branch-level deposits for all FDIC-insured institutions, but excludes credit
unions. Because we cannot compute Exposure for credit unions, we drop a small number ofcredit union observations from the regressions that include Exposure. We further do not includecredit unions in the Exposure variable for banks, which would tend to overstate Exposure giventhat nearly all credit unions are exempt from Reg II.
22 Banking market definitions are available athttps : //www.federalreserve.gov/bankinforeg/afi/market info.htm.
12
and 11 quarters after Reg II’s effective date.
III.B. Summary Statistics
Figure I illustrates the data’s coverage in terms of banks and total deposits for the
U.S. retail banking market as reported in the SOD. The data capture 50 percent of
covered banks and 66 percent of exempt banks, accounting for 83 percent of total
deposits for both categories. The figure also illustrates that, because of the skewed
asset size distribution across banks, our data include far fewer covered than exempt
banks, although the covered banks account for a large fraction of total deposits.
Table I provides sample means for each outcome variable, broken out by issuer
status under the regulation, account type, and pre/post-Reg II period.23 Figure II
further depicts average values of the variables by quarter, with Reg II’s effective date
noted by the vertical line at date 0.
Table I and Figure II illustrate several notable features of the data. First, different
account types exhibit substantial differences in terms and fees. Second, in many
cases, terms and fees for a given account type differ substantially between covered
and exempt banks. Third, while most of the data series are relatively stable, a few
exhibit pronounced changes over the sample period.
In addition, Figure II previews some main findings from our subsequent analysis.
In particular, Figure II.A shows that the percentage of covered banks offering free
noninterest checking accounts decreased substantially around the time Reg II was
introduced, with a possible leading effect in anticipation of the rule change, while the
corresponding percentage for exempt banks did not change substantially. Figure II.C
indicates that, compared with exempt banks, the percentage of covered banks offering
23 To categorize banks before the regulation’s effective date, we use each bank’s status at theeffective date.
13
their customers the chance to avoid a monthly fee on their noninterest checking ac-
counts decreased following Reg II’s introduction. Finally, Figure II.D illustrates that
the average balance to avoid a monthly fee on interest checking accounts increased
substantially for covered banks compared with exempt banks after the regulation.
Table II provides summary statistics for the Exposure variable, our measure of
how strongly an exempt bank competes with covered banks for retail customers. By
construction, this variable is bounded by [0,1), and Table II shows that the data con-
tain exempt banks that are highly exposed to covered banks, as well as exempt banks
that are completely insulated from them. In other analyses of indirect treatment ef-
fects (for example, Miguel and Kremer, 2004), extreme cases of exposure would serve
to identify indirect effects. Indeed, measures of indirect exposure are typically limited
to those two cases. However, reflecting heterogeneity in local competitive conditions
for retail banking, the vast majority of observations in our data fall between these
extremes with a great deal of variation in the Exposure variable.
IV. Empirical Analysis
IV.A. Modeling approach
To investigate deposit account pricing, it is useful to consider how the different ac-
count terms and fees jointly determine FeeE, the monthly fee that a bank can expect
to collect from an accountholder, conditional on its fee structure:
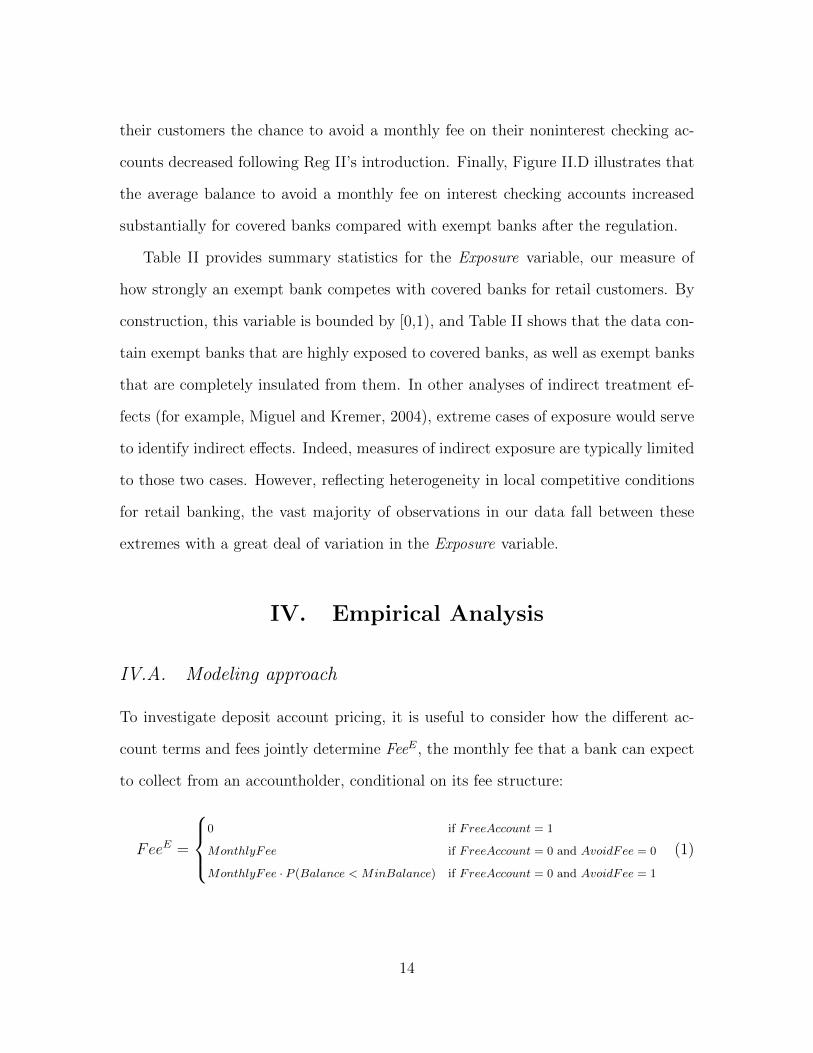
FeeE =
0 if FreeAccount = 1
MonthlyFee if FreeAccount = 0 and AvoidFee = 0
MonthlyFee · P (Balance < MinBalance) if FreeAccount = 0 and AvoidFee = 1
(1)
14
where P(Balance < MinBalance) is the probability that a customer’s average monthly
balance is below the minimum balance to avoid the monthly fee. In our analysis, we
focus on each of the four term and fee variables directly, an approach which allows us
to examine specific mechanisms by which banks adjust their pricing. A bank could
alter the fee income from its accounts by adjusting any of the four variables (or some
combination of them) for which we have data. In particular, a bank could impose
a fee on a previously free account or raise the monthly fee on accounts with a pre-
existing fee. Alternatively, a bank could increase the minimum balance to avoid a fee,
thereby increasing the likelihood that an accountholder would be subject to the fee.
The extent to which banks utilize some channels over others will provide information
about consumer sensitivity to the different dimensions of account pricing.
An alternative approach could be to model and analyze FeeE. However, that
approach would require knowledge of Balance across consumers, which we do not
observe. Such an approach would not necessarily provide more insight into banks’
pricing reactions to Reg II, but could shed light on the response of account balances to
changes in minimum balance requirements, as well as the revenue effects of the price
changes for the banks. While these various issues are important, and the variation in
terms and fees and subsequent accountholder behavior induced by Reg II may be a
useful environment to examine them, they are beyond this paper’s scope.
IV.B. Econometric specification and identification strategy
In our empirical analysis, we estimate separate fixed effects regressions for each of
the four outcome variables: FreeAccount, MonthlyFee, AvoidFee, and MinBalance.
We exploit the panel structure of our data set and the existence of multiple account
15
types to separate the regulation’s effects from other forms of pricing heterogeneity.
Specifically, for account types a ∈ {noninterest checking, interest checking, savings},
bank i, and time period t, we consider a regression of the form
yait = γai + θat + λit + βawait + δaf(cait) + βlaga wlagait + δlaga f(clagait ) + εait (2)
where yait is an outcome variable for product a at bank i in time t, wait is an account
type-specific indicator for the two checking account products at covered banks in the
post-Reg II period, cait is the measure of competitive exposure to covered banks for
checking accounts at exempt banks in the post-Reg II period, f(·) is a monotonic, well-
behaved function (described later), wlagait and clagait are leading and lagging terms that
correspond to wait and cait, respectively, and εait are unobserved factors that influence
the pricing of product a at bank i in time t.24 The focus of our analysis will be on
the coefficient βa, which measures the long-run pricing response of type a checking
accounts at covered banks to Reg II, as well as the coefficient δa, which measures the
exempt banks’ equilibrium pricing response for type a checking accounts.25
This econometric specification allows identification of Reg II’s impact on bank
pricing to come from two sources. First, we compare banks covered by the regulation
with banks exempt from it, which allows us to separate the regulation’s effect from
general time-specific factors that may have coincided with the regulation and affected
24 In other words, recalling that bank status is based on the $10 billion asset threshold and lettingT ∗ be the effective date of the regulation, wait = 1(a = checking)·1(Assetsit ≥ $10billion)·1(t
≥ T ∗), cait = 1(a = checking)·1(Assetsit < $10billion)·1(t ≥ T ∗)· Exposureit, wlagait = 1(a =
checking)·1(Assetsit ≥ $10billion)·1(|t - T ∗| ≤ N lag) and clagait=1(a = checking)·1(Assetsit <$10billion)·1(|t - T ∗| ≤ N lag)·Exposureit, where N lag is the number of periods forward/backin time for which we include lagging/leading terms, Assetsit are bank i ’s consolidated assetsat time t, and Exposureit is the exposure to competition from covered banks faced by bank iin time t. In our estimation, we allow the responses to differ across the two types of checkingaccounts, and the actual variables reflect this distinction.
25 Any additional bank-specific characteristics would be perfectly collinear with the fixed effectsin our regressions.
16

pricing of all banks, as captured by θat. Our ability to perform this comparison based
on an exogenous feature of the regulatory environment contrasts with evaluation of
interchange fee regulation in other jurisdictions, such as Australia or the European
Union. In those cases, broad applicability of interchange fee regulation prevents sep-
aration of the regulation’s effect from other contemporaneous factors (Chang, Evans
and Garcia Swartz, 2005; Hayes, 2007).
Second, we compare checking accounts, which involve debit cards and were directly
affected by the regulation, with savings accounts, which typically do not involve
debit cards and we assume were not affected. Doing so allows us to introduce bank-
time period fixed effects, λit, that account for any time-specific shocks that may
be correlated with bank size and, thus, status under the regulation. For example,
it addresses the concern that the financial crisis or regulatory pressures may have
affected large banks differently than small banks, influencing their pricing irrespective
of Reg II.26
We could alternatively focus on covered banks and exploit the regulation’s dif-
ferent applicability across checking and savings accounts at those banks. Although
we provide estimates based on this identification strategy, it does not allow us to
account for all of the heterogeneity in our full model. In particular, it leaves open the
possibility that certain account types were affected by time-specific shocks unrelated
to Reg II.27
In addition to capturing the direct response of covered banks, the econometric
26 We could address this concern by considering banks with assets in a window around the $10billion threshold. However, such a window would need to be fairly wide in order to have enoughobservations to avoid losing too much power.
27 For example, in 2009, the Board amended Regulation E to prohibit all financial institutionsfrom charging fees for overdrafts unless a consumer opts in to an overdraft service. Thischange, which became effective on July 1, 2010, would have largely affected overdraft revenuefor checking accounts and could have influenced checking account pricing around the same timeas Reg II.
17
specification also captures its impact on pricing at exempt banks through equilibrium
pricing effects. Ignoring such effects would not only fail to capture the regulation’s
impact on exempt banks but would also bias our estimates related to covered banks.
As noted in our discussion of the data, following Miguel and Kremer (2004), among
others, we could envision dividing exempt banks into those that compete with covered
banks and those that do not. The regulation’s impact on the former would reflect
equilibrium pricing effects, while the latter would become the “clean” control group.
However, competition between banks does not lend itself to such a clear division,
because most exempt banks compete with covered banks to some degree. Instead,
the covariate f(cait) builds on the variable Exposure, which captures how intensely a
given exempt bank competes with covered banks on a continuous [0,1) scale, with 0
signifying complete isolation from covered banks and a value close to 1 representing
a situation in which all of a bank’s competitors are covered by Reg II. Initial analysis
indicated that it is important to allow for nonlinearity in the effect of Exposure,
with much of the effect arising at relatively low levels of exposure and diminishing
effects at higher levels. Various functional forms of the f(·) function can incorporate
such nonlinearity, and our primary results employ the cubed root function. In the
Appendix, we consider a number of alternative functional forms for the f(·) function.
A number of assumptions, in addition to functional form assumptions, underlie
identification of the regulation’s effects. First, we require that exempt banks not
be directly influenced by the regulation, but only experience equilibrium pricing re-
sponses because of their competitive exposure to covered banks. Second, the analysis
assumes that the Reg II “treatment” is exogenous, which requires that banks not
adjust their assets in order to avoid being covered by the regulation. As noted in
our discussion of the data, we see very few banks make any transition around the
threshold, and more move above it than shrink below. In addition, Kay, Manuszak
18
and Vojtech (2014) find no evidence that banks systematically altered their assets in
the period around Reg II. Finally, we require that Reg II not affect the pricing of sav-
ings accounts, which experience the same unrelated shocks to pricing, λit, as checking
accounts. If re-optimization of pricing occurred across a bank’s entire product line in
response to Reg II, or if competition in savings led to different responses to non-Reg
II shocks for large banks, then estimates based on the comparison between checking
and savings accounts could be biased.
We analyze the binary variables FreeAccount and AvoidFee using a linear proba-
bility model, rather than a nonlinear logit or probit model.28 We use this approach
because, unlike in a nonlinear binary outcome model, a linear probability model al-
lows us to easily incorporate a rich set of fixed effects. Not only would a nonlinear
binary outcome model with fixed effects be difficult to estimate computationally, we
would also face the “incidental parameters problem” (Lancaster, 2000) that could
result in biased estimates. Importantly, our application avoids the main drawback of
linear probability models, namely that they can generate predicted outcomes outside
of [0,1] for some values of the explanatory variable. Our main regressor – status under
the regulation – is binary, so we are effectively comparing averages for observations
in cells corresponding to different status under the regulation (and different time pe-
riods). The regressions with the continuous Exposure metric do not involve simple
cell averages, but the regressor based on that variable is bounded between 0 and 1 by
construction, so that the predicted outcomes would be as well.29
28 In theory, because these variables are averages across a bank’s branches, they could take valuesother than zero or one. In practice, this is exceedingly rare, but a linear probability modelallows us to incorporate these unusual observations.
29 The linear probability model also generates heteroskedastic errors. We address this issue byusing standard errors, clustered at the bank level, that are robust to arbitrary heteroscedasticity.
19
V. Regression Results
Our results are presented in Table III. In these regressions, an observation is a bank-
quarter, with each dependent variable reflecting the average value across all branches
sampled in a quarter for a given bank. We perform the analysis separately for each
outcome variable, with the dependent variable capturing the term or fee for each
account type. The results for each variable comprise the four panels in Table III.
Turning to the columns in Table III, the specifications differ in their underly-
ing identification strategies and whether they account for equilibrium pricing effects
or leading and lagged responses. Columns (1) and (2) represent simple “difference-
in-difference” specifications with column (1) including only information on checking
accounts at covered and exempt banks and column (2) considering checking and sav-
ings accounts only at covered banks. Column (3) is a “triple-difference” specification
that combines these identification strategies, and column (4) adds two-period leading
and lagging terms. Column (5) then builds on column (3), adding covariates that
capture equilibrium pricing effects. The final two columns further add two-period
leading and lagging terms for only covered banks (in column (6)) and for both cov-
ered and exempt banks (in column (7)). This last column corresponds to the full
regression model in the previous section.
V.A. Did banks covered by Reg II raise prices?
The estimates from all specifications broadly provide evidence that Reg II resulted in
covered banks increasing prices on affected accounts in an attempt to recover revenue
lost due to lower interchange fees. Specifically, the signs of almost all statistically
significant coefficients are consistent with higher expected fees for accountholders:
20

lower availability of free accounts, higher monthly fees, lower likelihood that the
monthly fee could be avoided, and a higher minimum balance to avoid the fee. The
exact manner in which these different terms and fees changed across account types is
analyzed in the following section.
Analyzing columns (1) and (2), we find that even the simple “difference-in-differ-
ence” approach allows for meaningful identification of Reg II’s impact on the depen-
dent variables. The estimated coefficients have broadly similar values for the two
columns, which suggests that each identification strategy is reasonably successful at
identifying the true value of the coefficients. Comparing columns (1) and (2) with
column (3), we find that employing both identification strategies generates coefficient
estimates which are mostly closer to those in column (1) than in column (2). Under
the assumption that a bank’s coverage status did not influence its pricing on savings
accounts following Reg II, this suggests that any shocks to covered banks that were
contemporaneous with the regulation were relatively less important compared with
the effect of the regulation itself. In other words, checking account pricing at covered
banks appears primarily driven by the interchange fee restriction rather than other
factors related to the financial crisis or subsequent regulatory initiatives.
Comparing columns (3) and (4), we find that the addition of leading and lagging
terms increases the coefficient estimates for all statistically-significant coefficients.
This finding suggests that the adjustment of terms and fees following the introduction
of Reg II was not always instantaneous, but rather occurred gradually over multiple
quarters. For example, we find that the availability of “free” noninterest checking
accounts fell for covered issuers 9.2 percent and 16.9 percent, respectively, two quar-
ters and one quarter ahead of Reg II’s effective date. Intuitively, the coefficients on
these leading effects have the same sign, but smaller magnitude, than the estimated
long-term decline of 26.3 percent. The implication of this finding is twofold. First,
21
from an econometric perspective, not accounting for leading/lagging effects can result
in the underestimation of coefficients of interest. Second, from a policy perspective,
it is important to recognize that market reactions to regulations may not be fully
observed immediately when the regulation goes into effect.
V.B. Analysis of nonlinear pricing employed by banks
In addition to providing evidence that banks increased prices in response to Reg II,
Table III also documents the specific mechanisms that banks used. With respect
to the provision of free accounts, we find a large and highly significant drop in the
propensity of covered banks to offer free noninterest checking accounts. In contrast,
we find only a small and statistically insignificant decline in the provision of free
interest checking accounts. These findings reflect that, before Reg II, only 6.2 percent
of covered banks offered free interest checking accounts, compared with 51.7 percent
for noninterest checking accounts. Thus, banks imposed new monthly fees where they
were able to do so (that is, for noninterest checking accounts), but were constrained
in their ability to introduce fees where most accounts already had a monthly fee (that
is, for interest checking accounts).
Beyond the estimated decline in the provision of free noninterest checking accounts
at covered banks, our most significant results, both economically and statistically,
relate to the continuous monetary variables, MinBalance and MonthlyFee. First, cov-
ered banks increased the likelihood that consumers would be subject to a monthly
account fee by raising the minimum balance to avoid a fee for interest checking ac-
counts. Focusing on column (7), the increase of $1,694.1 for interest checking accounts
is especially economically significant given that the average checking account balance
(across all types of accounts) was around $2,000 in 2013 (Bricker et al, 2014). Cov-
22
ered banks further found it optimal to increase monthly fees; we find large and highly
significant increases in MonthlyFee for both types of accounts. To put the estimated
values in context, a monthly fee that is $1 higher would offset the lost interchange
revenue on an account used for around four debit card transactions per month given
the $0.27 decline per transaction in average interchange fees for covered banks when
the regulation took effect.
At the same time, we do not find that covered banks chose to significantly decrease
the percentage of checking accounts on which monthly fees can be avoided. According
to our estimates, covered banks were less likely to allow accountholders to avoid
fees, but the decline is statistically significant only for interest checking accounts,
and economically insignificant for both account types. These findings suggest that
consumers may be particularly averse to being forced to pay account fees, as evidenced
by the fact that, before the regulation, fees were mandatory on only around 11.8
percent and 1.2 percent of noninterest and interest checking accounts, respectively,
at covered banks. Alternatively, it is possible that banks value the ability to price
discriminate across consumers by allowing consumers with high enough balances to
avoid fees.30
Finally, the factors underlying the nonlinear price responses of covered banks to
the fall in interchange fee revenues are of interest, especially given the estimated
differences between the two types of checking accounts. Specifically, we find that, for
noninterest checking accounts, the greatest response seems to have come from a large
fall in the proportion of banks that offer free accounts, while for interest checking
accounts, the response involved a larger increase in monthly fees and the minimum
balance to avoid the monthly fee. A possible explanation is that the nonlinear price
30 Other examples of second-price price discrimination in checking accounts are described byStavins (1999).
23
responses were driven by the varying degrees to which consumer demand is sensitive to
the different terms and fees on the two account types. While answering this question
is beyond the scope of this paper, it may be an interesting research avenue to consider
in the future given the prevalence of nonlinear pricing in the retail banking industry.
V.C. Analysis of equilibrium pricing effects
The estimates from columns (5) – (7) provide evidence that banks exempt from Reg
II also raised their prices, depending on their exposure to competition from covered
banks. Focusing on column (7), the signs on all coefficients indicate that, as at
covered banks, prices increased at exempt banks facing more significant competition
from covered banks. However, the magnitude of the estimated competitive response
is generally smaller than the pricing response estimated for the covered banks. For
example, our results suggest that exempt banks fully exposed to competition from
covered banks would reduce the availability of free noninterest checking accounts
15.5 percent, compared with a reduction of 35.2 percent for covered banks. This
difference is expected, given that covered banks’ response represents both the first-
order price change as a result of lower revenues (higher costs), as well as the second-
order competitive response to price increases by exempt competitors.
From an econometric perspective, the estimates from columns (5) – (7) emphasize
the importance of accounting for equilibrium effects when analyzing the impact of a
policy that only applies to a portion of the population. First, as described above,
the policy may have an impact on the portion of the population that is not directly
affected by the policy. Second, not accounting for equilibrium effects can lead to
underestimation of the direct impact of the policy on the affected portion of the
population. This possibility is illustrated by comparing the coefficients capturing
24
Reg II’s impact on covered banks in columns (3) and (5), which are uniformly higher
in the latter specification.
These findings are also notable more broadly. From an economic perspective,
they illustrate that competition among firms may generate an industrywide response
even for a policy that only targets a specific set of firms. Such spillover effects thus
serve to magnify the pricing response by banks that was, for many, an unintended
consequence of the regulation. Their presence also suggests that policymakers need
to take a broad view of an entire industry, even when evaluating policies that directly
target only a subset of firms.
VI. Conclusion
Legislation and other actions that followed the recent financial crisis have generated
new regulations of banks and other financial institutions. Often, these regulations
have a direct impact on certain activities or firms, but may also involve consequences
for prices, firms, or markets that are not direct subjects of a regulation. These
consequences may be particularly complex in an industry, such as the industry for
payment cards and other financial services, where two-sided market considerations
are important. Moreover, in an industry where heterogeneous firms compete, as in
the banking industry, a regulation that addresses a narrow activity or set of firms
may alter the entire market equilibrium, thereby indirectly affecting firms outside the
regulation’s immediate scope.
In this paper, we focus on a particular regulation which illustrates the challenges
associated with empirically evaluating a regulation’s effect, namely the interchange
fee cap for certain debit card transactions that resulted from the Durbin Amendment
to the Dodd-Frank Act. The economic theory of interchange fees and two-sided
25
markets broadly predicts that cardholder fees may change as banks respond to a cut
in interchange fee revenue. Correspondingly, we examine terms and fees for deposit
accounts around the regulation’s effective date and find clear evidence that, in an
indirect consequence of the regulation, those variables changed in ways that increased
deposit account prices for accountholders. By focusing on individual terms and fees
we are able to accurately capture the complex ways in which financial institutions
may adjust their prices in response to a regulatory cut in revenue.
Our analysis exploits variation in the cap’s applicability across account types and
banks, including an exogenous statutory provision that clearly delineated banks into
a group subject to the interchange fee cap and another group exempt from it. Unlike
for many other regulations, including interchange fee regulations elsewhere in the
world, such variation allows us to clearly disentangle the regulation’s impact from
other factors affecting account terms and fees.
In addition, we characterize exempt banks’ competitive exposure to covered banks
and find evidence that exempt banks with greater exposure mimicked the price re-
sponses of covered banks, albeit to a lesser degree. Such equilibrium effects have
important and broad implications for empirically evaluating a regulation’s impact.
First, not accounting for equilibrium effects can lead to biased estimates of the regu-
lation’s impact on institutions it covers. Second, when evaluating the impact on the
industry as a whole, it is important to not just look at the institutions covered by the
regulation, but also at those in competition with the regulated institutions, whose
actions may be indirectly affected by the regulation.
Finally, this paper suggests avenues for future research. Bank services tend to
involve a bundle of products with complex nonlinear pricing, but analyzing the way
in which prices are set is complicated by the co-determination of all price terms at the
same time. Our analysis demonstrates how account pricing may change in response
26

to regulations that target one aspect of account services, and provides an opportunity
to investigate the reasons underlying the exact form such a price response may take.
Such research could be combined with analyzing how accountholders responded to the
changes in account terms and fees that we document. The degree to which accoun-
tholders switched banks following these price changes may provide information about
switching costs for banking services, which are often cited as an important feature of
the market. Other data sets may provide information about this consideration, and
Reg II may provide a useful exogenous shock in which to examine it. A final interest-
ing avenue of future research is to examine the pass-through of the cut in interchange
fees from acquiring banks to transaction fees for merchants (and, ultimately, retail
prices).
References
Agarwal, Sumit, Souphala Chomsisengphet, and Neale Mahoney. 2015. “Regulat-
ing Consumer Financial Products: Evidence from Credit Cards.” Quarterly Journal of
Economics, 130(1): 111–164.
Angelucci, Manuela, and Giacomo De Giorgi. 2009. “Indirect Effects of an Aid Pro-
gram: How Do Cash Transfers Affect Ineligibles’ Consumption.” American Economic
Review, 99(1): 486–508.
Angelucci, Manuela, and Vincenzo Di Maro. 2015. “Program Evaluation and Spillover
Effects.” World Bank Policy Research Working Paper No. 7243.
Baxter, William F. 1983. “Bank Interchange of Transactional Paper: Legal and Economic
Perspectives.” Journal of Law and Economics, 26(3): 541–588.
27
Board, Federal Reserve. 2011. “2009 Interchange Fee Revenue, Covered Issuer Costs,
and Covered Issuer and Merchant Fraud Losses Related to Debit Card Transactions.”
Federal Reserve Board Paper.
Board, Federal Reserve. 2013. “2011 Interchange Fee Revenue, Covered Issuer Costs,
and Covered Issuer and Merchant Fraud Losses Related to Debit Card Transactions.”
Federal Reserve Board Paper.
Bricker, Jesse, Lisa J. Dettling, Alice Henriques, Joanne W. Hsu, Kevin B.
Moore, John Stabelhaus, Jeffrey Thompson, and Richard A. Windle. 2014.
“Changes in U.S. Family Finances from 2010 to 2013: Evidence from the Survey of
Consumer Finances.” Federal Reserve Bulletin, 100(4): 1–40.
Carbo Valverde, Santiago, Sujit Chakravorti, and Francisco Rodriguez Fernan-
dez. 2016. “The role of interchange fees in two-sided markets: An empirical investigation
on payment cards.” Review of Economics and Statistics, 98(2): 367–381.
Chang, Howard, David S. Evans, and Daniel D. Garcia Swartz. 2005. “The Effect
of Regulatory Intervention in Two-Sided Markets: An Assessment of Interchange-Fee
Capping in Australia.” Review of Network Economics, 4(4): 328–358.
Durbin, Richard. 2010. “Durbin Sends Letter to Wall Street Reform Conferees on
Interchange Amendment.” Available at
http://www.durbin.senate.gov/public/index.cfm/pressreleases?ID=46431008-9a5c-464c-
a961-3156c5062a25, May 25, 2010.
Evans, David S., Howard Chang, and Steven Joyce. 2015. “The Impact of the U.S.
Debit-Card Interchange Fee Regulation on Consumer Welfare.” Journal of Competition
Law & Economics, 11(3): 23–67.
Genakos, Christos, and Tommaso Valletti. 2011. “Testing the ‘Waterbed’ Effect in
Mobile Telephony.” Journal of the European Economic Association, 9(6): 1114–1142.
28
Gentzkow, Matthew, Jesse M Shapiro, and Michael Sinkinson. 2014. “Competi-
tion and ideological diversity: Historical evidence from us newspapers.” The American
Economic Review, 104(10): 3073–3114.
Grover, Eric. 2011. “Bankers Should Call Every New Charge a ‘Durbin Fee’.” American
Banker, June 30, 2011.
Hayashi, Fumiko. 2012. “The New Debit Card Regulations: Initial Effects on Networks
and Banks.” Economic Review, 79–115.
Hayashi, Fumiko. 2013. “The New Debit Card Regulations: Effects on Merchants, Con-
sumers, and Payments System Efficiency.” Economic Review, 89–118.
Hayashi, Fumiko, and Jesse Leigh Maniff. 2014. “Interchange Fees and Network Rules:
A Shift from Antitrust Litigation to Regulatory Measures in Various Countries.” Federal
Reserve Bank of Kansas City PSR Briefing.
Hayashi, Fumiko, Richard Sullivan, and Stuart E. Weiner. 2003. “A Guide to the
ATM and Debit Card Industry.” Federal Reserve Bank of Kansas City Payments System
Research Department.
Hayes, Richard. 2007. “An Econometric Analysis of the Impact of the RBA’s Credit
Card Reforms.” submission to the Reserve Bank of Australia’s Payment System Board’s
2007-08 Review of Payment System Reforms.
Jeziorski, Przemysaw. 2014. “Effects of mergers in two-sided markets: The US radio
industry.” American Economic Journal: Microeconomics, 6(4): 35–73.
Kaiser, Ulrich, and Julian Wright. 2006. “Price structure in two-sided markets: Ev-
idence from the magazine industry.” International Journal of Industrial Organization,
24(1): 1–28.
29

Kay, Benjamin S., Mark D. Manuszak, and Cindy M. Vojtech. 2014. “Bank Prof-
itability and Debit Card Interchange Regulation: Bank Responses to the Durbin Amend-
ment.” Finance and Economics Discussion Series, 2014-77.
Lancaster, Troy. 2000. “The incidental parameter problem since 1948.” Journal of Econo-
metrics, 95(2): 391–413.
Miguel, Edward, and Michael Kremer. 2004. “Worms: Identifying Impacts on Educa-
tion and Health in the Presence of Treatment Externalities.” Econometrica, 72(1): 159–
217.
Prager, Robin A., Mark D. Manuszak, Elizabeth K. Kiser, and Ron
Borzekowski. 2009. “Interchange Fees and Payment Card Networks: Economics, In-
dustry Developments, and Policy Issues.” Finance and Economics Discussion Series,
2009-23.
Rochet, Jean-Charles, and Jean Tirole. 2002. “Cooperation among Competitors:
Some Economics of Payment Card Associations.” Rand Journal of Economics, 33(4): 549–
570.
Rochet, Jean-Charles, and Jean Tirole. 2006. “Two-sided markets: a progress report.”
The RAND journal of economics, 37(3): 645–667.
Rysman, Marc, and Julian Wright. 2014. “The Economics of Payment Cards.” Review
of Network Economics, 13(3): 303–354.
Stavins, Joanna. 1999. “Checking Accounts: What Do Banks Offer and What Do Con-
sumers Value?” New England Economic Review, 3–14.
System, Federal Reserve. 2013. “The 2013 Federal Reserve payments study: Recent and
long-term trends in the United States: 2003-2012.” Federal Reserve System Paper.
30
Verdier, Marianne. 2011. “Interchange Fees in Payment Card Systems: A Survey of the
Literature.” Journal of Economic Surveys, 25(2): 273–297.
Wang, Zhu, Scarlett Schwartz, and Neil Mitchell. 2014. “The Impact of the Durbin
Amendment on Merchants: A Survey Study.” Federal Reserve Bank of Richmond Eco-
nomic Quarterly, 100(3): 183–208.
Wildfang, Craig K., and Ryan W. Marth. 2006. “The Persistence of Antitrust Contro-
versy and Litigation in Credit Card Networks.” Antitrust Law Journal, 73(3): 675–707.
31
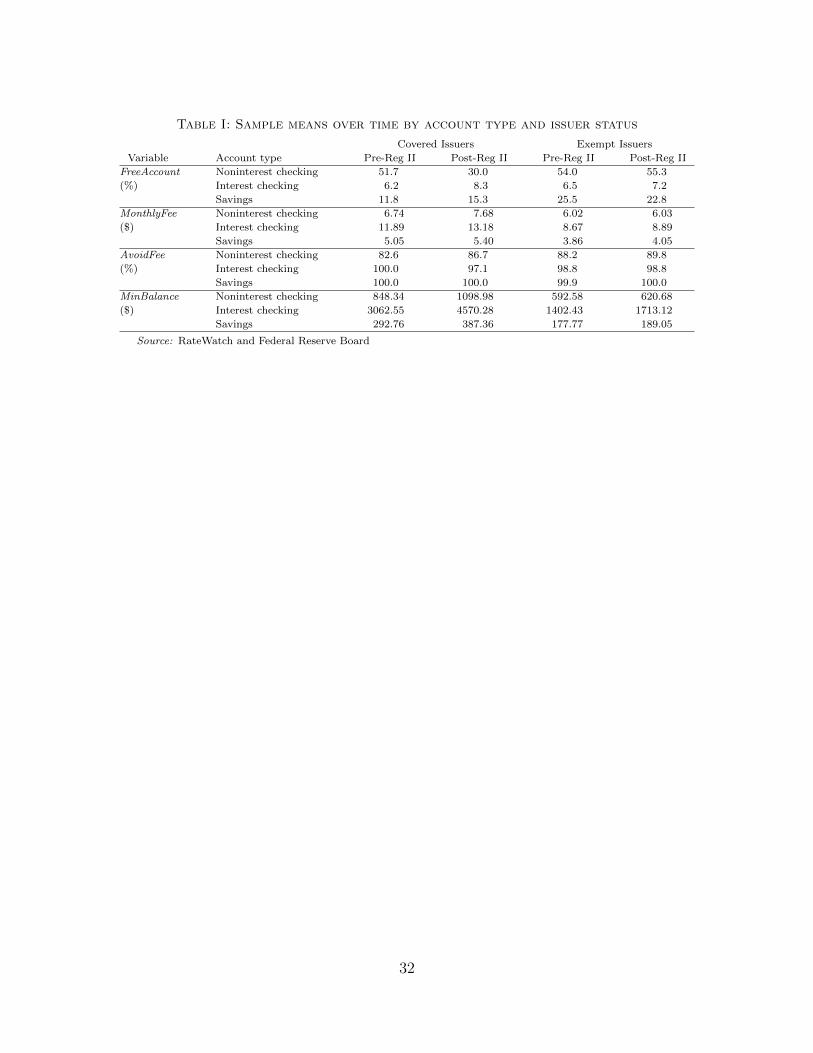
Table I: Sample means over time by account type and issuer status
Covered Issuers Exempt Issuers
Variable Account type Pre-Reg II Post-Reg II Pre-Reg II Post-Reg II
FreeAccount Noninterest checking 51.7 30.0 54.0 55.3
(%) Interest checking 6.2 8.3 6.5 7.2
Savings 11.8 15.3 25.5 22.8
MonthlyFee Noninterest checking 6.74 7.68 6.02 6.03
($) Interest checking 11.89 13.18 8.67 8.89
Savings 5.05 5.40 3.86 4.05
AvoidFee Noninterest checking 82.6 86.7 88.2 89.8
(%) Interest checking 100.0 97.1 98.8 98.8
Savings 100.0 100.0 99.9 100.0
MinBalance Noninterest checking 848.34 1098.98 592.58 620.68
($) Interest checking 3062.55 4570.28 1402.43 1713.12
Savings 292.76 387.36 177.77 189.05
Source: RateWatch and Federal Reserve Board
32
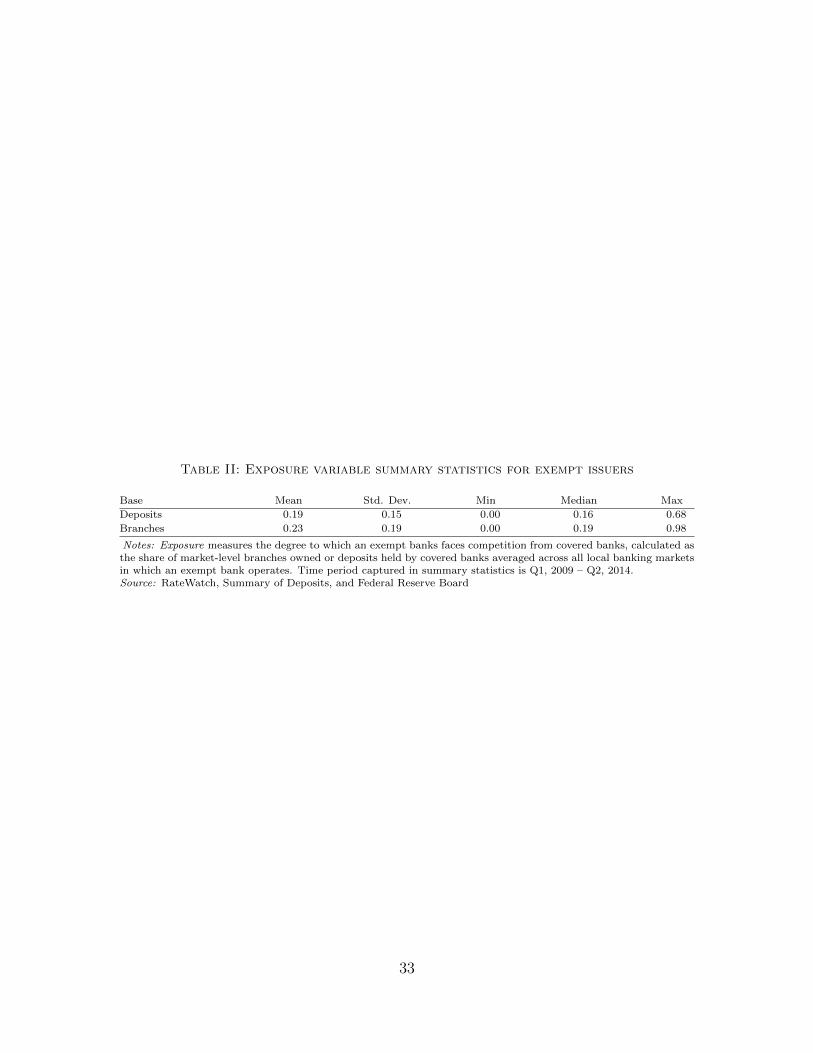
Table II: Exposure variable summary statistics for exempt issuers
Base Mean Std. Dev. Min Median Max
Deposits 0.19 0.15 0.00 0.16 0.68
Branches 0.23 0.19 0.00 0.19 0.98
Notes: Exposure measures the degree to which an exempt banks faces competition from covered banks, calculated asthe share of market-level branches owned or deposits held by covered banks averaged across all local banking marketsin which an exempt bank operates. Time period captured in summary statistics is Q1, 2009 – Q2, 2014.Source: RateWatch, Summary of Deposits, and Federal Reserve Board
33
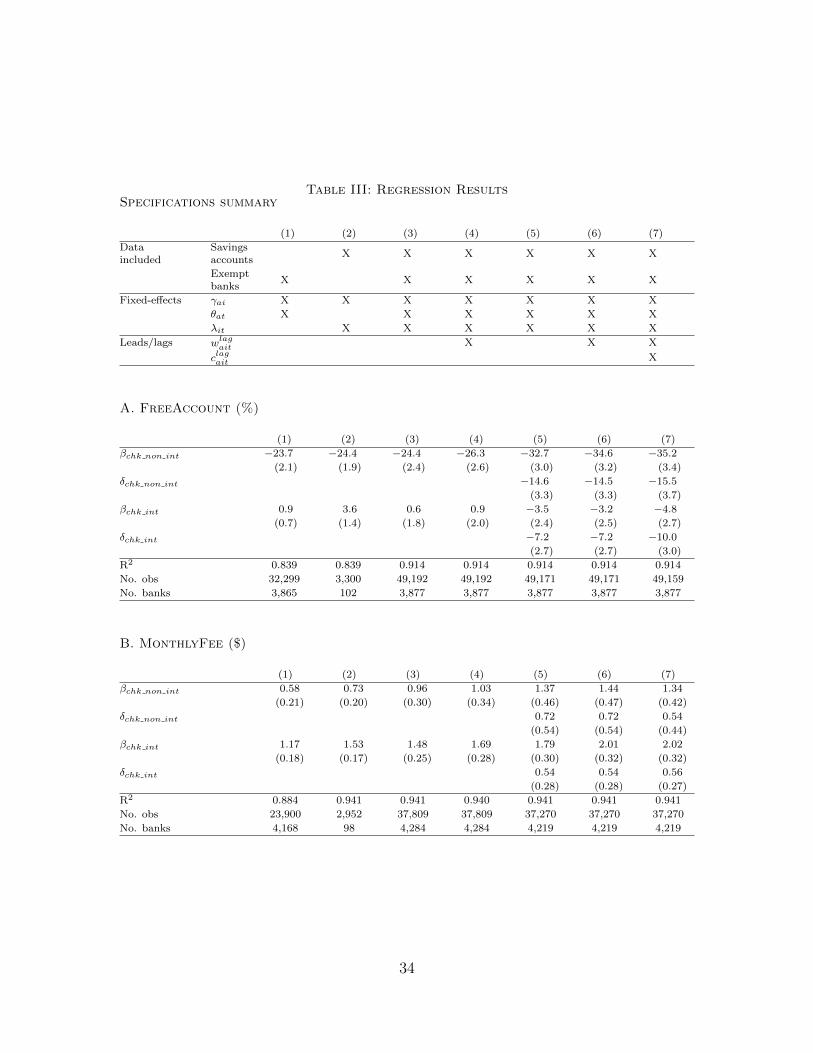
Table III: Regression ResultsSpecifications summary
(1) (2) (3) (4) (5) (6) (7)
Dataincluded
Savingsaccounts
X X X X X X
Exemptbanks
X X X X X X
Fixed-effects γai X X X X X X X
θat X X X X X X
λit X X X X X X
Leads/lags wlagait
X X X
clagaitX
A. FreeAccount (%)
(1) (2) (3) (4) (5) (6) (7)
βchk non int −23.7 −24.4 −24.4 −26.3 −32.7 −34.6 −35.2
(2.1) (1.9) (2.4) (2.6) (3.0) (3.2) (3.4)
δchk non int −14.6 −14.5 −15.5
(3.3) (3.3) (3.7)
βchk int 0.9 3.6 0.6 0.9 −3.5 −3.2 −4.8
(0.7) (1.4) (1.8) (2.0) (2.4) (2.5) (2.7)
δchk int −7.2 −7.2 −10.0
(2.7) (2.7) (3.0)
R2 0.839 0.839 0.914 0.914 0.914 0.914 0.914
No. obs 32,299 3,300 49,192 49,192 49,171 49,171 49,159
No. banks 3,865 102 3,877 3,877 3,877 3,877 3,877
B. MonthlyFee ($)
(1) (2) (3) (4) (5) (6) (7)
βchk non int 0.58 0.73 0.96 1.03 1.37 1.44 1.34
(0.21) (0.20) (0.30) (0.34) (0.46) (0.47) (0.42)
δchk non int 0.72 0.72 0.54
(0.54) (0.54) (0.44)
βchk int 1.17 1.53 1.48 1.69 1.79 2.01 2.02
(0.18) (0.17) (0.25) (0.28) (0.30) (0.32) (0.32)
δchk int 0.54 0.54 0.56
(0.28) (0.28) (0.27)
R2 0.884 0.941 0.941 0.940 0.941 0.941 0.941
No. obs 23,900 2,952 37,809 37,809 37,270 37,270 37,270
No. banks 4,168 98 4,284 4,284 4,219 4,219 4,219
34

C. AvoidFee (%)
(1) (2) (3) (4) (5) (6) (7)
βchk non int −1.7 −0.3 −1.7 −1.7 −2.6 −2.6 −2.9
(2.2) (1.8) (2.5) (2.9) (3.0) (3.3) (3.4)
δchk non int −1.4 −1.4 −2.0
(3.1) (3.1) (3.6)
βchk int −1.2 −1.8 −1.3 −1.3 −3.0 −3.0 −3.2
(0.6) (0.9) (1.2) (1.4) (1.4) (1.6) (1.6)
δchk int −2.9 −2.9 −3.2
(1.3) (1.3) (1.5)
R2 0.800 0.778 0.885 0.885 0.885 0.885 0.885
No. obs 21,947 2,853 34,557 34,557 34,539 34,539 34,529
No. banks 3,394 96 3,516 3,516 3,516 3,516 3,516
D. MinBalance ($)
(1) (2) (3) (4) (5) (6) (7)
βchk non int 236.1 435.9 297.4 255.4 403.9 364.7 423.7
(113.6) (146.2) (202.4) (219.1) (217.7) (230.7) (232.1)
δchk non int 165.5 169.8 265.2
(185.8) (185.9) (209.4)
βchk int 1, 025.4 1, 387.3 947.0 1, 163.3 1, 344.6 1, 555.9 1, 694.1
(184.9) (168.3) (235.0) (257.9) (266.3) (281.4) (280.7)
δchk int 686.2 679.3 916.4
(242.9) (242.9) (258.1)
R2 0.738 0.910 0.877 0.877 0.877 0.877 0.877
No. obs 20,541 2,728 33,152 33,152 33,134 33,134 33,124
No. banks 3,321 95 3,472 3,472 3,472 3,472 3,472
Notes: The numbers of observations and banks vary across columns for a given variable based on whether data onsavings accounts or exempt banks are included in a given specification. Imperfect coverage of the data set used tocalculate Exposure also causes a small number of observations to be dropped. The numbers of observations andbanks differ across outcome variables because certain outcomes are only observed in some circumstances (for example,MinBalance is only observed when a bank applies that term to its accounts.) All dummy variables and leading/laggingeffects are suppressed. Robust standard errors in parentheses clustered at the bank level.
35

183
$6.3Tn
5,374
$8.2Tn
0%
20%
40%
60%
80%
100%
Banks Deposits
Covered
Exempt
Figure IData coverage of banks and total deposits by exemption status
Bars represent coverage of data set in terms of banks and total deposits for banks cate-gorized as covered and exempt under Reg II. Values displayed above the bars represent,respectively, total number of banks and average value of total deposits held by banksobserved in the data set for period Q1 2009 – Q2 2014. For purposes of this figure,banks are counted at the charter level.Source: RateWatch, Summary of Deposits, and Federal Reserve Board
36

Panel A: FreeAccount Panel B: MonthlyFee
0%
20%
40%
60%
80%
100%
-11 -9 -7 -5 -3 -1 1 3 5 7 9Covered - Savings Exempt - Savings
Covered - N-int checking Exempt - N-int checking
Covered - Int Checking Exempt - Int Checking
$-
$2
$4
$6
$8
$10
$12
$14
$16
-11 -9 -7 -5 -3 -1 1 3 5 7 9Covered - Savings Exempt - Savings
Covered - N-int checking Exempt - N-int checking
Covered - Int Checking Exempt - Int Checking
Panel C: AvoidFee Panel D: MinBalance
0%
20%
40%
60%
80%
100%
-11 -9 -7 -5 -3 -1 1 3 5 7 9Covered - Savings Exempt - Savings
Covered - N-int checking Exempt - N-int checking
Covered - Int Checking Exempt - Int Checking
$-
$1,000
$2,000
$3,000
$4,000
$5,000
$6,000
-11 -9 -7 -5 -3 -1 1 3 5 7 9Covered - Savings Exempt - Savings
Covered - N-int checking Exempt - N-int checking
Covered - Int Checking Exempt - Int Checking
Figure IISample means over time by account type and issuer status
Horizontal axes represent quarters, labelled with respect to the Reg II’s effective date,with the first period in which the regulation was effective (Q4 2011) labelled ‘0’, the firstperiod in the data set (Q1 2009) labelled ‘-11’ and the last period (Q2 2014) labelled‘10’.Source: RateWatch
37

Appendix
In this appendix, we examine the sensitivity of our main results to changes in the
composition of the data set, ways in which we calculate variables, and the functional
form in which those variables enter our model. Our results are presented in Appendix
Table I. The econometric specification for each column matches the full regression
model, and thus should be compared alongside results in column (7) of Table III in
the main text; we have reproduced these results in column (1) in Appendix Table I.
First, we consider the effect of aggregation to the bank-quarter level. As noted
in section 3, RateWatch samples account fees and terms for each branch on average
once every half a year. When viewed on a quarterly basis, the panel of branch-
level observations is thus unbalanced. An implicit assumption when averaging across
branches up to the bank-quarter level is that this unbalanced nature of the underlying
data does not bias the resulting average fees. Column (2) in Appendix Table I presents
estimation results based on data aggregated over a half-year period. The primary
takeaway from comparing columns (1) and (2) is that most of the primary results
hold, although higher standard errors driven by a smaller sample result in a loss of
statistical significance for the increase in MonthlyFee for interest checking accounts
and the increase in MinBalance for noninterest checking accounts. In addition, the
absolute values of the statistically significant coefficients in column (2) are higher
than in column (1), in particular for MonthlyFee and MinBalance. As a result, the
indirect impact of Reg II on MinBalance for noninterest checking accounts at exempt
banks is statistically significant in column (2).
Second, we examine whether our main results are affected by the unbalanced
nature of the panel data set arising from the nature of the variables MonthlyFee,
AvoidFee, and MinBalance. Consider a covered issuer that offered a free account
38

before Reg II, but afterwards started charging a monthly fee. While the resulting
panel of MonthlyFee will be unbalanced (it is only observed if FreeAccount = 0), the
estimates of Reg II’s impact on the corresponding coefficient will be unaffected as long
as the fee introduced by the covered issuer is comparable to that charged by other
covered issuers. However, if the issuer starts charging a fee that is lower than those
charged by other issuers after Reg II, this may lead to biased estimates of Reg II’s
impact on MonthlyFee (and, by similar argument, AvoidFee). The same problem may
arise for MinBalance, which is only observed when FreeAccount = 0 and AvoidFee =
1.
To test whether this issue affects our estimates, column (3) in Appendix Table I
presents results based on a panel data set that excludes issuers for which the value of
FreeAccount or AvoidFee changed within three periods of Reg II’s implementation.
Comparing this column with column (1), we find that the coefficient estimates on
MonthlyFee for noninterest checking accounts, and MinBalance for account types
increase in magnitude, confirming the hypothesis that issuers who began charging a
monthly fee and offering their customers the possibility to avoid the fee by maintaining
a minimum balance on their accounts only following the introduction of Reg II set
their fees and thresholds at a lower level than those who had been charging it all along.
On the other hand, the magnitude of Reg II’s impact on MonthlyFee for interest
checking accounts falls, suggesting the opposite effect. Nonetheless, the majority of
the primary results hold, leading us to conclude the unbalanced nature of the panel
does not introduce significant bias in our results.
Third, we consider the effect of an alternative specification of Exposure, in which
the variable is constructed based on the count of branches of covered/exempt banks,
rather than on the deposits held at branches. Comparing summary statistics of
the alternative variable with the original variable (see Table II), we find that the
39

mean of the alternative specification is higher, reflecting the fact that covered banks
have a lower average level of deposits per branch than exempt banks. Turning to
the estimation results in Appendix Table I, comparing column (4), which presents
estimation results using the alternative Exposure variable, to column (1), we find
that most of the primary results hold.
Finally, we consider alternative specifications for the f(·) function which captures
the nonlinear impact on exempt banks of competitive exposure to covered banks. The
results are presented in columns (1), (5) and (6), which present the results for cubed
root, linear and square root specifications of f(·), respectively. First, we find strong
evidence of nonlinearity in the impact on exempt banks of competitive exposure to
covered banks - more coefficients are statistically significant, and absolute values of all
statistically significant coefficients are larger in column (7) than in column (6). This
latter finding is consistent with the effect of exposure arising at relatively low levels
of exposure and diminishing at higher levels. Second, comparing columns (1) and
(7) we find that the effect of exposure appears to be strongly nonlinear, favoring the
cubed root specification of the f(·) function, though the difference is less pronounced
than between the linear and square specifications.
40
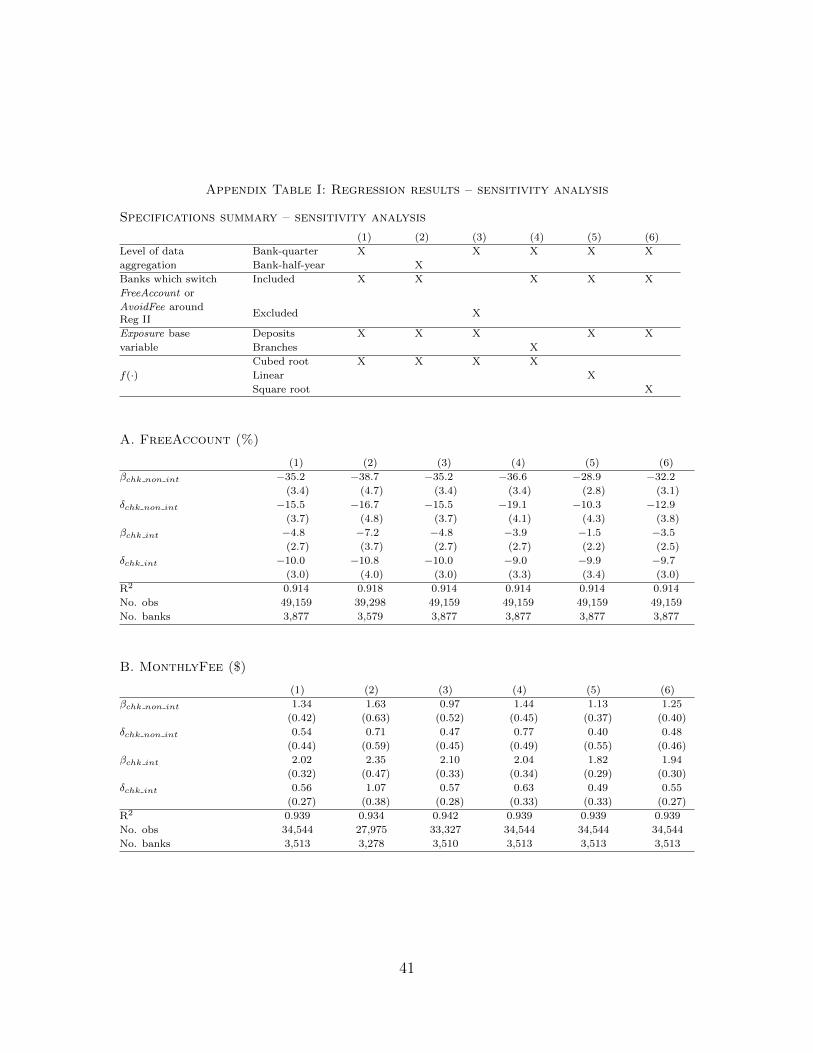
Appendix Table I: Regression results – sensitivity analysis
Specifications summary – sensitivity analysis
(1) (2) (3) (4) (5) (6)
Level of data Bank-quarter X X X X X
aggregation Bank-half-year X
Banks which switch Included X X X X X
FreeAccount or
AvoidFee aroundReg II
Excluded X
Exposure base Deposits X X X X X
variable Branches X
Cubed root X X X X
f(·) Linear X
Square root X
A. FreeAccount (%)
(1) (2) (3) (4) (5) (6)
βchk non int −35.2 −38.7 −35.2 −36.6 −28.9 −32.2
(3.4) (4.7) (3.4) (3.4) (2.8) (3.1)
δchk non int −15.5 −16.7 −15.5 −19.1 −10.3 −12.9
(3.7) (4.8) (3.7) (4.1) (4.3) (3.8)
βchk int −4.8 −7.2 −4.8 −3.9 −1.5 −3.5
(2.7) (3.7) (2.7) (2.7) (2.2) (2.5)
δchk int −10.0 −10.8 −10.0 −9.0 −9.9 −9.7
(3.0) (4.0) (3.0) (3.3) (3.4) (3.0)
R2 0.914 0.918 0.914 0.914 0.914 0.914
No. obs 49,159 39,298 49,159 49,159 49,159 49,159
No. banks 3,877 3,579 3,877 3,877 3,877 3,877
B. MonthlyFee ($)
(1) (2) (3) (4) (5) (6)
βchk non int 1.34 1.63 0.97 1.44 1.13 1.25
(0.42) (0.63) (0.52) (0.45) (0.37) (0.40)
δchk non int 0.54 0.71 0.47 0.77 0.40 0.48
(0.44) (0.59) (0.45) (0.49) (0.55) (0.46)
βchk int 2.02 2.35 2.10 2.04 1.82 1.94
(0.32) (0.47) (0.33) (0.34) (0.29) (0.30)
δchk int 0.56 1.07 0.57 0.63 0.49 0.55
(0.27) (0.38) (0.28) (0.33) (0.33) (0.27)
R2 0.939 0.934 0.942 0.939 0.939 0.939
No. obs 34,544 27,975 33,327 34,544 34,544 34,544
No. banks 3,513 3,278 3,510 3,513 3,513 3,513
41

C. AvoidFee (%)
(1) (2) (3) (4) (5) (6)
βchk non int −2.9 −0.8 4.5 −2.6 −3.6 −3.5
(3.4) (5.1) (3.8) (3.5) (3.1) (3.3)
δchk non int −2.0 0.7 −0.7 −1.5 −7.9 −3.8
(3.6) (4.8) (3.6) (3.9) (4.7) (3.8)
βchk int −3.2 −3.7 −3.2 −2.9 −2.0 −2.7
(1.6) (2.4) (1.5) (1.6) (1.4) (1.5)
δchk int −3.2 −4.0 −3.0 −2.9 −2.7 −3.0
(1.5) (2.1) (1.5) (1.7) (1.8) (1.5)
R2 0.885 0.885 0.898 0.885 0.885 0.885
No. obs 34,529 27,953 33,322 34,529 34,529 34,529
No. banks 3,516 3,278 3,513 3,516 3,516 3,516
D. MinBalance ($)
(1) (2) (3) (4) (5) (6)
βchk non int 423.7 453.0 482.8 357.2 316.5 372.3
(232.1) (320.7) (323.6) (236.7) (222.5) (228.2)
δchk non int 265.2 552.6 447.3 163.5 207.4 222.9
(209.4) (309.3) (210.2) (239.6) (292.3) (229.3)
βchk int 1, 694.1 1, 894.3 1, 963.3 1, 612.3 1, 337.3 1, 548.3
(280.7) (392.2) (323.9) (286.8) (264.8) (274.4)
δchk int 916.4 1, 164.8 998.8 828.1 692.3 835.0
(258.1) (356.6) (269.9) (289.7) (353.5) (279.4)
R2 0.877 0.871 0.877 0.877 0.877 0.877
No. obs 33,124 26,854 31,686 33,124 33,124 33,124
No. banks 3,472 3,240 3,462 3,472 3,472 3,472
Notes: Column (1) corresponds to column (7) from Table III and presents the primary results from the full model.The numbers of observations and banks vary across columns for a given variable based on aggregation over time (forcolumn (2)) and the criteria imposed on inclusion in the sample (for column (3)). The numbers of observations andbanks differ across outcome variables because certain outcomes are only observed in some circumstances (for example,MinBalance is only observed when a bank applies that term to its accounts). All dummy variables and leading/laggingeffects are suppressed. Robust standard errors in parentheses clustered at the bank level.
42