the impact of restricting beverage contai-ner use
TRANSCRIPT


The Impact of Restricting Beverage Contai-ner Use
in Iowa
Prepared for: The Honorable Robert D. Ray
Governor of Iowa
By: Suzan M. Stewart Research Librarian Iowa Geological Survey
and
Edward J. Stanek I1 ~irector, Air Management Division , I o ~ a Department of Environmental Quality
Revised 1/1/77
F i g u r e s
1. P e r C a p i t a S o f t Drink Consumption i n t h e United S t a t e s , 1954-1974.
2. Beer S a l e s i n Iowa, 1 9 7 4 .
3. 1951 S o f t Drink Manufacturers .
4 . 1975 S o f t Drink Manufacturers .
Tab le s
1. Iowa S o f t Drink S a l e s .
2. Comparison o f Energy U s e i n S o f t Drink Systems.
3 . Comparison of Energy Use i n Beer Conta iner Systems.
4. Energy Savings i n Beer and S o f t Drink Systems.
5. Comparative Consumer Cos t s of Nonreturnable and Re tu rnab le Beverage Con ta ine r s .
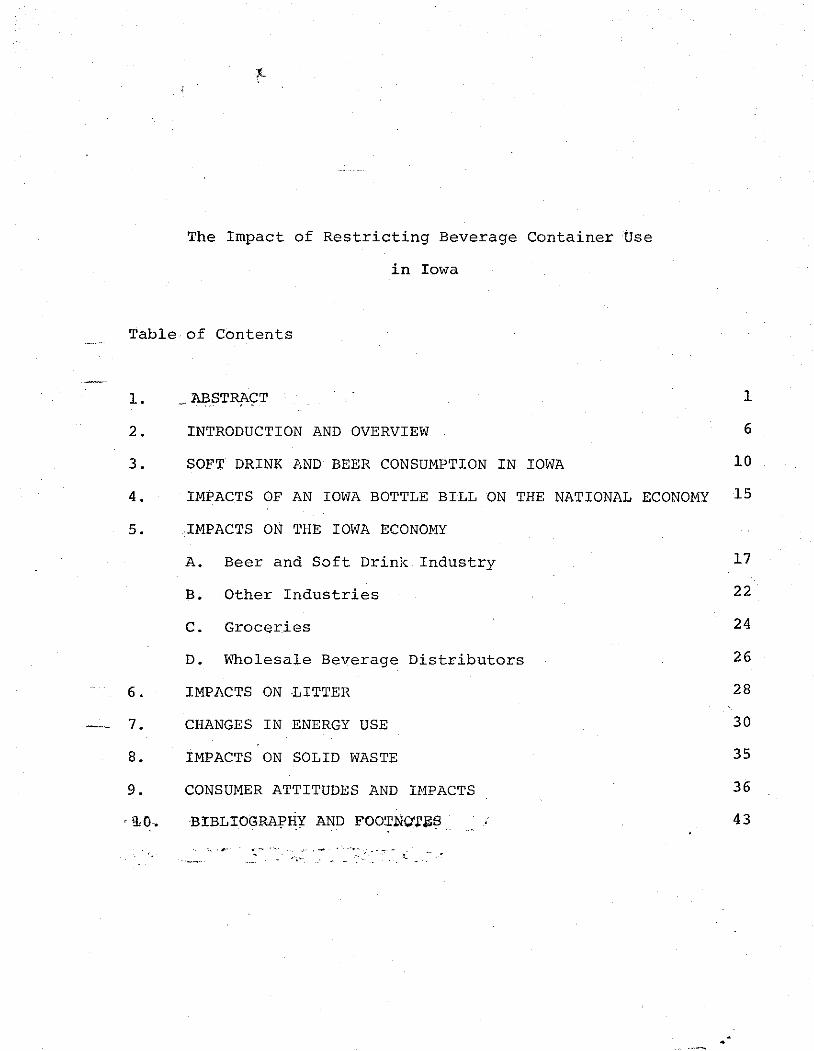
The Impact of Restricting Beverage Container Use
in Iowa
-- Table of Contents
-- 1. - AsSTeCT
2. INTRODUCTION AND OVERVIEW
3 . SOFT DRINK AND BEER CONSUMPTION IN IOWA
4 . IMPACTS OF AN IOWA BOTTLE BILL ON THE NATIONAL ECONOMY
5. IMPACTS ON THE IOWA ECONOMY
A. Beer and Soft Drink Industry
B. Other Industries
C. Groceries
D. Wholesale Beverage Distributors
6. IMPACTS ON LITTER
- 7. CHANGES IN ENERGY USE
8. IMPACTS ON SOLID WASTE
9. CONSUMER ATTITUDES AND IMPACTS
i no. B~BLTOGRAPHY AND . . FOOTNOTSS . .
.. , ,. , - . . . . . ,. . - . ... I.
, . - :~~- . . . . . ~.. . . . . . . - -

Abstract
Many states and municipalities have considered measures
that would restrict the types of beverage containers that could
be used by their citizens. This type of legislation was introduced
1,051 times in state legislatures between 1969 and 1975. Vermont
and Oregon have container legislation in effect, and Vermont's
law will become more stringent in 1977. California, Minnesota,
South Dakota, and Virginia have enacted container laws that
will take effect in the next two years. The citizens of Maine
and Michigan approved container measures in referenda held in
November, 1976.
Iowa has considered beverage container legislation in
several recent General Assemblies. The measure as proposed in
the 1976 session of the Iowa legislature, HF797, HF413 or SF275,
would have placed deposits of two to five cents on all beverage
containers, set up a mechanism for redeeming bottles, and
prohibit pop top cans.
In this study, the sections of the Iowa economy that
would be impacted by container legislation were analyzed and
a number of conclusions were drawn.
Soft Drink and Beer Consumption in Iowa
Iowans drink 24.6 gallons of soft drinks and 21.3 gallons
of beer per capita per year. About 21 percent of the soft drink
sold in Iowa is sold in bulk. The remainder is sold in return-
able bottles (48.2 percent), nonreturnable bottles (9.4 percent),

and nonreturnable cans (21.4 percent). The beer Iowans drink is
sold in kegs (15.0 percent), returnable bottles (2.1 percent),
nonreturnable bottles (12.8 percent) and nonreturnable cans
(70.1 percent). Iowans use one billion beverage containers
each year.
Impacts of an Iowa Bottle Bill on the National Economy
Iowans are not engaged in the energy-intensive manufacture
of beverage containers, where most employment impacts will be
felt. If beverage cans were prohibited, approximately 720 jobs
in the metal fabrication and can industries would be lost. If
one-way bottles vere prohibited, another 97 glass producers would
lose jobs, although this unemployment would be delayed several
years by the need to build an adequate stock of refillable bottles
It must be emphasized that these job losses would not occur
in Iowa, but in surrounding states.
Iowa Beer and Soft Drink Industry
Iowa has 34 soft drink bottlers and one brewery. These
plants employ 1,576. The industry has centralized over the years.
Today, five plants can drinks and ship them throughout Iowa.
About 12 percent of the soft drink consumed in Iowa is imported
from other states.
The impacts of this sector are not readily quantified. The
canners might install new bottling lines, buy quantities of re-
turnable bottles, and new delivery trucks. This increased capital
expenditure would be offset by additional business at Iowa's
bottling plants. It is highly probably that significant new
employment would result in this sector of Iowa's economy.

Other Industries
Alcoa Aluminum in Riverdale, Iowa, produces a minimal amount
of aluminum for beverage cans. Chemplex Company in Clinton produces
polyethylene resin that is used to fabricate the plastic rings
around 6-packs of nonreturnable cans.
In interviews with officials from Alcoa and Chemplex, neither
could estimate any loss of employment from container legislation.
Grocery Stores
In Iowa, 2,156 retail establishments sell groceries and soft
drinks. These stores would have to add staff to sort bottles.
An estimated 379 new part-time jobs would be added in Iowa's
grocery stores with container legislation. The expense of this in-
creased employment would be between $985,000 and $1.8 million.
Wholesale - Beverage Distributors
The 106 wholesale beer distributors would add from 240 to
336 new employees to their establishments for handling and deliv-
ering returnables.
Litter
National studies have indicated that roadside litter is com-
posed primarily of paper (48.9 percent) , beer cans (21.7 percent) ,
soft drink cans (4.4 percent), returnable bottles (2.0 percent),
nonreturnable bottles (3.5 percent) and miscellaneous items and
containers (19.5 percent). It has been estimated that the beverage

container portion of roadside litter would decrease about 80 per-
cent with a bottle bill. In Oregon, beverage container litter
has decreased 83 percent, and total litter 39 percent.
The Iowa Department of Transportation spends between $350,000
and $400,000 each year for litter pickup. The DOT does not
expect pickup expenses to decrease with container legislation.
Energy
Only a small portion of the energy needed to produce the
beverages Iowans drink is actually consumed in Iowa. Only 9.5 per-
cent of the 5.15 trillion BTU needed to produce the beer and soft
drinks used in Iowa is actually consumed in Iowa.
A national savings of 2.62 trillion BTU would result with a
switch to an all returnable beverage system in Iowa. This is
equivalent to about 21 million gallonsof gasoline per year. The
amount of energy used in Iowa to produce beverages would increase
46.9 percent to 720 billion BTU with an all returnable beverage
system. This is because the parts of the beverage system that
are more energy intensive in a returnable system are performed in
Iowa. This increase is insignificant when compared with the
national savings.
Solid Waste
Iowans would save only a minimal amount of tax dollars for
solid waste disposal if beverage container waste was eliminated.
Over a long period of time, a decreased number of landfills would
be put into operation in Iowa.
Consumer Impacts
Container legislation would benefit the consumer most.
Some choice in container types might be forfeited. It is not
likely that beverage costs would increase. Currently the cost
of soft drinks in returnable containers is significantly lower
than the cost of disposables.
The American consumer is ready and willing for restrictive
container legislation to be enacted. Polls indicate that Iowans
and Americans prefer beverages in returnable containers and will
return the containers for deposits.

INTRODUCTION AND OVERVIEW
During the 1977 legislative session one of the pieces of
proposed legislation will deal with limiting the sale of non-
returnable beverage containers. The debate on this issue
has been heated in states where such a measure is a law. .It
appears that American consumers are ready to support a "bottle
bill. "1 This legislation has the strong support of environ-
mental groups as a aethod of decreasing energy and natural
resource use, litter and solid waste. The beverage industry
denounces this type of measure because it feels litter problems
can be handled more effectively by recycling used containers.
Nonreturnable containers are both bottles and cans that are
disposed of instead of returned for deposit. In a returnable
system, the consumer rents the bottles. In a disposable system,
the consumer purchases the containers. Disposable bottles weigh
and cost about half as much as returnable ones.
Nonreturnable beverage containers have been part of
American life since tblate forties, when the steel industry
began to view the soft drink and beer industries as a last
major market area for expanding the use of steel cans. At that
time, returnable bottles averaged 40 trips, as compared with
nine to 12 trips today. Aluminum beer cans entered the market
in the middle to late fifties and since that time, aluminum
has replaced the steel in can tops to facilitate opening.

Today, beer and soft drink containers constitute about one-
half of all beverage and food containers sold.L From 1958 to
1970, beverage consumption rose by a factor of 1.6, while bev-
erage container use rose 4.2 times during the same period. 3
The nonreturnable container is preferred generally by the
male consumer who is more willing to sacrifice cost advantages for
convenience. Nonreturnables cost from 30 to 90 percent more than
beverages in returnable containers. On the other hand, the
housewife, who does her shopping by automobile and is more
cost-conscious, generally prefers returnable containers. In
Iowa, almost all the beer sold in packages is sold in nonre-
turnable containers, while only 38.9 percent of the packaged
soft drinks are sold in disposables. This is primarily because
of the difference in consumer preferences for the packaging.
With the advent of disposable beverage containers, concern
for littering problems grew. The industry reacted by forming
an organization to combat litter through public awareness,
"Keep America Beautiful." The Can Planufacturer's Institute,
the Glass Container Manufacturers Institute, the U,S. Brewers
Association and the National Soft Drink Bottlers Association
are all members of KAB, which conducts massive anti-littering
advertising campaigns. The industry favors container recycling
over prohibition of nonreturnable containers. The aluminum
industry in particular is hoping to achieve a 50 percent rate
of recycling of all-aluminum cans by 1980. 4
Other groups have supported restrictive legislation similar
to the measures being proposed in Iowa. The first restrictive
law was passed in Vermont in 1953. This measure banned nonre-

turnable beer bottles in an effort to reduce littering. This
law expired in 1957 and was not renewed because the volume of
litter was unaffected. By 1972, over 350 restrictive bills
had been introduced in Congress, state legislatures, and local
jurisdictions.
During the second session of the ninety-third Congress
Senator Hatfield introduced a measure modeled on the Oregon
law. The bill died in committee. Also, the U.S. Environmental
Protection Agency recently promulgated regulations that would
prohibit use of nonreturnables in federal installations. Three
states have container legislaticncurrently in force. The Oregon
bill went into effect in 1972, a more recent Vermont measure was
enacted in 1973, and Minnesota's ban on detachable tcps enacted
in 1973 became effective on January 1, 1977. In addition,
South Dakota, Virginia, and California have enacted container
legislation that will go into effect in 1978 and 1979.
In Iowa, bottle legislation has been introduced during the
past three General Assemblies. The major provisions of the
most recent Iowa bill HF797, introduced on 23 April 1975 by
the Committee on Energy are as follows:
1. All beverage containers have deposit values. If a con-
tainer is reusable by more than one manufacturer, the
container is certified and has a deposit value of two
cents. If the container is not reusuable, its deposit
value is five cents.
2. Retail outlets must accept container of the kind, brand
and size they sell and exchange them for a refund value.
3. The refund value of the container must be clearly marked.
However, certified glass containers are not required to
be so marked.
4. Redemption centers at which consumers may return empty
beverage containers for deposits may Ge set up by anyone.
5. Snap top cans are prohibited.
6. The administration of the bill, including the certifica-
tion of containers and redemption centers will be handled
by the Iowa Beer and Liquor Control Department.
Similar measures have been introduced in the Iowa munici-
palities of Des Moines and Iowa City.
This study is an attempt to idertify the sectors of the
Lowa economy that will be impacted by container legislation.
No sophistifacted economic techniques have been employed because
any projections will be faulty at best. An overview of the
issue is presented as well as detailed analysis of the in-
volved sectors of Iowa's soft drink distribution system.
SOFT DRINK AND BEER CONSUMPTION
IN IOWA
Per capita consumption of soft drinks in Iowa is 24.6
gallons/year.3 This is 8.9 percent below the national aver-
age.6 Data is not available on the types of containers in
which Iowa's soft drinks are served, but spot checks in super-
markets and soft drink distributors indicate that container
trends in Iowa follow thoseof the West-Central region of the
U.S. On this basis, 21 percent of the soft drink sold in Iowa
is sold in bulk. The remainder is sold in returnable bottles
(48.2 percent), nonreturnable bottles (9.4 percent), and bi-
metallic 12-ounce cans (21.4 percent) . Soft drinks are sold
in approximately 451.2 million containers. Eighty-seven per-
cent of the soft drinks consumed in Iowa is produced in the State. 8
Per capita consumption of beer in Iowa is 21.3 gallons/
year, exactly the national average. lo Fifteen percent of the
beer consumed in Iowa is sold in kegs; the remainder is in
562.1 million containers, almost all of which are nonreturn-
able. Almost all of the beer consumed in Iowa is shipped
from out of state.
Consumption of soft drinks and beer has continuously in-
creased in Iowa and the U.S. over the last ten years. In 1974,
for the first time in twenty years, soft drink consumption in
the U.S. fell slightly, by 0.9 percent. The major reason for
* t h i s was t h e tremendous i n c r e a s e i n s u g a r p r i c e s . However, i n
Iowa t h i s t r e n d was negated by a d ramat ic i n c r e a s e i n d i e t s o f t
d r i n k s a l e s , from l e s s than one p e r c e n t o f an average grocery
s tore ' s s o f t d r i n k b u s i n e s s t o more than t e n p e r c e n t o f i t s
s a l e s . 1 3
Opponents o f c o n t a i n e r l e g i s l a t i o n f e e l t h a t a p r o h i b i t i o n
on nonre tu rnab le s would s e r i o u s l y dec rease s a l e s of s o f t d r i n k s ,
e s p e c i a l l y s a l e s o f " p r i v a t e l a b e l " beverages , and t h u s h u r t
t h e consumer. Oregon exper ienced a 1 .38 p e r c e ~ t i n c r e a s e i n
b e e r s a l e s t h e yea r a f t e r t h e i r me&sure was passed. l4 Thi s was
less than t h e h i s , t o r i c a l annual r a t e of i n c r e a s e of 5.67 per-
c e n t . I n 1974, t h e h i s t o r i c a l annual r a t e o f i n c r e a s e i n bee r
s a l e s was a g a i n reached. l5 No good d a t a i s a v a i l a b l e on s o f t
d r i n k consumption i n Oregon, b u t one s tudy i n d i c a t e s it i n -
c r e a s e d t e n p e r c e n t i n 1973 ove r t h e 1972 l e v e l s . 16
Opponents a l s o have argued t h a t p r i c e s pa id f o r beverages
would i n c r e a s e . S o f t d r i n k p r i c e s i n Oregon r o s e no more than
i n t h e bo rde r ing s t a t e o f Washington. B e e r p r i c e s r o s e s l i g h t l y
i n Vermont and Oregon. Oregon's p r i c e s remain two-to-three
p e r c e n t h i g h e r t h a n t h o s e i n Washington, b u t t h i s p r i c e d i f -
f e r e n t i a l cannot be a t t r i b u t e d e n t i r e l y t o c o n t a i n e r l e g i s l a t i o n .
* It i s worthwhile t o no te t h a t p r i c e s of bo th b e e r and s o f t
d r i n k s on a n a t i o n a l s c a l e have r i s e n i n t h e p a s t y e a r .

Iowa S o f t Dr ink S a l e s
I. By: Type o f Package
A. Bulk
M i l l i o n G a l l o n s P e r c e n t
14 .7 21.0
B. Packaged
1. R e t u r n a b l e b o t t l e s 33.8 48.2
2. N o n r e t u r n a b l e b o t t l e s 6.6 9.4
3 . Cans 15 .0 21.4 70.1 m i l l i o n 100%
11. By: P l a c e o f S a l e
1. Food S t o r e s 38.6
2. Vending Machines 14 .7
3 . O t h e r R e t a i l S t o r e s 9.8
g a l l o n s
4. Othe r 7.0 - 10.0 70.1 m i l l i o n 100%
g a l l o n s
111. Iowa B e e r S a l e s
A . Kegs 9 . 1
B. Packaged
l . R e t u r n a b l e b o t t l e s 1 . 3
2. N o n r e t u r n a b l e b o t t l e s 7.8
3. Cans 42.6 70.1 60 .8 m i l l i o n 100%
g a l l o n s
Source : N a t i o n a l S o f t Dr ink A s s o c i a t i o n . 1974 S a l e s Survey o f
t h e S o f t Dr ink I n d u s t r y .
Iowa Wholesa le B e e r D i s t r i b u t o r s A s s o c i a t i o n . Monthly
Beer Shipments .

Per Capita Soft Drink Consumption in the United States, 1954-1974.
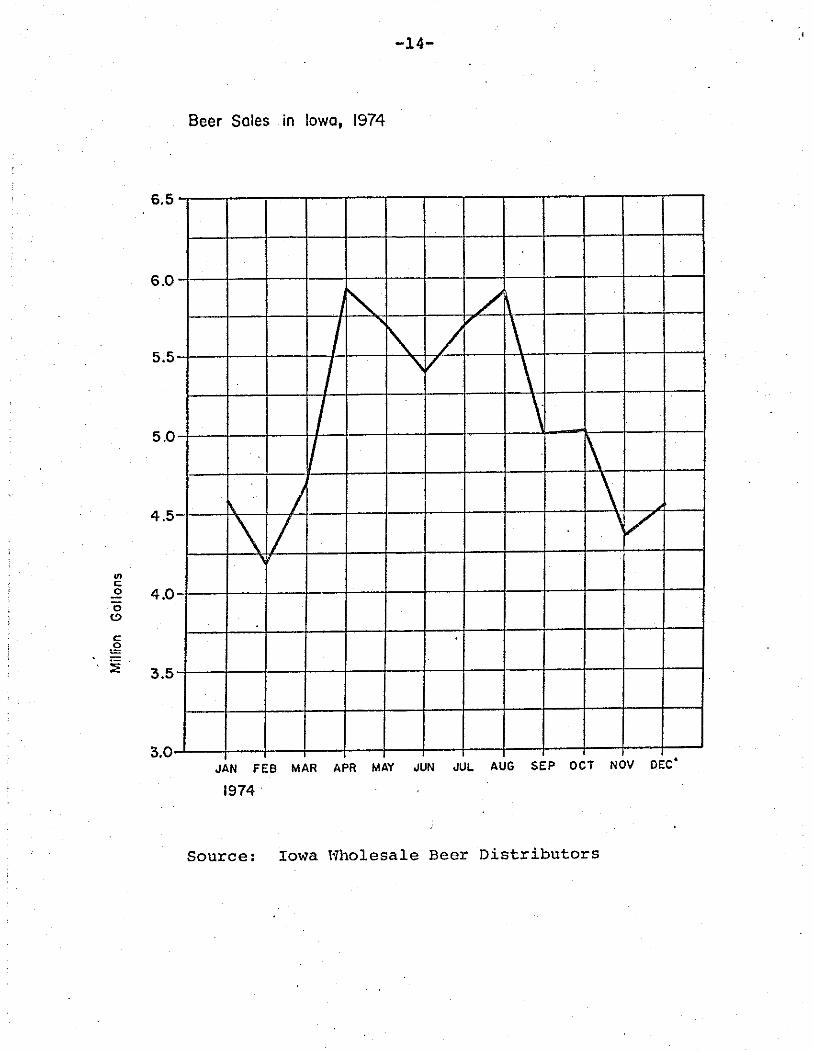
Beer Sales in Iowa, 1974
1974
Source: Iowa Wholesale Beer Distributors

IMPACTS OF AN IOWA BOTTLE BILL ON THE NATIONAL ECONOMY
Iowans a r e n o t engaged i n t h e energy i n t e n s i v e manufac-
t u r e of beverage c o n t a i n e r s . However, c o n t a i n e r l e g i s l a t i o n
passed i n Iowa would have a s l i g h t impact upon n a t i o n a l employ-
ment. The U.S. Department of Commerce has e s t ima ted t h a t a
n a t i o n a l b o t t l e b i l l would dec rease U . S . employment 22,000
pe r sons i n b o t t l e manufactur ing, 35,000 i n can manufactur ing,
and 25,000 i n me ta l s and f a b r i c a t i o n . Thir l o s s of 82,000 jobs
woulc? be o f f s e t by an i n c r e a s e of 95,000-115,000 jobs i n t h e
r e t a i l i n g and b o t t l i n g s e c t o r s . 1 7
Iowans used about 580.4 m i l l i o n beverage cans , o r 1 .3
p e r c e n t o f t o t a l U.S. beverage can produc t ion i n 1974. Thus,
i f t h e number o f beverage cans used i n Iowa would dec rease from
57.3 p e r c e n t t o 1 . 4 pe rcen t , a s occu r red i n 0regon,19 t h e re-
s u l t and e f f e c t of t h e Iowa l e g i s l a t i o n on n a t i o n a l employment
i n t h e me ta l f a b r i c a t i o n and can i n d u s t r i e s would be t h e l o s s o f
720 jobs .
About 137.7 m i l l i o n nonre tu rnab le beverage b o t t l e s a r e
used i n Iowa p e r y e a r . I f t h e s e l e f t t h e d i s t r i b u t i o n system,
abou t 97 g l a s s p roducers would l o s e jobs . However, t h e need t o
b u i l d a " f l o a t " ( r e f i l l a b l e b o t t l e s t h a t have been purchased by
t h e consumer and a r e somewhere between t h a t p o i n t and t h e p o i n t
a t which they a r e r e f i l l e d ) w i l l de lny job l o s s e s by two t o
t h r e e y e a r s , depending on t h e r a t e of t r a n s i t i o n .

I n c r e a s e s i n employment r e l a t e d t o c o n t a i n e r l e g i s l a t i o n
would occu r i n Iowa, i n t h e r e t a i l and wholesale s e c t o r s o f t h e
beverage i n d u s t r y . The n a t i o n a l dec rease of 817 jobs i n con-
t a i n e r manufacture would b e o f f s e t by an i n c r e a s e o f 1 9 0 f u l l -
t ime e q u i v a l e n t jobs i n g roce ry s t o r e s , 240 t o 336 jobs w i th
b e e r d i s t r i b u t o r s , and a number o f jobs i n t h e s o f t d r i n k i n -
d u s t r y . Labor unions contend t h a t t h e jobs l o s t have hour ly
r a t e s o f $5 t o $6 p e r hour a s compared wi th $2.50 t o $4.50 p e r
hour i n r e t a i l i n g . 2 0

Impacts On The Iowa Economy
B e e r And S o f t Drink I n d u s t r y
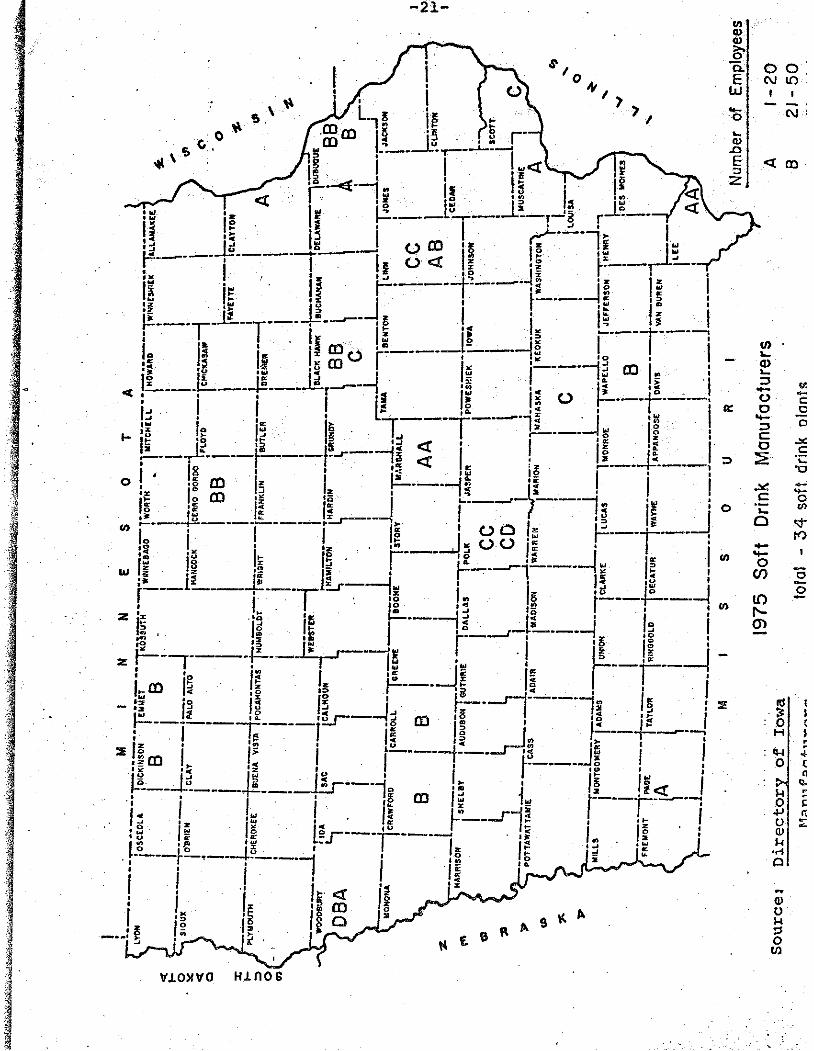
Iowa has 34 s o f t d r i n k b o t t l e r s and canners and one brewery.
These p l a n t s employ 1 ,576 , and a r e l o c a t e d i n e igh teen Iowa
c i t i e s . Over t h e y e a r s t h e i n d u s t r y has tended t o c e n t r a l i z e .
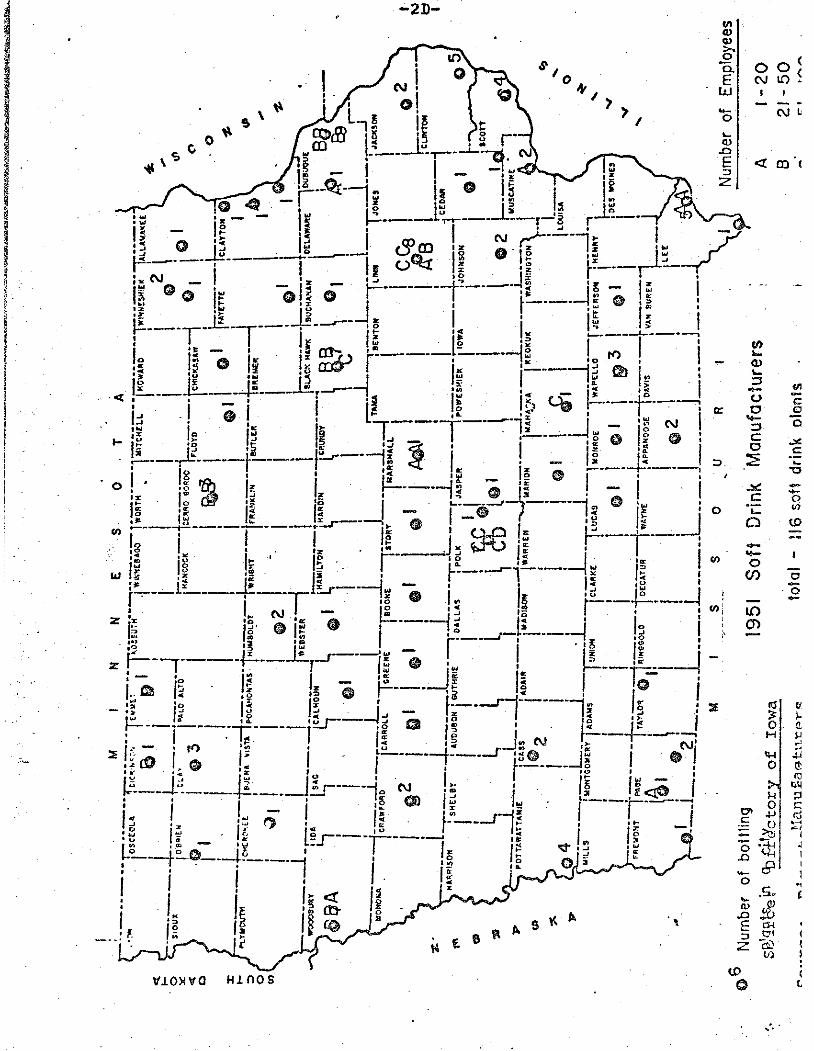
I n 1951 t h e r e were 1 1 6 s o f t d r i n k b o t t l e r s and t h r e e b rewer i e s
i n Iowa, many l o c a t e d i n smal l towns such a s Garnav i l l o , Decorah,
and Alb ia . 22 Today, Iowa's major c i t i e s supply s o f t d r i n k s f o r
t h e e n t i r e s t a t e . Iowa 's b o t t l e r s a l s o d i s t r i b u t e s o f t d r i n k s
t o r e t a i l o u t l e t s .
O f t h e t h i r t y - f i v e p l a n t s , o n l y f i v e can beverages (Mid-
Con t inen t B o t t l e r s i n D e s Moines, Mahaska B o t t l e r s i n Oskaloosa,
Coca-Cola B o t t l i n g i n Ottumwa, P i c k e t t Breweries i n Dubuque, and
Chesterman Company i n Sioux C i t y ) . These companies r e c e i v e cans
from p l a n t s i n Hammond, Ind iana and Rockford, I l l i n o i s , f i l l them,
and p l a c e steel b o t t ~ m s on them. The l i g h t e r cans can be t r a n s -
p o r t e d l o n g e r d i s t a n c e s w i t h l e s s t r a n s p o r t a t i o n f u e l . Some
canned beverage i s t r a n s p o r t e d i n t o t h e s t a t e from canning p l a n t s
i n Kansas C i t y , Norfolk, Nebraska, and Watertown, Wisconsin.
Large c e n t r a l i z e d p l a n t s i n Chicago, Minneapol is , and ~ a n s a s C i t y
can " p r i v a t e l a b e l " s o f t d r i n k s t h a t a r e s o l d i n g roce ry s t o r e s .
About 12 p e r c e n t o f t h e s o f t d r i n k consumed i n Iowa i s imported
from o t h e r s t a t e s . 2 3
The o n l y f o r c e opposing t h e c e n t r a l i z i n g tendency o f t h e
beverage i n d u s t r y i s t h e f r a n c h i s i n g procedure used by t h e major
beverage companies. The franchises provide each bottler with an
exclusive territory, which forces large food wholesalers to buy
soft drinks locally. This processhas been an incentive for the
food chains' private-label soft drinks.
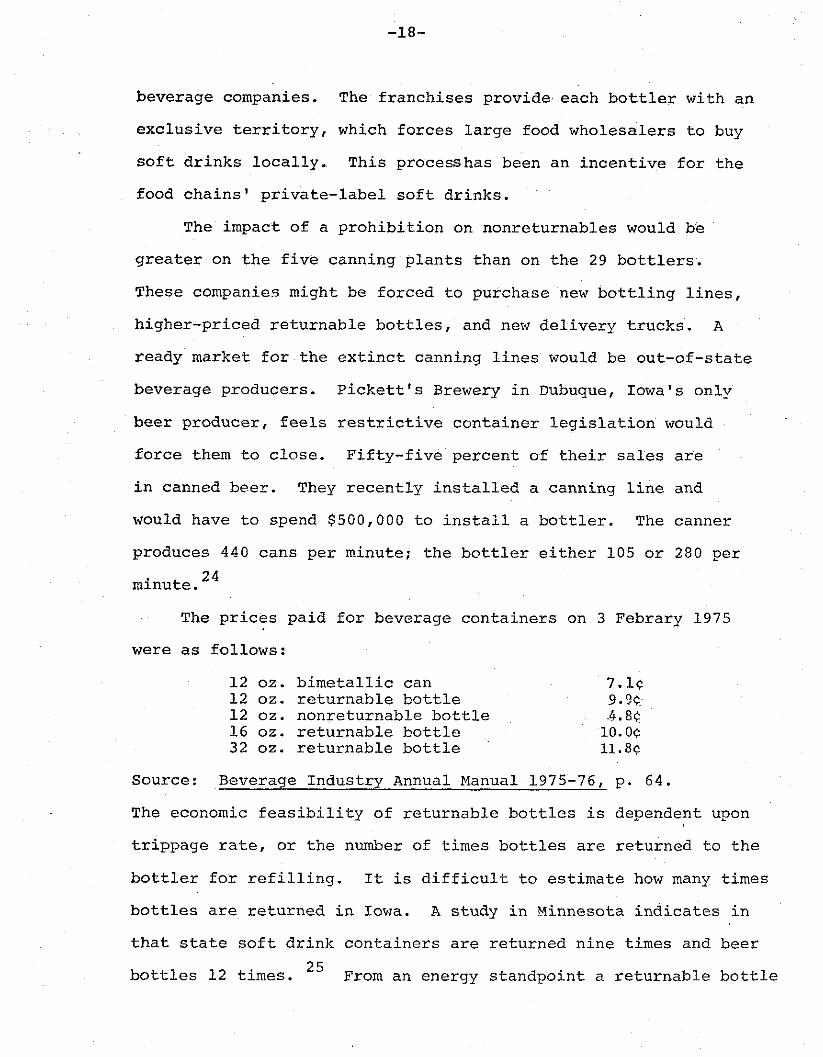
The impact of a prohibition on nonreturnables would be
greater on the five canning plants than on the 29 bottlers.
These companies might be forced to purchase new bottling lines,
higher-priced returnable bottles, and new delivery trucks. A
ready market for the extinct canning lines would be out-of-state
beverage producers. Pickett's Brewery in Dubuque, Iowa's only
beer producer, feels restrictive container legislation would
force them to close. Fifty-five percent of their sales are
in canned beer. They recently installed a canning line and
would have to spend $500,000 to install a bottler. The canner
produces 440 cans per minute; the bottler either 105 or 280 per
minute. 2 4
The prices paid for beverage containers on 3 Febrary 1975
were as follows:
12 oz. bimetallic can 12 oz. returnable bottle 12 oz. nonreturnable bottle 16 oz. returnable bottle 32 oz. returnable bottle
Source: Beverage Industry Annual Manual 1975-76, p. 64.
The economic feasibility of returnable bottles is dependent upon
trippage rate, or the number of times bottles are returned to the
bottler for refilling. It is difficult to estimate how many times
bottles are returned in Iowa. A study in Xinnesota indicates in
that state soft drink containers are returned nine times and beer
bottles 12 times. 25 From an energy standpoint a returnable bottle

must be returned eight times for the returnable system to consume
less energy than a nonreturnable system. The bottlers estimate
that a bottle must make 13 trips to be economically feasible. 26
In Oregon, trippage rate has increased to 20. - 27 Pickett's feels
that if trippage did increase, the brewery could remain economi-
cally viable v?iL\ an all-returnable system.
Again, the Oregon experience serves to illustrate possible
trends in Iowa if container legislation is enacted. New invest-
ment in the "float" of returnable bottles was $910,000. Increased
costs for soft drink distribution were $881,000. In total, Oregon
bottlers experienced an increase of $2.8 million during the first
year container legislation was in effect. 2 8
The beverage industry has become highly centralized as a re-
sult of the lightweight, easy to transport can. Four soft drink
plants are centrally located in Iowa urban areas, and produce'
most of the canned beverages sold in the state. At the same time,
the number of small, local breweries and bottlers has declined
from 116 in 1951 to 35 today, a decrease of about 70 percent.
Although a mandatory deposit law might work to the economic dis-
advantage of the five canners, even these establishment~ concede
that a high rate of trippage, as has been experienced in Oregon,
would allow their bottling lines to remain economically viable.
The 30 plants that limit their function to bottling would be able
to increase their sales volumes, add employees, and possibly add
new plants. In Oregon, the small bottlers have experienced major
growths in volume and employment. Iowa's "bottle-based" soft
drink industry would probably follow that pattern.
Other Industries
There are no industries in Iowa that manufacture cans,
bottles or paper beverage carriers. Two Iowa industries are en-
gaged in the manufacture of other beverage packaging. The Alcoa
plant in Riverdale produces sheet aluminum that is used primarily
for house siding and aviation. This plant produces a minimal
amount of aluminum that is used for beer cans. Chemplex Company
in Clinton produces polyethylene resin th8t is used to manufac-
ture plastic milk bottles, the "rings" around 6-packs of nonre-
turnable cans, and a variety of other packaging materials.
The Alcoa system has two sheet rolling plants--the plant in
Riverdale, Iowa and one in Evansville, Indiana. The production
of beverage-can aluminum at these two plants is interreleated and
neither can be examined separately. The Iowa plant has a peak
employment of 3,200. The Evansville operation is a new plant
designed specifically to roll can aluminum. The company tends
to put most of its can business into the Indiana plant. The
Iowa plant will manufacture can aluminum only if an excess of
demand occurs. The total capacity of the Evansville plant is
60 to 80 million tons of aluminum per month. The capacity
of theRiverdaleplant is 50 million tons per month. In late
1975, the Evansville plant produced 60 million tons per month
of can aluminum and the Riverdale plant produced 37.5 million

tons per month of sheet aluminum. The Riverdale plant was pro-
ducing very little, if any, can aluminum. 29
The impact of nonreturnable legislation on employment at
Alcoa/Riverdale cannot be readily quantified. In peak periods,
up to 20 percent of the plant's output may be can alumnium. How-
ever, all of this aluminum is shipped out of Iowa to be fabrica-
ted into beer cans which in turn are filled with beer outsic7.e the
State. Container legislation that would decrease the demand for
all-aluminum beer cans would probably result in greater shifting
of Alcoa's can business to the more efficient Evansville plant,
with slight unemployment possibly resulting in Riverdale.
Soft drinks sold in all-alumiilum cans are not available in
Iowa. The typical Iowa beverage can is the bimetallic three-
piece, with steel sides and bottom and an aluminum top. However,
several brands of beer are sold in Iowa in all-aluminum cans.
Chemplex in Clinton transforms liquefied propane gas and
ethane into polyethylene resin, which is then formed into a vari-
ety of materials. Most of their business is in the packaging
field. A minimal amount of their resin is used to fabricate
plastic rings which are used to hold 6-packs of canned beverages
together. The company does not aniticpate any unemployment due
to container legislation. The greatest impact of such legislation
would be on their future business. 30 A survey of new trends in
the beverage industry indicates that plastic-coated nonreturnables
are now being test-marketed and that a plastic bottle is being
researched. Both of these products could he important in Chem-
plex's futnre business.
Grocery Stores
In Iowa there are 2,156 retail establishments that sell
groceries and soft drinks. 31 There is a wide variety in sizes of
grocery stores in the state. A store in Iowa City, judged to be
typical was studied in detail. This store has sales that are
almost at the middle of the sales range for the Hy-Vee chain.
About 15 percent of the totalshelf space of the store is
dedicated to sales of beer and soft drinks. Two-thirds of this
shelf space is for returnables. Almost all beer is sold in non-
returnable~. Returnable beer is housed in a far corner of the
storage room and must be specifically requested. Thirty-five to
forty percent of the soft drink sales are in returnable con-
tainers. The store sells a private-label soft drink, in both diet
and regular varieties, in cans and nonreturnable bottles. Private-
label drinks account for 20 percent of their soft drink sales.
A ban on beverage cans would have two effects on grocery
stores. The number of employees engaged in sorting bottles would
increase 2 1/2 times, and the storage space devoted to bottles would
have to be increased. The storage problem could be eliminated by
more frequent pick-ups of empty bottles. More shelf space night
have to be added, although this problem would be reduced by the
use of the 11-ounce "stubbynbeer bottle that is widely used in
Oregon.
In the study store, it is estimated that increased labor

costs for sorting bottles would be $4,927 per year, or 1,095
person-hours per year. It is estimated that employees spend
three hours per day sorting bottles. This would have to increase
two and one-half times with the implementation of a ban on cans.
From this data, rough estimates can be made of total increased
costs and additional employment in grocery stores. There are
719 grocery stores in Iowa towns with populations of 10,000 or
more. 32 it is estimated that half of these or 360, would ex-
perience similar employment needs to those in the store studied.
On this basis, total increased labor nee3s would be 394,200
person-hours per year at a cost of between $985,500 (based on
beginning part-time employee wage) and 1.8 million (based on
average wage). Bottle sorting is usuallya part-time job. If it
is assumed the additional employees would work 20 hours a week,
379 new part-time jobs would be created by container legislation.
Grocers have stated that bottle breakage would increase and
sanitation would become more difficult with an increase in re-
turnable sales. In the sample store, at least, conditions around
returnable bottles were very clean and no breakage problems were
evident.
In Oregon, grocers' labor costs increased 2.7 million. A
small amount of additional storage was added, and grocers made in
new investments in shelf space and sorting devices. The bill did
not impact on other retail outlets that sell beverages such as
restaurants and taverns. 3 3

Wholesale Beverage D i s t r i b u t o r s
I n Iowa, t h e most s e v e r e impacts o f c o n t a i n e r l e g i s l a t i o n
w i l l probably occur among t h e r e t a i l g roce ry stores and wholesale
beverage d i s t r i b u t o r s . These e s t a b l i s h m e n t s w i l l have t o h i r e
a d d i t i o n a l employees t o handle and t r a n s p o r t b o t t l e s and may make
some c a p i t a l expend i tu re s f o r b o t t l e handl ing equipment and
t r u c k s .
There a r e 106 wholesale beer d i s t r i b u t o r s i n Iowa. These
e s t a b l i s h m e n t s employ 800. Another 136 e s t ab l i shmen t s d i s t r i b u t e
g r o c e r i e s , and some o f t h e s e handle s o f t d r i n k s . 34 Many o f Iowa ' s
b o t t l e r s a r e a l s o beverage d i s t r i b u t o r s . The beer d i s t r i b u t o r s
r e c e i v e beverages from l a r g e manufac ture rs , p r i m a r i l y i n Wiscon-
s i n , and se l l and d e l i v e r bee r t o r e t a i l e r s . The d i s t r i b u t o r s
a l s o redeem r e t u r n e d c o n t a i n e r s from t h e r e t a i l e r s and s h i p them
back t o t h e brewers.
I n Iowa, bee r i s s o l d i n 4 5 4 . 4 m i l l i o n cans and 83.7 m i l l i o n
nonre tu rnab le b o t t l e s annua l ly . Re tu rnab le s r e q u i r e about tw ice
a s much space a s nonre tu rnab le s , a l t hough t h i s problem has been
a l l e v i a t e d i n Oregon by t h e i n t r o d u c t i o n o f t h e 11-ounce "s tubby"
b o t t l e t h a t i s s i m i l a r i n s i z e t o a beer can .
Oregon. has e s t ima ted t h a t handl ing r e t u r n a b l e s c o s t s about
10.3 c e n t s p e r c a s e more t h a n handl ing cans . These inc reased
c o s t s have been o f f s e t by a premium p a i d f o r t h e r e t u r n o f c e r t i -
f i e d b o t t l e s . Oregon and Iowa have a s i m i l a r number of bee r

wholesalers. 35 If the Oregon experience is applied to Iowa, an
increase of $495,550 in costs can be expected by the distributors
with the enactment of container legislation. Most of this will
be for increased warehouse and truck-driver labor. About 1.6
times more labor is needed to handle returnables than nonreturn-
able~. 36 On that basis, Iowa's wholesale beer distributors would
have to add between 240 and 336 new employees to handle the in-
creased numbers of returnable bottles.
IMPACTS ON'LITTER
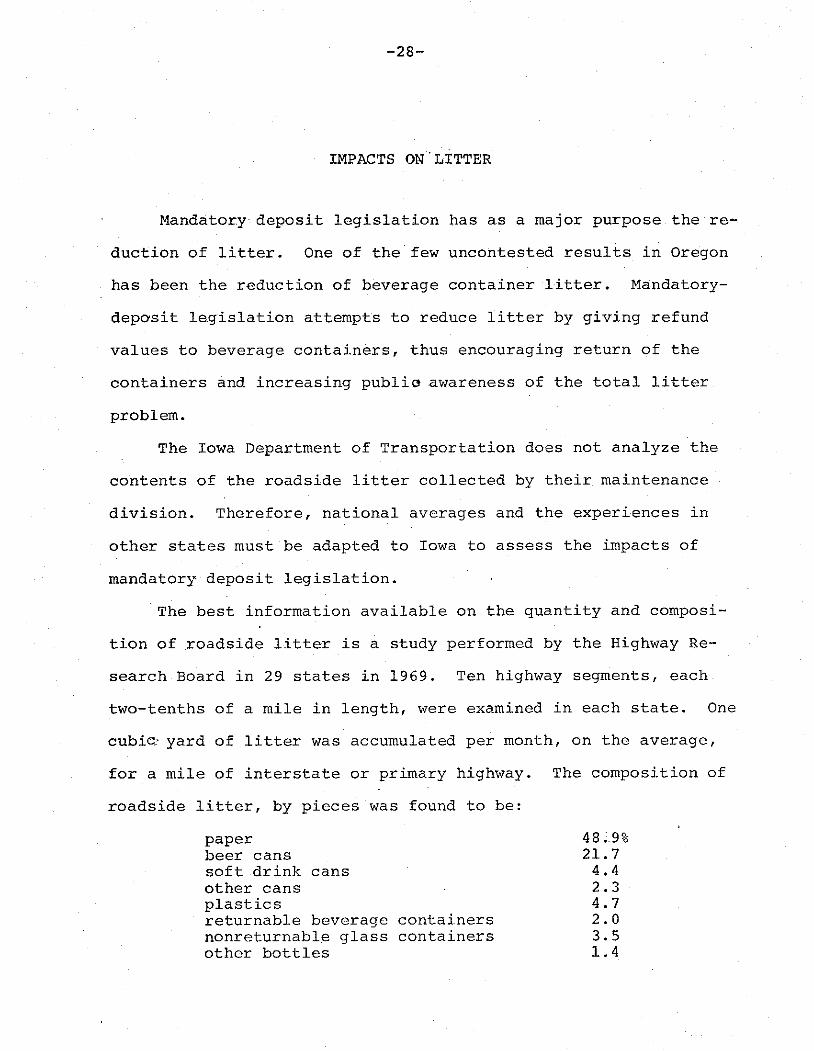
Mandatory d e p o s i t l e g i s l a t i o n has as a major purpose t h e r e -
d u c t i o n o f l i t t e r . One o f t h e few uncontes ted r e s u l t s i n Oregon
h a s been t h e r e d u c t i o n of beverage c o n t a i n e r l i t t e r . Mandatory-
d e p o s i t l e g i s l a t i o n a t t e m p t s t o reduce l i t t e r by g i v i n g r e fund
v a l u e s t o beverage c o n t a i n e r s , t h u s encouraging r e t u r n o f t h e
c o n t a i n e r s and i n c r e a s i n g p u b l i o awareness o f t h e t o t a l l i t t e r
problem.
The Iowa Department o f T r a n s p o r t a t i o n does n o t a n a l y z e t h e
c o n t e n t s o f t h e r o a d s i d e l i t t e r c o l l e c t e d by t h e i r maintenance
d i v i s i o n . Therefore , n a t i o n a l averages and t h e expe r i ences i n
o t h e r s t a t e s must be adapted t o Iowa t o a s s e s s t h e impacts o f
mandatory d e p o s i t l e g i s l a t i o n .
The b e s t in format ion a v a i l a b l e on t h e q u a n t i t y and composi-
t i o n o f r o a d s i d e l i t t e r i s a s tudy performed by t h e Highway Re-
s e a r c h Board i n 29 s t a t e s i n 1969. Ten highway segments, each
two-tenths o f a m i l e i n l e n g t h , were examined i n each s t a t e . One
c u b i c r y a r d o f l i t t e r was accumulated p e r month, on t h e ave rage ,
f o r a m i l e of i n t e r s t a t e o r primary highway. The composi t ion of
r o a d s i d e l i t t e r , by p i e c e s was found t o be:
Paper 48.9% bee r cans 21.7 s o f t d r i n k c a n s 4 . 4 o t h e r c a n s 2.3 p l a s t i c s 4.7 r e t u r n a b l e beverage c o n t a i n e r s 2.0 nonre tu rnab le g l a s s c o n t a i n e r s 3.5 o t h e r b o t t l e s 1 . 4

misce l laneous
Source: Highway Research Board, Nat iona l Study o f t h e Composi-
t i o n of Roadside L i t t e r , 1970.
Not ice t h e l a r g e pe rcen tage of beer cans t h a t a r e d i s c a r d e d com-
pared t o s o f t d r i n k cans .
The o n l y d a t a on r o a d s i d e l i t t e r i n Iowa comes from a one-
m i l e survey performed by t h e Iowa S tudent P u b l i c I n t e r e s t Reseaech
Group i n October, 1974 on a heav i ly t r a v e l e d s t r e t c h o f Highway
69 near A m e s . I n t h i s survey, non re tu rnab le c o n t a i n e r s were
found t o c o n s t i t u t e 30 p e r c e n t of a l l i t e m s o f l i t t e r . Twenty-
two p e r c e n t of t h e l i t t e r , by i t em, was beer cans ; t h i s c o r r e l a t e s
c l o s e l y w i t h t h e n a t i o n a l f i g u r e s . 37
The r e d u c t i o n o f l i t t e r i n Oregon brought abou t by t h e law
a g a i n s t non re tu rnab le s has been widely accla imed. The most r e -
c e n t l i t t e r s tudy was performed i n September, 1974, two y e a r s
a f t e r t h e l e g i s l a t i o n was enac ted . Beverage c o n t a i n e r l i t t e r had
decreased 83 p e r c e n t , on an i t em b a s i s , and t o t a l l i t te r decreased
39 p e r c e n t . 3 8'
The Iowa Department of T r a n s p o r t a t i o n spends between $350,000
and $400,000 each y e a r f o r l i t t e r pickup. I n f i s c a l y e a r 1975,
l i t t e r pickup c o s t Iowans $358,388. 39 L i t t e r i s c o l l e c t e d once a
year a long a l l r o a d s i n Iowa, u s u a l l y i n t h e s p r i n g , and i s c o l -
l e c t e d s p o r a d i c a l l y throughout t h e r e s t of t h e yea r . The DOT does
n o t f e e l t h a t a r e d u c t i o n i n l i t t e r would reduce t h e i r l i t t e r
pickup e x p e n d i t u r e s , s i n c e t h e same m i l e s would have t o be covered.
A s l i g h t r e d u c t i o n i n t i m e spen t on l i t t e r p ickup would be p o s s i b l e .

Changes in Energy Use
On a national basis, the major impacts of container legisla-
tion are decreased use of energy and natural resources. The U.S.
Department 3f Commerce has estimated that the country could de-
crease the amount of encerTy used in the beverage industry by 57
percent within several years of the enactment of container legis-
lation. 40
The current Iowa beverage system consumes 5.15 trillion BTU
of fuels, or 1.1 percent of the total U.S beverage industry's
use of energy. Only 490 billion BTU, or 3.5 percent, of the
energy used in Iowa's beverage system is actually consumed in
Iowa. 41 This fuel is used primarily to bottle beverages and trans-
port bottles and empties.
Four beverage systems were compared in this analysis:
1. The current system 2. The current system with 30 percent glass recycling 3. An all-returnable system 4. An all nonreturnable system
A glass recycling loop (remelting the old glass and making new
bottles) would actually consume slightly more energy than the cur-
rent system does. This occurs because of the additional ,energy
used in sorting and hauling the recycled glass.
A significant decrease in the energy used in the U.S in pro-
ducing Iowa's beverage system would result with a switch to an
all-returnable system. More than 2.5 trillion BTU of fuel would
be saved by such a switch. This is the equivalent of 21 million
gallons of gasoline per year. The benefits of this decrease in

energy use would not be felt in Iowa because Iowans are not
engaged in container manufacture, the area where most energy
is expended. Bottling and transport of finished beverages are
the only parts of the system that occur in Iowa. Both of these
operations are more energy-intensive in a returnable bottling
system than in a nonreturnable one. Bottles weigh about as much
as the beverage they contain, but a can for a 12-ounce beverage
weighs only .05 pound. About four and one-half times more energy
is needed to transport returnable bottles than to move cans. The
bottling process is more energy intensive than is canning, because
of the heat expended in washing and sterilizing bottles.
Energy consumed in the beverage system within Iova would in-
crease with a returnable system by 230 billion BTU, or 46.9 per-
cent over current levels. This is the equivalent of i.19 million
gallons of gasoline, enough to keep 2,375 automobiles on the road
for a year. This is a minimal increase when compared with the ,
benefit that Qould accrue to the nation from an all returnable
system.
Orecaution must be applied to examination of the energy savings
in an all-returnable system: unless the bottles are returned 70
percent of the time, more energy will be consumed than in a non-
returnable system. However, this minimum has been easily achieved
in Oregon, where bottles are returned at least 95 percenk of the
time. 4 2
If Iowa used all throwaways the U.S. would consume an additional
1.28 trillion BTU, the equivalent of 10.2 million gallox of gasoline
This fuel could keep 13,250 automobiles on the road for one year.

Comparison of Energy Use in Soft Drink Systems
Comparison of returnable, nonreturnable glass, and cans.
energy use (B.T.U /gallon)
material acquisition transport container manufacture crown or lid manufacture transport to bottler bottling paper container manufacture transport to outlet collection & hauling of waste Iowa
non Iowa TOTAL
returnable (8 fills)
NI* 900
glass non-ret . 4,720 650
non-ret . cans 33,529
253
Energy use under four container alternatives (Trillion B.T.U.).
T- Iowa Use Non Iowa Use current system 2.22 0.41 1.81 present system w/30% glass recycling all returnables all non returnables
Percent change in energy use with optional systems over current system.
Total Energy Use Iowa Use Non Iowa Use current system -- -- -- present system w/30% glass recycling +2.7% all returnables -32.0% all non returnables +54.1%
indicates energy utilized to produce beverages outside of Iowa.
1

Comparison of Energy Use i n B e e r Container Systems*
energy use (B.T.U./gallon)
r e t u r n a b l e slass non-ret . material a c q u i s i t i o n t r a n s p o r t c o n t a i n e r manufacture crown o r l i d manuf a c t u r e t r a n s p o r t t o b o t t l e r b o t t l i n g paper c a r r i e r manufacture t r a n s p o r t a t i o n t o o u t l e t c o l l e c t i o n and hau l ing
of was te Iowa non Iowa
TOTAL
(19 f i l l s ) N I 335
- non-ret .
4,225 575
36,210 2,385 1 ,690 1 ,525
10,560 2,230
cans 33,529
253 3,358
15,960 206
1 ,345 3,100
420
Energy u s e under f o u r c o n t a i n e r system a l t e r n a t i v e s - ( t r i l l i o n 3TU) .
A. c u r r e n t system B. p r e s e n t system w/30%
g l a s s r e c y c l i n g C. a l l r e t u r n a b l e s D. a l l n o n r e t u r n a b l e s
T o t a l Energy U s e Jowa U s e Non Iowa Use 2.93 0.076 2.85
Pe rcen t change energy u s e w i t h - o p t i o n a l systems over c u r r e n t s y s t a ~ s .
a T o t a l Enerqy Use Iowa U s e Non Iowa U s e - 1. c u r r e n t system - - - - -- 2. p r e s e n t system w/30%
g l a s s r e c y c l i n g ' +1.3% 0.0% + 1 . 4 % 3. a l l r e t u r n a b l e s -65.2% +163.2% -71.2% 4. a l l nonre tu rnab les ' +2.7% -60.5% +4.6%
* P i c k e t t s ' Brewery i n Dubuque has n o t been inc luded i n t h e c a l c u l a t i o n s f o r b o t t l i n g . The company produced and s o l d t o Iowans 3,160,000 cans and 182,804 b o t t l e s o f b e e r i n 1974. Energy used i n t h i s product ion i n Iowa was 1.73 b i l l i o n B.T.U. f o r b o t t l i n g and ano the r .076 b i l l i o n B.T.U.
. f b r t r a n s p o r t o f c o n t a i n e r s t o b o t t l e r . T h i s i s t h e e q u i v a l e n t of .06% of t h e energy used t o produce Iowa ' s b e e r system.

Energy Savings i n Beer and S o f t Drink Systems
1 2 Energy u s e under f o u r c o n t a i n e r a l t e r n a t i v e s (10 B.T.U.).
c u r r e n t sys tem p r e s e n t system w/30%
g l a s s r e c y c l i n g a l l r e t u r n a b l e s a l l n o n r e t u r n a b l e s
T o t a l U s e Iowa Eneryy U s e Non Iowa U s e 5.15 0.49 4.66
Energy s a v i n g s (-)or increases (+) i n each system as compared w i t h c u r r e n t system ( T r i l l i o n B.T.U. ) .
c u r r e n t svstem T o t a l U s e --
pgesen t ~ ; s t e m w/30% glass r e c y c l i n g + . l o
a l l r e t u r n a b l e s -2.62 a l l non . r e tu rnah le s - +1.28
Iowa U s e Non Iowa U s e -- --
Percen t change i n energy u s e w i t h o p t i o n a l systems.
c u r r e n t system T o t a l U s e --
p r e s e n t ~ ; s t e m w/30% g l a s s r e c y c l i n g + l . 9%
a l l r e t u r n a b l e s -50.9% a l l n o n r e t u q ~ b l e s +24.9%
Iowa U s e Non Iowa U s e

IMPACTS ON SOLID WASTE
About t h r e e percent by weight of t h e s o l i d waste d iscarded
i n Iowa i s beverage con ta ine rs . A s beer and s o f t d r i nk cons:lmp-
t i o n rises, con ta ine r l i t t e r a l s o increases . A s t h e q u a n t i t y of
s o l i d waste generated each year inc reases , l o c a l governments a r e
faced wi th t h e s e r i ous problems of f ind ing adequate l a n d f i l l
sites.
Iowans pay $80 mi l l i on each year t o c o l l e c t and d ispose of
s o l i d waste. I f r e s t r i c t i v e con ta ine r l e g i s l a t i o n were passed,
Iowa t a x payers could save a small amount on c o l l e c t i o n c o s t s . 4 3
Because beverage con t a ine r s a r e only a small por t ion o f s o l i d
waste, c o l l e c t i o n r o u t e s and equipment would no t over t h e s h o r t
run respond t o . s l i gh t changes i n t h e quan t i t y of wastes discharged.

CONSUMER IMPACTS
Any type of container legislation will have the most
beneficial impact on the beverage consumer, through lower
prices. Iowa and national opinion surveys and the results
of recent referenda indicate that the American beverage
consumer would support legislation that would prohibit the
use of nonreturnsble containers.
Of the four referenda held in 1976, those held in Michi-
gan and Maine passed by wide margins. The referendum in
Massachusetts was defeated by less than m e percent. The
citizens of Colorado turned down a similar measure by a ratio
of two to one. (See table A). The results of these referenda
can be compared to the results in state legislatures. Between
1969 and 1975, 1,051 container bills were considered in state
legislature^.'^^ Only seven passed. (See table B) . It appears
that when a consumer has a chance to vote on a container measure,
he is more likely to support it than his legislator is.
A January 11, 1976 Iowa Poll asked Iowans whether they
would favor legislation banning the use of all nonreturnable
bottles and car~s.~T (See table C). Seventy percent of all
Iowans responded favorably. Men were slightly more favorable
than women. Eighty percent of all rural residents surveyed
favored such a measure.

The results of the Iowa Poll correspond to those obtained
by the Federal Energy ~dministration.~~ The FEA survey indi-
cated that 51 percent of the public prefer to purchase soft
drinks and beer in returnables. The study found that people
buying returnables do so to save money or out of concern for
the ecology. Can buyers are willing to pay more for the
greater convenience, and if container legislation were enacted,
would probably prefer to pay a high deposit for the convenience
of cans.
The FEA found that both beer and soft drink purchasers
would return containers if deposits were placed on containers.
Only seven percent of beer drinkers and eight percent of soft
drink users would decrease their consumption with a ten-cent
deposit per container. Eighty-six percent of beverage consumers
would return their bottles for a ten-cent deposit.
Opponents of containerlegislation claim that such laws
would increase consumer costs, decrease consumer choice, and
decrease beverage sales. Currently, Iowa City residents pay
much less for beverages in returnable containers than they
do for canned beverages. A survey of Iowa City groceries
indicates that consumers pay 1.7 to 1.9 cents per ounce for
canned brand name soft drinks and 0.9 cents per ounce for an
eight-pack of returnable, brand-name beverages. (See table D).
Even canned "private label" soft drinks are not a bargain, since
they average 1.3 cents per ounce.
Soft-drink prices in Oregon are four percent lower than
those in Washington and beer prices are 2.4 to 3.7 percent
higher. 47 Soft drink sales increased ten percent in 1973 over
1972 levels in Oregon. Beer sales increased about 1.38 percent
in 1973 over the year before. 48 A study of Oregon indicates
that consumers there actually paid $75,000 - less for the same
quantity of beverage they purchased in 1972. 49 This statistic
contradicts every argument made by opponents of the measure.
The consumer stands to benefit from lower beverage prices
if container legislation is enacted. The decrease in container
litter will be an aesthetic benefit. The consumer will sacri-
fice some choice in the types of container he may purchase, but
results of the Iowa Poll indicates that Iowans are willing to
make that sacrifice.

Table A
Results of State Referenda on
Nonreturnables, November 23, 1976
State
Colorado
Vote ( % ) Provisions of bill
YES - NO -
3 3 6 7 All beer and soft drink containers to be
reusable, 50 deposit.
Maine 5 8 4 2 Ban on pop tops and plastic loops,
5C: deposit.
Massachusetts 49.6 50.4 Ban on pop tops, 50 deposit on containers
less than 32 02, 1 0 ~ deposit on containers
more than 32 oz.
Michigan 6 4 -36 Ban on pop top, 100 deposit on all beer
and soft drink containers, 50 deposit on
: all certified containers.
2
Source: U.S. Brewer's Association, Inc.

Table B
States Which have Enacted Container Legislation
Effective State Date Provisions of the Law
California 1/1/7 9 Ban on pop top beverage containers.
Minnesota 1/1/77 Ban on detachable top beverage containers.
Oregon 10/1/72 At least 56 deposit on beverage containers, 2.d deposit on certified containers, ban on pop tops.
South Dakota 1/1/28 Only recyclable or biodegradable containers allowed.
Vermont 1/77 Mandatory deposit of not less than 5$ on all beverage containers, ban on plastic rings unless biodegrade- able, only bottles that can be re- filled at least 5 times may be used.
Virginia 1/1/79 Tax for litter control of $2.50 on each person engaged in the manufacture, wholesale, or retail of goods.
Washington 5/21/71 Litter assessment of 1.5/100 of 1% of $ value of products produced in the State and of $ value of gross proceeds from sales in the State.

Table C
Question :
YZS
NO
UNDECIDEC
Question:
YES
NO
UNDECIDED
Results of the Iowa Poll on Nonreturnable
Containers, January 11, 1976
Do you think nonreturnable bottles and cans are a serious
litter problem?
city & all Iowa male female metro. town rural -
Would you favor Banning the use of all
nonreturnable beer and soft drink containers in Iowa?
city & all Iowa male female metro. town rural - --
7 0 72 69 6 9 69 80
2 0 19 2 0 22 2 0% 12
10 9 11 9 11 8
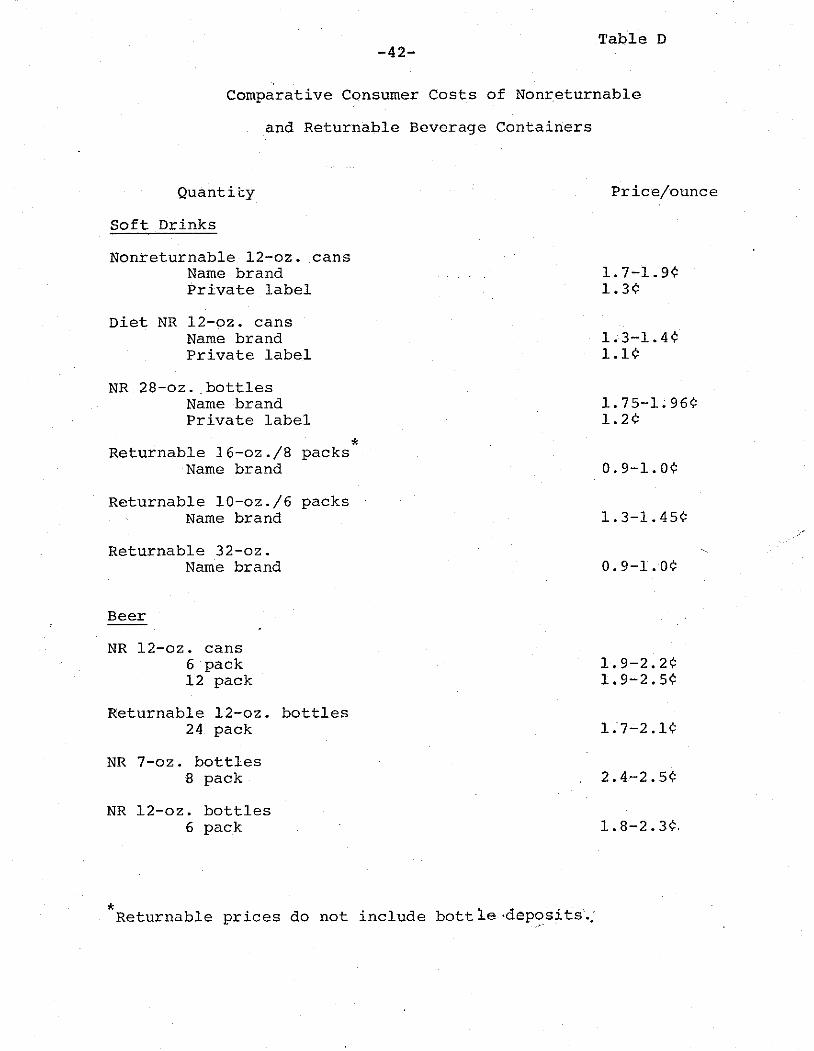
Tab le D -42-
comparat ive Consumer C o s t s o f Nonreturnable
and Returnable Beverage Con ta ine r s
Q u a n t i t y
S o f t Drinks
Nonreturnable 12-02. c a n s Name brand P r i v a t e l a b e l
D i e t NR 12-02. c a n s N a m e brand P r i v a t e l a b e l
NR 28-02. b o t t l e s Name brand P r i v a t e l a b e l
Re turnable 16-oz./8 packs Name brand
Returnable 10-oz./6 packs Name brand
Returnable 32-02. Name brand
B e e r -
NR 12-02. c a n s 6 pack 12 pack
Re tu rnab le 12-02. b o t t l e s 24 pack
NR 7-02. b o t t l e s 8 pack
NR 12-02. b o t t l e s 6 pack
* Returnable p r i c e s do n o t i n c l u d e b o t t l e , d e p o s i t s . ,
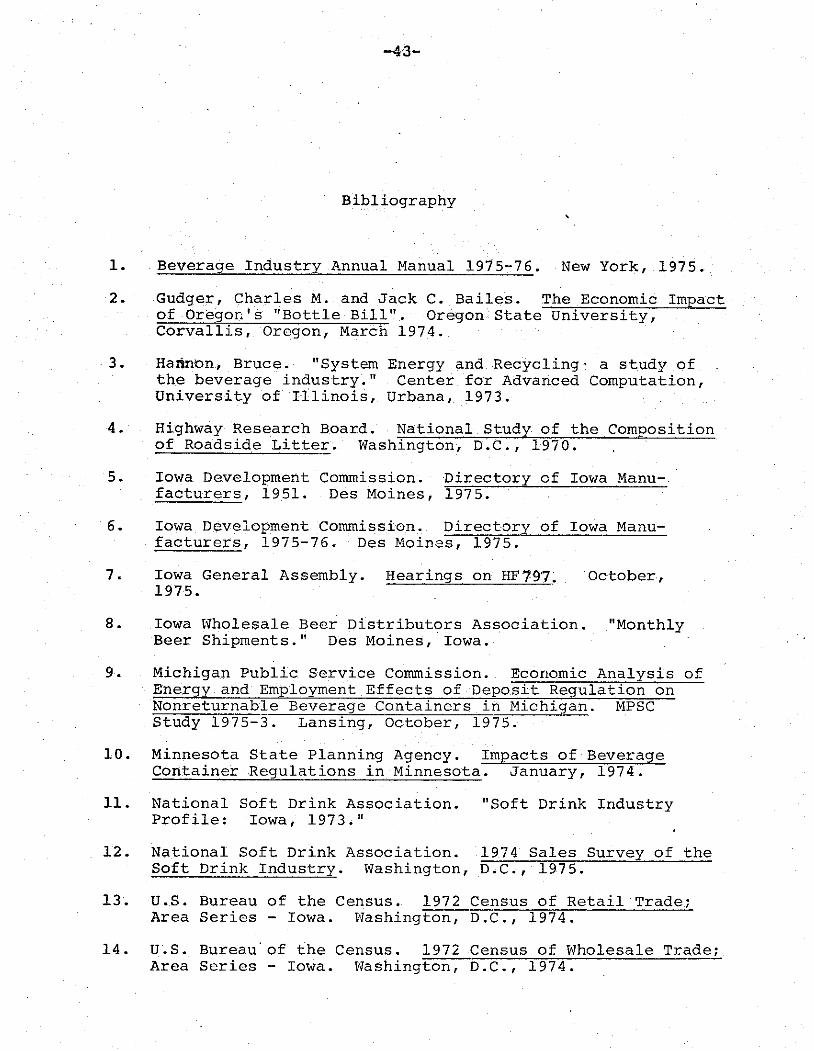
Bibl iography
1. Beverage I n d u s t r y Annual Manual 1975-76. New York, 1975.
2. Gudger, Cha r l e s M. and J a c k C. B a i l e s . The Economic Impact o f OregorA1s " B o t t l e B i l l " . Oregon S t a t e U n i v e r s i t y , C o r v a l l i s , Oregon, March 1974.
3 . Hafinon, Bruce. "System Energy and Recycl ing- a s t u d y o f t h e beverage i n d u s t r y . " Center f o r Advanced Computation, U n i v e r s i t y o f I l l i n o i s , Urbana, 1973.
4. Highway Research Board. Nat iona l Study o f t h e Composition o f Roadside L i t t e r . Washington, D . C . , 1950.
5. Iowa Development Commission. D i r e c t o r y of Iowa Manu- f a c t u r e r s , 1951. Des Moines, 1975.
6. Iowa Development Commission. D i r ec to ry of Iowa Manu- f a c t u r e r s , 1975-76. D e s Moinss, 1975.
7. Iowa General Assembly. Hearings on HF79.7. October , 1975.
8. Iowa Wholesale B e e r D i s t r i b u t o r s Assoc i a t i on . "Monthly Beer Shipments." D e s Moines, Iowa.
9. Michigan P u b l i c Se rv i ce Commission. Economic Analys i s of
10. Minnesota S t a t e Planning Agency. Impacts o f Beverage Conta iner Regu la t ions i n Minnesota. January , 1 9 7 4 .
11. Na t iona l S o f t Drink Assoc ia t ion . " S o f t Drink I n d u s t r y P r o f i l e : I o w a , 1973."
12. Na t iona l S o f t Drink Assoc ia t ion . 1974 S a l e s Survey o f t h e S o f t Drink I n d u s t r y . Washington, D . C . , 1975.
13 . U.S. Bureau o f t h e Census. 1972 Census o f R e t a i l Trade; Area S e r i e s - Iowa. Washington, D . C . , 1974.
1 4 . U.S. Bureau 'of t h e Census. 1972 Census of Wholesale Trade; Area S e r i e s - Iowa. Washington, D . C . , 1974.

15. U.S. Department of Commerce. Bureau of Domestic Commerce. " S t a f f Study on t h e Impact of Nat iona l Beverage Conta iner L e g i s l a t i o n . " Washington, D.C . , October, 1975.
16. U.S. Env:ronmental P r o t e c t i o n Agency. The Beverage Con- t a i n e r Problem; a n a l y s i s and recommendations. Environ- mental P r o t e c t i o n Technology S e r i e s , Washington, D .C . , September, 1972.
17. U.S. Fede ra l Energy Adminis t ra t ion . "General P u b l i c Behavior and A t t i t u d e s Regarding: Beverage Con ta ine r s . " A r e p o r t p repared by Opinion Research Corpora t ion , P r ince ton , New J e r s e y .
18 . U.S. Sena te , N ine ty - th i rd Congress, Second Sess ion . Committee on Commerce. "Nonreturnable Beverage Conta iner P r o h i b i t i o n Act . " Washington, D . C . , 1 9 7 4 .
19. Waggoner, Don. Oregon's B o t t l e B i l l Two Years L a t e r , Oregon Environmental Counci l , P o r t l a n d , May, 1974.