the impact of social belonging on the academic …
TRANSCRIPT
THE IMPACT OF SOCIAL BELONGING ON THE ACADEMIC PERFORMANCE
OF FIRST-GENERATION STUDENTS AT MONTANA STATE UNIVERSITY
by
Christiane Nadine Oliveri
A dissertation submitted in partial fulfillment
of the requirements for the degree
of
Doctorate of Education
in
Adult & Higher Education
MONTANA STATE UNIVERSITY
Bozeman, Montana
April 2019

©COPYRIGHT
by
Christiane Nadine Oliveri
2019
All Rights Reserved

ii
DEDICATION
My dissertation is dedicated to my parents, who understood the value of higher
education and unquestioningly supported the pursuit of my college and graduate degrees.
My Dad worked overnights at a bank for years while I was in high school and college to
pay for my sister and I to attend college. He was a first-generation college and graduate
school student. My Mom had a relative who was the first woman to graduate from
college in the state of Nebraska. From very different backgrounds, they both instilled the
power and importance of education in me, and I can only hope that I have done the same
for the students I have worked with in my career thus far, and will for those yet to come.
I wish my mother was still on this earth to see me get my doctorate, but I know she is
watching proudly, in another place.
“I was something that lay under the sun and felt it, like the pumpkins, and I
did not want to be anything more. I was entirely happy. Perhaps we feel
like that when we die and become a part of something entire, whether it is
sun and air, or goodness and knowledge. At any rate, that is happiness; to
be dissolved into something complete and great. When it comes to one, it
comes as naturally as sleep.”
“My `Antonia”, Willa Cather

iii
ACKNOWLEDGEMENTS
I want to acknowledge the wonderful supervisors and colleagues who mentored
and guided me in my career thus far in higher education, who helped make it such a
meaningful and supportive experience that I decided to stay in the field and ultimately
pursue my doctorate: Camille Consolvo and Mike Dannells, Linda Overlock, and Bennie
Moses, among others. I am also so appreciative of the support and guidance that my
colleagues in the field of higher education and in my graduate program at Montana State
University, and also my colleagues at Eastern Washington University have given me. I
am so grateful to Tricia Seifert for her serendipitous timing in bringing her career to
Montana State University so that I could make the leap into finishing my doctorate, along
with her never-ending guidance and support from day one of the program all the way
through my dissertation. Finally, thank you to my entire committee: Sweeney Windchief,
Carrie Myers, Bryce Hughes, and Tricia Seifert, a lovely group of kind and intelligent
faculty who have been nothing but totally supportive to me throughout my time at MSU.

iv
TABLE OF CONTENTS
1. INTRODUCTION ...........................................................................................................1
Theoretical Framework .....................................................................................................9
Problem Statement .........................................................................................................19
Research Questions ........................................................................................................19
Delimitations ..................................................................................................................20
Limitations .....................................................................................................................20
Significance....................................................................................................................21
2. LITERATURE REVIEW ..............................................................................................24
Introduction ....................................................................................................................24
First-Generation College Students .................................................................................26
Campus Climate .............................................................................................................36
Social Stigma .................................................................................................................40
Stereotype Threat ...........................................................................................................43
Sense of Belonging ........................................................................................................51
Summary ........................................................................................................................62
3. METHODOLOGY ........................................................................................................66
Research Questions .......................................................................................................66
Research Design.............................................................................................................67
Institution .......................................................................................................................68
Sample............................................................................................................................72
Data Collection ..............................................................................................................73
Variables and Measurement ...........................................................................................75
Predictor Variables...............................................................................................75
Mediating Variables .............................................................................................76
General Belongingness Scale (GBS) ...................................................................76
Student Experiences Survey Items......................................................................78
Reconfigured Items .............................................................................................81
Control Variables ................................................................................................84
Outcome Variables..............................................................................................85
v
TABLE OF CONTENTS CONTINUED
Participants ......................................................................................................................87
Analysis...........................................................................................................................88
Data Conditioning and Assumption Checking .....................................................91
Research Question One .........................................................................................95
Research Question Two ........................................................................................96
Research Question Three ......................................................................................96
Research Question Four ........................................................................................97
Research Question Five ........................................................................................97
4. RESULTS .....................................................................................................................99
Research Questions .......................................................................................................99
Research Question One .......................................................................................99
Research Question Two ....................................................................................103
Research Question Three ..................................................................................109
Research Question Four ....................................................................................109
Research Question Five ....................................................................................115
Summary .....................................................................................................................118
5. CONCLUSION ...........................................................................................................119
Introduction ................................................................................................................119
Findings......................................................................................................................120
Research Question One ...................................................................................120
Research Question Two ..................................................................................122
Research Question Three ................................................................................124
Research Question Four ..................................................................................125
Research Question Five ..................................................................................129
Limitations .................................................................................................................132
Recommendations for Practice ..................................................................................134
Gathering Accurate Data on First-Generation Students ...............................134
Interventions that Build Social and Cultural Capital ....................................136
Psychological Interventions to Increase Belonging ......................................140
Summary ....................................................................................................................147
REFERENCES CITED ....................................................................................................149
APPENDICES .................................................................................................................162

vi
TABLE OF CONTENTS CONTINUED
APPENDIX A: Survey Items...............................................................................163
APPENDIX B: Survey Materials.........................................................................168

vii
LIST OF TABLES
Table Page
1. Descriptive Statistics for all Scales
and Continuous Variables ...............................................................................81
2. Factor Loadings from Principal Factor
Analysis with Varimax Rotation for a
Two-Factor Solution for GBS and Peer Involvement......................................84
3. Sample and Population Statistics .....................................................................87
4. Correlation Matrix of all Variables used in Study ...........................................94
5. T Test Results Comparing First-Generation and
Continuing-Generation Students on GBS Scale and
Belonging Updated Scale ...............................................................................101
6. T Test Results Comparing First-Generation and
Continuing-Generation Students on Peer Involvement
Scale and Peer Involvement Updated Scale...................................................101
7. Means, Standard Deviations, and Intercorrelations
for GBS and Predictor Variables ...................................................................104
8. OLS Regression Analysis Summary with Generational
Status Predicting Sense of Belonging, with Peer
and Faculty Involvement as Mediators, Controlling for
Pre-College Characteristics ...........................................................................105
9. Means, Standard Deviations, and Intercorrelations
for GBS Updated and Predictor Variables .....................................................107
10. OLS Regression Analysis Summary with Generational
Status Predicting Sense of Belonging_Updated,
With Peer Involvement_Updated and Faculty
Involvement as Mediators, Controlling for Pre-College
Characteristics ................................................................................................108
11. Logistic Regression Predicting College GPA ................................................111

viii
LIST OF TABLES CONTINUED
12. Logistic Regression with Belonging_Updated
and Peer Involvement Updated Predicting College GPA ..............................114

ix
LIST OF FIGURES
Figure Page
1. Relationship Between Sociological and Psychological
Factors in the Study .........................................................................................18
2. Proposed Process of Impact of First-Generation Status
upon Academic Performance and Persistence .................................................25
3. Conceptual Framework ...................................................................................90

x
ABSTRACT
In the United States, first-generation college students are significantly less likely
to persist in college and complete a four-year college degree than continuing-generation
students (Cataldi, Bennett, & Chen, 2018; DeAngelo & Franke, 2016; Engle & Tinto,
2008; Pascarella, Pierson, Wolniak, & Terenzini, 2004). The same is true at Montana
State University (MSU), where only thirty-one percent of first-generation students
graduate within six years (Montana State University, 2018c). It was hypothesized that
generational status would predict academic performance at MSU, and that sense of
belonging, along with peer and faculty involvement, would mediate the relationship. In
addition, a conditional effect was hypothesized, so that there would be an interaction
between generational status and belonging, with belonging being a stronger predictor of
college grades for first-generation students than for continuing-generation students.
A self-report online survey was utilized to assess peer and faculty involvement
and sense of belonging. The sample consisted of 184 first-year, first-time, part-time and
full-time students at MSU. Factor analysis was used to better delineate between peer
involvement and belonging scales. Logistic regression and linear regression were utilized
to determine the relationships between independent and dependent variables.
First-generation college students had significantly lower levels of influential
positive peer involvement when compared to continuing-generation students.
Specifically, they had lower levels of agreement that peers would help or listen if they
had a problem, and that it was easy to make friends at MSU. Peer involvement and
faculty involvement significantly predicted higher sense of belonging for all students.
Peer involvement had a negative impact upon college grades for all students, which
approached significance. Faculty involvement had a positive impact on college grades
for all students. Stigma/stereotype threat variables had an impact on college grades.
Sense of belonging did not significantly impact college GPA. Finally, a conditional
effect emerged for generational status and peer involvement upon college GPA, which
approached statistical significance.
Policies, programs, and services must be changed at institutions of higher
education to help first-generation college students feel more supported by their peers and
welcomed to campus, along with balancing social vs. academic priorities during college.

1
INTRODUCTION
Introduction
In the United States, we tend to espouse the view that education is the great
equalizer, and yet class disparities in higher education have actually increased over time
(Astin & Oseguera, 2004; Soria & Bultmann, 2014; Soria, 2015), and only thirty-four
percent of our nation’s citizens over age twenty-five hold four-year bachelor’s degrees
(NCES, 2017). In 2010, students coming from the top income quartile were ten times
more likely to earn a college degree by the age of twenty-four than those in the bottom
quartile; yet three decades ago, in 1980, these students were five times as likely to earn
their degree by the same age (Mortenson, 2010). Educational inequality may be
increasing, rather than decreasing over time. This reality contrasts with the vision of
many higher education reformers over the decades, among them Ernest Boyer, author of
Scholarship Reconsidered. He put forward a vision of higher education in service of the
public good, for the purpose of making the nation and the world a more democratic and
inclusive place (Boyer, 1990). We need a reimagining of the purpose and structure of
American higher education, from one focused on uniformity and the reproduction of
inequality, to one focused on validating the lives and experiences of all students.
Approximately one quarter of first-time (full and part-time) students in the U.S.
leave college between their first and second year (NCES, 2017a), and as of 2009, only
approximately fifty-nine percent of first-time full-time students entering a four-year
institution graduate with their bachelor’s degree within six years (NCES, 2017b). At
Montana State University (MSU); a land grant public research university, these numbers

2
are a bit lower than the national average: the six-year rate for students entering in 2012
was fifty-two percent (Montana State University, 2018c). College persistence, retention,
and graduation are important topics of research and are currently of great concern to state
legislators and institutions around the country, both private and public. It is essential to
expand our understanding of why certain groups of students might be more likely to leave
college than others, and why they persist, so that institutions can improve or alter what
they do to help students be successful and reach their potential.
Tinto’s (1993) research has illustrated the importance of students becoming
integrated into the campus environment, though more recent research has critically
examined the presumption that students must sever ties with their families and homes in
order to do. Researchers have also questioned the applicability to diverse populations of
students, such as commuters, students of color such as Latino students, and nontraditional
students (Braxton & Mundy, 2001; Hurtado & Carter, 1997; Kuh & Love, 2000; Lee,
Godwin, & Hermundstad, 2018; Rendon, 1992; Tierney, 1999). Tinto’s original work
focused on how the actions of students helped them integrate into the institution (or not)
(Tinto, 1993), versus the importance of the actions of the institution (and responsibility as
well), in assisting and supporting students in integrating and finding their fit (Tinto,
2012). A body of research, spearheaded by Astin’s (1984) work, has shown that getting
students involved with peers and faculty makes it more likely they will be satisfied and
persist (Astin, 1984; Pascarella & Terenzini, 1991, 2005; Mayhew, Rockenbach,
Bowman, Seifert, & Wolniak, 2016), and that feelings of belonging or fit are necessary
for persistence (Hurtado & Carter, 1997; Johnson, Soldner, Brown Leonard, Alvarez,
Kurotsuchi Inkelas, Rowan-Kenyon, & Longerbeam, 2007; Hausmann, Ye, Ward-
3
Schofield, & Woods, 2009; Strayhorn, 2012; Wells & Horn, 2015). There exists a
variety of terminology used to describe student integration or fit at institutions of higher
education. For example, one study may describe something as “fit,” another as “sense of
belonging,” and still another may seem to measure integration and involvement, and all
may call them “belonging” (Wolf-Wendel, Ward, & Kinzie, 2009).
First-generation college students, or students whose parents did not graduate from
a four-year institution, by some estimates are at least half of students currently in college
in the U.S. (NCES, 2017). In the NCES study of 2002 high school sophomores who
subsequently enrolled in higher education, fifty-eight percent were first-generation
college students using the above definition (NCES, 2017). Over the past few decades,
access to higher education has improved for first-generation students (Cataldi, Bennett, &
Chen, 2018; Chen & Carroll, 2005; Choy, 2001; Nunez & Cuccaro-Alamin, 1998;
Pascarella & Terenzini 1998; Pascarella, Pierson, Wolniak, & Terenzini, 2004), as
evidenced by the numbers of these students enrolling in higher education. Though first-
generation students are attending college at higher rates, (if we define first-generation as
those with parents who have not graduated from college), they are not graduating or
persisting as often as students who have parents who have completed a college degree
(Cataldi, Bennett, & Chen, 2018; Chen & Carroll, 2005; DeAngelo & Franke, 2016;
Engle & Tinto, 2008; Pascarella, Pierson, Wolniak, & Terenzini, 2004; Riehl, 1994;
Soria, 2015). At Montana State University, first-generation students are significantly less
likely to persist and graduate than continuing-generation students. Only thirty-one
percent of first-generation students at MSU graduate within six years, while fifty-two
percent of all entering students graduate (Montana State University, 2018c) .

4
Belonging in college is a contributing factor to success, persistence, and
graduation for all students (Hausmann, Ye, Ward-Schofield, & Woods, 2009; Hurtado &
Carter, 1997; Johnson, Soldner, Brown Leonard, Alvarez, Kurotsuchi Inkelas, Rowan-
Kenyon, & Longerbeam, 2007; Wells & Horn, 2015), but may be much more salient for
first-generation college students. Researchers studying first-generation students have
examined a variety of factors that appear to at least partially explain this phenomenon of
lower persistence among first-generation students. First-generation students are more
likely to be nontraditional students; older than twenty-five, married, have children, and
work while attending college (Nunez & Cuccaro-Alamin, 1998; Skomsvold, 2015).
There are also higher percentages of first-generation students who are students of color,
low-income, and non-native English speakers (NCES, 2017). First-generation students
tend to lack knowledge about higher education, especially in terms of the costs of college
and college choice and application process (Cataldi et al., 2018; Collier & Morgan, 2008;
Conley, 2010; Pascarella et al., 2004). These factors all present challenges that can make
it more difficult to access and pursue a college degree. In addition, studies have found
that first-generation students tend to come to college with lower high school GPAs and
lower SAT scores than their continuing-generation peers (DeAngelo & Franke, 2016;
Sackett, Kuncel, Arneson, Cooper, & Waters, 2009; Redford, Mulvaney Hoyer & Ralph,
2017; Riehl, 1994; Sirin, 2005), indicating that first-generation students often start off
less academically prepared (or less “college-ready”) for college. In one study, when
“college readiness,” (defined as academic preparation, along with factors such as
choosing a major prior to matriculation and amount of time spent studying each week)
was controlled for when comparing the effects of generational status upon persistence,

5
first-generation college students who were “college-ready” were just as likely to persist
beyond the first year as continuing generation students (DeAngelo & Franke, 2016).
Though overall, first-generation students tend to be less college-ready than their peers,
along with holding many characteristics that make it more difficult to complete college,
this can be evaluated from a deficiency perspective as well. In response, some
researchers focus on a more strengths-based model of first-generation student success in
college, rather than what could be labeled as the “deficiency viewpoint” taken by many
of the studies above. For example, one qualitative study found that the first-generation
students they interviewed developed the positive strengths of proactivity, goal direction,
optimism and reflexivity during college (Garrison & Gardner, 2010). A recent book
titled Becoming a Student-Ready College (Brown McNair, Bensimon, Cooper, Mcdonald,
& Major, 2016) has flipped the notion of college-readiness to focus on the institution’s
responsibility to be ready to support and serve all kinds of students. Finally, it is
important to note that first-generation students may come from low-income or working-
class families, but they may also have parents who work in the skilled trades or other
fields not requiring a bachelor’s degree and make enough money economically in the
middle-class. This overlap and yet distinction between low-income, working-class and
first-generation can cause problems with interpretation across research studies.
In addition to life responsibilities and lower academic preparation for college,
first-generation students also confront a campus climate that may not be welcoming to
the values and identities that they bring to college, which ultimately has a huge impact on
persistence (Synder & Trost, 2018). Prior to the passage of the Morrill Act in 1862 and
then implementation of the GI Bill in the 1940’s and the diversification of higher

6
education in the US, access to higher education was mostly for the middle to upper
classes of society (Thelin & Gasman, 2011; Thelin, 2011). The founding of institutions
of higher education in America was centered on educating future religious leaders
(Boyer, 1990; Thelin & Gasman, 2011). With the creation of the land grant university as
a result of the Morrill Act in 1862 came a move towards a practical college education in
agriculture and mechanical arts, and better access for those from the working classes
(Thelin & Gasman, 2011). Then in 1890, the second Morrill Act created historically
black institutions in the U.S. (Thelin & Gasman, 2011). Thus, the institution of higher
education in this country has been associated with class, or SES, from the beginning. It is
only beginning in the 19th century that higher education has significantly changed in
terms of the populations of students gaining access.
Cognitive intelligence is associated with class, or socioeconomic status, the
stereotype being that poor people are not as intelligent as middle class or wealthy people
(Soria, 2015). This stereotype, as most stereotypes, has a basis in reality: on average,
people in middle-upper income brackets tend to have higher IQs than those in lower
income brackets (Binet, 1911; Sirin, 2005; White, 1982). SAT scores tend to be
associated with wealth as well, so that for every $20,000 increase in parental income,
SAT scores also increase about ten-seventy points (College Entrance, Examination
Board, 2009). The assumption is that these test scores measure actual intelligence, rather
than one’s access to test preparation, good education, and other cultural advantages of the
wealthy.
Stereotypes about the poor and working-class have not been studied widely; when
class is included in research studies, it is often included as a control variable, rather than

7
the central focus of the study (Croziet & Millet, 2011). However, available research
tends to illustrate that negative stereotypes about the poor and working-class do exist.
People from lower SES groups are often stereotyped as lazy, ignorant, unintelligent, and
unmotivated (Cozarelli, Wilkinson, & Tagler, 2001).
An example of this stereotyping is Miller, Mclaughlin, Haddon, and Chansky’s
1968 study examining teacher perceptions of lower-class and middle-class children.
They found that teachers were more likely to perceive lower- class children as having
more detentions, having lower estimated IQs, participating less in extracurricular
activities, leaving school earlier, having parents less involved in school, and completing
fewer homework assignments. People tend to assume lower SES children have lower
academic ability than higher SES children (Desert, Preaux, & Jund, 2009). More recent
work has examined the effect of beliefs in meritocracy upon the social class achievement
gap, finding that the belief that ability and hard work lead to success increased the social
-class achievement gap (Darnon, Wiederkehr, Dompnier, and Martinot, 2018). Durante,
Tablante, & Fiske (2017) conducted a study examining stereotype content, and found that
poor people were stereotyped as warm, while wealthy people were perceived as cold, but
more competent.
Class, or socio-economic status, may overlap with generational status, since
family experience with higher education makes up part of the construct of SES, along
with income. Research with low-income and working-class students has illustrated that
these students appear to be stigmatized due to their status, and experience the negative
effects of stereotype threat (Croziet & Claire, 1998; Johnson, Richeson, & Finkel, 2011;
Spencer & Castano, 2007). The experience of identity threat or stereotype threat, in

8
which students internalize messages that they are not smart and do not belong in college,
is theorized to have a negative impact upon fit or feelings of belonging for first-
generation students (Mendoza-Denton, Downey, Purdie, Davis, & Pietrzak, 2002; Synder
& Trost, 2018; Walton & Cohen, 2007).
The theoretical underpinnings of the current study are based in theories of identity
and experience of stereotype threat (Steele, 1997, 2010; Steele & Aronson, 1995; Steele,
Spencer, & Aronson, 2002). For first-generation college students, who are more likely to
come from working-class and lower income families, they come face to face with a
climate that often subtly tells them they do not belong in college (Synder & Trost, 2018).
Due to the climate of the college environment, they may also be primed to be vigilant for
these environmental cues that signal they do not belong (Murphy & Taylor, 2011). If
situational cues indicate that they don’t belong and that their identity is a liability, then
the level of vigilance, or awareness, to messages and cues that one does not belong
increases. Stereotype threat, a psychological experience in which stigmatized
individual’s awareness of a well-known stereotype affects behavioral outcomes, is
characterized by a state of arousal and anxiety, impacting well-being, cognitive
functioning, and the ability to identify with the environment or domain in question or
stereotyped (Murphy & Taylor, 2011; Murphy & Zirkel, 2015; Steele, 2010). In the case
of first-generation college students, this domain or environment is higher education
(Hurst, 2010; Soria, 2015).

9
Theoretical Framework
Models of college student retention have been around at least since 1970, with
William Spady’s model focusing on drop-outs from higher education (Spady, 1970). The
transition to college poses a significant challenge for all students, but may be more
challenging for first-generation students, since the transition often involves a very
different environment than the one they have grown up in. Tinto’s (1993) theory of
student departure focuses on how and why students become or do not become socially
and academically integrated into the campus environment. Integration is defined as the
congruency between the student and institution, but Tinto also places the responsibility of
integration squarely upon the student (Tinto, 1993). The theory is that integration is a
necessary precursor to persistence and retention, and, eventually, graduation (Tinto,
1993). Although commitments (goals around completing college and commitment to a
specific college) and entering traits (age, race/ethnicity, income, etc.) are both important
predictors of integration and persistence, interactions are also a very important predictor
of persistence (Tinto, 1993). This “interactionalist” theory basically says that interactions
during college can lead to better integration; both social and academic, or, they can lead
to negative relationships or a lack of relationships, isolation, or so much social and
academic/intellectual challenge without accompanying supports that a student leaves the
institution (Tinto, 1993).
A number of critiques have been leveled at Tinto’s theory, since it places the onus
on the student to “integrate” into the college environment (Tierney, 1999). The theory
assumes this integration requires an abandonment of family, friends, and values

10
associated with racial/ethnic, first-generation, and working-class identities (i.e., “cultural
suicide”) (Rendon, 1992; Tinto, 2012; Tierney, 1999). Tinto himself, in his most recent
book (2012), has focused more on the actions and responsibility of institutions, rather
than the students, in improving college success, retention and graduation. Tierney argues
that Tinto’s theories reside within the assumption that underrepresented and racial/ethnic
minority students are lacking or deficient in a variety of ways and must assimilate into
the dominant culture of higher education in order to be successful students (Tierney,
1999). Rendon (1992) and Tierney (1999) argue that the definition of intellectual
development and the culture of the academy must change so that underrepresented
students and their backgrounds and identities are affirmed and validated. Rendon (1992;
1994) examined validation and the relationship to involvement and successful college
transitions. She discovered that especially for nontraditional and underrepresented
students, validation appeared to be a prerequisite for academic and social involvement in
college (Rendon, 1994). The components of validation included in and out of class
academic and interpersonal validation (Rendon, 1994). Most importantly, the validation
and involvement process was perceived by students as needing to be initiated by the
institution and institutional agents, and was not something students expected to initiate on
their own (Rendon, 1994). This indicates the shift needed: a shift away from the
expectation that students need to change their behavior, and toward the expectation that
institutions will need to intentionally create these interactions and supports.
Astin’s (1984) theory of involvement is closely related to Tinto’s (1993) theory of
student departure, in that Astin postulated that one of the outcomes of involvement is
persistence. Astin defines involvement as the investment of energy and time into an

11
object. Additionally, involvement happens along a continuum, so that different degrees
of involvement are manifested in different objects at different times, and it has
quantitative and qualitative features (hours spent participating in a student club in
addition to the quality of time spent- programs developed, level of leadership in club,
etc.) (Astin, 1984). Astin developed the I-E-O model, which stands for Inputs-
Environments-Outcomes, and provides a simple construct or model for how students
experience college. Inputs include variables such as a student’s parent’s income, high
school experiences such as GPA and SAT scores, gender and race; environments are any
experiences that occur during college (such as participation in learning communities,
interactions with faculty, doing study-abroad, for example), and outcomes are a myriad
number of learning and development - based variables, such as subject matter
competence, scores on GREs, and civic engagement (Astin, 1984).
Astin’s 1975 study found that “fit” was an important predictor of
retention/persistence as well, so that Black students were more likely to persist at HBCUs
vs. majority White colleges, religious students were more likely to persist at religious
colleges when their religious backgrounds were similar, and students from smaller
towns/rural areas were more likely to persist at smaller colleges vs. larger (Astin, 1975,
1984). This notion of “fit” is essential to the current study, in that fit and belonging may
be similar or even the same concept. The current study also follows Astin’s I-E-O model,
in that the I, or input, is represented by generational status along with other individual
variables, the E or environment is sense of belonging (or institutional fit), and the O, or
outcome, is academic performance.

12
The theory of cultural capital is an important theory as well, especially in terms of
the experiences of first-generation college students. The seminal work on social capital
comes from Bourdieu (1986), who proposed three parts of capital. The first, cultural
capital, consists of embodied, objectified, and institutional capital (Bourdieu, 1986).
Embodied capital are the long-lasting dispositions of the mind and body, objectified
capital are the goods and services such as books, pictures, etc., and institutional capital is
the capital acquired through association with institutions, such as a college degree
(Bourdieu, 1986). The second form of capital is social capital, which are the benefits and
resources that come to one as the result of social group membership, whether it is a
family, a club, fraternity/sorority, or alumnus of a college or university. Finally,
economic capital is the capital that can be acquired or bought through monetary means,
(Bourdieu, 1986). Bourdieu (1986) theorized that middle- and upper-class people
inherited and passed on cultural capital in its various forms through family lines, so that,
for example, attending college was an expectation. Prior to this work, Bourdieu
introduced the concept of habitus (1977), which he conceptualized as a system of
dispositions, perceptions, and actions dependent upon one’s social location in society. In
our current system of higher education, all of these forms of capital are needed to obtain a
college degree, which in Bourdieu’s terms would be an example of institutionalized
capital. Embodied capital- the language, knowledge, and values necessary to succeed in
college, and objectified and economic capital- textbooks, housing, and tuition resources
to score well on SATs, are all needed in order to succeed in college (Tierney, 1999).
First-generation students are often less likely to have access to this cultural capital since
they do not have family with a history of college attendance, and in addition are often

13
without access to the economic capital to pay for college and the time and space to
succeed there.
First-generation college students are least likely to have the knowledge about
college that is necessary to succeed. For example, this “college knowledge” (Conley,
2010) includes navigating the systems and processes necessary in college life, an
understanding of the culture that guides positive interactions with faculty and staff, and
the social and academic skills necessary for success. In addition, the differences between
high school and college, two organizational systems which developed differently
historically and in separate spheres, is vast. Thus, the actions and mindsets students are
familiar with from high school often do not assist them in college, where a higher level of
agency, different academic expectations, and time management skills are all needed for
success. On top of this difference is the influence of cultural capital discussed above,
since those with access to cultural capital are often better prepared for college by
attending private high schools, taking SAT prep courses, and having parents with high
levels of education. This has more recently been called the “hidden curriculum” of
college (Smith, 2013; Soria, 2015). The hidden curriculum reproduces the social class
hierarchy; which promotes the values of competition, independence, and rewards based
upon academic hierarchies, such as honor programs/colleges and dean’s lists. This
curriculum also includes the knowledge and skills necessary for success in college; such
as the types of books one should read to prepare for college and the experiences one
should have in college (living in residence halls, traveling over spring break, and doing
study abroad) (Soria, 2015).

14
Some of the barriers to learning this hidden curriculum are obviously financial:
studying abroad and traveling costs money. When working-class and first-generation
students are working in addition to attending college, they may simply not have the time
or energy to be involved in a student club or do an internship (for no pay). However,
there may be other factors at work as well. The assumption that students must learn this
“hidden curriculum” in order to succeed in college is considered problematic in and of
itself, since this assumption is rooted in the deficiency model. It puts the onus on the
student to assimilate into the culture of higher education, rather than on the institution to
change to be more welcoming and inclusive of first-generation students, along with
changing the academic curriculum and the institutional structure to represent these
students. Social belonging may play a role in the hidden curriculum, so that first-
generation students do not feel as if they fit or belong in in higher education due to a
campus climate or environment that reproduces the social class hierarchy present in
American society.
The definition of a “first-generation college student” varies across studies and
datasets. NCES (2017) defines a first-generation student as a student where neither
parent has attended college or graduated with a bachelor’s degree, but also collect and
analyze data on students who have at least one parent who has attended an institution of
higher education but not graduated. NCES analyzes their data for these two groups and
compares them to continuing generation students: those who have at least one parent who
has graduated with a bachelor’s degree (Cataldi et al., 2018). For the purposes of the
current study, unless specified otherwise, first-generation college students are defined as
those whose parent/s have not graduated from college. The reason for this is that the

15
retention and graduation outcomes for students whose parent/s attended college vs.
graduated from college are not different enough to validate treating these two groups very
differently. Cataldi et al. (2018) studied high school performance, college enrollment,
and college persistence and graduation for these three groups of students using three large
national data sets; the Education Longitudinal Study of 2002, the 2004/09 Beginning
Postsecondary Students Longitudinal Study, and the 2008/12 Baccalaureate and Beyond
Longitudinal Study. There were differences between the three groups for enrollment in
college: seventy-two percent of first-generation students had enrolled in postsecondary
education by 2012, while eighty-four percent of those whose parent/s had attended some
college had, and ninety-three percent of continuing-generation students had enrolled
(Cataldi et al., 2018). There were also differences between the groups for staying on the
persistence track, which is captured by three categories taken three years after
enrollment: stayed on the persistence track, left persistence track, and left without return
(Cataldi et al., 2018). Forty-eight percent of first-generation students stayed on the
persistence track, compared to fifty-three percent of those whose parent/s attended some
college, and sixty-seven percent of continuing-generation students (Cataldi et al., 2018).
There seem to be consistently larger differences between first-generation vs. continuing
students than there are between first-generation vs. some attendance. When examining
data by institutional type, the differences are even larger: when looking at public two-
year college enrollment, forty-two percent were first-generation students, compared with
twenty-nine percent for both some college attendance and continuing generation students
(Cataldi et al., 2018). The pattern was reversed for four-year institutions (public and
private). This indicates that there are likely multiple types of advantages that students

16
whose parent/s graduated from college tend to gain. The gains are likely economically
larger when a parent graduates from college, vs. only attends without getting a degree.
People with college degrees are more likely to earn more over a lifetime, and are able to
obtain professional jobs that pay higher salaries, along with gaining access to social
capital (Mayhew et al., 2016). However, there is also the cultural capital that comes from
college attendance and degree obtainment, and it may be that what is gained through
some attendance is this cultural capital (Bourdieu, 1986). Parents may be able to assist
students with college applications, assessments/tests, and financial aid, and assist with
understanding the navigational aspects of college life. However, it does not appear to be
enough, or to be the same as the life-changing benefits that come with a bachelor’s
degree. The current study defines first-generation students as the NCES (2017), Cataldi
et al., (2018) and TRiO (Upward Bound Program, 2017) programs do: neither parent has
graduated with a bachelor’s degree.
The current study argues that sense of belonging is the linchpin that holds models
of retention together and is missing from traditional models of retention. Sense of
belonging is a psychological phenomenon, and is related to Tinto’s theory of integration,
and to Astin’s involvement theory. However, belonging has been studied in the
psychological literature as far back as Anant (1966) and has appeared in the literature on
stigmatized groups and college persistence over the past twenty years (Hurtado & Carter,
1997; Johnson, Soldner, Brown Leonard, Alvarez, Kurotsuchi Inkelas, Rowan-Kenyon,
& Longerbeam, 2007; Hausmann, Ye, Ward-Schofield, & Woods, 2009; Wells & Horn,
2015). The transition to college signals a change to student’s belongingness status
(Baumeister & Leary, 1995). Separation from friends and family occurs, whether that

17
means a student is commuting to school a half hour away and living at home or moving
across the country. Separation may be conceptualized in terms of physical distance, but
also cultural distance. Though the type and degree of separation is varied, it constitutes a
change in belongingness status. New social groups and experiences are going to be
encountered, which means that perceptions are heightened around whether (or how)
students will fit into their new environment. First-generation students may be more
susceptible to threats to their sense of belonging during this transition (Croziet & Millet,
2011; Soria, 2015). Though belonging is a basic human motivation and need for everyone
(Anant, 1966, 1967, 1969; Baumeister & Leary, 1995; Durkheim, 1951; Maslow, 1954),
the current study proposes that belonging has a disproportional impact on academic
performance for those who are stigmatized, such as first-generation college students.
Indeed, authors examining race/ethnicity and belonging have discovered that stigmatized
racial groups (non-white) experience lower levels of belonging in college (Hurtado &
Carter, 1997; Johnson, Soldner, Brown Leonard, Alvarez, Kurotsuchi Inkelas, Rowan-
Kenyon, & Longerbeam, 2007; Hausmann, Ye, Ward-Schofield, & Woods, 2009; Wells
& Horn, 2015).
Spady, Tinto, Astin, and Bourdieu’s theories are characterized as sociological in
nature. They all account for characteristics students bring with them to college, and focus
on the interactions and experiences students have during college, which then lead to
certain outcomes (negative, such as dropping out, or failing, and positive, such as
involvement in clubs and organizations). In contrast, belonging is centered in
psychological processes. Figure one, below, illustrates the approach and connection the
current study makes between the sociological and psychological characteristics,

18
experiences, and outcomes. The current study takes a sociocultural viewpoint, focusing
on the importance of the climate and environment of college, which interacts with the
psychological experiences of identity threat and social belonging with a social category
or identity, first-generation status. The climate of higher education; the valuing and
promoting of the values, objects, language, and knowledge associated with a family
history of involvement with higher education, impacts the experience of identity or
stereotype threat, which impacts the ability for first-generation students to form the social
bonds necessary for belonging in college. Thus, the current study marries the
sociological and the psychological literature on retention.
Figure 1. Relationship between sociological and psychological factors in the study.
Academic
performance:
Behavioral
outcome
Belonging: Psychological experience and outcome
Identity/Stereotype threat: Psychological experience
Campus climate/environment: Sociocultural environment
Generational Status:
Social characteristic

19
Problem Statement
The purpose of the current study is to investigate the impact of generational
status, peer and faculty involvement, and sense of belonging upon the academic
performance of first-year students at Montana State University. It is hypothesized that
due to the stigma and stereotype threat felt by those students who do not have a family
history of involvement and familiarity with higher education, that first-generation college
students will have lower levels of belonging on campus than continuing-generation
students. Generational status is expected to moderate the impact of both involvement and
belonging upon academic performance, so that belonging will have a stronger
relationship to academic performance for first-generation students compared to
continuing-generation students. Finally, for the purposes of the current study, a first-
generation student is a student whose parents or guardians have not graduated with a
four-year baccalaureate degree.
Research Questions
1. Is there a difference in sense of belonging between first-generation and
continuing generation college students?
2. To what extent is any difference in students’ sense of belonging mediated by
peer and faculty interactions?
3. Is there a relationship between generational status and academic performance
as measured by GPA?

20
4. To what extent is this relationship mediated by sense of belonging and peer and
faculty interactions?
5. To what extent is the relationship between sense of belonging and academic
performance, controlling for peer and faculty interactions, moderated by
generational status?
Delimitations
The current study is a problem of practice. Specifically, it asks why first-
generation college students attending Montana State University (MSU), a public, land
grant, mid-sized research university, might be less likely to persist and graduate than
continuing-generation students. As such, the findings of the research will apply to this
single institution and are not necessarily applicable more broadly beyond MSU. In
addition, the current study focuses solely on first-year students. Sophomores and above
are not a part of the sample. It may be that belonging’s impact upon academic
performance is different for these students. Similarly, transfer students are not included
in this sample of first-time MSU students, and belonging may function differently for
them as well.
Limitations
The current study has a few limitations. First-generation status is a self-report
variable, by necessity, (since there is no other way to obtain this data), which may leave
room for misinterpretation or simply a lack of knowledge of parent’s/guardian’s
education levels. In addition, family income is not available, since it is a protected part

21
of student’s FAFSA data. Instead, the researcher decided to use Pell grant recipient
status as a substitute. It is fairly well-known that there are a number of problems with
using Pell grant status as a proxy for income, namely that it tends to underestimate the
number of low-income students (Delisle, 2017). This is due to the fact that depending
upon inflation and the way in which eligibility is determined, sometimes there are more
middle-income students who qualify for Pell grants (Delisle, 2017). Additionally, low-
income students who would qualify for Pell grants don’t necessarily apply for and obtain
them (Delisle, 2017).
Finally, the current research does not include a measure of anticipated belonging,
or pre-belonging, measured prior to the General Belongingness Scale (GBS). Therefore,
this limits the current research in that there is no way to examine student’s feelings of
belonging prior to transitioning to MSU.
Significance
Though several researchers have studied racial and ethnic minority students and
the impact of stigma on belonging and success in college, first-generation status has been
under-studied using these concepts. In addition, Montana State University has a fairly
significant population of first-generation students, and as a public land-grant institution,
one could argue that they have an obligation to guide and support these students through
college to graduation. Since these first-generation students have not traditionally had the
same access to higher education as those with a family history of higher education, and
many of them also belong to lower class/SES groups, they may experience feelings of
stigma in college which negatively impact belonging, due to their group status (Croziet &

22
Claire, 1998; Johnson, Richeson, & Finkel, 2011; Spencer & Castano, 2007). In addition,
first-generation students may experience stigma more strongly when there are more
salient cues present that they do not belong (Aries & Seider, 2005; Barratt, 2012;
Granfield, 1991; Jury, Smeding, Stephens, Nelson, Aelenei, & Darnon, 2017; Lehmann,
2007; Martin, 2015; Ostrove, 2003; Ostrove & Long, 2007; Soria, 2015; Soria et al.,
2014). If this is part of what is occurring for first-generation students at MSU, and could
help account for their lower rates of success, retention, and graduation, it could lead to
different interventions designed to address these issues. The current study attempts to
address these issues and inadequacies in the research.
Finally, almost half of the new first-time full-time students attending Montana
State University (MSU) do not graduate from MSU. In addition, only thirty-one percent
of first-generation students at MSU graduate within six years, while fifty-two percent of
all entering students graduate (Montana State University, 2018c). Losing half of the
incoming class prior to graduation, in addition to a large graduation gap between first-
generation and continuing-generation students, is not a positive indicator that the
institution is serving its students well. This statistic indicates a need to dig deeper and
investigate who is leaving, and why.
Though college access has improved, access without success might almost be
worse than no access at all. If students are encouraged to aspire to further education and
are invited into the world of postsecondary education, but they do not see themselves
represented and valued, and are not provided the tools, environment, or the support to
succeed there, they will leave. When they leave, they often leave with debt, frustrated,
and without a degree, and therefore unable to access the social, cultural, and economic

23
potential a four-year degree provides. The future of the nation depends upon our ability
to truly create educational environments that promote success for all; especially the most
marginalized and underprepared students. Maybe then the dream of the “New American
College” Ernest Boyer (1994) spoke of could be a reality; college for the public good,
rather than the private benefit.
24
LITERATURE REVIEW
Introduction
First-generation college students are less likely to graduate from college than their
continuing-generation peers (Astin & Oseguera, 2004; Cataldi et al., 2018; Walpole,
2007), possibly due to a multitude of reasons. Though access to college has improved
over the past few decades for underrepresented groups of students (Cataldi et al., 2018;
Chen & Carroll, 2005; Choy, 2001; Nunez & Cuccaro-Alamin, 1998; Pascarella &
Terenzini 1998; Pascarella et al., 2004), the ability to finish and obtain a degree remains
out of reach for too many students. Social belonging has been established in the
psychological literature as a basic human need, healthy levels of which result in lower
levels of anxiety and depression, good mental health, and a variety of motivational
behaviors. However, this body of research on belonging is just beginning to be applied to
college students in the campus environment, especially college students who are
underrepresented in institutions of higher education. It is important to investigate the role
of psychological belonging in the success of first-generation students in college. To do
so, current literature on the characteristics of first-generation students is presented below,
along with comparisons of first-generation characteristics and outcomes to continuing-
generation students. In addition, the definition of ‘first-generation student’ itself is
critiqued, since this definition can vary, thus changing the statistics and their meaning.
Next, a review of campus climate research, along with social stigma and stereotype
threat, the latent variables in the current study, is presented. Finally, the research on
social belonging is discussed, along with research on first-generation students and their

25
belonging in college, and the few studies that have empirically connected first-generation
status, belonging, and academic performance in college. First-generation students are
theorized to have a stigmatized status in the college environment, leading to the
experience of stereotype threat, a psychological experience impacting belonging, and
eventually academic performance in college. Figure two illustrates the connections
between these concepts, along with the process that is theorized to result in the outcome
of poor academic performance and lower likelihood of persistence. This follows the
manner and order in which these concepts will be presented in the chapter.
Figure 2. Proposed process of impact of first-generation status upon academic
performance and persistence.
Stigmatized Identity (First-generation
student status)
Institutional Climate/environmental
Cues
The experience of stereotype threat
Anxiety and arousal interfering with well
being and the ability to identify with college
Low Belonging
Poor academic performance and lower
likelihood of persistence

26
First-Generation College Students
The term “first-generation student” has been used for at least a few decades
(Billson & Terry, 1982; Bui, 2001; Davis, 2010; Hsiao, 1992; Pascarella & Terenzini,
1998) to identify students who are the first in their family to attend college. The first use
of the term in legislation was through the H.R. 5192, Education Amendments of 1980,
after the term was used by the Council for Opportunity in Education (COE) to identify
underserved students without utilizing racial/ethnic terminology (Whitley, Benson, &
Wesaw, 2018). The COE champions TRiO, along with other education opportunity
programs. TRiO, a federal program operating in every state and serving disadvantaged
students, was created in 1964 as a result of the Educational Opportunity Act (Upward
Bound Program, 2017). During fiscal year 2013, TRiO programs served 800,000
students, including first-generation students (Federal TRiO programs 50th Anniversary
Fact Sheet, 2017). TRiO’s definition of “first-generation” is that neither of the student’s
parents holds a bachelor’s degree (Upward Bound Program, 2017), which includes
students whose parent or parents enrolled in college but never graduated, along with
those who graduated with associate degrees. However, the National Center for Education
Statistics (NCES) and their studies such as the Beginning Postsecondary Students
Longitudinal Study and the Baccalaureate and Beyond Studies, define first-generation
college students are those whose parents never enrolled in post-secondary education at
all; a much more restrictive definition (NCES, 2017c). The most recent study issued
from the NCES on first-generation students defines them as students whose parents have
never enrolled in college (Cataldi et al., 2018). Other independent research studies define

27
first-generation inconsistently as well. The result is that we as a nation do not have a
consistent definition of “first-generation”, making it challenging to consistently report on
the outcomes associated with this status.
The differences in definitions of first-generation students lead to some major
differences in reporting on how many of these students exist, along with whether their
numbers are increasing or decreasing in terms of enrollment and graduation. For
example, a recent study of high school sophomores in 2002 who later enrolled in
postsecondary education (NCES, 2017d) asked students about both parental enrollment
and graduation from college. This study found that twenty-four percent of these students
were “first-generation” students, or students whose parents never enrolled in or graduated
from college, and that another thirty-four percent had at least one parent who had some
post -secondary experience, but did not hold a degree (NCES, 2017d). Only forty-two
percent of these students had at least one parent with a bachelor’s degree or higher
(NCES, 2017d). The most current statistics from the National Center for Education
Statistics (NCES, 2017) state that for students taking the Beginning College Student
Survey in 2011-12, sixty-two percent indicated that neither parent had a bachelor’s
degree. By most of these estimates then, “first-generation” college students, if they are
defined as students whose parents did not graduate from post-secondary education, are
now over half of new students entering programs and institutions of higher education in
the United States (Davis, 2010; NCES, 2017). Using the definition of first-generation
that neither parent holds a bachelor’s degree, first-generation student numbers have
increased steadily over the past two or three decades, and are also at least half, possibly
the majority, of new college students (Chen & Carroll, 2005; Choy, 2001; Nunez &

28
Cuccaro-Alamin, 1998; Pascarella & Terenzini 1998; Pascarella, Pierson, Wolniak, &
Terenzini, 2004).
The NCES report, First-generation students in postsecondary education utilizes
data from the National Longitudinal Study, which include students enrolled in
postsecondary education between 1992-2000. These students were part of a nationally
representative sample of eighth graders across U.S. schools who were tracked from
middle school through postsecondary education (Chen & Carroll, 2005). Twenty-two
percent of this sample were first-generation college students, defined as students whose
parents never attended college (Chen & Carroll, 2005). Since many institutions do not
track generational status, it is impossible to know for certain the exact number of first-
generation students attending postsecondary institutions at any point in time (Hsiao,
1992).
The problem with differing definitions of first-generation students is that
seemingly conflicting data exist. The most recent NCES report from February of 2018
indicates that numbers of first-generation students, defined as students whose parents
have never attended college, are declining slightly; five percent from the year 1999-2000
to 2011-2012 (Cataldi et al., 2018). When comparing this statistic with other evidence
that seems to show more first-generation students attending college, this may indicate
that there are more people in the U.S. who are attending college but not graduating, while
in the past these people would never have attended at all. This group of people would not
be captured by the NCES, which is defining first-generation as those whose parents never
attended any college. It could be argued that more people attending college yet not

29
graduating is worse than no college at all, since these students often accumulate debt and
yet are without any credential to show for it.
In summary, the percentages of first-generation students in the U.S., along with
the growth in college attendance for this population, depends on where the data comes
from. Using the definition of “parent or parents who have not graduated with a
bachelor’s degree” results in much larger numbers of first-generation students than the
definition of “parent or parents who have never attended college at all.” In addition, the
most current data on first-generation students appears to show that the differences in
persistence and graduation between students whose parents attended some college and
first-generation students are fairly small (Cataldi et al., 2018). This may indicate that
some college attendance is not as beneficial as graduating with a credential. The benefits
that come with one parent with a bachelor’s degree seem to far outweigh the benefits that
come from some college attendance without a degree.
First-generation students identify with ethnic and racial groups across the
spectrum, but seem to lean heavily towards underrepresented and minoritized
ethnic/racial groups. For example, one study (Saenz, Hurtado, Barrera, Wolf, & Yeung,
2007) found that eighty-seven percent of first-generation students entering postsecondary
study in 2005 were students of color, and Lohfink & Paulsen (2005) found that the first-
generation students in their study were disproportionately non-white, low-income, and
female. According to NCES data, when looking at generational status along with
ethnicity/race, fifty-one percent of White students in the study were first-generation,
along with sixty-nine percent of Black/African-American students, seventy-two percent
of Latino/Hispanic students, forty-three percent of Asian students, seventy-four percent

30
of American Indian or Alaska Native students, and forty-eight percent of Native
Hawaiians/Pacific Islanders (NCES, 2017).
Although first-generation students can be defined as students whose parents did
not graduate from college, this can include working- class and middle-class families,
since some jobs that do not require a college degree have the potential for a high income,
such as in the skilled trades. Social class intersects with first-generation status and race
but is not consistently measured by any major educational surveys. Since the NCES does
not collect data on social class, Pell grant status may be a somewhat acceptable proxy.
Pell grants, especially the largest amount ($4,500-$5,550/year), are for financially needy
students, since eligibility is based upon belonging to lower-income brackets. In 2011-12,
for those students who did not receive Pell grants, forty-five percent were first-generation
college students, while for the neediest students receiving the highest amount of Pell
grants, eighty percent were first-generation students (NCES, 2017). According to these
statistics, most students in the U.S., along with the majority in almost every ethnic group,
and the overwhelming majority of Pell grant recipients, are first-generation college
students. Even those students who are not Pell-eligible are close to fifty percent first-
generation students (NCES, 2017). Clearly, increased access to college for those who
have been traditionally underrepresented in higher education is working. In addition, the
moniker “first-generation student” includes a wide variety of social classes and ethnic
groups, though being a student of color and/or financially needy appears to make it more
likely that one will also be first in their family to attend college (NCES, 2017). First-
generation students are often dealing with multiple identities, which may intersect,
creating more, or less, privilege and differing types of challenges and experiences during

31
college. For example, being a Latina and first-generation college student is different in
many ways than being a white male first-generation student. The Latin or Hispanic
culture is not necessarily represented or deeply ingrained in higher education, whether
one is examining the academic curriculum, or the values represented in the academy
(Rendon, 1992; 1994). Orbe (2004), in his qualitative study of first-generation students,
found that women and students of color were much more likely to be conscious of being
the first in their family in college, and to feel the weight of that experience, both in
positive and negative ways. In contrast, being white, male, and/or middle-upper class
seemed to keep the self-concept of being first-generation on the edge of consciousness
and identity (Orbe, 2004).
Though there are a large number of first-generation college students attending
institutions of higher education in the U.S., they are also at a disadvantage in terms of
college success when compared to their continuing-generation peers, for a multitude of
reasons and in a multitude of differing areas (Bowen, Kurzweil & Tobin, 2005; Collier
& Morgan, 2008; Ishitani, 2003; Nunez & Cucarro-Alamin, 1998; Pascarella, Pierson,
Wolniak, & Terenzini, 2004; Prospero & Vohra-Gupta, 2007; Stephens, Markus,
Fryberg, Johnson, & Covarrubias, 2012a; Terenzini, Springer, Yaeger, Pascarella, &
Nora, 1996). First-generation students tend to lack knowledge about higher education,
especially in terms of the costs of college and application processes (Cataldi et al., 2018;
Collier & Morgan, 2008; Conley, 2010; Pascarella et al., 2004). This is not surprising,
since they do not have parents who are able to share expertise and knowledge with them.
First-generation students also show lower levels of pre-college academic preparation and
tend to have lower SAT scores and lower high school GPAs than continuing-generation

32
students (DeAngelo & Franke, 2016; Redford, Mulvaney Hoyer & Ralph, 2017; Riehl,
1994; Sackett, Kuncel, Arneson, Cooper, & Waters, 2009; Sirin, 2005). First-generation
college students are also more likely to be older, have lower incomes, be married, and
have dependents than non-first-generation students (Nunez & Cuccaro-Alamin, 1998;
Skomsvold, 2015).
Once enrolled in college, the differences (and often the disadvantages), continue.
At private non-profit institutions, first-generation students were more likely to take
remedial/developmental courses than their peers (Nunez & Cuccaro-Alamin, 1998), and
overall, fifty-five percent of first-generation students take some remedial courses during
college (Chen, 2005). First-generation students also earn fewer credits during their first
year of college; an average of eighteen compared to twenty-five for continuing-
generation students (Chen, 2005). Taking several remedial courses, along with lower
credit loads, are both associated with lower retention and graduation rates (Chen, 2005).
Cataldi et al. (2018) found that proportionally fewer first-generation college students,
compared to students whose parents had graduated from college, took higher level math
and calculus courses, and had enrolled in AP (Advanced Placement) credits or IB
(International Baccalaureate) credits during high school. In addition, first-generation
students also have significantly lower undergraduate GPAs both their first year and
continuing over the course of their college careers (Chen, 2005; Ramos-Sanchez &
Nichols, 2007; Riehl, 1994). Financial issues differentially affect first-generation
students as well (Martinez, Sher, Krull, & Wood, 2009; Mayhew, Rockenbach, Bowman,
Seifert, & Wolniak, 2016). First-generation students are significantly more debt-averse
than their peers, and debt has a stronger association with attrition for them (Mayhew et

33
al., 2016; Somers, Woodhouse & Cofer, 2004). These students are less likely to live on
campus, and work significantly more hours per week than students whose parents have
graduated from college (Engle & Tinto, 2008; Pascarella et al., 2004). This may be
because first-generation students are more likely to come from families with less funds
available to pay for education (Bui, 2002; NCES, 2017). These are all experiences that
put these students at a disadvantage in terms of college success and completion.
In terms of social differences, first-generation students tend to have lower levels
of peer interactions outside of academic courses, and less extracurricular involvement in
college, along with lower levels of social and academic integration (Pascarella et al.,
2004; Rubin, 2012). Since interactions with one’s peers has an important effect upon
learning, involvement, and belonging in college (Astin, 1994; Pascarella & Terenzini,
1991, 2005), this puts first-generation students at a disadvantage. Terenzini et al. (1996)
assessed students attending institutions participating in the National Study of Student
Learning (NSSL), and found that first-generation students studied fewer hours, completed
fewer first-year credit hours, took fewer humanities and fine arts courses, and were less
likely to perceive that faculty were concerned about students and teaching. Interestingly,
several authors have found that these differences in outcomes (in learning gains,
involvement, retention/persistence, etc.) existed between first- and continuing -generation
students, even when all pre-college characteristics (HS GPA, SAT scores, SES,
institution type, attendance status, etc.) were controlled (Nunez & Cuccaro- Alamin,
1998; Pascarella et al., 2004).
Other studies have been conducted evaluating the cognition and psychology of
first-generation students, with varying results. Self-efficacy has been found to have an

34
important impact upon adjustment to college (Ramos-Sanchez & Nichols, 2007).
Although not necessarily the same as self-efficacy, Hellman (1996) found that first-
generation students had lower self-perceptions of their academic ability than continuing-
generation students, and Ramos-Sanchez & Nichols (2007) also concluded that first-
generation students had lower self-efficacy than continuing-generation students and
found a positive relationship between self-efficacy and college adjustment for all
students. In a study evaluating belonging and mental health resources, Stebleton, Soria,
& Huesman (2014) found that first-generation students had higher levels of depression
and stress than continuing-generation students.
The characteristics and experiences of first-generation students result in
differences in retention and graduation rates for students who are first in their family to
attend college. These students are significantly more likely to leave college, when
compared to their peers, by the end of their first year (Cataldi et al., 2018; Engle & Tinto,
2008; Pascarella et. al., 2004). They are also less likely than continuing generation
students to remain enrolled in college or attain a BA degree after five years (Ishitani,
2003; Pascarella et. al., 2004). The most recent NCES report states that thirty-three
percent of first-generation students whose parent/s do not have a bachelor’s degree are
not enrolled three years after beginning college, compared to only fourteen percent of
students who have at least one parent with a bachelor’s degree (Cataldi, Bennett, & Chen,
2018). These differences in persistence and retention exist even when studies control for
pre-existing characteristics (gender, race, family income, academic standing, etc.) (Nunez
& Cuccaro-Alamin, 1998; Ishitani, 2003). Since first-generation students are not
graduating at a similar rate to their continuing generation peers, they are

35
disproportionately burdened with college debt, without the benefit of a college degree
that would allow them access to better careers and a higher standard of living.
The results of studies discussed above would suggest there is more going on than
simply different levels of academic preparation, less involvement in college, and a lack of
“college knowledge,” which could all be addressed by skill-based and remedial
programs. What these studies lack, however, is they do not tell us why- why are these
students often less involved, less integrated, and less confident than their peers? As Rubin
(2012) makes clear in his study on social class differences in social integration in college,
we know there are differences; future studies need to focus on why differences exist.
Then we may focus on how to address the issue, and whether we need to better assimilate
students, change institutions, or both (Rubin, 2012).
Although we appear to know a fair amount about first-generation student’s high
school preparation, experiences in college, and differing retention and completion
outcomes, we do not know enough about their cognitive or psychological development or
experiences during college (Pascarella et al., 2004). More recent research conducted just
over the past several years has focused on the impact of the campus climate or
environment on the psychology of first-generation students; specifically on the negative
effects of endorsing interdependent goals and needs within the more independent culture
of higher education (cultural mismatch) (Phillips, Stephens, & Townsend, 2016;
Stephens, Townsend, Markus, & Phillips, 2012b), on the effects of utilizing value
affirmations to boost these student’s academic achievement and counter the effects of
feeling like an outsider in education (Layous, Davis, Garcia, Purdie-Vaughns, Cook, &
Cohen, 2017) and on affirming feelings of independence to boost achievement (Tibbetts,
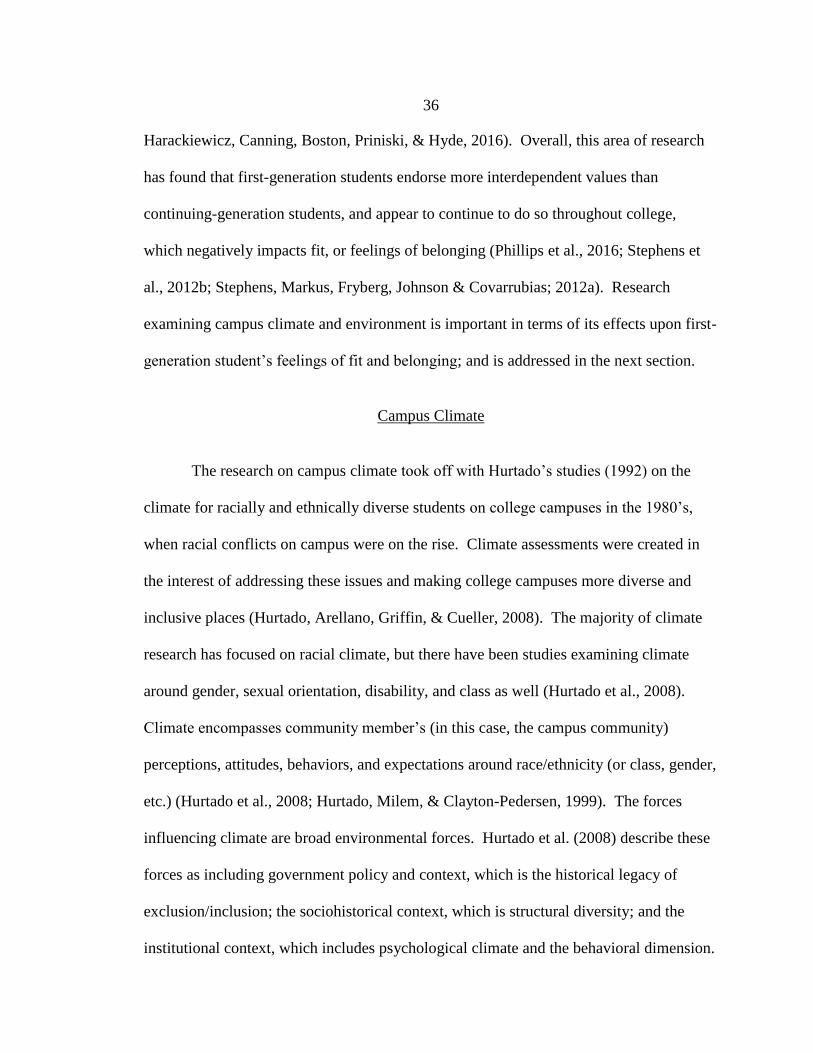
36
Harackiewicz, Canning, Boston, Priniski, & Hyde, 2016). Overall, this area of research
has found that first-generation students endorse more interdependent values than
continuing-generation students, and appear to continue to do so throughout college,
which negatively impacts fit, or feelings of belonging (Phillips et al., 2016; Stephens et
al., 2012b; Stephens, Markus, Fryberg, Johnson & Covarrubias; 2012a). Research
examining campus climate and environment is important in terms of its effects upon first-
generation student’s feelings of fit and belonging; and is addressed in the next section.
Campus Climate
The research on campus climate took off with Hurtado’s studies (1992) on the
climate for racially and ethnically diverse students on college campuses in the 1980’s,
when racial conflicts on campus were on the rise. Climate assessments were created in
the interest of addressing these issues and making college campuses more diverse and
inclusive places (Hurtado, Arellano, Griffin, & Cueller, 2008). The majority of climate
research has focused on racial climate, but there have been studies examining climate
around gender, sexual orientation, disability, and class as well (Hurtado et al., 2008).
Climate encompasses community member’s (in this case, the campus community)
perceptions, attitudes, behaviors, and expectations around race/ethnicity (or class, gender,
etc.) (Hurtado et al., 2008; Hurtado, Milem, & Clayton-Pedersen, 1999). The forces
influencing climate are broad environmental forces. Hurtado et al. (2008) describe these
forces as including government policy and context, which is the historical legacy of
exclusion/inclusion; the sociohistorical context, which is structural diversity; and the
institutional context, which includes psychological climate and the behavioral dimension.

37
Importantly, Hurtado and colleagues (2008) found in their studies that perceptions of
campus climate and actual experiences of discrimination are not always directly related,
and are separate constructs. Students could, and often did, perceive racial hostility, yet
did not necessarily experience direct discriminatory behavior from others on campus
(Hurtado, 1994; Hurtado et al., 2008). Finally, a number of studies assessing racial
campus climate have found that perceptions of a hostile climate can affect outcomes,
especially for students of color (Hurtado, 2008). For example, Hurtado found that Latino
students perceiving a negative climate for diversity had lower sense of belonging than
those who did not perceive such a climate (2005). The more positive interactions with
diverse peers, along with participation in academic support programs, the higher their
levels of belonging (Hurtado & Ponjuan, 2005). Other climate research has found that
perceptions of a hostile climate are not only related to lower belonging, but to lower
academic performance as well (Fischer, 2007; Nora & Cabrera, 1996). However, many
of these studies are plagued by methodological problems that make it difficult to attribute
the differences in outcomes solely to race (Lascher & Offenstein, 2012). A climate
assessment (the SERU) conducted with large public institutions indicated that student’s
agreement that “students of my race/gender/SES are respected on campus,” dropped
between 2012-2017 (Soria, 2018). The largest drop occurred in 2016, the year of the
presidential election, possibly indicating the negative effect the current political climate is
having upon campus climate (Soria, 2018).
Though typically researchers have examined campus climate in light of race and
ethnicity, some researchers have examined class, and/or first-generation status.
Institutional climate towards socioeconomic diversity appears to affect lower-SES

38
student’s feelings about their fit with the student body and perceptions of the diversity of
the institution (Browman & Destin, 2016; Granfield, 1991; Reay, Crozier, & Clayton,
2009). For example, warmth cues (as opposed to chilliness cues) increased lower-SES
student’s academic efficacy, expectations, and implicit associations with high academic
achievement (Browman & Destin, 2016). The cues for the chilly climate condition for
low SES students included written descriptions of the campus which focused on the
wealth of the students and the campus, including a lack of need for financial aid, high
tuition costs, and a large college endowment. The warmth cues involved statements
about the majority of students receiving financial aid, and the commitment of the
university to the work-study program; promoting the overall idea that the college was
interested in socioeconomic diversity (Browman & Destin, 2016).
Educational settings are “classed” in the sense that cues in the campus
environment indicate the type of behavior that is encouraged, acceptable and rewarded,
and these behaviors are rooted in class (Browman & Destin, 2016; Granfield, 1991;
Murphy & Zirkel, 2015; Reay, Crozier, & Clayton, 2009; Synder & Trost, 2018; Soria,
2015). Simple overt cues include things such as visual indicators of class, such as style
of dress and speech. An example of a more subtle environmental cue is the manner in
which values are enacted on a campus. Meritocracy is the belief that through hard work
and a level playing field, anyone can rise to the top; a value often expressed at institutions
of higher education. Students coming from working-class backgrounds often know
through their own personal and familial experience this is not the case, and yet tend to
endorse these values anyway. Interdependent vs. independent values is another example
of a more subtle cue in the environment. Universities tend to promote the notion that

39
independence is a positive and sought-after mode of operation during college. First-
generation college students have been found to value interdependence (in contrast with
continuing-generation students), vs. the values of separation, independence, and self-
reliance promoted by middle and upper classes (and institutions of higher education)
(Phillips et al., 2016; Stephens et al., 2012b; Stephens, Markus, Fyrberg, Johnson &
Covarrubias; 2012a).
Human beings read these cues in the environment and use them to determine
whether they fit in and belong (Aries & Seider, 2005; Granfield, 1991; Martin, 2015;
Ostrove, 2003). For example, Aries & Seider (2005) found that lower-income students
noticed the economic capital of other students- their dorm furnishings, clothing, and
vacations- and those attending private Ivy-league institutions discussed these more often,
with more anxiety, than those students attending public state institutions. Orbe (2004), in
his qualitative study of first-generation students and identity, found that many first-
generation students had a distinct awareness of the privileges of other students whose
parents had attended college and had money. One Latina student talked about the
benefits her roommate had in terms of re-taking the SAT and taking a prep course in high
school, because her father understood this option was available, and had the money to
pay for it (Orbe, 2004). Though this study does not explicitly examine environmental
cues, it does examine climate and student perceptions. Ultimately, these cues in the
environment affect perceptions, and are what creates a “campus climate.” For example,
Synder & Trost (2018) studied generational status and perceptions of campus climate at
large research universities, using data from the Student Experience in the Research
University (SERU). They found that continuing-generation students, or those whose

40
parents had obtained a four-year college degree, reported feeling more comfortable with
the climate for diversity and inclusivity on campus. Synder & Trost (2018) also found
that these continuing-generation students were significantly more likely than the first-
generation students to report feeling that others of their race/ethnicity were respected on
campus, and that others of their SES were respected as well. Along with an indicator that
first-generation students seem to be experiencing a less-welcoming campus climate or
environment, this is also an indicator of the intersection between generational status, race,
and class.
Identity, self-perceptions, and perceptions of the college environment matter, and
they matter immensely. The most recent research on first-generation students tells us that
students evaluate whether they are welcome, whether they will fit into the environment,
and whether their values and ideals will be valued in the culture or climate of higher
education. Further, their conclusions have an important impact upon their academic
performance and success. It appears there are deeper cognitive and psychological effects
in college that impact the achievement of students who are first in their family to attend
college. Studies on stereotype threat and stigma and the relationship to social belonging
are enlightening in terms of explaining the experiences and outcomes of first-generation
college students.
Social Stigma
Goffman (1963) conducted what is widely viewed as the seminal work on stigma
in the 1960’s. He proposed that people belonging to “discredited” social groups
consciously manage the way in which others see them and their identities. The process of

41
devaluation of certain social groups, and the individuals that belong to them, affect these
individuals’ sense of self, and result in stress and anxiety (Goffman, 1963). Stigma is a
social construction, and stigmatized individuals are “marked.” These discrediting marks
can be visible or invisible, linked to appearance (such as a facial deformity) or to group
membership, (such as working-class individuals) (Crocker & Major, 1989; Goffman,
1963; Major & O’Brien, 2005). In addition, the stereotypes and perceptions about
stigmatized individuals are shared widely in the culture or society, and then become the
reason or basis for excluding or avoiding stigmatized members (Major & O’Brien, 2005).
Stigma and the processes that can occur because of stigma can lead to negative
emotions and impact self-esteem. Some of these processes include negative treatment
and direct discrimination, expectancy confirmation processes, automatic stereotype
activation, and identity threat processes (Major & O’Brien, 2005). Identity threat, often
called stereotype threat as well, is the process central to the current study (Major &
O’Brien, 2005; Steele, 2012). Stigma by itself is not associated with negative outcomes;
rather the psychological processes triggered by stigma result in negative outcomes, which
will be discussed in the next section.
Since Goffman’s work on stigma and suggestion that lower social class could be
considered a stigma, some researchers have focused on the perceptions and self-concepts
of working class and lower SES class students within the realm of higher education,
especially in fields or types of institutions not historically friendly to working class/low-
income students (Aries & Seider, 2005; Barratt, 2011; Granfield, 1991; Jury, Smeding,
Stephens, Nelson, Aelenei, & Darnon, 2017; Lehmann, 2007; Martin, 2015; Ostrove,
2003; Ostrove & Long, 2007; Soria, 2015; Soria et al., 2014). Students belonging to

42
lower social classes (and first-generation students as well, when this was assessed)
expressed feelings of not fitting in or belonging, especially on more elite or private
college campuses (Aries & Seider, 2005; Soria et al., 2014); “imposter syndrome”
(Granfield, 1991) reported depression and anxiety (Stebleton, Huseman, & Soria, 2014);
and lower levels of social integration (Soria et al., 2014). In addition, working- class
students sometimes expressed their values in a positive manner and took pride in them as
well, as in Martin’s (2015) study illustrating these student’s values of hard work,
financial responsibility, and self-reliance.
Lower-income and working-class students feel “different.” Aries & Seider (2005)
found in their qualitative study that lower-income students noted the economic capital of
other students in their possessions: electronic equipment, dorm furnishings, designer
clothes, cars, meals at off- campus restaurants, and vacations. The students made many
references to this evidence of social class in their interviews. The themes emerging from
these interviews centered around feelings and affect: feelings of inadequacy around their
articulateness (or lack thereof) and regional accents, their self-presentation, their lack of
money, and feeling excluded based upon class (Aries & Seider, 2005). Students
attending state colleges (as opposed to a private Ivy-league institution) discussed these
feelings and concerns much less often. They did not discuss feeling powerless and were
not particularly aware of their speech or accents. However, the authors did find that these
students were aware of being judged as ‘less than’ when interacting with more wealthy
students (Aries & Seider, 2005). The authors concluded that the type of college attended
significantly impacts student’s relationship between their class identity and the college
experience. In addition, the first-generation students in the study showed the greatest
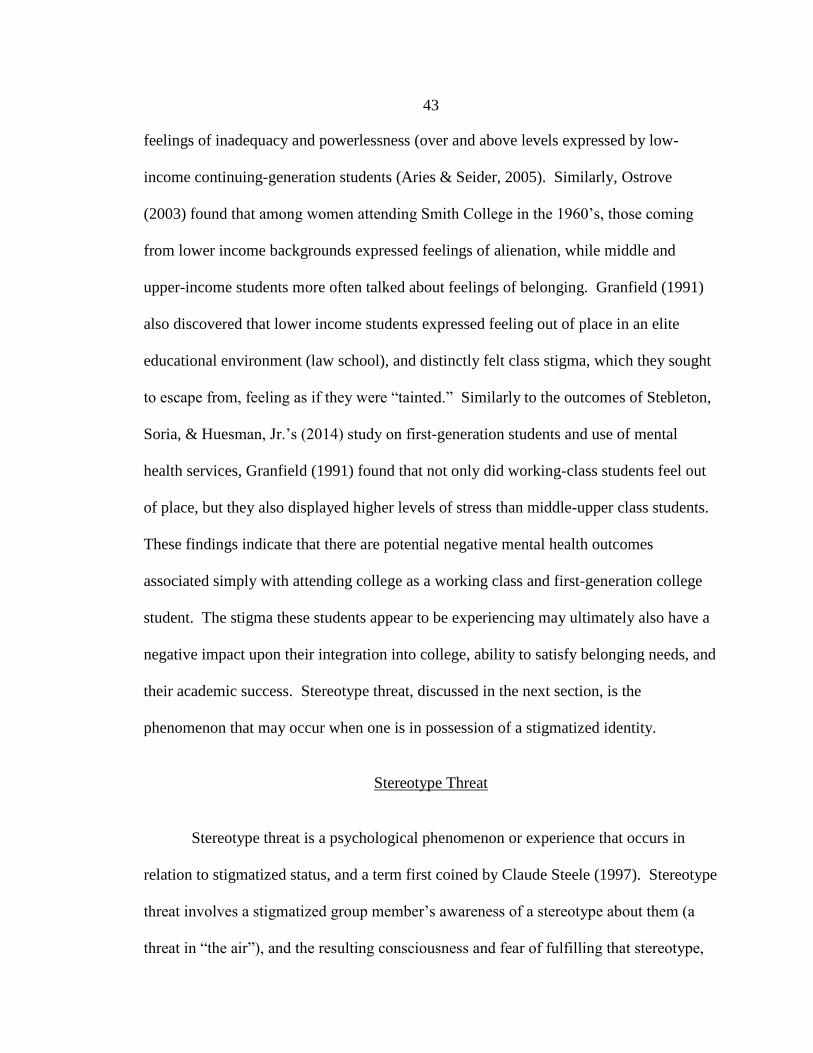
43
feelings of inadequacy and powerlessness (over and above levels expressed by low-
income continuing-generation students (Aries & Seider, 2005). Similarly, Ostrove
(2003) found that among women attending Smith College in the 1960’s, those coming
from lower income backgrounds expressed feelings of alienation, while middle and
upper-income students more often talked about feelings of belonging. Granfield (1991)
also discovered that lower income students expressed feeling out of place in an elite
educational environment (law school), and distinctly felt class stigma, which they sought
to escape from, feeling as if they were “tainted.” Similarly to the outcomes of Stebleton,
Soria, & Huesman, Jr.’s (2014) study on first-generation students and use of mental
health services, Granfield (1991) found that not only did working-class students feel out
of place, but they also displayed higher levels of stress than middle-upper class students.
These findings indicate that there are potential negative mental health outcomes
associated simply with attending college as a working class and first-generation college
student. The stigma these students appear to be experiencing may ultimately also have a
negative impact upon their integration into college, ability to satisfy belonging needs, and
their academic success. Stereotype threat, discussed in the next section, is the
phenomenon that may occur when one is in possession of a stigmatized identity.
Stereotype Threat
Stereotype threat is a psychological phenomenon or experience that occurs in
relation to stigmatized status, and a term first coined by Claude Steele (1997). Stereotype
threat involves a stigmatized group member’s awareness of a stereotype about them (a
threat in “the air”), and the resulting consciousness and fear of fulfilling that stereotype,
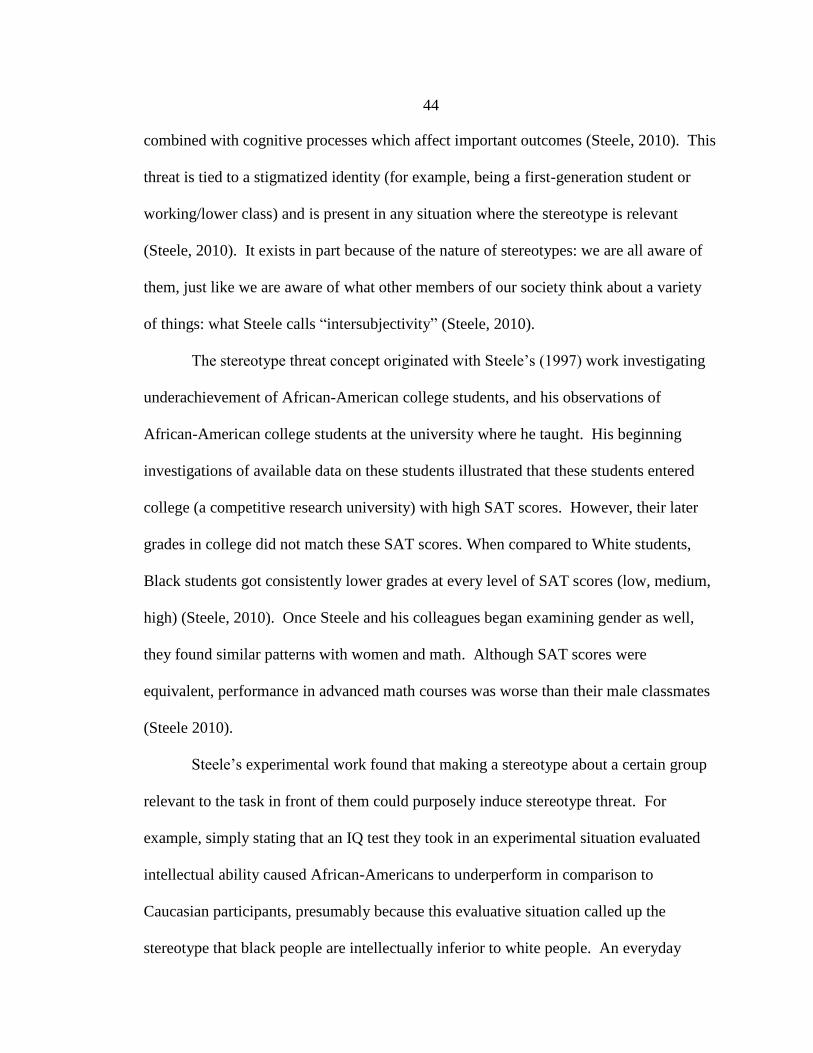
44
combined with cognitive processes which affect important outcomes (Steele, 2010). This
threat is tied to a stigmatized identity (for example, being a first-generation student or
working/lower class) and is present in any situation where the stereotype is relevant
(Steele, 2010). It exists in part because of the nature of stereotypes: we are all aware of
them, just like we are aware of what other members of our society think about a variety
of things: what Steele calls “intersubjectivity” (Steele, 2010).
The stereotype threat concept originated with Steele’s (1997) work investigating
underachievement of African-American college students, and his observations of
African-American college students at the university where he taught. His beginning
investigations of available data on these students illustrated that these students entered
college (a competitive research university) with high SAT scores. However, their later
grades in college did not match these SAT scores. When compared to White students,
Black students got consistently lower grades at every level of SAT scores (low, medium,
high) (Steele, 2010). Once Steele and his colleagues began examining gender as well,
they found similar patterns with women and math. Although SAT scores were
equivalent, performance in advanced math courses was worse than their male classmates
(Steele 2010).
Steele’s experimental work found that making a stereotype about a certain group
relevant to the task in front of them could purposely induce stereotype threat. For
example, simply stating that an IQ test they took in an experimental situation evaluated
intellectual ability caused African-Americans to underperform in comparison to
Caucasian participants, presumably because this evaluative situation called up the
stereotype that black people are intellectually inferior to white people. An everyday

45
example of the phenomenon is provided by Steele (2010) in his book Whistling Vivaldi:
How stereotypes affect us and what we can do. A black student attending an Ivy-league
university notices that whenever he walks around the city, he can almost feel the fear of
the white people he passes by. Out of nervousness at first, he begins whistling Vivaldi
and Beatles tunes as he walks down the street, and people’s reactions are completely
different- the tension disappears, sometimes they smile at him. This student had
experienced a stereotype- the stereotype that all black men are violent- “in the air”
(Steele, 2010). This stereotype did not have to be verbally expressed; the student was
aware of it because he was a black male living in the United States, and he was conscious
of the body language of white people on the street (Steele, 2010).
Stereotype threat results in the underperformance of the group on intellectual
tasks in which the stereotype exists (Steele, 1997; Steele & Aronson, 1995; Steele,
Spencer, & Aronson, 2002). Steele & Aronson (1995) hypothesized that stigma had a
negative influence on performance for these groups. When participants were told that a
test had no gender differences and did not evaluate math ability, males and females
scored similarly on math tests (Spencer, Steele, & Quinn, 1999). Steele (2010) found
similar results when examining race. When black men taking a test were told that the test
did not measure intellectual ability (Steele & Aronson, 1995), they scored similarly to
white men. When it is made clear that the test is not measuring the ability that is under
stereotype threat (“women are bad at math,” “black people are not as smart as white
people”), this removes the unstated threat and presumably the cognitive load that thinking
about confirming the stereotype induces (Steele, 2010). These findings are important for
multiple reasons. First, the knowledge that a stereotype existing about one’s group could

46
affect one’s academic performance meant that there was much more to underperformance
of stigmatized groups than anyone had realized. Second, it meant that removing the threat
of the stereotype might do much towards equalizing the chances of success for
underrepresented groups in education. Finally, it was important because it indicated that
the phenomenon of stereotype threat could happen without intentional prejudice of
specific people (Steele, 2010). The students participating in the experiments had no
reason to believe that the people running the studies or giving the test were prejudiced; all
they knew was the general knowledge that people in our culture share: the stereotype
that women are not as good at math as men, or, black people are not as intelligent as
white people (Steele, 2010).
Even more importantly, Steele (2010) and his colleagues have discovered with
further experimental research that stereotype threat affects the more highly motivated and
academically engaged students the most, since their identity is tied to academic and
intellectual pursuits. This means that the disadvantaged students who make it into
college; often the ones who are the most motivated and engaged; are also the ones most
susceptible to stereotype threat. In contrast, when confronted with stereotype threat,
some students disengage from the task at hand, preserving their self-esteem by
disidentifying with academic and intellectual arenas when other sources of belonging and
self-esteem are available and easier to come by (Steele, 1997, 2010). These are the
students who may gain self-esteem and feel belonging from joining gangs, who identify
doing well in academics as “acting white,” or who drop out of high school and/or college.
Students who are academically engaged, whose self-esteem is connected to their
academic performance in school, do not disengage from the task, and therefore

47
performance often goes down and self-esteem does as well. Ironically, the result is that
this may feed into the stereotype about their group, though the poor performance or
disengagement is caused by stigma and stereotype threat, not actual differences in
intellectual ability.
Additionally, researchers have studied the cognitive process by which the
underperformance related to stereotype threat occurs, and it appears to be that it affects
cognitive load (Croziet, Despres, Gauzins, Huguet, Leyens, & Meot, 2004; Johnson,
Richeson, & Finkel, 2011; Steele, 2010). Humans only have so much room in their
brains for processing, and when cognition is taken up with thinking about and attempting
to disprove a stereotype about your group, anxiety and stress are triggered, and there is
less room to process and understand an intellectual task. Stereotype threat may have a
large impact upon first-generation and low-SES college students, resulting in many of the
outcomes described in the section on first-generation students. A limited number of
experimental studies have been published so far investigating stereotype threat and
class/SES (Croziet & Claire, 1998; Johnson, Richeson, & Finkel, 2011; Spencer &
Castano, 2007), and all found significant results for the relationship between stereotype
threat, class, and behavior or cognitions. For example, Croziet & Claire (1998) studied
French college students, and presented them with an intellectual task where the
instructions were varied to induce or to not induce stereotype threat. When the test was
described as a test of intellectual ability, low SES participants performed worse than high
SES participants, but when the test was presented as non-diagnostic of intellectual ability,
low SES and high SES participant’s performance did not differ (Coziet & Claire, 1998).
Spencer & Castano (2007) also studied SES and stereotype threat, finding that when SES

48
was made salient before a test, low SES students performed more poorly than when SES
was not made salient. The way SES was made salient was by stating that the test was a
measure of verbal intelligence, vs. the control condition where it was described as a task
of attention and perception (Spencer & Castano, 2007).
Johnson, Richeson, & Finkel (2011) found that lower SES students at an elite
university expressed more concern about academic competency than their higher SES
peers; what the authors call “identity-based concerns”. The authors also theorized that,
according to ego-depletion theories, the impact of managing these identity concerns
would be significant for lower SES students. Indeed, this is what they discovered, so that
using measures of ego depletion, lower SES students were more depleted than higher-
SES students after talking about a topic related to academic achievement (Johnson,
Richeson, & Finkel, 2011). They also found that the amount of ego-depletion could be
changed as well, through manipulating task demands, so that the lower-SES students
concerns about academic competency were lowered. All in all, though these studies do
not assess first-generation status, they do assess a closely-related identity: class, or
socioeconomic status. They confirm that class is a stigmatized identity, as gender or race
can be as well. As such, lower- class or lower-SES students appear to be susceptible to
the effects of stereotype threat.
Another line of more recent research has involved implementing behavioral
interventions that are designed to reduce stereotype threat and increase belonging,
resulting in better academic outcomes (Cohen, Garcia, Apfel, & Master, 2006; Cohen,
Garcia, Purdie-Vaughns, Apfel, & Brzustoski, 2009; Stephens, Townsend, Hamedani,
Destin, & Manzo, 2015; Walton & Cohen, 2007; Yeager et al., 2016). These studies all

49
test the assumption that brief psychological interventions can have long-term effects upon
group member’s achievement, since they reduce stereotype threat and initiative recursive
processes (Stephens et al., 2015). Interventions vary, and include tasks such as writing
exercises affirming the personal adequacy of minority students (Cohen et al., 2006);
listening to peers talking about how their first-generation status affected their success in
college, and then writing about and discussing one’s own background (Stephens et al.,
2015), and a “lay theory” social belonging intervention where students listened to peers
normalize the challenges of the transition to college (Yeager et al., 2016). All of the
above studies found significant results. For example, Stephens et al. (2015) found that
students in the intervention condition discussed their backgrounds more often than
control participants, and that first-generation students participating in the intervention vs.
the control condition showed greater physiological thriving. Other studies found
significant results for academic achievement: Cohen et al. (2009) found that African-
American students in the intervention had higher GPAs and higher self-perceptions two
years later.
These are all important studies, because they appear to show that relatively short-
term simple social-psychological interventions can reduce stigma and stereotype threat
and increase achievement in college (Cohen & Garcia, 2014; Steele, 2010). However,
belonging is not directly measured and is, for the most part, an assumption in many of
these studies. Two studies that do directly assess fit and feelings of belonging are Walton
& Cohen (2007) and Mendoza-Denton, Downey, Purdie, Davis, & Pietrzak (2002),
whose research indicates that stereotype threat does significantly impact African-

50
Americans, resulting in discomfort during the college transition, lower trust in the
university, declines in grades, and lower feelings of belonging and potential.
Walton & Cohen (2007) examined how threats to social belonging would impact
African-American student’s motivation and academic performance in college. The
activity that induced stereotype threat involved participants listing either two or eight
friends who would fit into the Computer Science department in their college. A
subsequent intervention involved students learning that adversity and struggle were a
normal and temporary part of being a new student. Findings indicated that for racial
minorities but not for whites, their feelings of fitting in and belonging were lower when
they had to list eight friends as opposed to two. For black students, their sense of fit or
belonging in college dropped on days when they experienced higher levels of stress,
indicating they are attributing the stress to their stigmatized identity (Walton & Cohen,
2007). The intervention, which normalized adversity and labeled it as temporary, also
differentially affected minority students, resulting in feelings of belonging less dependent
upon the stress levels of any particular day, along with higher GPAs and an increase in
the amount of time spent studying (Walton & Cohen, 2007).
Mendoza-Denton et al. (2002) tested a questionnaire designed to assess feelings
of rejection and anxiety around race; basically, a self-report measure of identity or
stereotype threat. The authors concluded that students with higher levels of race-based
anxiety and rejection expectation also showed lower levels of academic performance,
even when controlling for incoming SAT scores, along with lower social adjustment and
interpersonal relationships (Mendoza- Denton et al. (2002). The authors conclude that
individuals can develop rejection expectations based upon membership in a devalued

51
group (stigma), and the environment then determines which expectations become
activated.
Sense of Belonging
Maslow (1954) described social belonging as a basic human need in Motivation
and Personality, and some of the early research on belonging by Anant (1966, 1967,
1969) indicated that there was a negative relationship between belongingness and
anxiety. Belonging research is also based in Durkheim’s theory (1951) that suicide could
be explained in terms of a lack of social integration (Baumeister & Leary, 1995).
Interestingly, Tinto’s theory of integration is also based in Durkheim’s theory (1993), and
Tinto himself, in an ‘expert interview’ on his theory, stated that if he was developing his
theory today, he might more accurately call it ‘sense of belonging’ or ‘fit.’ (Wolf-
Wendel, Ward, & Kinzie, 2009).
Hagerty, Lynch-Sauer, Patusky, Bouwsema & Collier (1992) defined sense of
belonging as “the experience of personal involvement in a system or environment so that
persons feel themselves to be an integral part of that environment.” (p.173). Sense of
belonging is essentially a psychological experience, wherein there are precursors and
consequences to the experience of belonging, or of not belonging (Hagerty et al., 1992;
Hagerty, Williams, Coyne, & Early, 1996). Hagerty et al. (1992) proposed that these
precursors include energy for involvement, desire for meaningful involvement, and the
potential for shared or complementary characteristics, and the consequences are
involvement, attributions of meaningfulness, and a foundation for behavioral and
emotional responses (Hagerty et al., 1992). In an empirical test of belonging, Hagerty et

52
al. (1996) found that belonging was related to social support; specifically, that belonging
was significantly related to more perceived support and positive social support actions.
In addition, income was negatively related to sense of belonging, but only for women in
the lower socioeconomic group, defined as income below $40,000/year (Hagerty et al.,
1996).
In their seminal work, Baumeister & Leary (1995) conducted an extensive
summary of the empirical literature on belonging in the field of psychology, and
ultimately characterized the need to belong as a fundamental human motivation affecting
a wide variety of human behavior, emotion, and cognition. As such, the need to belong
motivates goal-directed actions that are designed to satisfy it (Baumeister & Leary,
1995). This view supports Maslow’s original theory that the need to belong is a part of
the hierarchy of needs, which must be satisfied so that healthy self-esteem and self-
actualization can occur (Maslow, 1954). Since belonging is a basic motivation and need,
negative affect, including anxiety, stress, and even psychosis can result when those needs
are not satisfied. The motivation to belong also has an important effect upon cognition,
in that belongingness concerns shape human thought, and people interpret situations and
behaviors in terms of their implications for relationships (Baumeister & Leary, 1995).
Even anticipating being alone without supportive others affects cognitive processes
negatively. Baumeister, Twenge, & Nuss (2002) found that thinking about the possibility
of social exclusion led to significant impairment in logic and reasoning, while thoughts
about misfortunes such as accidents or sickness did not impair complex cognitions.
Baumeister, Dewall, Ciarocco, & Twenge (2005) found that anticipated social rejection
or lack of belonging impaired participant’s ability to self-regulate. This indicates that it

53
is not simply worry or anxiety in general, but worry focused on social belonging, that
leads to the impairment. Humans are wired to connect with others, and when that need is
threatened or is not satisfied, the ability to regulate behavior and affect, along with
intelligent thought, is significantly impaired.
The transition to college could be interpreted as an event indicating a potential
change in one’s belongingness status, triggering behaviors and feelings designed to
satisfy the need to belong. Currently, there is a surge of interest and research on
belonging within the field of higher education. Strayhorn (2008) conceptualizes sense of
belonging in college students as the extent to which students are integrated into the
college and feel as if they matter and are valued by both individuals and a community,
which is in line with the psychological research on belonging discussed above. Strayhorn
also states that belonging is the result of feeling that one has access to sufficient support
(Strayhorn, 2008; 2012), which is consistent with the psychological literature on
belonging (Baumeister & Leary, 1995; Hagerty et al., 1992; Hagerty et al., 1996;
Maslow, 1954). Similar to Baumeister & Leary’s research (1995), Strayhorn (2012)
posits that there exist several core elements of sense of belonging. These include: sense
of belonging as a basic human need; a drive or motive which is sufficient to drive human
behavior, it takes on increased importance in certain contexts, such as the new student
transition process (being a newcomer to an established group, i.e., college), it is related to
mattering, social identities affect college students’ sense of belonging, sense of belonging
engenders other positive outcomes, and finally, sense of belonging changes as contexts
and circumstances change and must be satisfied on a continual basis (Strayhorn, 2012).

54
Empirical research on belonging within higher education has been conducted by a
number of researchers and can be characterized in two ways: research on specific identity
groups, their experiences with belonging, and the impact of certain college experiences
on belonging, and general research with college students on belonging. Research over
the last twenty years has focused on belonging, campus climate, and racial identity
(Hurtado & Carter, 1997; Johnson, Soldner, Brown Leonard, Alvarez, Kurotsuchi
Inkelas, Rowan-Kenyon, & Longerbeam, 2007; Hausmann, Ye, Ward-Schofield, &
Woods, 2009; Wells & Horn, 2015). Racial and ethnic minority students tend to
experience a lower sense of belonging on campus than white students (Johnson et al.,
2007), and sense of belonging has been found to have a significant effect upon
persistence (Hausmann et al., 2009). In addition, for students belonging to racial and
ethnic minority groups, belonging is strongly correlated with their perceptions of the
racial climate of the campus. Hurtado & Carter (1997) studied Latina student’s
belonging in college and found that there was a strong relationship between sense of
belonging in college and membership in social-community organizations, frequent
discussions of course content outside of class, tutoring other students, and frequently
talking with faculty outside of class. However, they found no relationship between sense
of belonging and GPA. Hurtado & Carter (1997) found that the perception of a campus
environment having racial/ethnic tension was related to lower sense of belonging for
Latina students. Wells & Horn’s (2015) study drawing from this work found that Asian-
American student’s perceptions of their campus, and specifically their perceptions that
their Asian culture was congruent with or fit with the campus culture, was significantly
correlated with their sense of belonging. In an interesting twist to these studies,

55
Hausmann et al. (2009) devised an intervention to see if a university communication
along with a gift bearing the university insignia would affect student’s sense of
belonging. They found it had a positive effect on sense of belonging for White students,
but no effect for African-American students.
Other studies on belonging have investigated a diverse set of variables and their
relationship to belonging. Hoyle & Crawford (1994) examined social self-esteem and
belonging in 469 college students, concluding that there was a significant positive
correlation between social self-esteem and belongingness. Morrow & Ackermann (2012)
found a positive relationship between student’s intentions to persist in college and
motivation, along with perceived peer and faculty support, but only indirect relationships
with belonging. Finally, in their study on sense of belonging, academic motivation, sense
of class belonging, and instructor characteristics, Freeman, Anderman, & Jensen (2007)
found that social acceptance was a significant positive predictor of belonging, along with
perceptions of professors as being pedagogically caring.
Studies investigating the relationship between belonging and either first-
generation status or social class are few and far between. Social class and first-
generation status often overlap, but it is important to remember that first-generation
students may have parents who are blue-collar workers and yet make enough money to be
middle-class. Social class is much more than rich or poor (Barratt, 2011); it is a complex
interaction between income, education, and social and cultural capital. Two studies have
empirically and quantitatively investigated first-generation students and sense of
belonging (Pittman & Richmond, 2007; Stebleton, Soria, & Huesman, 2014), and one
meta-analysis explored social class and social integration, with belonging as one measure

56
of integration (Rubin, 2012). All three studies found that first-generation status and/or
low SES had a negative relationship to belonging. Stebleton and colleagues (2014) found
that first-generation students reported lower levels of sense of belonging, greater levels of
stress and depression, and less use of mental health services than their continuing-
generation counterparts. They used a factor described as ‘satisfaction and belonging’,
part of the survey Student Experience in the Research University (SERU), out of which
two items measure belonging (Stebleton et al., 2014). Pittman & Richmond (2007)
adapted a measure of school belonging (The Psychological Sense of School Membership)
for college students and found first-generation college students had significantly lower
levels of belonging than continuing-generation students, though when examining SES,
differences in belonging were non-significant. Interestingly, this difference in
significance between generational status and SES was not explained or explored.
However, the fact that the authors defined SES as the type of job held by parents (skilled
worker, unskilled worker, professional worker, etc.) rather than the usual way of defining
SES, may have influenced the results. Higher levels of social belonging in the study were
associated with positive outcomes such as higher grades and healthy psychological
behaviors such as feelings of scholastic competence and high self-worth. Higher levels
of belonging during high school were also significantly associated with higher levels
reported in college, indicating that prior experience with belonging can impact later
belonging in a different school setting (Pittman & Richmond, 2007).
Rubin (2012) conducted a meta-analysis on social integration and class in college.
He found the largest significant effect size (.18) for the relationship between social class
and social integration overall, measured by the SAQ-Social, which is a multi-dimensional

57
scale measuring social integration, across gender, year of study, and also measure of class
(parental education and parental income). The SAQ-Social measures quantity and quality
of formal social activities (four items), informal social activities (eight items), loneliness
(two items), and sense of belonging (one item). Working-class status was associated with
lower integration (Rubin, 2012). When examining the multiple measures utilized to
assess social integration (sense of belonging, the SAQ- Social, and participation in formal
and informal social activities), sense of belonging had the second largest effect size after
the SAQ-Social (Rubin, 2012). This indicates the importance of belonging in measuring
social integration in college.
Several qualitative studies have examined social class in college (Martin, 2015;
Ostrove, 2003; Ostrove & Long, 2007). For example, Ostrove (2003) interviewed female
college students, and concluded that working-class students more often expressed
feelings of alienation and consciousness of class, in contrast to middle- and high- income
students. Martin’s (2015) qualitative study of first-generation low-income white college
students concluded that these students appear to deny that social class matters, while at
the same time expressing feelings of both pride and exclusion and alienation based on
social class. Finally, Soria, Stebleton & Huesman (2013) conducted a large study
examining income/class and academic integration and social integration (including
satisfaction, sense of belonging, and climate) at six public institutions. Their results
indicated that working-class students had significantly lower levels of belonging than
middle- and upper-income students, along with lower social and academic integration.
In addition to empirical research, a number of books have been published
addressing the experiences of low-income and/or first-generation student’s experiences in

58
higher education from a first-person narrative perspective. J.D. Vance, the author of
Hillbilly elegy: A memoir of a family and culture in crisis (2016) writes about the saving
graces of just one supportive family member or mentor in not only getting to college, but
simply surviving his youth in a poverty-stricken and drug and alcohol fueled small rural
town in the South. The author writes about attending a military school and the structure
and discipline the experience instilled in him. If he had attended a typical college directly
after high school, he might have dropped out due to his lack of experience with the
required self-motivation and discipline. Vance also writes about the social and cultural
capital he develops as a result of his experience with Yale Law school; capital that was
essential in order to land a legal position after law school (Vance, 2016). Vance’s story
about applying to Yale is indicative of the cultural capital needed to even apply to
graduate school: the application required a reference letter from the Dean of his college,
and since he did not know the Dean, Vance felt intimidated by asking him for a letter of
reference. Vance almost dropped the application completely because he could not bring
himself to ask for a reference. A middle or upper-class student is more likely to know
what a Dean is, to feel comfortable with the system that expects that asking for references
from strangers is just par for the course, and to feel as if one deserves a reference from a
Dean.
This fine place so far from home: Voices of academics from the working class
(Dews & Lester Law, 1995) also chronicles the experiences and often the struggle and
dislocation of people from the working-class not only in attending college but choosing
the academic life as a career. Experiences often mirror, in narrative form, the research
studies discussed here so far: feelings of not belonging in private colleges/Ivy league

59
institutions where students easily discuss their world travels and upper-class knowledge
of food; major differences in speech in terms of everything from volume to language and
slang expressions, and the lack of validation from faculty on academic work. In one
essay, the author writes about the first time she got up the gumption to take a paper to a
professor’s office hours, and the validation that brought her to tears when he told her that
her idea was very good, but also challenged her, telling her how improvements in her
writing could make her good idea even better (Johnson-Black, 1995).
These narrative stories support the empirical research on the connection between
socioeconomic status, cultural and social capital, climate/environment, and the
psychological experience of social belonging in higher education (Barratt, 2011;
Johnson-Black, 1995; Vance, 2016). Students who identify as working class or first-
generation show lower levels of belonging or integration in college, and further, this
impacts social and academic integration and adjustment to college (Jury, Smeding,
Stephens, Nelson, Aelenei, & Darnon, 2017; Martin, 2015; Ostrove, 2003; Ostrove &
Long, 2007; Pittman & Richmond, 2007; Rubin, 2012; Soria et al., 2013; Stebleton et al.,
2014).
Several studies have examined social class or first-generation students, belonging,
and academic performance. Low SES and first-generation students do appear to have
significantly lower grades, on average, than continuing generation and middle-upper SES
students in college (Chen & Carroll, 2005; Terenzini, Springer, Yeager, Pascarella, &
Nora. 1996; Tibbetts, Harackiewicz, Canning, Boston, Priniski, & Hyde, 2016; Prospero
& Vohra-Gupta, 2007; Riehl, 1994; Stephens, Fryberg, Markus, & Covarrubias, 2012a;
Stephens, Townsend, Hamedani, Destin, & Manzo, 2015). Ramos-Sanchez & Nichols

60
(2007) found that self-efficacy, along with academic performance (measured by GPA)
were lower for first-generation students. Self-efficacy was not found to be a mediator for
academic performance; but overall, high self-efficacy at the beginning of the year
predicted better college adjustment at the end of the year for all students (Ramos-Sanchez
& Nichols, 2007). Finally, a few recent studies have examined belonging or a construct
that could be construed as similar to belonging, such as fit or integration. These authors
found that first-generation students had lower levels of fit, belonging, or integration, and
this negatively impacted grades (Phillips, Stephens, & Townsend, 2016; Prospero &
Vohra-Gupta, 2007). For example, Phillips, Stephens, & Townsend (2016) examined
endorsement of interdependent or independent values, finding that first-generation
students were more likely to endorse interdependent values, which negatively impacted
feelings of fit, while lower fit negatively impacted grades throughout their time in
college.
These are all important findings, because they tell us that social class appears to
have a significant impact on how students adjust to college, and further, that social class
impacts student’s psychology: their feelings of fitting in and belonging. In addition,
belonging may impact academic achievement, a precursor in many cases to dropping out
and not completing a degree. Thus, though improved access to college is important, if
students perceive they do not belong in institutions of higher education once they are
there, they do not have equal chances of success.
One of the problems in the study of belonging in the field of higher education
appears to be that authors often say they are studying ‘sense of belonging’ but do not
appear to be using a validated and reliable instrument measuring the construct (Hoffman,

61
Richmond, Morrow, & Salomone, 2002; Strayhorn, 2012). Instead, these authors appear
to assess involvement, peer and faculty relationships, or other constructs, and then call
them “sense of belonging.” For example, Pittman & Richmond (2007) utilized an
adapted form of the Psychological Sense of School Membership, usually used with high
school students, and adapted some of the questions to refer to college. Whether or not a
sense of school membership is the same construct as a sense of belonging has not been
examined. Stebleton et al. (2014), in their study of first-generation students and their use
of mental health resources, utilized a measure from Student Experiences in the Research
University (SERU), composed of items assessing satisfaction (4 items) and belonging (2
items), which when combined the authors called “belonging”. According to the
psychological literature on belonging discussed above, belonging is its own construct,
and has never been connected to the construct of satisfaction, which appears to be a
construct created for studies on higher education.
In summary, the study of belonging in higher education, and especially the impact
of class (SES and/or first-generation status) upon belonging and other important
outcomes, is just beginning. No study has yet assessed the differences between first- and
continuing -generation students in their perceptions of belonging in college on a large
scale, while using an accepted and validated belonging instrument.
People who hold a stigmatized identity may be more susceptible to threats to this
identity, experiencing stereotype threat (Steele, 2010). First-generation students have a
stigmatized identity in the context of higher education. Experiencing stereotype threat as
a part of campus or institutional climate, may then impact the ability to become
integrated socially and academically, leading to feeling as if one does not belong or fit in.

62
This area of research is seeing a surge of studies investigating behavioral interventions
purported to reduce stereotype threat and increase belonging in college for first-
generation students and students with other stigmatized identities as well. Studies
focusing on interventions designed to boost student’s achievement and feelings of fit and
belonging appear to show certain interventions have a positive effect upon academic
achievement and belonging (Cohen, Garcia, Apfel & Master, 2006; Cohen, Garcia,
Purdie-Vaughns, Apfel, & Brzustoski, 2009; Critcher & Dunning, 2015; Jury, Smeding,
Stephens, Nelson, Alelai, & Darnon, 2017; Stephens, Townsend, Hamedani, Destin &
Manzo, 2015; Yeager, Walton, Brady, Akcinar, Paunesku, Keane, Kamentz, Ritter,
Duckworth, Urstein, Gomez, Markus, Cohen, & Dweck, 2016). Interventions utilized by
these authors are usually exercises involving affirmations of student’s values or peer
education on how being a first-generation student impacts adjustment to college. Not all
these studies have utilized first-generation students however; most of the affirmation
studies have explored race and compared Caucasian and African-American high school
and college students (Cohen, Garcia, Apfel & Master, 2006; Cohen, Garcia, Purdie-
Vaughns, Apfel, & Brzustoski, 2009). Though not all of them have focused on first-
generation status, they have found that stigmatized groups seem to benefit from these
interventions, so they appear to hold potential for the success of first-generation students
in college.
Summary
First-generation college students, those whose parents have not graduated from
college themselves, are now at last half and possibly the majority of students enrolled in

63
college in the United States. Access has increased, yet the persistence and graduation
rates of first-generation students lags behind their continuing-generation peers (NCES,
2017). Access to college without success only harms students, since once they leave
college, they often leave saddled with student loan debt, without a degree that allows
them to access careers that will connect them to opportunities for a better life.
First-generation student status is linked to lower persistence and graduation rates,
and lower levels of preparedness for college, along with less involvement and longer time
to degree. Current research on identity threat/stereotype threat and first-generation and
low-income students illustrates the essential role of social psychological processes in
determining college success. The research reviewed thus far shows that the experience of
stigma and stereotype threat has an impact on social belonging, a psychological
motivation and basic need shared by all human beings. The environment or culture of
college itself- social and environmental cues- may instigate stereotype or identity threat
in first-generation students, causing them to feel as if they do not belong and making it
difficult to integrate into the campus, and thus, to succeed academically and to graduate.
Working- class and first-generation students have very different experiences
during college than their middle/high income and continuing-generation peers. They
often feel different, less-then, as if they are not college material, often along with positive
feelings as well; of pride in their background and commitment to their values. Though a
fair amount of research has examined the constructs of belonging, stereotype threat, and
first-generation students separately, no quantitative studies have connected all three as the
current study proposes to do. In addition, studies that do address belonging and its
impact on academic performance have not yet examined generational status; but most

64
often examine race/ethnicity, comparing white students to students of color. It is still
unclear if it is first-generation student status or low-income (or both) that matters more in
determining student experiences and outcomes in college, since some studies examine
income, some working-class students (or alternatively SES), and others generational
status. No research studies have explicitly utilized generational status to predict
belonging and academic performance, while examining the impact of mediational
variables as well. Since involvement in co-curricular activities, along with peer and
faculty interactions is often conflated with sense of belonging, the current study utilizes a
measure of involvement to address this issue. In addition, as reviewed above, many
studies purportedly examining belonging examine fit, involvement, or contact with peers.
These are all different constructs than an actual psychological, validated measure of
belonging. The current study utilizes a validated measure of psychological belonging to
address this deficiency in the higher education literature, bringing together the
psychological literature and the higher education literature on belonging.
The current study proposes to link these variables to examine the relationships
between first-generation student status, stereotype threat, involvement, and social
belonging upon academic performance during the first year of college. A focus on skill -
building and the improvement of cultural capital alone is not making a large enough
difference in the outcomes for first-generation students. Research needs to be conducted
that will uncover the impact of generational status upon the psychology of students in
college, and further, the impact upon successful transitions. We cannot assume that the
deficiency model will improve outcomes (throwing more skills, more capital, and more
money at first-generation students), and yet that is what the majority of current

65
interventions and programming for first-generation students presumes. The current study
will quantitatively examine the impact of being first-generation upon belonging and
ultimately upon academic performance, which directly impacts persistence and
graduation.

66
METHODOLOGY
The purpose of the current study is to investigate the impact of college students’
generational status and sense of belonging upon academic performance in college. It is
hypothesized that due to the stigma and stereotype threat felt by those students whose
parents did not graduate from college, first-generation college students will have lower
levels of belonging on campus than continuing-generation students. Feeling a connection
and sense that one belongs in college is essential to develop healthy psychological habits,
connections to others, motivation, and academic performance (Chen & Carroll, 2005;
Terenzini, Springer, Yeager, Pascarella, & Nora, 1996; Tibbetts, Harackiewicz, Canning,
Boston, Priniski, & Hyde, 2016; Pittman & Richmond, 2007; Prospero & Vohra-Gupta,
2007; Riehl, 1994; Stebleton, Soria, & Huesman, 2014; Stephens, Fryberg, Markus, &
Covarrubias, 2012a; Stephens, Townsend, Hamedani, Destin, & Manzo, 2015). If first-
generation college students do not develop a sense that they belong or “fit” in college, it
is hypothesized that their grades will suffer, and they will probably be less likely to
persist and graduate. Since persistence and graduation could not be assessed in the
current study, the intermediate outcomes of belonging and the impact upon academic
performance were analyzed.
Research Questions
1. Is there a difference in sense of belonging between first-generation and
continuing generation college students?

67
2. To what extent is any difference in students’ sense of belonging by generational
status mediated by peer and faculty interactions, controlling for pre-college
characteristics?
3. Is there a relationship between generational status and academic performance
as measured by GPA?
4. To what extent is the relationship between generational status and GPA
mediated by sense of belonging and peer and faculty interactions?
5. To what extent is the relationship between sense of belonging and academic
performance, controlling for peer and faculty interactions, moderated by
generational status?
Research Design
The design of the current study involves survey research and is correlational in
nature. Survey research typically involves collecting data directly from participants
about their opinions on topics or issues (Gay, Mills, & Airasian, 2012). In the case of the
current study, the survey method was utilized due to the self-report nature of the
constructs and scales measuring affective and cognitive domains. The researcher wanted
to assess how student’s sense of belonging, along with quality and quantity of peer and
faculty relationships, impact academic performance in college. Pre-existing scales
measuring sense of belonging and interactions with faculty and peers (the General
Belongingness Scale, and scales measuring faculty and peer interactions/involvement)
were used in the study.

68
This self-report survey data was collected in order to determine if there were
relationships among the variables in question, which defines the research design as
correlational (Gay, Mills, & Airasian, 2012). Specifically, it was hypothesized that
continuing-generation students would be advantaged over first-generation students on
academic performance. In addition, the purpose was to determine if sense of belonging
and faculty and peer involvement mediated the relationship between generational status
and academic performance, while controlling for background characteristics that tend to
have an impact on academic performance (high school GPA, ACT scores, Pell grant
status, gender, and race). It is important to note that correlational research is not causal
and does not imply a cause and effect relationship (Gay, Mills, & Airasian, 2012).
However, a high correlation may allow prediction (Gay, Mills, & Airasian, 2012).
Institution
The study was conducted at Montana State University (MSU), a land grant, public
university with a student population of 16,703 (MSU Office of Planning and Analysis,
Campus Profile, 2018) and a Carnegie Classification of Doctoral University with Higher
Research Activity (Carnegie Classification of Institutions of Higher Education, 2018).
MSU distributes the Beginning College Student Survey of Engagement (BCSSE) each
year to new incoming students during summer orientations. According to BCSSE
statistics from fall 2017, twenty percent of incoming first-time students who attended
orientation on campus identified themselves as first-generation college students (MSU
Office of Planning and Analysis, personal communication, 2018). The BCSSE defines
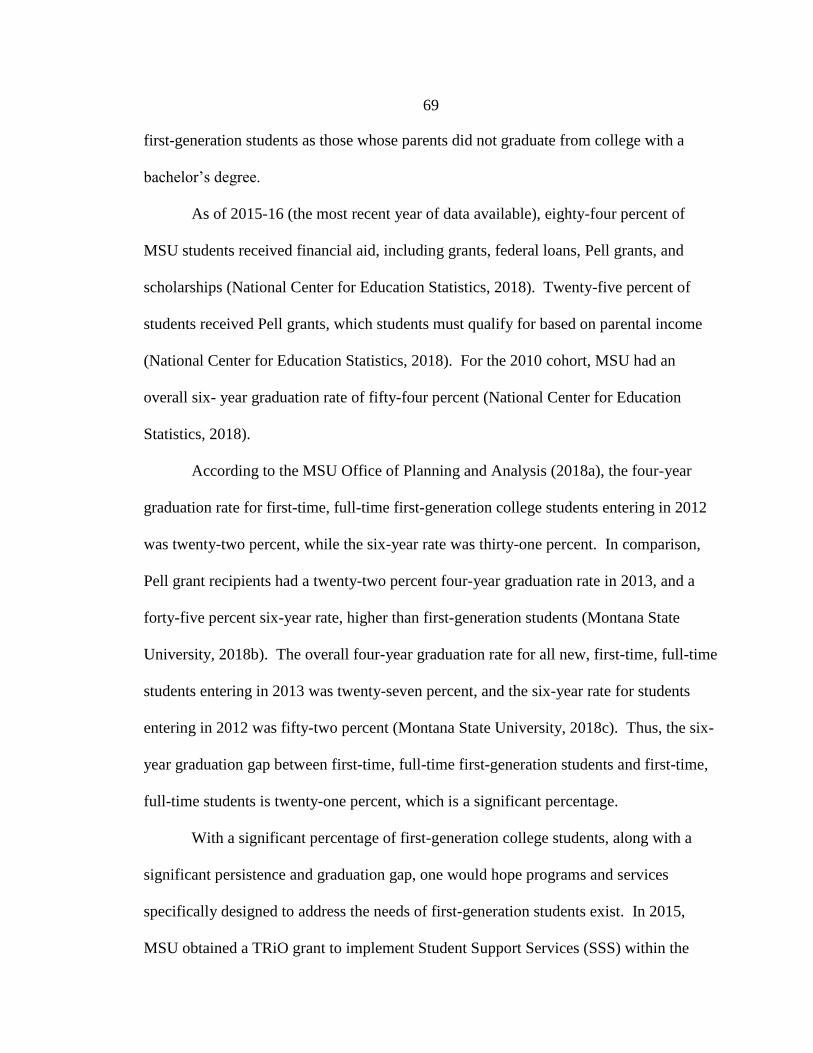
69
first-generation students as those whose parents did not graduate from college with a
bachelor’s degree.
As of 2015-16 (the most recent year of data available), eighty-four percent of
MSU students received financial aid, including grants, federal loans, Pell grants, and
scholarships (National Center for Education Statistics, 2018). Twenty-five percent of
students received Pell grants, which students must qualify for based on parental income
(National Center for Education Statistics, 2018). For the 2010 cohort, MSU had an
overall six- year graduation rate of fifty-four percent (National Center for Education
Statistics, 2018).
According to the MSU Office of Planning and Analysis (2018a), the four-year
graduation rate for first-time, full-time first-generation college students entering in 2012
was twenty-two percent, while the six-year rate was thirty-one percent. In comparison,
Pell grant recipients had a twenty-two percent four-year graduation rate in 2013, and a
forty-five percent six-year rate, higher than first-generation students (Montana State
University, 2018b). The overall four-year graduation rate for all new, first-time, full-time
students entering in 2013 was twenty-seven percent, and the six-year rate for students
entering in 2012 was fifty-two percent (Montana State University, 2018c). Thus, the six-
year graduation gap between first-time, full-time first-generation students and first-time,
full-time students is twenty-one percent, which is a significant percentage.
With a significant percentage of first-generation college students, along with a
significant persistence and graduation gap, one would hope programs and services
specifically designed to address the needs of first-generation students exist. In 2015,
MSU obtained a TRiO grant to implement Student Support Services (SSS) within the

70
Division of Student Success (MSU TRiO Student Support Services, 2018). The TRiO
program is the only service at MSU that specifically serves first-generation college
students as part of their mission. TRiO is designed for underserved populations of
students; eligibility for services is based upon being low-income, first-generation, and/or
living with a disability (MSU TRiO Student Support Services, 2018). The needs of
someone who has a learning or physical disability are most likely different from someone
whose parents are not familiar with higher education, yet the services offered do not
differ dependent upon which category (or categories) one falls into. MSU’s TRiO SSS
offers peer mentoring, along with ten hours per week of free tutoring through SmartyCats
tutoring, and organized events such as awards ceremonies, provost speakers, and
breakfasts (MSU TRiO Student Support Services, 2018). They also offer a small special
orientation just for TRiO students, called “Smart Start”, which introduces students to
resources on campus, along with community building (J. Collins, personal
communication, August 9, 2018). TRiO SSS offers academic support, combined with the
development of a community cohort. However, none of the events or materials appear to
focus on what it means to be a first-generation college student in terms of belonging,
culture, or climate- the more psychosocial aspects of the experience. The programs tend
to focus on navigating college and utilizing resources, including understanding and
navigating financial aid and accessing academic assistance such as tutoring (J. Collins,
personal communication, August 9, 2018). The services offered appear to be quite
traditional services offered by most universities: fun events and activities designed to
connect students to their peers, along with a support network of mentors and tutors.
Additionally, the SSS program only has the capacity to serve about one hundred-fifty

71
students; a small portion of the total first-generation students on campus (J. Collins,
personal communication, August 9, 2018). The Hilleman Scholars program, started in
2016, also appears to serve first-generation college students, including a “bridge
program” over the summer prior to the first year (J. Collins, personal communication,
August 9, 2018). However, they currently take only approximately 50 students, and they
do not expressly recruit/serve first-generation colleges students; they recruit Montana
high school students with excellent academic records who are eligible for Pell grants.
Some of the participants are first-generation college students, since there is cross-over
between income and generational status. For all of these reasons, it was beneficial to
focus on the effects of the psychological experience of a broader sample of first-
generation college students (their feelings of belonging) upon their actual academic
performance.
Montana has vast areas that are still defined as “frontier” with only seven people
per square mile on average (United States Census Bureau Quick Facts, Montana, 2018a).
As a public, land-grant institution in the rural state of Montana, MSU has an obligation to
provide access to first-generation college students, along with programs and supports that
assist these students in graduating from college as the first in their family. Indeed, one of
MSU’s stated values is “Student Success: Value students and believe in creating an
environment in which they can be successful and reach their full potential” (Montana
State University, Mountains and Minds: Learners and Leaders, 2018). Since a minority of
Montana residents hold bachelor’s degrees or higher (thirty percent in 2017) (United
States Census Bureau Quick Facts, Montana, 2018b), it should be a priority to encourage

72
first-generation students to enter college, and to support them so that they graduate with
their degree.
Sample
Participants were new first-time undergraduates entering Montana State
University in fall 2018. Montana State University is a mid-sized, public, land grant
university in the western United States. A sample of first-time, first-year, full and part-
time students was obtained from the Director of Planning and Analysis at MSU. The
director utilized probability sampling to obtain a sample size of 1000 from the
approximately 4000 total new, first-time students entering MSU fall term of 2018 (Gay,
Mills, & Airasian, 2012). Stratified random sampling was used in order to ensure
adequate sample sizes of first-generation and continuing-generation students (Gay, Mills,
& Airasian, 2012). Utilizing a representative sample ensured that inferences could be
made about the population, in this case, all new first-year students at MSU. The
population of new, first-time students at MSU was 3,387 this fall semester 2018. Total
student enrollment has been rising each year steadily since 2010, when headcount was
13,559, to fall 2018 when total headcount was 16,902 (Montana State University, 2019).
Since the BCSSE indicates that about twenty percent of the incoming class are first-
generation students, that means about 800 incoming students are first-generation college
students. Therefore, with a 95% confidence level and +/- 3% confidence interval, 457
first-generation student responses would be needed to compare to the continuing-
generation responses. Therefore, first-generation students were oversampled to get an
adequate subsample on this key variable. In addition, to attempt to encourage

73
participants to respond in higher numbers to the survey, the survey was sent out and then
followed up with two reminders. To address sampling bias, (Gay, Mills, & Airasian,
2012) the sample was compared to the population on the following variables: high school
GPA, ACT scores, Pell grant status, race, gender, and first-generation status.
Data Collection
After obtaining IRB approval, Qualtrics software was utilized to create the
survey. The “from” email address appeared as the researcher’s MSU email address. The
email content and the introduction to the survey in Qualtrics explained that the research
was being conducted as part of the researcher’s dissertation requirements, along with an
interest in understanding student’s experiences with peers and faculty at MSU. Items in
the survey included the belonging measure, items from the Wabash survey measuring
peer and faculty involvement, and an item assessing generational status. The instructions
for the survey clearly stated that it was confidential, but not anonymous, and that by
continuing the survey, participants agreed that their high school GPA and ACT scores,
Pell grant status, and race, along with fall term grades, would be obtained at the end of
fall term. The survey was sent out to the 1000 participants at the end of October 2018,
again by the researcher. By this time, participants had time to settle in and begin to make
the transition to MSU, since they had been attending for approximately two months (end
of August-end of October). Therefore, participants could more accurately respond to the
items asking about faculty and peer involvement and relationships. All participants who
completed the survey were given five hundred ChampChange points, applied to their
accounts by the Allen Yarnell Center for Student Success. In addition, one participant

74
was randomly selected to receive a $50 Columbo’s Pizza gift card. The incentives were
selected in order to strike a balance between incentives that might appeal to those
students who already feel more connected to the institution, vs. incentives that might
appeal to any student. ChampChange points may be earned by any MSU student,
through social and academic participation, such as tutoring sessions, library visits, and
social/engagement events. The researcher decided not to utilize an MSU bookstore gift
card, since this might also appeal to students who already care about and feel connected
to MSU, thus increasing the likelihood that students already high in belonging would
respond to the survey and skew the results.
The survey was left open for a total of two weeks, with a reminder sent out at the
end of week one and towards the end of week two by the researcher, to only those who
had not yet responded. At the end of two weeks, the survey was closed, and data
downloaded. Email addresses had failed to work for 65 participants, so that the survey
was actually sent to 935 participants. A total of 188 participants completed the survey,
for a response rate of twenty percent. Items which were obtained after participants
responded to the survey were the pre-college variables: high school GPA, ACT/SAT
scores, race, gender, and Pell grant status. They also included the outcome measure of
first semester grades once fall term grades were reported in December, operationalized as
fall-term cumulative GPA. The researcher sent the list of respondents to The Office of
Planning and Analysis (OPA), and they obtained these variables for the respondents, and
sent the password-protected data file back to the researcher using BOX software.

75
Variables and Measurement
Predictor Variables
The predictor or independent variable was generational status (first- generation,
defined as students having neither parent graduating from college with a four-year
degree; and continuing-generation students, those who have at least one parent having
graduated with a four-year degree or higher). The predictor variable was categorical.
The survey item asked: “What is the highest level of education each of your
parents/guardians completed?” The response options were: 1 = Did not finish high
school, 2 = High school graduate/GED, 3 = Attended college but no degree, 4 =
Vocational/technical certificate or diploma, 5 = Associate or other 2-year degree, 6 =
bachelor’s or other 4-year degree, 7 = Masters, 8 = Law, 9 = Doctorate). Categories were
collapsed, so that first-generation students were those with response options 1-5, while
continuing-generation students were those who had response options 6-9. Therefore, for
the current study, first-generation was defined as students who did not have any parent or
parents who graduated from college with a bachelor’s degree. The first-generation status
variable was dummy coded so that the reference group of continuing-generation students
= 0, and first-generation students = 1. A total of twenty-eight percent of the sample self-
identified as first-generation students, while seventy-two percent identified as continuing-
generation students. A total of seventeen percent of students who attended orientation
and completed the BCSSE at MSU identified as first-generation students. Since this
information is not solicited from every entering student, but only from those attending
orientation and taking the BCSSE, it is difficult to tell how accurate this data is. Thirty-

76
one percent of students who did fill out the BCSSE declined to answer the question about
parental education.
Mediating Variables
A mediating variable or variables explains the relationship between the predictor,
or independent, and the outcome, or dependent, variables. Mediators can be the
mechanism through which the predictor produces an effect upon the outcome (Gay,
Mills, & Airasian, 2012). Past literature has demonstrated there are variables that covary
with generational status and may explain differences in academic performance by
generational status. Thus, it was necessary to include these mediating variables in the
model in order to create the best specified model of the relationship between generational
status and academic performance. These mediating variables are sense of belonging and
peer/faculty involvement, consisting of the Good Teaching and High-Quality Interactions
with Faculty scale, and Influential Interactions with Peers scale. Sense of belonging
was measured by the General Belongingness Scale, described below.
General Belongingness Scale (GBS). Sense of belonging has been interpreted and
operationalized quite differently in the higher education literature, and often confounded
with measures of involvement and/or peer interactions, along with engagement (Wolf-
Wendel, Ward, & Kinzie, 2009). In addition to these issues, some studies have found
that various measures of what might be termed involvement or integration have been
found to be related to feelings of belonging in college (Soria et al., 2013), and the concept
of involvement and integration is closely and theoretically related to belonging (Astin,
1975, 1984).

77
Students’ sense of belonging was assessed using the General Belongingness Scale
(GBS) (Malone, Pillow, & Osman, 2012). The measure was developed by the authors
because they determined a need for a general measure of belongingness. The measure
aligns with the psychological literature on belonging and is rooted in Baumeister and
Leary’s (1995) vision of belonging, which developed both from regular social contact
and feelings of belongingness, along with Hagerty et. al.’s (1992) conception of
belonging as rooted in both social relationships, and spirituality, nature, animals, and
ideologies. The current measure used in this study reflects these theories, and measures
belongingness across friends and family, societal others, and an overarching sense of
belonging (Malone et. al., 2012). This overarching sense of belonging reflects belonging
at a campus community or institutional level as well, since the questions were altered to
apply specifically to Montana State University.
When tested on a sample of 213 students, the one factor reliability of the GBS
was high: coefficient alpha .94 (Malone et al, 2012). Validity of the scale was tested as
well, and it was found to be correlated with other theoretically related constructs. For
example, the acceptance items were correlated with “Big Five” personality traits such as
agreeableness and extraversion, and rejection items were correlated with neuroticism
(Malone et al, 2012). In addition, since belonging is connected to satisfaction and
negatively related to anxiety and depression in the literature, this was examined as well.
The authors found that when entered as two predictors in regressions,
“Acceptance/Inclusion” strongly predicted life satisfaction and happiness, and the
“Rejection/Exclusion” strongly predicted depression (Malone et. al., 2012).

78
The GBS consists of twelve items on a seven- point Likert scale ranging from
“strongly agree” to “strongly disagree”, with six items clustering on acceptance/inclusion
and six clustering on rejection/exclusion (items in Appendix A). Items were altered to be
specific to Montana State University for the current study, and the negative items were
reverse-scored. The variables (or items) were ordinal, while the scale was continuous. To
determine reliability, Cronbach’s alpha reliabilities (Field, 2009) were conducted on the
GBS scale. Reliability were compared to the original reliability obtained by the authors
of the scale. Generally, alpha scores that are .7 or above are considered very good, and
even .5-.6 may be considered good as well, especially when using psychological
measures such as the GBS scale (Field, 2009). The alpha for the GBS was .95,which
indicates that the items formed a scale with high internal consistency reliability. The
mean GBS score was 64, s = 13.3, min = 20, max = 84, skewness = -.97 and kurtosis =
.67. See table one.
Student Experiences Survey Items. For the measures of peer/faculty involvement,
items were utilized from the Student Experiences Survey from the Wabash Study. These
included items that comprised two scales: Good Teaching and High-Quality Interactions
with Faculty, and Influential Interactions with Peers. These scales and items were
developed from the National Study of Student Learning (Cruce, Wolniak, Seifert, &
Pascarella, 2006; Pascarella, Wolniak, Seifert, Cruce, & Blaich, 2005). These scales
(Good Teaching and High-Quality Interactions with Faculty and Influential Interactions
with Peers) measure a range of good practices that include student-faculty interaction,

79
active learning/time on task, quality of teaching, prompt feedback from faculty, and
influential interactions with other students (Pascarella and colleagues, 2007).
Good teaching and high quality interactions with faculty is a twenty-three-item
scale that combines items from four subscales: Faculty interest in teaching and student
development (e.g., the extent to which faculty are interested in helping students grow in
more than just academic areas, the extent to which faculty are generally interested in
teaching, and the extent to which faculty are willing to spend time outside of class to
discuss issues of interest and importance to students); Prompt feedback (e.g., how often
faculty informed students of level of performance in a timely manner, how often faculty
checked to see if students had learned the material well before going on to new
materials); Quality and impact of non-classroom interactions with faculty (e.g., extent to
which non-classroom interactions with faculty have had an impact on: intellectual growth
and interest in college; personal growth, values, and attitudes; and career goals and
aspirations); and Overall exposure to clear and organized instruction (e.g., frequency that
faculty give clear explanation, frequency that faculty make good use of examples and
illustration to explain difficult points, frequency that class time was used effectively,
frequency that course goals and requirements were clearly explained). The internal
consistency reliability for the twenty-three-item scale is .92 (Pascarella and colleagues,
2007). In addition, good teaching and interactions with faculty positively predicts
student’s reading comprehension, critical thinking skills, internal attribution for academic
success, and openness to diversity and challenge (Cruce et al., 2006). In the current
study, faculty interest in teaching and student development; prompt feedback, and quality
and impact of non-classroom interactions with faculty were utilized; a total of twelve

80
items. These items were utilized in the Student Experiences Survey, and it was important
to keep the current survey relatively short to increase the likelihood that participants
would complete the survey. Internal reliability was computed, and the alpha for the
quality and impact of non-classroom interactions with faculty scale (.90), indicated high
internal consistency. The mean score was 45, s = 7.29, min = 19, max = 60, skewness = -
.74, kurtosis = 1.23. See table 1.
Influential interactions with peers is a nine-item scale that combined items from a
scale measuring student perceptions of positive peer interactions (e.g., the student
friendships one has developed at the institution have been personally satisfying;
interpersonal relationships with other students have had a positive influence on one’s
intellectual growth and interest in ideas; interpersonal relationships with other students
have had a positive influence on one’s personal growth, attitudes, and values) and a
single item measuring frequency of co-curricular involvement (number of hours per week
spent in co-curricular activities). The nine-item scale has an internal consistency
reliability of .85 (Pascarella and colleagues, 2007). Interactions with peers significantly
impact both cognitive development and orientations to learning, including learning for
self- understanding, openness to diversity and challenge, and preferences for higher-order
cognitive tasks (Cruce et al., 2006). In addition, Wabash National Study (WNS) research
assessing out of class or co-curricular experiences found that non-classroom interactions
with faculty and meaningful discussions with diverse peers had a positive impact upon
need for cognition (Padgett, Goodman, Johnson, Saichaie, Umbach, & Pascarella, 2010;
Trolian, 2014). Internal reliability was computed for the current study, and the alpha for
Peer Involvement (.81) indicated high internal consistency. The mean score for peer

81
involvement was 27, s = 5.45, min = 10, max = 37, skewness = -.47, kurtosis = .04. See
table 1.
Table 1. Descriptive statistics for all scales and continuous variables.
x̅ s min max skewness kurtosis
GBS 64 13.3 20 84 -.97 .67
Peer Involvement 27 5.5 10 37 -.47 .04
Faculty Involvement 45 7.9 19 60 -.74 1.23
GBS_Updated 43 9.0 15 56 -1.0 .51
Peer Involvement_Updated 21 4.8 5 27 -.86 .36
College GPA 3.32 .61 1.35 4.0 1.01 .48
High School GPA 3.58 .40 2.33 4.0
ACT Comprehensive 25 3.94 15 35
Re-configured Variables. In order to determine the underlying factor structure for
the GBS and the peer involvement scales, since they were found to be highly correlated
(described later), a principal axis factor analysis was conducted. The assumption of
independent sampling was met. The assumptions of normality, linear relationships
between variables, and the variables being correlated at a moderate level were checked.
Two factors were requested, based on the fact that the items were designed to be two
different scales measuring different constructs: sense of belonging, and influential peer
interactions. After rotation, the first factor accounted for thirty percent of the variance,
and the second factor accounted for twenty-seven percent of the variance. These results
appear to indicate that though the two scales are highly similar, they are measuring
something different, which is why belonging was not removed from the conceptual
model. Table 2 displays the items and factor loadings for the rotated factors.

82
Two new and updated scales were created using “compute variables” in SPSS:
Belonging_Updated and Peer Involvement_Updated, utilizing the information in the
factor analysis. The items loading strongly on the sense of belonging factor and included
in the Belonging_Updated scale were: Belong_Outsider (reverse coded), Belong_Isolated
(reverse coded), Belong_Stranger (reverse coded), Belong_Accepted, Belong_Included,
Belong_Not care (reverse coded), Belong_Distant (reverse coded), Belong_Sense of, and
Belong_Place at table. Reliability was calculated for the new scale. This new scale had
an alpha of .94, which is considered very high (Field, 2009). The items loading strongly
on the peer involvement scale and included in the Peer Involvement_Updated scale were:
Peer interactions_Close relationship with peers, Peer interactions_Personally satisfying,
Peer interactions_Positive effect on intellectual growth, Peer interactions_Positive effect
on personal growth, and Belong_bonds with friends. The reliability was calculated for
this new scale as well, and the alpha was .93, again, considered very high (Field, 2009).
Belong_connected, Belong_Not included in plans, and Peer interactions_Difficult to
make friends loaded fairly equally on both factors and so were excluded from the scales.
Finally, two items: Peer interactions_would not help with problem, and Peer
interactions_attitudes and values different from own did not load highly on either factor,
indicating they may be measuring a separate and different construct than belonging and
positive peer interactions. These were both negative/reverse coded items, stating: “few of
the students I know would be willing to listen to me and help me if I had a personal
problem”, and “most students at this institution have values and attitudes different than
my own”.

83
It may be that these items are measuring affect and cognition related to stigma and
stereotype threat. Much of the current behavioral intervention research has focused on
how first-generation and working-class students often espouse different values from other
students; values that are usually out of line with the traditional culture of higher education
and more focused on interdependence vs. independence (Phillips, Stephens, & Townsend,
2016; Prospero & Vohra-Gupta, 2007). This item may be capturing this feeling of not
fitting into the culture of higher education. In addition, the item stating that other
students would not help out if the person had a problem may also be capturing the feeling
of “every man/woman for themselves” or the culture of independence espoused by the
traditional university. Some previous research (Morrow & Ackermann, 2012) has found
that feeling as if one has strong social supports is highly related to belonging, which may
be what this item is measuring as well, since it is basically asking if students have anyone
who would assist them or support them if they were in trouble. Both of these items will
be evaluated using a chi-square analysis against generational status, and will be entered
into the regression models to see how they impact both sense of belonging, and college
GPA.

84
Table 2. Factor loadings from principal axis factor analysis with varimax rotation for a
two-factor solution for GBS and peer involvement (n = 184).
________________________________________________________________________
Item Factor Loading
1 2 Communality
________________________________________________________________________
Belonging_Outsider .78 .74
Belonging_Stranger .77 .75
Belonging_Isolated .74 .65
Belonging_Accepted .73 .77
Belonging_Included .68 .72
Belonging_Not care .67 .66
Belonging_Distant .66 .63
Belonging_Sense of .65 .75
Belonging_Place at table .62 .68
Peer_Difficult make friends .52 .37 .53
Peer_Not help if problem .31 .26
Peer_Different attitudes/values .28
Peer_Close relationships .85 .75
Peer_Satisfying relationships .84 .80
Peer_Positive intellectual growth .80 .76
Belonging_Bonds w/friends .76 .74
Peer_Positive personal growth .74 .71
Belonging_Connected .50 .55 .64
Belonging_Not included/plans .50 .50 .55
Note: Loadings < .01 are omitted.
Control Variables. The control variables utilized in this study included high
school ACT scores, high school GPA, race, gender, and Pell grant status. These were all
obtained by the OPA from the participant’s institutional records. In the sample high
school ACT comprehensive scores had a mean of 25, s = 3.94, min = 15, max = 35. The
MSU population also had a mean ACT score of 25. High school cumulative GPA had a

85
mean of 3.58, s = .40, min = 2.33, max = 4.0. The MSU population had a mean GPA
score of 3.54. Race was transformed from a multi-category variable to a categorical
dummy-coded variable, since the non-white racial categories were very small. They
included Hispanic (four percent), Multiracial (seven percent), Indian (two percent), Black
(one percent), and International Student (three percent), which were categories utilized by
the OPA. Each had such a small number of cases that they were grouped together and
defined as “Student of Color”, dummy coded as “1,” while the “Caucasian/White”
category was kept as is, and was dummy coded as “0.” Students of color comprised
seventeen percent of the sample, and sixteen percent of the population at MSU. The
gender variable was dummy coded as female = 1 (sixty-five percent), and male = 0
(thirty-five percent), and these were the only two categories available, again from the
OPA. While females were a majority of the sample, at sixty-five percent, they are a
minority at MSU, at forty-five percent. The Pell grant status variable was dummy coded
as well, with Pell grant recipient = 1 (twenty-six percent), and non-recipient = 0 (seventy-
five percent). Pell grant recipients in the sample, at twenty-six percent, were more
numerous than the population at MSU, at twenty-one percent.
Outcome Variables. The dependent variable was academic performance,
operationalized as first-term college GPA, and measured on a 4-point scale. GPA was a
continuous variable, ranging from 0-4. GPA is one of the more commonly used measures
of academic performance in the education literature (Mayhew et al., 2016; York, Gibson,
& Rankin, 2015). York et al.’s (2015) study of education literature’s definition of
academic success found that 17 studies utilized GPA as the measurement of academic

86
performance, while 4 studies utilized grades. Though there are certainly arguments that
GPA does not always capture the full picture of academic performance (Young, 1990), it
has been determined to be a valid and easily available proxy (Mayhew et al., 2016; York
et al., 2015). College GPA is also a very reliable positive predictor of retention and
graduation (Mayhew et al., 2016). The mean first-term fall GPA was 3.32, s = .61, min =
1.35, max = 4.0, skewness = -1.01, kurtosis = .48, see table 1. The assumption of
normality was not met, since the dependent variable of college GPA was negatively
skewed, and the Kolmogorov-Smirnov test (.15) and the Shapiro-Wilk test (.89) were
statistically significant for the cohort as a whole at p < .0001, and also for both groups,
first-generation and continuing-generation students, (p < .001). In order to address this
issue, a median split was performed on the College GPA variable in SPSS, to attempt to
normalize the data and create a categorical variable. The median of college GPA was
3.5. A dummy variable was created, where “low” was assigned a 0, and defined as a
GPA from 0-3.4999, and “high” was assigned a 1 and defined as a GPA from 3.5-4.0.
Though necessary in order to perform analyses, splitting GPA into a categorical variable
with two categories, either high or low, and such a high median, means that some of the
variance in the low category is not captured, and this is a limitation. This means that for
the purposes of this study, a participant with a GPA of a 1.35 is the same as a participant
with a GPA of a 3.4. However, in reality these participants may differ in significant ways
that are not analyzed in the current study.

87
Participants
The characteristics of the sample are presented in table 3 below.
Table 3. Sample and population descriptive statistics.
Characteristic/Variable Sample Population: MSU
First-Generation 28% (n = 51) 16.7%
Continuing-Generation 72% (n = 133) 52.6% (30.7% No
response)
White/Caucasian 82% (n = 150) 84%
Person of Color 17% (n = 32) 16%
Female 65% (n = 119) 44.6%
Male 35% (n = 65) 55.4%
Pell Grant Recipient 26% (n = 47) 20.8%
No Pell Grant 75% (n = 137) 79.2%
Average High School
GPA
3.58 3.54
Average ACT COMP
score
25 25
The characteristics of the sample were similar overall to the characteristics of the
population of first-year, first-time students entering MSU in fall term 2018 (MSU Office
of Planning and Analysis, 2018d). However, there was a major difference for the
predictor variable of first-generation status, since for the fall of 2018, thirty-one percent
of students did not respond to the parental education question on the BCSSE. Therefore,
it is unknown what the actual percentage of first-generation students is for the 2018
cohort of students. In addition, some of the control variables were different between the
sample and the population. In the sample, females were in the majority, at sixty-five
percent, while at MSU, females are in the minority at forty-five percent. Females may

88
have been in the majority of respondents for the sample because females tend to respond
to and fill out surveys at a higher level than males (Keusch, 2015; Porter & Whitcomb,
2005). In addition, there are slightly higher number of Pell grant recipients in the current
sample when compared to the MSU population.
T tests and chi-square analyses were conducted in order to see if there were
differences between first-generation and continuing-generation students in the sample on
the control variables: ACT scores, high school GPA, Pell grant status, race, and gender.
The results were statistically significant for both Pell grant status and race. First-
generation students were more likely to be Pell grant recipients than were continuing-
generation students, and there was a significant association between generational status
and Pell grant status, X 2 = 11.48, p < .001. First-generation students were also more
likely to be students of color than were continuing-generation students. There was a
significant association between generational status and race, X 2 = 4.76, p < .05. These
results support the decision to control for these variables, since there are positive
relationships between generational status, race, and Pell grant status, both in the current
sample and in the national data.
Analysis
The purpose of the current study was to determine the effects of first-generation
student status, belonging, peer and faculty involvement and co-curricular involvement on
academic performance in college, while controlling for student’s pre-college
characteristics (Cohen, Cohen, West, & Aiken, 1983). First, differences in sense of
belonging between first-generation and continuing generation college students were

89
examined. Research has shown that first-generation college students tend to have lower
levels of social belonging in college than continuing-generation students, impacting their
academic performance (Pittman & Richmond, 2007; Rubin, 2012; Stebleton, Soria, &
Huesman, 2014). Next, it was explored whether any difference in students’ sense of
belonging was mediated by peer and faculty interactions, since belonging and peer
involvement are often found to be highly related or confounded in multiple research
studies (Hoffman, Richmond, Morrow, & Salomone, 2002; Pittmn & Richmond, 2007;
Strayhorn, 2012).
The relationship between generational status and academic performance, as
measured by GPA, was also examined, along with the extent to which this relationship
was mediated by belonging and peer and faculty interactions, while controlling for pre-
college characteristics. Peer and faculty involvement were thought to influence the
outcome of academic performance (Cruce et al., 2006; Padgett, Goodman, Johnson,
Saichaie; Pascarella and colleagues, 2007; Umbach, & Pascarella, 2010; Trolian, 2014).
Finally, the relationship between sense of belonging and academic performance was
hypothesized to be moderated by generational status. Ultimately, it was hypothesized
that the effects of belonging would be conditional by generational status, so that first-
generation student’s sense of belonging would have a larger impact upon their academic
performance than belonging would for continuing-generation students. Research
examining stigma and stereotype threat and its impact on first-generation students has
indicated that feelings of belonging might have an outsized impact on college grades for
first-generation students (Cohen, Garcia, Apfel & Master, 2006; Cohen, Garcia, Purdie-

90
Vaughns, Apfel, & Brzustoski, 2009; Critcher & Dunning, 2015; Jury, Smeding,
Stephens, Nelson, Alelai, & Darnon, 2017).
The predictor variable was categorical (first-generation or continuing-generation),
and the other independent variables (good teaching and high-quality interactions with
faculty, influential interactions with peers, co-curricular involvement, and sense of
belonging, were interval or continuous variables. The final dependent variable, GPA,
was categorical and dummy-coded, since it was converted from a continuous variable.
OLS (block regression) was selected as the first analysis method since there was more
than one independent variable, along with continuous or interval independent and
dependent variables (Cohen, Cohen, West, & Aiken, 1983; Gay, Mills, & Airasian,
2012). In addition, OLS with the block entry method is utilized when there are
theoretical reasons to group certain variables together into blocks, entered in a sequential
order (Fields, 2009). OLS tells us how much of the variance in the dependent variable
can be attributed to each of the independent variables and determines the degree to which
variables are related (Gay, Mills, & Airasian, 2012). Logistic regression was selected for
the research questions with GPA as dependent variable, since GPA was converted to a
categorical variable. The conceptual framework is illustrated below in figure three.

91
Figure 3. Conceptual framework.
Data Conditioning and Assumption Checking
Data were cleaned, so that they could be systematically examined for missing or
incomplete answers. Numbers that were out of range (of a Likert scale, for example)
were not possible since the researcher used Qualtrics software. A minimum 60%
completion rate of items within the scaled measures was required to generate a scale
score and be used in the data analysis. Twenty-three participants did not reach this sixty
percent minimum completion rate, and so were deleted from the rest of the analysis.
Three participants had only a few items missing from one or more scales, and these single
items were replaced using mean replacement, by calculating the total mean of the scale
for that participant. There were also a total of eighteen missing cases for ACT
comprehensive scores, and nineteen for high school GPA, which were replaced using the
mean of all participants’ scores on the ACT comprehensive, and on high school GPA.
Out of all the ACT comprehensive and high school GPA data, eight participants had

92
neither an ACT comprehensive score nor a high school GPA. These scores were
replaced in the same manner; by using the mean of all participant’s scores on the ACT
and for high school GPA. In order to determine if the data was missing in any systematic
manner or was correlated with certain values of the independent variables, chi square
tests were conducted on each of the pre-college characteristics, and there were no
statistically significant differences between participants with missing data vs. no missing
data.
Since the Office of Planning and Analysis provided ACT and SAT scores, and
some participants had both and some had one or the other, the researcher decided to use
the ACT comprehensive score for all participants. SAT scores were converted to ACT
scores utilizing the ACT/SAT concordance tables (College Board ACT Inc., 2018). For
the one participant who had a high school GPA from a country outside of the U.S., the
MSU Office of International Programs was contacted, and they provided the U.S.
equivalent GPA score.
All three scales (GBS, faculty interactions and peer interactions) were re-coded in
SPSS so that higher numbers were equivalent to higher levels of belonging and of
positive faculty and peer involvement, and then the negative items were reverse-coded.
Scale total scores were calculated in SPSS for each of the scales by creating new
variables: General Belongingness Scale (GBS) Total, Good Teaching and High-Quality
Interactions with Faculty Total, and Influential Interactions with Peers Total. Item scores
were summed to create the scale score total for the GBS, faculty interactions, and peer
interactions scales.

93
Assumptions that the data are normal are necessary to utilize parametric statistics
(Leech Barrett, & Morgan, 2015). For linear regression, the assumptions that need to be
met are that the relationship between each of the predictor variables and the dependent
variable are linear and that the error, or residual, is normally distributed and not
correlated with the predictor variables (Leech, Barrett, & Morgan, 2015). Therefore, p
plots showing the predicted by actual residuals, and the linear regression line of the
dependent variable were produced in SPSS. Multicollinearity can be a problem as well,
which is when there are high intercorrelations among predictor variables, which would
mean that these variables are too similar and cannot be distinguished as truly measuring
different constructs (Leech, Barrett, & Morgan, 2015). Therefore, when regression was
computed in SPSS, the correlation table was examined for high correlations among
predictors. In addition, the tolerance levels were examined to determine if
multicollinearity was occurring between variables. Finally, Cook’s distance and casewise
diagnostics were calculated in SPSS to determine if outliers existed and if they might be
contributing to the heteroskedasticity of the errors.
The initial regression conducted to examine assumptions indicated that some of
the tolerance levels were low. 1-Adjusted R2 (.27) = .73. This meant that tolerance levels
below .73 could mean that multicollinearity was occurring. The tolerance levels for the
following were below .73: Sense of Belonging = .34, Peer Involvement =.38, and ACT
comprehensive= .67. Correlations were computed using SPSS, in order to see if
assumptions of linear regression were met. When examining the bivariate correlations
between independent variables as well, Sense of Belonging (the GBS) and Peer
Involvement were highly correlated (.77), indicating that they were likely measuring

94
similar constructs, which can interfere with an accurate regression model. The
correlation between high school GPA and ACT comprehensive was .42, a moderate
correlation. Since high school GPA and ACT scores measure similar constructs, ACT
comprehensive was removed as a variable from regression models. In addition, since the
GBS and Peer Involvement were highly correlated, and the t test comparing the GBS and
Peer Involvement means for first-generation and continuing-generation students was
statistically significant only for Peer Involvement (described in the next chapter), the
GBS was removed from the initial regression models as an independent variable.
Therefore, the rest of the analysis described below utilizes the Peer Involvement scale as
a substitute for the GBS. See table 4 for correlations between all the variables in the
study.

Table 4. Correlation matrix of all variables used in study.
1 2 3 4 5 6 7 8 9 10
1 GEN Status 1.00
2 Gender .051 1.00
3 Race .143 -.088 1.00
4 High School GPA -.077 .130 -.029 1.00
5 ACT
Comprehensive -.135 -.210 -.103 .369 1.00
6 Pell Grant Recipient .250 .172 .042 -.224 -.277 1.00
7 Peer INV Total -.188 -.039 -.011 .113 .043 -.115 1.00
8 Fall College GPA -.054 .110 -.066 .516 .239 -.150 -.006 1.00
9 Belong Total -.089 -.029 -.053 .108 -.116 -.088 .757 .010 1.00
10 Faculty INV Total -.041 -.048 .027 .114 -.084 -.056 .355 .149 .474 1.00
94

95
Finally, the regression line for the transformed college GPA variable (now
categorical) was produced in SPSS, which indicated that the dependent variable followed
a linear regression line closely, meeting the assumption of linearity. Then the
standardized predicted vs. residuals for the dependent variable college GPA were
produced, which indicated some possible heteroskedasticity in the data. To examine the
issue more closely, casewise diagnostics were produced in SPSS with standardized
residuals, along with Cook’s distance values. To meet assumptions, ninety-five percent
of cases should have a standardized residual ± 2. Since the sample size was 188, ninety-
five percent is 179, so we could expect that 9 cases could values outside of ± 2.
However, there were 11 in the sample. In addition, there were 4 cases that were ± 3. The
4 cases that had residuals of ± 3 were removed from the analysis. When examining
Cook’s distance values, they were all acceptable, with values below 1. Therefore, the
final sample size was 184.
The analysis plan described below, by research question, was the plan with an
expectation of met assumptions. Since ultimately, not all assumptions were met, the
analysis plan was changed. The revised analysis is described in chapter four, with the
results.
Research Question 1
Is there a difference in students’ sense of belonging between first-generation and
continuing generation college students? Independent t tests were conducted in SPSS to
compare the mean GBS score and mean peer involvement score between the two groups,
first-generation and continuing-generation students.

96
Research Question 2
To what extent is any difference in students’ sense of belonging by generational
status mediated by peer and faculty interactions, controlling for pre-college
characteristics?
OLS regression was conducted controlling for student background characteristics
and examining the indirect effects of first-generation on sense of belonging, as mediated
by peer and faculty interactions. In the SPSS linear regression function, generational
status was entered into the first block, then control variables; high school GPA, gender,
race, and Pell grant status into the second block, and Influential Peer Interactions scale
total and the Good Teaching and High-Quality Interactions with Faculty scale total into
the third block. The GBS scale total was entered into the dependent variable section.
Research Question 3
Is there a relationship between generational status and academic performance as
measured by GPA?
An independent t test was conducted in SPSS with generational status as the
predictor and college GPA as the dependent variable. An independent t test, along with
chi-square was conducted, since the analysis was conducted with GPA as both a
continuous and a categorical variable (dummy coded). GPA was converted to a
categorical variable since assumption checking found that the continuous variable was
negatively skewed.

97
Research Question 4
To what extent is the relationship between generational status and GPA mediated
by sense of belonging and peer and faculty interactions?
Logistic regression was conducted in SPSS, rather than OLS regression as
wasfirst planned, due to the results of assumption testing. GPA was converted to a
categorical variable, so logistic regression was conducted, controlling for background
characteristics and examining the indirect effects of generational status and peer and
faculty interactions on academic performance. Generational status was entered into the
first block, and then the control variables; high school GPA, gender, race, and Pell grant
status into the second block. Then the Influential Peer Interactions scale total and the
Good Teaching and High-Quality Interactions with Faculty scale totals were entered into
block three. The dependent variable was college GPA.
Research Question 5
To what extent is the relationship between sense of belonging and academic
performance, controlling for peer and faculty interactions, moderated by generational
status.
Though OLS regression had been planned since GPA was continuous, it was no
longer appropriate, and logistic regression was conducted. To determine the presence of
conditional effects, the cross-products terms for generational status*peer involvement
were calculated using the compute variable function in SPSS. Generational status was
entered into the first block, and the control variables; high school GPA, gender, race, and

98
Pell grant status into the second block. Then Influential Peer Interactions scale total and
the Good Teaching and High-Quality Interactions with Faculty scale totals were entered
into block three. Finally, the interaction term of generational status*peer involvement
was entered into block four. The dependent variable was college GPA.

99
RESULTS
The purpose of the current study was to investigate the impact of college students’
generational status and sense of belonging, along with faculty and peer involvement and
interactions, upon academic performance in college. It was hypothesized that due to the
stigma and stereotype threat felt by those students whose parents did not graduate from
college, first-generation college students would have lower levels of belonging on
campus than continuing-generation students. It was also hypothesized that peer and
faculty interactions would mediate the effects of belonging upon academic performance,
and that generational status would moderate the impact of belonging upon academic
performance, operationalized as fall term college GPA.
Research Questions
Research Question 1
Is there a difference in students’ sense of belonging between first-generation and
continuing generation college students?
Results of the independent samples t test examining the mean difference in
belonging between first-generation and continuing-generation students indicated the
difference between means was not statistically significant. The following assumptions
were tested and met: 1. The variances of the population were fairly equal, 2. observations
were independent, and 3. the GBS score, the dependent variable, was normally
distributed. However, the assumption that group sizes were equal was not met, since
first-generation students had n = 51, and continuing-generation students n = 133. There

100
was no statistically significant difference between first-generation (x̅ = 62) and
continuing-generation (x̅ = 65) students in their sense of belonging: t (182) = 1.2, p = .23.
Since the researcher made the decision to remove belonging from the regression
due to the high correlation with peer involvement, as described in chapter 3, the peer
involvement score was also examined in a t test as the dependent variable. The following
assumptions were tested and met: 1. The variances of the population were fairly equal, 2.
observations were independent, and the peer involvement total, the dependent variable,
was normally distributed. However, the assumption that group sizes were equal was not
met, since first-generation students had n = 51, and continuing-generation students n =
133. There was a statistically significant difference between first-generation (x̅ = 25) and
continuing-generation (x̅ = 28) students, with first-generation students self-reporting
lower levels of positive peer involvement and interaction: t (182) = 2.6, p = .01, d = .60.
The effect size of .60, according to Cohen (1988), is a medium to large effect size,
indicating that the effect is larger than typical in the behavioral and social sciences. See
tables 5 and 6 for summary.
In addition, t tests were also conducted on the new Belonging_Updated scale, and
the new Peer Involvement_Updated scale, described in the previous chapter. Departing
from the results above, there was no significant difference between first-generation (x̅ =
42) and continuing-generation (x̅ = 44) students on the Belonging_Updated scale: t (182)
= 1.33, p = .184. There was also no significant difference between first-generation (x̅ =
20) and continuing-generation (x̅ = 21) students on the Peer Involvement_Updated scale:
t (182) = 1.43, p = .154. See tables 5 and 6.

101
Table 5. T test results comparing first-generation and continuing-generation students on
GBS scale and belonging_updated scale.
GBS Scale n x̅ s t df p
Continuing-Generation 133 65 13.53 1.2 182 .23
First-Generation 51 62 12.63
________________________________________________________________________
Belonging_Updated Scale
________________________________________________________________________
Continuing-Generation 133 44 9.13 1.3 182 .184
First-Generation 51 42 8.47
Table 6. T test results comparing first-generation and continuing-generation students on
peer involvement scale and peer involvement_updated scale.
Peer Involvement n x̅ s t df p
Continuing-Generation 133 28 5.55 2.58 182 .01**
First-Generation 51 25 4.86
Peer Involvement_Updated
Continuing-Generation 133 21 4.85 1.43 182 .154
First-Generation 51 20 4.75
________________________________________________________________________
** p <.01
In order to determine if there were significant differences between first- and
continuing-generation students on the two items “attitudes and values different from
own”, and “would not help with problem”; along with testing the proposition that these
items were serving as proxies for stereotype threat or cultural mismatch, chi-square
analyses were conducted. These two items, along with the peer involvement scale as a
whole, were reverse scored prior to using them in the analysis. Higher numbers equaled
higher levels of positive peer involvement. Therefore, these negative items were reverse
scored so that 1 = strongly agree, while for the positive items, it was the opposite, and 1 =
strongly disagree. Generational status was the predictor and the scale (strongly agree,

102
agree, neutral, disagree, and strongly disagree) choices were used as the outcome
categories for the variable. Agree/strongly agree and disagree/strongly disagree were
collapsed for the sake of interpretation. For “attitudes and values different from own”,
there was no significant association between generational status and the item scales, X 2 =
2.46, p = .78. For first-generation students, thirty-seven percent agreed or strongly
agreed that students had attitudes and values different from their own, while twenty-nine
percent of continuing-generation students agreed or strongly agreed that students had
attitudes and values different from their own.
For “would not help with problem”, there was a significant association between
generational status and the item, X 2 = 12.55, p < .05. For first-generation students, fifty-
one percent agreed or strongly agreed that if they had a problem, peers would not help
them, and thirty-four percent disagreed/strongly disagreed. For continuing-generation
students, thirty-five percent agreed/strongly agreed that if they had a problem, peers
would not help them, and fifty-nine percent disagreed/strongly disagreed. In summary,
first-generation students were significantly more likely than continuing-generation
students to agree that none of their peers would assist them if they had a problem. It was
hypothesized that these items were measuring a different construct than the other items
within the peer involvement scale; possibly stigma or stereotype threat or feelings of
cultural mismatch. These items were entered separately into the regression model
predicting academic performance, described later in this chapter.

103
Research Question 2
To what extent is any difference in students’ sense of belonging by generational status
mediated by peer and faculty interactions, controlling for pre-college characteristics?
To investigate if peer and faculty interactions altered the relationship between
generational status and sense of belonging while controlling for Pell grant status, high
school GPA, race, and gender, OLS regression was computed in SPSS. Block 1 in SPSS
included generational status. Block 2 in SPSS included generational status and all
controls. Block 3 included generational status, all controls, faculty involvement, and peer
involvement. The assumptions of linearity, normally distributed errors, and uncorrelated
errors were checked and met. Means and standard deviations are presented in table 7.
Generational status (Model 1) did not significantly predict sense of belonging F (1, 182)
1.5, p = .23, R2 = .01. Generational status, Pell grant status, high school GPA, race, and
gender (Model 2) did not significantly predict sense of belonging F (4, 178) .69, p = 60,
R2 change = .01. However, when faculty involvement and peer involvement were added
to the model, they significantly improved the prediction; R2 change = .60, F (2, 176)
142.2, p = .0001. This is a large effect according to Cohen (1988). The beta weights and
significance values, presented in table 8, indicate which variables contributed the most to
predicting sense of belonging, when all variables were entered as predictors. With this
combination of predictors, peer involvement has the highest beta, (.69), though both peer
involvement and faculty involvement significantly contributed to predicting sense of
belonging.

104
Table 7. Means, standard deviations, and intercorrelations for GBS, predictor and control
variables (n = 184).
Variable x̅ s 1 2 3 4 5 6 7
GBS 64.1 13.3 -.09 -.09 .11 -.05 -.03 .76** .47**
Predictor Variable
1. Gen Status .28 .45 .25** -.08 .14** .05 -.19** -.04
2. Pell Grant Status .26 .44 -.22** .04** .17** -.16 -.06
3. High School GPA 3.6 .40 -.03 .13** .11 .11
4. Race .18 .39 -.09 -.01 .03
5. Gender .65 .48 -.04 -.05
6. Peer Inv 27 5.5 .36**
7. Faculty Inv 45 7.3
________________________________________________________________________
** p < .01

105
Table 8. OLS regression analysis summary with generational status predicting sense of
belonging, with peer and faculty involvement as mediators, controlling for pre-college
characteristics (n = 184).
Variables Model 1 Model 2 Model 3
Coefficient t ratio Coefficient t ratio Coefficient t ratio
First-Gen -0.9 -1.2 -.06 .80 .06 1.3
(reference
group =
continuing-gen)
Students of -.05 -.61 -.07 -1.5
Color (reference
group= White)
Females -.04 -.54 .003 .05
(reference
group= males)
Pell grant -.04 -.51 -.01 -.14
(reference
Group=No
Pell grant)
HS GPA .10 1.22 .000 -.01
Peer Inv .69 13.55***
Faculty Inv .23 4.70***
R2 .01 .02 .63***
R2 Change .01 .01 .60
* p < .05; ** p < .01; *** p < .001
OLS regression was computed again, using the new updated versions of both
belonging and peer involvement created in the factor analysis. To investigate if the
relationship between generational status and belonging changed when peer involvement
(updated) and faculty interaction were added, while controlling for Pell grant status, high
school GPA, race, and gender, OLS regression was computed in SPSS. Block 1 in SPSS

106
included generational status. Block 2 included generational status and all controls. Block
3 included generational status, all controls, peer involvement_updated, and faculty
involvement. Block 4 included generational status, all controls, peer
involvement_updated, faculty involvement, and stigma/stereotype threat variables. The
assumptions of linearity, normally distributed errors, and uncorrelated errors were
checked and met. Means and standard deviations are presented in table 9. Generational
status (Model 1) did not significantly predict sense of belonging_updated F (1, 180) 1.7,
p = .20, R2 = .01. Generational status, Pell grant status, high school GPA, race, and
gender (Model 2) did not significantly predict sense of belonging_updated F (5, 176) .52,
p = .47, R2 change = .02. However, when faculty involvement and peer
involvement_updated were added to the model, they significantly improved the
prediction; R2 change = .57, F (7, 174) 1248.23, p = .0001. This is a large effect
according to Cohen (1988). Finally, when the two peer involvement items, “would not
help with problem”, and “attitudes and values different from own” were added to the
model, they significantly improved upon model 3’s prediction of belonging_updated; R2
change = .02, F (9,172) 1005.7, p = .01. The beta weights, presented in table 10, indicate
which variables contribute the most to predicting sense of belonging_updated, when all
variables were entered as predictors. With this combination of predictors, peer
involvement_updated has the highest beta, (.62), though peer involvement_updated,
faculty involvement, and race all significantly contributed to predicting sense of
belonging_updated in the final model. The two peer involvement items, “would not help
with problem”, and “attitudes and values different from own” did not reach traditional

107
statistical significance, though there does appear to be a trend in that direction, since they
were p = .09 and p = .08, respectively. Especially considering the small sample size,
these are fairly close to .05. In its entirety, the results indicate that sixty percent of the
variance in sense of belonging_updated was explained by the final full model, model 4.
Table 9. Means, standard deviations, and intercorrelations for GBS_updated and
predictor variables (n = 184).
Variable x̅ s 1 2 3 4 5 6 7 8 9
GBS_Updated 43.2 8.97 -.10 -.09 .10 -.08 -.04 .74** .48** .25** .28**
Predictor Variable
1. Gen Status .28 .45 .25** -.08 .16* .05 -.11 -.04 -.18* -.08
2. Pell Grant .26 .44 -.22** .06 .17* -.07 -.06 -.08 -.10
3. HS GPA 3.6 .40 -.05 .13 .09 .11 .11 -.08
4. Race .18 .38 -.08 .02 .02 -.06 -.01
5. Gender .65 .48 .03 -.05 -.01 -.09
6. Peer Inv_U 20.8 4.8 .40** .14 .23**
7. Faculty Inv 45 7.3 .14 .03
8. Peer Inv_
Would not help 3.2 1.28 .38**
9. Peer Inv_
Attitudes/values 3.0 1.03 .28**
______________________________________________________________________________________
* p < .05; ** p < .01; *** p < .001

108
Table 10. OLS regression analysis summary; generational status predicting sense of
belonging_updated with peer involvement_updated and faculty involvement as
mediators, controlling for pre-college characteristics (n = 184).
Variables Model 1 Model 2 Model 3 Model 4
Coefficient t ratio Coefficient t ratio Coefficient t ratio Coefficient t ratio
First-Gen -.10 -1.3 -.07 -.85 .01 .10 .02 .44
(reference
group =
Continuing-Gen)
Students of -.07 -.86 -2.3 -2.0 -.10* -1.1*
Color (reference
group= White)
Females -.05 -.65 -.05 -.95 -.04 -.77
(reference
group= Males)
Pell grant -.04 -.51 -.02 -.29 -.01 -.11
(reference
Group=No
Pell grant)
HS GPA .09 1.1 .01 .25 .02 .31
Peer Inv_ .65 12.4*** .62 11.7***
Updated
Faculty Inv .22 4.1*** .22 4.1***
Peer Inv_
Would not help .09 1.7
Peer Inv_
Attitudes/Values .09 1.8
R2 .01 .03 .60*** .62**
R2 Change .01 .02 .57 .02
* p < .05; ** p < .01; *** p < .001

109
Research Question 3
Is there a relationship between generational status and academic performance as
measured by GPA?
The following assumptions were tested and met: 1. The variances of the
population were fairly equal, and 2. observations were independent. However, the
assumption that group sizes were equal was not met, since first-generation students had n
= 51, and continuing-generation students n = 133. The chi-square test showed no
statistically significant association between first-generation (x̅ = 3.27) and continuing-
generation (x̅ = 3.34) students and their first-term college GPA, X 2 = 2.77, p = .10.
Research Question 4
To what extent is the relationship between generational status and GPA mediated
by sense of belonging and peer and faculty interactions?
To investigate if peer and faculty interactions altered the relationship between
generational status and college GPA while controlling for Pell grant status, high school
GPA, race, and gender, logistic regression was computed in SPSS. OLS regression could
not be used, since college GPA was converted to a categorical variable in order to address
non-normal, negatively skewed data. Belonging was eliminated as an independent
variable, as described earlier, due to the high correlation with peer involvement. The
assumptions for logistic regression of observations being independent and independent
variables being linearly related to the log were checked and met. Block 1 included
generational status. Block 2 included generational status and all controls. Block 3
included generational status, all controls, peer involvement, and faculty involvement.

110
High school GPA had a large positive impact on college GPA. The odds of a
high college GPA increased by fifteen times with each one unit increase in high school
GPA. This was true across all models. When the pre-college variables were controlled
for in model 4, the odds of a high college GPA was six percent more likely with each one
unit increase in faculty involvement, X 2 = 6.49 df = 2, n = 182, p < .05. Faculty
involvement had a positive and significant relationship with college GPA. Peer
involvement did not have a statistically significant relationship with high college GPA, p
= .70, and had a negative relationship to GPA throughout all of the models. Table 11
presents the model summaries.
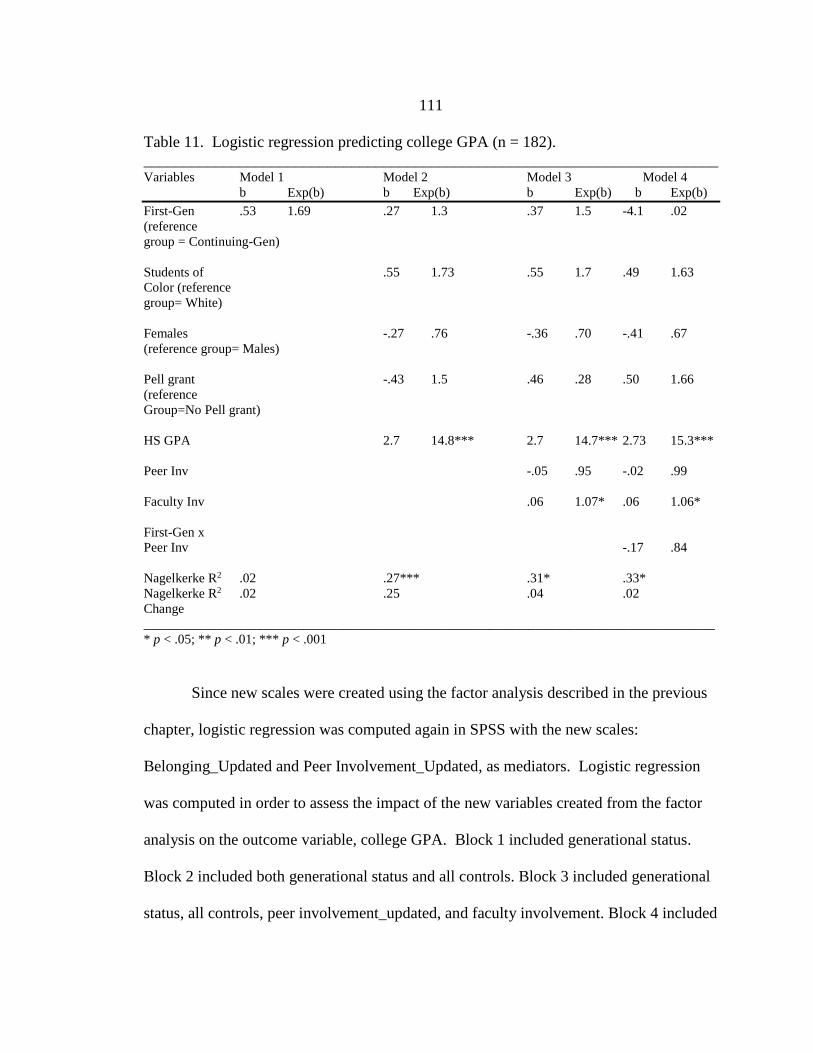
111
Table 11. Logistic regression predicting college GPA (n = 182).
________________________________________________________________________ Variables Model 1 Model 2 Model 3 Model 4
b Exp(b) b Exp(b) b Exp(b) b Exp(b)
First-Gen .53 1.69 .27 1.3 .37 1.5 -4.1 .02
(reference
group = Continuing-Gen)
Students of .55 1.73 .55 1.7 .49 1.63
Color (reference
group= White)
Females -.27 .76 -.36 .70 -.41 .67
(reference group= Males)
Pell grant -.43 1.5 .46 .28 .50 1.66
(reference
Group=No Pell grant)
HS GPA 2.7 14.8*** 2.7 14.7*** 2.73 15.3***
Peer Inv -.05 .95 -.02 .99
Faculty Inv .06 1.07* .06 1.06*
First-Gen x
Peer Inv -.17 .84
Nagelkerke R2 .02 .27*** .31* .33*
Nagelkerke R2 .02 .25 .04 .02
Change
______________________________________________________________________________________
* p < .05; ** p < .01; *** p < .001
Since new scales were created using the factor analysis described in the previous
chapter, logistic regression was computed again in SPSS with the new scales:
Belonging_Updated and Peer Involvement_Updated, as mediators. Logistic regression
was computed in order to assess the impact of the new variables created from the factor
analysis on the outcome variable, college GPA. Block 1 included generational status.
Block 2 included both generational status and all controls. Block 3 included generational
status, all controls, peer involvement_updated, and faculty involvement. Block 4 included

112
generational status, all controls, peer involvement_updated, faculty involvement, and
belonging_updated. Block 5 included generational status, all controls, peer
involvement_updated, faculty involvement, belonging_updated, and the
stigma/stereotype threat variables. The assumptions for logistic regression of
observations being independent and independent variables being linearly related to the
log were checked and met.
The prediction model had a statistically significant probability of accurately
predicting high/low first-term college GPA in the sample, X 2 = 39.27 df = 5, n = 182, p
< .001. When faculty involvement and peer involvement_updated were added to the
third model, they significantly improved the prediction of college GPA, X 2 = 11.29, df =
7, n = 182, p < .001. Table 12 presents the model summaries, which indicate that in the
final model, the odds of having a high first-term college GPA increase by nineteen times
for every unit increase in high school GPA scores. High school GPA was a consistently
significant predictor across all of the models, p < .001. When peer involvement_updated
and faculty involvement were added to the model, faculty involvement significantly
contributed to the model predicting college GPA, p < .01, and peer involvement_updated
significantly contributed as well, p < .01. Faculty involvement was a positive predictor;
the odds of a high college GPA increased by nine percent for each one- unit increase in
faculty involvement. However, peer involvement_updated was a negative predictor; the
odds of a high college GPA decreased by thirteen percent for each one unit increase in
peer involvement. Belonging_updated, when added to model 5, did not contribute
significantly to the prediction of college GPA, p = .54.

113
The two items, “attitudes and values” and “would not help,” were used separately
from the peer involvement scale as a whole, and were reserve scored. The original items
read, respectively: “Most students at this institution have values and attitudes different
from me,” and “Few of the students I know would be willing to listen to and help me
with a personal problem.” The original Likert scale had 5 = strongly agree, 4 = agree, 3 =
neutral, 2 = disagree, and 1 = strongly disagree. So that higher numbers for participant’s
responses equaled higher levels of positive peer involvement, the negatively worded
items were reverse scored. This meant that for the items above, 5 = strongly disagree, 4
= disagree, 3 = neutral, 2 = agree, and 1 = strongly agree. Therefore, higher numbers for
these items mean that there is less stereotype threat present. The peer_involvement item
“attitudes and values”, though it did not meet traditional significance levels, at p < .07,
was close to .05. Again, with a small sample size, this is important. Feeling as if one’s
attitudes and values were similar to one’s peers had a positive impact upon college
GPA. In the final model, the odds of a high college GPA increased by forty-two percent
for each one -unit increase in the attitudes and values item.

Table 12. Logistic regression with belonging_updated and peer involvement_updated predicting college GPA (n = 182). ________________________________________________________________________________________________________________________________________
Variables Model 1 Model 2 Model 3 Model 4 Model 5 Model 6
b Exp(b) b Exp(b) b Exp(b) b Exp(b) b Exp(b) b Exp(b)
First-Gen .53 1.69 .27 1.3 .33 1.39 .34 1.4 .27 1.3 -3.28 .04
(reference
group = Cont. Gen)
Students of .55 1.7 .54 1.7 .49 1.64 .57 1.8 .60 1.8
Color (reference
Group=White)
Females -.27 .76 -.41 .66 -.43 .65 -.46 .63 -.50 .60
(reference
group= Males)
Pell grant .43 1.5 .52 1.68 .51 1.67 .50 1.65 .51 1.66
(reference Group=No PG)
HS GPA 2.7 14.8*** 2.74 15.45*** 2.73 15.42*** 2.95 19.09*** 3.07 21.4***
Peer Inv _Updated -.11 .90** -.13 .88* -.14 .87* -.15 .86*
Faculty Inv .08 1.10** .07 1.08** .08 1.09** .08 1.08*
Belonging_Updated .02 1.02 .01 1.01 .03 1.03
Peer Inv_Would not help .04 1.04 .002 1.00
Peer Inv_Attitudes and values .37 1.45 .35 1.42
Belonging_Updated*First-Gen -.08 .92
Nagelkerke R2 .01 .21 .25 .25 .27 .28
Nagelkerke R2 .02 .27*** .34** .34 .36 .38
Change
________________________________________________________________________________________________________________________________________
* p < .05; ** p < .01; *** p < .001
114

115
Research Question 5
To what extent is the relationship between sense of belonging and academic
performance, controlling for peer and faculty interactions, moderated by generational
status?
To investigate if generational status would moderate the relationship between peer
involvement and academic performance (college GPA) while controlling for Pell grant
status, high school GPA, race, gender, and faculty interactions, logistic regression was
computed in SPSS. Sense of belonging, measured by the GBS, was eliminated from this
part of the analysis due to its high correlation with peer involvement. Linear regression
could not be used since college GPA was converted to a categorical variable in order to
address non-normal, negatively skewed data. The final block added was block 4 for the
interaction terms. Block 4 included generational status, all controls, peer involvement,
faculty involvement, and finally, the interaction terms for generational status * peer
involvement. The assumptions for logistic regression of observations being independent
and independent variables being linearly related to the log were checked and met. Table
11 presents the model summaries.
The final block with interaction terms (peer involvement*first-generation), block
4, was significant, X 2 = 4.09, df = 1, n = 182, p <.05. The log likelihood of this model
(199.9) was slightly lower than the model without the interaction terms (204.02),
indicating a better fit of this model to the data. However, the coefficient for the
interaction terms indicated that being a first-generation college student did not have a
statistically significant moderating effect upon peer involvement upon college GPA, p

116
<.056. Though the p value of .056 does not meet traditional standards of statistical
significance, it is extremely close to .05. Along with a relatively small sample size, it
should be noted that this indicates a strong trend towards statistical significance. If a
larger sample was obtained, it might be that it would reach statistical significance,
indicating that first-generation student’s college academic performance, as measured by
GPA, is more strongly related to positive peer interactions than for continuing-generation
students. However, it is impacted negatively, so that the odds of a high GPA are reduced
by sixteen percent for each one unit increase in peer involvement for first-generation
students. Finally, compared to the null model, where college GPA was predicted
correctly fifty percent of the time, model 3 predicted GPA correctly seventy-two percent
of the time. The final model with interaction terms predicted GPA correctly seventy
percent of the time. These results are presented in table 11.
Finally, logistic regression was computed again, using the new scales of
Belonging_Updated and Peer Involvement_Updated, along with the two Peer
Involvement items that did not load highly on any factors: “would not help with
problem” and “attitudes and values”. These scales were created from the factor analysis
conducted in the previous chapter. The final block with interaction terms was block 6.
Block 6 included generational status, all controls, peer involvement_updated, faculty
involvement, belonging_updated, stigma/stereotype threat variables, and the interaction
terms of generational status * belonging_updated.
Table 12 presents the model summaries, which shows that there was no
statistically significant interaction between generational status and belonging_updated
117
(generational status * belonging_updated) in terms of improving the prediction of college
GPA, p <.09. Though the p value of .09 does not meet traditional standards of statistical
significance, it does generally meet the standards for exploratory research. However,
belonging had a negative impact upon college GPA for first-generation students.
In the final model, model 6, high school GPA significantly improved the
probability of predicting high/low college GPA, p < .001, as did peer
involvement_updated, p < .05, and faculty involvement, p < .05. Peer involvement
continued to have a negative impact on college GPA. The odds of a higher college GPA
decreased by fourteen percent for every one unit increase in peer involvement_updated.
Faculty involvement had a positive effect on college GPA, so that the odds of a higher
college GPA increased by eight percent for every one unit increase in faculty
involvement. The single item, “attitudes and values”, though not statistically significant,
was still significant for exploratory research, at p < .09, in the final model with the
interaction terms. Though not significant, “attitudes and values” had a positive impact on
college GPA, similarly to the previous findings using the original scales, presented in
table 11. Since the reverse-scored version of the item was included in the regression, as
described earlier, this meant that agreement that one’s peers had attitudes and values
similar to one’s own was positively related to a higher college GPA. Compared to the
null model, where college GPA was predicted correctly fifty percent of the time, model 5
predicted GPA correctly seventy-seven percent of the time. The final model, model 6
with interaction terms, predicted GPA correctly seventy-six percent of the time.
118
Summary
The purpose of this study was to examine the explanatory relationship between
generational status and belonging, and generational status and college GPA, or academic
performance, while also assessing peer involvement and faculty involvement as
mediators, along with the impact of pre-college variables. Empirical quantitative
research is just beginning to be conducted in this area of stereotype threat and belonging,
and the deleterious effects upon success in college for first-generation students. The
current study explored this area of research, examining the impact of social belonging
upon academic outcomes in college.
In the current study, OLS regression was conducted, along with logistic
regression, to examine these explanatory relationships. Though the General
Belongingness Scale and the Peer Involvement Scale were found to be highly correlated,
it was also found, through conducting factor analysis, that for the most part, each scale
was measuring something distinctly different in the current sample. However, in
restructuring them according to the factor analysis results, the reliability measurements of
both increased, and two items on the peer involvement scale (“attitudes and values” and
would not help”) appear to have been responsible for some of the significant differences
between first- and continuing-generation MSU students. Chapter five will explain and
discuss the results by question, and will connect the current study back to the literature.
Chapter five will also provide recommendations for future research, along with
recommendations for supporting first-generation college students at Montana State
University with the results of the current study in mind.

119
CONCLUSION
Introduction
Extensive previous research indicates that social belonging is a basic human need,
which leads to a wide variety of affect and behaviors designed to satisfy that need (Anant,
1966, 1967, 1969; Baumeister & Leary, 1995; Durkheim, 1951; Maslow, 1954). Not
being able to satisfy the need to belong can lead to anxiety, depression, and even
psychosis. As such, it should not be surprising that belonging plays an essential role in
the transition to college, along with persistence and completion. Stigma and stereotype
threat also appear to affect belonging, so that stigmatized groups are more strongly
affected by identity threat or stereotype threat in college (Hurtado & Carter, 1997;
Johnson, Soldner, Brown Leonard, Alvarez, Kurotsuchi Inkelas, Rowan-Kenyon, &
Longerbeam, 2007; Hausmann, Ye, Ward-Schofield, & Woods, 2009; Wells & Horn,
2015). The experience of feeling as if one does not belong may lead to mental health
issues, academic disidentification, poor grades, and sometimes, leaving college.
As a nation, we must change institutions in order to impact the ability of first-
generation college students to graduate from college. The graduation rates for first-
generation students are far below the average for those students who have a familial
history of involvement in higher education (Cataldi, Bennett, & Chen, 2018; Chen &
Carroll, 2005; DeAngelo & Franke, 2016; Engle & Tinto, 2008; Pascarella, Pierson,
Wolniak, & Terenzini, 2004; Riehl, 1994; Soria, 2015). At MSU, a public land grant
institution, first-generation college students are at least twenty percent, and quite

120
possibly a higher percentage, of the student body. Similarly to the national statistics,
first-generation students at MSU are less likely to persist and graduate than their
continuing-generation peers (Montana State University, 2018c). Thirty-one percent of
first-generation students at MSU graduate within six years, while fifty-two percent of all
entering first-time, full-time students graduate (Montana State University, 2018c). In
chapter two, the process by which it was hypothesized that first-generation students are
affected by stereotype threat, lower belonging, and consequently, lower grades and
decreased persistence was visualized in figure 2. The relationships among these variables
were explored utilizing both OLS regression and logistic regression. In the following
sections, the results presented in chapter four will be discussed by research question, and
recommendations will be made both for future research on the topic, and for addressing
the issue in practice, in the context of MSU.
Findings
In this next section, each research question is presented, along with a discussion
of the results that were presented in chapter four.
Research Question 1
Is there a difference in students’ sense of belonging between first-generation and
continuing generation college students?
The hypothesis that there would be a significant difference between first- and
continuing-generation students on their levels of belonging on the GBS was not
supported. However, when the peer involvement scale was utilized in place of the

121
belonging scale, statistically significant differences were found between the mean scores
for first- and continuing-generation students. First-generation students reported
significantly lower levels of positive influential peer interactions than did continuing-
generation students. In addition, the items that influenced this difference were items that
did not load well or highly on the peer involvement scale in the factor analysis conducted
in the previous chapter. These items were: “It has been difficult to meet and make
friends with other students” (reverse-coded), and “few of the students I know would be
willing to listen to and help me with a personal problem” (reverse-coded). First-
generation students did not differ significantly from continuing-generation students on
the other individual items that made up the peer involvement scale, which focused more
on feeling close with peers, having satisfying friendships, and friendships that had a
positive influence on personal and intellectual development.
The few previous studies that have included a measure of belonging and have
examined generational status have found that first-generation students had lower levels of
belonging (Pittman & Richmond, 2007; Rubin, 2012; Stebleton, Soria, & Huesman,
2014). However, these studies utilized a variety of different measures of belonging. For
example, Rubin (2012) assessed a number of social integration measures, and one single
item asked about belonging. Therefore, these previous findings align with the current
study and findings. It is significant that it was only two items from the peer involvement
measure that showed significant differences based upon generational status, and these
items asked about feelings of support from peers and ease in making friends. This
finding is supported by the literature on social support and its positive relationship with

122
belonging. It may not be the general notion of friendships and closeness with peers in
college that matters as much as the notion of being supported in times of stress and
difficulty.
It is also interesting that the reported number of hours per week of involvement in
co-curricular activities did not differ significantly between first- and continuing-
generation students either, at least at this point in their college experience. This goes
against the literature in this area that first-generation college students tend to be less
involved in co-curricular activities in college. It might be that these things take time to
develop, and since the current study assessed student’s feelings and perceptions after only
two months in college, it was simply too early in the process to see significant differences
in social belonging, along with co-curricular involvement.
Research Question 2
To what extent is any difference in students’ sense of belonging by generational
status mediated by peer and faculty interactions, controlling for pre-college
characteristics?
The hypothesis that peer and faculty interactions would mediate the relationship
between generational status and sense of belonging was not supported. In both versions
of the scales, faculty and peer interactions had a statistically significant effect upon sense
of belonging, accounting for sixty percent of the variance in the sense of belonging
variable. In addition, when the updated version of peer interaction was utilized, and the
two individual items, “attitudes and values” and “would not help” were entered in the
final model, these came close to statistical significance as well, and accounted for two

123
percent of the variance in sense of belonging. This R2 change was statistically
significant. The entire model utilizing the updated scales predicted sixty-two percent of
the variance in sense of belonging. Though the results illustrated the large impact peer
and faculty interactions had upon student’s sense of belonging, they were not technically
mediators between generational status and belonging, since there was not a significant
direct relationship between generational status and belonging.
These results support the literature on involvement, satisfaction, fit, and belonging
in college discussed in chapter two. These constructs are quite intertwined (Wolf-
Wendell, Ward, & Kinzie, 2009), so it makes sense that they are often used as a substitute
for one another in empirical research, whether purposefully or mistakenly. However, the
current study supports the need for clarity when measuring involvement vs. belonging.
The two constructs are highly correlated in the current study (at an alpha of .70), yet the
factor analysis results made it clear that the peer involvement scale and the belonging
scale, for the most part, loaded separately on two different factors. This indicates that
they were measuring different constructs, as some researchers have suggested (Strayhorn,
2012).
In addition, faculty involvement, or the high- quality interactions with faculty
scale, significantly predicted belonging. These results support the importance of good
teaching and positive relationships with faculty in helping new students feel as if they fit
and belong in college. These items from the Wabash study were created to operationalize
Chickering and Gamson’s principles of good practice in undergraduate education (Kuh,
2001). Chickering and Gamson (1987, 1991) created this list of principles, which include
124
student-faculty contact, cooperation among students, active learning, prompt feedback to
students, time on task, high expectations, and finally, respect for diverse students and
diverse ways of knowing. The current results support the contention that experiencing
these good practices- through high quality interactions with peers and with faculty- have
significant effects upon sense of belonging in college for all students. Since
belongingness has an impact upon healthy transitions to college, along with persistence
and completion, this is an important finding.
Research Question 3
Is there a relationship between generational status and academic performance as
measured by GPA?
The hypothesis that there would be a direct effect of generational status upon
academic performance, operationalized as college GPA, was not supported. There was
no statistically significant difference between first-generation and continuing-generation
student’s GPA their first term at MSU. Overall, the literature states that on average, first-
generation college students tend to have lower college GPA’s than continuing-generation
students (Chen, 2005; Ramos-Sanchez & Nichols, 2007; Riehl, 1994). However, this is
not always a consistent finding. Zalaquett (1999), for example, did not find a significant
difference between first-generation and continuing-generation college student’s
cumulative GPAs over a period of three years in college. The author theorized that it
might be that first-generation students, many from rural areas, felt a level of comfort at
the university (a public university in a rural area/small town in Texas), which might have
mediated the results. However, the author did not examine this possibility empirically.

125
The current study used a small sample of 184 participants, which may have
impacted the results. The sample was just over the minimum required to be able to
conduct regression with multiple independent variables. The current study also measured
GPA the first semester in college. It might be that this outcome takes time to develop.
For example, Murphy & Zirkel (2015) found that feelings of belonging in the first weeks
of college impacted the second term GPA of students of color (and not white students),
but not the first term GPA. This indicates a process that occurs over time. Additionally,
some of the research on GPA as an outcome seems to lean in the direction of mediation
or of conditional effects: mediating variables are influencing GPA, or, there are
interaction effects upon GPA (hypothesized in the current study). The current sample
also leaned in the direction of rather high first term GPAs on average, since the mean
GPA for the sample was 3.32. Therefore, it might be that with more variability in the
dependent variable, there would have been an effect.
Research Question 4
To what extent is the relationship between generational status and GPA mediated
by sense of belonging and peer and faculty interactions?
The hypothesis that sense of belonging, peer interactions, and faculty interactions
would mediate the relationship between generational status and college GPA was
partially supported. The results differed in a significant manner when the new updated
belonging and peer interaction scales, created through the factor analysis, were utilized in
the analysis. Utilizing the original scales, high school GPA had a consistently positive
relationship with college GPA, even when all other variables were entered into each

126
block. This finding is consistent with the literature examining the impact of high school
GPA and test scores upon academic success in college (Mayhew et al., 2016). In
addition, faculty interactions had a positive relationship with college GPA. Higher levels
of agreement with the items measuring high quality interactions with faculty increased
the odds by six percent that participants would have high college GPAs. This finding is
supported by the literature examining the impact of positive faculty interactions in
college. Positive interactions with faculty during in college is fairly consistently
associated with increased retention and persistence (Mayhew et al., 2016). In addition,
some studies have found that positive faculty interactions have a positive effect upon
course completion and course grades. Two studies found that perceived teaching clarity
and organization predicted better retention, as explained by the moderating influences of
increased grades, and satisfaction with college (Pascarella, Salisbury, & Blaich, 2011;
Wolniak et al., 2012). When students feel as if faculty care about their intellectual and
personal growth and development, have positive interactions with them outside of the
classroom, and perceive them as excellent teachers, it has a large impact upon academic
performance, and therefore, upon persistence.
When the new updated peer and faculty interaction scales were utilized, results
were significantly different, in several important ways. First, the hypothesis was
supported for peer interactions. In this model, peer interactions_updated had a slight
negative relationship to college GPA. Higher levels of positive peer interactions reduced
the odds by fourteen percent that students would have a high first-term college GPA at
MSU. Belonging_updated was not significantly related to college GPA. The impact of

127
positive peer interactions upon grades and persistence is supported in the literature on
college outcomes (Fischer, 2007; Mayhew et al., 2016; Wolniak et al., 2012).
Friendships with peers on campus tend to have a positive impact upon persistence, while
more ties with friends off-campus predicts drop-out (Fischer, 2007). In addition, a
number of studies have found that it is not the number of friendships, but quality that
matters in terms of persistence (Crissman, 2002; Wolniak et al., 2012). It is interesting
that in the current study, peer involvement had a negative relationship with college GPA.
This may indicate a developmental transition process quite common to new students:
struggling to figure out how to balance time with friends and social interactions vs. doing
what is needed to study and complete homework in order to succeed academically.
Managing time is a fairly common challenge for students new to college, where there is
much less structured time than in high school, and students must decide how much time
to spend on studying rather than socializing. This may be what is occurring in the current
study.
The two single items “attitudes and values” and “would not help” were entered
into the final model as predictor variables. “Attitudes and values” was very close to
traditional levels of significance, and in a small sample size, this is important. Though
not statistically significant (p < .07), reported agreement that other student’s values and
attitudes were similar to their own was associated with a positive increase (forty-two
percent) in the odds of having a high college GPA. This is interesting, particularly
because this item can be assumed, on the surface, to be clearly related to belonging.
When a person feels as if they have similar values and attitudes as others in their

128
community, they are more likely to feel a sense of belonging and affiliation, as part of
that community. However, the results indicated these are two different constructs, as one
(attitudes and values/peer interactions) appears to be predicting the other (belonging) (see
research question two). Current research studying first-generation students and students
of color in college examines values alignment and the impact of values upon belonging,
grades, and persistence. As discussed in the literature review, a number of researchers
have found that first-generation students tend to endorse more interdependent values than
continuing-generation students, which then impacts feelings of belonging and fit in
college (Phillips et al., 2016; Stephens et al., 2012; Stephens, Markus, Fryberg, Johnson
& Covarrubias; 2012a). Some of these studies have conducted behavioral interventions
which involve validating student’s personal values, or encouraging students, through a
variety of methods, to think about more independent values. They all resulted in positive
impacts upon academic performance. These results appear to be in alignment with
Rendon’s (1994) studies on validation and Bourdieu’s (1986) theory of cultural capital,
particularly embodied capital. The college culture embodies values- independence,
competition, intellectualism- that do not necessarily align with the embodied values and
ways of being of students without a familial link to higher education. If students do not
see themselves reflected in those around them in college- validating their experiences,
values, and ways of being- they may feel as if they do not belong, and may leave.
Though it is obvious that positive peer interactions overall matter in the current study,
attitudes and values alignment with peers is an interesting result and deserves further
study.

129
Research Question 5
To what extent is the relationship between sense of belonging and academic
performance, controlling for peer and faculty interactions, moderated by generational
status?
Since belonging was eliminated from the first part of the analysis due to high
correlations with peer interactions, that part of the question was not assessed. Instead, the
interaction between peer interactions and generational status was examined. The
hypothesis that generational status would moderate the relationship between peer
interactions and college GPA was partially supported. The model itself, model 5, was
statistically significant, indicating that adding the interaction terms for first-generation
and peer interactions improved the predictive power of the model. However, the
coefficient for the interaction terms was not significant, though it came very close to
statistical significance (p < .06). The negative beta value for the interaction terms
indicated a conditional effect; dependent upon whether or not a student is first-generation
or not, peer interactions had a differing impact upon college GPA . Peer interactions had
a larger negative impact upon GPA for first-generation students, vs. continuing-
generation students. Though not measured directly, this may support the contention that
stigma and stereotype threat are impacting the interactions first-generation students have
with peers on campus. These interactions may confirm the fear that they do not belong or
fit in, triggering stereotype threat, and leading to worsening academic performance. It
may also indicate that first-generation students, who often receive less guidance and
knowledge on how to navigate college, struggle more with the transition to college than
do continuing-generation students. First-generation students tend to struggle more in

130
terms of managing and balancing time with friends and other commitments that
continuing-generation students do not have, vs. time spent on studying/academic work
(Collier & Morgan, 2008). This may negatively impact their grades, since good time
management practices are associated with higher GPAs in college (Britton & Tesser,
1992).
The logistic regression was then performed again, with the new updated scales for
belonging and peer interactions. This time, the hypothesis was partially supported as
well. Both peer interactions_updated and faculty interactions significantly influenced the
odds of a high college GPA in the final model. Peer interactions had a small negative
impact on the odds of a high GPA, while faculty interactions has a small positive impact
on the odds of a high GPA. Belonging_updated did not significantly impact college
GPA. The single item “attitudes and values” was significant for exploratory research
standards at p < .09, positively impacting the odds of getting a high college GPA. The
interaction between belonging and generational status also was significant in terms of
exploratory research, at p < .09. First-generation college student’s higher sense of
belonging increased the odds by eight percent that they would have a low college GPA.
This may align with the findings of the negative effect of peer involvement on college
GPA, and could be due to new student’s attempting to balance study time vs. social time.
However, that could not be determined in the current study.
Overall, the results of the current study support the literature on the impact of
positive interactions with faculty in college upon academic performance. The results also
support the importance and positive impact of peer interactions and involvement upon

131
feelings of belonging on campus. Though belonging and peer involvement actually had a
slightly negative impact upon grades in the current study, that may be due to the period of
transition new students experience in college. It takes time to develop the ability to
balance social interactions and relationships with academic work and studying
(Greenfield, Keup, & Gardner, 2013). First-year experience programs help guide
students through the process of figuring out how to best manage and balance their time
between studying and socializing. Both Astin’s involvement theory (1984) and Tinto’s
interactionalist theory (1993) support the positive impact of peer interactions and college
integration upon persistence and retention. According to Astin, peers are the most
important source of influence in college (1993). However, the current research goes
deeper, since peer and faculty interactions measured feelings of support in times of
difficulty, along with prompt feedback from faculty, good teaching, and positive
relationships with faculty outside the classroom. “Attitudes and values” and “would not
help”, the two single items from the peer interactions scale, also appeared to be
measuring something distinct from generalized peer interactions in the current study.
First-generation college students were more likely to state that their peers would not help
or listen to them if they had a problem. Feeling as if one’s attitudes and values were
different from one’s peers in college had a negative impact upon all participant’s first-
term GPAs. In addition, both sense of belonging and peer interactions were significant
for exploratory research in terms of a conditional effect (or moderating) on college GPA.
In other words, sense of belonging and peer interactions had a larger negative impact
upon college GPA for first-generation students at MSU. The results indicate a need to go

132
beyond traditional student development theories of involvement and integration, towards
the validation and affirmation of intersectional identities of students, which aligns with
Rendon’s (1992; 1994) theory of cultural validation.
Limitations
There were a few limitations with the current study. First, the sample size was
small, at 184 participants. With eight predictor variables, the minimum sample size, at
twenty observations per variable, is 160 (Field, 2009). The current study meets those
requirements, but is just over 160. Many studies utilizing similar design and variables
have sample sizes of hundreds or thousands of participants. In addition, the study was
conducted at a single institution, making it difficult to generalize outside of MSU.
However, as a problem of practice, the intent of the current study is to analyze first-
generation student’s experience at MSU specifically. Another limitation involved the
small sample size and the nature of the college GPA data. The mean GPA for the sample
was quite high, which is why the variable was negatively skewed. Since it was skewed
and violated assumptions for linear regression, a median split had to be conducted so that
a categorical variable could be created: high vs. low GPA. Forcing the variable into two
categories can hide the effects of variance in a sample, since a GPA of 1.5 and a GPA of
3.0 were all defined as “low GPA.”
Examining additional variables, such as amount of time spent working and time
spent studying vs. socializing, along with living on- vs. off- campus, would have allowed
the researcher to further assess why first-year, first-time, first-generation students self-

133
reported lower levels of positive peer interactions than continuing- generation students at
MSU. In addition, it could have assisted in the interpretation of why peer involvement
had a larger negative impact upon college grades, especially for first-generation students.
Some research indicates that the process through which stigma and stereotype
threat impact belonging and then academic performance takes time to develop (Murphy
& Zirkel, 2015). The current study only examined student’s academic performance their
first term at MSU. Finally, the current research and data is self-report, which tends to be
less reliable than data coming from direct observations (Mayhew et al., 2016). It is
important to remember that the current results are based upon participant’s perceptions
about their own feelings and behavior.
Future research should attempt to replicate the results of the current study with
more participants from a variety of different institutional types, in order to see if the
results hold with a higher sample size, along with across different institutional types. It
might be that, in alignment with the literature, first-generation students experience stigma
and threat more strongly at private, wealthier institutions. In addition, further exploration
of the peer involvement items asking about help and support from peers and attitudes and
values alignment would be helpful. This would help delineate why attitudes and values
alignment was related to student’s grades, and whether they might have more of an
influence on first-generation student’s grades. A mixed methods study could add a
qualitative component, asking follow-up questions of students around values alignment
with peers, and feelings of support in times of difficulty.
134
Recommendations for Practice
A variety of programs, services, and interventions have been proposed and put
into practice which hold promise for encouraging and supporting first-generation
student’s feelings of belonging and fit in college. As research has illustrated, there are
significant connections between belonging, persistence, and college completion. A few
examples of these programs include TRiO, which has been in existence since the 1960’s;
bridge programs for underrepresented students, and psychological interventions.
Behavioral/psychological interventions appear to hold much promise, particularly for
supplementing intensive programs such as TRiO, and for scaling up practices so that they
may impact large numbers of students. These interventions specifically target the
psychology of first-generation and working-class students, initiating recursive processes
already likely to occur in educational settings (Yeager & Walton, 2011). In addition,
changes to policies and practices also may support the success and persistence of first-
generation students in college.
Gathering Accurate Data on First-Generation Students
At the most basic level, institutions need an accurate assessment of the number of
first-generation students on campus. As discussed in the literature review, data on first-
generation students ranges widely across institutions. In order to serve any student
population, an accurate count and identification of them must exist. At MSU, the BCSSE
is the instrument utilized to assess generational status on campus. However, it is
distributed during orientations over the summer. Orientations are not required, and

135
overall, students who are better prepared and come from families with money and with
historical experience with higher education are more likely to attend, since it requires
travel and overnight stays. In addition, asking questions that might induce feelings of
identity or stereotype threat are not necessarily best to ask at the times when students are
feeling most vulnerable; at the beginning of the transition process. This might be why
thirty percent of the students taking the BCSSE at MSU did not answer the parental
education question. It could also be because students often are not able to accurately
identify what level of education their parent/s complete. For these reasons, it would be
best to gather this data on the admissions application, through the Office of Admissions.
In addition, if the only measure of income and class is through Pell grant status, it
is almost a guarantee it will be inaccurate. Many low-income and working-class students
do not take out Pell grants, and depending upon a number of factors, sometimes middle-
income students qualify for Pell grants. The creation of an index or measure of class in
the United States would allow institutions to track class, along with making it more
visible (Jonas, 1999; Soria, 2015). However, the culture of the United States, based in
the same values as the traditional university- the myth of meritocracy, and the values of
independence and hard work- makes it unlikely we will acknowledge that class both
exists and matters (Jonas, 1999). But this does not keep an individual college or
university from asking about and tracking this data, along with making it public and
visible. The question/s could be assessed through self-report on the admissions
application, or, could be a composite of several data points: parental education, income,

136
Pell grant status, and possibly others (Rubin, Denson, Kilpatrick, Matthews, Stehlik, &
Zyngier, 2014; Soria, 2015).
Programs/Interventions that Build
Social and Cultural Capital
Programs that help first-generation students build social networks and capital
prior to attending college and during college appear to work well. These include bridge
programs, along with TRiO programs that occur prior to college, such as Educational
Talent Search and Upward Bound, and the Student Success Services (SSS) programs
during college, such as MSU’s SSS program. These programs provide tutoring, social
support and a cohort of similar students, financial aid information and assistance, and
peer mentoring (Soria, 2015). TRiO programs have documented success with working-
class, low-income, and first-generation college students (Graham, 2011; The Pell
Institute, 2009; Soria, 2015). TRiO participants are more likely to graduate with a four-
year degree than their peers who are not in TRiO (Balz & Esten, 1998; The Pell Institute,
2009). TRiO program participants also tend to consistently report high levels of
satisfaction with the program around job counseling and placement, intellectual growth in
college, and course curricula (Balz & Esten, 1998). Upward Bound, a TRiO program for
students in high school, resulted in participants being fifty percent more likely to attain a
bachelor’ degree, and twenty-two percent more likely to apply for financial aid than a
control group (The Pell Institute, 2009). TRiO Upward Bound programs bring high
school students to colleges over the summer, on weekends, and after school to take a
college courses, and include enrichment components such as community service

137
activities, along with tutoring and mentoring. This early exposure to college in a
relatively safe and supportive environment assists with building social and cultural
capital, while remediating academic under-preparedness and possibly alleviating feelings
of stigma as well. Graham (2011) writes about her personal experience as a female, first-
generation, low-income African-American student with Upward Bound, and later on, the
McNair Scholars program. She states that these programs were essential to her college
attendance and success, for a variety of reasons. She was assisted with college navigation
processes that are unfamiliar to those without familial experience with college, such as
financial aid and FAFSA applications. But Upward Bound also placed her directly into
the college environment over the summer, so she understood what it was like to live away
from home, get along with roommates, and go to resident assistants for help. She also
received free assistance and instruction in test-taking (the ACT/SAT), and took math and
science to prepare her for college courses. Finally, Graham had a cohort of students
similar to her in many ways whom she felt comfortable with and could go to for advice.
Even with the consistent success of TRiO programs, success is by definition
limited since such a small population is served and funding is limited. TRiO programs
are estimated to serve only five percent of the population of eligible students (Balz &
Esten, 1998). At Montana State University, the TRiO program has the capacity to serve
approximately 150 students (J. Collins, personal communication, August 2018). With
close to 17,000 students, at least twenty percent of whom identify as first-generation, that
is 3,400 first-generation college students; which means MSU is not even serving five
percent of the population of first-generation college students. Another option is that

138
institutions can scale up and implement TRiO-type programs on their own with state,
federal, or institutional funds.
Bridge programs are one example of a program similar to or modeled on TRiO,
serving first-generation, working-class, and low-income students, yet funded in a
multitude of ways. Bridge programs usually occur the summer prior to the first year in
college, and can help students get a head start on building peer relationships and social
networks, along with the cultural capital necessary to navigate college (Soria, 2015).
Strayhorn (2012) implemented a bridge program for students of color and assessed sense
of belonging pre and post- program. Students took an introductory English course,
received assistance in math, and did a variety of educational and co-curricular activities
together, along with living in the residence halls. Many of the students involved in the
bridge program spoke about this intense experience with a cohort of similar students over
the summer helping the university feel smaller and more manageable. Sense of
belonging scores rose slightly at the end of the program, though they dipped again at the
end of the first term (Strayhorn, 2012). One aspect that appeared to be missing from the
program was guided assistance in figuring out how to negotiate or re-negotiate ties back
home (rather than sever them completely, or leave college) (Strayhorn, 2012). One
Latina student left after the first term because her parents called her every day and told
her they could not function without her; they did not speak English, and stopped
answering the door or the phone because she was not there to translate.
Bridge programs do not necessarily have to be summer-long programs; first-
generation students in one study reported they benefitted from making several short

139
campus visits prior to the fall term (Bryan & Simmons, 2009). These programs appear to
work well because they offer intense, intentional experiences with small groups of
students. They offer a chance to acclimate to college prior to the rush and craziness of a
new year with (often) thousands of students on campus. These experiences usually
include intentional meetings with academic advisors, connections with supportive faculty
and peer mentors, club/organization/leadership involvement, academic preparation, and
instruction in college navigation skills (Greenfield et al., 2013; Kezar, 2000; Soria, 2015).
Montana State University’s Hilleman Scholars Program could be identified as a “bridge”
type program, and begins with a “summer success academy” for a month and a half over
the summer, prior to the start of fall semester (Hilleman Scholars Program, 2019).
However, it serves a small number of students; approximately fifty each year; and is not
limited to first-generation students (J. Collins, personal communication, August, 2018).
However, since they do target low-income students, they most likely capture a number of
first-generation students as well, due to the overlap between low-income and first-
generation status.
Another practice or program that appears to hold promise are spaces or centers on
college campuses devoted specifically to first-generation and/or working-class/low-
income students. For example, Brown University has an Undocumented, First-
Generation and Low-Income Student Center (U-FLi) (Brown University, 2019). They
offer a wide variety of supportive services and spaces, such as a “Class Dissonance”
series, scholars program, and an “Undoc-U Series.” They state on their webpage that
they purposefully use an equity and strengths/asset-based approach to their programs

140
(Brown University, 2019). Dartmouth University (2013) created an arts-based
educational series on their campus called “Class Divide.” It was a three-year initiative
involving talks, workshops, and programming around class. As one of the creators states
in their video, people at Dartmouth like to talk about every kind of diversity and
difference there is, except for class (Dartmouth University, 2013). The initiative was a
way to dissect class and make it more visible.
These types of programs and initiatives create supportive programming for
identified students, and can also change and influence the broader campus climate in a
positive direction. Especially as MSU grows in enrollment and attracts more out-of-state
students who might be less likely to be first-generation, a dedicated center for first-
generation and working-class students could be beneficial. These kinds of spaces can
also send a symbolic message to the college community and potential students of all
kinds that MSU honors its land grant, agricultural, inclusive roots.
Psychological Interventions to Increase Belonging
Over the past decade or so, a group of studies have been published based on
behavioral interventions designed to address and alleviate stereotype or identity threat.
Called everything from mindsets (Yeager, Paunesku, Walton, & Dweck, 2013) to
psychological lay theories, to social-psychological interventions (Walton & Cohen, 2007;
Yeager & Walton, 2011), they share commonalities. These interventions use what we
know about social psychology to address student’s perceptions about themselves and how
they learn, who they are and how they fit into their environments, and their attributions
for other’s behavior. In addition, they depend upon the educational environment to
141
initiate recursive processes that magnify the positive results over time (Yeager & Walton,
2011). For these reasons, they are very promising in terms of use in a variety of settings
in higher education, such as orientation, welcome week, and within college classrooms.
They also do not cost a lot of money, though they do require understanding, careful
implementation, and intentionality in use (Yeager & Walton, 2011). For these reasons,
these practices can be scaled up and used to affect large numbers of students in higher
education.
One strand of this research focuses on cultural mismatch theory and is significant
in light of the results of the current study. First-generation college students have been
found to endorse more interdependent values than continuing-generation students
(Fryberg & Markus, 2007; Stephens et al., 2012a; Stephens et al., 2012b; Stephens et al.,
2014). Yet American education tends to endorse and enact more independent values:
those of individual hard work, individual accomplishment, and competition (Fryberg &
Markus, 2007). Both of these premises have actually been empirically tested in a series
of recent studies (Stephens et al., 2012a). Stephens and her co-authors surveyed
administrators from the top fifty national universities and top twenty-five liberal arts
institutions, along with fifty second-tier institutions (half national and half liberal arts).
The majority of administrators agreed overall that American universities tend to promote
and value independent norms more than interdependent norms (Stephens et al., 2012a).
The author also conducted three more empirical studies following students through the
first three years of college to examine how social class, along with values and motives for
attending college, impacted academic performance. They found that interdependent

142
motives negatively impacted grades at the end of the first year. Examples of these
motives included “help my family out after I’m done with college,” “be a role model for
people in my community,” “bring honor to my family,” “show that people with my
background can do well,” give back to my community,” and “provide a better life for my
own children.” (Stephens et al., 2012a). In a subsequent study, the authors also
experimentally manipulated cultural match/mismatch, and then assessed student’s
performance on an anagram test. When the university culture was presented as focusing
on norms of independence, first-generation students solved fewer anagrams than
continuing-generation students (Stephens et al., 2012a). When culture was presented an
interdependent, there was no different in performance between the two groups (Stephens
et a., 2012a). The authors also discovered that cultural mismatch influenced student’s
perceptions of academic tasks: it made students perceive the task as more difficult,
leading to worsening academic performance. This would appear to be a test of stereotype
threat, and builds upon other studies in this area (Walton & Cohen, 2007; 2011) which
found similar results with white students and students of color. These studies confirm
that stereotype threat or identity threat is occurring in the typical college or university.
Further, the middle-class values of independence endorsed by American universities
seem to influence stereotype threat.
There are a number of solutions that would address the issue of cultural mismatch.
One is utilizing university communications- admissions materials, university mission
and values, and websites- to emphasize interdependence over independence (Stephens et
al., 2012a). These materials could emphasize giving back to one’s community and

143
maintaining ties to family, rather than values such as improving oneself, figuring out
interests and goals, and exploring what one should do for a career. Though important,
these emphasize the individual over community. Another change to university culture
involves traditional transition and welcome programs for new students. Many first-year
experience and orientation programs focus on the expectations of university and
academic life. Universities could begin acculturating students to the norms of working in
small groups with peers, relying on others, asking for help, and connecting one’s own
interests (the traditional major and career exploration) to the needs of one’s home,
community, and family; i.e., impacting the lives of others. These expectations and values
relate back to Chickering and Gamson’s principles of good practice in undergraduate
education (Chickering & Gamson, 1987), particularly cooperation among students and
respect for diverse students and diverse ways of knowing. These principles might be
better utilized to illustrate how they can be leveraged to alleviate cultural mismatch and
better welcome our first-generation students, along with other diverse groups, to college.
In addition, these principles are a good reminder that most students need guidance,
instruction and support around how to balance peer interactions and studying/academic
work. Helping students get used to working cooperatively in small groups in and outside
of classes can assist their feelings of fit and belonging, in addition to relying on and
utilizing peers as mentors and co-learners.
Other related studies have devised behavioral interventions that were
hypothesized to lessen the effects of cultural mismatch, along with other transition issues
that appear to affect first-generation students more strongly than continuing-generation

144
students. For example, Stephens et al. (2014) devised a program put on during
orientation, where a panel of diverse college seniors answered pre-planned questions
from a moderator. These questions focused on how the students adjusted to college,
along with their transition experiences. They linked their transition experiences to their
social-class backgrounds explicitly; i.e.; “because my parents didn’t go to college, they
weren’t always able to provide me with the advice I needed… but there are other people
who can provide that advice, and I learned that I needed to rely on my adviser more than
other students” (Stephens et al., 2014). The other experimental condition provided
general transition advice, minus the focus on social-class background. The participants in
these interventions completed a survey afterwards, and a video testimonial. They were
told that the video would be shared with participant’s/new students the following year to
help them adjust to college. This intervention did a few things: they normalized the
difficulty in transitioning to college, emphasizing that these difficulties are temporary,
but might be more difficult due to social-class differences. This might help students
locate difficulty outside of themselves and their intellectual abilities. The intervention
also utilized repetition to help students take on the viewpoints as their own, since they
had to take what they learned and convey it to future students. This also involved
repetition in a new context, which is essential for learning. The results of the study
indicated that the intervention or experimental condition reduced the social-class
achievement gap between first-generation and continuing-generation students by sixty-
three percent (Stephens et al., 2014). The intervention also resulted in improvements in
first-generation student’s psycho-social outcomes, including psychological adjustment,

145
and social and academic engagement (Stephens et al., 2014). The Stephens et al., (2014)
study disputes the notion that one must be “difference-blind” in order to alleviate the
impact of stereotype threat upon performance in college. Supporting students in learning
about how their background and identity impacts their experiences in college can be
empowering, and might be one of the keys that will address stereotype and identity threat.
In combination with the results of Walton and Cohen’s studies (2007; 2011), this
grouping of studies utilizing behavioral interventions indicate that learning about how
social class impacts transitions, normalizing transition difficulties/belonging uncertainty
and indicating their temporary nature, along with emphasizing cultural norms of
interdependence, can all have a large impact upon the performance of first-generation
students in college.
Similarly to the behavioral interventions utilized in the studies described above,
college transition programs could be changed and improved to include these practices.
Orientation, welcome week, and first-year experience programs should include
intentional and diverse peer interactions that involve sharing stories of the challenging yet
temporary nature of the transition to college. This should include how social identities
impact the transition. This includes not only social class- first-generation and working-
class or low-income status- but also sexual orientation, gender, and race/ethnicity. Many
orientations include short programs or breakout sessions for students with these identities
(Council for the Advancement of Standards in Higher Education, 2019; Perigo &
Upcraft, 1989; Ward-Roof, 2010). However, they tend to focus on the campus resources
and services for these students, rather than the more specific challenges based in the

146
identity itself within the context of American higher education. In addition, many
programs also locate these issues in a deficiency model, focusing on changing the
behavior of students. This is not always necessarily wrong- many students do need to
learn how to study in college, how to balance and manage their time differently; i.e., how
to alter the behaviors they learned in high school (Ward-Roof, 2010). But we also need
to change the very culture of the American college itself and the focus on independence
and competitiveness. Institutions need to examine their own programs, practices, and the
values on which they operate in order to truly welcome first-generation students to
college. Finally, this research indicates how beneficial peer mentoring and leadership can
be, and that institutions could scale up these practices to truly impact persistence and
graduation outcomes. The students going through transition programs their first year
should be recruited to support these programs, and the next incoming class, the following
year. These practices impact both the new students along with the continuing students
who serve as mentors and leaders (Jacobi, 1991).
Montana State University would benefit from examining how their policies,
practices, and programs across the university welcome (or do not welcome) first-
generation students to campus. This includes continuing to assist them throughout their
time at MSU in connecting with peers and feeling a sense of belonging on campus, along
with learning skills of self-efficacy; how to plan their time, say no, and balance academic
work and socializing. Utilizing some of the psychological interventions described in this
section might assist MSU in scaling up its retention and completion practices, which

147
would positively impact the population of low-income, working-class, and first-
generation college students.
Summary
The current study concluded that first-generation college students self-reported
lower levels of positive peer interactions during their first semester at MSU. More
specifically, first-generation students were more likely to think that it was difficult to make
friends and that their peers would not listen or help them if they had a problem. Though
results did not reach traditional levels of significance, belonging and peer interactions had
a larger negative impact on academic performance for first-generation vs. continuing-
generation students. Faculty interactions had a significant positive impact upon academic
performance for all students. Finally, a factor analysis supported the contention that peer
involvement/interaction is a construct separate and distinct, though highly related, to sense
of belonging.
There are a number of strategies and programs that we know work in increasing the
success and persistence of first-generation students in college. These include TRiO
programs, along with other bridge programs, and transition programs such as orientation
and first-year experience. However, these programs in and of themselves have not
consistently moved the needle on completion for large numbers of students. New research
that addresses the mismatch between the values of first-generation college students and
American higher education holds much promise. The results indicate that relatively small
short-term interventions can have a large impact upon how students perceive difficulty and

148
struggle- both academic and psychosocial- and thus upon academic performance in
college. It is the manner in which transition programs are created and implemented- the
quality and content- and not so much that “welcome week” or a “first-year experience
seminar” exists, that really matters. If we as a nation truly want to level the playing field
and make higher education a more equitable and inclusive place, we need to make
institutional changes that will help students without a historical connection to higher
education feel welcome and validated, and able to succeed in and navigate the college
experience.

149
REFERENCES CITED

150
Astin, A. W. (1977). What matters most in college: Four critical years. San Francisco,
CA: Jossey- Bass.
Astin, A. W. (1984). Student involvement: A developmental theory for higher education.
Journal of College Student Personnel, 25(4), 297-308.
Astin, A. W., & Oseguera, L. (2004). The declining “equity” of American higher
education. The Review of Higher Education, 27(3) 321-341.
Anant, S. S. (1966). The need to belong. Canada’s Mental Health, 14, 21-27.
Anant, S.S. (1967). Belongingness and mental health: Some research finds. Acta
Psychologia, 26, 391-396.
Anant, S. S. (1969). A cross-cultural study of belongingness, anxiety, and self-
sufficiency. Acta Psychologia, 31, 385-393.
Aries, E. & Seider, M. (2005). The interactive relationship between class identity and
the college experience: The case of lower income students. Qualitative
Sociology, 28(4), 419- 443.
Balz, F. J., & Esten, M. R. (1998). Fulfilling private dreams, serving public priorities: An
analysis of TRiO students’ success at independent colleges and universities.
Journal of Negro Education, 67(4), 333-345.
Baumeister, R. F., DeWall, C. N., Ciarocco, N. J., & Twenge, J. M. (2005). Social
exclusion impairs self-regulation. Journal of Personality and Social Psychology,
88(4), 589-604.
Baumeister, R. F., & Leary, M. R. (1995). The need to belong: Desire for interpersonal
attachments as a fundamental human motivation. Psychological Bulletin, 117(3),
497-529.
Baumeister, R. F., Twenge, J. M., & Nuss, C. K. (2002). Effects of social exclusion on
cognitive processes: Anticipated aloneness reduces intelligent thought. Journal of
Personality and Social Psychology, 83(4), 817-827.
Binet, A. (1911). Nouvelles recherches sur la mesure du niveau intellectual chez les
enfants d’ecole. (New studies on the measurement of the intellectual level among
pupils). L’Annee Psychologique, 19, 145-201.
Boston, C. & Warren, S. R. (2017). The effects of belonging and racial identity on urban
African-American high school student’s achievement. JULTR, 26,
Bourdieu, P. (1977). Outline of a theory of practice (R. Nice, Trans.). Cambridge:
Cambridge University Press.
Bourdieu, P. (1986). The forms of capital. In J. G. Richardson (Ed.), Handbook of theory
and research for the sociology of education (pp. 241-258). New York: Greenwood
Press.
Bowen, W. G., Kurzweil, M. A., & Tobin, E. M. (2005). Equity and excellence in
American higher education. Charlottesville, VA: University of Virginia Press.
Boyer, E. (1990). Scholarship Reconsidered. Priorities of the Professoriate. Princeton,
NJ: The Carnegie Foundation for the Advancement of Teaching.
Boyer, E. (1994). Creating the new American college. Chronicle of Higher Education,
40(27), A48.
Braxton, J. M., & Mundy, M. E. (2001). Powerful institutional levers to reduce college
student departure. The Journal of College Student Retention, 3(1), 91-118.

151
Britton, B. K., & Tesser, A. (1991). Effects of time-management practices on college
grades. Journal of Educational Psychology, 83, 405-410.
Browman, A. S. & Destin, M. (2016). The effects of a warm or chilly climate toward
socioeconomic diversity on academic motivation and self-concept. Personality
and Social Psychology Bulletin, 42(2), 172-187.
Brown University. (2019). First-generation college and low-income student center.
https://www.brown.edu/campus-life/support/first-generation-students/
Bryan, E. & Simmons, L. A. (2009). Family involvement: Impacts on postsecondary
educational success for first-generation, Appalachian college students. Journal of
College Student Development, 50(4), 391-406.
Bui, K. T. (2002). First-generation college students at a four-year university:
Background characteristics, reasons for pursuing higher education, and first-year
experiences. College Student Journal, 36(1) 3–11.
Cataldi, E. F., Bennett, C. T., & Chen, X. (2018). Stats in brief: First-generation college
students: College access, persistence, and post-bachelor’s outcomes. U.S.
Department of Education: NCES 2018-421.
https://nces.ed.gov/pubs2018/2018421.pdf
Chen, X. & Carroll, C.D. (2005). First-generation students in postsecondary education:
A look at their college transcripts. National Center for Education Statistics,
Statistical Analysis Report, U.S. Department of Education, NCES 2005-171.
Chickering, A. W., & Gamson, A. F. (1987). Seven principles for good practices in
undergraduate education. AAHE Bulletin, 39(7), 3-7.
Chickering, A. W. & Gamson, A. F. (1991). Applying the seven principles of good
practice in undergraduate education. San Francisco: Jossey-Bass.
Choy, S. (2001). Students whose parents did not go to college: Postsecondary access,
persistence, and attainment. Findings from the condition of education, 2001. U.S.
Department of Education.
Cohen, J., Cohen, P., West, S. G., & Aiken, L. S. (2003). Applied multiple
regression/correlation analysis for the behavioral sciences, 3rd edition. Mahwah,
NJ: Lawrence Erlbaum Associates, Inc.
Cohen, G.L., Garcia, J., Apfel, N., & Master, A. (2006). Reducing the racial
achievement gap: A social-psychological intervention. Science, 313(5791), 1307-
1310.
Cohen, G. L., Garcia, J., Purdie-Vaughns, V., Apfel, N., & Brzustoski, P. (2009).
Recursive processes in self-affirmation: Intervening to close a minority
achievement gap. Science, 324(5925), 400-403.
College Board ACT, Inc. (2018). Guide to the 2018 ACT/SAT Concordance.
College Entrance Examination Board (December 10, 2017). College-board seniors
national report: A profile of SAT program test-takers.
http://media.collegeboard.com/digitalServices/pdf/research/cbs-2009-national-
TOTAL-GROUP.pdf
Collier, P. J. & Morgan, D. L. (2008). ‘Is that paper really due today’? Differences in
first-generation and traditional college students’ understandings of faculty
expectations. Higher Education, 55, 425-426.

152
Collins, J. (August 9, 2018). Personal communication.
Conley, D. T. (2010). College and career ready: Helping all students succeed beyond
high school. San Francisco, CA: Jossey-Bass.
Council for the Advancement of Standards in Higher Education (CAS). (February 16,
2019). CAS Orientation Programs. Retrieved from
http://standards.cas.edu/getpdf.cfm?PDF=E86E214E-E432-4BBA-
8BCB03626D2495BD
Cozarelli, C., Wilkinson, A. V., & Tagler, M. J. (2001). Attitudes towards the poor and
attributions for poverty. Journal of Social Issues, 57, 207-227.
Crissman, J. L., (2002). The impact of clustering first-year seminars with English
composition courses on new student’s retention rates. Journal of College Student
Retention, 3(2), 137-152.
Critcher, C.R., & Dunning, D. (2015). Self-affirmations provide a broader perspective on
self-threat. Personality and Social Psychology Bulletin, 4(1), 3-18.
Crocker J, Major B. (1989). Social stigma and self-esteem: The self-protective properties
of stigma. Psychological Review, 96, 608–630.
Croziet, J. & Claire, T. (1998). Extending the concept of stereotype threat to social class:
The intellectual underperformance of students from low socioeconomic
backgrounds. Personality and Social Psychology Bulletin, 24(6), 588-601.
Croziet, J., & Millet, M. (2011). Social class and test performance: From stereotype
threat to symbolic violence, and vice versa. In (Eds.) Stereotype threat: Theory,
process, and application, 188-201.
Croziet, J., Despres, G., Gauzins, M., Huguet, P., Leyens, J., & Meot, A. (2004).
Stereotype threat undermines intellectual performance by triggering a disruptive
mental load. Personality and Social Psychology Bulletin, 30(6), 721-731.
Cruce, Ty M., Wolniak, G. C., Seifert, T. A., & Pascarella, E. T. (2006). Impacts of good
practices on cognitive development, learning orientations, and graduate degree
plans during the first year of college. Journal of College Student Development,
47(4), 365-383.
Darley, J. M., & Gross, P. H. (1983). A hypothesis-confirming bias in labeling effects.
Journal of Personality and Social Psychology, 44(1), 20-33.
Darnon, C., Wiederkehr, V., Dompnier, B., & Martinot, D. (2018). ‘Where there is a
will, there is a way’: Belief in school meritocracy and the social-class
achievement gap. British Journal of Social Psychology, 57, 250-262.
Dartmouth College. (2013). Past special HOP Project: A Class Divide. Hopkins Center
for the Arts, Dartmouth College. Retrieved from
https://hop.dartmouth.edu/online/class_divide
Davis, J. (2010). The First-Generation Student Experience. Stylus Publishing.
DeAngelo, L., and Franke, R. (2016). Social Mobility and Reproduction for Whom?
College Readiness and First-Year Retention. American Educational Research
Journal, 53(6), 1588–1625.
Delisle, J. (2017). The Pell grant proxy: A ubiquitous but flawed measure of low-
income student enrollment. Economic Studies at Brookings, Evidence Speaks
Reports, 2(26).

153
Desert, M., Preaux, M., & Jund, R. (2009). So young and already victims of stereotype
threat: Socio-economic status and performance of 6-9 years old children on
Raven’s progressive matrices. European Journal of Psychology of Education,
XXIV(2), 207-218.
Durante, F., Tablante, C. B., & Fiske, S. T. (2017). Poor but warm, rich but cold (and
competent): Social classes in the stereotype content model. Journal of Social
Issues, 73(1), 138-157.
Durkheim, E. (1951). Suicide. (John A. Spaulding and George Simpson, trans.).
Glencoe, IL: Free Press.
Engle, J. & Tinto, V. (2008). Moving beyond access: College success for low-income,
first-generation students. Pell Institute for the Study of Opportunity in Higher
Education.
Faircloth, B. S., & Hamm, J. V. (2005). Sense of belonging among high school students
representing four ethnic groups. Journal of Youth and Adolescence, 34(4), 293-
309.
Field, A. (2009). Discovering statistics using SPSS, 3rd edition. Thousand Oaks, CA:
Sage Publications.
Fischer, M. J. (2007). Settling into campus life: Differences by race/ethnicity in college
involvement and outcomes. The Journal of Higher Education, 78(2), 125-161.
Freeman, T. M., Anderman, L.H., & Jensen, J.M. (2007). Sense of belonging in college
freshmen at the classroom and campus levels. The Journal of Experimental
Education, 75(3), 203-220.
Fryberg, S. A., & Markus, H. R. (2007). Cultural models of education in American
Indian, Asian American, and European American contexts. Social Psychology of
Education,10, 213-246.
Garrison, N. J., & Gardner, D. S. (2012). Assets first-generation students bring to the
higher education setting. Paper presented at the Association for the Study of
Higher Education (ASHE) Conference, November 15th, 2012, Las Vegas, Nevada.
Goffman, E. (1963). Stigma: Notes of the Management of Spoiled Identity. (1st
Touchstone edition.). New York: Simon and Schuster.
Graham, L. (2011). Learning in a new world: Reflections upon being a first-generation
college student and the influence of TRIO programs. In V. L. Harvey and T. H.
Housel (Eds.). Faculty and first-generation college students: Bridging the
classroom gap together. (New Directions for Teaching and Learning, 127, pp.33-
38.) San Francisco, CA: Jossey-Bass.
Granfield, R. (1991). Making it by faking it: Working-class students in an elite academic
environment. Journal of Contemporary Ethnography, 20(3), 331-351.
Greenfield, G. A., Keup, J. R., & Gardner, J. N. (2013). Developing and sustaining
successful first-year programs: A guide for practitioners. San Francisco, CA:
Jossey-Bass.
Hagerty, B. M. K., Lynch-Sauer, J., Patusky, K., Bouwsema, M., & Collier, P. (1992).
Sense of belonging: A vital mental health concept. Archives of Psychiatric
Nursing, 6, 172-177.

154
Hagerty, B. M., Williams, R. A., Coyne, J. C., & Early, M. R. (1996). Sense of
belonging and indicators of social and psychological functioning. Archives of
Psychiatric Nursing, X(4), 235-244.
Hausmann, L.R.M., Ye, F., Ward Schofield, J., & Woods, R.L. (2009). Sense of
belonging and persistence in White and African American first-year students.
Research in Higher Education, 50(7), 649-669.
Hellman, C. M. (1996). Academic Self Efficacy: Highlighting the First- Generation
Student. Journal of Applied Research in the Community College, 4(1), 69-75.
Hoffman, M., Richmond, J., Morrow, J., & Salomone, K. (2002). Investigating ‘sense of
belonging’ in first-year college students. Journal of College Student Retention,
4(3), 227-256).
Hoyle, R. H. & Crawford, A. M. (1994). Use of Individual-Level Data to Investigate
Group Phenomena Issues and Strategies. Small Group Research, 25(4),464-485.
Hurtado, S. (1992). The campus racial climate: Contexts of conflict. The Journal of
Higher Education, 63(5), 539-569.
Hurtado, S. & Carter, D.F. (1997). Effects of college transition and perceptions of the
campus racial climate on Latino college students' sense of belonging. Sociology
of Education. 70(4),324-345.
Hurtado, S., Griffin, K. A., Arellano, L., & Cuellar, M. (2008). Assessing the value of
climate assessments: Progress and future directions. Journal of Diversity in
Higher Education, 1(4), 204-221.
Hurtado, S., Milem, J., Clayton-Pedersen, A., & Allen, W. (1999). Enacting diverse
learning environments: Climate for racial/ethnic diversity in higher education.
ASHE-ERIC Higher Education Report 26(8), 1-140.
Hurtado, S., & Ponjuan, L. (2005). Latino educational outcomes and the campus climate.
Journal of Hispanic Higher Education, 4(3), 235-251.
Hurst, A. L. (2010). The burden of academic success: Loyalists, renegades, and double
agents. Maryland: Lexington Books.
Ishitani, T. (2003). A longitudinal approach to assessing attrition behavior among first-
generation students: Time-varying effects of pre-college characteristics. Research
in Higher Education, 4(44), 433-449.
Jacobi, M. (1991). Mentoring and undergraduate academic success: A literature review.
Review of Educational Research, 61(4), 505-532.
Johnson, S.E., Richeson, J. A., & Finkel, E. J. (2011). Middle class and marginal?
Socioeconomic status, stigma, and self-regulation at an elite university. Journal
of Personality and Social Psychology, 1-15.
Johnson, D.R., Soldner, M., Leonard, J.B., Alvarez, P., Inkelas, K.K., Rowan-Kenyon,
H., & Longerbeam, S. (2007). Examining sense of belonging among first-year
undergraduates from different racial-ethnic groups. Journal of College Student
Development, 48(5), 525-542.
Jury, M., Smeding, A., Stephens, N. M., Nelson, J. E., Aelenai, C., & Darnon, C. (2017).
The experience of low-SES students in higher education: Psychological barriers to
success and interventions to reduce social-class inequality. Journal of Social
Issues, 73(1), 16-34.

155
Keusch, F. (2015). Why do participate in web surveys? Applying survey participation
theory to internet survey data collection. Management Review Quarterly, 65(3),
183-
Kezar, A. (2000). Summer bridge programs: Supporting all students. Washington, DC,
ERIC Clearinghouse on Higher Education. George Washington University.
Kuh, G. D. (2001). Assessing what really matters to student learning: Inside the National
Survey of Student Engagement. Change, 33(3) 10-66.
Lascher Jr., E. L. & Offenstein, J. L. (2012). Campus racial climate and student
academic outcomes: A critique of prior research and recommendations for future
study. Journal of College Student Retention, 14(2), 265-277.
Layous, K., Davis, E.M., Garcia, J., Purdie-Vaughns, V., Cook, J.E., & Cohen, J.L.
(2017). Feeling left out, but affirmed: Protecting against the negative effects of
low belonging in college. Journal of Experimental Social Psychology, 69, 227-
231.
Leech, N. L., Barrett, K. C., & Morgan, G. A. (2015). IBM SPSS for Intermediate
Statistics: Use and Interpretation (5th ed). New York, NY: Routledge.
Lehmann, W. (2007). “I just didn’t feel like I fit in”: The role of habitus in university
drop-out decisions. The Canadian Journal of Higher Education, 37(2), 89-110.
Lohfink, M. M. & Paulsen, M. B. (2005). Comparing the determinants of persistence for
first-generation and continuing-generation students. Journal of College Student
Development, 46(4), 409-428.
Major, B., & O’Brien, L. T. (2005). The social psychology of stigma. Annual Review of
Psychology, 56, 393-421.
Malone, G. P., Pillow, D. R., & Osman, A. (2012). The general belongingness scale:
Assessing achieved belongingness. Personality and Individual Differences,
52(3), 311-316.
Martin, G. (2015). “Always in my face”: An explanation of social class consciousness,
salience, and values. Journal of College Student Development, 56(5), 471-487.
Martinez, J. A., Sher, K. J., Krull, J. L., & Wood, P. K. (2009). Blue -collar scholars?
Mediators and moderators of university attrition in first-generation college
students. Journal of College Student Development, 50(1). 87-103.
Maslow, A. H. (1954). Motivation and Personality. New York, Harper.
Mayhew, M. J., Rockenbach, A.N., Bowman, N. A., Seifert, T. A., & Wolniak, G. C.
(2016). How College Affects Students, Volume 3: 21st Century evidence that
higher education works. San Francisco, CA: Jossey-Bass.
McNair, T. B., Albertine, S., Cooper, M. S., McDonald, N., & Major, Jr., T. (2016).
Becoming a student-ready college: A new culture of leadership for student
success. San Francisco, CA: Jossey-Bass.
Mendoza-Denton, R., Downey, G., Purdie, V. J., Davis, A., & Pietrzak, J. (2002).
Sensitivity to status-based rejection: Implications for African-American student’s
college experience. Journal of Personality and Social Psychology, 83(4), 896-
918.
Miller, C. K., Mclaughlin, J. A., Haddon, J., & Chansky, N. M. (1968). Socioeconomic
class and teacher bias. Psychological Reports, 23, 806.

156
Montana State University (July 10, 2018). Mountains and Minds: Learners and Leaders.
Retrieved from: http://www.montana.edu/strategicplan/vision.html
Montana State University (July 5, 2018). MSU TRiO Student Support Services.
Retrieved from: http://www.montana.edu/triosss/
Montana State University (February 20, 2019). Office of Planning and Analysis: Quick
facts, 2018-2019. Retrieved from:
http://www.montana.edu/opa/facts/quick.html#Full
Montana State University (February 12, 2019). Hilleman Scholars Program. Retrieved
from: http://www.montana.edu/hillemanscholars/details.html
Montana State University, Office of Planning and Analysis (July 5, 2018). Office of
Planning and Analysis Campus Profile. Retrieved from:
http://www.montana.edu/opa/ 3Montana State University, Office of Planning and Analysis (2018a). Graduation and
Retention Rates: First generation students. [Data file]. Retrieved from:
http://www.montana.edu/opa/students/performance/gradrate/r_firstgen.pdf
Montana State University, Office of Planning and Analysis (2018b). Graduation and
Retention Rates: Pell grant recipients. [Data file]. Retrieved from:
http://www.montana.edu/opa/students/performance/gradrate/r_Pell.pdf
Montana State University, Office of Planning and Analysis (2018c). Graduation and
Retention Rates: All freshmen. [Data file]. Retrieved from:
http://www.montana.edu/opa/students/performance/gradrate/r_all.pdf
Montana State University, Office of Planning and Analysis (2018d). Retention and
Graduation Dashboard. [Data file]. Retrieved from:
http://www.montana.edu/opa/students/performance/retentiongraduation.html
Morrow, J. & Ackermann, M. (2012). Intention to persist and retention of first-year
students: The importance of motivation and sense of belonging. College Student
Journal, 46(3), 483-491.
Murphy, M., & Zirkel, S. (2015). Race and belonging in school: How anticipated and
experienced belonging affect choice, persistence, and performance. Teacher’s
College Record, 117(12), 1-40.
National Center for Education Statistics (NCES) (July 5, 2018). College Navigator:
Montana State University. Retrieved from:
https://nces.ed.gov/collegenavigator/?q=montana+state+university&s=all&id=180
461
National Center for Education Statistics (2017, July 1). Rates of high school completion
and bachelor's degree attainment among persons age 25 and over, by
race/ethnicity and sex: Selected years, 1910 through 2017. Source: U.S.
Department of Education, National Center for Education Statistics, 2017 Tables
and Figures; Digest of Education Statistics;
https://nces.ed.gov/programs/digest/d17/tables/dt17_104.10.asp
National Center for Education Statistics (2017a, December 1). IPEDS Trend Generator.
Source: U.S. Department of Education, National Center for Education Statistics.
https://nces.ed.gov/ipeds/trendgenerator/tganswer.aspx?sid=7&qid=32

157
National Center for Education Statistics (2017b, December 1). Digest of Education
Statistics. Source: U.S. Department of Education.
https://nces.ed.gov/programs/digest/d16/tables/dt16_326.10.asp
National Center for Education Statistics (2017c, December 15). Statistical Analysis
Report: First-Generation Students: Undergraduates Whose Parents Never
Enrolled in Post- Secondary Education, Source: U.S. Department of Education,
National Center for Education Statistics.
https://nces.ed.gov/pubs98/web/98082.asp
National Center for Education Statistics (2017d, December 15). Stats in Brief: First-
Generation and Continuing-Generation College Students: A Comparison of High
School and Postsecondary Experiences. Source: U.S. Department of Education,
National Center for Education Statistics.
https://nces.ed.gov/pubs2018/2018009.pdf
Nunez, A., & Cucarro-Alamin, S. (1998). First-generation students: Undergraduates
whose parents never enrolled in postsecondary education. National Center for
Education Statistics, Statistical Analysis Report, U.S. Department of Education,
NCES 98-082.
Orbe, M. P. (2004). Negotiating multiple identities within multiple frames: An analysis
of first-generation college students. Communication Education, 53(2), 131-149.
Ostrove, J. M. (2003). Belonging and wanting: Meanings of social class background for
women’s constructions of their college experiences. Journal of Social Issues,
59(4), 771-784.
Ostrove, J. M. & Cole, E. R. (2003). Privileging class: Toward a critical psychology of
social class in the context of education. Journal of Social Issues, 59(4), 677-692.
Ostrove, J. M. & Long, S. M. (2007). Social class and belonging: Implications for
college adjustment. The Review of Higher Education, 30(4), 363-389.
Padgett, R..D., Goodman, K. M., Johnson, M.P., Saichaie, K., Umbach, P..D., &
Pascarella, E. T. (2010). The impact of college student socialization, social class,
and race on need for cognition. In S. Herzog (Ed.), New Directions for
Institutional Research: No. 145. Diversity and education benefits (pp. 99–111).
San Francisco, CA: Jossey-Bass.
Pascarella, E. T. & Colleagues. (2007). Methodological Report for Wabash National
Study of Liberal Arts Education.
Pascarella, E. T., Cruce, Ty, Umbach, P. D., Wolniak, G. C., Kuh, G. D., Carini, R. M.,
Hayeck G. C., Gonyea, R. M., & Zhao, C. (2006). Institutional selectivity and
good practices in undergraduate education: How strong is the link? Journal of
Higher Education, 77 (2), 251-285.
Pascarella, E.T., Pierson, C., Wolniak, G., & Terenzini, P. (2004). First-generation
college students: Additional evidence on college experiences and outcomes.
Journal of Higher Education, 75, 249-284.
Pascarella, E.T., Salisbury, M.H., & Blaich, C. (2013). Design and analysis in college
impact research: Which counts more? Journal of College Student Development,
54(3), 329-335.

158
Pascarella, E.T., Wolniak, G., Seifert, T., Cruce, T., & Blaich, C. (2005). Liberal arts
colleges and liberal arts education: New evidence on impacts. San Francisco:
Jossey-Bass/ASHE.
Pell Institute. (2009). National studies find TRiO programs effective at increasing college
enrollment and graduation.
Perigo, D., & Upcraft, M. (1989). Orientation programs. In M. L. Upcraft, J. N. Gardner,
& Associates (Eds.), The Freshman Year Experience, 82-94, San Francisco, CA:
Jossey-Bass.
Phillips, L.T., Stephens, N. M., & Townsend, S. S. M. (2016). Access is not enough:
Cultural mismatch persists to limit first-generation student’s opportunities for
achievement throughout college. Journal of Personality and Social Psychology.
Porter, S. R., & Whitcomb, M. E. (2005). Non-response in student surveys: The role of
demographics, engagement, and personality. Research in Higher Education,
46(2), 127-152.
Prospero, M. & Vohra-Gupta, S. (2007). First-generation college students: Motivation,
integration, and academic achievement. Community College Journal of Research
and Practice, 31(12), 963-975.
Ramos-Sanchez, L. & Nichols, L. (2007). Self-efficacy of first-generation and non-first-
generation college students: The relationship with academic performance and
college adjustment. Journal of College Counseling, 10(1), 6-18.
Reay, D., Crozier, G., & Clayton, J. (2009). “Strangers in Paradise?” Working-class
students in elite universities. Sociology, 43(6), 1103-1121.
Rendon, L. I. (1992). From the barrio to the academy: Revelations of a Mexican-
American “scholarship girl.” New Directions for Community Colleges, 80, 55-64.
Rendon, L. I. (1994). Validating culturally diverse students: Towards a new model of
learning and student development. Innovative Higher Education, 19(1), 33-51.
Riehl, R. J. (1994). The academic preparation, aspirations, and first-year performance
of first-generation college students. College and University, 70(1), 14-19.
Rubin, M. (2012). Social class differences in social integration among students in higher
education: A meta-analysis and recommendations for future research. Journal of
Diversity in Higher Education, 5(1), 22-38.
Rubin, M., Denson, N., Kilpatrick, S., Matthews, K. E., Stehlik, T., & Zyngier, D.
(2014). “I am working class”: Subjective self-definition as a missing measure of
social class and socioeconomic status in higher education research. Educational
Researcher, 43(4), 196-200.
Sackett, P. R., Kuncel, N. R., Arneson, J. J., Cooper, S. R., & Waters, S. D. (2009).
Does socioeconomic status explain the relationship between admissions tests and
post-secondary academic performance? Psychology Bulletin, 135(1), 1-22.
Saenz, V.B., Hurtado, S., Barrera, D. Wolf, D., & Yeung, F. (2007). First in my family: A
profile of first-generation college students at four-year institutions since 1971.
Los Angeles: Higher Education Research Institute.
Sirin, S. R. (2005). Socioeconomic status and academic achievement: A meta-analytic
review of the research. Review of Educational Research, 75(3), 417-453.

159
Skomsvold, P. (2015). Web tables—Profile of undergraduate students: 2011–12. U.S.
Department of Education (NCES 2015-167). Washington, D.C.: National Center
for Education Statistics. Retrieved from
https://nces.ed.gov/pubs2015/2015167.pdf.
Somers, P., Woodhouse, S. R.., & Cofer, J. E. (2004). Pushing the boulder uphill: The
persistence of first-generation college students. NASPA Journal, 41(3), 418-435.
Soria, K. M. (2015). Welcoming blue-collar scholars into the ivory tower: Developing
class-conscious strategies for student success. Columbia, SC: University of
South Carolina, National Resource Center for the First- Year Experience and
Students in Transition.
Soria, K. M. (2018). Campus climate at research universities: 2012-2017. In Soria, K. M.
(Ed.) Evaluating campus climate at U.S. research universities: Opportunities for
diversity and inclusion. Minneapolis, MN: Palgrave Macmillan.
Soria, K. M., & Bultmann, M. (2014). Supporting working-class students in higher
education. NACADA Journal, 34(2), 51-62.
Soria, K. M., Stebleton, M. J., & Huesman Jr., R. L. (2013). Class counts: Exploring
differences in academic and social integration between working-class and middle-
upper-class students at large, public research universities. Journal of College
Student Retention: Research, Theory, and Practice, 15(2), 215-242.
Spencer, B. & Castano, E. (2007). Social class is dead. Long live social class!
Stereotype threat among low socioeconomic status individuals. Social Justice
Research, 20, 418-432.
Spencer, S. J., Steele, C. M., & Quinn, D. (1999). Stereotype threat and women’s math
performance. Journal of Experimental Social Psychology, 35, 4-28.
Stebleton, M. J., Soria, K. M., & Huesman Jr., R. L. (2014). First generation student’s
sense of belonging, mental health, and use of counseling services at Public
Research Universities. Journal of College Counseling, 17(1), 6-20.
Steele, C. M. (1997). A threat in the air: How stereotypes shape intellectual identity and
performance. American Psychologist, 52(6), 613-629.
Steele, C. M. (2010). Whistling Vivaldi: How stereotypes affect us and what we can do.
New York, NY: W.W. Norton & Company.
Steele, C. M., & Aronson, J. (1995). Stereotype threat and the intellectual test
performance of African-Americans. Journal of Personality and Social
Psychology, 69, 797-811.
Steele, C. M., Spencer, S. J., & Aronson, J. (2002). Contending with group image: The
psychology of stereotype and social identity threat. Advances in Experimental
Social Psychology, 34, 379-440.
Stephens, N. M., Fryberg, S. A., Markus, H. R., Johnson, C. S., Covarrubias, R. (2012a).
Unseen disadvantage: How American universities’ focus on independence
undermines the academic performance of first- generation college students.
Journal of Personality and Social Psychology, 102(6), 1178-1197.
Stephens, N.M., Townsend, S. S. M., Hamedani, M. G., Destin, M., & Manzo, V. (2014).
A difference-education intervention equips first-generation college students to
thrive in the face of stressful college situations. Psychological Science, 1-11.

160
Stephens, N. M., Townsend, S. S., Markus, H. R., & Phillips, L.T. (2012b). A cultural
mismatch: Independent cultural norms produce greater increases in cortisol and
more negative emotions among first-generation college students. Journal of
Experimental Psychology, 48, 1389-1393.
Strayhorn, T.L. (2008). The role of supportive relationships in facilitating African-
American male’s success in college. NASPA Journal, 45(1), 26-48.
Strayhorn, T. L. (2012). College Student’s Sense of Belonging: A Key to Educational
Success for all Students. Routledge: New York and London.
Terenzini, P. T., Springer, L., Yaeger, P. M., Pascarella, E. T., & Nora, A. (1996). First-
generation college students: Characteristics, experiences, and cognitive
development. Research in Higher Education, 37(1), 1-22.
The College Board, ACT, Inc. (2018). Guide to the 2018 ACT/SAT Concordance.
Thelin, J. R. (2011). A history of American higher education, 2nd edition. Baltimore,
MD: The Johns Hopkins University Press. Thelin, J. R. & Gasman, M. (2011). Historical overview of American higher education.
In J. H. Schuh, S. R. Jones, S. R. Harper & Associates (Eds.) Student services: A
handbook for the profession, 5th edition. San Francisco, CA: John Wiley & Sons.
Tibbetts, Y., Harackiewicz, J. M., Canning, E. A., Boston, J. S., Priniski, S. J., & Hyde,
J.S. (2016). Affirming independence: Exploring mechanisms underlying a values
affirmation intervention for first-generation students. Journal of Personality and
Social Psychology, 110(5), 635-659.
Tierney, W. G. (1999). Models of minority college-going and retention: Cultural
integrity versus cultural suicide. The Journal of Negro Education, 68(1), 80-91.
Tinto, V. (1993). Leaving College: Rethinking the causes and cures of student attrition.
(2nd edition). Chicago: University of Chicago Press.
Tinto, V. (2012). Completing college: Rethinking institutional action. Chicago:
University of Chicago Press.
Trolian, T. L. (2014). What the WABASH National Study can teach us about at-risk
student populations. New Directions for Student Services, 147, 77-87.
United States Census Bureau (August 14, 2018a). Montana Quick Facts. Retrieved
from: https://www.census.gov/quickfacts/fact/dashboard/mt/PST120217
United States Census Bureau (July 6, 2018b). Montana Quick Facts. Retrieved from:
https://www.census.gov/quickfacts/fact/table/mt/PST045217
U.S. Department of Education (December 10, 2017). Programs: Upward Bound
program. https://www2.ed.gov/programs/trioupbound/index.html
U.S. Department of Education (June 1, 2018). 50th Anniversary Federal TRiO Programs:
Fact Sheet. https://www2.ed.gov/about/offices/list/ope/trio/trio50anniv-
factsheet.pdf
Walpole, M. (2007). Special issue: Economically and educationally challenged students
in higher education: Access to outcomes. ASHE-ERIC Higher Education Report,
33(3), 1-104.
Walton, G. M. & Cohen, G. L. (2007). A question of belonging: Race, social fit, and
achievement. The Journal of Personality and Social Psychology, 92(1), 82-96.

161
Ward-Roof, J. A. (Ed.). (2010). Designing successful transitions: A guide for orienting
students to college (3rd edition). NODA and Stylus Publishing.
Wells, A.V. & Horn, C. (2015). The Asian-American college experience at a diverse
institution: Campus climate as a predictor of sense of belonging. Journal of
Student Affairs Research and Practice, 52(2),149-163.
White, K. R. (1982). The relation between socioeconomic status and academic
achievement. Psychological Bulletin, 91, 461-481.
Wolf-Wendel, L., Ward, K., & Kinzie, J. (2009). A tangled web of terms: The overlap
and unique contribution of involvement, engagement, and integration to
understanding college student success. Journal of College Student Development,
50(4), 407-428.
Wolniak, G. C., Mayhew, M. J., & Engberg, M. E. (2012). Learning’s weak link to
persistence. Journal of Higher Education, 83(6), 795-823.
Yeager, D. S., Paunesku. D., Walton, G. M., & Dweck, D. S. (2013). How Can We
Instill Productive Mindsets at Scale? A Review of the Evidence and an Initial
R&D Agenda. A White Paper prepared for the White House meeting on
Excellence in Education: The Importance of Academic Mindsets.
Yeager, D. S., & Walton, G. M. (2011). Social-psychological interventions in education:
They’re not magic. Review of Educational Research, 81(2), 267-301.
Yeager, D.S., Walton, G.M., Brady, S. T., Akcinar, E.N., Paunesku, D., Keane, L.,
Kamentz, D., Ritter, G., Duckworth, A.L., Urstein, R., Gomez, E.M., Markus,
H.R., Cohen, G. L., & Dweck, C. S. (2016). Teaching a lay theory before college
narrows achievement gaps at scale. Proceedings of the National Academy of
Sciences.
York, T. T., Gibson, C., & Rankin, S. (2015). Defining and measuring academic success.
Practical assessment, Research, & Evaluation, 20(5), 1-20.
Young, J. W. (1990). Adjusting the cumulative GPA using Item Response Theory.
Journal of Educational Measurement, 27(2), 175-186.
Zalaquett, C. P. (1999). Do students of noncollege-educated parents achieve less
academically than students of college-educated parents? Psychological Reports,
85, 417-421.
Zirkel S. (2004). What will you think of me? Racial integration, peer relationships and
achievement among white students and students of color, Journal of Social
Issues, 60(1), 57-74.

162
APPENDICES

163
APPENDIX A
SURVEY ITEMS

164
Measure of General Belongingness Scale (GBS)
Items are measured using a Likert scale, with options of strongly agree (1), agree (2),
agree somewhat (3), undecided (4), disagree somewhat (5), disagree (6), and strongly
disagree (7):
• When I am with other people at MSU, I feel included
• I feel accepted by others at MSU
• I feel like an outsider at MSU (reverse coded)
• When I am with other people at MSU, I feel like a stranger (reverse coded)
• I feel connected with others at MSU
• I feel isolated from the rest of the world at MSU (reverse coded)
• Friends at MSU do not include me in their plans (reverse coded)
• I have a sense of belonging at MSU
• I have a place at the table with others at MSU
• I have close bonds with friends at MSU
• Because I do not belong at MSU, I feel distant during the holiday season (reverse
coded)
• I feel as if people at MSU do not care about me (reverse coded)
Student Experience Survey (SES) Items
Influential interactions with peers is a 9-item scale with an alpha reliability of .85 that
combines items from two subscales from the Student Experiences Questionnaire. The
scales and constituent items are:

165
Positive peer interactions:
• The respondent has developed close personal relationships with other students.*
• The student friendships the respondent has developed at this institution have been
personally satisfying.*
• Interpersonal relationships with other students have had a positive influence on
the respondent’s personal growth, attitudes, and values.*
• Interpersonal relationships with other students have had a positive influence on
the respondent’s intellectual growth and interest in ideas.*
• It has been difficult for the respondent to meet and make friends with other
students (reverse-coded).*
• Few of the students the respondent knows would be willing to listen to and help
the respondent with a personal problem (reverse-coded).*
• Most students at this institution have values and attitudes different from the
respondent (reverse-coded).*
*The response options for this item are “strongly agree,” “agree,” “neutral,”
“disagree,” or “strongly disagree.”
Good teaching and high-quality interactions with faculty is a 23-item scale with an alpha
(internal consistency) reliability of .92 that combines items from four subscales. The
scales and constituent items are:

166
Faculty interest in teaching and student development
• Most faculty with whom the respondent had contact are genuinely interested in
students.
• Most faculty with whom the respondent had contact are interested in helping
students grow in more than just academic areas.
• Most faculty with whom the respondent had contact are outstanding teachers.
• Most faculty with whom the respondent had contact are genuinely interested in
teaching.
• Most faculty with whom the respondent had contact are willing to spend time
outside of class to discuss issues of interest and importance to students.
For each item, the response options are “strongly agree,” “agree,” “neutral,”
“disagree,” or “strongly disagree.”
Prompt feedback
• How often faculty informed the respondent of their level of performance in a
timely manner.*
• How often faculty checked to see if the respondent had learned the material well
before going on to new material.*
*The response options for this item are “very often,” “often,” “sometimes,” “rarely,”
or “never.” The alpha reliability of this scale is .68.
Quality of non-classroom interactions with faculty
• Non-classroom interactions with faculty have had a positive influence on personal
growth, values, and attitudes.
• Non-classroom interactions with faculty have had a positive influence on
intellectual growth and interest in ideas.
• Non-classroom interactions with faculty have had a positive influence on career
goals and aspirations.
• Since coming to this institution, the respondent has developed a close, personal
relationship with at least one faculty member
• The respondent is satisfied with the opportunities to meet and interact informally
with faculty members.
For each item, the response options are “strongly agree,” “agree,” “neutral,”
“disagree,” or “strongly disagree.” The alpha reliability of this scale is .85.
Generational Status Item:
“What is the highest level of education each of your parents/guardians completed?” (The
response options are: 1 = Did not finish high school, 2 = High school
graduate/GED, 3 = Attended college but no degree, 4 = Vocational/technical
certificate or diploma, 5 = Associate or other 2-year degree, 6 = Bachelors or
other 4-year degree, 7 = Masters, 8 = Law, 9 = Doctorate).

167
APPENDIX B
SURVEY MATERIALS

168
Email Invitation to Participants:
Dear First-year Student at MSU,
MSU is dedicated to enhancing the experience of new students on our campus. The best
way we can do this is by asking you about your experiences and perceptions at MSU.
You have been selected as part of a scientific sample of first-year students at MSU. Your
response is very important to ensure the accuracy and representativeness of the responses
and we need your help!
By completing this survey you will be providing MSU with important information that
will help us shape the first-year student experience on our campus. ALLrespondents will
receive500 ChampChange points on their account, and ONE randomly selected
respondent will also receive a $50 Columbo’s Pizza gift card as thanks!
Follow this link to the Survey:
${l://SurveyLink?d=Take the Survey}
This survey will only take about 5 minutes to complete. Your responses are voluntary and
will be kept strictly confidential. Your participation or non-participation will not affect
your grade or class standing in any way. This survey has been reviewed and approved by
the Montana State University Institutional Review Board (IRB). If you have any
questions about the survey, please email Christy Oliveri at [email protected]. If
you have any questions about your rights as a participant in this study, you may direct
them to the Institutional Review Board at 994-4706.
I look forward to receiving your responses and learning about how we can enhance the
student experience at MSU for the next generation of incoming students.
Many Thanks,
Christy Oliveri, Doctoral candidate
Email Reminder to Participants (sent only to those who have not completed):
Dear First-year MSU student:
Just a quick reminder to please complete the student experience survey you were sent last
week. On average, it takes about 5 minutes, and it is SO important to complete it so that
your voice is included! This information will help us enhance the student experience on
our campus for future students. All participants receive 500 ChampChange points, and
ONE winner will receive a $50 Columbo's Pizza gift card!
Follow this link to the Survey:
${l://SurveyLink?d=Take the Survey}
Thank you so much!
Christy Oliveri, MSU Doctoral student