the impact of taxation and - university of york · the impact of taxation and ... cereals and soft...
TRANSCRIPT

CHE Research Paper 131
The Impact of Taxation and Signposting on Diet: An Online Field Study with Breakfast Cereals and Soft Drinks
Daniel John Zizzo, Melanie Parravano,Ryota Nakamura, Suzanna Forwood,Marc Suhrcke


The impact of taxation and signposting on diet: an online field study with breakfast cereals and soft drinks
1Daniel John Zizzo 2Melanie Parravano 3Ryota Nakamura 4Suzanna Forwood 3Marc Suhrcke
1 BENC and Newcastle University, UK 2BHRU and Newcastle University, UK
3Centre for Health Economics, University of York, York, UK 4Anglia Ruskin University, UK June 2016

Background to series
CHE Discussion Papers (DPs) began publication in 1983 as a means of making current research material more widely available to health economists and other potential users. So as to speed up the dissemination process, papers were originally published by CHE and distributed by post to a worldwide readership. The CHE Research Paper series takes over that function and provides access to current research output via web-based publication, although hard copy will continue to be available (but subject to charge). Acknowledgements
This report is independent research commissioned and funded by the Department of Health Policy Research Programme (Policy Research Unit in Behaviour and Health (PR-UN-0409-10109)).The views expressed in this publication are those of the authors and not necessarily those of the Department of Health. We also gratefully acknowledge the support of the UKCRC Centre for Diet and Physical Activity Research (CEDAR) and the ESRC (Network for Integrated Behavioural Science, ES/K002201/1). We thank Susan Jebb, Bruce Lyons, Peter Moffatt, Theresa Marteau, Vicki Pyne, Martin Roland, Richard Smith, Robert Sugden and participants to presentations at Cambridge, East Anglia, Essen, Newcastle, Nottingham, Reading and York for relevant encouragement and advice. The usual disclaimer applies. Further copies
Copies of this paper are freely available to download from the CHE website www.york.ac.uk/che/publications/ Access to downloaded material is provided on the understanding that it is intended for personal use. Copies of downloaded papers may be distributed to third-parties subject to the proviso that the CHE publication source is properly acknowledged and that such distribution is not subject to any payment. Printed copies are available on request at a charge of £5.00 per copy. Please contact the CHE Publications Office, email [email protected], telephone 01904 321405 for further details. Centre for Health Economics Alcuin College University of York York, UK www.york.ac.uk/che © Daniel John Zizzo, Melanie Parravano, Ryota Nakamura, Suzanna Forwood, Marc Suhrcke

The impact of taxation and signposting on diet: an online field study with breakfast cereals and soft drinks i
Abstract
We present a large scale study where a nationally representative sample of 1,000 participants were asked to make real purchases within an online supermarket platform. The study captured the effect of price changes, and of the signposting of such changes, for breakfast cereals and soft drinks. We find that such taxes are an effective means of altering food purchasing, with a 20% rate being sufficient to make a significant impact. Signposting represents a complementary nudge policy that could enhance the impact of the tax without imposing severe welfare loss, though the effectiveness may depend on the product category. Keywords: taxes, signposting, healthy diet, nudges, public health. JEL classification numbers: C93, D12, H31, I1.
Extended Abstract
Background: Current thinking about the impact of a fiscal policy intervention, such as a ‘sugar tax’, on dietary behavior is limited and based on econometric and modelling data, or on experimental studies using hypothetical purchase choices. This study presents a large scale field study: a nationally representative sample of participants was asked to make real purchases within an online supermarket platform. The study captured price elasticity for two products of policy interest: breakfast cereals and soft drinks, as well as the impact of how those changes are signposted to the consumer. Methods: 1,000 participants, with latent demand for breakfast cereals and soft drinks, were randomly allocated to one of two conditions (signposted or not signposted) and completed ten shopping tasks using an online supermarket platform. They were given a budget of £10 and were aware that a randomly determined task would be played out for real: they received the groceries chosen and any unspent budget. For each of the 10 tasks, the supermarket contained either breakfast cereals (five tasks) or soft drinks (five tasks), and the pricing either matched a UK grocery retailer (baseline), or a subset of products received a tax of either 20% or 40% to either the healthier or less healthy items within the supermarket. Participants could fill a one week shopping diary after groceries were delivered. Results: When the taxes were signposted to consumers, both the 20% and 40% rates reduced purchase volume of all the products they were applied to. When the taxes were not signposted, reductions in purchase volume were only seen in less healthy breakfast cereals and healthier soft drinks at 20% taxation, and in less healthy breakfast cereals and all soft drinks at 40% taxation. There were no significant differences in the effects from taxation between socioeconomic groups. Discussion: Fiscal policies that tax food or drinks may be an effective means of altering food purchasing, with a 20% rate being sufficient to make a significant impact in relation to breakfast cereals and soft drinks. Signposting represents a complementary ‘nudge’ policy that could enhance the impact of the tax without imposing severe welfare loss, though the effectiveness may depend on the product category. Expectations that taxation would reduce socioeconomic inequalities in diet may be overstated, but neither is there reason for concern that overall diet improvement would have to come at the cost of increasing socioeconomic inequalities.

ii CHE Research Paper 131

The impact of taxation and signposting on diet: an online field study with breakfast cereals and soft drinks 1
1. Introduction
This paper presents a large scale online study with a nationally representative sample from the United Kingdom to look at the effect of price changes, and ways in which these price changes are presented, on healthy diet choice in relation to breakfast cereals and soft drinks.1 Participants in our study used real budgets and had an opportunity to buy real groceries online which were then delivered to their door. The groceries were from a list of almost 1,000 products offered by Tesco, the largest U.K. supermarket retailer, and checks were made for any effect of online purchases on later purchases to better identify the net effect of our potential policy interventions. There has been considerable recent policy interest in the potential use of fiscal policy to influence dietary behavior (Mytton et al. 2012), for example in the form of a ‘fat tax’ or of a ‘sugar tax’ as already trialed in different forms in Australia, Chile, Denmark, France, Hungary, Mexico and Norway (Cornelsen and Carreido 2015; Ells et al., 2015). There is in principle a defendable justification for public policy to correct what may be conceived as a market failure associated with the external costs arising from obesity. In collectively funded health insurance systems, healthy-weight individuals will subsidize the medical care costs of obese individuals. The higher medical care costs may be passed on to the public in the form of higher payroll or income taxes, which in turn leads to decreased labor supply (Cawley and Frisvold 2015). While it is widely recognized that the case for diet-related taxation is far more nuanced than that for other commodities such as tobacco and alcohol, there is a perhaps surprising heterogeneity in the conclusions from the existing modeling and econometric evidence.2 The experimental evidence, which is almost entirely based on hypothetical choices, is also mixed (Epstein et al. 2007).3 Perhaps the most interesting evidence comes from the actual real world experiences of the implementation of significant fiscal policy measures (Wareham and Jebb 2015); this is also mixed, however, as apparent for example from what some see as a failure of the Danish fat tax (Snowdon, 2015) and conversely the seeming success of the Mexican excise tax on on sugary soft drinks (Colchero et al., 2016). There is obviously an important role for randomized studies to go hand in hand with an analysis of actually implemented fiscal policies.4
1 For ease of reference, throughout this paper we refer to ‘breakfast cereals’ as simply ‘cereals’.
2 While, for instance, Thow et al. (2014) conclude that “taxes and subsidies on food have the potential to influence
consumption considerably and improve health, particularly when they are large”, Cornelsen et al. (2015a, p.18) argue that “without a proper appreciation of the potential indirect impacts we do not know the overall impact of taxes foods on unhealthy foods and beverages and further that there is a very real possibility that they may not be beneficial for health after all.” Ells et al. (2015) and Public Health England (2015) argue for the existence of price effects but note the limitations of existing research. 3 Part of the problem in developing conclusive evidence on the effectiveness of fiscal policies is to do with the fact that
there have only been very few (though a growing number of) cases of actual real world experiences of the implementation of significant fiscal policy measures (Wareham and Jebb 2015). Inevitably, the bulk of the existing studies are either relying (1) on epidemiological modelling studies, the results of which critically depend on underlying assumptions and scenarios considered in the model (Briggs et al. 2013) or (2) on econometric analyses of the relationships between food prices and purchase, consumption or diet-related health (Powell and Chaloupka, 2009; Eyles et al. 2012). A limitation of the latter approach is that the observed variation in prices may be endogenous, resulting in biased estimates of the impact of price changes. 4 Other real world policy evaluations are presented by Cawley and Frisvold (2015), looking at short term price effects of the
first city-level tax on sugar-sweetened beverages in Berkeley, California, and by Grogger (2015), also evaluating the excise tax in Mexico. When compared with observational studies that measure real-world purchasing, randomized studies can appear to lack validity and generalizability. The reason for this is that designing a randomized experiment necessitates simplification and control of sources of variability in order to make the study tractable and appropriately powered. This limitation brings with it a considerable advantage: randomized trials are a more stringent test of the causality than observational studies. Many claims from observational findings are not seen when studied in randomized trials (Ioannidis, 2013) and may instead reflect complex and insufficiently controlled socio-economic patterns of behavior (Lawlor et al., 2004). The current study therefore provides key evidence needed to complement observational evaluations of the impact of taxes (such as Colchero et al., 2016) claiming that taxes do have a causal impact on purchasing behavior.

2 CHE Research Paper 131
At the same time, there has been growing policy interest in the use of ‘nudge’ or ‘choice architecture’ approaches to correct behavior without imposing major financial incentives or regulation (Sunstein and Thaler 2009; Marteau et al. 2011; Hollands et al. 2013), often invoking insights from behavioral economics. Out of the wide range of potential nudge approaches, the idea of signposting information to affect their salience has been applied in various contexts, but not yet in the context of diet-related fiscal policies. Chetty et al. (2009) may come closest in their attempt to increase the salience of a commodity tax on the price tag, finding that this did indeed increase the consumers’ sensitivity to the tax. Goldin and Homonoff (2013) find a similar effect to vary by socioeconomic groups in some but not all cases: high income consumers were less responsive than low income consumers to a tobacco tax that was levied at the cashier but were similarly responsive to a tax that was presented in the price tag. In non-diet related settings, Sussman and Olivola (2011) find a general tendency for consumers to dislike taxes more than equivalent price changes. Bad deal aversion (Isoni, 2011) may go together with taxation aversion, as consumers may see taxes as a bad deal. Our study is innovative in several respects. We seek to combine both policy approaches in a novel field experimental setting, using a purpose-built online supermarket that is carefully modelled on a major real world online supermarket (Tesco). Unlike the vast majority of lab experimental studies (e.g., Giesen et al. 2011 and Waterlander et al. 2012a, 2012b), which are drawn from psychology,5 budgets and purchases are for real, i.e. participants are given budget and groceries (breakfast cereals and soft drinks) that will be delivered via a real supermarket to their doorstep. We also restrict the sample of participants to people that have a latent demand for the product categories being considered, in that they have consumed cereals and soft drinks at least once in the last month. This avoids any power reduction and estimation bias by including people who do not generally buy either, but who may spuriously feel they have to in an experimental setting. Unlike the small number of recent randomized controlled trials (RCTs) of subsidies to increase purchases of healthier foods, typically fruit and vegetables (Waterlander et al. 2013; Ball et al. 2015), we look at the potentially more interesting (from a policy viewpoint) case of taxes; we consider a nationally representative, large sample of consumers (of our two product categories), the largest we are aware of in terms of tax studies on diet choices; and we have an intertemporal check about the effect of the online purchase on other purchases. Looking at a representative sample enables us to verify whether taxes on less healthy products are more likely to be effective or ineffective with particular segments of the population. Some researchers have argued that taxation should have the potential not only to improve overall population diet but to simultaneously reduce socioeconomic inequalities in diet (Blakely 2014; Sharma et al 2014). The opposite outcome, of course, would be of policy concern. Having an intertemporal consumption check enables us to have a first test, partial albeit it is, on whether there is any evidence of compensation effects where the study manipulation, while effective in terms of direct study outcomes, would be made pointless by later unhealthy purchases. As an example of this, researchers may observe less Coke being bought in a study. This however would mean little if the consumer were to compensate by buying a six-pack of Coke at the local grocery store afterwards. Our study is also innovative in combining price changes with modifying the way such price changes are implemented: as discussed below, taxes are either signposted or not. We focus on cereals and soft drinks as they are reasonably popular among UK households, include sizeable proportions of both healthy and unhealthy products within each category and are priced
5 Within experimental economics, a partial exception is Yang and Chiou (2010), who have a laboratory experiment with
university undergraduates and a small set of eight genuine beverages on offer; no real money or equivalent is however provided in exchange of unspent budgets, which may bias the results towards finding a price effect (which they do). Fevrier and Visser (2004) use real budgets to test the GARP axiom with an orange juice purchasing task.

The impact of taxation and signposting on diet: an online field study with breakfast cereals and soft drinks 3
within the experimental budget of UK £10. From a public policy perspective, taxes on sugary soft drinks have been implemented in countries such as Mexico and are being debated in many countries (Cornelsen and Carreido 2015). In relation to the UK, in a recent report by Tedstone et al. (2015), an introduction of a price increase of a minimum of 10-20% via a tax or levy on high sugar products, such as on sugar-sweetened beverages, was one out of eight measures identified that could help facilitate a reduction in sugar intakes. Cereals are also interesting as they can make an important contribution to micronutrient intake and many of them also represent a good source of fibre (Williamson 2010). However, a considerable and growing proportion of cereals have high levels of sugar and salt (Which? 2012, Action on Sugar 2015). In addition, the market for both cereals and soft drinks is characterized by collusive pricing and intense non-price competition, meaning that estimation of price elasticity from naturally occurred variations in prices from observational data is challenging, though possible under structural models that make assumptions about the nature of market competition (e.g., Nevo, 2000, 2001). This provides further justification for our field experimental methodology. We consider price changes of 20% and 40%. A price change of (around) 20% is standard in the literature (Bonnet and Réquillart 2013; Briggs et al. 2013; Epstein et al. 2007; Waterlander et al. 2012a, 2012b), it is at the upper bound of food taxes typically considered by policy makers, and the lower bound of what public health researchers consider as necessary for making a significant, positive impact on health (Mytton et al 2012). A price change of 40% is a ‘large’ change and provides a stress test for whether any effect can be found, given the inconclusiveness of the results in the literature. In brief, our key result is that taxation of less healthy cereals and soft drinks has a sizeable negative impact on their purchases, particularly, in the case of cereals, when the price change is salient (signposted), though more generally the effects of signposting are nuanced. A policy ‘reasonable’ tax value of 20% is sufficient to lead to large changes in behavior. Furthermore, we find no evidence of adverse distributional effects between socioeconomic groups to worry about as a result of the price changes. The rest of the paper is structured as follows. Section 2 describes the online supermarket platform, the product categories and healthfulness classification, and the experimental design, as well as providing details on participants, procedures, variables and the econometric model being employed. Section 3 describes the sample characteristics and experimental results, section 4 includes a discussion and section 5 concludes.

4 CHE Research Paper 131
2. Study platform and design
2.1 Online supermarket platform
A website built to emulate an online supermarket platform was used. The website is posted at www.woodssupermarket.co.uk and was developed by Cauldron Inc. for the BHRU. The website mimics the appearance of a regular online grocery store, including browsing, search, unique product pages, trolley and checkout. Image, price, full description, and a table of macronutrient were available for each product. The platform automatically collects a range of data, i.e. product name, price, number of units purchased, price information, nutrient content, browsing history and time spent within the site. The platform was built for assessing the effectiveness of a series of food purchase interventions (Forwood et al., 2015) and further modified for this study. In this study the range of products was restricted to two target categories – cereals (189 products) and soft drinks (709 products). The food database was a copy of the range of products for the corresponding categories from the largest supermarket chain in the United Kingdom, Tesco (scraped from Tesco.com in August 2015), supplemented with nutrient composition per 100 g (100 ml) from food (drinks) labels available at Tesco.com or from databases for common foods supplied by MRC Human Nutrition Research (Fitt et al., 2014). Tesco’s market share at the time of the experiment was 28.3% (McKevitt, 2015). Grocery deliveries were organized by the team using Tesco’s home delivery service (http://www.tesco.com/groceries/).
2.2 Product categories and healthfulness classification
As noted, we focused on the following product categories: (i) cereals, which included ready-to-eat breakfast cereals, muesli and granola and (ii) soft drinks, which included sports and energy drinks, waters, juices and fizzy drinks.6 Products in both the cereal and the soft drinks categories were divided into two groups: healthier and less healthy. We classified products into those groups based on the same criteria used by the UK broadcasting regulator Ofcom to enforce restrictions of television advertising to children. That is, based on the UK Food Standards Agency’s nutrient profiling (NP) model (Rayner et al. 2005). An advantage of this method is that it provides a unified measure of healthiness across all available food and drink products (Nakamura et al. 2015). The model uses a simple scoring system based on the nutrient content of 100g of a food or drink. The score for each product is based on the energy density, saturated fat, total sugar and sodium and protein contents together with an estimate of the fruit, vegetable, and nut contents. An increase in the NP score reflects a reduction in the healthiness of the product. In order to classify products, we followed the same thresholds used by Ofcom to regulate food and drinks advertisement to children, that is, foods scoring 4 or more and drinks scoring 1 or more are defined as less healthy, and those scoring less are defined as healthier.7 Lobstein and Davies (2009) have a comprehensive discussion on the application of nutrient profiling models for public health policy purposes.
6 We excluded fresh milk, fresh fruit juices and the like due to their perishability and the risk of problems associated with
delivery. 7 Some examples of less healthy cereals are: Kellogg’s Rice Krispies (score = 6), Nestle Cheerios Cereal (score = 8) and
Kellogg’s Frosties Cereal (score = 13) and examples of healthier cereals are: Nestle Shredded Wheat Cereal (score = -6), Alpen No Added Sugar Muesli (score = -3) Dorset Cereals Honey Granola (score = 0). Examples of less healthy soft drinks are: regular tonic water (score = 1), regular Coke (score = 2) and Lucozade Energy (score = 3), while water (score = 0), Diet Coke (score = 0) and orange juice from concentrate (score = -3) are examples of healthier drinks. Notice that a healthier food or drink is a relative concept and depends on the threshold applied; hence it is not necessarily equal to what would be generally accepted as a healthy food or drink. A good example is diet sodas, which are healthier than sugar added soft drinks, but would not be considered healthy per se.

The impact of taxation and signposting on diet: an online field study with breakfast cereals and soft drinks 5
2.3 Design
Participants had a budget (£10) and undertook a series of online shopping tasks.8 In each shopping task, items from only one product category (either cereals or soft drinks) were available for purchase. In the baseline tasks, one for each product category, item prices were matched with Tesco.com prices (excluding promotions). In the intervention tasks, the prices of the less healthy (healthier) products were taxed by either 20% or 40%, while the prices of the healthier (less healthy) products remained at the baseline level. This results in a total of ten shopping tasks, five for each product category. These price interventions allowed us to estimate the price elasticities and cross-price elasticities of the demand for healthier and less healthy products within each product category. While only the case of taxes on the less healthy products is obviously of direct policy interest, we decided to be symmetrical between the two cases in order to avoid making overly transparent what the experiment is about, and therefore to reduce the likelihood of experimenter demand effects (Zizzo 2010); we also found of potential interest to compare direct and cross-price elasticities between the two sets of products. In addition, participants were randomly allocated to one of the following treatments: Signposted tax and Not Signposted tax. In the Signposted tax treatment the amount of the price increase is presented separately from the original price and flagged as a tax, whereas in the Not Signposted treatment the price increase is kept implicit (only the final price is presented). Figure 1 shows an example of a 20% tax on a less healthy cereal. The objective of this manipulation is to assess the degree to which the salience of the tax has an impact on consumers’ demand. The price manipulation was a within-subject factor while the signposting manipulation differed between-subjects. We used a standard Random Incentive Mechanism (RIM), i.e. once participants complete all shopping tasks one shopping task was randomly selected and played out for real, i.e. participants received the groceries delivered to their homes and the remainder of the budget was credited to them by the survey company (Research Now).9 The instructions never referred to taxes as either ‘fat taxes’ or ‘sugar taxes’.
Figure 1. Price manipulation: Not signposted vs. signposted
Notes: The signposting manipulation was between-subjects, and therefore participants would either see the tax-inclusive prices as in the first panel, or the tax identified separately and flagged as a tax as in the second panel.
8 A pilot experiment controlled for whether the fact that this money was not earned made a difference, which it did not.
See discussion section for details. 9 The RIM is a standard experimental economics procedure (see for example Davis and Holt, 1993, p. 452, and Fevrier and
Visser, 2004) and one of its main advantages is that it provides an incentive for truthfully responding to all tasks while only paying one of them; in addition it avoids: a) the wealth effect that would be generated by changes in the shopping budget through the experiment; and b) a portfolio effect, i.e. subjects (rationally) treating all the tasks together rather than separate tasks.

6 CHE Research Paper 131
Participants were free to spend as much as desired from their £10 shopping budget, including the option of checking out with an empty basket. We decided to implement this design feature against the option of forcing participants to spend all or at least part of their shopping budget, because the latter would inflate the purchasing data unrealistically and potentially bias the estimation of tax effects. One of the potential negative consequences of this was having a large number of participants checking out with an empty basket. We reduced the risk of this happening by limiting subject eligibility to consumers who bought a product from each of the two target product categories (cereals and soft drinks) at least once in the last month. In order to examine any potential compensation effect between our online shop and alternative shopping opportunities, upon completion of the online shopping, participants were invited to record their purchases of the two relevant product categories as well as the additional category ‘chocolate’ for one week after they received the shopping basket delivered to their homes. Below, we refer to this part of our study as the shopper diary.
2.4 Participants
A total of 1,000 participants (54.10% female; mean age 46.95, SD=15.9 years; BMI= 26.49, SD=5.28) completed the experiment. All participants were based in the UK and the sample was representative in terms of regions, gender, age ranges and social classification. Participants were recruited via Research Now, a market research online panel company (http://www.researchnow.com). Quota targets were based on the Office for National Statistics annual mid-year estimates 2014. We used three screening questions in order to restrict our sample to consumers who purchased the target products – cereals and soft drinks – at least once a month and were responsible for at least half of the shopping of their household. We also excluded respondents in a diet for medical reasons and those answering incorrectly one or more of the data quality questions. See Q1.2-Q1.5 and Q1.7 in the appendix for the questions’ exact phrasing. From the total of 1,000, 281 participants completed the follow-up shopper diary correctly (49.82% female; Mean age 42.82, SD=15.43; BMI= 25.85, SD= 4.87).
2.5 Procedure
Participants took part in the study over the internet between August and October 2015, and both participant and experimenter were blind to treatment allocation. The experimental instructions can be found in the appendix. The study was conducted using specialized online survey software (www.qualtrics.com) and the Woods online supermarket discussed in section 2.1. At initial assessment, participants completed a consent form, questions about their shopping habits and quality control questions. Participants not meeting the inclusion criteria and/or failing to answer correctly one or more of the quality control questions were excluded at this point. Eligible participants were randomly allocated to one of the two experimental treatments. Participants each completed ten shopping tasks, presented in random order. Both randomizations were performed using a built-in feature within the survey software. Product name, number of units purchased, price information, and total spending were recorded for analysis. Participants provided their address, relevant contact details and delivery preferences. Following completion of the shopping tasks, participants were informed which task (and hence products) was (randomly) selected to be delivered to them. Personally identifiable information was used solely for the purpose of organizing the delivery of the groceries to the participants, who knew this. Subsequently, participants answered

The impact of taxation and signposting on diet: an online field study with breakfast cereals and soft drinks 7
a post-experiment questionnaire.10 Within the next eleven days participants received the relevant groceries via Tesco.com and any unspent budget was transferred by the survey company via panel points rewards of equivalent value (within 28 days after completion of the experiment). The study protocol received approval from the University of East Anglia, School of Economics Ethics Committee (Application No: 0170). Participants completing the shopper diary received an email containing a link to a website which directed them to confirm the delivery of the groceries. Participants were required to wait until receiving the groceries to complete the survey. Once delivery had been confirmed (including a description of the items received) participants automatically received a link to their shopper diary. For a period of seven days, participants were instructed to record the following information every time they purchased one or more products within one of the three categories (cereals, soft drinks and chocolate): store name, name of the product including weight/volume and quantity. Participants were compensated for taking part in the shopper diary with a £5 shopping voucher.
2.6 Variables
In line with our main objective of estimating price elasticities for the less healthy and healthier products within each category, i.e. cereals and soft drinks, we used the following outcome variables: the total quantity of less healthy cereals (weight in grams) purchased in each task by each participant; the total quantity of healthier cereals (weight in grams) purchased in each task by each participant; the total quantity of less healthy soft drinks (volume in ml) purchased in each task by each participant; and the total quantity of less healthy soft drinks (volume in ml) purchased in each task by each participant. For simplicity, from now on we will call these variables “volume purchased of …” as appropriate. We now list the other variables. Socioeconomic status: As a measure of individual level socioeconomic status, participants provided their highest level of educational qualification attained, coded onto a six point scale ranging from 0 ‘No qualifications’ to ‘6 Degrees or higher’. As a measure of income, participants provided both their personal yearly income and their total household income before tax (participants selected from 4 income bands in each case). Participant characteristics: Data on gender, age, self-reported height and weight (used to calculate participants' body mass index: BMI) the number of adults and children living in their household was collected. Participants were also asked whether or not they were in a weight loss diet. Other control variables: We elicited participants’ time preferences using a ten choices discount rate price list for a six months’ time horizon, similar to Harrison et al. (2002). Participants were asked to provide an estimation of the number of days their stocks of soft drinks and their stocks of cereals would last until they would run out and need to buy some more. Participants were also asked to provide a measure of the frequency they purchased groceries online, and the frequency they shopped at Tesco, both variables coded on a 7 point Likert scale ranging from never to more than once a week. Finally, as a measure of price recollection, participants were asked to indicate their best guess of the regular retail price of six products, i.e. three cereals and three soft drinks.
10
The questions included: recollection and awareness of price of products outside the experiment; stock of cereals and soft drinks in their home at the time of participation to the experiment; time time-discount rate elicitation (Harrison et al., 2002) as well as questions related to socioeconomic, health and demographic characteristics, including: age, gender, weight, height, personal income, household income and education level. Height and weight were collected to calculate participants’ Body Mass Index (BMI).

8 CHE Research Paper 131
2.7 Econometric model
We exploit the panel nature of the data in the analysis. Since the data on the volume of products purchased are censored at zero, we consider the following Random Effects Tobit regression model (Wooldridge, 2010). For subject j in task t:
lnY𝑗𝑡∗ = 𝛼𝑗 + 𝛽1tax20𝑗𝑡
𝐻 + 𝛽2[tax20𝑗𝑡𝐻 × signpost𝑗] + 𝛾1tax40𝑗𝑡
𝐻 + 𝛾2[tax40𝑗𝑡𝐻 × signpost𝑗]
+ 𝜃1tax20𝑗𝑡𝐿𝐻 + 𝜃2[tax20𝑗𝑡
𝐿𝐻 × signpost𝑗] + 𝜇1tax40𝑗𝑡𝐿𝐻 + 𝜇2[tax40𝑗𝑡
𝐿𝐻 × signpost𝑗]
+ 𝛿signpost𝑗 + 𝐳𝑗′𝝋 + 휀𝑗𝑡;
lnY𝑗𝑡 = lnY𝑗𝑡
∗ if lnY𝑗𝑡∗ > 0 and lnY𝑗𝑡 = 0 otherwise.
ln𝑌𝑗𝑡 gives the volume of healthier and less healthy products purchased in each product category
(estimated separately). We use log-scaled variable because the distribution of 𝑌𝑗𝑡 is highly skewed
(see Appendix A.1-A.4 for distributions).
The key independent variables tax20𝑗𝑡𝐻 , tax40𝑗𝑡
𝐻 , tax20𝑗𝑡𝐿𝐻 and tax40𝑗𝑡
𝐿𝐻 are indicators of the price
manipulations, representing the 20% or 40% tax on healthier (H) or less healthy (LH) products, respectively. These variables are interacted with the indicator of the signpost condition. For illustration, when the outcome variable is the (latent) volume of healthier products purchased, the impact of the 20% tax on healthier products (own price effect) is represented by 𝛽1, or 𝛽1 + 𝛽2 in the signposted condition. Similarly, the impact of 20% tax on less healthy products (cross price effect) is given by 𝜃1, or 𝜃1 + 𝜃2 in the signpost condition. Note however that the coefficients alone represent the impacts of the interventions on the latent outcome (lnY𝑗𝑡
∗ ), rather than the impacts on
the actual outcome (lnY𝑗𝑡). We are interested in the latter, and hence we re-evaluate the estimated
coefficients to represent the partial effects on the actual outcome.11 The vector 𝐳𝑗 includes various
other variables as discussed. In order to take into account the within-subject correlation in purchasing, we estimate the standard errors of the parameters via block bootstrap, which gives subject-level cluster-robust standard errors (Bertrand et al. 2004; Cameron et al. 2008).
11
This involves weighting of the estimated coefficients by the probability of not being censored.

The impact of taxation and signposting on diet: an online field study with breakfast cereals and soft drinks 9
3. Results
3.1 Sample characteristics
Demographic characteristics of participants are presented in Table 1. The total number of participants was 1,000, with a total of 506 in the Not Signposted treatment and 494 in the Signposted treatment. There were no significant between-treatment differences in these characteristics.12 Demographic characteristics of the sub-sample participating in the shopper diary (N=281) are also presented in Table 1; 128 had participated in the Not Signposted treatment and 153 had participated in the Signposted treatment.13
3.2 Experimental results
The mean quantity purchased across all tasks was 1.5 Kg of cereals and 5.6 litres of soft drinks. Only about 5.6% purchases were zero (5.8% for cereals and 5.4% for soft drinks). When only considering less healthy (healthier) products within each task, the amount of zero purchases was 13.5% (20.7%) for cereals and 13.2% (7.8%) for soft drinks.14 The weighted average price of purchased less healthy (healthier) breakfast cereals was £0.52, WSD: 0.20 (£0.38, WSD: 0.16) per 100g and for soft drinks it was £0.16, WSD: 0.13 (£0.10, SD: 0.11) per 100ml.15 The prices of less healthy products tend to be higher on average than those of healthier products, though the standard deviations are large. Figure 2 shows mean purchases of less healthy (healthier) products when prices of less healthy (healthier) were manipulated. Figures 3 and 4 rely on the econometric model to show the estimated effect and confidence intervals for each price manipulation on the volume of purchases of the taxed products (direct price effects) for cereals and soft drinks, respectively. The model estimates can be found in Tables 2 and 3, while Table 4.1 extracts the key information by presenting price and cross-price effect estimates for less healthy and healthier cereals and soft drinks corresponding to each price manipulation and treatment. While we report the results of regression models with the control variables, the general results remain the same with different combinations of controls or no controls at all. Table 4.2 presents our best price elasticity estimates derived from estimations in Table 4.1, assuming constant and linear price elasticities between 0 and 20% and between 20% and 40% price changes. Mean values and distributions of volumes purchased at baseline prices and each price manipulation are available in the appendix (Figures A.1 to A.4 and Table A.1). Let us first focus on the Not Signposted treatment. Both the 20% and the 40% taxes on less healthy cereals significantly reduced the volume purchased of the taxed products (p<0.01: see Table 4.1), though the effect of the 40% tax was not significantly larger than that of a 20% tax. A 20% tax was sufficient to induce a 48% demand decrease for cereals. For soft drinks, in the Not Signposted
12
Tests employed are Pearson’s 2 (for gender) and the two-sample Mann-Whitney U test for the ratio variables. The
distribution of the ratio variables, which departs considerably from normality justifies using a non-parametric approach. 13
We find some degree of self-selection bias when comparing demographic characteristics of subjects who participated in the shopper diary and those who did not. In particular, those participating in the diary were younger, were more educated, had a larger household income (p<0.001), and there is limited evidence that the proportion of males and the household size were slightly larger (p<0.10). The post hoc nature of these tests require some caution in interpretation; at any rate, none of these variables systematically change our key results, as presented later. Tests employed are the same as above. 14
Two observations out of 5000 are missing in the drinks category, because there was a technical issue with the supermarket platform and two subjects were affected, for which we lost the data corresponding to one drinks task each. 15
Reported weighted average prices and weighted standard deviations (WSD) are based only on products that were part of participants’ shopping basket across all the tasks and weighted based on the quantity purchased (grams for breakfast cereals and millilitres, for soft drinks). The average price of less healthy (healthier) breakfast cereals available for purchase was £0.52, SD: 0.14 (£0.41, SD: 0.26) per 100g and for less healthy (healthier) soft drinks it was £0.22, SD: 0.20 (£0.18, SD: 0.18) per 100ml. The difference between the average price of available healthier soft drinks and the weighted average of healthier soft drinks is most likely due to large quantities of bottled water purchased by participants.

10 CHE Research Paper 131
treatment, a 40% tax was instead required to significantly reduce the purchasing of less healthy soft drinks. Result 1. With no signposting, while a 40% tax always works, a 20% tax is effective in reducing the demand for less healthy products in relation to cereals but not in relation to soft drinks. Let us now consider the Signposted treatment. Again the 20% and the 40% taxes on less healthy cereals significantly reduced the volume purchased of the taxed products (p<0.01), with no difference between the two. A 20% tax was now sufficient to induce a 54% demand decrease for cereals. With signposting, a 20% tax was sufficient to induce a similar (52%) and significant demand decrease for soft drinks (p<0.01). Result 2. With signposting, a 20% tax is sufficient to significantly reduce the demand for less healthy products in relation to both cereals and soft drinks. The effect of taxes on healthier products is obviously less interesting as it is not policy relevant. The picture partially mirrors that of taxes on less healthy products: there are broadly robust price effects. The picture is subtler with respect to signposting. For soft drinks, their effects are significantly negative regardless of signposting, whereas for cereals they are only significant when signposted (p<0.01). More generally, Tables 2 and 3 support a picture where signposting is not generally effective in nudging behavior on its own in relation to soft drinks, whereas it increases the consumption of healthier cereals and reduces that of less healthy cereals. Taken together with the previous results regarding the demand for less healthy products, this leads to a more general result on signposting. Result 3. The effectiveness of signposting may depend on the product category. Cross-price elasticities are interesting because potentially they are one (of course imperfect) way of controlling for compensation effects. If, for example, I see higher prices for less healthy cereals and I buy more healthy cereals, this cannot be explained by the fact that it is a particularly good deal relative to what I can find in an alternative shop. There is no evidence that a tax on less healthy soft drinks increases the consumption of more healthy drinks.16 There is, however, evidence that a tax on less healthy cereals does significantly increase the consumption of healthier cereals, though only for the not signposted category (p<0.05 with a 20% tax). Result 4. For both a 20% and a 40% tax rate, there is a sizeable cross-price effect increase in the purchasing of healthier cereals when a tax on less healthy cereals is introduced and there is no signposting. There is no such cross-price effect for soft drinks. As supplementary findings, and focusing only on ones consistent between cereals and soft drinks, Table 2 and 3 show that men generally bought less healthy cereals and soft drinks than women, and consumers with greater stocks at home bought less unhealthily. Interestingly, we found no robust evidence of greater income and a better education as a predictor for better diet choices, though there is some partial evidence to this effect in relation to soft drinks only. Stocks of food were negatively correlated with purchases of less healthy food. Finally, we checked for potential differences in tax and signposting sensitivity by socioeconomic status, in particular participants’ household income level and educational level. Tables A.2 and A.3 show that the estimated effect of our price manipulations are not statistically different between the lower and the higher income group, while tables A.4 and A.5 show that there were no significant differences in price manipulation sensitivity between the less educated and the more educated
16
There is a curious p < 0.1 decrease in consumption of healthy soft drinks with a 20% tax on less healthy soft drinks, but this finding is not replicated with a 40% tax on less healthy soft drinks.

The impact of taxation and signposting on diet: an online field study with breakfast cereals and soft drinks 11
group (95% confidence intervals for estimated effects overlap). In addition, we found no significant differences when comparing the group with lower and higher body mass index, see tables A.6 and A.7.
3.3 Shopper diary
The mean quantity of purchases recorded over the required week in the shopper diary was 1.6 Kg of cereals, 7.9 litres of soft drinks, and 558 gr of chocolate. A considerable proportion of participants reported no purchases of a given product category, in particular 39.2% for cereals, 21.0% for soft drinks and 27.8% for chocolates.17 In line with our objective, we used these data to check for compensation effects: that is, when an item is taxed in the experimental task, participants may decide not to purchase the item but instead keep the budget and purchase the same or a related item in a grocery outlet afterwards (at a lower price). If this is the case, it would imply that we overestimate the effect of the tax in the experiment. We analyze the data in two ways, details of which are provided in online Appendix B. First, we estimate the correlation between the volume of the products which participants received from the experiment and the volume of products in the same category they bought afterwards (as recorded in the shopping diary). We do not find evidence that the volume of items purchased in the experiment is systematically and negatively correlated with the volume purchased within one week after groceries were received, which would point to compensation effects. Second, we directly estimate the impact of the experimental tax on the volume of items purchased within a week after receipt of the groceries by replacing the dependent variable of the regression model described in section 2.7 with the volume of items purchased within a week after receipt of the groceries, and otherwise using a similar econometric specification except that the total volume of items purchased at the baseline task is additionally controlled for. We do not find evidence that the effect of the tax was compensated by greater purchases of similar products after the groceries were received. In addition, we found no significant increase in the purchase of chocolate in response to the experimental tax on less healthy items. Result 5. The shopping diary data does not detect evidence that lower purchases in the experiment due to the effect of taxes on less healthy products was compensated by higher purchases of less healthy products, within a week after groceries were received.
17
The amount of zero purchases of less healthy (healthier) products was 59.4% (63.7%) for cereals, 56.9% (33.8%) for soft drinks.

The impact of taxation and signposting on diet: an online field study with breakfast cereals and soft drinks 12
Table 1. Baseline characteristics of participants
Treatment
All n Not signposted n Signposted n Diary n
Age, years 1/
46.95 1000 46.72 506 47.18 494 42.82 281
Gender (F), % 54.10
53.75 506 54.45 494 49.82 281
BMI, kg/m2 26.49 983 26.81 487 26.16 496 25.85 277
Education level, %
999
506
493
No qualifications 6.91
5.34
8.52
6.07 280
<5 GCSEs/NVQ Level 1 15.42
15.81
15.01
12.14
5 or more GCSEs/NVQ Level 2/1 A-level 19.62
20.75
18.46
15.71
2 or more A-levels/NVQ Level 3 21.22
19.37
23.12
21.43
Bachelor’s degree 25.23
27.27
23.12
28.93
Post-Graduate degree or qualification 11.61
11.46
11.76
15.71
Household income, %
908
455
453
Up to £15,499 per year 19.71
18.46
20.97
16.03
£15,500–£24,999 per year 23.46
25.05
21.85
19.47
£25,000–£39,999 per year 29.3
28.13
30.46
29.77
£40,000 or more per year 27.53
28.35
26.71
34.73
Household size, n 2.64
2.68
2.59
2.75
Total participants, n
1000
506
494 281

The impact of taxation and signposting on diet: an online field study with breakfast cereals and soft drinks 13
Figure 2. Mean quantity purchased of less healthy (healthier) products when prices of less healthy (healthier) were manipulated
Figure 3. Breakfast cereals: Estimated impact of the taxes on the volume purchased of the taxed products
Notes: Own-price effects that are estimated from the random effects Tobit regression model (see the regression models in Table 2) are presented. The bars show the average percentage change in the volume of purchases in each tax condition, as compared to the baseline condition without any price manipulations. Black bars show the effects when tax was combined with the signposted treatment. 95% confidence intervals are presented in the figure and are based on block-bootstrap cluster robust standard errors at participant level.

14 CHE Research Paper 131
Figure 4. Soft drinks: Estimated impact of the taxes on the volume purchased of the taxed products
Notes: Own-price effects that are estimated from the random effects Tobit regression model (see the regression models in Table 3) are presented. See notes to Figure 3.
Table 2. Impact of taxation and signposting on the log volume of healthier and less healthy breakfast cereals purchased (random effect Tobit model)
Less healthy breakfast cereals
Healthier breakfast cereals
(1) (2)
(3) (4)
Tax less-healthy 20% -0.442*** -0.479*** 0.985*** 1.060**
(0.080) (0.081) (0.366) (0.427)
Interaction with signposted -0.141 -0.109 -0.448*** -0.475***
(0.192) (0.214) (0.139) (0.141)
Tax less-healthy 40% -0.657*** -0.709*** 1.372*** 1.543***
(0.055) (0.050) (0.448) (0.534)
Interaction with signposted -0.322* -0.0945 -0.421*** -0.520***
(0.165) (0.226) (0.148) (0.136)
Tax healthier 20% -0.117 -0.184* 0.111 0.103
(0.111) (0.112) (0.205) (0.220)
Interaction with signposted 0.368 0.601* -0.556*** -0.600***
(0.258) (0.334) (0.115) (0.109)
Tax healthier 40% -0.0195 -0.0514 -0.258* -0.226
(0.148) (0.147) (0.140) (0.163)
Interaction with signposted 0.412 0.609* -0.612*** -0.666***
(0.301) (0.362) (0.107) (0.099)
Signposted -0.423*** -0.444***
2.371*** 2.357***

The impact of taxation and signposting on diet: an online field study with breakfast cereals and soft drinks 15
(0.127) (0.126)
(0.860) (0.868)
Gender (male=1)
-0.368***
-0.288**
(0.122)
(0.144)
Age
-0.0232***
0.0199***
(0.00681)
(0.00728)
Log BMI
-0.177
0.466
(0.579)
(0.584)
In a weight loss diet (yes=1)
0.0529
-0.203
(0.221)
(0.180)
Time preferences (discount)
0.0305
-0.0207
(0.0271)
(0.0297)
Stocks of cereals (days)
-0.0264**
0.00630
(0.0106)
(0.00909)
Online grocery shopping frequency
0.0256
0.0657
(0.0572)
(0.0601)
Tesco shopping frequency
0.0678
-0.0353
(0.0588)
(0.0572)
Accuracy guessing cereal prices
0.187
-0.107
(0.253)
(0.275)
Education level
-0.0411
0.108
(0.0725)
(0.0757)
Household income
0.135
-0.114
(0.0918)
(0.0960)
N Subjects 1000 853
1000 853 Notes: The analysis is based on a random effect Tobit model where each choice made by a subject provides an observation. Partial effects on the observed volume of log purchases are presented. The estimated partial effects are also transformed to represent the proportionate effects. Subject-level cluster-robust standard errors in parentheses (block-bootstrapped, 1000 replications). The number of subjects is smaller in the regressions with controls because of omitted answers to control questions. *** p<0.01, ** p<0.05, * p<0.1

16 CHE Research Paper 131
Table 3. Impact of taxation and signposting on the log volume of healthier and less healthy soft drinks purchased (random effect Tobit model)
Less healthy soft drinks
Healthier soft drinks
(1) (2)
(3) (4)
Tax less-healthy 20% -0.125 -0.147 -0.244* -0.242*
(0.170) (0.183) (0.141) (0.141)
Interaction with signposted -0.459*** -0.450** 0.717 0.506
(0.159) (0.179) (0.454) (0.414)
Tax less-healthy 40% -0.670*** -0.683*** -0.002 -0.064
(0.072) (0.075) (0.206) (0.213)
Interaction with signposted 0.0793 0.173 0.664 0.459
(0.320) (0.393) (0.448) (0.420)
Tax healthier 20% 0.127 0.240 -0.480*** -0.515***
(0.224) (0.265) (0.100) (0.103)
Interaction with signposted 0.245 0.113 0.39 0.311
(0.347) (0.335) (0.396) (0.403)
Tax healthier 40% 0.061 0.0476 -0.502*** -0.503***
-0.21 -0.223 -0.097 -0.102
Interaction with signposted 0.665 0.497 -0.372** -0.347*
(0.453) (0.457) (0.186) (0.207)
Signposted -0.207 -0.196
-0.16 -0.0282
(0.220) (0.243)
(0.213) (0.254)
Gender (male=1)
-0.291*
-0.498***
(0.171)
(0.0968)
Age
-0.0151*
-0.000979
(0.00849)
(0.00702)
Log BMI
-0.653
1.177**
(0.704)
(0.505)
In a weight loss diet (yes=1)
-0.464***
0.211
(0.148)
(0.256)
Time preferences (discount)
-0.0118
0.00322
(0.0331)
(0.0278)
Stocks of soft drinks (days)
-0.0310**
0.00859
(0.0144)
(0.0105)
Online grocery shopping frequency
0.0693
0.0147
(0.0669)
(0.0565)
Tesco shopping frequency
-0.0170
0.113**

The impact of taxation and signposting on diet: an online field study with breakfast cereals and soft drinks 17
(0.0692)
(0.0545)
Accuracy guessing soft drink prices
-2.322**
-1.903*
(1.100)
(1.018)
Education level
-0.153*
0.108
(0.0873)
(0.0784)
Household income
-0.201*
0.201**
(0.117)
(0.101)
N Subjects 1000 853
1000 853 Notes: The analysis is based on a random effect Tobit model where each choice made by a subject provides an observation. Partial effects on the observed volume of log purchases are presented. The estimated partial effects are also transformed to represent the proportionate effects. Subject-level cluster-robust standard errors in parentheses (block-bootstrapped, 1000 replications). The number of subjects is smaller in the regressions with controls because of omitted answers to control questions. *** p<0.01, ** p<0.05, * p<0.1.
Table 4.1. Estimated price effects
Breakfast cereals
Soft drinks
Less healthy Healthier
Less healthy Healthier
Own tax 20% (0.2) -0.479***
0.103
-0.147 -0.515***
(0.081)
(0.220)
(0.183) (0.103)
Own tax 20% (0.2) in
signposted intervention -0.536***
-0.560***
-0.531*** -0.365**
(0.083)
(0.084)
(0.114) (0.146)
Own tax 40% (0.2) -0.709***
-0.226
-0.683*** -0.503***
(0.050)
(0.163)
(0.075) (0.102)
Own tax 40% (0.4) in
signposted intervention -0.736***
-0.741***
-0.628*** -0.675***
(0.048)
(0.054)
(0.087) (0.078)
Cross tax 20% (0.2)3/
-0.184*
1.060**
0.240 -0.242*
(0.112)
(0.427)
(0.265) (0.141)
Cross tax 20% (0.2) in
signposted intervention 0.306
0.0821
0.38 0.142
(0.201)
(0.191)
(0.314) (0.235)
Cross tax 40% (0.4) -0.0514
1.543***
0.048 -0.064
(0.147)
(0.534)
(0.223) (0.213)
Cross tax 40% (0.4) in
in signposted intervention 0.526**
0.221
0.568* 0.365
(0.244)
(0.230)
(0.335) (0.247)
Control variables Yes
Yes
Yes Yes
Notes: The results are based on models (2) and (4), presented in Tables 2 and 3. Partial effects on the observed volume of log purchases are presented. The estimated partial effects are also transformed to represent the proportionate effects. ‘Cross tax’ effect refers to the effect on the volume of healthier (less healthy) products purchased when the less healthy (healthier) products were taxed. *** p<0.01, ** p<0.05, * p<0.1

18 CHE Research Paper 131
Table 4.2 Price elasticity (% change in demand in response to a 1% change in price) as implied by the estimated impact of the tax
Breakfast cereals
Soft drinks
Less healthy Healthier
Less healthy Healthier
Tax within the range 0 - 20% -2.40 -
- -2.58
Tax within the range of 0 - 20% in signposted condition
-2.68 -2.80
-2.66 -1.83
Tax within the range 20 - 40% -1.15 -1.13
-3.42
Tax within the range of 20 - 40% in signposted condition
-1.00 -0.90
-0.49 -1.55
Notes: The elasticities reported on the table are based on the assumptions of constant and linear values for 20% brackets. Therefore for the 0 - 20 % range we divided our point estimate of tax impact by 20. To obtain the range between 20% and 40%, we calculated the slope between the point estimate for 20% and the point estimate for the corresponding 40% tax. Missing elasticities represent estimations that were not statistically different from zero, as can be seen in Table 4.1. In order to calculate the elasticity between the range 20 to 40%, in those cases we assumed the point estimate to be zero.

The impact of taxation and signposting on diet: an online field study with breakfast cereals and soft drinks 19
4. Discussion
Do taxes on less healthy products lead to healthier diet choices in relation to breakfast cereals and soft drinks? The broad answer from our study is a clear yes, and quite independently of signposting. However, in the case of cereals, our findings suggest that signposting does seem to affect whether such taxes increase the purchasing of more healthy cereals (non-signposted case) or just reduce that of the less healthy cereals (signposted case). Does signposting matter? The broad answer is that it depends, both on the product category and what we are trying to achieve. We did not find that it matters in the context of a tax on less healthy soft drinks. In the context of cereals, if the goal is to reduce the demand of less healthy cereals, there is clear evidence of a potentially substantial effect. This confirms the notion of imperfect demand optimization in diet-related behavior (see DellaVigna, 2009, for a review of applications in other fields). Our results show that the magnitude of this effect is potentially substantial, and would lend itself to a fairly straightforward, inexpensive policy implication – that food-related taxation could be more effective when it is combined with signposting on the price tag.18 The implementation of such a complementary ‘nudge’ policy would enhance the impact of the tax without imposing severe welfare loss, though we should recognize that its effectiveness may depend on the product category. The further qualification to this is that the consumption of healthier cereals would not be increased in case of signposting – this may or may not be problematic depending on a more comprehensive evaluation of optimal dietary choices. Our results are based on real purchases of a nationally representative sample of 1,000 consumers in the UK, the largest sample we are aware of for tax field studies on diet. The large sample size and representativeness of the data, combined with experimental control over price and signposting variations as well as controls for compensation effects and a range of other factors, should provide more credible estimates of the impact of the tax on food and beverages, and should thus credibly inform the current policy debate on the subject. Own-price effects. We recognize that our estimates of the own-price effects are larger than what has been found in previous research (Briggs et al. 2013; Andreyeva et al. 2010).19 In comparison to our around 50% drop in demand for a 20% tax, Nevo (2001) found that the elasticity is on average -1.53 in the US ready-to-eat cereals market, i.e. assuming linearity, a 20% and 40% tax would lead to a reduction in purchases by about 30% and 60%, respectively. Our results do suggest that the marginal effect of taxation diminishes as the tax rate is raised from 20% to 40%, for both cereals and soft drinks. Existing econometric studies typically assume a linear relationship between price and demand. Although this simplification is practical, our evidence demonstrates that this is unlikely the case for grocery products and, hence, nonlinearities should be allowed for in estimating the effect of food-related tax reform. Our shopping diary data is not conclusive regarding the absence of any compensation effects, which of course may take place over a period longer than one week after receipt of the groceries, and may involve other product categories. We cannot therefore entirely rule out that our elasticities may be overestimated because of potential compensation effects. However, the evidence we have does not point in that direction, as (for example) we did not find a correlation between a reduction in less
18
Waterlander et al. (2013) finds that the impact of subsidy on fruits and vegetables becomes greater when it is combined with an educational intervention. 19
Note that the fact that we have pre-filtered the sample for participants with latent demand does not explain why there is a higher estimate than in econometric studies estimates, as these are based on empirical demand functions that, by definition, rely on latent demand (e.g., if you never buy cereals, you will not affect the slope of the demand for cereals function).

20 CHE Research Paper 131
healthy soft drinks purchases in the study and an increase in less healthy soft drinks purchases at least in the one week after the groceries were received. Note that this is not because participants treated the experimental task in artificial isolation; the strong negative correlation between stocks of soft drinks/cereals and experimental purchases is clear evidence that this was not the case. The existence of uncontrolled compensation effects is nevertheless the greatest source of potential upward bias in the size of the effects, and something worth investigating further in future research. Our results should be considered as evidence for the effectiveness of taxation but less so as evidence for the specific quantitative size of the effect, which obviously needs to be seen in complement with other and non-experimental evidence. That said, we need to recognize that the current non-experimental evidence does not necessarily address the compensation effect problem. We do not know the extent to which, for example, Mexican consumers have replaced sugar consumption with equally harmful sugar surrogates. One other potential limitation of our analysis is that participants may be subject to house money effects, namely they may behave differently if the money is just given to them – as it was in our setup – as opposed to being earned. However, in a pilot we ran with university students at the University of East Anglia, we tested for house money effects and found no evidence of them in our setting (details available on request). We therefore opted for simplicity in the online study design. Cross-price effects. Our estimates for cross-price effects within the categories show a nuanced picture, with mostly nonsignificant cross price effects. Yang and Chiou (2010) estimate the cross-price elasticity within the soft-drink category (divided by healthier and less healthy products) to be 0.53 to 0.69. Our data do not allow us to examine substitutions between dietary categories. Cornelsen et al. (2015b), however, show that between-category cross-price elasticity of cereals is modest (ranging from 0 up to 0.1).20 Socioeconomic differences. Our results also show no significant difference in the impacts of taxes between socioeconomic groups. Briggs et al. (2013) also predict no significant difference in the impact of sugar sweetened drink tax in the UK, and Blakely et al. (2011) do not find that the impact of a subsidy on fruit and vegetables differs by income and education group in their randomized control trial in New Zealand. In contrast to Goldin and Homonoff’s (2013) study on purchasing of tobacco, we do not find significant differences in the effect of the signposting intervention across different socioeconomic groups. Therefore, our results do not support the claim that diet-related taxation (with or without signposting) would reduce socioeconomic inequalities in diet and related health outcomes. Neither though would our results give rise to the concern that such inequalities would increase. Taken literally, this would imply that taxation could improve overall population diet without having to incur the cost of widening socioeconomic inequalities in diet (and related health outcomes). There are not many population level preventive interventions out there, and even far less curative and screening interventions, that would share this favourable characteristic (Capewell and Graham 2010). One potential concern is that the tax may be regressive in making consumers with less income proportionally even poorer. However, in our sample we find that on average less healthy soft drinks and cereals are at least as expensive if not more expensive than healthier alternatives. To the extent that there is a non-negative ‘unhealthy premium,’ discouraging consumers from purchasing less healthy food relative to alternatives may leave consumers with at least as great or greater purchasing power.
20
The comparison to the (cross-)price elasticities on cereals from Cornelsen et al (2015b) should be drawn with caution, in that the breakfast cereals we consider here make up only a small share of the category they define as “cereals” (i.e. cereals, bread, bakery, grains, flour, maize, noodles, pasta, rice).

The impact of taxation and signposting on diet: an online field study with breakfast cereals and soft drinks 21
Policy implementation. A policy implementation of a tax on less healthy food and drinks would obviously need to make choices on which products should be taxed (whether that be based on the FSA Nutrition score) or some other criterion. If the tax is based on a nutrient attribute, industry may modify the attribute to avoid it, i.e. pass-through should not be considered as automatic. Ito and Sallee (2014) found that this has happened in the market of cars, where a fuel economy tax is levied based on the size/weight of the car. Grogger (2015) looked at the tax pass-through of the Mexican soda tax, and found that, in the short run, the price of sodas actually increased by more than the amount of the tax. A related policy question is the value of the optimal tax rate. The maximum level of the tax that has been considered by policy makers is 20%, and obviously there are good reasons not to tax more than is needed. Our finding of a nonlinear impact of taxation provides some support to a tax rate of 20% rather than a higher value, though this depends on the rate of tax pass-through as well. Further research could look in a more nuanced way at the impact of tax rates up to 20% to identify where the greatest marginal gains in terms of increase tax rate are obtained.

22 CHE Research Paper 131
5. Conclusions
We have presented an online study with a representative sample of 1,000 U.K. consumers to investigate the effect of taxation targeted at improving diet. The specific categories we considered were breakfast cereals and soft drinks. Our study was innovative in a number of ways: the representative and large nature of the sample; the use of real as opposed to hypothetical choices; the focus on taxation, and combination of taxation with signposting; and the attempt to at least partially control for compensation effects with purchases in other shopping outlets. When the taxes were signposted to consumers, both the 20% and 40% rates reduced purchase volume of all the products they were applied to. When the taxes were not signposted, reductions in purchase volume were only seen in less healthy cereals and healthier soft drinks at 20% taxation, and in less healthy cereals and all soft drinks at 40% taxation. There were no differences in effects from taxation between socioeconomic groups, and we had a first, albeit partial, test for compensation effects with later grocery purchases. Our evidence is consistent with the conclusion that taxes on soft drinks or cereals are an effective means of altering purchases, with a 20% rate being sufficient to make a significant impact. It should be considered together with observational studies, such as Colchero et al.’s (2016) analysis of the Mexican case, in terms of estimation of the size of the effects. Signposting represents a complementary ‘nudge’ policy that could enhance the impact of the tax without imposing severe welfare loss, though the effectiveness may depend on the product category.

The impact of taxation and signposting on diet: an online field study with breakfast cereals and soft drinks 23
References
Action on Sugar. 2015. Cereals Still Stuffed with Sugar. Available at: http://www.actiononsalt.org.uk/actiononsugar/Press%20Release%20/146899.html Andreyeva T, Long MW, Brownell KD. 2010. The impact of food prices on consumption: A systematic review of research on the price elasticity of demand for food. American Journal of Public Health 2010;100(2):216. Ball K, McNaughton SA, Le HND, Gold L, Mhurchu CN, Abbott G, Pollard C, Crawford D. 2015. Influence of price discounts and skill-Building strategies on purchase and consumption of healthy food and beverages: Outcomes of the supermarket healthy eating for life randomized controlled Trial. American Journal of Clinical Nutrition 2015;101(5):1055-64. Bertrand M, Duflo E, Mullainathan S. How much should we trust differences-in-differences estimates? The Quarterly Journal of Economics 2004:119(1):249-75. Blakely T. 2014. Would a Sugary Fizzy Drink Tax Reduce Health Inequalities? Probably Yes. Available at: https://blogs.otago.ac.nz/pubhealthexpert/2014/06/19/would-a-sugary-fizzy-drink-tax-reduce-health-inequalities-probably-yes/ Blakely T, Mhurchu CN, Jiang Y, Matoe L, Funaki-Tahifote M, Eyles HC, Foster RH, McKenzie S, Rodgers A. Do effects of price discounts and nutrition education on food purchases vary by ethnicity, income and education? Results from a randomised, controlled trial. Journal of Epidemiology & Community Health 2011;65(10):902-8. Bonnet C, Réquillart V. Tax incidence with strategic firms in the soft drink market. Journal of Public Economics 2013;106(0):77-88. Briggs ADM, Mytton OT, Kehlbacher A, Tiffin R, Rayner M, Scarborough P. Overall and income specific effect on prevalence of overweight and obesity of 20% sugar sweetened drink tax in uk: Econometric and comparative risk assessment modelling study. British Medical Journal 2013;347. Cameron AC, Gelbach JB, Miller DL. Bbootstrap-based improvements for inference with clustered errors. The Review of Economics and Statistics 2008;90(3):414-27. Capewell S, Graham H. Will cardiovascular disease prevention widen health inequalities? PLoS Medicine 2010;7(8):e1000320. Cawley J, Frisvold D. The Incidence of Taxes on Sugar-Sweetened Beverages: The Case of Berkeley, California. National Bureau of Economic Research. 2015. Chetty R, Looney A, Kroft K. Salience and taxation: theory and evidence. American Economic Review 2009;99(4):1145-77. Colchero MA, Popkin BM, Rivera JA, Ng SW. Beverage purchases from stores in Mexico under the excise tax on sugar sweetened beverages: observational study. British Medical Journal 2016;352:h6704. Cornelsen L, Carreido A. Health-Related Taxes on Foods and Beverages. Food Research Collaboration Policy Brief. 2015.

24 CHE Research Paper 131
Cornelsen L, Green R, Dangour A, Smith R. Why fat taxes won't make us thin. Journal of Public Health 2015a;37(1):18-23. Cornelsen L, Green R, Turner R, Dangour AD, Shankar B, Mazzocchi M, Smith RD. What happens to patterns of food consumption when food prices change? evidence from a systematic review and meta-analysis of food price elasticities globally. Health Economics 2015b;24(12):1548-59. Davis DD, Holt CA. Experimental Economics. Princeton University Press. 1993. DellaVigna S. Psychology and economics: evidence from the field. Journal of Economic Literature 2009;47(2):315-72. Ells LJ, Roberts K, McGowan VJ, Machaira T. Sugar reduction: the evidence for action. Public Health England. 2015. Epstein LH, Dearing KK, Paluch RA, Roemmich JN, Cho D. Price and maternal obesity influence purchasing of low- and high-energy-dense foods. American Journal of Clinical Nutrition 2007;86(4):914-22. Eyles H, Mhurchu CN, Nghiem N, Blakely T. Food pricing strategies, population diets, and non-communicable disease: a systematic review of simulation studies. PLoS Medicine 2012;9(12):e1001353. Février P, Visser M. A study of consumer behavior using laboratory data. Experimental Economics 2004, 7(1), 93-114. Fitt E, Cole D, Ziauddeen N, Pell D, Stickley E, Harvey A, Stephen AM. DINO (Diet In Nutrients Out) - an integrated dietary assessment system. Public Health Nutrition 2014;2014:1-8. Forwood SE, Ahern AL, Marteau TM, Jebb SA. Offering within-category food swaps to reduce energy density of food purchases: a study using an experimental online supermarket. International Journal of Behavior, Nutrition and Physical Activity 2015;12:85. Giesen JC, Payne CR, Havermans RC, Jansen A. Exploring how calorie information and taxes on high-calorie foods influence lunch decisions. American Journal of Clinical Nutrition 2011;93(4):689-94. Goldin J, Homonoff T. Smoke gets in your eyes: cigarette tax salience and regressivity. American Economic Journal: Economic Policy 2013;5(1):302-36. Green R, Cornelsen L, Dangour AD, Turner R, Shankar B, Mazzocchi M, Smith RD. The effect of rising food prices on food consumption: systematic review with meta-regression. BMJ 2013:346. Grogger J. Soda Taxes and the Prices of Sodas and Other Drinks: Evidence from Mexico National Bureau of Economic Research. Working Paper no. 21197. 2015. Harrison GW, Lau MI, Williams MB. Estimating individual discount rates in denmark: a field experiment. The American Economic Review 2002;92(5):1606-17. Hollands G, Shemilt I, Marteau TM, Jebb SA, Kelly MP, Nakamura R, Suhrcke M, Ogilvie D. Altering micro-environments to change population health behaviour: towards an evidence base for choice architecture interventions. BMC Public Health 2013;13(1):1218.

The impact of taxation and signposting on diet: an online field study with breakfast cereals and soft drinks 25
Ioannidis JPA. Implausible results in human nutrition research. BM J 2013;347:f6698. Isoni A. 2011. The willingness-to-accept/willingness-to-pay disparity in repeated markets : loss aversion or 'bad-deal' aversion? Theory and Decision 2011;71(3):409-430. Ito K, Sallee JM. The economics of attribute-based regulation: theory and evidence from fuel-economy standards. National Bureau of Economic Research. 2014. Lawlor DA, Smith GD, Bruckdorfer KR, Kundu D, Ebrahim S. Those confounded vitamins: what can we learn from the differences between observational versus randomised trial evidence? The Lancet 2004;363(9422):1724-1727. Lobstein T, Davies S. 2009. Defining and labelling ‘healthy’and ‘unhealthy’food. Public Health Nutrition 2009;12(03):331-40. Marteau TM, Ogilvie D, Roland M, Suhrcke M, Kelly MP. Judging nudging: Can nudging improve population health? BMJ 2011;342. McKevitt F. Sainsbury’s the Only One of the ‘Big Four’ Retailers to Increase Sales. 2015.Available at http://uk.kantar.com/consumer/shoppers/2015/august-kantar-worldpanel-uk-grocery-share/ Mytton OT, Clarke D, Rayner M. Taxing unhealthy food and drinks to improve health. BMJ 2012;344:e2931. Nakamura R, Suhrcke M, Jebb SA, Pechey R, Almiron-Roig E, Marteau TM. Price promotions on healthier compared with less healthy foods: a hierarchical regression analysis of the impact on sales and social patterning of responses to promotions in great britain. American Journal of Clinical Nutrition 2015;101(4):808-16. Nevo A. Mergers with differentiated products: the case of the ready-to-eat cereal industry. Rand Journal of Economics 2000;31(3):395-421. Nevo A. Measuring market power in the ready‐to‐eat cereal industry. Econometrica 2001;69(2):307-42. Powell LM, Chaloupka FJ. Food prices and obesity: evidence and policy implications for taxes and subsidies. Milbank Quarterly 2009;87(1):229-57. Public Health England. 2015. Sugar Reduction: The Evidence for Action. Rayner M, Scarborough P, Boxer A, Stockley L. Nutrient Profiles: Development of Final Model. London: Food Standards Agency. 2005. Sharma A, Hauck K, Hollingsworth B, Siciliani L. The effects of taxing sugar-sweetened beverages across different income groups. Health Economics 2014;23(9):1159-1184. Snowdon C. 2015. A tax on sugar won’t work, as the shipwreck of the Danish ‘fat tax’ shows. Spectator; 2015:May 22. http://health.spectator.co.uk/a-tax-on-sugar-wont-work-as-the-shipwreck-of-the-danish-fat-tax-shows/

26 CHE Research Paper 131
Sunstein CR, Thaler RH. Nudge: Improving Decisions About Health, Wealth and Happiness. Penguin UK. 2009. Sussman AB, Olivola CY. Axe the tax: taxes are disliked more than equivalent costs. Journal of Marketing Research 2011;48(Special Issue): S91-S101. Tedstone A, Targett V, Allen R. Sugar reduction: The evidence for action. Public Health England: 2015. Thow AM, Downs S, Jan S. A systematic review of the effectiveness of food taxes and subsidies to improve diets: understanding the recent evidence. Nutrition Reviews 2014;72(9):551-65. Wareham N, Jebb SA. What is the Evidence Base for Various Fiscal Measures? Cambridge: 2015. http://www.cedar.iph.cam.ac.uk/wp-content/uploads/2014/04/HoC-Health-follow-up-info-Feb-2015-financial-final.pdf Waterlander WE, Steenhuis IH, de Boer MR, Schuit AJ, Seidell JC. The effects of a 25% discount on fruits and vegetables: results of a randomized trial in a three-dimensional web-based supermarket. International Journal of Behavior, Nutrition and Physical Activity 2012a;9:11. ____.. Introducing taxes, subsidies or both: the effects of various food pricing strategies in a web-based supermarket randomized trial. Preventive Medicine 2012b;54(5):323-30. ____.. Effects of different discount levels on healthy products coupled with a healthy choice label, special offer label or both: results from a web-based supermarket experiment. International Journal of Behavior, Nutrition and Physical Activity 2013;10:59. Which? Oh Sugar! Why Can’t Breakfast Cereals be Healthier? 2012. Available at: http://conversation.which.co.uk/food-drink/healthy-breakfast-cereals-salt-sugar-content/ Williamson CS. Breakfast Cereals – Why All the Bad Press? , Facts behind the headlines. London, UK British Nutrition Foundation. 2010. Wooldridge J, Jeffrey M. Econometric Analysis of Cross Section and Panel Data. MIT press. 2010. Yang C-C, Chiou W-B. Substitution of healthy for unhealthy beverages among college students. a health-concerns and behavioral-economics perspective. Appetite 2010;54(3);512-6. Zizzo DJ. Experimenter demand effects in economic experiments. Experimental Economics 2010;13(1):75-98.

The impact of taxation and signposting on diet: an online field study with breakfast cereals and soft drinks 27
Appendix A. Additional figures and tables
Fig A.1 Volume of less healthy breakfast cereals purchased. Graphs by price manipulation and treatment: (a) to (e) signposted; (f) to (j) not-signposted
Fig A.2 Volume of healthier breakfast cereals purchased. Graphs by price manipulation and treatment: (a) to (e) signposted; (f) to (j) not-signposted
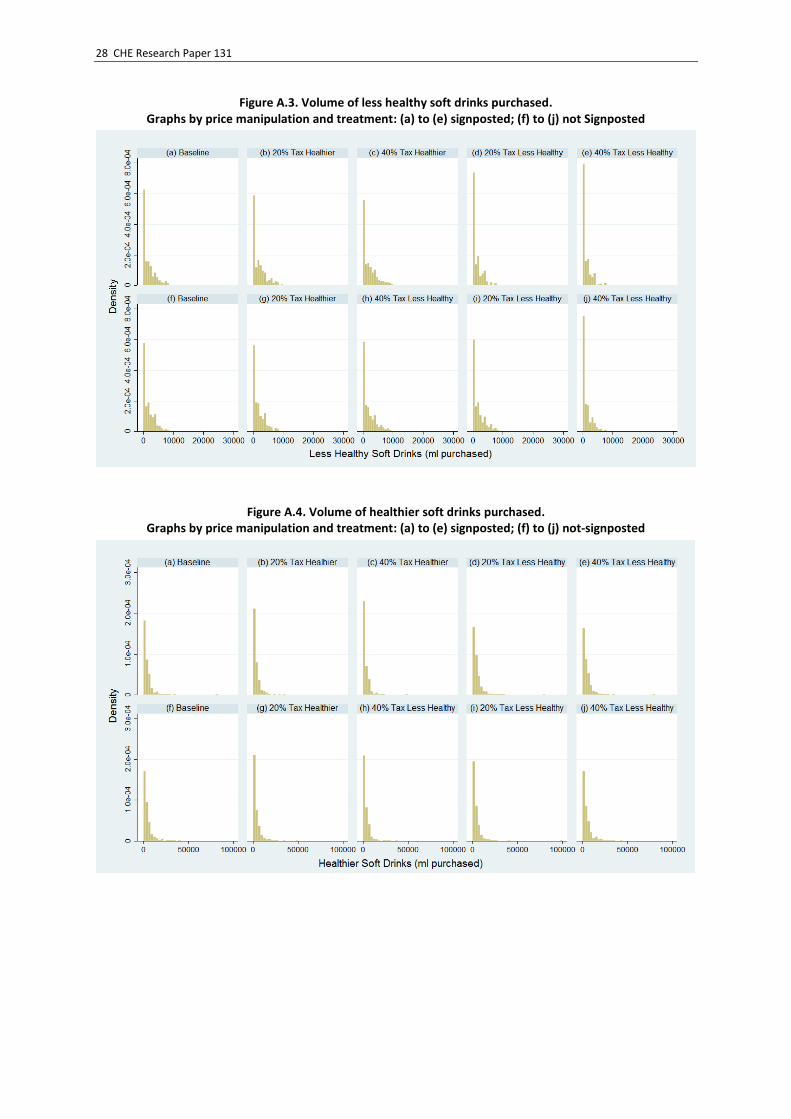
28 CHE Research Paper 131
Figure A.3. Volume of less healthy soft drinks purchased. Graphs by price manipulation and treatment: (a) to (e) signposted; (f) to (j) not Signposted
Figure A.4. Volume of healthier soft drinks purchased. Graphs by price manipulation and treatment: (a) to (e) signposted; (f) to (j) not-signposted

The impact of taxation and signposting on diet: an online field study with breakfast cereals and soft drinks 29
Table A.1 Mean volume of products purchased
Treatment
Signposted Not signposted
Price manipulation
Volume less healthy Volume healthier
Volume less healthy Volume healthier
Breakfast cereals (grams)
Baseline
813.74 ± 691.62 893.69 ± 945.66
891.51 ± 688.65 587.9 ± 763.28
20% tax healthier
873.53 ± 703.26 687.50 ± 796.07
868.66 ± 692.46 601.93 ± 733.39
40% tax healthier
921.05 ± 746.90 529.83 ± 653.27
902.14 ± 713.59 491.49 ± 644.48
20% tax less healthy
596.72 ± 569.99 940.07 ± 940.28
682.91 ± 558.63 770.39 ± 855.49
40% tax less healthy
483.38 ± 519.66 1,011.04 ± 976.94
579.18 ± 532.97 790.23 ± 870.00
Soft drinks (millilitres)
Baseline
1,757.37 ± 2,353.39 4,060.87 ± 5,739.97
1,756.28 ± 2,238.03 4,429.20 ± 5,606.56
20% tax healthier
2,029.01 ± 2,497.30 3,384.31 ± 4,336.70
1,830.94 ± 2,318.24 3,553.93 ± 5,010.78
40% tax healthier
2,187.08 ± 2,663.76 2,804.56 ± 4,056.63
1,914.02 ± 2,390.07 3,258.98 ± 4,332.75
20% tax less healthy
1,327.33 ± 1,955.33 4,522.09 ± 6,194.51
1,778.79 ± 2,204.05 3,946.48 ± 6,414.70
40% tax less healthy
1,115.59 ± 1,660.54 4,734.86 ± 6,142.03
1,208.71 ± 1,914.59 4,539.86 ± 5,704.49
Note: Means ± Standard deviation.

30 CHE Research Paper 131
Table A.2: Estimated tax effects for breakfast cereals by household income
Notes: The samples are split at the median of ‘household income’ (lower income= less than £25.000 per year). The coefficients represent the partial effects on the observed outcome (log volume of products purchased), corrected to represent proportionate changes. 95% confidence intervals based on block bootstrap cluster robust standard errors in brackets. Control variables used in models (3), (4), (7) and (8) are the same as in Table 2, models (2) and (4), except for ‘household income’ now being excluded from the model. ‘Cross tax’ effect refers to the effect on the volume of healthier (less healthy) products purchased when the less healthy (healthier) products were taxed. *** p<0.01, ** p<0.05, * p<0.1
Lower Income Higher Income Lower Income Higher Income Lower Income Higher Income Lower Income Higher Income
(1) (2) (3) (4) (5) (6) (7) (8)
20% own Tax -0.512*** -0.392*** -0.568*** -0.426*** 0.288 0.0119 0.296 0.0159
[-0.724,-0.301] [-0.633,-0.151] [-0.760,-0.377] [-0.654,-0.199] [-0.467,1.044] [-0.463,0.487] [-0.468,1.059] [-0.472,0.504]
20% own Tax in -0.466*** -0.554*** -0.521*** -0.557*** -0.416** -0.557*** -0.464*** -0.545***
signposted intervention [-0.770,-0.162] [-0.732,-0.377] [-0.803,-0.239] [-0.747,-0.368] [-0.744,-0.089] [-0.760,-0.355] [-0.755,-0.173] [-0.756,-0.335]
40% own Tax -0.696*** -0.629*** -0.717*** -0.677*** -0.116 -0.337** -0.001 -0.334**
[-0.850,-0.543] [-0.773,-0.485] [-0.864,-0.570] [-0.800,-0.555] [-0.638,0.405] [-0.640,-0.0344] [-0.634,0.633] [-0.660,-0.008]
40% own Tax in -0.798*** -0.745*** -0.807*** -0.728*** -0.601*** -0.768*** -0.674*** -0.778***
signposted intervention [-0.916,-0.680] [-0.848,-0.643] [-0.924,-0.691] [-0.842,-0.614] [-0.835,-0.367] [-0.885,-0.651] [-0.868,-0.480] [-0.896,-0.660]
20% cross Tax -0.238 -0.0302 -0.255* -0.075 0.708 1.175** 0.852 1.375**
[-0.525,0.0502] [-0.358,0.297] [-0.541,0.030] [-0.405,0.255] [-0.335,1.751] [0.160,2.191] [-0.273,1.978] [0.262,2.488]
20% cross Tax in 0.382 0.105 0.443 0.147 0.035 0.135 -0.00637 0.148
signposted intervention [-0.257,1.021] [-0.287,0.496] [-0.209,1.094] [-0.268,0.561] [-0.509,0.579] [-0.315,0.584] [-0.565,0.553] [-0.320,0.616]
40% cross Tax 0.11 -0.096 0.0236 -0.146 1.749* 1.156** 1.925* 1.221**
[-0.358,0.578] [-0.438,0.246] [-0.419,0.466] [-0.476,0.184] [-0.058,3.556] [0.156,2.156] [-0.019,3.868] [0.212,2.229]
40% cross Tax in 0.0369 0.668** 0.138 0.728** 0.0906 0.583* 0.0448 0.593
signposted intervention [-0.493,0.567] [0.0915,1.245] [-0.464,0.739] [0.106,1.350] [-0.515,0.696] [-0.0813,1.246] [-0.527,0.616] [-0.116,1.301]
Control variables No No Yes Yes No No Yes Yes
N 392 608 368 567 392 608 368 567
95% confidence intervals in brackets
* p<0.10, ** p<0.05, *** p<0.01
Less healthy breakfast cereals Healthier breakfast cereals
Manipulation

The impact of taxation and signposting on diet: an online field study with breakfast cereals and soft drinks 31
Table A.3: Estimated tax effects for soft drinks by household income
Notes: The samples are split at the median of ‘household income’ (lower income= less than £25.000 per year). The coefficients represent the partial effects on the observed outcome (log volume of products purchased), corrected to represent proportionate changes. 95% confidence intervals based on block bootstrap cluster robust standard errors in brackets. Control variables used in models (3), (4), (7) and (8) are the same as in Table 2, models (2) and (4), except for ‘household income’ now being excluded from the models. ‘Cross tax’ effect refers to the effect on the volume of healthier (less healthy) products purchased when the less healthy (healthier) products were taxed. *** p<0.01, ** p<0.05, * p<0.1
Lower Income Higher Income Lower Income Higher Income Lower Income Higher Income Lower Income Higher Income
(1) (2) (3) (4) (5) (6) (7) (8)
20% own Tax 0.0719 -0.235 0.193 -0.253 -0.192 -0.607*** -0.216 -0.588***
[-0.564,0.708] [-0.604,0.133] [-0.546,0.932] [-0.634,0.128] [-0.667,0.282] [-0.796,-0.419] [-0.727,0.296] [-0.795,-0.380]
20% own Tax in -0.420** -0.582*** -0.385* -0.569*** -0.497*** -0.0857 -0.508*** -0.157
signposted intervention [-0.833,-0.00625] [-0.809,-0.356] [-0.829,0.0599] [-0.820,-0.319] [-0.821,-0.173] [-0.546,0.375] [-0.837,-0.179] [-0.614,0.301]
40% own Tax -0.708*** -0.642*** -0.704*** -0.654*** -0.371** -0.569*** -0.322 -0.593***
[-0.899,-0.518] [-0.834,-0.451] [-0.903,-0.504] [-0.848,-0.460] [-0.742,-0.002] [-0.775,-0.364] [-0.739,0.0945] [-0.790,-0.396]
40% own Tax in -0.584*** -0.676*** -0.640*** -0.646*** -0.707*** -0.673*** -0.665*** -0.695***
signposted intervention [-0.890,-0.279] [-0.845,-0.507] [-0.914,-0.366] [-0.833,-0.458] [-0.904,-0.509] [-0.862,-0.484] [-0.893,-0.436] [-0.879,-0.512]
20% cross Tax 0.18 0.094 0.257 0.115 -0.123 -0.312** -0.109 -0.306**
[-0.546,0.906] [-0.449,0.637] [-0.546,1.061] [-0.469,0.698] [-0.714,0.468] [-0.610,-0.0145] [-0.693,0.475] [-0.598,-0.0145]
20% cross Tax in 0.72 0.237 0.844 0.326 0.163 0.393 0.152 0.421
signposted intervention [-0.394,1.834] [-0.367,0.841] [-0.378,2.066] [-0.397,1.050] [-0.476,0.802] [-0.311,1.097] [-0.455,0.760] [-0.328,1.170]
40% cross Tax 0.0488 0.067 0.153 0.108 0.118 -0.0693 0.113 -0.127
[-0.584,0.681] [-0.463,0.597] [-0.527,0.833] [-0.473,0.689] [-0.717,0.953] [-0.506,0.367] [-0.699,0.925] [-0.541,0.288]
40% cross Tax in 0.832 0.724 0.707 0.666 0.483 0.787* 0.526 0.575
signposted intervention [-0.242,1.906] [-0.146,1.594] [-0.312,1.726] [-0.187,1.520] [-0.278,1.245] [-0.0235,1.598] [-0.295,1.347] [-0.166,1.315]
Control variables No No Yes Yes No No Yes Yes
N 392 608 368 567 392 608 368 567
Manipulation
Less healthy soft drinks Healthier soft drinks

32 CHE Research Paper 131
Table A.4: Estimated tax effects for breakfast cereals by education level
Notes: The samples are split at the median of ‘educational level’. The coefficients represent the partial effects on the observed outcome (log volume of products purchased), corrected to represent proportionate changes. 95% confidence intervals based on block bootstrap cluster robust standard errors in brackets. Control variables used in models (3), (4), (7) and (8) are the same as in Table 2, models (2) and (4), except for ‘educational level’ now being excluded from the models. ‘Cross tax’ effect refers to the effect on the volume of healthier (less healthy) products purchased when the less healthy (healthier) products were taxed. *** p<0.01, ** p<0.05, * p<0.1
No University degree University
No University
degree University No University degree University No University degree University
(1) (2) (3) (4) (5) (6) (7) (8)
20% own Tax -0.470*** -0.398*** -0.476*** -0.484*** 0.116 0.103 -0.00717 0.283
[-0.679,-0.260] [-0.653,-0.143] [-0.696,-0.257] [-0.716,-0.252] [-0.372,0.604] [-0.549,0.755] [-0.499,0.485] [-0.507,1.073]
20% own Tax in -0.458*** -0.624*** -0.499*** -0.593*** -0.363** -0.692*** -0.496*** -0.666***
signposted intervention [-0.699,-0.216] [-0.819,-0.429] [-0.723,-0.275] [-0.820,-0.366] [-0.646,-0.0803] [-0.867,-0.517] [-0.734,-0.257] [-0.872,-0.459]
40% own Tax -0.589*** -0.742*** -0.665*** -0.763*** -0.177 -0.369** -0.0985 -0.381**
[-0.751,-0.427] [-0.866,-0.617] [-0.810,-0.520] [-0.877,-0.649] [-0.578,0.223] [-0.730,-0.00857] [-0.574,0.377] [-0.748,-0.0147]
40% own Tax in -0.808*** -0.668*** -0.781*** -0.629*** -0.670*** -0.776*** -0.716*** -0.789***
signposted intervention [-0.895,-0.720] [-0.851,-0.485] [-0.882,-0.680] [-0.841,-0.418] [-0.825,-0.514] [-0.907,-0.645] [-0.867,-0.564] [-0.941,-0.637]
20% cross Tax -0.128 -0.0998 -0.178 -0.194 0.975** 1.000* 1.034* 1.106*
[-0.418,0.161] [-0.466,0.266] [-0.466,0.110] [-0.549,0.161] [0.00531,1.944] [-0.110,2.110] [-0.00956,2.079] [-0.117,2.329]
20% cross Tax in 0.207 0.21 0.262 0.39 0.268 -0.16 0.188 -0.0777
signposted intervention [-0.192,0.605] [-0.386,0.807] [-0.179,0.703] [-0.331,1.111] [-0.267,0.804] [-0.583,0.264] [-0.362,0.739] [-0.559,0.404]
40% cross Tax 0.0196 -0.0766 -0.0164 -0.0992 1.219** 1.627** 1.529** 1.560**
[-0.381,0.420] [-0.461,0.308] [-0.423,0.390] [-0.503,0.305] [0.0544,2.384] [0.196,3.058] [0.0822,2.975] [0.149,2.972]
40% cross Tax in 0.188 0.842* 0.273 1.096* 0.654* -0.0202 0.337 0.04
signposted intervention [-0.235,0.611] [-0.143,1.827] [-0.219,0.765] [-0.0118,2.203] [-0.0705,1.379] [-0.551,0.510] [-0.299,0.973] [-0.544,0.624]
Control variables No No Yes Yes No No Yes Yes
N 631 369 525 329 631 369 525 329
Manipulation
Less healthy breakfast cereals Healthier breakfast cereals

The impact of taxation and signposting on diet: an online field study with breakfast cereals and soft drinks 33
Table A.5: Estimated tax effects for soft drinks by education level
Notes: The samples are split at the median of ‘educational level’. The coefficients represent the partial effects on the observed outcome (log volume of products purchased), corrected to represent proportionate changes. 95% confidence intervals based on block bootstrap cluster robust standard errors in brackets. Control variables used in models (3), (4), (7) and (8) are the same as in Table 2, models (2) and (4), except for ‘educational level’ now being excluded from the models. ‘Cross tax’ effect refers to the effect on the volume of healthier (less healthy) products purchased when the less healthy (healthier) products were taxed. *** p<0.01, ** p<0.05, * p<0.1
No University
degree
University
degree
No University
degree
University
degree
No University
degree
University
degree
No University
degree
University
degree
(1) (2) (3) (4) (5) (6) (7) (8)
20% own Tax -0.202 0.00915 -0.198 -0.0673 -0.457*** -0.515*** -0.486*** -0.555***
[-0.604,0.201] [-0.559,0.578] [-0.631,0.236] [-0.645,0.510] [-0.731,-0.182] [-0.785,-0.245] [-0.790,-0.182] [-0.834,-0.277]
20% own Tax in -0.514*** -0.548*** -0.514*** -0.555*** -0.226 -0.362* -0.297 -0.494***
signposted intervention [-0.773,-0.254] [-0.866,-0.230] [-0.807,-0.221] [-0.885,-0.225] [-0.624,0.171] [-0.781,0.0565] [-0.706,0.111] [-0.852,-0.135]
40% own Tax -0.649*** -0.699*** -0.648*** -0.727*** -0.463*** -0.556*** -0.438*** -0.583***
[-0.843,-0.456] [-0.877,-0.520] [-0.874,-0.421] [-0.911,-0.543] [-0.721,-0.205] [-0.816,-0.296] [-0.736,-0.139] [-0.847,-0.320]
40% own Tax in -0.603*** -0.707*** -0.611*** -0.671*** -0.698*** -0.664*** -0.679*** -0.685***
signposted intervention [-0.813,-0.393] [-0.912,-0.503] [-0.845,-0.377] [-0.908,-0.435] [-0.869,-0.528] [-0.900,-0.429] [-0.874,-0.483] [-0.934,-0.435]
20% cross Tax -0.0759 0.521 0.118 0.443 -0.192 -0.318* -0.0605 -0.445***
[-0.549,0.397] [-0.289,1.330] [-0.521,0.756] [-0.406,1.292] [-0.563,0.178] [-0.695,0.0588] [-0.541,0.420] [-0.765,-0.125]
20% cross Tax in 0.653 0.043 0.517 0.176 0.431 0.0813 0.184 0.0802
signposted intervention [-0.191,1.497] [-0.626,0.712] [-0.327,1.362] [-0.618,0.970] [-0.216,1.078] [-0.584,0.747] [-0.421,0.789] [-0.609,0.770]
40% cross Tax 0.248 -0.18 0.301 -0.239 -0.036 0.0548 -0.00468 -0.143
[-0.389,0.884] [-0.655,0.295] [-0.419,1.020] [-0.703,0.224] [-0.522,0.450] [-0.625,0.735] [-0.605,0.596] [-0.750,0.463]
40% cross Tax in 0.552 1.198* 0.322 1.046 0.783** 0.458 0.505 0.16
signposted intervention [-0.189,1.294] [-0.174,2.570] [-0.403,1.047] [-0.307,2.399] [0.0499,1.515] [-0.391,1.307] [-0.167,1.176] [-0.554,0.875]
Control variables No No Yes Yes No No Yes Yes
N 631 369 525 329 631 369 525 329
Manipulation
Less healthy soft drinks Healthier soft drinks

34 CHE Research Paper 131
Table A.6: Estimated tax effects for breakfast cereals by Body Mass Index
Notes: The coefficients represent the partial effects on the observed outcome (log volume of products purchased), corrected to represent proportionate changes. 95% confidence intervals based on block bootstrap cluster robust standard errors in brackets. Control variables used in models (3), (4), (7) and (8) are the same as in Table 2, models (2) and (4), except for the variable ‘log bmi’ now being excluded from the models. ‘Cross tax’ effect refers to the effect on the volume of healthier (less healthy) products purchased when the less healthy (healthier) products were taxed. *** p<0.01, ** p<0.05, * p<0.1
BMI < 25 BMI ≥ 25 BMI < 25 BMI ≥ 25 BMI < 25 BMI ≥ 25 BMI < 25 BMI ≥ 25
(1) (2) (3) (4) (5) (6) (7) (8)
20% own Tax -0.284* -0.548*** -0.292* -0.605*** -0.0958 0.323 -0.0595 0.311
[-0.590,0.0220] [-0.725,-0.371] [-0.606,0.0219] [-0.764,-0.446] [-0.542,0.350] [-0.340,0.986] [-0.554,0.435] [-0.437,1.060]
20% own Tax in -0.610*** -0.444*** -0.656*** -0.438*** -0.563*** -0.461*** -0.619*** -0.505***
signposted intervention [-0.797,-0.423] [-0.693,-0.195] [-0.826,-0.486] [-0.721,-0.155] [-0.820,-0.305] [-0.708,-0.215] [-0.847,-0.391] [-0.754,-0.256]
40% own Tax -0.623*** -0.683*** -0.615*** -0.769*** -0.181 -0.320* -0.218 -0.251
[-0.793,-0.454] [-0.818,-0.547] [-0.800,-0.430] [-0.875,-0.663] [-0.668,0.305] [-0.645,0.00558] [-0.717,0.281] [-0.638,0.136]
40% own Tax in -0.786*** -0.753*** -0.772*** -0.722*** -0.770*** -0.663*** -0.782*** -0.702***
signposted intervention [-0.902,-0.669] [-0.862,-0.644] [-0.900,-0.643] [-0.853,-0.592] [-0.906,-0.634] [-0.835,-0.492] [-0.919,-0.645] [-0.863,-0.542]
20% cross Tax -0.159 -0.0814 -0.16 -0.2 0.731 1.230** 0.828 1.390**
[-0.461,0.143] [-0.410,0.248] [-0.486,0.166] [-0.486,0.0869] [-0.276,1.738] [0.136,2.324] [-0.275,1.931] [0.111,2.669]
20% cross Tax in 0.461 0.0472 0.482 0.143 0.173 0.0411 0.114 0.0905
signposted intervention [-0.156,1.078] [-0.360,0.454] [-0.139,1.104] [-0.342,0.628] [-0.416,0.761] [-0.398,0.480] [-0.442,0.669] [-0.409,0.590]
40% cross Tax -0.122 0.0742 -0.141 0.0324 0.649 2.213*** 0.542 2.813***
[-0.523,0.278] [-0.331,0.479] [-0.568,0.286] [-0.355,0.420] [-0.315,1.613] [0.639,3.787] [-0.411,1.495] [0.738,4.888]
40% cross Tax in 0.562 0.265 0.491 0.495 0.841* 0.0975 0.597 0.0222
signposted intervention [-0.110,1.234] [-0.236,0.765] [-0.181,1.162] [-0.187,1.176] [-0.0752,1.757] [-0.423,0.618] [-0.205,1.400] [-0.493,0.537]
Control variables No No Yes Yes No No Yes Yes
N 440 560 382 480 440 560 382 480
Manipulation
Less healthy breakfast cereals Healthier breakfast cereals

The impact of taxation and signposting on diet: an online field study with breakfast cereals and soft drinks 35
Table A.7: Estimated tax effects for soft drinks by Body Mass Index
Notes: The coefficients represent the partial effects on the observed outcome (log volume of products purchased), corrected to represent proportionate changes. 95% confidence intervals based on block bootstrap cluster robust standard errors in brackets. Control variables used in models (3), (4), (7) and (8) are the same as in Table 2, models (2) and (4), except for the variable ‘log bmi’ now being excluded from the model. ‘Cross tax’ effect refers to the effect on the volume of healthier (less healthy) products purchased when the less healthy (healthier) products were taxed. *** p<0.01, ** p<0.05, * p<0.1
BMI < 25 BMI ≥ 25 BMI < 25 BMI ≥ 25 BMI < 25 BMI ≥ 25 BMI < 25 BMI ≥ 25
(1) (2) (3) (4) (5) (6) (7) (8)
20% own Tax -0.178 -0.0762 -0.0827 -0.199 -0.515*** -0.450*** -0.575*** -0.472***
[-0.598,0.241] [-0.563,0.411] [-0.606,0.441] [-0.640,0.243] [-0.793,-0.237] [-0.735,-0.165] [-0.844,-0.306] [-0.750,-0.194]
20% own Tax in -0.517*** -0.532*** -0.515*** -0.554*** -0.392** -0.179 -0.455** -0.288
signposted intervention [-0.805,-0.230] [-0.807,-0.258] [-0.845,-0.185] [-0.835,-0.272] [-0.762,-0.0212] [-0.615,0.258] [-0.805,-0.105] [-0.698,0.122]
40% own Tax -0.679*** -0.662*** -0.634*** -0.701*** -0.382** -0.584*** -0.442** -0.572***
[-0.854,-0.503] [-0.861,-0.463] [-0.862,-0.405] [-0.894,-0.509] [-0.737,-0.0263] [-0.792,-0.376] [-0.796,-0.0881] [-0.781,-0.363]
40% own Tax in -0.656*** -0.634*** -0.673*** -0.600*** -0.707*** -0.671*** -0.667*** -0.680***
signposted intervention [-0.877,-0.436] [-0.834,-0.434] [-0.903,-0.443] [-0.836,-0.364] [-0.895,-0.519] [-0.858,-0.484] [-0.894,-0.440] [-0.883,-0.478]
20% cross Tax 0.264 0.02 0.6 0.0137 -0.026 -0.389** -0.0892 -0.365**
[-0.437,0.964] [-0.518,0.558] [-0.346,1.546] [-0.544,0.572] [-0.502,0.450] [-0.702,-0.0760] [-0.577,0.398] [-0.713,-0.0178]
20% cross Tax in 0.425 0.39 0.288 0.452 0.102 0.465 -0.149 0.421
signposted intervention [-0.361,1.211] [-0.394,1.174] [-0.461,1.037] [-0.420,1.325] [-0.494,0.698] [-0.269,1.199] [-0.625,0.327] [-0.321,1.163]
40% cross Tax -0.139 0.261 0.0637 0.0647 -0.239 0.244 -0.338 0.256
[-0.617,0.339] [-0.390,0.913] [-0.580,0.708] [-0.512,0.642] [-0.699,0.222] [-0.431,0.919] [-0.774,0.0987] [-0.485,0.997]
40% cross Tax in 0.838 0.714 0.703 0.523 0.511 0.782* 0.275 0.497
signposted intervention [-0.209,1.885] [-0.158,1.586] [-0.356,1.762] [-0.355,1.401] [-0.267,1.290] [-0.0244,1.588] [-0.428,0.979] [-0.200,1.195]
Control variables No No Yes Yes No No Yes Yes
N 440 560 382 480 440 560 382 480
Manipulation
Less healthy soft drinks Healthier soft drinks

36 CHE Research Paper 131
Appendix B. Shopping Diary Analysis
We analyze the data in two ways. First, we estimate the correlation between the volume of the products which participants received from the experiment and the volume of products in the same category they bought afterwards (as recorded in the shopping diary). In order to control for heterogeneity in general purchasing patterns, we include the volume of both healthier and less healthy items purchased at the baseline task (i.e. without tax) in the model.21 We conduct this analysis for healthier and less healthy cereals and soft drinks separately. In addition, we analyze the volume of chocolate purchased in the shopping diary. Chocolate is considered to be less healthy. Participants may purchase chocolates by way of rewarding their healthier choices which are induced by the tax. The results of the first approach are presented in Table B.1. We do not find evidence that the volume of items purchased in the experiment is systematically and negatively correlated with the volume purchased within one week after groceries were received, which would point to compensation effects.22 Second, we directly estimate the impact of the experimental tax on the volume of items purchased within a week after receipt of the groceries by replacing the dependent variable of the regression model described in section 2.7 with the volume of items purchased within a week after receipt of the groceries, and otherwise using a similar econometric specification except that the total volume of items purchased at the baseline task is additionally controlled for. Again the analysis is conducted separately for cereals, soft drinks and chocolate. If the participants facing the tax decided not to buy a taxed item but purchased it afterwards, we would observe a positive impact of the tax on the volume purchased in the shopping diary. The results from the second approach are presented in Table B.2. We do not find evidence that the effect of the tax was compensated by greater purchases of similar products after the groceries were received. None of the tax manipulations had a positive effect on purchases of cereals and beverages within the taxed category. In addition, we found no significant increase in the purchase of chocolate in response to the experimental tax on less healthy items.23
21
Participants for whom the randomly selected basket was at baseline prices (N=66) were excluded from the analysis. 22
We ran the same regressions using an OLS specification instead of Tobit and results are very similar to those presented here. Note that positive correlations between volumes purchased in the experiment and volumes purchased afterwards within the same category might imply a habit formation – i.e. when more less healthy (healthier) items were received from the experiment, participants purchased more less healthy (healthier) items in the shopping diary, even after controlling for purchases at the baseline price (which we used as a proxy of the general purchasing pattern). It might also simply imply that participants have a similar purchasing pattern inside and outside the experiment, the effect of which may not be fully captured by controlling for purchases at the task with the baseline price. 23
Again, results are very similar to those presented here if OLS is used instead of Tobit. In some cases (notably in the policy non interesting case of taxes on the healthier products), the tax had a negative impact on the volume of items purchased in the same category (healthier products) even after the experiment. If reflecting a genuine effect, this might imply that the corresponding taxes had a sustainable impact on purchases after a week i.e. habit formation.

The impact of taxation and signposting on diet: an online field study with breakfast cereals and soft drinks 37
Table B.1. The relationship between the volume of products received from the experiment and the volume of products purchased afterwards, as recorded in the shopper diary (Tobit model)
Breakfast cereals
Soft drinks
Chocolate
Less healthy
Healthier
Less healthy
Healthier
If received cereals
If received
soft drinks
(1) (2)
(3) (4)
(5) (6)
Log volume of less healthy products received
0.0244 0.195
0.262** -0.209*
-0.111 0.0155
(0.141) (0.120)
(0.111) (0.122)
(0.103) (0.0865)
Log volume of healthier products received
-0.120 0.269**
-0.165 -0.0910
0.172 -0.00469
(0.139) (0.114)
(0.110) (0.112)
(0.113) (0.0838)
Log volume of less healthy products purchased at baseline prices (experiment)
0.0759 -0.420**
0.0672 0.0956
0.194 0.0655
(0.151) (0.167)
(0.121) (0.128)
(0.126) (0.0871)
Log volume of healthier products purchased at baseline prices (experiment)
-0.0463 -0.469***
0.00945 0.128
0.0453 0.0476
(0.175) (0.126)
(0.134) (0.170)
(0.123) (0.110)
Control variables Yes Yes
Yes Yes
Yes Yes Notes: The analysis is based on a Tobit model with each subject as one observation. Products received after the experiment were either breakfast cereals or soft drinks, since only the outcome of one shopping task was implemented, and shopping tasks involved either breakfast cereals or soft drinks. Partial effects on the observed volume of log purchases are presented. For models (1) and (2), the other variables are the same as reported in Table 2; for models (3) and (4), the other variables are the same as in Table 3, while for models (5) and (6) stocks of cereals/beverages and accuracy guessing prices of cereals/soft drinks were excluded as covariates. Robust standard errors in parentheses. *** p<0.01, ** p<0.05, * p<0.1.

38 CHE Research Paper 131
Table B.2. The effect of taxes in the experiment on the log volume of less healthy and healthier products purchased afterwards, as recorded in the shopper diary (Tobit model)
Breakfast cereals
Soft drinks
Chocolate (less healthy)
Less healthy
Healthier
Less healthy
Healthier
If received cereals
If received
soft drinks
(1) (2)
(3) (4)
(5) (6)
20% tax less healthy
6.537 16.44 3.325 -0.958*** 0.0275 22.61
(9.147) (17.87) (8.963) (0.0775) (1.314) (35.29)
20% tax less healthy in signposted intervention
15.62 15.28 0.365 -0.438 3.690 -0.539
(21.80) (21.11) (2.442) (1.101) (4.489) (0.456)
40% tax less healthy 0.188 0.773 11.92 -0.704 0.818 17.83
(1.799) (2.208) (20.63) (0.469) (2.709) (28.28)
40% tax less healthy in signposted intervention
8.352 1.308 2.844 1.667 -0.396 -0.432
(12.33) (3.292) (6.375) (4.384) (0.675) (0.486)
20% tax healthier
5.512 -0.117 3.974 -0.965*** -0.830*** 2.235
(6.636) (0.979) (9.286) (0.0557) (0.173) (4.972)
20% tax healthier in signposted intervention
0.403 5.535 15.92 -0.707 0.580 -
0.854***
(2.152) (8.292) (30.53) (0.568) (1.469) (0.203)
40% tax healthier 13.14 -0.820*** 3.304 -0.922*** -0.822*** 15.89
(15.60) (0.264) (8.230) (0.127) (0.194) (25.64)
40% tax healthier in signposted intervention
-0.284 3.958 23.96 -0.176 0.0920 -
0.832***
(1.134) (5.828) (33.45) (1.367) (1.215) (0.175)
Control variables Yes Yes
Yes Yes
Yes Yes Notes: The analysis is based on a Tobit model with each subject as one observation. Products received after the experiment were either breakfast cereals or soft drinks, since only the outcome of one shopping task was implemented, and shopping tasks involved either breakfast cereals or soft drinks. Partial effects on the observed volume of log purchases are presented. For models (1) and (2) the other variables are the same as reported in Table 2; for models (3) and (4) the other variables are the same as in Table 3, while for models (5) and (6) stocks of cereals/soft drinks and accuracy guessing prices of cereals/soft drinks were excluded as covariates. Robust standard errors in parentheses. *** p<0.01, ** p<0.05, * p<0.1.

The impact of taxation and signposting on diet: an online field study with breakfast cereals and soft drinks 39
Appendix C. Experimental materials
Informed consent and screening questions24
Q0.1 <Consent> This survey is a research project being run by scientists within the University of East Anglia, Newcastle University, the University of York and the University of Cambridge. In order to proceed, we need your consent to take part in the study. Below is a link to the information sheet telling you more about the study. Please take time to read it, and if you have any questions regarding the study please contact the researcher, by contacting the Valued Opinions Services team by [Clicking here] [Click here] to see the Information for Participants. In summary your participation will involve the following:
Answer some questions about you and your shopping habits;
Complete a series of food shopping tasks using our supermarket website. For this you will receive a £10 budget;
Answer a few more questions to tell us more about you and your experience using the supermarket website.
After completing the shopping tasks, you will be asked to provide the following information: name, address and contact details. This information will be used to deliver the products you purchased in the supermarket website using the shopping budget. This personal identifiable information won’t be transferred to any 3rd parties, except from Tesco.com, where the information will be used to place your order. After 30 days all personally identifiable information will be destroyed and only anonymized data will be retained. Make sure you have around 40 minutes available before starting the survey. This is how long it will take, and it should be completed in one go. DO NOT START NOW IF YOU DO NOT THINK YOU HAVE THE TIME. COME BACK LATER. Taking part in this study should not be harmful or stressful to you, does not require you to install any software, and will not require you to spend any money, other than the shopping budget of £10 that we will provide you. If you wish to withdraw from the study you can close your browser window at any time or contact us within 21 days after completing the survey and both your personally identifiable information and your responses will be securely deleted, and will not be used for any further purpose.
24
Labels Q# in each question were not shown to the participants.

40 CHE Research Paper 131
Q0.2 Give your consent to take part by confirming the following: 1. I have read, understood and accept the Information for Participants and have had the
opportunity to ask questions 2. I understand that my participation is totally voluntary. I am free to withdraw at any time
without having to give a reason. 3. I understand that all personally identifiable information will remain confidential and that it
will be stored for 30 days before being destroyed. 4. I agree that the data gathered in this study may be stored anonymously and securely, and
that data other than personally identifiable information may be used for research purposes. 5. I agree to take part in this research study. OR I do NOT agree to take part in this research study. (You will not proceed with the study) Q1.1 Before starting the shopping tasks we need you to answer a few questions. Your answers will allow us to determine if you are eligible to take part in this survey. If you are eligible, you will then be able to participate fully in the survey. Important! - Data quality Please be aware that there are simple test questions in the survey that check whether you are paying due care and attention to answering all the questions. Please note that if you answer one or more of these simple questions incorrectly, you will not be able to participate fully in the survey. Yes - I understand this and I am happy to proceed. Q1.2 Thinking about food/grocery shopping, which of these best describes the level of responsibility you have for the shopping in your household? Responsible for all or most of the food/grocery shopping Responsible for about half of the food/grocery shopping Responsible for less than half of the food/grocery shopping Not responsible for any of the food/grocery shopping Q1.3 Are you currently on a special diet for medical reasons? Yes No

The impact of taxation and signposting on diet: an online field study with breakfast cereals and soft drinks 41
Q1.4 Do you sleep more than an hour (60 minutes) in total per night? Never (1) 2 3 4 5 6 Always (7) Q1.5 How often on average over the past year have you bought each of the following items for you or your household?
Never Not in the past
12 months
1-3 times in the last
12 months
4-11 times in the last
12 months
1-3 times a month
Once a week
More than
once a week
-Breakfast cereals
-Soft drinks (including water, fruit juices, juice
drinks, fizzy drinks, sports and energy drinks)
Q1.6 How often, have you...
Never Not in the past
12 months
1-3 times in the last
12 months
4-11 times in the last
12 months
1-3 times a month
Once a week
More than
once a week
... shopped online for food or groceries to be delivered to you (e.g.
Tesco.com, Ocado.com, mysupermarket.co.uk)?
... shopped for food or groceries at Tesco?

42 CHE Research Paper 131
Q1.7 To ensure that you are reading this question properly, please select ‘yellow’ from the list below. Red Blue Green Yellow Pink Purple Q1.8 Are you planning to stay away from home for more than 3 days within the next 2 weeks?
Yes
No <Quality control criteria: (Q1.4) answer= 6 or 7; (Q1.7) answer=Yellow.> If participant fails quality control: Message: Many thanks for your responses! Unfortunately you answered incorrectly at least one of our quality control questions and you are not able to participate fully in the study. Clicking 'next' will take you back to the recruitment agency website. <Eligibility criteria: (Q1.2) Responsible for at least about half of the food/grocery shopping; (Q1.3) Not on a diet for medical reasons; (Q1.5) shops breakfast cereals at least once a month and; shops soft drinks at least once a month; (Q1.8) answer=NO> <If the eligibility criteria are not fulfilled: Message We are sorry. Based on your answers to our questions you are not eligible to participate in this survey. We sincerely thank you and appreciate your time and dedication. Clicking 'next' will take you back to the recruitment agency website. If inclusion criteria are fulfilled, next> Thank you for your responses! You have qualified to continue participating in this survey. You are now going to complete the shopping tasks. Detailed instructions will be provided on the following screen. Click ‘next’ to proceed. Y. Instructions shopping tasks The computer will invite you to visit a website where you can buy from a limited selection of products. This will happen 10 times. From now on, we will refer to these shopping opportunities as shopping tasks. For each of the 10 shopping tasks you have a budget of £10 and you can buy as much (or as little) you want within this budget – it is entirely up to you how much you spend. Each task will invite you to visit a slightly different supermarket website. Half the time only breakfast cereals will be available, and half the time only drinks. Also the prices of some products might change, indicated by a symbol and the amount of the price change. For example the symbol
indicates when the price has been increased by a Tax.25
25
The sentence between brackets was only shown to participants in the Signposted tax treatment

The impact of taxation and signposting on diet: an online field study with breakfast cereals and soft drinks 43
Once you have added all the products you want to your basket, click ‘checkout’, you will be asked to enter your delivery details and select which evening(s) you will be available to receive your delivery. Once you are done, confirm that you have finished and click the link to exit the supermarket. You can then continue on to the next shopping task, or return to the online shopping website to re-do this shopping task if you are not happy with your choices. If you accidentally close the web browser or a window before finishing the task, you can re-join the survey by clicking the original link to the survey. You will re-join the survey at the point you left (you won’t need to repeat the pages of the survey that you have already completed), and you can re-start any shopping task that was interrupted by clicking on the link available. After you have completed all 10 shopping tasks, the computer will randomly select one of them and show you what you bought. This randomly chosen shopping task will become ‘real’: your choices will be delivered between 6:00pm and 10:00pm on one of the selected evenings to the address you provided and any unspent money from your £10 budget will be credited to your Valued Opinions reward account.
Click ‘next’ to continue Please use the link below to visit our supermarket and make your purchases. Remember: - What you buy in this task may become ‘real’: you will receive the products and any unspent money. - You decide how you would like to spend your £10 budget. Remember that the prices might change from task to task. - Check out from the supermarket and follow the link to go back to this page and continue to the next task.
Link to open Woods Supermarket website Have you completed the shopping task? Yes I completed the shopping task If you did not manage to complete your shopping and check out, or if you are not happy with your choices, you can click on the link to start this task again. Otherwise, click 'next'.
Link to open Woods Supermarket website <Repeats until the 10 tasks are completed> Thank you for completing all the shopping tasks! Click ‘next’ to continue The computer has chosen at random one of the 10 tasks to be real. That is, you will receive the products you purchased in that task and any unspent money from your shopping budget. Please click the link below to find out the content of your shopping basket that will be delivered to you.
Link to the real shopping basket

44 CHE Research Paper 131
The products you purchased will be delivered (by Tesco delivery service) between 6:00pm and 10:00pm on one of the selected evenings to the address you provided us in the shopping website. Any unspent money from your £10 budget will be credited to your Valued Opinions reward account. Click the link below if you want to see again the content of your shopping basket and your delivery details. Otherwise, click 'next' to continue. Otherwise, click 'next' to continue.
Link to the real shopping basket Z. Post-Experiment questionnaire Q3.1 In the following part we will ask you to answer some questions. Please click 'next' to start Q3.2 Imagine that you have a choice of two payment options; Option A or Option B. If you choose Option B you will receive a sum of money 7 months from today. If you choose Option A, you will receive a sum of money 1 month from today, but this Option (A) will pay a smaller amount than Option B. Of the following two options which one would you prefer?
Option A Option B
Option A: £300.00 in 1 month or Option B: £307.50 in 7 months
Option A: £300.00 in 1 month or Option B: £315.20 in 7 months
Option A: £300.00 in 1 month or Option B: £322.90 in 7 months
Option A: £300.00 in 1 month or Option B: £330.80 in 7 months
Option A: £300.00 in 1 month or Option B: £338.70 in 7 months
Option A: £300.00 in 1 month or Option B: £346.70 in 7 months
Option A: £300.00 in 1 month or Option B: £354.80 in 7 months
Option A: £300.00 in 1 month or Option B: £363.00 in 7 months
Option A: £300.00 in 1 month or Option B: £371.30 in 7 months
Option A: £300.00 in 1 month or Option B: £379.70 in 7 months
Q3.3 Please use the bar to indicate how long you estimate your stock of each of the items below would last until you would run out and need to buy some more.

The impact of taxation and signposting on diet: an online field study with breakfast cereals and soft drinks 45
Q3.4 Please use the slider beside each product to indicate your best guess of its regular retail price.
______ Kellogg's Corn Flakes 750G ______ Kellogg’s Crunchy Nut Cornflakes 500G ______ Coca Cola 1.75L ______ Evian Mineral Water 2L ______ Tesco Orange Juice from Concentrate 1L Q4.1 In order to finish, please answer the following questions about yourself. Q4.2 Your gender Male Female Q4.3 Your age (years) Q4.4 Your weight Kilograms/stones/pounds Q4.5 Your height Meters/feet/inches Q4.6 Are you currently on a diet to lose weight or to maintain your current weight? Yes No Q4.7 What is the highest education qualification you have achieved?

46 CHE Research Paper 131
None Up to 4 GCSE’s (Including 1-4 O Levels/CSE/GCSEs (any grades), Foundation Diploma, NVQ level 1, Foundation GNVQ or equivalents) 5 or more GCSE’s or 1 A-level (Including 5+ GCSEs (Grades A*-C),1 A Level/ 2-3 AS Levels, NVQ level 2, Intermediate GNVQ, City and Guilds Craft, BTEC First/General Diploma, RSA Diploma, Apprenticeship or equivalents) 2 or more A-levels (Including 2+ A Levels, 4+ AS Levels, NVQ Level 3, Advanced GNVQ, City and Guilds Advanced Craft, ONC, OND, BTEC National, RSA Advanced Diploma or equivalents) Bachelor’s degree (Including BA, BSc, NVQ Level 4-5, HNC, HND, RSA Higher Diploma, BTEC Higher level or equivalents) Post-Graduate degree or qualification (Including Higher Degrees e.g. MA, PhD, PGCE, Professional qualifications e.g. teaching, nursing, accountancy or equivalents) Other Answer If, What is the highest education qualification you have achieved? Other Is Selected Q4.7.b Please write below the highest education qualification you have achieved Q4.8 Please indicate your approximate yearly personal income before taxes.
Up to £15,499 per year
£15,500–£24,999 per year
£25,000–£39,999 per year
£40,000 or more per year
Don’t know/Prefer not to say Q4.9 Please indicate your approximate yearly household income before taxes (include total income of all adults living in your household).
Up to £15,499 per year
£15,500–£24,999 per year
£25,000–£39,999 per year
£40,000 or more per year
Don’t know/Prefer not to say Q4.10 How many persons - including yourself - live in your household? Q4.11 How many persons in your household are children under 18 years of age? Q4.12 Please indicate to which extent you agree with the following statement: The products I have purchased in the online supermarket resemble my regular food purchases of breakfast cereals and non-alcoholic drinks. Strongly agree Agree Neither agree nor disagree Disagree Strongly disagree

The impact of taxation and signposting on diet: an online field study with breakfast cereals and soft drinks 47
Q4.13 Please tell us if you have any comments or anything you think we should know about your experience of taking part in this study! Q4.14 Many thanks for taking part. Clicking ‘next’; will take you back to the recruitment agency website.