the impact of the aids pandemic on health services …accase/downloads/downloads/the_impact... ·...
TRANSCRIPT

The impact of the AIDS pandemic on health services in Africa: Evidence from Demographic Health Surveys
Anne Case Christina Paxson
Research Program in Development Studies and
Center for Health and Wellbeing
Princeton University
December 2008
We thank Kimberly Bryan for expert research assistance, Jane Fortson for sharing her code and her knowledge of the DHS data, and Helen Epstein for helpful discussions. We acknowledge funding from the National Institute of Aging P01 AG005842, and the Demography of Aging Center, Princeton University.
1
1. Introduction In the past twenty years, the AIDS crisis has had crippling effects on the health care systems of
many countries in sub-Saharan Africa. The increase in morbidity that accompanies HIV has
greatly increased demand for health services. At the same time, the pandemic has compromised
the ability of health systems to deliver care, as health professionals fall ill and leave the system,
and as health budgets shift resources toward AIDS and the vertical delivery of care for those
infected with HIV (Lancet 1995, Jones et al 2003, Colvin 2005, Easterly 2008).
AIDS often places a large tax on households’ budgets. Prime-aged adults who fall ill may
need to leave the labor force. Other family members may also find it necessary to change their
work patterns, in order to care for the sick. These costs, together with the financial costs of
covering illnesses associated with AIDS, can lead to ‘medical poverty traps’ (McIntyre et al
2005).
These strains on health systems and households have taken their toll. In this paper, we
document the impact of the AIDS crisis on non-AIDS related health services in eight sub-
Saharan African countries. Using multiple waves of Demographic and Health Surveys (DHS) for
each country, we examine antenatal care, birth deliveries, and rates of immunization for children
born between 1988 and 2003. We find deterioration in the delivery of nearly all of these
dimensions of health care over this period. The most recent DHS survey for each country
collected data on HIV prevalence, which allows us to examine the association between HIV
burden and health care. We find that erosion of health services is highly correlated with increases
in AIDS prevalence. Regions of countries that have light AIDS burdens have witnessed small or
no declines in health care, using the measures noted above, while those regions currently
shouldering the heaviest burdens have seen the largest erosion in treatment for pregnant women
2
and children. Using semi-parametric techniques, we can date the beginning of the divergence in
health services between high and low HIV regions to the mid-1990s.
We begin in Section 2 by introducing the DHS data we use to examine the impact of HIV
on health care delivery. We discuss our estimation strategy in Section 3. We present evidence on
the associations between HIV and health services in Section 4, and explore explanations for our
findings in Section 5. Section 6 discusses ways in which future health service delivery may be
affected by the arrival of antiretroviral therapy (ART), and notes ways in which the design of
AIDS care should take into account the fact that persons living in regions most affected by AIDS
may not have been receiving adequate medical care for the past 20 years.
2. Demographic and Health Survey Data
Demographic and Health Surveys are large, nationally representative household-based surveys
run at approximately four to five year intervals in low and middle income countries. Their focus
is primarily on population, health and nutrition. Women in the household aged 15 to 49 are asked
about their fertility histories, including information on prenatal care, delivery assistance and
children’s immunizations. In some survey waves, information on antenatal care is available for a
woman’s most recent birth, and in others it is collected for all births that occurred within a
particular time window (within the past three years for some surveys, within the past five years
for others). Appendix Table 1 provides a guide to survey years. Information on these surveys is
also available on line at http://www.measuredhs.com/aboutdhs/.
We analyze data from 25 DHS surveys conducted between 1988 and 2006 in eight
countries in sub-Saharan Africa. We have chosen three West African countries where HIV
prevalence rates are relatively low – Burkina Faso, Cameroon, and Ghana – and five countries in

3
East and Southern Africa where rates are higher – Kenya, Malawi, Tanzania, Zambia, and
Zimbabwe. We selected these countries because they have conducted three or four DHS surveys
since 1988, and because their latest round of DHS data collection included HIV testing. We do
not use the 1988 survey from Ghana and the 1991-92 survey from Tanzania, because the geo-
coding of within-country regions changed between these and later surveys.
Table 1 reports on the DHS data we use, including survey years, the birth years of
children covered in each survey year, and the number of observations in each survey.1 For each
birth year from 1988 to 2003, we have observations from at least six of the eight countries we are
studying, with two exceptions. (For children born in 1988, there are no data from Ghana,
Tanzania, or Zimbabwe, and for children born in 1994, there are no data from Cameroon,
Zambia or Kenya.)
Our analysis will focus on the association between health service delivery on one hand,
and HIV prevalence rates on the other. The DHS data do not allow us to match HIV results to
individuals in each survey, but do allow us to match HIV prevalence at the region level. All
countries are divided into regions that can be consistently identified across survey years.
Countries vary in the number of regions (3 in Cameroon and in Malawi for example, 10 in
Zimbabwe, 20 in Tanzania), and in total we analyze data from 75 regions.
Antenatal Care
Outcome measures for antenatal care and birth deliveries are presented in Table 2. The upper
panel shows means for each country, taken over all DHS waves, on women’s reports that they
1 We exclude 86 cases where information on mother’s education is missing and 3509 cases where information on the HIV prevalence in the region of birth is unknown for the child’s birth year.

4
received any antenatal care (in the form of at least one antenatal visit). For women who report
antenatal care, each is asked whether their urine and blood were tested, and whether
measurements of their blood pressure and weight were taken. Over 90 percent of women
surveyed in East and Southern Africa report some form of antenatal care, true for 60 to 90
percent of women in West Africa. Conditional on reporting prenatal care, more than 90 percent
of women report they were weighed, and the vast majority report their blood pressure was taken.
Blood tests and urine analysis are much less likely to be reported in some countries (Malawi,
Tanzania, Zambia) than in others (Cameroon, Ghana).
Figure 1 shows a marked decline in the tests and measurements taken during antenatal
visits, by country and birth year, particularly for tests involving bodily fluids. Results for urine
and blood tests during antenatal care, shown in the upper panel of Figure 1, suggest that use of
these tests declined in all parts of Africa. In Malawi, for example, the percentage of women
reporting that their blood was tested as part of their prenatal care declined from 54 percent in
1995, to 32 percent in 2003. In Burkina Faso, this percentage dropped from 62 percent in 1998 to
32 percent in 2003. Reports that blood pressure was taken during an antenatal visit held constant
in West Africa, but fell in East and Southern Africa, as can be seen in the bottom left panel of
Figure 1. In Kenya, for example, reports of blood pressure being taken fell from 88 percent in
1998 to 80 percent in 2003, and in Tanzania from 75 percent in 2000 to 62 percent in 2003. The
only measure that held relatively steady over this period is an inexpensive measure that takes
little clinic time: being weighed during a prenatal visit is constant, at close to 100 percent, in all
countries over this period. (Note that the graphing scales used are different for different
procedures.)
5
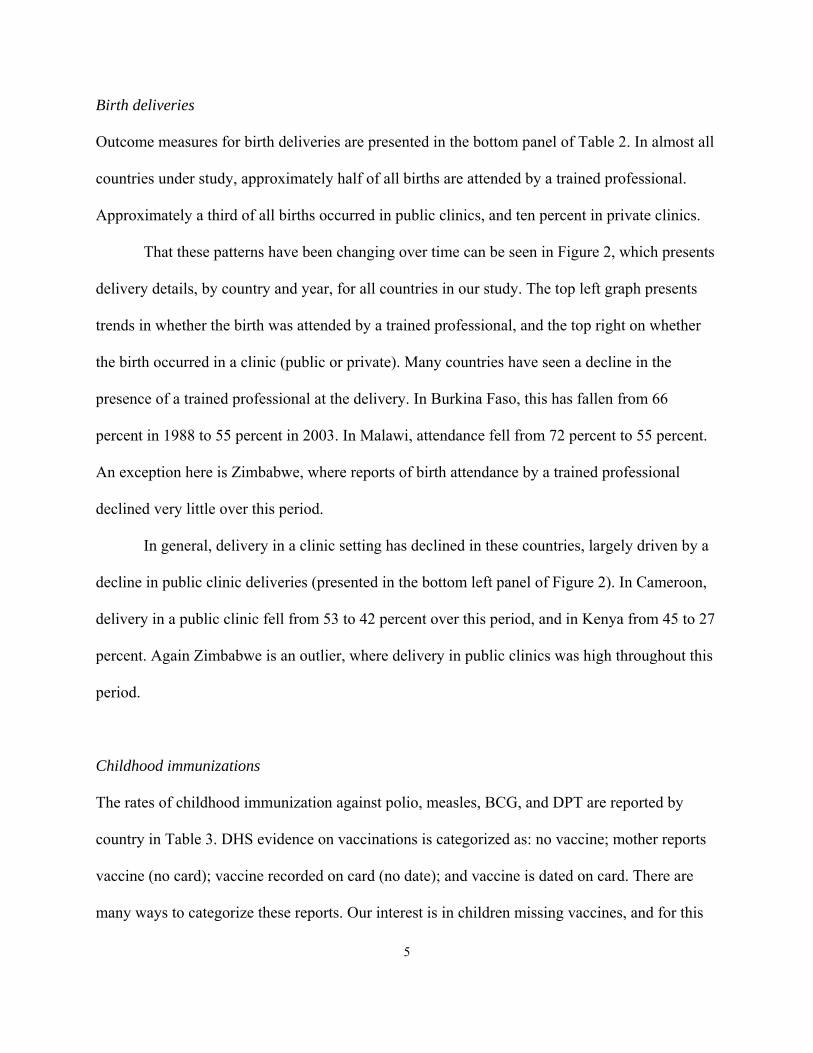
Birth deliveries
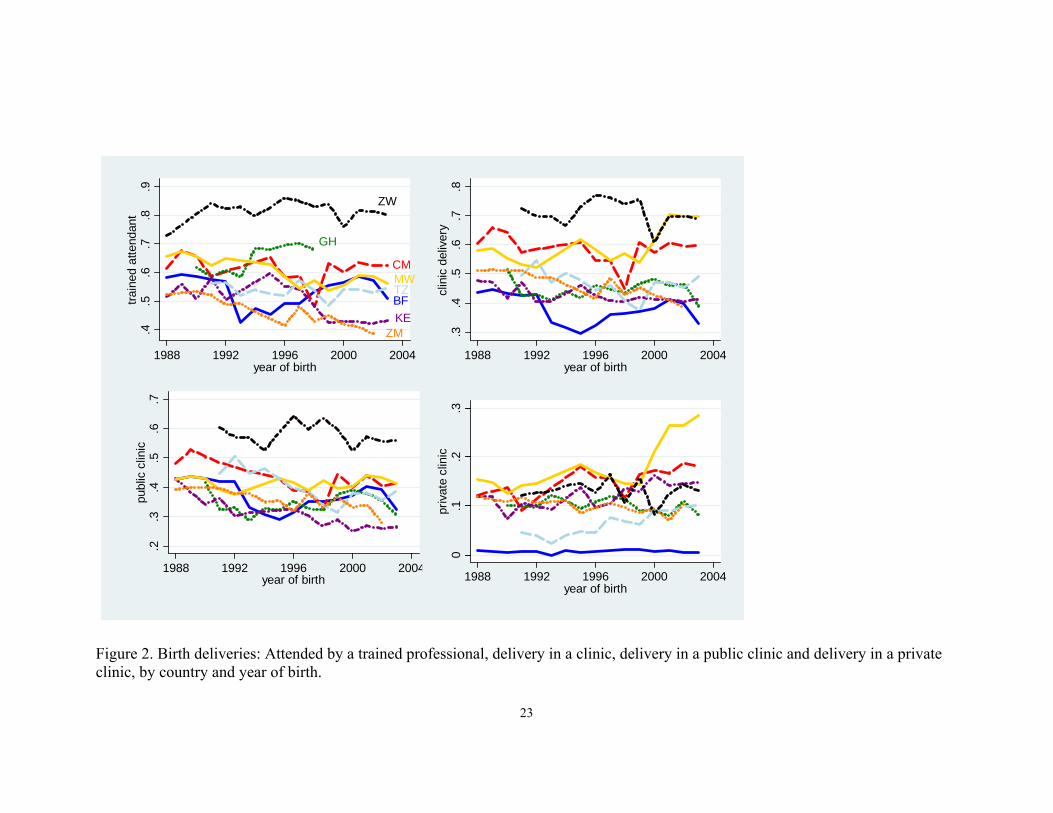
Outcome measures for birth deliveries are presented in the bottom panel of Table 2. In almost all
countries under study, approximately half of all births are attended by a trained professional.
Approximately a third of all births occurred in public clinics, and ten percent in private clinics.
That these patterns have been changing over time can be seen in Figure 2, which presents
delivery details, by country and year, for all countries in our study. The top left graph presents
trends in whether the birth was attended by a trained professional, and the top right on whether
the birth occurred in a clinic (public or private). Many countries have seen a decline in the
presence of a trained professional at the delivery. In Burkina Faso, this has fallen from 66
percent in 1988 to 55 percent in 2003. In Malawi, attendance fell from 72 percent to 55 percent.
An exception here is Zimbabwe, where reports of birth attendance by a trained professional
declined very little over this period.
In general, delivery in a clinic setting has declined in these countries, largely driven by a
decline in public clinic deliveries (presented in the bottom left panel of Figure 2). In Cameroon,
delivery in a public clinic fell from 53 to 42 percent over this period, and in Kenya from 45 to 27
percent. Again Zimbabwe is an outlier, where delivery in public clinics was high throughout this
period.
Childhood immunizations
The rates of childhood immunization against polio, measles, BCG, and DPT are reported by
country in Table 3. DHS evidence on vaccinations is categorized as: no vaccine; mother reports
vaccine (no card); vaccine recorded on card (no date); and vaccine is dated on card. There are
many ways to categorize these reports. Our interest is in children missing vaccines, and for this
6
reason we code variables equal to ‘1’ if the child is reported – either by the mother or on the
health card – not to be vaccinated , and equal to ‘0’ if the mother reports the vaccine, or evidence
of the vaccine is recorded on the child’s health card. Table 3 shows that approximately half of all
children were reported not to have had a polio vaccine shortly after birth, but that this lack of
vaccination falls to between 10 to and 20 percent of children at older ages. Between a quarter and
a third of all children are not vaccinated against measles, and between 10 and 20 percent have
not received BCG vaccines. Non-vaccination rates are generally higher in West African
countries.
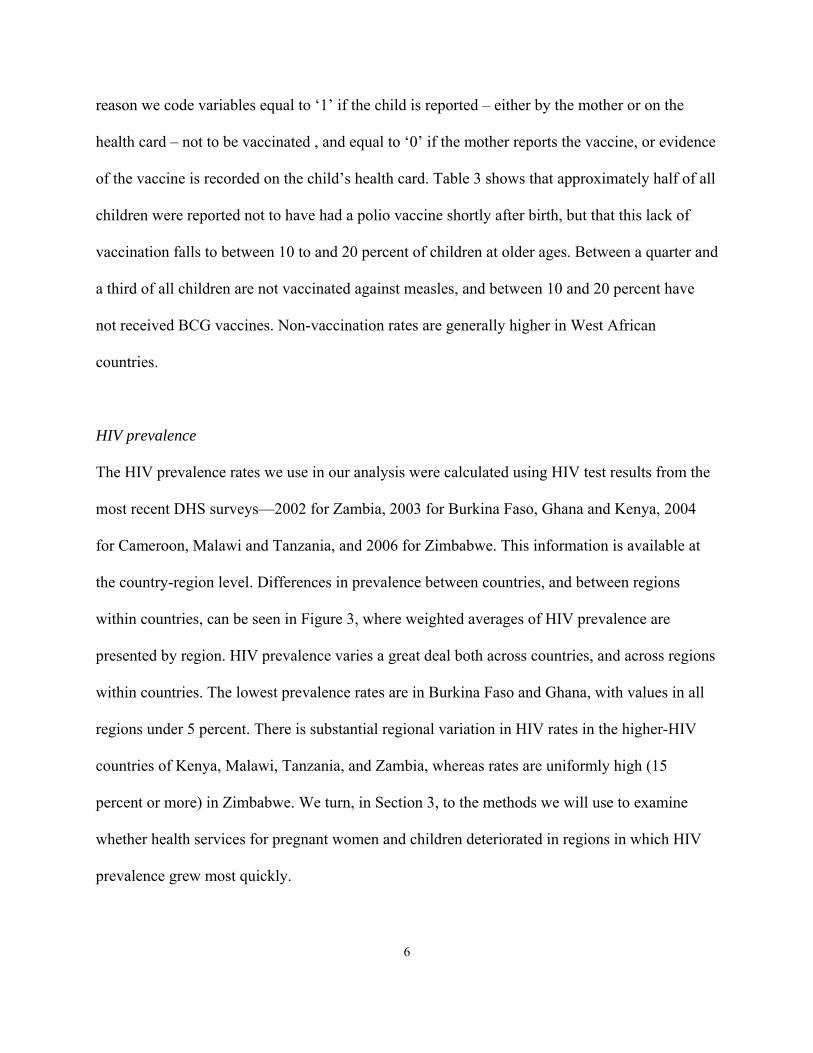
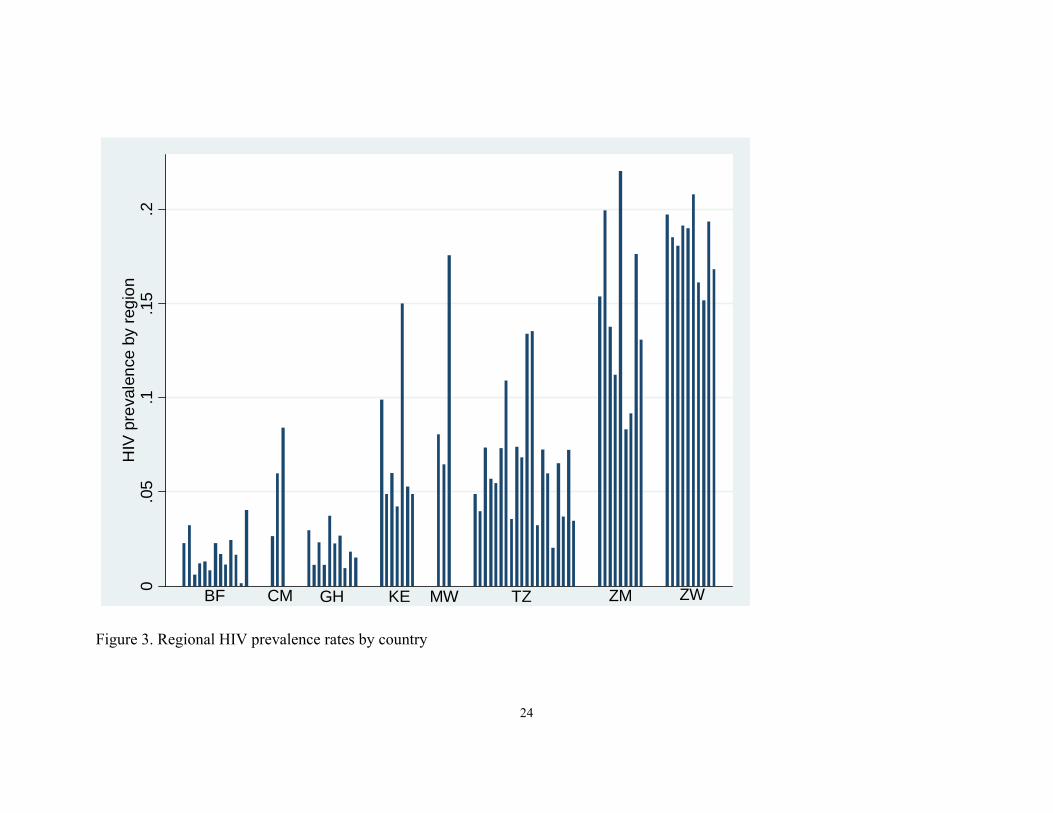
HIV prevalence
The HIV prevalence rates we use in our analysis were calculated using HIV test results from the
most recent DHS surveys—2002 for Zambia, 2003 for Burkina Faso, Ghana and Kenya, 2004
for Cameroon, Malawi and Tanzania, and 2006 for Zimbabwe. This information is available at
the country-region level. Differences in prevalence between countries, and between regions
within countries, can be seen in Figure 3, where weighted averages of HIV prevalence are
presented by region. HIV prevalence varies a great deal both across countries, and across regions
within countries. The lowest prevalence rates are in Burkina Faso and Ghana, with values in all
regions under 5 percent. There is substantial regional variation in HIV rates in the higher-HIV
countries of Kenya, Malawi, Tanzania, and Zambia, whereas rates are uniformly high (15
percent or more) in Zimbabwe. We turn, in Section 3, to the methods we will use to examine
whether health services for pregnant women and children deteriorated in regions in which HIV
prevalence grew most quickly.

7
3. Methods
Our key concern is whether higher HIV prevalence within regions is associated with lower
quality health care for mothers and their children. As noted above, we do not observe HIV
prevalence over multiple years, but only in the year in which the most recent survey was
conducted. We follow two general strategies for estimating the relationship between prevalence
and health care. Our first strategy is to impute prevalence in each of the years in which children’s
births are observed, assuming that HIV prevalence has increased linearly since 1980. We then
regress each health care measure on this measure of prevalence as well as other controls
variables, including indicators for year of birth and country/region fixed effects. Our second
strategy is to regress each health care measure on a set of interactions between the child’s year of
birth and the measure of HIV prevalence in the most recent survey. This permits us to examine
whether the evolution of health outcomes from the last 1980’s to the early 21st century is
different in regions with high HIV prevalence rates when compared to regions with low
prevalence rates. As we show below, the second of these strategies is simply a less restrictive
variant of the first.
The first step is to impute HIV prevalence in each year in which children’s births are
observed. Let denote the prevalence of HIV measured in region in year , where exceed
1980 and denotes a country/region. The estimated prevalence of HIV in region in year ,
denoted , is assumed to be:
(1) .
We then estimate regressions of the following form for each of the health outcomes discussed
above:
(2) ,
8
where is a health care measure associated with child , either a measure of the quality of the
care the child’s mother received before or at the birth of the child, or a measure of the quality of
care the child has received. In addition to the prevalence measure, equation (2) contains a set of
region fixed effects ( , which capture time invariant features of the region, including
determinants of quality of care that do not change over time. As seen in Figures 1 and 2, there
are pronounced differences in the levels of the measures we examine, even though many have
similar trends. We also include a set of birth year effects ( ), which capture changes over time
that are common to all regions, and a set of controls for characteristics of the mother and child
( ). These controls include the mother’s years of education, her age in years, the child’s age in
months (or, if the child has died, the age in months the child would have been at the time of the
survey had he or she lived), an indicator for the child’s sex, and an indicator for whether the
household lives in an urban area. The parameter of interest, , provides an estimate of how
changes in HIV prevalence in a region influence health care outcomes.
Equation (2) incorporates two assumptions: one, that HIV prevalence increased linearly
from 1980 to the current time period, and two, that HIV prevalence has a linear effect on health
care quality. These assumption can o ls of the following form: s be l osened, by estimating mode
(3) ,
where all variables are defined as above, only the actual prevalence in year has replaced
estimated prevalence in year , and the coefficient on actual prevalence is permitted to vary by
year. Because the prevalence measure does not vary over time within regions, and region fixed
effects are included, the value of must be set to zero for one of the years.
In what follows, we present estimates of (2) and (3). It is straightforward to see that (3) is
a less restrictive version of (2). First, substitute (1) into (2) to obtain:

9
19801980 1980
which, if:
19801980
and
1980
can be expressed as:
(4) .
In (4), the inclusion of an interaction term between the prevalence in year and the year of birth
permits a linear trend in the outcome (over and above the year effects ) that varies with HIV
prevalence. The only difference between (4) and (3) is that, in (3), different time patterns in areas
with high and low HIV prevalence are not restricted to a linear trend. In the results that follow,
we test whether this linear restriction can be rejected.
To see how estimates of equation (3) should be interpreted, consider predicted values of
the outcome at two time periods, 1 and 2. Ignoring the control variables , the difference in
the predicted value of the outcome in region will be:
(5) .
The year-to-year change in the outcome contains a component that is common to all regions, and
another component that is scaled by the region’s HIV prevalence in year τ.
One concern is that not all outcomes are observed in all countries in all years of birth. For
example, the indicator that a child did not receive a polio vaccine at birth is available in Tanzania
starting with children born in 1991, but is not observed in two other countries (Burkina Faso and
10
Ghana) until 1994, and is not available for all countries until 1997. To prevent the birth year
effects from reflecting the experience of only a few countries, we “trim” the sample for each
outcome, so that regressions exclude birth years that do not have observations from at least three
countries. As a result of this trimming, estimates of models for specific antenatal care procedures
cover the 1995-2003 period; and polio at birth covers the 1994 to 2003 period. All other
estimates cover the 1988-2003 period.
4. Results
Table 4 presents estimates of equation (2), which measure the association between estimated
HIV prevalence in the year of birth and antenatal care. We present the coefficient on HIV
prevalence from OLS regressions for whether a woman reports having had prenatal care (column
1) and, conditional on reporting care, that she reports having had a urine test, blood pressure
measured, a blood test, or her weight measured (columns 2 to 5). The first row presents estimates
from equation (2) where, in addition to estimated HIV prevalence, the only other controls are
birth year indicators. The second row presents estimates from regressions that also include
country/region fixed effects, and mother and child characteristics.2
Women in regions with high HIV prevalence are significantly more likely to report
prenatal care. Relative to living in a region with zero prevalence, women living in a region with
10 percent HIV prevalence are 15 percentage points more likely to report antenatal care (top
panel, column 1). However, when we include country/region fixed effects, so that identification
comes from change in HIV prevalence within a region over time, we find that higher HIV
2 Estimates using probit models yield similar results.
11
prevalence is associated with a significantly lower probability of reporting antenatal care. This
suggests that the high prevalence areas started from higher levels of prenatal care, and that HIV
has taken a greater toll there on service delivery than in regions with low levels of HIV
prevalence. Conditional on reporting antenatal care, women in regions with higher HIV
prevalence are observed with lower probabilities of having urine and blood tests, and of
reporting that their blood pressure was taken. Controlling for country/region fixed effects
magnifies these differences, so that all four of the measures of quality of prenatal care are
significantly lower over time within a region as HIV prevalence rises. For example, within a
region where HIV prevalence increased by 10 percentage points between 1995 and 2003, a
woman is 18 percentage points less likely on average to report that her blood pressure was taken
during prenatal care if she was pregnant in 2003, relative a woman who was pregnant in 1995.
Table 5 presents results on the association between estimated HIV prevalence in the year
of birth and the quality of birth deliveries. Specifically, we estimate the association of HIV
prevalence with an indicator that the birth occurred in a clinic (column 1) and, conditional on a
clinic delivery, whether the clinic was public (column 2). In addition, we estimate the association
between HIV prevalence and a trained attendant being present at the birth (column 3). Again, the
results are markedly different with and without country/region fixed effects. In the absence of
fixed effects (row 1), we find delivery at a clinic is significantly more likely in regions with high
HIV prevalence. However, over time within a region (row 2), we find only a small, marginally
significant relationship between HIV prevalence and delivery at a clinic. Without fixed effects,
conditional on being a clinic birth, delivery is are significantly less likely to be at a public clinic.
However, this result is not robust to the inclusion of country/region fixed effects. Over time
within a region, conditional on a clinic delivery, higher HIV prevalence is not significantly
12
associated with the probability of the clinic being public. A disturbing finding in Table 5 is that,
within regions over time, those with higher HIV prevalence see a significant drop in the
probability that a trained birth attendant was present for the delivery. On average, a region that
experienced a 10 percentage point increase in the rate of HIV prevalence witnessed a 8
percentage point drop in the probability of a trained attendant at the birth.
Table 6 turns to children’s health care outcomes, and presents estimates of the association
between HIV prevalence and children not reported to have had a polio vaccine soon after birth
(column 1), or to have ever been immunized against polio, measles, BCG and DPT (columns 2 to
5). With the exception of the polio vaccine at birth, high estimated HIV prevalence in the year of
birth is significantly associated with ever having been immunized (row 1). However, within
regions over time, children in regions of high HIV prevalence are significantly less likely to be
vaccinated against any of these diseases. Relative to children born in a particular region with
zero HIV prevalence in 1988, those born in the same region in 2003 would be almost 20
percentage points less likely to be immunized against polio, and 10 percentage points less likely
to be immunized against measles, BCG or DPT if the prevalence rate had risen to 10 percent in
2003.
In summary, it appears that regions that are bearing the heaviest HIV burdens have
become less able to care for pregnant women, provide trained attendants for birth deliveries, and
immunize children.
These results are built on the assumptions that HIV prevalence has increased linearly
over time, and that prevalence has a linear relationship with our health care measures of interest.
Next, we relax these assumptions by estimating models of the form of equation (3), reproduced
here for convenience:

13
(3) .
Our estimates are shown graphically. Specifically, after estimating equation (3) for each health
outcome, we predict what the value of the outcome would be in each birth year, for four HIV
prevalence rates ( equal to 0, 5, 10 and 20 percent.) For these predictions, the region fixed
effects are averaged across all regions, and values of are replaced by their grand sample
means. We set 1997 to be the omitted birth-year category for both and , so that predicted
values are equal for all , by definition, in 1997 for all prevalence rates. It is important to keep in
mind that, in the discussion of these estimates, “HIV prevalence” refers to , the actual
prevalence in a region, measured using data from the most recent DHS survey.
Figure 4 shows results for the indicator of whether the mother received antenatal care.
Consistent with the estimates of equation (2), the figure indicates that in low prevalence regions,
the use of antenatal care increased over time—by approximately 10 percentage points from 1988
to 2003. However, this upward trend is less pronounced for higher prevalence rates. At 20
percent prevalence, antenatal care is relatively constant from 1988 to 1995, and then declines
from over 90 percent to less than 85 percent. Test statistics from the regression underlying Figure
1 are shown in the first row of Table 7. These indicate that the hypothesis that the birth year
effects are jointly insignificant can be rejected, as can the hypothesis that the birth year/HIV
prevalence interactions are jointly insignificant.
The last column in Table 7 shows the results of test of the hypothesis that the birth
year/HIV prevalence interactions follow a linear trend—or, in other words, that the parameter
restrictions imposed in equation (4) are valid. This hypothesis is also rejected. This is not
surprising, given that the changes in antenatal care at different prevalence rates shown in Figure

14
1 do not begin to diverge until the mid-1990’s. The rejection of the hypothesis of a linear trend
could be due to two factors. First, it could be that the evolution of HIV prevalence was highly
non-linear. Second, it could be that the adverse effects of HIV on antenatal care have increased
since the mid-1990’s. Without data on HIV prevalence over time, we cannot distinguish between
these two factors.
Results for the procedures women receive during antenatal care are shown in Figure 5.
Consistent with the results in Table 4, differences in all of these procedures are apparent across
high and low HIV prevalence regions, with the largest differences observed for urine tests and
blood pressure. The use of blood tests is predicted to decline for all HIV prevalence rates shown,
although more so for high HIV regions. Unlike the results for antenatal care discussed above, the
linearity restrictions cannot be rejected for three of the four measures. This may reflect the fact
that we do not have data on these measures prior to 1995. Without this information, we cannot
determine whether changes across birth years in the use of antenatal procedures were similar
across high and low prevalence regions prior to the mid-1990s.
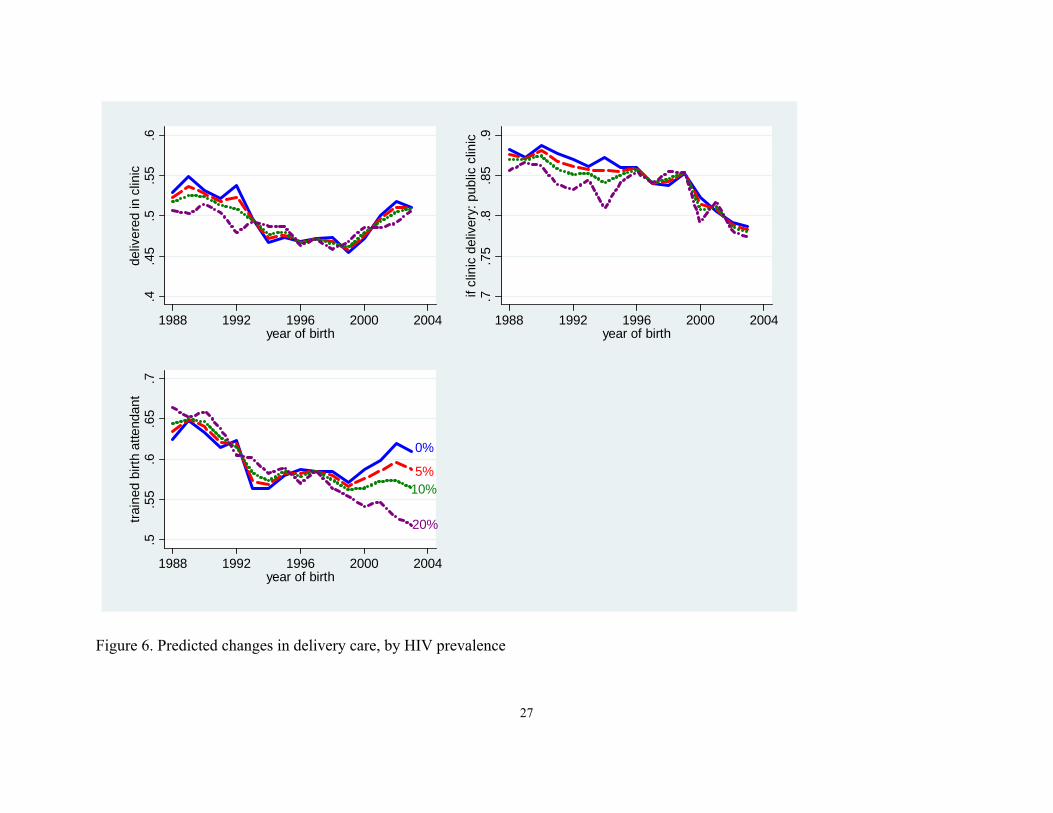
Results for delivery care, in Figure 6, indicate that the largest differences across higher
and lower HIV prevalence regions occur for the presence of a trained birth attendant. At 20
percent prevalence, the presence of a trained birth attendant declines almost continuously, from
over 65 percent in 1989 to less than 55 percent in 2003. At zero prevalence, the presence of a
trained birth attendant declines from 1988 to 1993 before leveling off and then increasing after
1999. Consistent with the results in Table 5, the there are only small differences across high and
low prevalence regions for the indicators for whether the mother delivered in a clinic, and
whether clinic deliveries occurred in a public clinic. The graphs indicate that, regardless of HIV
15
prevalence, clinic deliveries first decline from 1988 to the mid-1990’s, and then increase. There
is a steady shift from public to private clinics over this period.
Results for children’s vaccines are presented in Figures 7 and 8. In high HIV regions,
mothers were increasingly likely to report that their child had not received a polio vaccine
shortly after birth. For example, at 10 percent prevalence, the fraction of mothers who report no
vaccine is estimated to have increased from 45 percent to 60 percent. In contrast, low HIV
prevalence regions made gains in vaccinating children against polio shortly after birth. The
figures for the other vaccines are quite noisy, with large year-to-year fluctuations. However, the
general pattern is for high HIV regions to show increases in indicators that vaccines were not
given relative to low HIV regions.
Overall, the estimates of the less restrictive models, using equation (3), are consistent
with those reported in Tables 4-6: regions with high HIV prevalence rates experienced greater
deterioration in antenatal care, and larger declines in the use of trained birth attendants and
vaccinations, relative to low HIV regions. Estimates of the less restrictive models also allow us
to date when health care quality began to diverge across higher and lower HIV regions. For both
the use of antenatal care and the presence of a trained birth attendant, this divergence began in
the mid-1990’s. Our estimates for children’s vaccines, although noisy, also date the divergence
to this time.
5. Discussion
There are several possible, non-competing explanations for the deterioration of non-HIV related
health services observed in high prevalence regions. AIDS may have affected access to care.
AIDS may also have reduced the demand for non-HIV related health services through its effect
16
on households’ incomes. Alternatively, AIDS may have had little effect on demand for care, or
access to care, but have had a large effect on the quality of care available. We discuss these in
turn.
Access to care
AIDS-related illnesses may have crowded out access to medical care between 1995 and 2003.
This would have been prior to the arrival of antiretroviral therapy in nearly all regions, and it is
possible that the high morbidity rates among those infected with HIV took an ever larger toll on
access to care. High HIV burdens may have reduced funding for non-HIV-related medical issues,
producing closures of clinics or reductions in the range of services offered. Alternatively, high
HIV burdens could put upward pressure on user fees charged for non-HIV related services.
The DHS surveys provide some information on the problems women experienced with
access to services. Specifically, in the most recent surveys for all countries we examine except
Kenya, mothers are asked about problems they face accessing medical care. Specifically, they
are asked which of the following items were “a big problem with access to medical care”: (1) not
knowing where to go for care; (2) the distance required to get to care; (3) the lack of money to
pay for medical care; and (4) the lack of transportation to get to a facility. If HIV burdens were
responsible for forcing women to travel farther, or spend more to attend clinics, we would expect
to see a difference in responses among women in West Africa, where HIV rates are low, and
those in East and Southern Africa, where rates are high.
Tabulations of responses to these questions are in Table 8. For each outcome, we find a
uniform pattern across countries. Approximately 10 to 20 percent of women report not knowing
where to go for medical care; 40 percent report that distance is a problem; 60 percent say money
17
is an issue; and 40 percent say transportation is a problem. However, there is no divide between
high and low HIV countries. We also ran regressions of each of these variables on HIV
prevalence in the region, and a set of country dummies, and found no evidence that mothers
living in high-prevalence regions within countries reported worse access to care.
This result—that access to care measures are similar across low- and high-HIV countries
and regions within countries—provides suggestive but not conclusive evidence that HIV has not
altered access to care. It is possible that high-HIV countries (or regions within countries) had
better access to care prior to the HIV crisis, and that they have experienced more rapid
deteriorations in these measures of access. Indeed, our results on health care use presented
earlier indicate that, without controlling for region fixed effects, health care measures often look
better in high-HIV regions. However, once fixed effects are included—so we are essentially
looking at changes over time within region—we see a negative association between HIV
prevalence and health care. The same could be true for access to care. As more rounds of DHS
data are collected, it will be possible to examine within-region changes in access measures.
Demand for health services
Households in high-HIV regions may have become poorer, because of lost income due to illness,
increases in funeral expenses, or greater demands on household resources that result from having
to care for orphans. Lower wealth could, in turn, be responsible for the deterioration in health
care in high HIV regions. If so, we would expect that the estimated associations between
regional prevalence and health care will become smaller, in absolute value, when we control for
household wealth.
18
The DHS surveys do not contain measures of financial wealth. However, they do collect
information on household assets – ownership of bicycles, refrigerators, and radios, for example.
We construct a measure of household assets equal to the sum of indicators for the ownership of a
radio, television, refrigerator, bicycle, motorcycle and car. We first examine whether asset
ownership declined with HIV prevalence within regions. To test whether the HIV-prevalence
effect might be working through household resources, we re-ran equation (2), including a control
for the number of assets. We also estimated variants that included indicators for ownership of
each of the six assets separately.
Our results do not support the hypothesis that declines in wealth (as measured by assets)
in high-HIV regions account for the deterioration in the quality of health care. It is not the case
that the asset index declined significantly over time in high HIV-regions. Using a sample of
mothers (rather than births), we regressed the asset index on a set of survey year dummies,
country/region dummies, the mother’s age, education, an indicator for urban status, and
estimated HIV prevalence in the survey year. The coefficient on HIV prevalence was positive
(0.919) rather than negative, although not significantly different from zero. Estimates of (2) with
and without wealth indicators are in Table 9. The samples are somewhat smaller than those used
previously, since some waves of data did not contain comparable asset information. However, in
all cases, the addition of asset information has only small effects on the coefficient on HIV
prevalence.
Quality of health services
Our parametric and semi-parametric results suggest that it is not access to health services, but the
quality of services available, that is responsible for the decline in care we observe in our data.

19
Women continue to attend antenatal care clinics in very high numbers, but are receiving
significantly fewer diagnostic tests during their visits. They report delivering children in clinics,
but are significantly less likely to have a trained attendant at the delivery. These declines in
quality could be due to diversions of funds for supplies and trained medical professionals to care
for HIV patients. Whether the arrival of ART improves the quality of non-HIV related health
services – either directly, through provision of resources for medical care more broadly – or
indirectly, through a reduction in morbidity among HIV positive patients – is an important issue
requiring attention.
6. Conclusions
The next round of DHS data sets will be in the field after the arrival of ART in many regions.
When these data sets become available, we plan to assess whether ART improves the quality of
care received by pregnant women and children, or whether it further crowds out care for non-
AIDS-related medical care.
In the interim, care providers should take into account the fact that medical care in high
prevalence regions has not been adequate since the mid-1990s, which may affect the diseases
they face (measles, BCG, DPT) and the conditions they encounter (high under age 5 mortality)
as they prepare to provide services.
20
References
Colvin, Mark. 2005. “Impact of AIDS – the health care burden.” Chapter 22 in HIV/AIDS in South Africa, Salim Karim and Quarraisha Karim (eds.), Cambridge University Press. 336-350. Easterly, William. 2008. “Can the West save Africa?” National Bureau of Economic Research Working Paper 14363, forthcoming in the Journal of Economic Literature. England, Roger. 2008. “The writing is on the wall for UNAIDS.” BMJ 336 (10 May): 1072. Jones, Gareth, Richard W. Steketee, Robert E. Black, Zulfiqar A. Bhutta, Saul S. Morris and the Bellagio Child Survival Study Group. 2003. “How many child deaths can we prevent this year?” Lancet 362(9377): 65-71. Lancet. 1995. “Impact of HIV delivery of health care in sub-Saharan Africa: A tale of secrecy and inertia” [editorial]. 345(8961): 1315-7. McIntyre, Diane, Michael Thiede, Göran Dahlgren, and Margaret Whitehead. 2005. “What are the economic consequences for households of illness and of paying for health care in low- and middle-income country contexts?” Social Science & Medicine 62(4): 858-65.

21
Appendix Table 1
Most Recent Birth Only All Births, Last Five Years All Births, Last Three Years
Antenatal care BF4,CM4, GH4, KE4, MW4, MW3, TZ4, TZ2, ZM4, ZW5, ZW4
BF3,BF2, CM2, GH3, KE2, MW2, TZ1, TZ, ZM3, ZM2
CM3, GH2, KE3, ZW3
Antenatal procedures CM4, BF4, GH4, KE4, MW4, MW3, TZ4, ZM4, ZW5, ZW4
GH3
Polio vaccine shortly after birth
BF4(alive only), BF3(alive only), CM4 (alive only), GH4(alive only), GH3 (alive only), KE4 (alive only), MW4(alive only), MW3 (alive only), TZ4 (alive only), TZ2 (alive only), TZ1 (alive only), ZM4 (alive only)
CM3 (alive only), KE3(alive only)
Vaccines other than polio shortly after birth
BF4(alive only), B3(alive only), BF2(all), CM4(alive only), CM2(all), GH4 (alive only), GH3(alive only), GH1 (alive only), KE4(alive only), KE2(all), KE1(alive only), MW4 (alive only), MW3 (alive only), MW2 (all), TZ4 (alive only), TZ2 (alive only), TZ1 (alive only), TZ (all), ZM4 (alive only), ZM3 (alive only), ZM2 (all), ZW5 (alive only), ZW4 (alive only), ZW2(alive only)
CM3 (alive only), GH2(all), KE3(alive only), ZW3 (alive only),
Trained birth attendant BF4, BF3, BF2, CM4, CM2, GH4, GH3, GH1, KE4, KE2, KE1,MW4, MW3, MW2, TZ4, TZ2, TZ1, TZ, ZM4, ZM3, ZM2, ZW5, ZW4, ZW2
CM3, GH2, KE3, ZW3
Place of delivery
BF4, BF3, BF2, CM4, CM2, GH4, GH3, KE4, KE2, KE1, MW4, MW3, MW2, TZ4, TZ2, TZ1, TZ, ZM4, ZM3, ZM2, ZW5, ZW4, ZW2
CM3, GH2, KE3, ZW3

.2.3
.4.5
.6.7
.8.9
1ur
ine
test
1994 1996 1998 2000 2002 2004year of birth
GH.9
22
Figure 1. Prenatal care: urine tests, blood tests, blood pressure taken and weight taken, by country and birth year
CM.8
ZWKETZ
MWBF
ZM
.7.6
.51
bloo
d te
st.4
.3.2
1994 1996 1998 2000 2002 2004year of birth
.6.7
.8.9
1bl
ood
pres
sure
take
n
.98
.96
.94
.92
1w
eigh
t tak
en.9
1994 1996 1998 2000 2002 2004year of birth
1994 1996 1998 2000 2002 2004year of birth
ZW
GH
23
Figure 2. Birth deliveries: Attended by a trained professional, delivery in a clinic, delivery in a public clinic and delivery in a private clinic, by country and year of birth.
CMMWTZ
KEZM
BF
.4.5
.6.7
.8.9
train
ed a
ttend
ant .7
.6.5
.8cl
inic
del
iver
y.4
.3
1988 1992 1996 2000 2004year of birth
1988 1992 1996 2000 2004year of birth
.5.6
.7.3
.4.2
publ
ic c
linic
1988 1992 1996 2000 2004year of birth
.30
.1.2
priv
ate
clin
ic
1988 1992 1996 2000 2004year of birth
0.0
5.1
.15
.2H
IV p
reva
lenc
e by
regi
on
BF CM GH KE MW TZ ZM ZW
Figure 3. Regional HIV prevalence rates by country
24

.8.8
5.9
.95
1an
tena
tal c
are
1988 1990 1992 1994 1996 1998 2000 2002 2004year of birth
0% 5%10% 20%
HIV prevalence
Figure 4. Predicted changes in antenatal care, by HIV prevalence
25

0%
26
Figure 5. Predicted changes in antenatal procedures among those who receive antenatal care, by HIV prevalence
5%
10%
20%
.45
.5.5
5.6
.65
if A
C: u
rine
test .9
.85
.8.7
5.9
5if
AC
: blo
od p
resu
re ta
ken
1994 1996 1998 2000 2002 2004year of birth
1994 1996 1998 2000 2002 2004year of birth
.5.5
5.6
.65
.7if
AC
: blo
od te
st .95
.9.8
51
if A
C: w
eigh
t tak
en.8
1994 1996 1998 2000 2002 2004year of birth
1994 1996 1998 2000 2002 2004year of birth
.4.4
5.5
.55
.6de
liver
ed in
clin
ic
1988 1992 1996 2000 2004year of birth
.7.7
5.8
.85
.9if
clin
ic d
eliv
ery:
pub
lic c
linic
1988 1992 1996 2000 2004year of birth
0%
.65
.6
27
Figure 6. Predicted changes in delivery care, by HIV prevalence
5%10%
20%
.55
.7tra
ined
birt
h at
tend
ant
.5
1988 1992 1996 2000 2004year of birth

0%
28
Figure 7. Predicted changes in the lack of a polio vaccine shortly after the child’s birth, by HIV prevalence
5%
10%
20%.6
5.5
5.4
5.7
5no
pol
io a
t birt
h.3
5.2
5
1994 1996 1998 2000 2002 2004year of birth
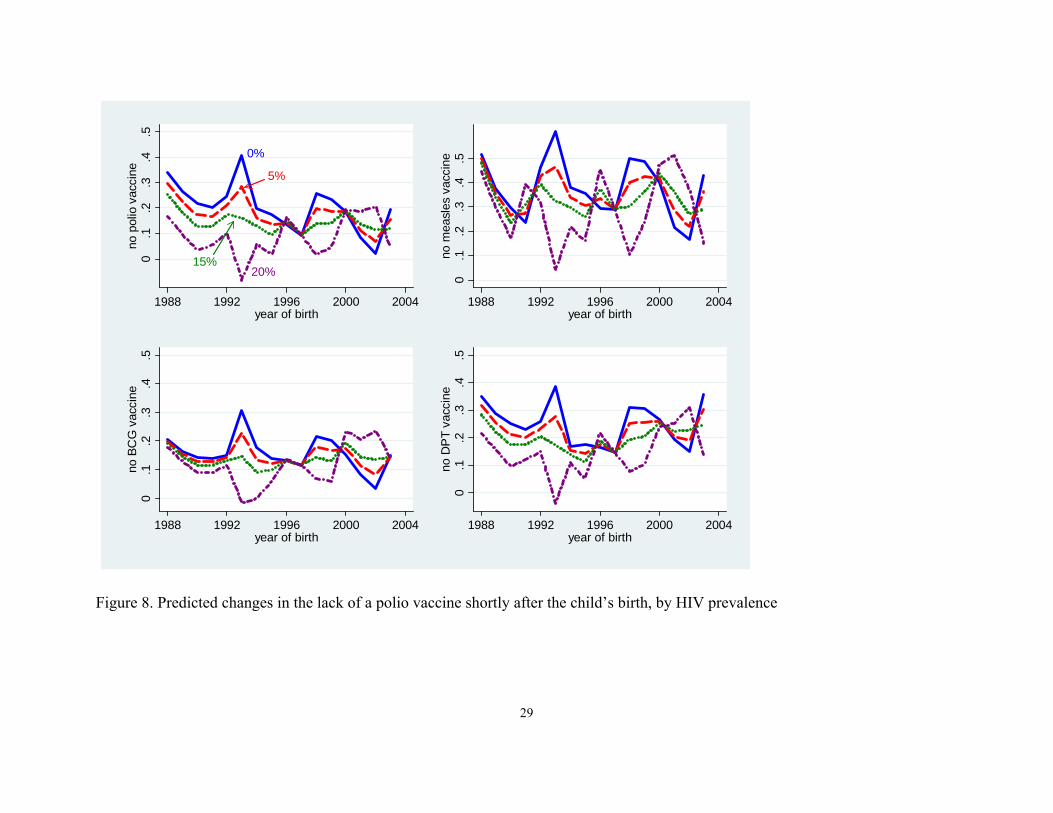
Figure 8. Predicted changes in the lack of a polio vaccine shortly after the child’s birth, by HIV prevalence
0%
20%
29
5%
15%0.1
.2.3
.4.5
no p
olio
vac
cine
1988 1992 1996 2000 2004year of birth
0.1
.2.3
.4.5
no m
easl
es v
acci
ne
1988 1992 1996 2000 2004year of birth
20001996 2004year of birth
19921988
.4.3
.2.1
.5no
DP
T va
ccin
e0
20001996 2004year of birth
19921988
.4.3
.2.1
.5no
BC
G v
acci
ne0
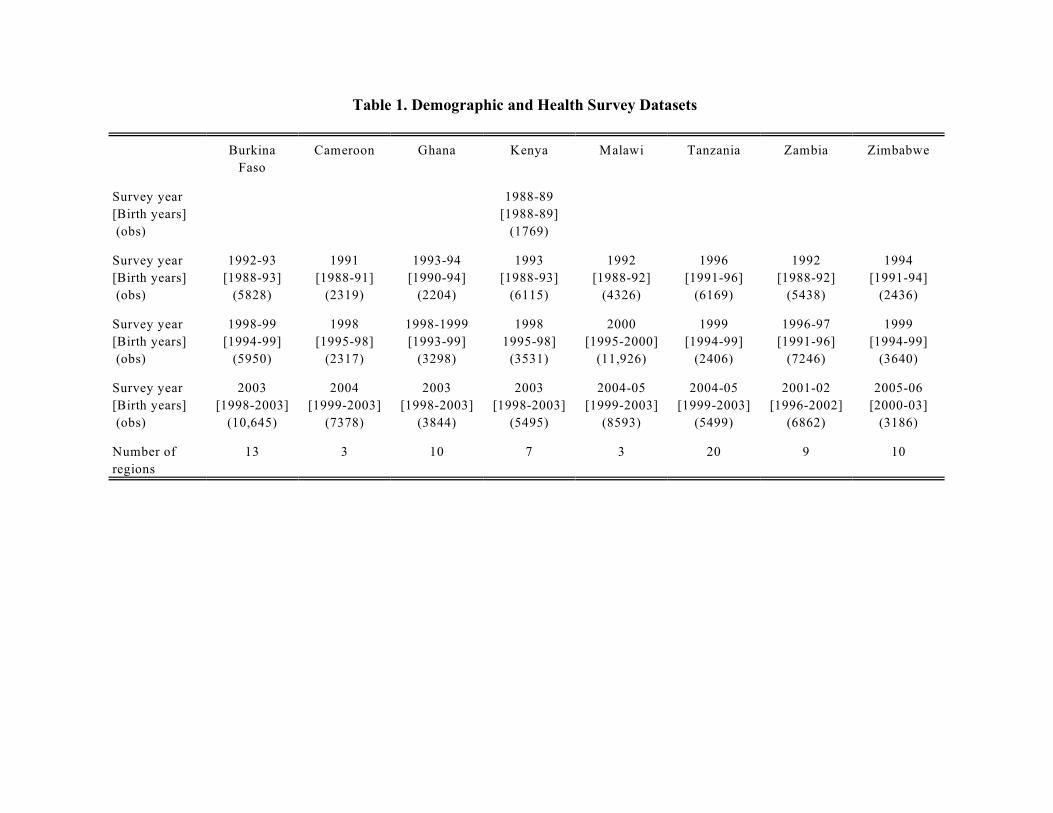
Table 1. Demographic and Health Survey Datasets
Burkina
Faso
Cameroon Ghana Kenya Malawi Tanzania Zambia Zimbabwe
Survey year
[Birth years]
(obs)
1988-89
[1988-89]
(1769)
Survey year
[Birth years]
(obs)
1992-93
[1988-93]
(5828)
1991
[1988-91]
(2319)
1993-94
[1990-94]
(2204)
1993
[1988-93]
(6115)
1992
[1988-92]
(4326)
1996
[1991-96]
(6169)
1992
[1988-92]
(5438)
1994
[1991-94]
(2436)
Survey year
[Birth years]
(obs)
1998-99
[1994-99]
(5950)
1998
[1995-98]
(2317)
1998-1999
[1993-99]
(3298)
1998
1995-98]
(3531)
2000
[1995-2000]
(11,926)
1999
[1994-99]
(2406)
1996-97
[1991-96]
(7246)
1999
[1994-99]
(3640)
Survey year
[Birth years]
(obs)
2003
[1998-2003]
(10,645)
2004
[1999-2003]
(7378)
2003
[1998-2003]
(3844)
2003
[1998-2003]
(5495)
2004-05
[1999-2003]
(8593)
2004-05
[1999-2003]
(5499)
2001-02
[1996-2002]
(6862)
2005-06
[2000-03]
(3186)
Number of
regions
13 3 10 7 3 20 9 10
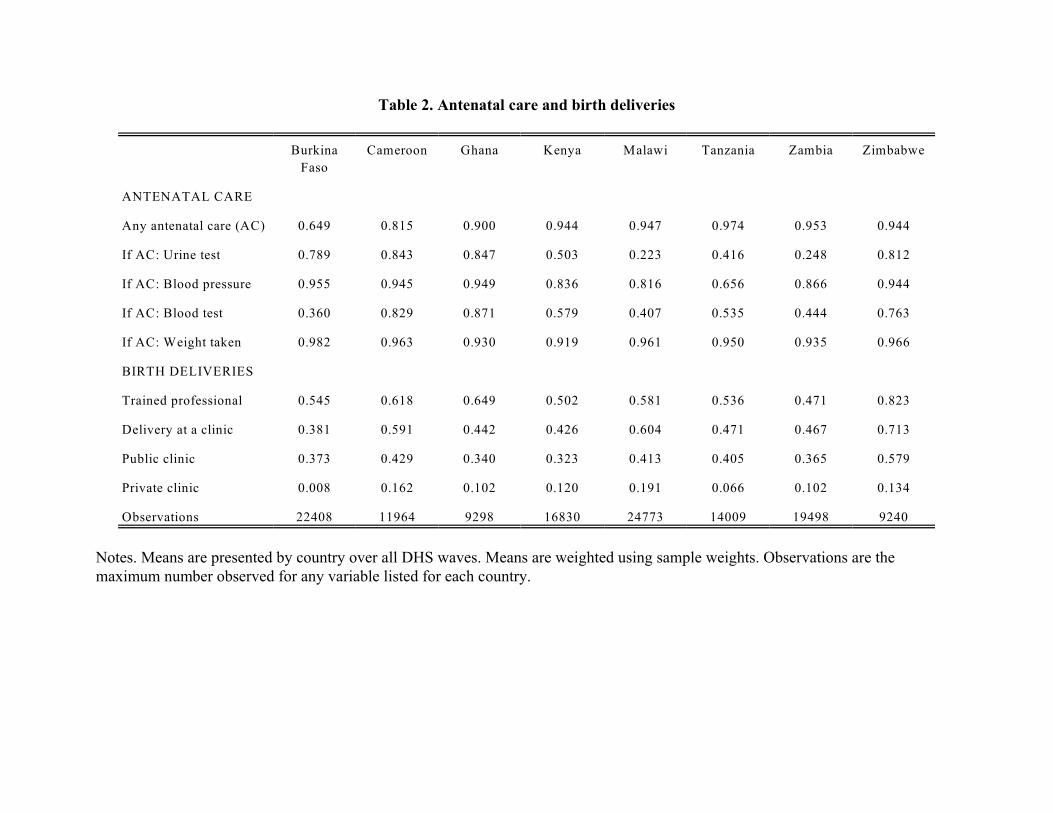
Table 2. Antenatal care and birth deliveries
Burkina
Faso
Cameroon Ghana Kenya Malawi Tanzania Zambia Zimbabwe
ANTENATAL CARE
Any antenatal care (AC) 0.649 0.815 0.900 0.944 0.947 0.974 0.953 0.944
If AC: Urine test 0.789 0.843 0.847 0.503 0.223 0.416 0.248 0.812
If AC: Blood pressure 0.955 0.945 0.949 0.836 0.816 0.656 0.866 0.944
If AC: Blood test 0.360 0.829 0.871 0.579 0.407 0.535 0.444 0.763
If AC: Weight taken 0.982 0.963 0.930 0.919 0.961 0.950 0.935 0.966
BIRTH DELIVERIES
Trained professional 0.545 0.618 0.649 0.502 0.581 0.536 0.471 0.823
Delivery at a clinic 0.381 0.591 0.442 0.426 0.604 0.471 0.467 0.713
Public clinic 0.373 0.429 0.340 0.323 0.413 0.405 0.365 0.579
Private clinic 0.008 0.162 0.102 0.120 0.191 0.066 0.102 0.134
Observations 22408 11964 9298 16830 24773 14009 19498 9240
Notes. Means are presented by country over all DHS waves. Means are weighted using sample weights. Observations are themaximum number observed for any variable listed for each country.
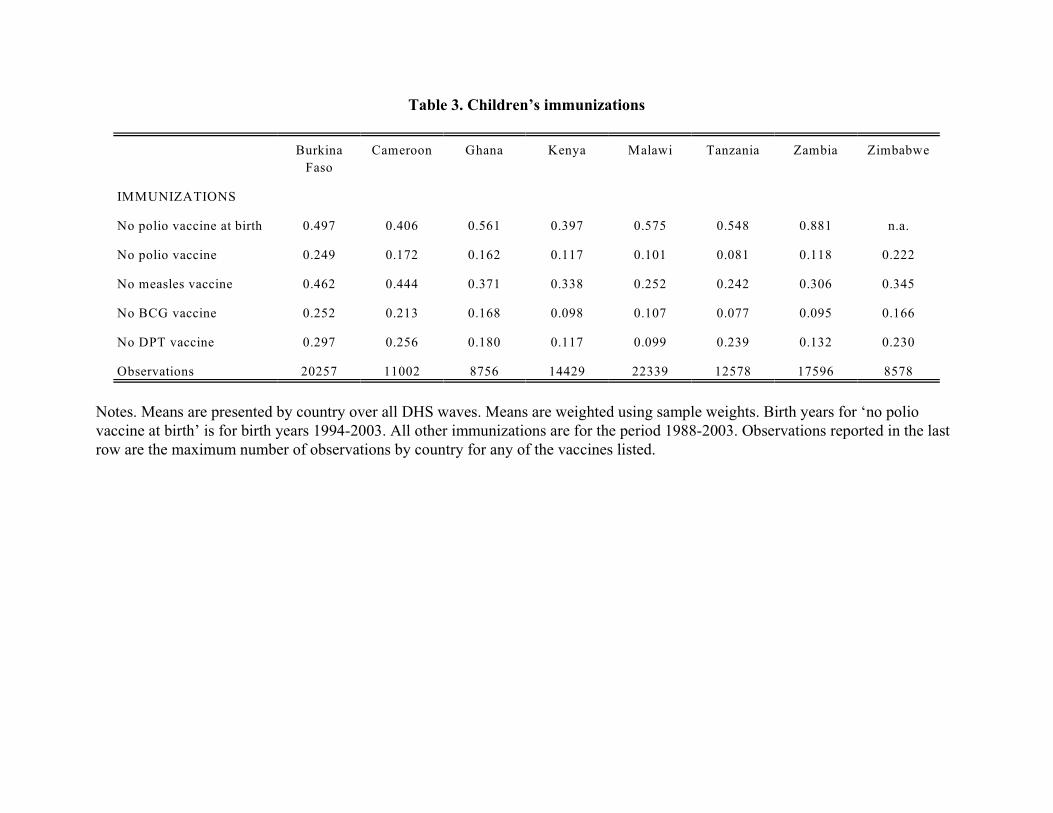
Table 3. Children’s immunizations
Burkina
Faso
Cameroon Ghana Kenya Malawi Tanzania Zambia Zimbabwe
IMMUNIZATIONS
No polio vaccine at birth 0.497 0.406 0.561 0.397 0.575 0.548 0.881 n.a.
No polio vaccine 0.249 0.172 0.162 0.117 0.101 0.081 0.118 0.222
No measles vaccine 0.462 0.444 0.371 0.338 0.252 0.242 0.306 0.345
No BCG vaccine 0.252 0.213 0.168 0.098 0.107 0.077 0.095 0.166
No DPT vaccine 0.297 0.256 0.180 0.117 0.099 0.239 0.132 0.230
Observations 20257 11002 8756 14429 22339 12578 17596 8578
Notes. Means are presented by country over all DHS waves. Means are weighted using sample weights. Birth years for ‘no poliovaccine at birth’ is for birth years 1994-2003. All other immunizations are for the period 1988-2003. Observations reported in the lastrow are the maximum number of observations by country for any of the vaccines listed.
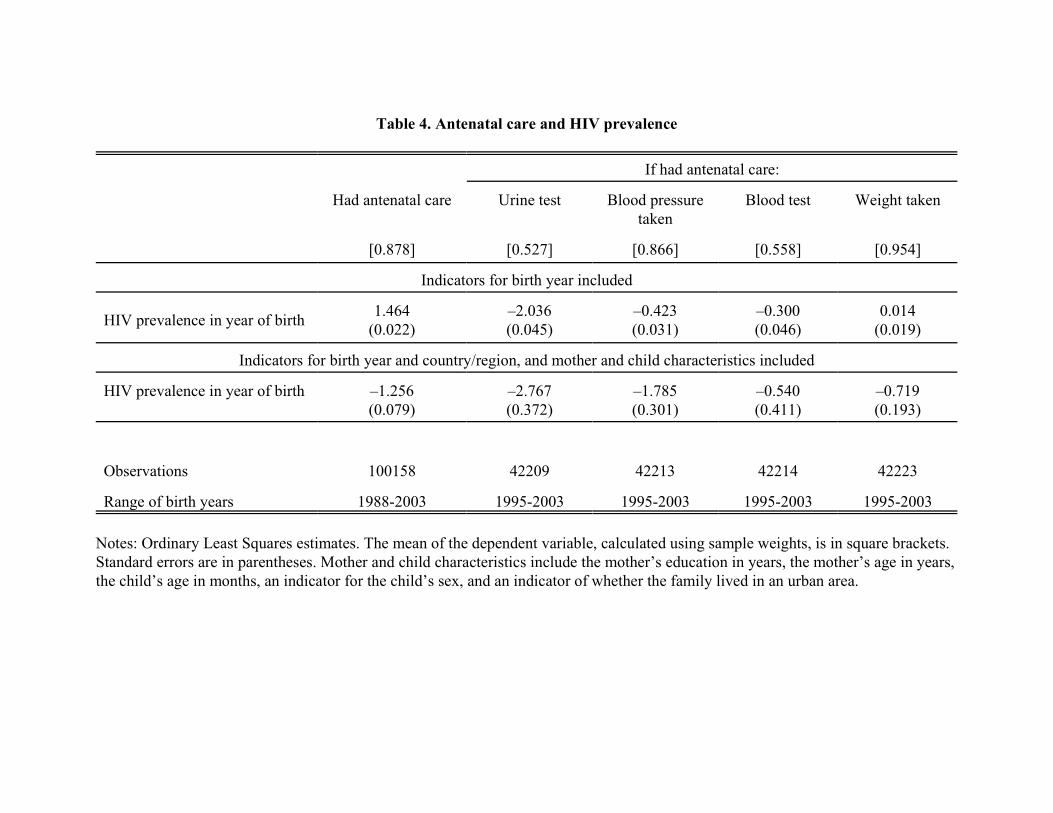
Table 4. Antenatal care and HIV prevalence
If had antenatal care:
Had antenatal care Urine test Blood pressuretaken
Blood test Weight taken
[0.878] [0.527] [0.866] [0.558] [0.954]
Indicators for birth year included
HIV prevalence in year of birth1.464
(0.022)–2.036(0.045)
–0.423(0.031)
–0.300(0.046)
0.014(0.019)
Indicators for birth year and country/region, and mother and child characteristics included
HIV prevalence in year of birth –1.256(0.079)
–2.767(0.372)
–1.785(0.301)
–0.540(0.411)
–0.719(0.193)
Observations 100158 42209 42213 42214 42223
Range of birth years 1988-2003 1995-2003 1995-2003 1995-2003 1995-2003
Notes: Ordinary Least Squares estimates. The mean of the dependent variable, calculated using sample weights, is in square brackets.Standard errors are in parentheses. Mother and child characteristics include the mother’s education in years, the mother’s age in years,the child’s age in months, an indicator for the child’s sex, and an indicator of whether the family lived in an urban area.

Table 5. Care at delivery and HIV prevalence
Delivered in a publicor private clinic
If delivered in a clinic, clinic was public
Had a trained birthattendant
[0.500] [0.785] [0.565]
Indicators for birth year included
HIV prevalence in year of birth1.651
(0.031)–0.782(0.035)
0.684(0.031)
Indicators for birth year and country/region, and mother and child characteristics included
HIV prevalence in year of birth 0.250(0.113)
0.227(0.139)
–0.833(0.115)
Observations 125934 64215 124219
Range of birth years 1988-2003 1988-2003 1988-2003
Notes: Ordinary Least Squares estimates. The mean of the dependent variable, calculated using sample weights, is in square brackets.Standard errors are in parentheses. Mother and child characteristics include the mother’s education in years, the mother’s age in years,the child’s age in months, an indicator for the child’s sex, and an indicator of whether the family lived in an urban area.

Table 6. Child immunizations and HIV prevalence
no polio vaccine at birth
no polio vaccine no measlesvaccine
no BCGvaccine
no DPT vaccine
[0.537] [0.149] [0.340] [0.145] [0.189]
Indicators for birth year included
HIV prevalence in year of birth1.198
(0.040)–0.370(0.023)
–0.953(0.030)
–0.669(0.022)
–0.832(0.025)
Indicators for birth year and country/region, and mother and child characteristics included
HIV prevalence in year of birth 6.397(0.333)
1.846(0.089)
0.950(0.109)
1.283(0.087)
0.974(0.097)
Observations 72233 115486 115000 115526 115461
Range of birth years 1994-2003 1988-2003 1988-2003 1988-2003 1988-2003
Notes: Ordinary Least Squares estimates. The mean of the dependent variable, calculated using sample weights, is in square brackets.Standard errors are in parentheses. Mother and child characteristics include the mother’s education in years, the mother’s age in years,the child’s age in months, an indicator for the child’s sex, and an indicator of whether the family lived in an urban area.
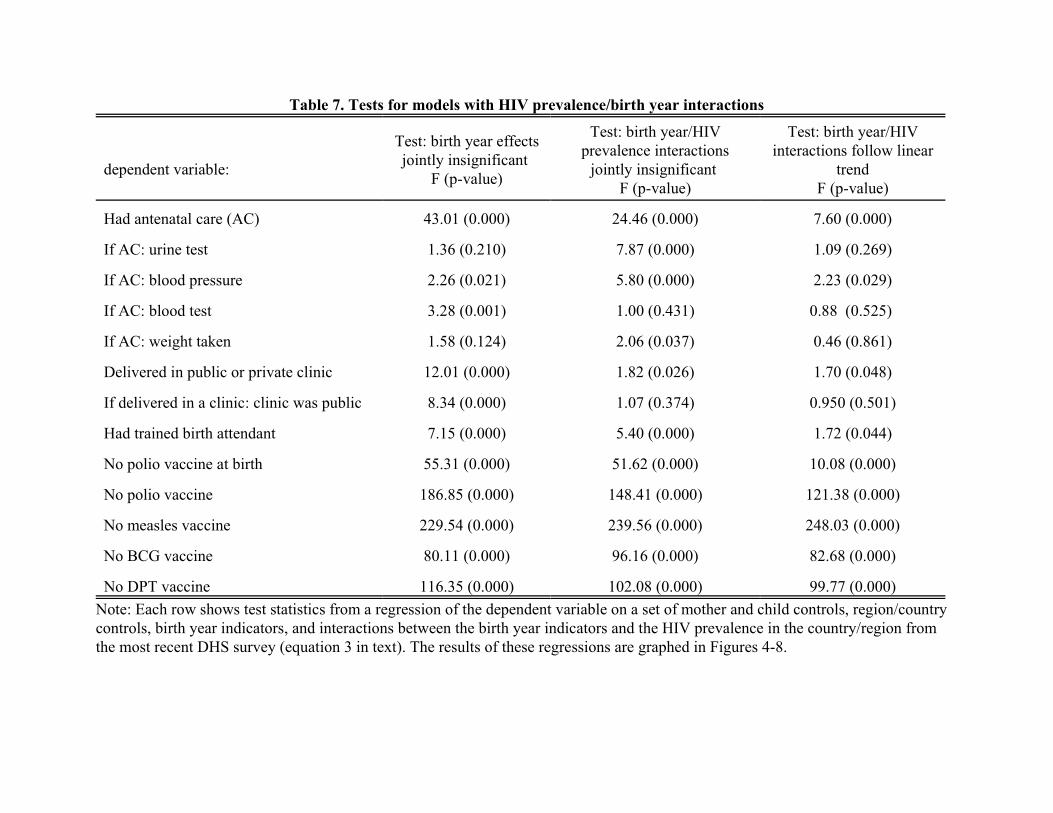
Table 7. Tests for models with HIV prevalence/birth year interactions
dependent variable:
Test: birth year effectsjointly insignificant
F (p-value)
Test: birth year/HIVprevalence interactions
jointly insignificant F (p-value)
Test: birth year/HIVinteractions follow linear
trendF (p-value)
Had antenatal care (AC) 43.01 (0.000) 24.46 (0.000) 7.60 (0.000)
If AC: urine test 1.36 (0.210) 7.87 (0.000) 1.09 (0.269)
If AC: blood pressure 2.26 (0.021) 5.80 (0.000) 2.23 (0.029)
If AC: blood test 3.28 (0.001) 1.00 (0.431) 0.88 (0.525)
If AC: weight taken 1.58 (0.124) 2.06 (0.037) 0.46 (0.861)
Delivered in public or private clinic 12.01 (0.000) 1.82 (0.026) 1.70 (0.048)
If delivered in a clinic: clinic was public 8.34 (0.000) 1.07 (0.374) 0.950 (0.501)
Had trained birth attendant 7.15 (0.000) 5.40 (0.000) 1.72 (0.044)
No polio vaccine at birth 55.31 (0.000) 51.62 (0.000) 10.08 (0.000)
No polio vaccine 186.85 (0.000) 148.41 (0.000) 121.38 (0.000)
No measles vaccine 229.54 (0.000) 239.56 (0.000) 248.03 (0.000)
No BCG vaccine 80.11 (0.000) 96.16 (0.000) 82.68 (0.000)
No DPT vaccine 116.35 (0.000) 102.08 (0.000) 99.77 (0.000)
Note: Each row shows test statistics from a regression of the dependent variable on a set of mother and child controls, region/countrycontrols, birth year indicators, and interactions between the birth year indicators and the HIV prevalence in the country/region fromthe most recent DHS survey (equation 3 in text). The results of these regressions are graphed in Figures 4-8.
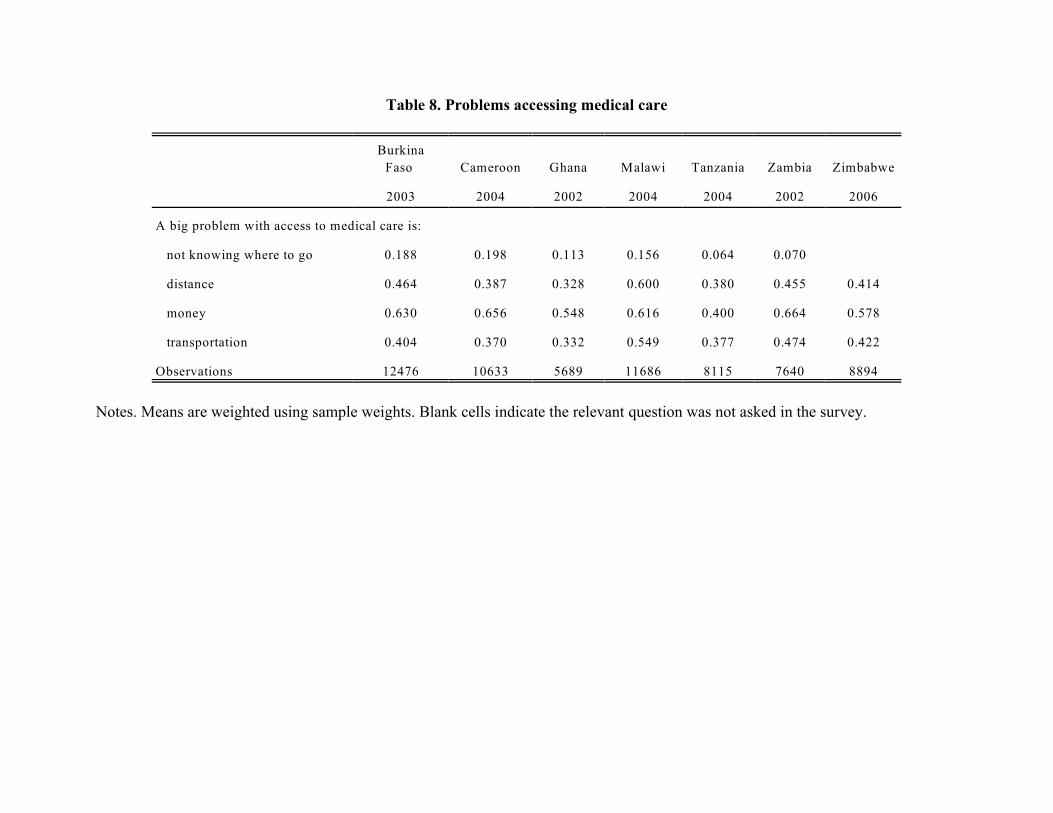
Table 8. Problems accessing medical care
Burkina
Faso Cameroon Ghana Malawi Tanzania Zambia Zimbabwe
2003 2004 2002 2004 2004 2002 2006
A big problem with access to medical care is:
not knowing where to go 0.188 0.198 0.113 0.156 0.064 0.070
distance 0.464 0.387 0.328 0.600 0.380 0.455 0.414
money 0.630 0.656 0.548 0.616 0.400 0.664 0.578
transportation 0.404 0.370 0.332 0.549 0.377 0.474 0.422
Observations 12476 10633 5689 11686 8115 7640 8894
Notes. Means are weighted using sample weights. Blank cells indicate the relevant question was not asked in the survey.
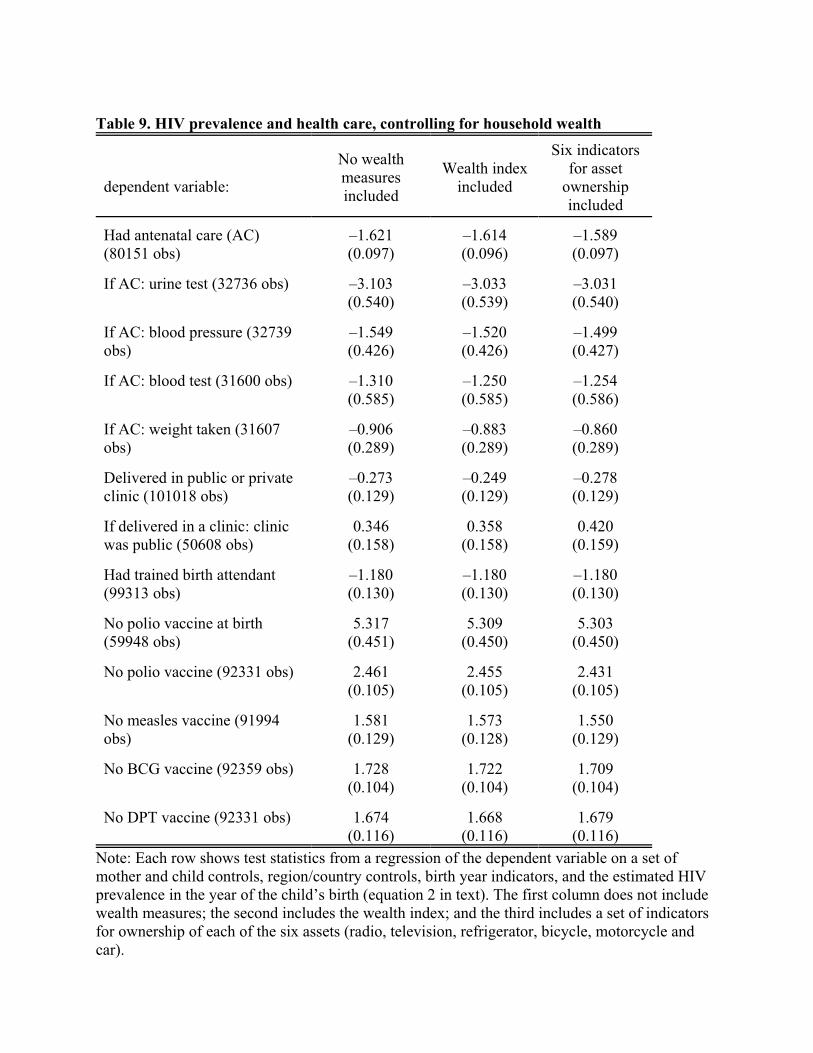
Table 9. HIV prevalence and health care, controlling for household wealth
dependent variable:
No wealthmeasuresincluded
Wealth indexincluded
Six indicatorsfor asset
ownershipincluded
Had antenatal care (AC)(80151 obs)
–1.621(0.097)
–1.614(0.096)
–1.589(0.097)
If AC: urine test (32736 obs) –3.103(0.540)
–3.033(0.539)
–3.031(0.540)
If AC: blood pressure (32739obs)
–1.549(0.426)
–1.520(0.426)
–1.499(0.427)
If AC: blood test (31600 obs) –1.310(0.585)
–1.250(0.585)
–1.254(0.586)
If AC: weight taken (31607obs)
–0.906(0.289)
–0.883(0.289)
–0.860(0.289)
Delivered in public or privateclinic (101018 obs)
–0.273(0.129)
–0.249(0.129)
–0.278(0.129)
If delivered in a clinic: clinicwas public (50608 obs)
0.346(0.158)
0.358(0.158)
0.420(0.159)
Had trained birth attendant(99313 obs)
–1.180(0.130)
–1.180(0.130)
–1.180(0.130)
No polio vaccine at birth(59948 obs)
5.317(0.451)
5.309(0.450)
5.303(0.450)
No polio vaccine (92331 obs) 2.461(0.105)
2.455(0.105)
2.431(0.105)
No measles vaccine (91994obs)
1.581(0.129)
1.573(0.128)
1.550(0.129)
No BCG vaccine (92359 obs) 1.728(0.104)
1.722(0.104)
1.709(0.104)
No DPT vaccine (92331 obs) 1.674(0.116)
1.668(0.116)
1.679(0.116)
Note: Each row shows test statistics from a regression of the dependent variable on a set ofmother and child controls, region/country controls, birth year indicators, and the estimated HIVprevalence in the year of the child’s birth (equation 2 in text). The first column does not includewealth measures; the second includes the wealth index; and the third includes a set of indicatorsfor ownership of each of the six assets (radio, television, refrigerator, bicycle, motorcycle andcar).