the impact of the data protection regulation in the e.u
TRANSCRIPT

The Impact of the Data ProtectionRegulation in the E.U.
by L. Christensen*, A. Colciago**, F. Etro*** and G. Rafert*1
February 13, 2013
JEL classi�cation: L1, J6, O3Keywords: IT investment, Endogenous market structures, Legislative
Framework in the E.U.
Executive Summary
We evaluate the impact of the proposed EU Data Protection Regula-tion on small and medium sized enterprises (�SMEs�), with a speci�cfocus on job growth and business creation. We �nd that information-intensive SMEs are likely to incur signi�cant costs in complying with theEU Data Protection Regulation and that these costs are likely to haveeconomy-wide impacts.As has been noted by others, compliance with these new rules will
impose a number of costs on SMEs including the need to hire additionalpersonnel, purchase new IT software, and consult with data protectionauthorities in advance of certain new projects. Furthermore, rules limit-ing the use of personal information, particularly in advertising, will im-pact all businesses engaged in targeted consumer marketing. Given thatSMEs increasingly rely on online advertising to drive revenue growth,the economic impact is likely to be substantial and widespread.
1* Analysis Group, Denver. ** University of Milan, Bicocca. *** Ca�FoscariUniversity, Venice. Disclaimer: funding for this paper was provided by Google. Allopinions contained in this study re�ect the independent views and analysis of theauthors alone.
1
To determine the impact of the EU Data Protection Regulation, we�rst estimated the direct costs likely to be incurred by SMEs. Each arti-cle within the regulation was reviewed and only articles deemed to havesigni�cant costs or bene�ts were selected. Where possible, we used theEC Impact Assessment on the reform of the data protection regulatoryframework report as a starting point for our calculations. Baseline costsand bene�ts were reviewed and modi�ed based on third party research toestimate the cost of each article group to an SME. Using this methodol-ogy, we estimate that the average SME in the EU can expect its annualcosts to increase by between approximately e3,000 and e7,200, depend-ing on the industry in which that SME is located; this represents between16 and 40 percent of current annual SME IT budgets.Based on these estimates, we then simulated the impact of the EU
Data Protection Regulation on business and job creation. Our simulationshows a substantial negative impact of the introduction of the EU DataProtection Regulation on business creation and employment. The reduc-tion in employment and the number of operating �rms is most severe inthose sectors where compliance with the EU Data Protection Regulationwill imply higher operating �xed costs for �rms. For example, the e¤ectis stronger in sectors where a large fraction of �rms will be subject tothe designation of a DPO. Among the industrial sectors that we con-sider, the one most severely a¤ected by the regulation is the Real Estateand Business Activities sector, which experiences a decline in employ-ment of between 0.2 and 0.6 percent a reduction in the number of marketcompetitors of between 3 and 5 percent.
2

1 Introduction
Policymaking and regulation at the centralized level of a union of coun-tries such as the European Union requires a correct balance between thebene�ts of the harmonization of policies and the internalization of cross-country spillovers and the costs related to heterogenous preferences ofthe countries that take a decision in common. This trade-o¤ is at thebasis of any cost-bene�t analysis concerning decisions centralized at aunion level (Alesina et al., 2005). An interesting example is emerging inthe debate on the new European regulation on data protection, whichlays down rules relating to the protection of individuals with regard tothe processing of personal data and represents an attempt to harmonizedi¤erent national regulations introducing a number of new requirementsto business and a new complex regulatory framework.This paper contributes to the debate by evaluating the impact of
the proposed EU Data Protection Regulation2 on small and mediumsized enterprises (SMEs) with a speci�c focus on the compliance costsassociated to the direct application of the new regulation and to theindirect e¤ects on job growth and business creation. Compliance withthe proposed regulation poses a number of challenges for �rms. The�rst challenge concerns the design of systems and procedures for dataprotection. In particular, under the proposed regulation, �rms must de-velop data management systems that allow for greater �exibility suchas the right to data portability (i.e. the right to transfer data from oneelectronic processing system to another), as well as the right of data sub-jects (identi�ed natural persons) to obtain personal data in a structured,commonly used electronic format. In addition, data protection impactassessments must be incorporated into IT project management so that�rms can identify and mitigate speci�c risks associated with data theprocessing of personal data. Another major challenge is the designationof a data protection o¢ cer (DPO). This obligation will apply to all pub-lic sector bodies and enterprises with 250 or more employees, as well asto �rms whose core activity involves the monitoring of data subjects.The controller (the entity that determines the purposes, conditions andmeans of the processing of personal data) and the processor (the entitythat actually processes personal data on behalf of the controller) will besubject to di¤erent obligations and, possibly also to di¤erent supervi-sory authorities (which still can create useless duplication costs),3 and
2See http://ec.europa.eu/justice/data-protection/document/review2012/com_2012_11_en.pdf.3Problems of duplication are reduced in many cases with this new regulation,
but not for entities that happen to be both controllers and processors. A clearerdistinction between the status of controller and the status of processor would beuseful to identify which supervisory authority has jurisdiction. The controller should
3

will have to ensure that the DPO is involved in all issues that relateto the protection of personal data and maintain detailed documentationon all processing operations. Substantial costs of the regulation will beassociated also with the compulsory noti�cation of any data breach in24 hours to the supervisory authority and without undue delay to thedata subjects, which is extremely demanding, especially for non-seriousdata breaches. Together, these and several additional articles will resultin additional added costs for �rms, depending on the type and amountof information processed.However, it should be noted that some of the proposed articles within
the legislation will reduce costs for �rms. For example, the "one-stop-shop" principle reduces some compliance costs ensuring that data con-trollers and data processors that operate across countries are typicallyregulated by a single supervisory authority, though this is not the case forcompanies that happen to be both data controllers and data processorsin di¤erent countries (for instance cloud computing providers). More-over, binding corporate rules will potentially reduce legal ambiguity sur-rounding data transfers, and joint operations on the part of supervisoryauthorities will reduce bureaucratic burdens. There is an importante¤ort in promoting secure data transfers, which is crucial for the de-velopment and the di¤usion of cloud computing; however more needsto be done, for instance supporting and standardizing a stronger andmore transparent protection of data that are transfered outside the E.U.for cloud computing services. Both the costs and the bene�ts of theproposed regulation have been taken into consideration in our analysis.Finally, it is important to remark that we did not take in considerationthe expected costs associated with the administrative sanctions, whosehomogenous application to all companies (without distinction betweenintentional and unintentional harm) may create unfair and dispropor-tionate burden on SMEs that will not comply with the regulation forreasons di¤erent from repeated negligence.Our estimates of the average expected costs and bene�ts of compli-
ance for SMEs suggest that the net costs are large and, most of all,larger than what could be expected for instance from the evaluation ofthe Impact Assessment prepared by the European Commission. How-ever, beyond these direct costs, there are indirect macroeconomic coststhat are more di¢ cult to measure: these are due to the impact thatthese additional costs have on the process of business creation and jobcreation, and they are the main focus of this work.We simulate the impact of the new regulation on the process of busi-
be the entity that determines the reason why data are processed and the processorthe entity that determines how the same data are actually processed.
4

ness and job creation using a dynamic stochastic general equilibriummodel with endogenous market structures and search frictions in thelabor market.4 The production structure of the �nal goods is basedon Etro and Colciago (2010), augmented with a description of the la-bor market with search frictions and endogenous unemployment as inColciago and Rossi (2010).The economy features four types of �rms. The producers of inter-
mediate goods, the �nal good producer, the producers of IT materialand the providers of data management services. The intermediate goodsindustry, features many sectors where the dynamics of the number ofmarket competitors is endogenous. In this industry �rms face a sunkcost of entry in the market, which they decide to incur if su¢ cientlycompensated by the expectation of future pro�ts. Goods are producedusing labor and IT which can be interpreted as hardware but also as thestock of data stored at each �rm.The industry producing IT adopts physical capital as the only input,
while in the industry providing data management services the input islabor. The labor market is characterized by frictions as in the literatureon job search and matching (see Mortensen and Pissarides, 1994; Merz,1995; Andolfatto, 1996; Pissarides, 2000). In the intermediate goodsindustry, both new �rms and incumbent �rms need to hire workers fromthe pool of unemployed agents who are looking for a job and to set up astock of IT before starting production. Similarly, the industry providingdata management services faces labor market frictions.The model counterpart of the introduction of the EU Data Protection
Regulation data protection legislative framework can be is illustrated inthe following as follows. In order to mimic the need to install a DPO, weassume that the intermediate goods producers will incur a period �xedcost. The designation of a DPO can be regarded as a �xed cost since itdoes not scale with the size of the �rm or the number of data records.The development of a data management systems is, instead, a variablecost for the �rm, which depends on the amount of data processed, ormore generally on the number of projects currently developed at a �rm.For this reason, the model counterpart of this requirement will be anincrease in the units of data management services necessary to deal witheach unit of information involved in the production process.Since the introduction of the EU Data Protection Regulation data
protection act represents a permanent shock to the cost function of �rms,we compute numerically a transition from the pre-reform steady stateto the post reform steady state of the economy we have just described.
4For a survey of the literature on endogenous market structures and its applica-tions see Etro (2013).
5

We consider two possible scenarios. A baseline case where the increasein costs for the �rms is calibrated according to the estimates that weprovide in Section 2, and an alternative scenario where the increase incosts represents half of the estimated value.Our simulation shows a substantial negative impact of the introduc-
tion of the EU Data Protection Regulation data protection legislativeframework on business creation and employment under both scenarios.Among the industrial sectors that we consider, the one most severelya¤ected by the regulation is the Real Estate and Business Activitiessector. The latter displays a reduction in the long-run sectoral employ-ment from 0.2 to 0.6 percent, together with a reduction in the numberof market competitors ranging from 3 to 5 percent. The reduction inemployment and the number of operating �rms is particularly severe inthose sectors where compliance with the EU Data Protection Regulationdata protection act will imply higher operating �xed costs for �rms. Forexample, the e¤ect is stronger in sectors where a large fraction of �rmswill be subject to the designation of a DPO. As a result, policymakersshould promote �scal incentives for those �rms which will be subject tohigh implementation costs, with particular reference to those subject tothe DPO requirement.Notice that the empirical literature supports the view that �rms dy-
namics is an important factor to take into account when explaining thedynamics of job creation and hence unemployment. Haltiwanger et al.(2010), on the basis of U.S. manufacturing data between 1972 and 1986,estimate that 25 percent of annual gross job creation is due to the cre-ation of new establishments. Similarly, Jaimovich and Floetotto (2008)focus on employment data at the establishment level; they estimate thatthe average fraction of quarterly job-gains (losses) that can be explainedby the opening (closing) of establishments is about 20 percent. There-fore, our analysis of job creation derived from business creation is wellfounded in the macroeconomic empirical literature.The remainder of the paper is organized as follows. Section 2 esti-
mates the cost impact of the compliance with the new rules. Section 3provides a non-technical summary of the modelling approach and of themain results. Section 4 develops the analysis at a more technical level.The reader not interested in technical details can safely skip section 4.Section 5 concludes.
2 The E¤ects of the Data protection LegislativeFramework and its Costs
The proposed EU Data Protection Regulation contains a number of ar-ticles and clauses that will signi�cantly impact small and medium sized
6

enterprises (SMEs) in the EU.5 We provide here a brief descriptions ofthe most relevant, for our analysis, articles of the data protection regu-lation.Articles 5, 19, 20: Principle of minimization of data process-
ing and right to object to pro�ling.Personal data must be processed for speci�ed, explicit and legitimate
purposes only and limited to the minimum necessary in relation to theirpurposes. The data subject has the right to object free of charge to dataprocessing for purposes of direct marketing or targeted advertising.Article 7: Conditions for consent.Clari�es the conditions for consent to be valid as a legal ground for
lawful processing: the controller bears the burden of proof for the datasubject�s consent to data processing and this consent can be withdrawnat any time.Article 8: Processing of personal data of a child.Processing of children�s�personal data in relation to information ser-
vices o¤ered directly to them.Article 11: Principle of transparency of information and
communication.The controller shall have transparent and easily accessibly policies
for processing personal data and shall provide information related tothis data to the data subject.Articles 12, 17, 18: Right to data portability and right to
be forgotten.Right to receive information within a month and free of charge for
data subjects, right to obtain erasure of personal data, right to dataportability, i.e. to transfer data from one electronic processing systemto and into another, and to obtain data in structured, commonly usedelectronic format.Article 22: Responsibility of the controller.Obligation of the controller to comply with the Regulation by way of
adoption of internal policies and mechanisms for ensuring compliance,including keeping the necessary documentation, implementing the datasecurity requirements, performing a data protection impact assessment,complying with the requirements for prior authorization of the supervi-sory authority and designating a DPO.Articles 23, 33: Data protection by design and by default
and the Data protection impact assessment (DPIA).
5�SMEs are de�ned by the European Commission as having less than 250 personsemployed.� Eurostat Small and Medium Sized Businesses, accessed Nov 20, 2012,http://epp.eurostat.ec.europa.eu/portal/page/portal/european_business/special_sbs_topics/small_medium_sized_enterprises_SMEs.
7

Obligations of data controller from principles of data protection bydesign and by default: data protection by design involves taking dataprotection into account in the design of systems and procedures; dataprotection by default requires that mechanisms are established by thedata controller to ensure a minimum amount of processing of personaldata. Requirement that data controllers must undertake a DPIA (dataprotection impact assessment) on data processing which presents spe-ci�c risks to the rights and freedoms of data subjects by virtue of theirnature, scope or purposes (for instance monitoring publicly accessibleareas, especially when using optic-electronic devices on a large scale).Articles 24, 25: Joint controllers; Representatives of con-
trollers not established in the Union.When a controller processes data jointly with others, the joint con-
trollers shall determine their respective responsibilities for complianceunder the Regulation. Where the Regulation applies to their process-ing activities, controllers not established in the Union must designate arepresentative in the Union.Articles 28, 35, 36, 37: Designation of the data protection
o¢ cer (DPO); Position of the data protection o¢ cer; Tasks ofthe data protection o¢ cer. Documentation.Mandatory data protection o¢ cer for public sector bodies and enter-
prises with 250 or more employees, and for any SMEs with core activitiesconsisting of processing operations which, by virtue of their nature, theirscope and or their purposes require regular and systematic monitoringof data subjects. The controller or processor shall ensure that the DPOis involved in all issues that relate to the protection of personal dataand provide sta¤, premises, equipment and any other resources. Thecontroller must maintain all documentation for processing operations(very detailed documentations required); there are exceptions for cer-tain parties. The tasks of the DPO include, for example, to inform andadvise the controller or processor of their obligations, monitor the imple-mentation and application of the policies and to document this activity,monitor the documentation, noti�cation and communication of personaldata, the performance of the DPIA and the response to requests fromthe supervisory authoroty.Articles 31, 32: Noti�cation of Data Breach:In the case of a personal data breach, the data controller must notify
the supervisory authorities within 24 hours and data subjects �withoutundue delay.�Article 34. Prior authorization and prior consultation.Speci�c cases in which authorization by and consultation of the su-
pervisory authority is mandatory prior to processing.
8

Article 43: Transfers by way of binding corporate rules(BCR).A supervisory authority shall approve binding corporate rules under
certain conditions: BCR specify the structure of the group, the datatransfers (purposes, data subjects a¤ected, third countries, etc.), legalbinding nature of data transfers, data protection principles, etc. TheCommission may specify the format and procedures for the exchange ofinformation between controllers, processors and supervisory authoritiesfor BCR.Articles 55, 56, 57, 58, 76: Mutual Assistance, Joint op-
erations of supervisory authorities; Consistency mechanism.Opinion by the European Data Protection Board. CommonRules for court proceedings.Supervisory authorities will co-operate and provide mutual assistance
concerning data requests from one authority to another. They cannotcharge a fee for complying with a request. In order to step up coop-eration and mutual assistance, the supervisory authorities shall carryout joint investigative tasks, joint enforcement measures and other jointoperations, in which designated members or sta¤ from other MemberStates�supervisory authorities are involved. For the purposes set out inArticle 46(1), the supervisory authorities shall cooperate with each otherand the Commission through the consistency mechanism as set out inthis section. Member States must ensure rapid court actions. Commonrules include the right of the data subject to be represented before thecourts, the right of supervisory authorities to engage in legal proceedingsand the information of a court�s parallel proceedings in another MemberState."Article 77: Right to compensation and liability.Sets out the right to compensation and liability from the controller for
any person who has su¤ered damage as a result of an unlawful processingoperation or an action incompatible with the Regulation.Article 79: Administrative sanctions.Each supervisory authority must sanction the administrative o¤ences
listed, imposing �nes up to maximum amounts, with consideration ofcircumstances of each individual case.Compliance with these new rules will impose a number of costs on
SMEs including the need to hire additional personnel, purchase newIT software, and consult with data protection authorities in advanceof certain new projects. Furthermore, rules limiting the use of personalinformation, particularly in advertising, will impact all business engagedin targeted consumer marketing. Given that SMEs increasingly rely ononline advertising to drive revenue growth, the economic impact will be
9

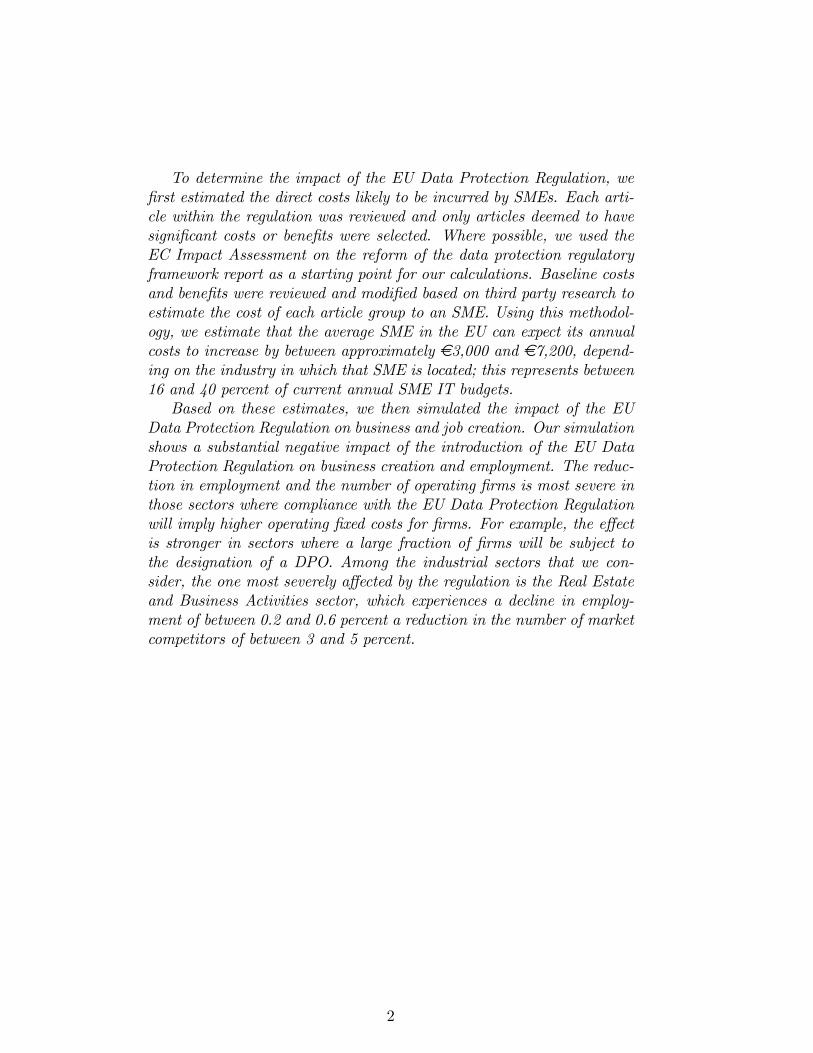
substantial and widespread; for example, a survey of 453 �rms in the UKestimated that the proposed legislation could cost the UK economy £ 47billion, with the costs concentrated mostly amongst SMEs.6 However,it should be noted that the regulation also contains articles that aim toreduce costs by, for example, making it easier for businesses to transferpersonal data within the EU. Our analysis estimates both the expectedannual costs and bene�ts associated with most impactful articles in theproposed proposed legislation for a typical SME across �ve industrialcategories.7 These industrial categories are:�Transport, storage, and communications�Hotels and restaurants�Real estate, renting, and business activities�Wholesale and retail trade; repair of motor vehicles and motorcycles�ManufacturingIn what follows, we �rst describe the methodology used to estimate
costs and bene�ts. We then provide ao detailed descriptions for threearticle groups expected to have a substantial impact on SMEs in orderto illustrate this methodology. We conclude by summarizing the costimpact for all articles.To calculate the total cost of the proposed legislation, we �rst es-
timated the annual costs and bene�ts of individual articles within thelegislation. Each article within the regulation was reviewed and onlyarticles deemed to have signi�cant costs or bene�ts were selected. Theselected articles were then grouped together based on a common theme orbased on costs that would be shared across the group of articles. Costsand bene�ts were then calculated for each article group and totaled.Where possible, we used the EC Impact Assessment on the reform ofthe data protection regulatory framework report (commissioned by theEC to assess the impact of the EU Data Protection Regulation) as astarting point for our own cost calculations. Baseline costs and bene�tswere reviewed and modi�ed based on third party research to estimatethe cost of each article group to an SME. For articles that were not re-ferred to in the EC Impact Assessment report, we used the InternationalStandard Cost Model methodology together with external research toestimate costs. Costs were then separated into �xed and variablecosts,since these costs have di¤erent economy-wide impacts. Finally, the costswere summed across all article groups and presented as a total cost andas a percentage of annual IT spend for a typical SME. Presented be-
6Putting a price on direct marketing 2012, Direct Marketing Association (UK)Ltd, July 2012
7Industrial categories selected from the �Classi�cation of Economic Activities inthe European Community,�(NACE rev 1.1) Final Version, 2002.
10

Figure 1: DPO Cost Estimates from EC Impact Assessment
low are three article groups that illustrate the application of our costestimation methodology.
2.1 Results for the main ArticlesCosts for Documentation and the Data Protection O¢ cer: Articles 28,35, 36 and 37Articles 35, 36, and 37 relate to the duties of the Data Protection
O¢ cer (DPO). Under the proposed regulation, an enterprise or an or-ganization employing more than 250 persons, or one that is processingpersonal data as part of their core activities, must designate a dataprotection o¢ cer. Article 35 describes the employment requirements ofthe DPO, while articles 36 and 37 detail the tasks and duties of theDPO, which include the monitoring and implementation of data pro-tection policies, informing the data controller of obligations under thelegislation, and communicating with data protection authorities.8
In estimating the costs of the DPO, we �rst assumed that the costof hiring a DPO was a �xed cost since it does not scale with the size ofthe �rm or the number of data records held by the �rm; it only dependson whether a �rm meets the criteria set forth in article 35.The EC Impact Assessment report provides an estimate for the num-
ber of SMEs in the EU that would require a data protection o¢ cer andthe associated costs. The report assumes that rather than hiring a full-time DPO, �rms would contract out the position on a per hour basis.The values estimated in the report are provided in Figure 1.The EC Impact Assessment provides no formal justi�cation for any
of the underlying values used to calculate total cost. For example, thereport assumed that "only 0.1% of SME who are data controllers requirevalidation in terms of processing risky data," yet no third party data or
8EU General Data Protection Regulation, p. 66
11

survey data cited were cited.9 The report explained that only four hoursof work per year was required by citing the fact that many of the DPOduties could be ful�lled by existing sta¤. However, this assumes the �rmis not currently fully utilizing its sta¤ and that there are no costs associ-ated with assigning more work to existing employees. Furthermore, thelegislation states that the DPO must be independent of IT managementand the use of existing sta¤ could raise con�icts of interest.10
Based on our analysis of the DPO duties contained in articles 35-37, four hours is a large underestimate of the time required. Duties ofthe DPO include the training of sta¤ on data protection policies, datasecurity assessments, investigation of data breaches, and the signing ofdata protection impact assessments. Estimates for the time required foreach of these DPO responsibilities are provided below� The training of sta¤at most SMEs will require one week since in
addition to new employees, existing employees would also be expectedto receive an annual refresher course on data processing compliance.This estimate includes the time required to prepare and update trainingmaterials.� DPOs will take one week or longer to review a �rm�s data
processing operations and ensure compliance with existing data protec-tion regulations.� Investigation of a data breach will require two to three weeks
minimum since the DPO must not only investigate the breach, but alsobe a point of contact for the data protection authority.� DPOs will require a minimum of one week to sign o¤on security
protocols and communicate any issues with senior management as partof the data protection impact assessment.Considering the estimates above, together with data provided in the
2010 IAPP Europe Data Protection Professional�s Role, Function andSalary Survey, we conservatively estimate these tasks to take a minimumof 100 hours per year for a typical data controller/processor (and likelyeven more for a data intensive �rm).11
To calculate industry-level costs, we utilize a bottom-up approach by�rst calculating the cost for a typical SME classi�ed as a data controlleror a data processor, and then estimating the percentage of �rms requiringa DPO in each of the �ve industrial sectors. The values from our analysisare provided in Figure 2.
9EC Impact Assessment, p.209.10EC Impact Assessment, p.209.11�The 2010 IAPP Europe Data Protection Professional�s Role, Function and
Salary Survey,�https://www.privacyassociation.org/media/pdf/knowledge_center/IAPP_2010EuropeSalarySurvey_�nal.pdf.
12

Figure 2: Revised DPO Cost Estimates (per �rm)
To calculate the cost in each of the �ve industries of interest, thepercent of �rms requiring a DPO in each industry is estimated using Eu-rostat industrial subsector data. For example, within the twenty-eightindustrial subcategories listed under "Transport, storage and communi-cations," the only subcategory identi�ed as needing a DPO under thenew regulation is "Data processing, hosting and other related activi-ties." SMEs in this subcategory represent two percent of all SMEs inthis industry.Documentation: Article 28Article 28 states that each data controller must maintain documen-
tation of all processing operations under its responsibility including doc-umentation about the DPO, categories of data subjects, and recipientsof personal data. Documentation costs vary by the number of process-ing operations, number of data subjects, and the number of recipientsof personal data. The larger the number of records stored or processed,the more documentation will be required. The EC Impact Assessmentdoes not explicitly assess the impact of Article 28; most of Article 28�scosts may, however, be included in assessments of the cost for a DPO.These costs should be considered variable costs since the documentationincreases as the number of records increases. The total cost assessmentfor these articles is provided below.According to the PwC Information Security Breaches Survey 2010,
67% of small organizations reported having a �formally documented in-formation security policy�.12 Although the information security policydi¤ers slightly from the clauses in Article 28, it is a suitable proxy forestablishing the baseline for Article 28. Let us assume that, there issu¢ cient documentation required to hire 1/2 of a full-time employee ata cost of e50,000 per year for small and medium sized �rms and 1/8thof an employee�s time for mirco �rms. Of the �rms that could be im-pacted, we know that 67% are already in compliance with this article.
12Data was for �rms in the U.K. See Appendix for details.
13

Figure 3: Documentation and the DPO Estimates Across Five IndustrialSectors (per �rm)
Therefore:
expected compliance costSMEs=(100� 67%)� 1=2e50; 000 = e8; 250
expected compliance costmicro �rms = (100�67%)�1=8�e50; 000 = e2; 062By expanding the results for Articles 28, 35-37 to SMEs across the
5 industrial sectors analyzed in the EU, we estimate the impact fromArticles 28, 35-37 to be approximately e1.7 billion.13 The EC ImpactAssessment report estimated the total impact of the DPO segment ofthe legislation to be e9.8 million. Though our estimate is several ordersof magnitude higher than the EC�s estimate, it should be noted that asurvey of businesses cited earlier suggests the impact of the regulation onthe UK alone to be at least £ 47 billion.14 Given that the costs associatedwith the DPOmake up a signi�cant portion of total costs in our analysis,our estimate more closely aligns with what businesses believe the totalcost impact will be, compared to the EC�s estimate.Personal Data Processing and Pro�ling: Articles 5,19 and 20Articles 5,19, and 20 were grouped together since they all impact
the ability of �rms to engage in data pro�ling. Article 5 describes prin-cipals related to personal data processing and in particular the dataminimization principle which states personal data should be �limitedto the minimum necessary�.15 Article 19 describes data subjects�rightto object stating �the data subject has the right to object, on requestand free of charge, to the processing of personal data relating to himwhich the controller anticipates being processed for the purposes of di-rect marketing�.16 Finally, Article 20 describes a data subject�s right to
13This �gure is calculated by taking the average SME cost and multiplying it bythe total number of SMEs for each of the 5 industrial sectors analyzed in the EU.14"Putting a price on direct marketing 2012," Direct Marketing Association (UK)
Ltd, July 2012.15EU General Data Protection Regulation p. 4416EU General Data Protection Regulation p. 53
14

not be subjected to pro�ling which includes measures �intended to eval-uate or predict in particular the natural person�s performance at work,economic situation, location, health, personal preferences, reliability orbehavior�.17The costs associated with these articles largely result fromlost revenue due to a �rm�s inability to engage in targeted advertisingand other direct marketing activities that require pro�ling. These costsvary depending on the degree of targeted advertising a �rm engages inand are, therefore, classi�ed as variable costs.While the EC Impact Assessment does not provide an explicit cost
to �rms associated with these articles, the Direct Marketing Association(UK) published a report titled �Putting a price on direct marketing2012,�which explicitly calculated the costs to SMEs in the UK due tothese articles.18The study surveyed 600 UK based companies (no publicsector �rms) of which a majority were SMEs. The purpose of the studywas to understand the number of �rms engaged in direct marketingactivity and the impact of pending EU legislation on these �rms. Thestudy found that because the de�nition of personal data detailed in thelegislation could be interpreted as including IP addresses, it would limitweb analytics and most personal services. �The impact of the Regulationwould be most strongly felt by SMEs which typically employ 250 or fewerpeople. Of the companies polled �the majority of which were SMEs �22% stated that the average likely cost to their businesses would be justover £ 76,000 �equivalent to 11% of their turnovers. This translates toan estimated potential cost of £ 47 billion to all UK businesses.�19 Sincethe survey likely included a few large �rms, we conservatively assumedthat 20% of SMEs estimated their cost to be £ 76,000 or e94,000.20
Therefore:
Exptected Cost to SME = 20%� e94; 000 = e18; 800
If we assume costs for �rms in the rest of the EU are similar to costs inthe UK, then the cost of Articles 5,19, and 20 is equal to e18,800 per�rm.The percent of �rms impacted across the 5 industrial sectors depends
on the degree to which �rms in each sector collect personal data, andengage in direct marketing. By analyzing the industrial sub-categories
17EU General Data Protection Regulation p. 5518�Putting a price on direct marketing 2012�Direct Marketing Association (UK)
Ltd, July 201219�Putting a price on direct marketing 2012�Direct Marketing Association (UK)
Ltd, July 2012, p 1320Based on conversion rate of 1 pound to 1.24 euros. Yahoo Finance
http://�nance.yahoo.com/q?s=GBPEUR=X Accessed October 15, 2012
15

Figure 4: Personal Data Processing and Pro�ling Cost Estimates AcrossFive Industrial Sectors (per �rm)
listed under each sector, we determined which of the subsectors are likelyto contain �rms engaged in e-commerce. In addition, Eurostat datasuggests that approximately 11% of SMEs are engaged in e-commerceof some kind.21 Using this data we have the following formula:
Average Expected Cost per F irmper sector
=11%� e18; 800� Percent of firms impactedper sector
Listed below are the compliance costs associated with Articles 5,19and 20.Personal Protection by Design and Data Protection Impact Assess-
ment: Articles 23 and 33Article 23 and 33 were grouped together since they both relate to
process changes �rms must make in order to ful�ll compliance. Arti-cle 23 involves taking protection into account in the design of systemsand procedures. Article 33 introduces the obligation of controllers andprocessors to carry out a data protection impact assessment prior torisky processing operations. Since these costs can change depending onthe number of projects the �rm initiates a year, they are classi�ed asvariable costs.The EC Impact Assessment admits the DPIA costs are very �context-
speci�c,�22 and does not provide a single expected value for costs. Itinstead provides example for the type of costs that a �rm may experience(summarized below).� Small scale DPIA - Commercial and innovative uses of sensitive
data: Total Cost = e14,000� Medium scale DPIA - Location based data and services: Total
Cost = e34,000
21Eurostat Data: Percent of Enterprises selling via Internetand/or networks other than Internet. Accessed on October 5 2012http://epp.eurostat.ec.europa.eu/portal/page/portal/statistics/themes22EC Impact Assessment PDF, p. 215.
16

Figure 5: Personal Protection by Design and Data Protection ImpactAssessment Cost Estimates Across Five Industrial Sectors (per �rm)
� Large scale DPIA - Security and biometrics: Total Cost =e149,000In assessing the underlying assumptions across the three example
provided in the EC Impact Assessment, we noted some inconsistencies,including the fact that the auditing task takes 10 hours in all three ex-amples (regardless of �rm size) and the costs for engaging stakeholdersincrease seven-fold between the small and large scale DPIA. However,to be conservative, we have used the costs provided by the EC ImpactAssessment without modi�cation. We assigned one of these costs (small,medium, or large) for �rms in each of the industrial subsectors likely tobe impacted by the articles. For example in the �Transport, storageand communication�industrial sector, �rms in the �Passenger air trans-port�and �Wireless telecom activities�subsectors are likely to processpersonal data and will therefore be impacted by the legislation whereas�rms in �Freight rail transport� subsector will not be impacted. The�nal compliance costs associated with Articles 23 and 33 are presentedbelow.
2.2 Results for other ArticlesIn this section we present brief summaries of the remaining articles inthe EU Data Protection Regulation estimated to have signi�cant costsor bene�ts. For a full description of the underlying calculations and thetotal cost impact, see Appendix C.Noti�cation of Data Breach: Articles 31, 32Articles 31 and 32 state that in the case of a personal data breach,
the data controller must notify the supervisory authorities within 24hours and data subjects �without undue delay.�Substantial costs willbe associated also with this articles, whose implementation is extremelydemanding, especially for non-serious data breaches.The EC Impact As-sessment estimated 1,000 data breaches per year in the EU at a cost ofe20,000 each. Based on data from a PricewaterhouseCoopers survey for
17

Figure 6: Noti�cation of Data Breach Cost Estimates Across Five In-dustrial Sectors (per �rm)
the EU titled �Information Security Breaches Survey�23 the average me-dian number of data breaches per year for an SME that processes datawas 14. The same survey provided �gures for reputational damage tothese breaches, and based on these �gures we estimated the incrementalreputation damage to be in the range of e625 to e2,500. The additionalcost of responding to the incident was estimated to be e100. Averagingthese costs across the total number of micro, small, and medium sized�rms, the average cost of compliance for an SME in each industrial sectoris provided below.Conditions for Consent: Article 7Article 7 clari�es the �conditions for consent to be valid as a le-
gal ground for lawful processing.�The EC Impact Assessment providesa baseline cost for �initially collecting, compiling and subsequently re-producing and providing the information to data subjects every timepersonal data are collected, including costs of legal validation.�The re-port estimates 4 hours of additional work every 3 years which will costapproximately e67 per year for a SME. The EC Cost Impact assessmentassumes there will be no scenarios where a data controller will have tointroduce new consent forms. Given the article mandates �explicit�con-sent, it is likely that many �rms will have to introduce new consent formsasking for explicit consent. We estimated that the additional clerical andlegal validation costs stemming from this article to be e633 per year foran SME. Averaging these costs across the total number of micro, small,and medium sized �rms, the average cost of compliance for an SME ineach industrial sector is as follows.Processing Personal Data of a Child: Article 8Similar to Article 7, this article discusses speci�c rules and condi-
tions for processing personal data belonging to a child. Speci�cally, �theprocessing of personal data of a child below the age of 13 years shall
23Information Security Breaches Survey 2010 technical report, Pricewaterhousec-oopers, April 28, 2010
18

Figure 7: Conditions for Consent Cost Estimates Across Five IndustrialSectors (per �rm)
Figure 8: Processing Personal Data of a Child Cost Estimates AcrossFive Industrial Sectors (per �rm)
only be lawful if and to the extent that consent is given or authorised bythe child�s parent or custodian.�The EC Impact Assessment does notprovide an estimate for this article. We assumed that a �rm experiencesthe same compliance costs as those experienced with Article 7 but thenumber of �rms impacted is smaller. Averaging these costs across thetotal number of micro, small, and medium sized �rms, the average costof compliance for an SME in each industrial sector is provided below.Data Portability and the Right to be Forgotten: Articles 12, 17, and
18Articles 12, 17, and 18 grant data subjects the �right to withdraw
and transfer data to other controllers� and to �request that organiza-tions delete personal information.�24 The EC Impact assessment doesnot speci�cally estimate a cost for this article and instead provides abaseline cost of e67 per year for all additional clerical work (see Condi-tions for Consent: Article 7). Given that most SMEs do not currentlyhave the capability to transfer data between incompatible software sys-tems, there will be an estimated IT cost of e2,000 as well as a small costof processing a user�s request (approximately e10-e50 per request 25).Based on a range of estimates of user requests from various UK sources,we estimate the average data controller to �eld between 50 and 5,000 re-
24EC Impact Assessment, PDF p. 69.25UKData Protection Act of 1998, http ://www .ico .gov.uk/for_ the_public/p ersonal_ in formation/how_manage/access_ in fo .aspx
19

Figure 9: Data Portability and the Right to be Forgotten Cost EstimatesAcross Five Industrial Sectors (per �rm)
Figure 10: Transparent Information and Communication Cost EstimatesAcross Five Industrial Sectors (per �rm)
quests (depending on size of the SME). Averaging these costs across thetotal number of micro, small, and medium sized �rms, the average costof compliance for an SME in each industrial sector is provided below.Transparent Information and Communication: Article 11Article 11 ensures �individuals are well informed in a transparent
way� concerning how their data is utilized. Furthermore, it mandatesthe �controller shall have transparent and easily accessibly policies forprocessing personal data and shall provide information related to thisdata to the data subject.�26 The EC Impact Assessment provides a costestimate of e100 (based on 2 hours of work every 2 years) and estimatesthat 8,821,638 SMEs would be impacted. This estimate seems low giventhe need to deploy new corporate policies which may also require legaladvice, and updates to websites.27 Averaging our estimated costs acrossthe total number of micro, small, and medium sized �rms, the averagecost of compliance for an SME in each industrial sector is provided below.Prior Authorization and Prior Consultation: Article 34Article 34 stipulates the data controller �shall consult the supervi-
sory authority prior to the processing of personal data in order to en-sure the compliance of the intended processing.�The EC Cost Impact
26EC Impact Assessment, PDF p. 120.27Based on Global PwC Survey, 53% of �rms globally have a written privacy policy
in place and published on external website
20

Figure 11: Prior Authorization and Prior Consultation Cost EstimatesAcross Five Industrial Sectors (per �rm)
Assessment calculates the �cost of noti�cations of processing activitiesby data controllers� as savings to be realized by the implementationof the new legislation (estimated at e200 per controller).28 However,Article 34 clearly provides evidence that not all these noti�cations willbe eliminated since some �rms will still have to consult with super-visory authorities in certain circumstances. We assumes 50% of �rmswho declared processing to a DPA will still experience one instance ofadditional consultation with a supervisory authority due to Article 34,which means 14.6% of data controllers will be impacted. The costs ofcompliance include the cost of informing the supervisory authority andpotential delays in project timelines was estimated at e1,489 per datacontroller. Averaging these costs across the total number of micro, small,and medium sized �rms, the average cost of compliance for an SME ineach industrial sector is provided below.Transfers by Way of Binding Corporate Rules: Article 43Article 43 stipulates that �a supervisory authority shall approve bind-
ing corporate rules under certain conditions described by this Article.�The EC Impact Assessment states that in general Articles 40-44 will�have a positive impact both on relations with third countries and onnon-EU businesses and will boost the competitiveness of EU economicoperators internationally, as they will �nd it easier to transfer personaldata outside of the EU.�While we agreed that in general this Article willlead to bene�ts, we believe there will be costs associated with point 4 ofthe article which states all data controllers must adopt a uniform formatfor transfer of data. Based on surveys from the EC Impact Assessment,approximately 24% of SMEs reported transferring data within the EU.We estimated the savings associated with this article to be e50,000for a data controller and subtracted e5,000 for the cost of complyingwith point 4 (attributed to software upgrades and associated clericalcosts). Averaging these costs across the total number of micro, small,
28Based on EC Stakeholder Feedback and Survey results
21

Figure 12: Transfers by way of Binding Corporate Rules Cost EstimatesAcross Five Industrial Sectors (per �rm)
and medium sized �rms, the average bene�t for an SME in each indus-trial sector is provided below.In conclusion on the general topic of dataprotection across countries, we may notice that the regulation shows animportant e¤ort in promoting secure data transfers, which is crucial forinstance for the development and the di¤usion of cloud computing. How-ever more needs to be done, for instance supporting and standardizinga correct and transparent protection of data that are transfered outsidethe E.U. for cloud computing services, for instance through forms ofcerti�cation of the procedures.Mutual Assistance, Joint Operations of Supervisory Authorities: Ar-
ticles 55, 56, and 57These articles relate to the conduct of supervisory authorities. They
state that �authorities shall provide each other relevant information andmutual assistance�and �shall have the right to participate in the jointinvestigative tasks or joint operations.�The EC Cost Impact Assessmentdoes not explicitly list the costs/bene�ts for these articles; it does statethat the overall e¤ect of the articles will be to reduce costs for businesses.We assumed the articles will lead to savings in clerical work and legalfees as a result of common legal proceedings and reduced fragmentation.Of the �rms who engage in cross border transfer of data, we assumed10% are investigated by data protection authorities and would thereforebene�t from the article. The net bene�t for a data controller was esti-mated to be e40,000. Averaging these costs across the total number ofmicro, small, and medium sized �rms, the average bene�t for an SMEin each industrial sector is provided below.Joint Controllers and Representatives in the Union: Articles 24 and
25These articles are about the role of controllers29 and they state that
29Incidentally, the controller should be the entity that determines the reason whydata are processed and the processor the entity that determines how the same dataare actually processed. This would clarify the di¤erences in a more appropriate way.
22

Figure 13: Mutual Assistance, Joint Operations of Supervisory Author-ities Cost Estimates Across Five Industrial Sectors (per �rm)
Figure 14: Joint Controllers and Representatives in the Union Cost Es-timates Across Five Industrial Sectors (per �rm)
when a �controller processes data jointly with others, the joint controllersshall determine their respective responsibilities for compliance under theRegulation.�This is an overhead cost that must be factored in anytimedata is processed jointly between two �rms or is outsourced from one�rm to another. We assumed that the additional cost for a controlleris approximately e5,000. Based on EU survey data, 73.6% of SMEs re-sponded they would be willing to outsource to multiple cloud providersand 38.9% responded they would outsource payroll data.30 Since theseare overlapping groups, we conservatively estimated 29% of SMEs out-source personal data. Averaging these values across the total numberof micro, small, and medium sized �rms, the average cost of compliancefor an SME in each industrial sector is provided below.Right to Compensation and Liability: Article 77Article 77 stipulates that �any person who has su¤ered damage as a
result of an unlawful processing operation or an action incompatible withthe Regulation has the right to receive compensation from the controlleror processor.�The EC Cost Impact Assessment does not provide a costestimate for this article. Currently damages are only applied to datacontrollers but with passage of this legislation, damages will also apply
30An SME perspective on Cloud Computing, The European Network and Infor-mation Security Agency (ENISA, Nov 2009).
23

Figure 15: Right to Compensation and Liability Cost Estimates AcrossFive Industrial Sectors (per �rm)
to data processors. While the law attempts to clarify the liability ofjoint controllers and joint processors, the growth of cloud computinghas created a gray area in terms of whether a cloud provider is a datacontroller, or data processor.31 32. Therefore, even though the numberof data processing �rms in the EU (as a % of all SMEs) is small, therecould be additional legal costs for data controllers due to legal ambiguity.Conservatively, we assumed the additional cost for a �rm caught in thedispute described above was e10,000 and that 29% of SMEs would beimpacted (since this is the estimated fraction of �rms that outsourcepersonal data).33 Averaging these values across the total number ofmicro, small, and medium sized �rms, the average cost of compliancefor an SME in each industrial sector is provided below.Administrative Sanctions: Article 79The article states that �each supervisory authority shall be em-
powered to impose administrative sanctions� including a �ne up toe1,000,000, or up to 2% of a �rm�s annual worldwide turnover. The ECImpact Assessment does not provide a cost for this article and simplydescribes the variations in �nes across di¤erent EU member states. Weestimate this article may actually lower the expected �ne for an SME.This is due to the fact that most �rms are micro-sized �rms and there-fore 2% of revenue is actually smaller than the current �nes in mostmember states. Furthermore, most authorities rarely issue maximumpenalties. The net e¤ect of this however will be negligible on the aver-age SME since the number of �rms a¤ected is so small.34 Therefore, we
31EUROPE �S DATA PROTECT ION FUTURE: PROSPECTS AND IMPL ICATIONS FOR BUSINES S, February 7, 201232Who is responsible for �personal data� in cloud computing?� The cloud of un-
knowing, Part 2, Millard et al, IDPL 201133See Articles 24 and 2534In 2011, the UK issued 7 �nes of which only 2 were for private
enterprises.(http://www.pcpro.co.uk/news/375691/has-the-ico-�nally-found-its-teeth-with-150-000-�ne)
24

estimate this article to have no impact on costs. Nevertheless, it is im-portant to remark that the proposed system of administrative sanctionsimplies a homogenous application to all companies, without distinctionbetween intentional and unintentional harm: this may create unfair anddisproportionate burden on SMEs that will not follow parts of the newregulation for reasons di¤erent from negligence.Responsibility of the Controller: Articles 22The responsibilities of the controller include adopting policies and
implementing appropriate measures to ensure compliance. The EC Im-pact Assessment does not provide estimates for this article, but it doesprovide cost estimates for other underlying articles we have evaluated.Since we have already provided estimates for the articles deemed to havea cost impact, it is redundant to include costs related to the implemen-tation of these measures. Therefore, we estimate the incremental cost ofthis act to be zero.
2.3 Summary of the Compliance CostsThe percentage of �rms impacted as well as the average expected costsand bene�ts were estimated for each of the �fteen article groups deemedimportant in the EU Data Protection Regulation (see appendix).35 Wealso calculated the costs as a percentage of IT budget for use in thegeneral equilibrium model. To do so, we �rst estimated the averageIT budget for a SME using data from the Voice of IT State of SMBIT 2H 2012 report provided by Spiceworks Inc.11 By taking a weightedaverage of the survey results and using the mix of micro, small, andmedium sized businesses in the EU as weights, we calculated an averageannual IT budget of e18,000. We then used this value to calculate totalcosts as a percent of IT budget; these estimates are provided below.These �gures are the inputs for the model presented in Section 3.
35The �fteen groups (along with their corresponding article numbers) are DataProtection Impact Assessment (23,33), Data Protection O¢ cer and Documentation(28,35,36,37), Noti�cation of Data Breach (31,32), Data Portability and Right tobe Forgotten (12, 17, 18), Conditions for Consent (7), Transparent Information andCommunication (11), Principles of Personal Data (5,19,20), Transfers by BindingCorporate Rules (43), Processing of Personal Data of a Child (8), Responsibilityof the Controller (22), Joint Controllers (24,25), Prior Authorization (24), MutualAssistance and Common Rules (55,56,57,58,76), Right to Compensation (77), andAdministrative Sanctions (79).
25

Figure 16: Summary of Average Expected Fixed and Variable Costs
3 The Economics Impact of the proposed EU DataProtection Regulation
3.1 Non-Technical Outline and ResultsIn this section we propose a non-technical summary of the modellingframework adopted in the analysis and a discussion of the main results.The interested reader can �nd the technical details underlying the nu-merical simulations in Section 4.In order to evaluate the impact of the proposed EU Data Protection
Regulation on business creation and employment we have to build amodel which satis�es at least two desiderata. The �rst one is that themodel must be able to account for the dynamics of the number of �rmsin the economy. This allows to evaluate whether the implementation ofthe data protection framework has an impact on net business creation.The second one is that the model has to deliver an endogenous dynamicsfor unemployment. This, in turn, allows to asses the e¤ect of the newrules on the level of unemployment.Accomplishing these tasks requires to depart from the assumption
of perfect competition in the goods market and from that of a perfectlycompetitive labor market. For this reason, our analysis takes a generalequilibrium approach (meaning that we consider all markets in the econ-omy simultaneously) characterized by the presence of frictions both in
26

the goods market and in the labor market.We consider a framework where setting up a �rm in order to serve
the market is costly. As a result, just those �rms whose expected pro�tscover the entry cost will decide to start production. We show that theintroduction of more restrictive norms on data protection a¤ects theexpected pro�ts of �rms and through this channel it a¤ects the numberof producers entering in the economy.The labor market is also characterized by frictions. Finding appro-
priate candidates for a new job opening requires time. This is of coursecostly for �rms. The presence of search costs in the labor market leads toa frictional level of unemployment. Any event that a¤ects the expectedsurplus that a newly created job could deliver may impact on �rms�jobcreation decisions. This is the channel through which regulation coulda¤ect job creation.Importantly, there is also an interaction channel between the dynam-
ics in the number of businesses and job creation. As mentioned in theIntroduction, new �rms, which are mainly small, are the engine of jobcreation. Policy measures which ultimately lead to a reduction in �rmcreation will impact on job creation as well. Finally, since the data pro-tection act is more likely to a¤ect �rms which use intensively technologyin the form of hardware and software for data management, we assumethat IT is an essential input for production.We formalize the introduction of the data regulation act as follows.
Installing a DPO o¢ ce will represent an additional �xed operating costsfor those �rms subject to the regulation. The development of a datamanagement systems is, instead, a variable cost for the �rm, which de-pends on the amount of data processed. For this reason the increase invariable costs faced by the �rm will depend on the amount of IT usedin the production process.The introduction of the regulation act represents a change in the
cost function of �rms which will have permanent e¤ects. This a¤ectsthe business and job creation channel described above. In particularthe economy will shift to a new allocation, characterized by a di¤erentnumber of �rms and a di¤erent level of unemployment.Using the cost impact evaluation displayed in the previous section
we can assess the change in the number of business and in the level ofunemployment that would be implied by the data regulation framework.In what follows we summarize the main results of this study.Our analysis shows a substantial negative impact of the introduction
of the data protection legislative framework on business creation andemployment. The reduction in employment and the number of operat-ing �rms is particularly strong in sectors where a large fraction of �rms
27

will be subject to the designation of a DOP, such as the Real Estate,Renting and Business Activities sector. We also translate our analysisin the number of jobs and �rms lost due to the introduction of the dataprotection legislation. According to our model, the number of jobs de-stroyed ranges between more than one hundred thousands in the shortrun to more than three hundreds thousands in the long run. This sug-gests that the introduction of the new norms should be crafted with care.It should be accompanied by other measures aimed at reducing the im-pact, in terms of higher costs, for �rms. As an example, policymakersshould promote �scal incentives for those �rms which will be subject tohigh implementation costs, with particular reference to those subject tothe DPO requirement.
3.2 SimulationsThe analysis in Section 2 highlights that a relevant fraction of �rms inthe Real Estate, Renting and Business Activities and the Wholesale andRetail Trade Sector will require a DPO o¢ ce. Other sectors will bea¤ected by the legislation because of the need to conform to the dataprotection standards. For this reason in what follows we show the e¤ectsof the introduction of the reform at the sectoral level distinguishing twocases. The �rst case, depicted in Figure 7, is meant to be representativeof the impact of the regulation in the two sectors where both �xed andvariable costs will be a¤ected, the second one is depicted in Figure 8 andit is meant to be representative of the e¤ects in other sector which willmainly experience a change in variable costs.36
We numerically compute an exact transition from the pre-reformsteady state to the post reform steady state.37 This is possible since weinterpreted the introduction of the data protection act as a permanentshock that hits the cost function of �rms. The Figures below report thepercentage variations of the main variables with respect to the initial(pre-reform) steady state. Time on the horizontal axis is marked inquarters.Figure 7 refers to the Real Estate, Renting and Business Activities
sector. Solid lines refer to our baseline case, where we target a costincrease in terms of initial IT budget equal to 40 percent on average,as reported in Figure 6. As a robustness check, dashed lines report thecase where the increase in IT budget equals 20 percent on average, halfof our estimate.38 While dynamics are similar under both scenarios,
36In this case the share of the change in the IT budget shown in Figure 6 is entirelyattributed to a change in variable costs.37To do so we use DYNARE version 4.3.38Under the alternative scenario the magnitude of the change in variable costs with
28

0 10 20 30 40 5010
5
0
5
10Number of firms
0 10 20 30 40 502
1
0
1
2
3
4Price markup
0 10 20 30 40 500
1
2
3
4
5Labor used to perform additional data processing
0 10 20 30 40 501
0.5
0
0.5Employment
Figure 17: Real Estate Renting and Business Activities sector. Percent-age deviations of the main sectoral variables in response to the intro-duction of the data protection act. Solid Lines refer to the baseline casescenario, dashed lines to the lower impact scenario.
our baseline case implies a much stronger reduction in the number of�rms and sectoral employment in the medium and the long-run. Inthe aftermath of the introduction of the new regulation the need toperform additional monitoring activities leads to an increase in demandfor workers involved in these tasks. This has an initial positive impacton sectoral employment. However as the cost pressure leads �rms toexit from the market, sectoral employment decreases while, due to lowercompetition in the sector, we observe an increase in the price markup.Figure 8 depicts the case of Hotels and Restaurants, where the reg-
ulation will a¤ect uniquely variable costs. As above we consider twopossible scenarios: a baseline case where the increase in variable costsamounts to our estimate of 21 percent of the initial IT budget (solidlines), and a low impact scenario where the increase in variable costsrepresents half of this estimate (dashed lines).Dynamics are similar to those depicted above. A joint analysis of the
two �gures leads to the following results: (i) the variable cost dimensiondrives the dynamics response of the economy to the introduction of theregulation; (ii) �xed costs reduce pro�ts and hence leads to a more pro-nounced reduction in the number of �rms in the market; (iii) even inthe case of a cost impact much lower than that estimated in Figures 1-6
respect to that in �xed costs is identical to the baseline one.
29

0 10 20 30 40 504
2
0
2
4
6Number of firms
0 10 20 30 40 502
1
0
1
2Price markup
0 10 20 30 40 500
1
2
3
4
5Labor used to perform additional data processing
0 10 20 30 40 500.4
0.2
0
0.2
0.4Employment
Figure 18: Hotel and Restaurants. Percentage deviations of the mainsectoral variables in response to the introduction of the data protectionregulation. Solid Lines refer to the baseline case scenario, dashed linesto the lower impact scenario.
the impact on both employment and the number of competitors wouldbe substantial.In Tables 1 and 2, we provide for each sector, the percentage change
in the number of employed persons and the number of �rms after 8 and20 quarters from the introduction of the reform. This allows to eval-uate the e¤ects of the new legislation in both the short and the longrun. Table 3 reports, instead, the corresponding change in the absolutenumber of employed persons in each sector.39 Based on the cost im-pact estimates presented in Section 2, the impact of the regulations onSMEs in the manufacturing sectors is estimated to be approximatelyzero. Therefore, there is no simulated impact from the proposed regula-tion on employment levels or number of �rms for this industrial sector.The introduction of the legislation shows its negative e¤ects on em-
ployment and the business environment even after eight quarters, but ithas a particularly sizeable e¤ect in the long run, after twenty quarters,where there is a large destruction of businesses and jobs. Consider thetwo industrial sectors analyzed above. In the Real Estate, Renting and
39To compute these values we multyply the most recent data on the number ofemployed persons per sector in the EU 27 by the percentage variations reported in Ta-bles 1 and 2. Data for employed persons and number of �rms by sector can be found athttp://epp.eurostat.ec.europa.eu/portal/page/portal/european_business/data/main_tables
30

Number of Employed Persons Baseline Impact Low Impact
Quarters 8 20 8 20SectorWholesale and retail trade -0.25 -0.41 -0.13 -0.21Hotels and restaurants -0.26 -0.37 -0.12 -0.19Transport Storage and communication -0.20 -0.29 -0.01 -0.15Real Estate, renting and Business activities -0.30 -0.54 -0.15 -0.28
Table 1: Percentage change in the number of employed persons due tothe introduction of the legislation on data protection in the EU 27
Number of Firms Baseline Impact Low Impact
Quarters 8 20 8 20SectorWholesale and retail trade -0.63 -2.55 -0.27 -1.34Hotels and restaurants -0.01 -1.59 -0.008 -0.85Transport Storage and communication -0.05 -1.28 0.003 -0.67Real Estate, renting and Business activities -1.92 -4.98 -0.94 -2.64
Table 2: Percentage change in the number of �rms due to the introduc-tion of the legislation on data protection in the EU 27
Business activities sector, the reduction in the number of �rms rangesfrom 2.6 percent in the low impact scenario to almost 5 percent in thebaseline scenario. We observe a reduction in the long-run sectoral em-ployment ranging from 0.3 percent in the low impact case to more thanhalf percentage point in the baseline case. Eurostat data suggest that in2007, before the �nancial crisis, this sector employed about 23 millionsworkers. As a result, our simulation suggests that in the baseline impactscenario the introduction of the legislation would lead to a loss of morethan one hundred and twenty thousands jobs in this sector. In the Ho-tels and Restaurants sector the reduction in long run employment rangesfrom 0.2 to 0.4 percent, with a reduction in market competitors from 1to 2 percent. This implies a destruction of 16 to 32 thousands jobs andan exit from the market of 8 to 15 thousands business activities.Overall our computations entail a short run loss of jobs ranging from
90 thousands in the low impact scenario to 196 thousands in the baselinescenario. A much stronger loss should be expected in the long run, wherejob losses range from 166 thousand in the low impact scenario to 320thousands in the baseline case.
31

Number of Employed Persons Baseline Impact Low Impact
Quarters 8 20 8 20SectorWholesale and retail trade -81352 -133420 -42303 -68336Hotels and restaurants -22562 -32108 -10413 -16488Transport Storage and communication -23459 -34016 -1173 -17594Real Estate, renting and Business activities -68762 -123770 -34381 -64178
Total -196135 -323314 -88270 -166596
Table 3: Absolute change in the number of employed persons due to theintroduction of the legislation on data protection in the EU 27
4 Technical Details
In this section we describe the model used for our simulations, furthertechnical details and the calibration of parameters can be found in theAppendix.
4.1 The ModelThe structure of the model is a basic Dynamic Stochastic General Equi-librium (DSGE) model that is standard in the macroeconomic analysis(see Kydland and Prescott, 1982; Christiano, Eichenbaum and Evans,2005) augmented with endogenous market structures as opposed to per-fectly competitive or monopolistically competitive markets (Colciagoand Etro, 2010, and Etro and Colciago, 2010).40 The economy features acontinuum of atomistics sectors, or industries, on the unit interval. Eachsector is characterized by di¤erent �rms producing a good in di¤erentvarieties, using labor and IT material as input. In turn, the sectoralgoods are imperfect substitutes for each other and are aggregated into a�nal good. The IT material in produced by a perfectly competitive �rmusing physical capital as the only input.Households use the �nal good for consumption and investment pur-
poses. Price competition and endogenous �rms�entry is modeled at thesectoral level, where �rms also face search and matching frictions in hir-ing workers, modeled in the tradition of the literature on job search (seeMortensen and Pissarides, 1994; Pissarides, 2000).
40See Etro (2009b) for a survey of the related literature on endogenous marketstructures in general equilibrium. Colciago and Etro (2012) analyze a related modelof technology adoption.
32

4.1.1 Labor Market and Job Matching
The labor market is characterized by search and matching frictions, asin Andolfatto (1996) and Merz (1995). Firms producing in t need topost vacancies in order to hire new workers. Unemployed workers andvacancies combine according to a CRS matching function and deliver mt
new hires, or matches, in each period. The matching function is assumeda Cobb-Douglas one:
mt = ( m)�vtott�1�
u t (1)
where m re�ects the e¢ ciency of the matching process, vtott is the total
number of vacancies created at time t and ut is the unemployment rate.The probability that a �rm �lls a vacancy is given by qt = mt
vtott, while
the probability to �nd a job for an unemployed worker reads as zt = mt
ut.
Firms and individuals take both probabilities as given. Matches becomeproductive in the same period in which they are formed. Each �rm sep-arates exogenously from a fraction 1�% of existing workers each period,where % is the probability that a worker stays with a �rm until the nextperiod. As a result a worker may separate from a job for two reasons:either because the �rm where the job is located exits from the marketor because the match is destroyed. Given that population is normalizedto one, the number of unemployed workers and the unemployment rateare identical. Therefore, given labor at time t as Lt, the unemploymentrate is:
ut = 1� Lt�1and represents also the fraction of agents searching for a job.Given our functional form, we can express the probability of �lling a
vacancy as:
qt = m
�vtottut
�� = m (�t)
� (2)
where we de�ne �t = vtott =ut, the probability of �nding a job as:
zt =( m) (v
tott )
1� u t
ut= m (�t)
1� (3)
and their ratio as:
ztqt= m (�t)
�
m (�t)1� = �t
33

4.1.2 Households
Using the family construct of Merz (1995) we can refer to a representa-tive household as consisting of a continuum of individuals of mass one.Members of the household insure each other against the risk of beingunemployed. The representative family has lifetime utility:
U = E0
1Xt=0
�t
(logCt � �Lt
h1+1='t
1 + 1='dj
)�; ' � 0 (4)
where � 2 (0; 1) is the discount factor, the variable ht represents indi-vidual hours worked and Ct is the consumption of the �nal good. Thefamily receives real labor income wthtLt, where wt is the real wage, andpro�ts �t from the ownership of �rms. Unemployed individuals receive areal unemployment bene�t b, hence the overall bene�t for the householdis b (1� Lt). This is �nanced through lump sum taxation by the gov-ernment. The households hold the stock of physical capital, Kt, whichevolves according to
Kt =�1� �k
�Kt�1 + I
kt (5)
where Ikt is investment in capital. The household chooses how much tosave in riskless bonds, physical capital and in the creation of new �rmsaccording to standard Euler and asset pricing equations. The �rst ordercondition (FOC) with respect to employment, Lt, is
�t =wthtCt
� � h1+1='t
1 + 1='� b
Ct+ �Et [(1� �) �� zt+1] �t+1 (6)
where �t is the marginal value to the household of having one memberemployed rather than unemployed and 1=Ct is the marginal utility ofconsumption. Equation (6) indicates that the household�s shadow valueof one additional employed member (the left hand side) has four com-ponents: �rst, the increase in utility generated by having an additionalmember employed, given by the real wage expressed in utils; second, thedecrease in utility due to more hours dedicated to work, given by themarginal disutility of employment; third the foregone utility value of theunemployment bene�t; fourth, the continuation utility value, given bythe contribution of a current match to next period household�s employ-ment.
4.1.3 Production, IT Provision and Data Management Ser-vices
There are four types of �rms in the economy. The producers of inter-mediate goods, the �nal good producer, the producers of IT material
34

and the providers of data management services. The �nal good is anaggregate of a continuum of mass one of sectoral goods de�ned as
Yt =
�Z 1
0
lnY!�1!
jt dj
� !!�1
(7)
where Yjt denotes output of sector j and ! is the elasticity of substitutionbetween any two di¤erent sectoral goods. The �nal good producersbehave competitively. In each sector j, there are Njt > 1 �rms producingdi¤erentiated goods that are aggregated into a sectoral good by a CESaggregating function de�ned as
Yjt =
24NjtXi=1
yjt(i)"�1"
35 ""�1
(8)
where yjt(i) is the production of good i in sector j, " > 1 is the elas-ticity of substitution between sectoral goods. As in Etro and Colciago(2010), we assume a unit elasticity of substitution between goods be-longing to di¤erent sectors. This allows to realistically separate limitedsubstitutability at the aggregated level, and high substitutability at thedisaggregated level. Each �rm i in sector j produces a (intermediate)di¤erentiated good with the following production function
yjt(i) = At [njt (i)hjt(i)]1�� [ITjt�1 (i)]
� (9)
where At represents technology which is common across sectors andevolves exogenously over time. The variable ljt (i) is �rm i�s time-tworkforce used for the production of the �nal good, and hjt(i) repre-sents hours per employee. In the remainder we will refer to �rms inthe intermediate goods sector as producers. The variable ITjt (i) is theamount of IT capacity involved in the production process.The latter is produced by a perfectly competitive �rm which uses
physical capital as the only input. In each period a �ow of IT, de�nedas �ITt, is produced with technology
�ITt = AITt Kt�1 (10)
whereKt is the stock of capital in the economy and AITt is the productiv-ity of the IT industry. Given perfect competition the price of IT materialis the marginal cost of production. The latter can be obtained by pro�tmaximization of the producer of IT services as pITt =
rktAITt. Period-t real
pro�ts of a producer are de�ned as
�jt (i) = �jt (i) yjt (i)�wjthtnt�pIPCt Mjt (i)��vjt (i)�pITt IITjt (i) (11)
35

where wjt (i) is the real wage paid by �rm i, vjt (i) represents the numberof vacancies posted at time t, � is the output cost of keeping a vacancyopen, IITjt (i) is period t investment in IT and p
ITt is the price of a unit
of IT in terms of the �nal good. Notice that �jt (i) is the real price of�rm i�s output.The term pIPCjt (i)Mjt (i) represents the cost of processing the data
stored at a �rm, but also the cost of maintenance and development ofthe IT material. For simplicity we assume that these activities are out-sourced by the �rm to what we de�ne an Information Processing Com-pany (IPC). The IPC operates in a perfectly competitive environmentwith a production function of the form Mt = n
IPCt ht, where nIPCjt rep-
resents the number of workers employed in the IPC. The IPC also facessearch costs in the labor market. It hires workers by posting vacanciesat an output cost equal to �, taking as given hours and the real wagedetermined in the bargaining process between the �rm and the workersoperating in the �nal good industry.41 Its workforce evolves according tonIPCt = %nIPCt�1 + v
IPCt qt. The problem faced by IPC can thus be written
as
maxfnIPCs ,vIPCs g1s=t
EtX
�t;s�pIPCs Ms � wshsnIPCt � �vIPCs
�s:t: nIPCs = %nIPCs�1 + v
IPCs qs
Pro�t maximization requires�
qt=�pIPCt ht � wtht
�+ %Et
�
qt+1�t;t+1
this condition equates the marginal cost of hiring a worker with themarginal bene�t. The latter is given by a discounted stream of �rm�sexpected future net earnings from the marginal worker. We assume thatthe �nal good �rm is characterized by a technology such that it mustacquire m
Atunits of information processing services for each unit of ITt
involved in the production process. As a result the individual demand ofinformation management services is m
AtITjt (i) and we can rewrite pro�ts
of the �nal good producer as
�jt (i) = �jt (i) yjt (i)�wjthtnt�pIPCt
m
AITtITjt�1 (i)��vjt (i)�pITt IITjt (i)
The value of a �nal good producer is the expected discounted valueof its future pro�ts
Vjt (i) = Et
1Xs=t+1
�t;s�js (i) (12)
41In this case it is indi¤erent for a member of the household to work in a productionline or in the IPC.
36

where �t;t+1 = (1� �) ��Ct+1Ct
��1is the households�stochastic discount
factor which takes into account that �rms�survival probability is 1 ��. Firms which do not exit from the market have a time-t individualworkforce given by
njt (i) = %njt�1 (i) + vjt (i) qt (13)
and a stock of IT equal to
ITjt (i) =�1� �IT
�ITjt�1 (i) + I
ITjt (i) (14)
where �IT is the depreciation rate of IT material. The unit intersectoralelasticity of substitution implies that the nominal expenditure, EXPt;is identical across sectors. Thus, the �nal producer�s demand for eachsectoral good is
PjtYjt = PtYt = EXPt (15)
where Pjt is the price index of sector j and Pt is the price of the �nalgood at period t. Denoting with pjt (i) the price of good i in sector j,the demand faced by the producer of each variant is
yjt (i) =
�pjtPjt
��"Yjt (16)
where Pjt is de�ned as
Pjt =
24NjtXi=1
(pjt (i))1�"
35 11�"
(17)
Using (16) and (15) the individual demand of good i can be written asa function of aggregate expenditure,
yjt (i) =p�"jt
P 1�"jt
EXPt (18)
4.1.4 Business and Job Creation
At the beginning of each periodN ejt new �rms enter into sector j 2 (0; 1),
while at the end of the period a fraction � 2 (0; 1) of market participantsexits from the market for exogenous reasons.42 As a result, the numberof �rms in a sector Njt, follows the equation of motion:
Njt+1 = (1� �)(Njt +N ejt) (19)
42As discussed in Bilbiie et al. (2012), if macroeconomic shocks are small enoughNej;t is positive in every period. New entrants �nance entry on the stock market.
37

where N ejt is the number of new entrants in sector j at time t. Following
Bilbiie et al. (2012) we assume that new entrants at time t will onlystart producing at time t + 1 and that the probability of exit from themarket, �, is independent of the period of entry and identical acrosssectors. The assumption of an exogenous constant exit rate in adoptedfor tractability, but it also has empirical support. Using U.S. annualdata on manufacturing, Lee and Mukoyama (2007) �nd that, while theentry rate is procyclical, annual exit rates are similar across booms andrecessions. Below we describe the entry process and the mode of compe-tition within in each sector in detail. Prior to entry, �rms face a sunkentry cost �et to be paid in order to serve the market. It is made by twocomponents:
�et = �adt + p
ITt
�IITjt (i)
�newThe �rst term �adt represents the cost associated with regulation andbarriers to entry, which is common across sectors. It is exogenous andexpressed in units of the �nal good. The second component of the entrycost re�ects instead the fact that in order to start production in the nextperiod new �rms must set up a stock of IT. This requires an amountof investment in IT given by
�IITjt (i)
�new.43 If the �rm exits from the
market its IT stock is lost. Firms will enter into the market up to thepoint where their value, represented by the discounted value of theirfuture pro�ts, equals the sunk entry cost �et .Let us consider competition à la Bertrand. Each �rm i chooses pjt(i);
njt (i) ; vjt (i) and ITjt (i) to maximize �t (i) + Vt (i), taking as given theprice of the other �rms in the sector. In a symmetric equilibrium optimalpricing implies that the relative price chosen by �rms is
�t (";Nt) = �tmct (20)
where �t the markup over the marginal cost is given by
�t (";Nt) =" (Nt � 1) + 1("� 1) (Nt � 1)
(21)
The latter is decreasing in the number of �rms in the sector. Further,when Nt ! 1 the markup tends to "=(" � 1), i.e. the traditional oneunder monopolistic competition. The �rst order condition (FOC) with
43The parameter � is an indicator variable which takes value 0 or 1 and allowsto nest the post-cloud economy into the pro-cloud economy. As it will be clearbelow it takes value 1 before the introduction of cloud services and value 0 after theintroduction of the cloud.
38

respect to vacancies reads as
�t =�
qt(22)
Thus, the �rm sets the value of the marginal worker, �t, equal to theexpected cost of hiring the worker, �
qt. The FOC with respect to nt
delivers
�t =
�(1� �)mctAt
�ITt�1ntht
��ht � wtht
�+ ��
CtCt+1
Et�t+1 (23)
Combining the latter two equations delivers the following Job Cre-ation Condition (JCC)
�
qt= (1� �) �t
�tAt
�ITt�1ntht
��ht � wtht + %Et�t;t+1
�
qt+1
where we used the pricing condition to substitute for mct =�t�t. Since
the ratio �t�tincreases in the number of �rms, it follows that competition
leads to a rise in the marginal cost and hence in the equilibrium marginalrevenue. For this reason the marginal revenue product of labor (MRP),
given by (1� �) �t�tAt
�ITt�1ntht
��ht, also rises with competition. Thus,
stronger competition promotes the creation of vacancies and employmentdue to its positive e¤ect on the MRP of labor. The �rm will invest inIT up to the point where
pITt = �t;t+1
"�t+1�t+1
At+1�
�ITt
nt+1ht+1
���1� pIPCt+1
m
AITt+1
#+�t;t+1p
ITt+1
�1� �IT
�(24)
Increasing IT by one unit today costs pITt . The bene�t associated to themarginal unit of IT is given by the discounted marginal revenue productof IT net of data processing and maintenance costs, the �rst term atthe RHS, summed to the discounted value that the additional unit of ITwill have tomorrow, �t;t+1pITt+1
�1� �IT
�. Since IT is a stock variable, the
�rm is forced to look ahead when taking decisions concerning optimalinvestment in IT.As in Trigari (2009), bargaining takes place along two dimensions:
the real wage and the hours of work. We assume Nash bargaining. Thatis, the �rm and the worker choose the wage wt and the hours of work htto maximize the Nash product
(�t)1�� (�tCt)
� (25)
39

where �t is �rm value of having an additional worker, while �tCt is thehousehold�s surplus expressed in units of consumption. The parameter� re�ects the parties�relative bargaining power. The FOC with respectto the real wage is
��t = (1� �) �tCt (26)
Using the de�nition of �t in equation (23) and that of �t given by equa-tion (6), after some manipulations, yields the wage equation
wt=(1� �)b
ht+ (1� �)�Ct
h1='t
1 + 1='+ (27)
+��
1� �Et�t;t+1�t+1ht
+ (1� �) � �t�tAt
�ITAt�1ntNtht
��(28)
where �t =�qt, ztqt= �t, ITAt�1 = NtITt�1. The wage shares costs and ben-
e�ts associated to the match according to the parameter �. The workeris rewarded for a fraction � of the �rm�s revenues and savings of hiringcosts and compensated for a fraction 1 � � of the disutility he su¤ersfrom supplying labor and the foregone unemployment bene�ts. A distin-guishing feature of our approach is that the wage depends on the degreeof competition in the goods market. The direct e¤ect of competition
on the real wage is captured through the term � �t�t(1� �)At
�ITAt�1ntNtht
��,
which represents the share of the MRP which goes to workers. Entryleads to an increase in the ratio �t
�tand hence in the MRP. Thus, every-
thing else equal, stronger competition shifts the wage curve up. Thisresult is similar to that in the static model by Blanchard and Giavazzi(2003), who �nd a positive e¤ect of competition on the real wage. TheFOC with respect to ht yields
ht =
"(1� �)2
�Ct
�t�tAt
�ITAt�1ntNtht
��#': (29)
Because the �rm and the worker bargain simultaneously about wagesand hours, the outcome is (privately) e¢ cient and the wage does notplay an allocational role for hours. Stronger competition leads to anincrease in hours bargained between the workers and �rms for the samereasons for which competition positively a¤ects the wage schedule.
4.1.5 Hiring Policy and IT Policy
Let �newt , vnewt and�IITt�new
be, respectively, the real pro�ts, the numberof vacancies posted by a new �rm and investment in IT. Symmetrically,�t,vt and IITt de�ne, respectively, the individual pro�ts and vacanciesposted by an incumbent producer. New �rms and incumbent �rms are
40

characterized by the same size, nt. Thus, the optimal hiring policy ofnew �rms, which have no initial workforce, consists in posting at time tas many vacancies as required to hire nt workers. As a result vnewt = nt
qt.
Since nt = %nt�1 + vtqt, it has to be the case that
vnewt = vt + %nt�1qt
(30)
Hence, a new �rm posts more vacancies than an incumbent producer.For this reason, and given vacancy posting is costly, the pro�t of new�rms are lower than those of incumbent �rms, in particular
�newt = �t � k%nt�1qt
Notice also that a new entrant must set up a stock of IT beforestarting production next period. Given the IT choice is symmetric acrossproducers they have to invest during time t as much as required to reacha stock of IT identical to that held by incumbent producers at the endof time t, that is
�IITt�new
= ITt. The sunk entry cost for a new �rmcan thus be written as
�et = �ad + pITt ITt
In each period the level of entry is determined endogenously to equatethe value of a new entrant, V et , to the entry cost
V et = �et (31)
Notice that perspective new entrants have lower value than producing�rms because they will have, in case they do not exit from the marketbefore starting production, to set up a workforce in their �rst periodof activity. The di¤erence in the value between a �rm which is alreadyproducing and a perspective entrant is, in fact, the discounted value ofthe higher vacancy posting cost that the latter will su¤er, with respectto the former, in the �rst period of activity. Formally
Vt = Vet + �%Et�t;t+1
ntqt+1
= �et + �%Et�t;t+1ntqt+1
(32)
where Vt is the value of a producing �rm (both new �rms and incumbent�rms) at time t.In order to mimic the need to install and run a DPO, we assume that
�nal good producers will incur a period �xed cost, which we de�ne as�. As already mentioned in Section 2, the designation of a DPO canbe regarded as a �xed cost since it does not scale with the size of the
41

�rm or the number of data records. Compliance with other articles inthe regulation require a mix of �xed costs and variable costs that scalewith the amount of data processed, or more generally with the numberof projects initiated by a �rm. For this reason, the model counterpart ofthis requirement will be an increase in the units of information processingservices for each unit of ITt involved in the production process. As aresult we can rewrite pro�ts of a �nal good producer as
�jt (i) = �jt (i) yjt (i)�wjthtnt�pIPCt
�
AITtITjt�1 (i)��vjt (i)�pITt IITjt�1 (i)��
where � � m. Aggregate pro�ts will now read as
�t = Yt � wtNtntht � pIPCt
�
AITtITAt�1 � pITt NtIITt � �vFt �Nt�
while the aggregate accounting equation translates into
Yt = Ct + �adN e
t + Ikt + �v
Ft +
��
qt� %�t;t+1
�
qt+1
��
AITt
ITt�1ht
+Nt�
In the Appendix we provide the value of parameters and the long-runequilibrium of the economy. As in the bulk of the literature we log-linearize equilibrium conditions and solve the resulting system of linerdi¤erence equations.The dynamics of the main sectoral variables in the aftermath of the
introduction of the data protection act are those depicted in Figure 5and 6.
5 Conclusions
In this article we have simulated the economic impact of the introductionof the EU Data Protection Regulation. Compliance with the regulationposes a number of challenges for SMEs. The �rst one concerns the de-sign of systems and procedures for data protection. The second is aboutdata protection impact assessments which must be incorporated intoIT project management so that �rms can identify and mitigate speci�crisks on data processing. Another major challenge is the designation ofa data protection o¢ cer. Substantial costs will be associated also withthe compulsory noti�cation of any data breach in 24 hours to the super-visory authority and without undue delay to the data subjects, whichis extremely demanding, especially for minor data breaches. These andseveral additional elements will result in substantial compliance costs for�rms and SMEs in particular. Nevertheless, the �one-stop-shop�prin-ciple will reduce some compliance costs ensuring that data controllers
42

and data processors that operate across countries will be regulated by asingle supervisory authority (though this is not the case for companiesthat happen to be both data controllers and data processors in di¤erentcountries). There is also an important e¤ort in promoting secure datatransfers (but it would be usefull to support and standardize a strongerprotection of data moved in the cloud). Overall, we emphasize how thenet compliance costs remain positive and extremely large for EuropeanSMEs, something that must be taken into account when evaluating costand bene�ts of the new regulation.Beyond these direct costs, there are indirect macroeconomic costs of
the regulation that are more di¢ cult to measure: these are due to theimpact that these additional costs have on the process of business cre-ation and job creation. We have evaluated the impact of the regulationon output, employment and business creation using a macroeconomicmodel characterized by endogenous market structures and job match-ing. This setting features an economy with many sectors, where thedynamics of the number of market competitors is endogenous. Firmsface a cost of entry in the market which they will decide to a¤ord justif compensated by the expectation of future pro�ts. In our model �rmsproduce the �nal goods using labor and IT. The stock of IT takes theform of IT hardware, but also of data stored by �rms which represent anessential input for the production process. Firms employ multiple work-ers and the labor market is characterized by frictions. Both new �rmsand incumbent �rms need to hire workers from the pool of unemployedagents who are looking for a job and to set up a stock of IT materialbefore starting production. The simulation shows a substantial negativeimpact of the EU Data Protection Regulation on the number of businessand the number of jobs.
References
Alesina, A., I. Angeloni and F. Etro, 2005, International Unions, Amer-ican Economic Review, 95, 602-15Andolfatto, D., 1996, Business Cycles and Labor Market Search,
American Economic Review, 86, 112-32Bell B. and J. Smith, 2002, On Gross Worker Flows in the United
Kingdom: Evidence from the Labour Force Survey, Bank of EnglandWP 160, Bank of EnglandBilbiie, F., F. Ghironi and M. Melitz, 2012, Endogenous Entry, Prod-
uct Variety, and Business Cycles, Journal of Political Economy, 120, 2,304-44Bils, M., 1987, The Cyclical Behavior of Marginal Cost and Price,
American Economic Review, 77, 838-55
43

Bils M., Chang Y., and Kim S.B., 2011, Worker Heterogeneity andEndogenous Separations in a Matching Model of Unemployment Fluc-tuations, American Economic Journal: Macroeconomics, 3, 128-54Blanchard, O. and Galì J., 2010, Labor Market Frictions and Mon-
etary Policy: A New Keynesian Model with Unemployment, AmericanEconomic Journal: Macroeconomics, 2, 2, 1-30Blanchard, O. and Giavazzi, F., 2003, Macroeconomic E¤ects of Reg-
ulation and Deregulation in Goods and Labor Markets, Quarterly Jour-nal of Economics, 118, 3, 879-907Borek, C. L. Christensen, P. Hess, G. Rafert and J. Lerner, 2012,
Lost in the Clouds: The Impact of Copyright Scope on Investment inCloud Computing Ventures, mimeo, Harvard UniversityChristiano, L., M. Eichenbaum, and C. Evans, 2005, Nominal Rigidi-
ties and the Dynamic E¤ects of a Shock to Monetary Policy, Journal ofPolitical Economy, 113, 1-45Colciago, A. and F. Etro, 2010, Real Business Cycles with Cournot
Competition and Endogenous Entry, Journal of Macroeconomics, 32, 4,1101-17Colciago, A. and F. Etro, 2012, Technology Adoption, Job Matching
Frictions and Business Creation, W.P. 30, University of VeniceColciago, A. and L. Rossi, 2011, Endogenous Market Structures and
Labor Market Dynamics, mimeo, University of Milano BicoccaCostain, J. and M. Reiter, 2008, Business Cycles, Unemployment
Insurance, and the Calibration of MatchingModels, Journal of EconomicDynamics and Control, 32, 4, 1120-55Davis, S.J., Haltiwanger, J.C. and Schuh, S., 1996, Job Creation and
Job Destruction, The MIT Press,CambridgeDen Haan, W., Ramey, G., Watson, J., 2000, Job Destruction and
the Propagation of Shocks, American Economic Review, 90, 482-98ECB, 2002, Labor Market Mismatches in the Euro Area Countries,
European Central BankEtro, F., 2009a, The Economic Impact of Cloud Computing on Busi-
ness Creation, Employment and Output in the E.U., Review of Businessand Economics, 54, 2, 179-208Etro, F., 2009b, Endogenous Market Structures and the Macroecon-
omy, New York and Berlin, SpringerEtro, F. and A. Colciago, 2010, Endogenous Market Structure and
the Business Cycle, The Economic Journal, 120, 549, 1201-33Etro, F., 2013, The Theory of Endogenous Market Structures, Jour-
nal of Economic Surveys, in pressEuropean Commission, 2007, The European e-Business Report, 2006/07.
A portrait of e-business in 10 sectors of the EU economy, 5th Synthesis
44

Report of the Sectoral e-Business Watch, Brussels, European Commis-sionGhironi, F. and M. Melitz, 2005, International Trade and Macroeco-
nomic Dynamics with Heterogenous Firms, Quarterly Journal of Eco-nomics, 120, 865-915Hagedorn, M. and Manovski, J., 2008, The Cyclical Behavior of Equi-
librium Unemployment and Vacancies Revisited, American EconomicReview, 98, 4, 1692-706Hall R., 1995, Lost Jobs, Brookings Papers on Economic Activity,
Economic Studies Program, The Brookings Institution, 26, 221-74Haltiwanger,J. C. Jarmin, R. S. and Miranda, J. 2010, Who Creates
Jobs? Small vs. Large vs. Young, NBER Working Paper No. 16300Jaimovich, N. and M. Floetotto, 2008, Firm Dynamics, mark up
Variations, and the Business Cycle, Journal of Monetary Economics,55, 7, 1238-52Kydland, F. and E. Prescott, 1982, Time to Build and Aggregate
Fluctuations, Econometrica, 50, 6, 1345-70Lee, Y. and T. Mukoyama, 2012, Entry, Exit, and Plant-level Dynam-
ics over the Business Cycle, mimeo, Federal Reserve Bank of ClevelandMerz, Monica, 1995, Search in the Labor Market and the Real Busi-
ness Cycle, Journal of Monetary Economics, 36, 269-300Mortensen, D. and C. Pissarides, 1994, Job Creation and Job De-
struction in the Theory of Unemployment, Review of Economic Studies,61, 3, 397-415Oliveira Martins, J. and S. Scarpetta, 1999, The level and Cyclical
Behavior of Mark-ups Across Countries and Market Structures, OECDWorking Paper No. 213, OECD PublishingPetrongolo, B. and C. Pissarides, 2001, Looking into the Black Box:
A Survey of the Matching Function, Journal of Economic Literature, 39,2, 390-431Pissarides, Christopher, 2000, Equilibrium Unemployment Theory,
Cambridge: MIT PressShimer, R., 2005, The Cyclical Behavior of Equilibrium Unemploy-
ment and Vacancies, American Economic Review, 95, 1, 25-49Thomas, C., and F. Zanetti (2009), Labor Market Reform and Price
Stability: An Application to the Euro Area, Journal of Monetary Eco-nomics, 56, 6, 885-99Trigari, A., 2009, Equilibrium Unemployment, Job �ows and In�a-
tion Dynamics, Journal of Money, Credit and Banking, 41, 1, 1-33
45

AppendixAppendix A: Model AppendixAggregation and Market Clearing
Considering that sectors are symmetric and have a unit mass, the sec-toral number of �rms and new entrants also represents their aggregatecounterpart. Thus, the dynamics of the aggregate number of �rms is
Nt = (1� �) (Nt +N et )
As aggregate expenditure and sectoral expenditure are identical, it fol-lows that EXPt =
PNti=1 ptyt = Ntptyt. Considering �t = pt=Pt and the
individual production function we obtain
Yt = �tNtyt = �tAt�ITAt�1
��(Ntntht)
1�� (33)
The aggregate production function features a form of increasing returns.In this case a productivity shock impacts directly on output, but alsothrough the �rm creation channel. Total vacancies posted at period tare
vtott = (1� �)Nt�1vt + (1� �)N et�1v
newt�1 + v
IPCt ;
where (1� �)Nt�1 is the number of incumbent producers, (1� �)N et�1
is the number of new �rms and vIPC is the total number of vacanciesposted by the IPC. Aggregating the budget constraints of households weobtain the aggregate resource constraint of the economy
Ct +
��ad + pITt
ITtNt
�N et + I
kt = wthtLt + r
ktKt�1 +�t (34)
which states that the sum of consumption and investment in new en-trants and capital must equal the sum between labor income and aggre-gate pro�ts, �t, distributed to households at time t . Aggregate pro�tsare de�ned as44
�t = (1� �)Nt�1�t + (1� �)N et�1�
newt (35)
where
�t = �tyt � wtntht � �vt � pIPCt
m
AITtITt�1 � pITt IITt
and
�newt = �tyt � wtntht � �vnewt � pIPCt
m
AITtITt�1 � pITt IITt
44Since the producer of IT material and the provider of IT services operate inperfect competition they make no pro�ts.
46

In this case
�t=(1� �)Nt�1��tyt � wtntht � �vt � pIPCt
m
AITtITt�1 � pITt IITt
�+
+(1� �)N et�1
��tyt � wtntht � �vnewt � pIPCt
m
AITtITt�1 � pITt IITt
�Since ITAt�1 = NtITt�1, and de�ning
vFt = (1� �)Nt�1vt + (1� �)N et�1v
newt
as the number of vacancies created by the producers of the �nal good,it follows that
�t = Yt � wtNtntht � pIPCt
m
AITtITAt�1 � pITt NtIITt � �vFt
Notice thatpIMCt ht =
�
qt� %�t;t+1
�
qt+1+ wtht
hence
�t=Yt � wtNtntht � wt�m
AITtITAt�1
�+
���
qt� %�t;t+1
�
qt+1
�1
ht
�m
AITtITAt�1
�� pITt NtIITt � �vFt
Since Mt = nIPCt ht =
�m=AITt
�ITAt�1, we can express aggregate pro�ts
as
�t = Yt�wtNtntht�wtnIPCt ht���
qt� %�t;t+1
�
qt+1
�nIPCt �pITt NtIITt ��vFt
The aggregate number of workers is Lt = ntNt+nIPC , which leads �nallyto
�t = Yt � wtLtht ���
qt� %�t;t+1
�
qt+1
�nIPCt � pITt NtIITt � �vFt
As a result, the clearing of the market for the �nal good requires
Ct +
��ad + pITt
ITAtNt
�N et + I
kt (36)
= rktKt�1 + Yt ���
qt� %�t;t+1
�
qt+1
�nIPCt � pITt NtIITt � �vFt (37)
47

or
Ct + �adN e
t + pITt
�ITAtNt
N et +NtI
ITt
�+ Ikt (38)
= rktKt�1 + Yt ��
qt
m
AITt
ITt�1ht
+ %�t;t+1�
qt+1
m
AITt
ITt�1ht
� �vFt (39)
Notice that the total IT produced at time t must be equal to the sumbetween investment by incumbent �rms and that of new entrants, thatis
�ITAt =ITAtNt
N et +NtI
ITt
thus, using �ITAt = AITt Kt�1 and pITt =
rktAITt, it follows
Ct + �adN e
t + Ikt = Yt �
�
qt
m
AITt
ITt�1ht
+ %�t;t+1�
qt+1
m
AITt
ITt�1ht
� �vFt
and �nally
Yt = Ct + �adN e
t + Ikt + �v
Ft +
��
qt� %�t;t+1
�
qt+1
�m
AITt
ITt�1ht
(40)
The dynamics of the aggregate stock of IT reads as follows
ITAt = (1� �)��1� �IT
�ITAt�1 +�IT
At
�Equilibrium conditions
This section reports the conditions de�ning the equilibrium of the modeleconomy.
�t (";Nt) =" (Nt � 1) + 1("� 1) (Nt � 1)
�t = N1
��1t
Yt = At�ITAt�1
��(Ntntht)
1��
yt =Yt�tNt
Yt = Ct + �adN e
t + Ikt + �v
Ft +
��
qt� %�t;t+1
�
qt+1
�m
AITt
ITt�1ht
+ (41)
pITt =rktAITt
48

Kt =�1� �k
�Kt�1 + I
kt
vtott = vit + vet + v
IPCt
vet = (1� �)N et�1Nt
Ntntqt
N et =
Nt+1(1� �) �Nt
Lt = Ntnt + nIMCt
nt = �nt�1 + vit (i) qt
nIPCt = �nIPCt�1 + vIPCt qt
nIMCt =
m
AITt
ITtht
�
qt= (1� �) �t
�tAt
�ITt�1ntht
��ht � wtht + %Et�t;t+1
�
qt+1
qt = m�� t
wtht=(1� �) b+ (1� �)�Cth1+1='t
1 + 1='+
+��
1� �Et�t;t+1�t+1 + (1� �) ��t�tAt
�ITAt�1Ntntht
��ht
�t =vtott
(1� Lt�1)
1
Ct= �(1 + rt)
1
Ct+1
1
Ct= �(1 + rkt � �k)
1
Ct+1
Vt = (1� �) �CtCt+1
(�t+1 + Vt+1)
�et = (1� �) �CtCt+1
��newt+1 + Vt+1
�ITAt = (1� ��)
��1� �IT
�ITAt�1 +�ITt
�pITt = (1� �) � Ct
Ct+1
"��t+1�t+1
At+1
�ITAt
Nt+1nt+1ht+1
���1� pIPCt+1
m
AITt+1+ pITt+1
�1� �IT
�#�ITt = A
ITt Kt�1
49

Kt =�1� �k
�Kt�1 + I
kt
�t = �tyt � wtntht � �vt (i)� pIPCt
m
AITt
ITAt�1Nt
� pITt IITt
IITt =ITAtNt+1
��1� �IT
� ITAt�1Nt
ht =
"(1� �)2
�Ct
�t�tAt
�ITAt�1Ntntht
��#'�t = (1� �)Nt�1�t + (1� �)N e
t�1�newt
�et = �ad + �pITt
ITtNt
Model Calibration
Calibration is conducted on a quarterly basis as in Shimer (2005) andBlanchard and Galì (2010) among others. The discount factor, �, isset to the standard value of 0.99. The exit rate is set at � = 0:025which implies an yearly rate of business destruction rate of 10 percentas reported by Bilbiie et al. (2012) for the US. The baseline value forthe entry cost is set such that the ratio of investment in new �rms andphysical capital is close to 15 per cent, as in Bilbiie et al. (2012). Theimplied steady state price markup is about 35 per cent. This value iswithin the range estimated by Oliveira Martins and Scarpetta (1999) fora large number of U.S. manufacturing sectors. With no loss of generality,the value of � is such that steady state hours equals one. In this casethe Frisch elasticity of labor supply reduces to ', to which we assigna low value of 0.5 in line with the evidence. We take as the baselinevalue for the intersectoral elasticity of substitution " = 6, as estimatedby Christiano, Eichenbaum and Evans (2005) using U.S. quarterly databetween 1965 and 1995. We set � = 0:15, which delivers a steady statelabor income share equal to 65 percent, in line with the evidence. Asstandard in the literature we set the steady state marginal productivityof labor, A, to 1. The same value is set for the marginal productivity ofcapital in the IT producing sector, AIT .The elasticity of matches to unemployment is = 1
2, within the range
of the plausible values of 0.5 to 0.7 reported by Petrongolo and Pissarides(2001) in their survey of the literature on the estimation of the match-ing function. In the baseline parameterization we impose symmetry inbargaining and set � = 1
2, as in the bulk of the literature.
Next we turn to parameters that characterize the dynamics in thelabor market. We set the e¢ ciency parameter in matching, m, and
50

the steady state job market tightness to target an average job �ndingrate, z, equal to 0.7 and a vacancy �lling rate, q, equal to 0.9. We drawthe latter value from Andolfatto (1996) and Dee Haan et al. (2000),while the former from Blanchard and Galì (2010). Since we consider alabor-leisure choice, the overall replacement rate is given by the sum ofthe unemployment insurance bene�t and the disutility cost of working.We calibrate the latter to 0.4. We select a quarterly job separation rateequal to 0.1. Both the latter �gures are consistent with Shimer (2005).The cost of posting a vacancy � is obtained by equating the steady
state version of the JCC and the steady state wage setting equation.Finally we set m = 0:025 and �IT = 0:025: These �gures imply thatdata processing costs make up about 10 percent of the value of the ITstock each year, and that the IT stock of a �rm fully depreciates in aboutten years.Finally we turn to the baseline calibration of � and �, which deter-
mine the aggregate economic impact of the introduction of the regulationact. The calibration of these parameters di¤ers according to the sectorunder analysis. To pin down �, we target the share of the overall in-crease in IT budget (reported in Table 2) which can be attributed toadditional �xed costs. Consider for example the Real Estate, Rentingand Business Activities sector. The overall change in IT budget for thetypical �rm is estimated to be 7265 euros per year, 2763 of which areattributable to �xed cost, as reported in Figure 3. Hence 38 percent ofthe change in the IT budget is due to �xed costs. We target this ratioin order to �x the parameter �. The remaining change in the IT budgetis due to a change in variable costs which can be target by choosing anappropriate value of �.
51

Appendix B
The table below provides the estimated percent of firms impacted in each sector by the various articles
in the EU Data Protection Regulation. The figures were calculated by first assessing the percentage of
firms impacted in the subsectors within an industrial sector and then taking a weighted average.
Percent of Firms Impacted in each Industrial Sector*
Article Group Transport, storage and communications
Hotels and Restaurants
Real estate, renting and business activities
Wholesale and retail trade; repair of motor vehicles and motorcycles
Across all 5 industrial sectors (includes manufacturing)
23, 33 4% 5% 11% 10% 8% 34 4% 5% 11% 10% 8%
31, 32 4% 5% 11% 10% 8% 12, 17, 18 4% 5% 11% 10% 8%
11 4% 5% 11% 10% 8% 77 1% 1% 3% 3% 2% 43 1% 1% 3% 3% 2%
24, 25 1% 1% 3% 3% 2% 7 27% 99% 34% 66% 48%
5, 19, 20 27% 99% 34% 66% 48% 8 7% 0% 5% 20% 9%
28, 35, 36, 37, 2% 0% 10% 0% 4% 55, 56, 57, 58,
76 0.1% 0.1% 0.3% 0.3% 0.2%
79 0% 0% 0% 0% 0% 22 0% 0% 0% 0% 0%
*No firms related to manufacturing are thought to be impacted and all percentages for this sector will be zero.
From the table above, one can see that there are logical groupings among certain article groups related
to the nature of the legislation. For example all articles related to the transfer of data between EU
member states will impact the same subset of firms (Articles 77,43, 24, and 25). It should also be noted
that the percentages across all 5 industrial sectors would be higher if manufacturing were excluded
since none of the article groups impact this industrial sector.

Appendix C
In the appendix below, we have provided details on the calculations for estimating the total economic
cost of the relevant article groups as well as the estimated average cost for an SME. To calculate the
total impact, we first determined the industrial subsectors within each of the 5 industrial sectors that
will be affected by the article group (using NACE_Revision 2 data from the EU). Within each individual
industrial subsector we multiplied number of SME’s impacted by the estimated cost faced by an
impacted firm. Depending on the article group, these calculations were sometimes also weighted by the
size of the firm (micro, small or medium). Finally the costs across the affected industrial subsectors were
summed up to obtain the total cost impact for each industrial sector. This data is shown in the first table
for each article group. The average cost per SME values (used in the model) were calculated by taking
the total cost impact in each industrial sector and dividing it by the total number of SMEs in the
industrial sector (not just the SMEs in the subcategories impacted). The average cost per SME data is
shown in the second table for each article group.

Articles 5, 19, 20
Cost Impact of Articles 5, 19, 20
Transport, storage and communications
Industrial Sector # of firms (micro, small and medium)[a] Total Cost Impact
(18,800 x 11% x
[a])
Passenger air
transport
3,166 € 6,547,288
Motion picture, video
and television
programme activities
76,342 € 157,875,256
Sound recording and
music publishing
activities
18,884 € 39,052,112
Television
programming and
broadcasting
activities
5,238 € 10,832,184
Wireless
telecommunications
activities
5,772 € 11,936,496
Satellite
telecommunications
activities
70 € 144,760
Computer
programming,
consultancy and
related activities
314,000 € 649,352,000
Data processing,
hosting and related
activities; web portals
31,774 € 65,708,632
Other information
service activities
7,040 € 14,558,720
Total impact to Transport, storage and communications € 956,007,448

Hotels and Restaurants
Industrial Sector # of firms (micro, small and medium)[a] Total Cost Impact
(18,800 x 11% x
[a])
Hotels and similar
accommodation
150,729 € 311,707,572
Holiday and other
short-stay
accommodation
85,974 € 177,794,232
Other
accommodation
10,322 € 21,345,896
Restaurants and
mobile food service
activities
815,758 €1,686,987,544
Event catering and
other food service
activities
63,972 € 132,294,096
Beverage serving
activities
606,526 € 1,254,295,768
Total impact to Hotels and Restaurants € 3,584,425,108

Real estate, renting and business activities
Industrial Sector # of firms (micro, small and medium)[a] Total Cost Impact
(18,800 x 11% x
[a])
Buying and selling of
own real estate
93,274 € 192,890,632
Renting and
operating of own or
leased real estate
664,702 € 1,374,603,736
Advertising 217,905 € 450,627,540
Market research and
public opinion polling
34,342 € 71,019,256
Renting and leasing
of motor vehicles
31,758 € 65,675,544
Renting and leasing
of personal and
household goods
40,814 € 84,403,352
Activities of
employment
placement agencies
24,509 € 50,684,612
Temporary
employment agency
activities
31,253 € 64,631,204
Travel agency and
tour operator
activities
65,090
€ 134,606,120
Cleaning activities 187,529 € 387,809,972
Landscape service
activities
122,434 € 253,193,512
Organisation of
conventions and
trade shows
31,257 € 64,639,476
Business support
service activities
n.e.c.
261,874 € 541,555,432
Total impact to Real estate, renting and business activities € 3,736,340,388

Wholesale and retail trade; repair of motor vehicles and motorcycles
Industrial Sector # of firms (micro, small and medium)[a] Total Cost Impact
(18,800 x 11% x
[a])
Retail sale of other goods in
specialised stores
1,145,144 €
2,368,157,792
Retail sale in non-specialised
stores
553,379 € 1,144,387,772
Retail sale of food, beverages
and tobacco in specialised stores
476,437 € 985,271,695
Retail sale of other household
equipment in specialised stores
465,486 € 962,625,048
Retail sale via stalls and markets 349,487
€ 722,739,116
Retail sale of cultural and
recreation goods in specialised
stores
210,406
€ 435,119,608
Sale of motor vehicles 196,497 € 406,355,796
Retail trade not in stores, stalls
or markets
185,919 € 384,480,492
Sale of motor vehicle parts and
accessories
111,119
€ 229,794,092
Retail sale of information and
communication equipment in
specialised stores
97,222 € 201,055,096
Retail sale of automotive fuel in
specialised stores
71,696 € 148,267,328
Sale, maintenance and repair of
motorcycles and related parts
and accessories
37,431
€ 77,407,308
Total Impact to Wholesale and retail trade; repair of motor vehicles and
motorcycles
€ 8,056,661,143
Total Impact across all 5 industries € 16,3452,434,087

Average Cost per SME
Industrial Sector Total # of SMEs [a] Total Cost of Articles [b] Average cost per SME
[b]/[a]
Transport, storage and
communications
1,690,890 € 956,007,448 € 565
Hotels and Restaurants 1,749,151 € 3,584,425,108 € 2,049
Real estate, renting and
business activities
5,385,648 € 3,736,340,388 € 694
Wholesale and retail
trade; repair of motor
vehicles and
motorcycles
5,903,649 € 8,056,661,143 € 1,366
Articles 28, 35, 36, 37
Cost Impact of Articles 35, 36, 37
Transport, storage and communications
Industrial Sector # of micro firms
[a]
# of small firms
[b]
# of medium
firms [c]
Total Cost Impact
(25,000 x [a] +
50,000 x [b] +
50,000 x [c])
Data processing,
hosting and related
activities; web portals
27,118 3,982 674 € 910,750,000
Total impact to Transport, storage and communications € 910,750,000

Real estate, renting and business activities
Industrial Sector # of micro firms
[a]
# of small firms
[b]
# of medium
firms [c]
Total Cost Impact
(25,000 x [a] +
50,000 x [b] +
50,000 x [c])
Accounting,
bookkeeping and
auditing activities; tax
consultancy
481,115 22,985 0 € 13,177,125,000
Market research and
public opinion polling
32,515 1,827 0 € 904,225,000
Other human
resources provision
2,000 1,128 900 € 151,400,000
Private security
activities
10,083 5,422 2,464 € 646,375,000
Total Impact to Real estate, renting and business activities € 14,879,125,000
Total Impact across all 5 industries (sum of transport and real estate) € 15,789,875,000
The costs for Article 28 were calculated in a similar manner described above. They impacted the same
businesses as those impacted by the DPO (Articles 28, 35, 36, 37). When those costs are added in to the
costs of Articles 35, 36, 37, we have the final average cost per firm values shown below.
Average Cost per SME (including Article 28)
Industrial Sector Total Expected Cost of Compliance for SME
Transport, storage and communications €594
Hotels and restaurants €0
Real estate, renting and business activities €3,017
Manufacturing €0
Wholesale and retail trade €0

Articles 23, 33
Cost Impact of Articles 23, 33
Transport, storage and communications
Industrial Sector # of SMEs [a] Expected Cost
per firm
(euros)[b]
Total Cost Impact
([a] x [b])(euros)
Passenger rail
transport, interurban
256 14000
€ 3,584,000
Passenger air
transport
3,166 14000 € 44,324,000
Wired
telecommunications
activities
11,071
14000 € 154,994,000
Wireless
telecommunications
activities
5,772
34000 € 196,248,000
Satellite
telecommunications
activities
70
34000 € 2,380,000
Other
telecommunications
activities
21,664
14000 € 303,296,000
Data processing,
hosting and related
activities; web portals
31,774 34000 € 1,080,316,000
Total impact to Transport, storage and communications € 1,785,142,000
Hotels and Restaurants
Industrial Sector # of SMEs [a] Expected Cost
per firm
(euros)[b]
Total Cost Impact
([a] x [b])(euros)
Holiday and other
short-stay
accommodation
85,974
14000
€ 1,203,636,000
Total impact to Hotels and Restaurants € 1,203,636,000

Real estate, renting and business activities
Industrial Sector # of SMEs [a] Expected Cost
per firm
(euros)[b]
Total Cost Impact
([a] x [b])(euros)
Accounting,
bookkeeping and
auditing activities; tax
consultancy
504,100
14,000
€ 7,057,400,000
Market research and
public opinion polling
34,342
14,000
€ 480,788,000
Temporary
employment agency
activities
31,253
14,000
€ 437,542,000
Other human
resources provision
4,028
14,000
€ 56,392,000
Private security
activities
17,969 149,000
€ 2,677,381,000
Security systems
service activities
8,237 149,000
€ 1,227,313,000
Activities of call
centres
7,361
14,000
€ 103,054,000
Total impact to Real estate, renting and business activities € 12,039,870,000
Wholesale and retail trade; repair of motor vehicles and motorcycles
Industrial Sector # of SMEs [a] Expected Cost
per firm
(euros)[b]
Total Cost Impact
([a] x [b])(euros)
Maintenance and repair of motor vehicles
419,998
14,000 € 5,879,972,000
Sale of motor vehicles 196,497 14,000 € 2,750,958,000
Total Impact to Wholesale and retail trade; repair of motor vehicles and
motorcycles
€ 8,630,930,000
Total Impact across all 5 industries € 23,659,575,000

Average Cost per SME
Industrial Sector Total # of SMEs [a] Total Cost of Articles [b] Average cost per SME
[b]/[a]
Transport, storage and
communications
1,690,890 € 1,785,142,000 € 1,056
Hotels and Restaurants 1,749,151 € 1,203,636,000 € 688
Real estate, renting and
business activities
5,385,648 € 12,039,870,000 € 2,236
Wholesale and retail
trade; repair of motor
vehicles and
motorcycles
5,903,649 € 8,630,930,000 € 1,462

Article 7
Cost Impact of Article 7
Transport, storage and communications
Industrial Sector # of firms (micro, small and medium)[a] Total Cost Impact
(633x [a])
Passenger air
transport
3,166 € 2,004,078.00
Motion picture, video
and television
programme activities
76,342 € 48,324,486.00
Sound recording and
music publishing
activities
18,884 € 11,953,572.00
Television
programming and
broadcasting
activities
5,238 € 3,315,654.00
Wireless
telecommunications
activities
5,772 € 3,653,676.00
Satellite
telecommunications
activities
70 € 44,310.00
J620 - Computer
programming,
consultancy and
related activities
314,000 € 198,762,000.00
Data processing,
hosting and related
activities; web portals
31,774 € 20,112,942.00
Other information
service activities
7,040 € 4,456,320.00
Total impact to Transport, storage and communications € 292,627,038

Hotels and Restaurants
Industrial Sector # of firms (micro, small and medium)[a] Total Cost Impact
(633x [a])
Hotels and similar
accommodation
150,729 € 95,411,457.00
Holiday and other
short-stay
accommodation
85,974 € 54,421,542.00
Other
accommodation
10,322 € 6,533,826.00
Restaurants and
mobile food service
activities
815,758 € 516,374,814.00
Event catering and
other food service
activities
63,972 € 40,494,276.00
Beverage serving
activities
606,526 € 383,930,958.00
Total impact to Hotels and Restaurants € 1,097,166,873

Real estate, renting and business activities
Industrial Sector # of firms (micro, small and medium)[a] Total Cost Impact
(633x [a])
Buying and selling of
own real estate
93,274 € 59,042,442.00
Renting and
operating of own or
leased real estate
664,702 € 420,756,366.00
Advertising 217,905 € 137,933,865.00
Market research and
public opinion polling
34,342 € 21,738,486.00
Renting and leasing of
motor vehicles
31,758 € 20,102,814.00
Renting and leasing of
personal and
household goods
40,814 € 25,835,262.00
Activities of
employment
placement agencies
24,509 € 15,514,197.00
Temporary
employment agency
activities
31,253 € 19,783,149.00
Travel agency and
tour operator
activities
65,090
€ 41,201,970.00
Cleaning activities 187,529 € 118,705,857.00
Landscape service
activities
122,434 € 77,500,722.00
Organisation of
conventions and
trade shows
31,257 € 19,785,681.00
Business support
service activities
n.e.c.
261,874 € 165,766,242.00
Total impact to Real estate, renting and business activities € 1,143,667,053

Wholesale and retail trade; repair of motor vehicles and motorcycles
Industrial Sector # of firms (micro, small and medium)[a] Total Cost Impact
(633x [a])
Retail sale of other
goods in specialised
stores
1,145,144 € 724,876,152.00
Retail sale in non-
specialised stores
553,379 € 350,288,907.00
Retail sale of food,
beverages and
tobacco in specialised
stores
476,437 € 301,584,614.67
Retail sale of other
household equipment
in specialised stores
465,486 € 294,652,638.00
Retail sale via stalls
and markets
349,487
€ 221,225,271.00
Retail sale of cultural
and recreation goods
in specialised stores
210,406
€ 133,186,998.00
Sale of motor vehicles 196,497 € 124,382,601.00
Retail trade not in
stores, stalls or
markets
185,919 € 117,686,727.00
Sale of motor vehicle
parts and accessories
111,119
€ 70,338,327.00
Retail sale of
information and
communication
equipment in
specialised stores
97,222 € 61,541,526.00
Retail sale of
automotive fuel in
specialised stores
71,696 € 45,383,568.00
Sale, maintenance
and repair of
motorcycles and
related parts and
accessories
37,431
€ 23,693,823.00
Total Impact to Wholesale and retail trade; repair of motor vehicles and
motorcycles
€ 2,468,841,153

Total Impact across all 5 industries € 5,002,302,116
Table 1. Average Cost per SME
Industrial Sector Total # of SMEs [a] Total Cost of Articles [b] Average cost per SME
[b]/[a]
Transport, storage and
communications
1,690,890 € 243,167,459 € 173
Hotels and Restaurants 1,749,151 € 171,787,242 € 627
Real estate, renting and
business activities
5,385,648 € 1,143,667,053 € 212
Wholesale and retail
trade; repair of motor
vehicles and
motorcycles
5,903,649 € 2,468,841,153 € 418

Article 8
Table 2. Cost Impact of Article 8
Transport, storage and communications
Industrial Sector # of SMEs [a] Weighting factor
[b]
Estimated Cost
(euros) [c]
Total Cost Impact
([a] x [b] x [c])
Motion picture, video
and television
programme activities
76,342 0.20 633 € 9,664,897
Sound recording and
music publishing
activities
18,884 0.20 633 € 2,390,714
Television
programming and
broadcasting
activities
5,238
0.20 633 € 663,131
Wireless
telecommunications
activities
5,772
0.20 633 € 730,735
Satellite
telecommunications
activities
70
1.00 633 € 44,310
Computer
programming,
consultancy and
related activities
314,000 0.20 633 € 39,752,400
Data processing,
hosting and related
activities; web portals
31,774 1.00 633 € 20,112,942
Total impact to Transport, storage and communications € 73,359,130
Real estate, renting and business activities
Industrial Sector # of SMEs [a] Weighting factor
[b]
Estimated Cost
(euros) [c]
Total Cost Impact
([a] x [b] x [c])
Advertising 217,905 1.00 633 € 137,933,865
Market research and
public opinion polling
34,342 1.00 633 € 21,738,486
Total Impact to Real estate, renting and business activities € 159,672,351

Wholesale and retail trade; repair of motor vehicles and motorcycles
Industrial Sector # of SMEs [a] Weighting factor
[b]
Estimated Cost
(euros) [c]
Total Cost Impact
([a] x [b] x [c])
Retail sale of other
goods in specialised
stores
1,145,144 0.20 633 € 144,975,230
Retail sale in non-
specialised stores
553,379 0.20 633 € 70,057,781
Retail sale of food,
beverages and
tobacco in specialised
stores
476,437 1.00 633 € 301,584,615
Retail sale of other
household equipment
in specialised stores
465,486 0.20 633 € 58,930,528
Retail sale of cultural
and recreation goods
in specialised stores
210,406
1.00 633 € 133,186,998
Retail trade not in
stores, stalls or
markets
185,919
0.20 633 € 23,537,345
Total Impact to Wholesale and retail trade; repair of motor vehicles and
motorcycles
€ 737,272,497
Total Impact across all 5 industries € 965,303,978
Table 3. Average Cost per SME
Industrial Sector Total # of SMEs [a] Total Cost of Articles [b] Average cost per SME
[b]/[a]
Transport, storage and
communications
1,690,890 € 73,359,130 € 43
Real estate, renting and
business activities
5,385,648 € 159,672,351 € 30
Wholesale and retail
trade; repair of motor
vehicles and
motorcycles
5,903,649 € 737,272,497 € 124

Articles 12, 17, 18
Table 4. Cost Impact of Articles 12, 17, 18
Transport, storage and communications
Industrial Sector # of micro firms
[a]
# of small firms
[b]
# of medium
firms [c]
Total Cost Impact
(1,558 x [a] +
14,433 x [b] +
25,933 x [c])
Passenger rail
transport, interurban
182 19 55 € 1,984,098
Passenger air
transport
2,639 361 166 € 13,626,753
Wired
telecommunications
activities
9,931 890 250 € 34,801,118
Wireless
telecommunications
activities
5,323 345 104 € 15,969,651
Satellite
telecommunications
activities
0 42 28 € 1,332,310
Other
telecommunications
activities
20,021 1,352 291 € 58,252,637
Data processing,
hosting and related
activities; web portals
27,118 3,982 674 € 117,200,892
Total impact to Transport, storage and communications € 243,167,459
Hotels and Restaurants
Industrial Sector # of micro firms
[a]
# of small firms
[b]
# of medium
firms [c]
Total Cost Impact
(1,558 x [a] +
14,433 x [b] +
25,933 x [c])
Holiday and other
short-stay
accommodation
83,244 2,496 234 € 171,787,242
Total impact to Hotels and Restaurants € 171,787,242

Real estate, renting and business activities
Industrial Sector # of micro firms
[a]
# of small firms
[b]
# of medium
firms [c]
Total Cost Impact
(1,558 x [a] +
14,433 x [b] +
25,933 x [c])
Accounting,
bookkeeping and
auditing activities; tax
consultancy
481,115 22,985 0 € 1,081,319,675
Market research and
public opinion polling
32,515 1,827 0 € 77,027,461
Temporary
employment agency
activities
20,058 7,131 4,064 € 239,563,799
Other human
resources provision
2,000 1,128 900 € 42,736,124
Private security
activities
10,083 5,422 2,464 € 157,863,952
Security systems
service activities
6,816 1,118 303 € 34,613,121
Activities of call
centres
5,313 1,399 649 € 45,299,938
Total impact to Real estate, renting and business activities € 1,678,424,070
Wholesale and retail trade; repair of motor vehicles and motorcycles
Industrial Sector # of micro firms
[a]
# of small firms
[b]
# of medium
firms [c]
Total Cost Impact
(1,558 x [a] +
14,433 x [b] +
25,933 x [c])
Maintenance and
repair of motor
vehicles
398,215 20,908 875 € 944,875,509
Sale of motor vehicles 168,780 22,573 5,144 € 722,154,701
Total Impact to Wholesale and retail trade; repair of motor vehicles and
motorcycles
€ 1,667,030,210
Total Impact across all 5 industries € 3,760,408,981

Table 5. Average Cost per SME
Industrial Sector Total # of SMEs [a] Total Cost of Articles [b] Average cost per SME
[b]/[a]
Transport, storage and
communications
1,690,890 € 243,167,459 € 144
Hotels and Restaurants 1,749,151 € 171,787,242 € 98
Real estate, renting and
business activities
5,385,648 € 1,678,424,070 € 312
Wholesale and retail
trade; repair of motor
vehicles and
motorcycles
5,903,649 € 1,667,030,210 € 282
Articles 31, 32
Table 6. Cost Impact of Articles 31, 32
Transport, storage and communications
Industrial Sector # of micro firms
[a]
# of small firms
[b]
# of medium
firms [c]
Total Cost Impact
(8,750 x [a] +
17,500 x [b] +
35,000 x [c])
Passenger rail
transport, interurban
182 19 55 € 3,850,000
Passenger air
transport
2,639 361 166 € 35,218,750
Wired
telecommunications
activities
9,931 890 250 € 111,221,250
Wireless
telecommunications
activities
5,323 345 104 € 56,253,750
Satellite
telecommunications
activities
0 42 28 € 1,715,000
Other
telecommunications
activities
20,021 1,352 291 € 209,028,750
Data processing,
hosting and related
activities; web portals
27,118 3,982 674 € 330,557,500
Total impact to Transport, storage and communications € 787,845,000

Hotels and Restaurants
Industrial Sector # of micro firms
[a]
# of small firms
[b]
# of medium
firms [c]
Total Cost Impact
(8,750 x [a] +
17,500 x [b] +
35,000 x [c])
Holiday and other
short-stay
accommodation
83,244 2,496 234 € 780,255,000
Total impact to Hotels and Restaurants € 780,255,000
Real estate, renting and business activities
Industrial Sector # of micro firms
[a]
# of small firms
[b]
# of medium
firms [c]
Total Cost Impact
(8,750 x [a] +
17,500 x [b] +
35,000 x [c])
Accounting,
bookkeeping and
auditing activities; tax
consultancy
481,115 22,985 0 € 4,611,993,750
Market research and
public opinion polling
32,515 1,827 0 € 316,478,750
Temporary
employment agency
activities
20,058 7,131 4,064 € 442,540,000
Other human
resources provision
2,000 1,128 900 € 68,740,000
Private security
activities
10,083 5,422 2,464 € 269,351,250
Security systems
service activities
6,816 1,118 303 € 89,810,000
Activities of call
centres
5,313 1,399 649 € 93,686,250
Total impact to Real estate, renting and business activities € 5,892,600,000

Wholesale and retail trade; repair of motor vehicles and motorcycles
Industrial Sector # of micro firms
[a]
# of small firms
[b]
# of medium
firms [c]
Total Cost Impact
(8,750 x [a] +
17,500 x [b] +
35,000 x [c])
Maintenance and
repair of motor
vehicles
398,215 20,908 875 € 3,880,896,250
Sale of motor vehicles 168,780 22,573 5,144 € 2,051,892,500
Total Impact to Wholesale and retail trade; repair of motor vehicles and
motorcycles
€ 5,932,788,750
Total Impact across all 5 industries 13,353,488,750
Table 7. Average Cost per SME
Industrial Sector Total # of SMEs [a] Total Cost of Articles [b] Average cost per SME
[b]/[a] + €100
Transport, storage and
communications
1,690,890 € 787,845,000 € 542
Hotels and Restaurants 1,749,151 € 780,255,000 € 546
Real estate, renting and
business activities
5,385,648 € 5,892,600,000 € 1,194
Wholesale and retail
trade; repair of motor
vehicles and
motorcycles
5,903,649 € 5,932,788,750 € 1,105

Article 11
Table 8. Cost Impact of Article 11
Transport, storage and communications
Industrial Sector # of firms (micro, small and medium)[a] Total Cost Impact
(633x [a]) (in
euros)
Passenger rail
transport, interurban
256
€ 537,600
Passenger air
transport
3,166
€ 6,648,600
Wired
telecommunications
activities
11,071 € 23,249,100
Wireless
telecommunications
activities
5,772 € 12,121,200
Satellite
telecommunications
activities
70 € 147,000
Other
telecommunications
activities
21,664 € 45,494,400
Data processing,
hosting and related
activities; web portals
31,774
€ 66,725,400
Total impact to Transport, storage and communications € 154,923,300
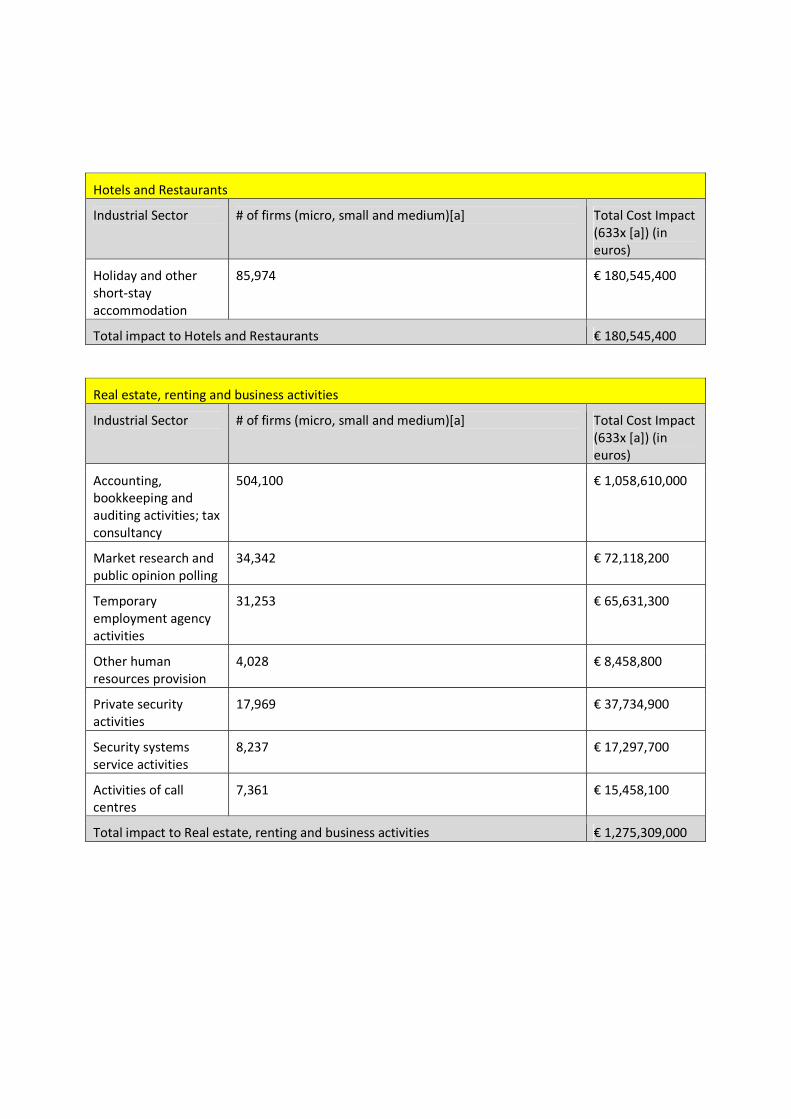
Hotels and Restaurants
Industrial Sector # of firms (micro, small and medium)[a] Total Cost Impact
(633x [a]) (in
euros)
Holiday and other
short-stay
accommodation
85,974 € 180,545,400
Total impact to Hotels and Restaurants € 180,545,400
Real estate, renting and business activities
Industrial Sector # of firms (micro, small and medium)[a] Total Cost Impact
(633x [a]) (in
euros)
Accounting,
bookkeeping and
auditing activities; tax
consultancy
504,100
€ 1,058,610,000
Market research and
public opinion polling
34,342
€ 72,118,200
Temporary
employment agency
activities
31,253 € 65,631,300
Other human
resources provision
4,028 € 8,458,800
Private security
activities
17,969 € 37,734,900
Security systems
service activities
8,237 € 17,297,700
Activities of call
centres
7,361
€ 15,458,100
Total impact to Real estate, renting and business activities € 1,275,309,000

Wholesale and retail trade; repair of motor vehicles and motorcycles
Industrial Sector # of firms (micro, small and medium)[a] Total Cost Impact
(633x [a]) (in
euros)
Maintenance and
repair of motor
vehicles
419,998
€ 881,995,800
Sale of motor vehicles 196,497 € 412,643,700
Total Impact to Wholesale and retail trade; repair of motor vehicles and
motorcycles
€ 1,294,639,500
Total Impact across all 5 industries € 2,905,417,200
Table 9. Average Cost per SME
Industrial Sector Total # of SMEs [a] Total Cost of Articles [b] Average cost per SME
[b]/[a]
Transport, storage and
communications
1,690,890 € 154,923,300 € 92
Hotels and Restaurants 1,749,151 € 180,545,400 € 103
Real estate, renting and
business activities
5,385,648 € 1,275,309,000 € 237
Wholesale and retail
trade; repair of motor
vehicles and
motorcycles
5,903,649 € 1,294,639,500 € 219
Article 34

Table 10. Cost Impact of Article 34
Industrial Sector # of firms (micro, small and medium)[a] Total Cost Impact
(1,489 x [a])
Transport, storage and communications
Passenger rail transport, interurban
256
€ 381,235
Passenger air transport
3,166
€ 4,714,807
Wired telecommunications activities
11,071 € 16,486,933
Wireless telecommunications activities
5,772 € 8,595,662
Satellite telecommunications activities
70 € 104,244
Other telecommunications activities
21,664 € 32,262,029
Data processing, hosting and related activities; web portals
31,774 € 47,317,841
Total impact to Transport, storage and communications € 109,862,752

Hotels and Restaurants
Industrial Sector # of firms (micro, small and medium)[a] Total Cost Impact
(1,489 x [a])
I552 - Holiday and other short-stay accommodation
85,974 € 128,032,481
Total impact to Hotels and Restaurants € 128,032,481
Real estate, renting and business activities
Industrial Sector # of firms (micro, small and medium)[a] Total Cost Impact
(1,489 x [a])
Accounting, bookkeeping and auditing activities; tax consultancy
504,100
€ 750,705,720
Market research and public opinion polling
34,342 € 51,142,106
Temporary employment agency activities
31,253 € 46,541,968
Other human resources provision
4,028 € 5,998,498
Private security activities
17,969 26,759,435
Security systems service activities
8,237 € 12,266,540
Activities of call centres
7,361
€ 10,962,001
Total impact to Real estate, renting and business activities € 904,376,268
Wholesale and retail trade; repair of motor vehicles and motorcycles
Industrial Sector # of firms (micro, small and medium)[a] Total Cost Impact
(1,489 x [a])
Maintenance and repair of motor vehicles
419,998
€ 625,461,022
Sale of motor vehicles 196,497 € 292,623,332
€ 918,084,354
Total Impact across all 5 industries € 2,060,355,854

Table 11. Average Cost per SME
Industrial Sector Total # of SMEs [a] Total Cost of Articles [b] Average benefit per
SME [b]/[a]
Transport, storage and
communications
1,690,890 € 109,862,752 € 65
Hotels and Restaurants 1,749,151 € 128,032,481 € 73
Real estate, renting and
business activities
5,385,648 € 904,376,268 € 168
Wholesale and retail
trade; repair of motor
vehicles and
motorcycles
5,903,649 € 918,084,354 € 156
Article 43
Table 12. Cost Impact of Article 43
Transport, storage and communications
Industrial Sector # of firms (micro, small and medium)[a] Total Benefit
Impact
(45,000 x 0.24 x
[a]) (in euros)
Passenger rail
transport, interurban
256
€ 2,764,800
Passenger air
transport
3,166 € 34,192,800
Wired
telecommunications
activities
11,071 € 119,566,800
Wireless
telecommunications
activities
5,772 € 62,337,600
Satellite
telecommunications
activities
70 € 756,000
Other
telecommunications
activities
21,664 € 233,971,200
Data processing,
hosting and related
activities; web portals
31,774
€ 343,159,200
Total impact to Transport, storage and communications € 796,748,400

Hotels and Restaurants
Industrial Sector # of firms (micro, small and medium)[a] Total Benefit
Impact
(45,000 x 0.24 x
[a]) (in euros)
Holiday and other
short-stay
accommodation
85,974 € 928,519,200
Total impact to Hotels and Restaurants € 928,519,200
Real estate, renting and business activities
Industrial Sector # of firms (micro, small and medium)[a] Total Benefit
Impact
(45,000 x 0.24 x
[a]) (in euros)
Accounting,
bookkeeping and
auditing activities; tax
consultancy
504,100
€ 5,444,280,000
Market research and
public opinion polling
34,342
€ 370,893,600
Temporary
employment agency
activities
31,253 € 337,532,400
Other human
resources provision
4,028 € 43,502,400
Private security
activities
17,969 € 194,065,200
Security systems
service activities
8,237 € 88,959,600
Activities of call
centres
7,361
€ 79,498,800
Total impact to Real estate, renting and business activities € 6,588,732,000

Wholesale and retail trade; repair of motor vehicles and motorcycles
Industrial Sector # of firms (micro, small and medium)[a] Total Benefit
Impact
(45,000 x 0.24 x
[a]) (in euros)
Maintenance and
repair of motor
vehicles
419,998
€ 4,535,978,400
Sale of motor vehicles 196,497 € 2,122,167,600
Total Impact to Wholesale and retail trade; repair of motor vehicles and
motorcycles
€ 6,658,146,000
Total Impact across all 5 industries € 14,942,145,600
Table 13. Average Cost per SME
Industrial Sector Total # of SMEs [a] Total Benefit of Articles
[b]
Average benefit per
SME [b]/[a]
Transport, storage and
communications
1,690,890 € 796,748,400 € 471
Hotels and Restaurants 1,749,151 € 928,519,200 € 531
Real estate, renting and
business activities
5,385,648 € 6,588,732,000 € 1,128
Wholesale and retail
trade; repair of motor
vehicles and
motorcycles
5,903,649 € 6,658,146,000 € 1,128

Articles 55, 56, 57, 76
Table 14. Cost Impact of Articles 55, 56, 57, 76
Transport, storage and communications
Industrial Sector # of firms (micro, small and medium)[a] Total Benefit
Impact
(40,000 x 0.024 x
[a]) (in euros)
Passenger rail
transport, interurban
256
€ 245,760
Passenger air
transport
3,166 € 3,039,360
Wired
telecommunications
activities
11,071 € 10,628,160
Wireless
telecommunications
activities
5,772 € 5,541,120
Satellite
telecommunications
activities
70 € 67,200
Other
telecommunications
activities
21,664 € 20,797,440
Data processing,
hosting and related
activities; web portals
31,774
€ 30,503,040
Total impact to Transport, storage and communications € 70,822,080
Hotels and Restaurants
Industrial Sector # of firms (micro, small and medium)[a] Total Benefit
Impact
(40,000 x 0.024 x
[a]) (in euros)
Holiday and other
short-stay
accommodation
85,974 € 82,535,040
Total impact to Hotels and Restaurants € 82,535,040

Real estate, renting and business activities
Industrial Sector # of firms (micro, small and medium)[a] Total Benefit
Impact
(40,000 x 0.024 x
[a]) (in euros)
Accounting,
bookkeeping and
auditing activities; tax
consultancy
504,100
€ 483,936,000
Market research and
public opinion polling
34,342
€ 32,968,320
Temporary
employment agency
activities
31,253 € 30,002,880
Other human
resources provision
4,028 € 3,866,880
Private security
activities
17,969 € 17,250,240
Security systems
service activities
8,237 € 7,907,520
Activities of call
centres
7,361
€ 7,066,560
Total impact to Real estate, renting and business activities € 582,998,400
Wholesale and retail trade; repair of motor vehicles and motorcycles
Industrial Sector # of firms (micro, small and medium)[a] Total Benefit
Impact
(40,000 x 0.024 x
[a]) (in euros)
Maintenance and
repair of motor
vehicles
419,998
€ 403,198,080
Sale of motor vehicles 196,497 € 188,637,120
Total Impact to Wholesale and retail trade; repair of motor vehicles and
motorcycles
€ 591,835,200
Total Impact across all 5 industries 1,328,190,720

Table 15. Average Cost per SME
Industrial Sector Total # of SMEs [a] Total Cost of Articles [b] Average benefit per
SME [b]/[a]
Transport, storage and
communications
1,690,890 € 70,822,080 € 42
Hotels and Restaurants 1,749,151 € 82,535,040 € 47
Real estate, renting and
business activities
5,385,648 € 582,998,400 € 108
Wholesale and retail
trade; repair of motor
vehicles and
motorcycles
5,903,649 € 591,835,200 € 100
Articles 24, 25
Table 16. Cost Impact of Articles 24, 25
Transport, storage and communications
Industrial Sector # of firms (micro, small and medium)[a] Total Cost Impact
(5,000 x 29% x [a])
Passenger rail
transport, interurban
256
€ 371,200
Passenger air
transport
3,166
€ 4,590,700
Wired
telecommunications
activities
11,071 € 16,052,950
Wireless
telecommunications
activities
5,772 € 8,369,400
Satellite
telecommunications
activities
70 € 101,500
Other
telecommunications
activities
21,664 € 31,412,800
Data processing,
hosting and related
activities; web portals
31,774 € 46,072,300
Total impact to Transport, storage and communications € 106,970,850

Hotels and Restaurants
Industrial Sector # of firms (micro, small and medium)[a] Total Cost Impact
(5,000 x 29% x [a])
Holiday and other
short-stay
accommodation
85,974 € 124,662,300
Total impact to Hotels and Restaurants € 3,584,425,108
Real estate, renting and business activities
Industrial Sector # of firms (micro, small and medium)[a] Total Cost Impact
(5,000 x 29% x [a])
Accounting,
bookkeeping and
auditing activities; tax
consultancy
504,100
€ 730,945,000
Market research and
public opinion polling
34,342 € 49,795,900
Temporary
employment agency
activities
31,253 € 45,316,850
Other human
resources provision
4,028 € 5,840,600
Private security
activities
17,969 € 26,055,050
Security systems
service activities
8,237 € 11,943,650
Activities of call
centres
7,361
€ 10,673,450
Total impact to Real estate, renting and business activities € 880,570,500

Wholesale and retail trade; repair of motor vehicles and motorcycles
Industrial Sector # of firms (micro, small and medium)[a] Total Cost Impact
(5,000 x 29% x [a])
Maintenance and
repair of motor
vehicles
419,998
€ 608,997,100
Sale of motor vehicles 196,497 € 284,920,650
Total impact to Wholesale and retail trade; repair of motor vehicles and
motorcycles
€ 893,917,750
Total Impact across all 5 industries € 2,006,121,400
Table 17. Average Cost per SME
Industrial Sector Total # of SMEs [a] Total Cost of Articles [b] Average benefit per
SME [b]/[a]
Transport, storage and
communications
1,690,890 € 106,970,850 € 63
Hotels and Restaurants 1,749,151 € 3,584,425,108 € 71
Real estate, renting and
business activities
5,385,648 € 880,570,500 € 164
Wholesale and retail
trade; repair of motor
vehicles and
motorcycles
5,903,649 € 893,917,750 € 151

Article 77
Table 18. Cost Impact of Article 77
Transport, storage and communications
Industrial Sector # of firms (micro, small and medium)[a] Total Benefit
Impact
(10,000 x 0.29 x
[a]) (in euros)
Passenger rail
transport, interurban
256
€ 742,400
Passenger air
transport
3,166
€ 9,181,400
Wired
telecommunications
activities
11,071 € 32,105,900
Wireless
telecommunications
activities
5,772 € 16,738,800
Satellite
telecommunications
activities
70 € 203,000
Other
telecommunications
activities
21,664 € 62,825,600
Data processing,
hosting and related
activities; web portals
31,774
€ 92,144,600
Total impact to Transport, storage and communications € 213,941,700
Hotels and Restaurants
Industrial Sector # of firms (micro, small and medium)[a] Total Benefit
Impact
(10,000 x 0.29 x
[a]) (in euros)
Holiday and other
short-stay
accommodation
85,974 € 249,324,600
Total impact to Hotels and Restaurants € 249,324,600

Real estate, renting and business activities
Industrial Sector # of firms (micro, small and medium)[a] Total Benefit
Impact
(10,000 x 0.29 x
[a]) (in euros)
Accounting,
bookkeeping and
auditing activities; tax
consultancy
504,100
€ 1,461,890,000
Market research and
public opinion polling
34,342
€ 99,591,800
Temporary
employment agency
activities
31,253 € 90,633,700
Other human
resources provision
4,028 € 11,681,200
N801 - Private
security activities
17,969 € 52,110,100
Security systems
service activities
8,237 € 23,887,300
Activities of call
centres
7,361
€ 21,346,900
Total impact to Real estate, renting and business activities € 1,761,141,000
Wholesale and retail trade; repair of motor vehicles and motorcycles
Industrial Sector # of firms (micro, small and medium)[a] Total Benefit
Impact
(10,000 x 0.29 x
[a]) (in euros)
Maintenance and
repair of motor
vehicles
419,998
€ 1,217,994,200
Sale of motor vehicles 196,497 € 569,841,300
Total Impact to Wholesale and retail trade; repair of motor vehicles and
motorcycles
€ 1,787,835,500
Total Impact across all 5 industries € 4,012,242,800

Table 19. Average Cost per SME
Industrial Sector Total # of SMEs [a] Total Cost of Articles [b] Average benefit per
SME [b]/[a]
Transport, storage and
communications
1,690,890 € 213,941,700 € 127
Hotels and Restaurants 1,749,151 € 249,324,600 € 143
Real estate, renting and
business activities
5,385,648 € 1,761,141,000 € 327
Wholesale and retail
trade; repair of motor
vehicles and
motorcycles
5,903,649 € 1,787,835,500 € 303