the impact of vehicle silhouettes on perceptions of car
TRANSCRIPT
Received 9 February 2017Revised 22 August 2017Accepted 18 September 2017
Corresponding authorT. [email protected]
Published by CambridgeUniversity Pressc© The Author(s) 2017
Distributed as Open Access undera CC-BY 4.0 license(http://creativecommons.org/licenses/by/4.0/)
Des. Sci., vol. 3, e23journals.cambridge.org/dsjDOI: 10.1017/dsj.2017.22
The impact of vehicle silhouettes onperceptions of car environmentalfriendliness and safety in 2009 and2016: a comparative studyYouyi Bi1, Sixuan Li1, David Wagner2 and Tahira Reid1
1 School of Mechanical Engineering, Purdue University, West Lafayette, IN 47907, USA2 Ford Motor Company, Dearborn, MI 48124, USA
AbstractAutomakers are interested in creating optimal car shapes that can visually conveyenvironmental friendliness and safety to customers. This research examined the influenceof vehicle form on perceptions based on two subjective inference measures: safety andperceived environmental friendliness (PEF). A within-subjects study was conducted in2009 (Study 1) to study how people would evaluate 20 different vehicle silhouettes createdby designers in industry. Participants were asked to evaluate forms on several scales,including PEF, safety, inspired by nature, familiarity, and overall preference. The samestudy was repeated in 2016 (Study 2). The results from the first study showed an inverserelationship between PEF and perceptions of safety. That is, vehicles that appeared to besafe were perceived to be less environmentally friendly, and vice versa. Participants inthe second study showed a similar trend, but not as strongly as the 2009 participants.Several shape variables were identified to be correlated with participants’ PEF and safetyratings. The changes in the trend of participants’ evaluations over seven years were alsodiscussed. These results can provide designers with insights into how to create car shapeswith balanced PEF and safety in the early design stage.
Key words: product design, sustainable design, environmental friendliness, productstyling, automotive design
1. IntroductionIt has been well established that consumers’ perceptions of product forms caninfluence their purchasing decisions (Bloch 1995). Rather than focusing solely onobjective information, people use heuristics based on the product form to makeinferences about objective product attributes (Tversky & Kahneman 1974). Forexample, individuals made inferences about the flavor and quality of wine basedon the shape of thewine bottle (MacDonald et al. 2008) andmade environmentallyconscious evaluations of cars based on car shapes (Reid, Gonzalez & Papalambros2010; Reid, MacDonald & Du 2013). However, these researchers have not studiedhow these evaluations change or remain the same over time.
Researchers in design have conducted a significant number of shape-perception studies, especially in an automotive context. Many of these studieshave focused on preference evaluations (Orsborn, Cagan & Boatwright 2009;Kelly et al. 2011; Reid et al. 2013; Orsborn, Cagan & Boatwright 2015) and
1/33
available at https://www.cambridge.org/core/terms. https://doi.org/10.1017/dsj.2017.22Downloaded from https://www.cambridge.org/core. Northwestern University Libraries, on 08 Jan 2018 at 21:34:11, subject to the Cambridge Core terms of use,

semantic evaluations (Lai, Chang & Chang 2005; Reid et al. 2013; Orbay, Fu& Kara 2015), especially as they relate to sustainability considerations (Reid et al.2010; Reid, Frischknecht & Papalambros 2012; Tseng et al. 2013; Sylcott, Orsborn& Cagan 2014; Goucher-Lambert & Cagan 2015).When developing new vehicles,an automotive designer needs to balance trade-offs between competing customerconsiderations (Burnap et al. 2016). This is especially true for sustainable-designconsiderations because customers often perceive environmentally consciousproducts as having lower quality (Goucher-Lambert & Cagan 2015). In anobjective sense, sustainable design can lead to the improvement of one attributeat the expense of one or more others (Chen 2001), such as safety (which may becompromised due to excessive light-weighting of vehicles (Crandall & Graham1989)) and performance (e.g., the rate of acceleration (Boyd & Mellman 1980)and the overall vehicle ride may decline (Crandall & Graham 1989)). Prior workby Tseng et al. showed that, on the basis of shape characteristics of cars, customersare able to make accurate inferences about objective measures regarding thosecars (Tseng et al. 2013). However, the way in which customers’ sustainabilityperceptions relate to their safety perceptions has not been studied systematicallyand in the context of automotive design.
To address these research gaps – that is, how customers’ form-basedevaluations change with time, and how people make trade-offs when evaluatingcar environmental friendliness and safety – awithin-subjects studywas conductedfirst in 2009 (Study 1) and then repeated in 2016 (Study 2). The study consisted ofhaving participants evaluate a set of vehicles developed by designers in industry.Their evaluations included ratings on safety, perceived environmental friendliness(PEF), and other factors. We obtained interesting results on how people maketrade-offs between cars that look safe and those that look green andhowcustomerschange their form evaluations over time. These resultsmay provide designers withinsights into how to create shapes with balanced PEF and safety in the early designstage.
In the remaining sections, we proceed as follows.We present a literature reviewon product forms and customers’ evaluations in Section 2. Themethods, includingthe creation of vehicle silhouettes and the design of experiment, are presented inSection 3. The experimental results, discussion, and conclusions are presented inSections 4, 5, and 6, respectively.
2. Background2.1. Product form and customers’ evaluationCustomer evaluation of products is a complex decision-making process (Hoyer1984). Nearly 80% of all information crucial for people’s decisions is gathered bythe eye (Schmitt et al. 2013), so visual impressions are often more decisive duringdesign evaluation than other impressions (e.g., haptic, acoustic) (Duchowski2007). Bloch (1995) pointed out that product form is an important part of productevaluations. By presenting product forms to customers, researchers are able to getcustomers’ subjective evaluation of different aspects of products (Holbrook 1999;Boztepe 2007; Kumar & Garg 2014), including product preferences, purchasingdecisions based on Discrete Choice Analysis (Chen &Wassenaar 2003), emotionsusing Kansei Engineering (Nagamachi 1995; Orth & Malkewitz 2008; Kumar& Garg 2014), and/or inference-based evaluations of products such as PEF on
2/33
available at https://www.cambridge.org/core/terms. https://doi.org/10.1017/dsj.2017.22Downloaded from https://www.cambridge.org/core. Northwestern University Libraries, on 08 Jan 2018 at 21:34:11, subject to the Cambridge Core terms of use,

vehicle silhouettes (Reid et al. 2010). Designers can then design better productsby incorporating customers’ preferences on product forms (Sylcott et al. 2014),including aesthetic considerations (Lugo et al. 2015; Valencia-Romero & Lugo2016). Orbay et al. (2015) investigated the relationship between product formand consumer responses through a visual deconstruction and abstraction ofexisting final products. The study produced a spectrum of abstractions for a given3D computer model (e.g., a nine-level simple-to-complex abstraction of a FordMustang model). The results showed that emotional responses evoked by coarseproduct impressions are strongly correlated with those evoked by final productionmodels. Similar results can be found in the papers by Artacho-Ramirez, Diego-Mas & AlcaideMarzal (2008) and Bates-Brkljac (2009). Orsborn et al. (2015)proposed the continuous visual conjoint, which provides design researcherswith a technique for quickly gathering user responses to visual informationabout product concepts, including shape, color, or experience. This preferenceinformation can then be modeled with a utility function and used to generatedesign concepts preferred by the targeted users. These studies suggest thatresearchers can get valuable information about customers’ evaluation of productshapes even if using simple or low-fidelity representations. Inference-basedquestions are proven to be robust regardless of product representation mode, butopinions can vary with representation mode (Reid et al. 2013). Other researchershave observed a similar trend in opinion-based questions in a study on flatware(Sylcott et al. 2014). These findings provide insight into what one can expect whenusing a single representation mode during product evaluations.
2.2. Customers’ preferences and inference-based evaluationson products
According to Reid et al. (2013), customer evaluations on products can be classifiedinto three groups: opinions, objective evaluations, and inferences. Opinions areproduct evaluations that are not right orwrong and that can vary betweendifferentindividuals (e.g., How creative is this design?). Preference evaluations are a subsetof opinions (e.g., Which design do you prefer?). An objective evaluation is eitherright or wrong and is made by a customer who has access to the informationneeded for making it (e.g., Which product is longer? Which of the designs issymmetrical?). An inference is also either right or wrong, but is made by acustomerwho either is not providedwith the necessary information or is providedwith incomplete information (e.g., Which design is the safest? How sustainable isthis design?).
Previous studies have shown how customers systematically make inference-based evaluations. For example, MacDonald, Gonzalez & Papalambros (2009a)quantitatively examined the relationship between important, complex productattributes (crux attributes) and perceptually related but less important attributes(sentinel attributes). A ‘crux’ attribute is the critical element or function forwhich a product is purchased (e.g., absorbent paper towels). A ‘sentinel’ attributeis one that consumers use to help them to evaluate the product for that cruxattribute (e.g., quilting on paper towels). Their results showed that the quantitativevalue of sentinel attributes is critically high in a marketplace where customers donot have access to information about crux attributes. Car shape can potentiallyserve as a sentinel attribute for the crux attribute of environmental friendliness
3/33
available at https://www.cambridge.org/core/terms. https://doi.org/10.1017/dsj.2017.22Downloaded from https://www.cambridge.org/core. Northwestern University Libraries, on 08 Jan 2018 at 21:34:11, subject to the Cambridge Core terms of use,

(Reid et al. 2010), and others. After mapping the product-shape features withcustomers’ preferences and evaluations on products, designers are able to improvethe product to better satisfy customers’ needs and expectations, in both form andfunction.
The remaining sectionswill review two inference-based evaluations importantto this work: the PEF and the perceived safety of products.
2.2.1. Perceptions of the environmental friendliness of productsEnvironmental concerns have attained substantial momentum and are continuingto alter consumers’ basic habits (Stisser 1994; D’Souza 2004). Vehicle producersare also willing to attract customers with their new environmentally friendlyproducts (Coad, DeHaan &Woersdorfer 2009). Previous studies have shown thatgreen consumers are willing to change their consumption behavior to preservethe environment (Kassarjian 1971; Brooker 1976; Du Preez, Diamantopoulos& Schlegelmilch 1994). However, as Goucher-Lambert & Cagan (2015) pointedout, sustainable products often struggle to find success in the marketplace.Research has shown that although customers approve of sustainable products andtechnologies, they are often unwilling to purchase them (MacDonald, Gonzalez& Papalambros 2009b; Hahnel, Gölz & Spada 2014). On one hand, customers donot completely trust the environmental claimsmade by producers/companies. Forexample, most respondents to a survey administered by Chase & Smith (1992)reported that environmental claims were not particularly believable. In anothersurvey, only 15% of respondents said that environmental claims were extremely orvery believable (Dagnoli 1991). Product messaging may not be effective because‘people are busy, and may not be paying attention’ (Brannan, Heeter & Bird2012). With the public’s growing concerns about ‘greenwashing’ (i.e., superficialenvironmentally friendly actions with a greater purpose of profit), customers maynot believe that those products with environmental labels and claims are really‘green’ (Laufer 2003; She & MacDonald 2014).
On the other hand, customers remain unwilling to sacrifice product attributessuch as form, function, or price in order to adopt a product whose environmentalimpact is less than that of a competing product (Goucher-Lambert & Cagan2015). One example of an environmentally friendly product being unsuccessfulin the consumer marketplace was the initial offering of the Honda Insight hybridvehicle in 1999 (Cagan & Vogel 2013). While this product met the environmentalneeds of target consumers, many perceived the form of the vehicle to be strange(Goucher-Lambert & Cagan 2015). To remedy the problem, Honda adjusted thevehicle’s form until its shape became appealing to consumers again.
Therefore, to convey the concept of ‘environmentally friendly’, a productshould use its form, labels, andmessages to convince customers. She&MacDonald(2014) presented a design technique that uses priming specifically to helpdesigners to communicate sustainability via design at an early stage in the designprocess. Their research suggested a method to improve the communication of aproduct’s sustainability by imbuing this communication in the product’s design,instead of relying on superficial or traditional marketingmessages. Similar studieson PEF judgments and product forms can be found in Reid et al. (2010, 2012) andTseng et al. (2013).
4/33
available at https://www.cambridge.org/core/terms. https://doi.org/10.1017/dsj.2017.22Downloaded from https://www.cambridge.org/core. Northwestern University Libraries, on 08 Jan 2018 at 21:34:11, subject to the Cambridge Core terms of use,
2.2.2. Perceptions of the safety of productsVery few studies address the role of product form in safety perceptions. However,studies on safety perception can be found in various domains, such as onlineshopping (Noort, Kerkhof & Fennis 2008), food safety (Roosen, Hansen &Thiele 2004; Parra et al. 2014), traffic safety (Anstey et al. 2012; El-Basyouny &El-Bassiouni (2013); Jian-you et al. 2013), and hospital environments (Haugenet al. 2010; Saleh, Darawad & Al-Hussami 2015). In the automotive field, theevaluation of safety performance of cars is one kind of objective evaluation thatoften plays an important role in customers’ purchase decisions (Kaul et al. 2010;Vrkljan & Anaby 2011; Isa et al. 2012), motivating some customers to pay foradditional safety features such as anti-lock brakes (ABS) and electronic stabilitycontrol (ESC) (Kaul et al. 2010; Isa et al. 2012). However, although a customermay start a decision task using these objective considerations, they will resortto subjective criteria when presented with many similar alternatives (Reid et al.2012).
Researchers have also focused on the interrelation between customers’perception of car safety and car shapes, although inconsistent results have beenfound. For example, Thomas &Walton (2007) found that when purchasing a car,customers with high safety perception showed no preference for large SUVs (sportutility vehicles) over smaller cars; thus, the study concluded that the consumers’consideration for safety was unrelated to the size of the vehicle. Nevertheless,Shende (2014) examined the Indian car industry and found that customersperceive SUVs and MUVs (multi-utility vehicles) to be safer due to their look,structure, and exterior styling. Affordance perception may be an alternative wayto measure customers’ safety evaluations (Ayres et al. 2000).
2.2.3. Summary of inference-based evaluationsPrevious studies have shown that visual cues can be used to make inferencesabout product attributes. However, most of these studies only examined oneinference-based evaluation.What is unknown is how the same set of visual cues ina given product may influence more than one inference-based evaluation of thatproduct, such as safety and environmental friendliness perceptions. In the contextof automotive studies, the degree to which perceptions of vehicle safety influencehow people evaluate environmentally conscious vehicles is not well documented.Anecdotal evidence suggests that cars that look environmentally friendly (e.g.,early models of the Toyota Prius) often appear unsafe to people. Therefore, thereis a need to investigate the visual cues that influence customers’ safety perceptionand how it interacts with their perception of the environmental friendliness ofcars.
2.3. Research on customers’ changing trend of productevaluations
In the design-research community, no studies have examined how customerschange their product evaluations over time. Researchers from consumer studiesand marketing have made exploratory investigations on this topic. Woodruff(1997) defined customer value as ‘a customer perceived preference for andevaluation of those product attributes, attribute performances, and consequencesarising from use that facilitate (or block) achieving the customer’s goals andpurposes in use situations’. This definition suggests that there are two aspects
5/33
available at https://www.cambridge.org/core/terms. https://doi.org/10.1017/dsj.2017.22Downloaded from https://www.cambridge.org/core. Northwestern University Libraries, on 08 Jan 2018 at 21:34:11, subject to the Cambridge Core terms of use,
of customer value: desired value and perceived value. The former refers to whatcustomers desire in a product or service, while the latter is the benefit that acustomer believes he or she will receive from a product after it has been purchased(Shanker 2012). Flint & Woodruff (2001) introduced a theoretical model toexplain the changes in customers’ desired value in the U.S. automobile industryand the initiators behind the changes. The study stated that the top driving forcefor customers to alter the products and services is changes in their demands. Theyalso suggested that suppliers should focus on the psychological effect of changeevents on individual customers and their response to those effects to predictchanges in their desired value (Flint & Woodruff 2001).
In the green-product industry, researchers found, in a longitudinal study ofthe strategies used by green companies, that the reputation of a company/brandand their advertising are the top two factors that strongly influence consumers’behavior (Smith & Brower 2012). On the other hand, customers’ knowledge,commitment, and general awareness of green products shape their opinionsand decisions when they are consuming them (Maniatis 2016). Yusof et al.(2013) studied the relationship between internal and external factors thatinfluence customers’ behavior in the green-automobile industry. They foundthat customers’ knowledge of the environment strongly affects their perceptionof environmentally friendly vehicles, which in turn influences their purchaseintention. A 2007 study on early adopters of hybrid vehicles showed that peoplepurchased them for reasons that aligned with the issues of that time (Heffner,Kurani & Turrentine 2007). In the early 2000s, there was an increased publicawareness of and discussion on climate change issues and the contributionsof greenhouse gas emissions to the problem, especially those that came fromautomobiles. High gas prices were the norm of the time, and automakers wereshowing social responsibility by producing light-duty vehicles and hybrid vehicles.Thus, the reasons why these early adopters purchased hybrid electric vehiclesincluded reducing support to oil producers, preserving the environment, andopposing the war (Heffner et al. 2007).
In summary, previous researchers have investigated some factors thatinfluence how customers change their evaluation of products and services, butnone of them have examined how customers would respond to and evaluateproduct forms over time.
2.4. Summary, research questions, and hypothesis formulationPrevious studies have shown that customers are able to use both directinformation (e.g., environmental claims, safety specifications) and indirectinformation such as product form to provide opinions on and make inferencesabout product characteristics. However, few studies have examined the effect ofthe same set of product attributes on more than one inference-based attribute,namely customers’ perception of environmental friendliness and safety in thecontext of cars. In addition, no studies have been conducted in the designcommunity to examine how product evaluations change over time. To coverthese gaps, we conducted two studies to investigate (1) how people perceivedand evaluated a set of car shapes, particularly the environmental friendliness andsafety of cars, and (2) how these same sets of cars were evaluated seven years later.The following research questions and hypotheses guide the development of ourstudies.
6/33
available at https://www.cambridge.org/core/terms. https://doi.org/10.1017/dsj.2017.22Downloaded from https://www.cambridge.org/core. Northwestern University Libraries, on 08 Jan 2018 at 21:34:11, subject to the Cambridge Core terms of use,
Q1: What is the relationship between customers’ PEF and safety ratings of carshapes? How do these ratings correlate with car-shape characteristics?
Results from Reid et al. (2010) showed that vehicles that looked more like SUVs(i.e., more boxy) were rated lowest on PEF and that vehicles with smoother shapes(i.e., less boxy) were rated highest on PEF. Shende (2014) found that Indiancustomers perceived SUVs andMUVs to be safer due to their look, structure, andexterior styling. Thus, we expect that cars with boxy shapes will receive highersafety ratings and lower PEF ratings. This leads to the following two hypotheses.
H1: Cars that are less boxy will receive higher PEF ratings than other cars.H2: Cars that are more boxy will receive higher safety ratings than other cars.
In automotive design, various features and structures are applied to ensure thesafety of a vehicle, such as safety glass, air bags, safety belts, ABS, and front/rearcrumple zones (Hoffenson, Frischknecht&Papalambros 2013). The crumple zoneis a structural feature used in automobiles to absorb the energy of impact and slowthe deceleration of the car. Thus, we expect that customers will rate the safety ofcar shapes with larger crumple zones (also called crush space) higher than thesafety of shapes with smaller crumple zones. This expectation informs our thirdhypothesis.
H3: Cars that appear larger in the front and rear crumple zones will receivehigher safety ratings than other cars.
To address the gap associated with how evaluations change over time, we seek toanswer the following question.
Q2: How do customers’ PEF and safety evaluations of car shapes change overtime?
Although fuel-efficient vehicles had already been in production, the year2006 showed a marked increase in the public interest in plug-in hybrid electricvehicles (PHEVs). The 2006 Toyota Prius and Honda Insight were among themost popular and had body styles that were distinct from their non-hybridcounterparts. However, automakers have been successfully increasing the fuelefficiency of their vehicles (von Kaenel 2017) regardless of the body shape/styleor class (e.g., Ford Flex). Environmentally friendly cars are no longer limited tounique shapes, and it is expected that, between 2009 and 2016, customers willhave had increased exposure to a variety of body shapes that are fuel efficient andthus associated with being environmentally conscious. Therefore, we expect that,over time, people’s PEF ratings of the car shapes presented will increase, leadingto our fourth hypothesis.
H4: Customers’ ratings of PEF on car shapes will generally increase with time.
As previously discussed, we expect consumers to rate safety based on the degreeto which they can assess the sizes of crumple zones, as stated in H3. We believethat this standard will not change between 2009 and 2016 participants. Thus, ourfifth hypothesis is as follows.
H5: Customers’ ratings of safety on car shapes will remain the same over time.
Tseng et al. (2013) indicated that the participants in their study used social normsor other conventions they were familiar with to make judgments. Thus, we expect
7/33
available at https://www.cambridge.org/core/terms. https://doi.org/10.1017/dsj.2017.22Downloaded from https://www.cambridge.org/core. Northwestern University Libraries, on 08 Jan 2018 at 21:34:11, subject to the Cambridge Core terms of use,
that participants’ familiarity with the car shapes will be positively correlated withtheir ratings for PEF and safety.
H6a: Customers’ ratings of PEF will be positively correlated with theirfamiliarity ratings of the car shapes.
H6b: Customers’ ratings of safety will be positively correlated with theirfamiliarity ratings of the car shapes.
The answers to these questions and the outcomes of these hypotheses canprovide designers with insights into how to create optimized shapes conveyingenvironmental friendliness and safety to customers.
3. MethodsThe overall approach used in the study was similar to that used in prior work thatexamined perception of vehicle silhouettes (Reid et al. 2010) and will be describedbriefly in the sections that follow. The same dependent variables were used (i.e.,familiarity, inspired by nature, PEF, preference), with the addition of safety asanother dependent measure. The tested stimuli, the experiment details, and thedemographic information on the participantswill also be described in this section.
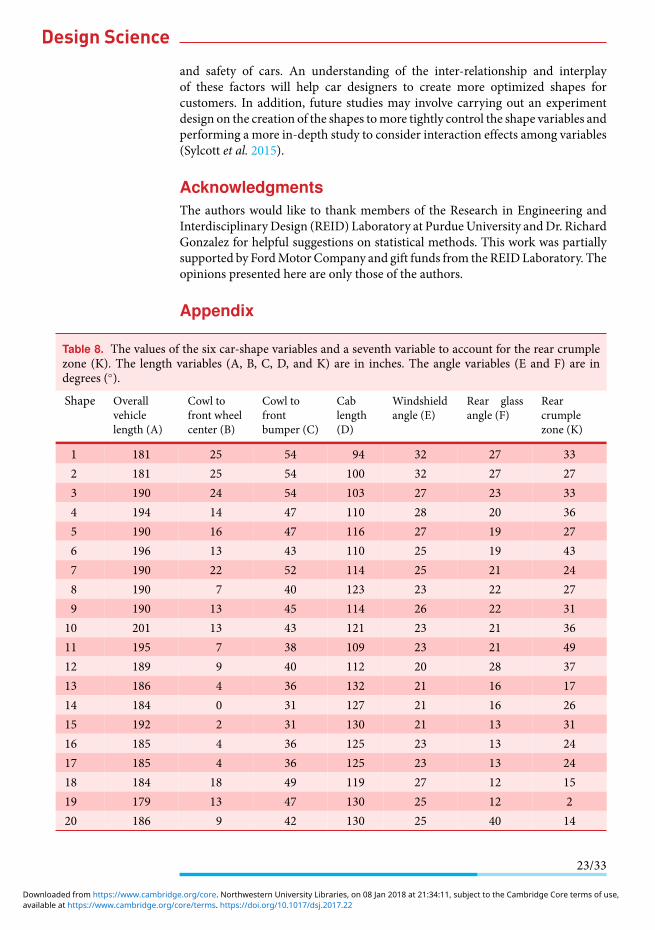
3.1. Stimulus creationThe stimuli used were 2D silhouettes of cars created by industrial designers inthe automotive industry using Adobe Illustrator. It is important to note thatthese sketches differ from the typical artistic profile sketches that are used in theactual design process (see Tovey (1992) for examples). The designers intentionallyprovided silhouettes for this study to mimic the approach used by Reid et al.(2010). Furthermore, the use of product silhouettes is common in studies of thiskind, and has been used extensively in the design community to assess customerpreferences, especially in automotive contexts (Lai et al. 2005; Kelly, Papalambros& Seifert 2008; Orsborn et al. 2009; Kelly et al. 2011; Sylcott et al. 2014). Theuse of silhouettes helps to minimize the number of variables that may have aneffect on the evaluations and makes the analysis procedure tractable. A total of20 different forms (see Figure 1) were created by manipulating six form variablesbased on pixel positions. These six variables were selected and manipulated bythe designers to generate shapes they were interested in studying. Figure 2 showsa schematic diagram of the main form variables that were manipulated to varythe shapes: overall vehicle length (A), cowl to front wheel center (B), cowl tofront bumper (C), cab length (D), windshield angle (E), and rear glass angle (F).One additional variable, called rear crumple zone (K), was included to test H3.Table 8 in the appendix provides the values of these variables for each shape inunits of inches or degrees as appropriate. Table 9 presents the Pearson correlationsbetween each of these shape variables and each other one. Other shape variableswere held constant, such as the wheel diameter, beltline height, and rocker height(see Figure 2).
3.2. Methods and proceduresTwo studies were conducted in order to address the research questions describedin Section 2.4. Study 1was conducted in 2009 to address the first research question.
8/33
available at https://www.cambridge.org/core/terms. https://doi.org/10.1017/dsj.2017.22Downloaded from https://www.cambridge.org/core. Northwestern University Libraries, on 08 Jan 2018 at 21:34:11, subject to the Cambridge Core terms of use,

Figure 1. The 20 vehicle silhouettes used in the experiment.
Figure 2. A schematic diagram of the main form variables that were manipulated in order to vary the forms(variables A to F). Variables G to J were kept constant. Variable K was added to test H3.
9/33
available at https://www.cambridge.org/core/terms. https://doi.org/10.1017/dsj.2017.22Downloaded from https://www.cambridge.org/core. Northwestern University Libraries, on 08 Jan 2018 at 21:34:11, subject to the Cambridge Core terms of use,

Figure 3. The general structure of the survey (Version A).
After some time had passed, we sought to address the second research question byrerunning Study 1 in 2016 to see whether the evaluations would change or remainthe same (Study 2). The sections below will describe details about the two studies.
3.2.1. Study 1 experimental detailsFor Study 1, the experiment was implemented using a survey with two versions tostudy the impact of form on perceptions of safety, and how they correlate to PEFevaluations. Both versions of the survey consisted of five parts and presentedthe same questions. The survey was administered using Sawtooth software(www.sawtoothsoftware.com), which has been used successfully in prior studies(Reid et al. 2010). Figure 3 illustrates the general structure of the survey(Version A).
Themain difference between the two versionswas the order inwhich the safetyand PEF questions were presented: Version A presented the safety questions inpart I and PEF questions in part II, followed by all of the remaining questions (seeFigure 3); Version B presented the PEF questions in part I and the safety questionsin part II, and then all of the remaining questions.
Part III measured preference (PREF), part IV measured degree of familiarity(FAMT), and part Vmeasured the degree to which shapes were inspired by nature(IBN), using both a rating and a sorting task. The questions were worded asfollows.
(i) Safety: How safe does this vehicle look to you?(ii) PEF: Based on the visual content, please rate how well this vehicle conveys
environmental friendliness.
10/33
available at https://www.cambridge.org/core/terms. https://doi.org/10.1017/dsj.2017.22Downloaded from https://www.cambridge.org/core. Northwestern University Libraries, on 08 Jan 2018 at 21:34:11, subject to the Cambridge Core terms of use,
(iii) FAMT: Please rate how much this vehicle shape looks like one you may haveseen before (ex. in a parking lot, on television/in magazines, etc.).
(iv) PREF: Please select the two vehicles you like the best.
All of the rating questions were on a seven-point Likert scale. For safety, thevalues ranged from 1= ‘Does not look safe at all’ to 7= ‘Definitely looks safe’. Inlike manner, for PEF, the Likert scale values ranged from 1 to 7, where 1 = ‘Doesnot look environmentally friendly at all’ and 7= ‘Definitely looks environmentallyfriendly’. The covariate FAMT was also on a seven-point Likert scale (1 = ‘Notsimilar to vehicles I’ve seen before’ and 7 = ‘Very similar to vehicles I’ve seenbefore’). The covariate PREF was based on selecting the top two favorites froma set of five candidates. Figures 9 and 10 in the appendix provide screen capturesof the PEF and safety questions, respectively. Figure 11 shows the FAMT question.The definitions of safety, environmental friendliness, and inspired by nature weregiven to participants in the respective sections of the survey that pertained to thoseterms, at the beginning of the section and with each question.
Participants were also provided with a list of assumptions similar to those usedin Reid et al. (2010), with the goal of helping the participants to focus on the formof the vehicle as described. The assumptions listed were that the vehicles
(i) have excellent fuel economy,(ii) have clean emissions,(iii) have an equal number of doors,(iv) carry the same number of passengers,(v) are equally priced,(vi) belong to the same vehicle class (ex. sedans).
3.2.2. Study 2 experimental detailsIn Study 2, we replicated the 2009 survey in 2016 using Qualtrics (www.qualtrics.com), but with a minor modification. First, we removed part V, the IBN ratingand sorting task, due to the strong correlation between PEF and IBN evaluationsin the 2009 results and the ones published by Reid et al. (2010). Second, allparticipants completed part II (PEF) after part I (safety), since ordering effectswere not detected in Study 1.
3.3. ParticipantsIn Study 1, a total of 101 online participants were involved in the study andwere recruited through LuthResearch (www.luthresearch.com). Participants werepaid approximately $2 for a 20-minute survey. In Study 2, a total of 103 onlinerespondents participated in the study and were recruited by Amazon MechanicalTurk (www.mturk.com) with a $0.65 compensation per person for finishing thesurvey. Amazon Mechanical Turk has been used in various studies (Rand 2012;Kudrowitz & Wallace 2013), including studies on hybrid electric vehicles (Krupaet al. 2014), and has been shown to be a reliable source of data (Buhrmester,Kwang & Gosling 2011; Kudrowitz & Wallace 2013; Krupa et al. 2014). Table 1summarizes the demographic information on the participants. In both studies,the participants were U.S. residents 18 years old or older.
11/33
available at https://www.cambridge.org/core/terms. https://doi.org/10.1017/dsj.2017.22Downloaded from https://www.cambridge.org/core. Northwestern University Libraries, on 08 Jan 2018 at 21:34:11, subject to the Cambridge Core terms of use,

Table 1. The gender and age distribution of the participants.
Year Total Male Female 18–35 yrs old 36–55 yrs old >55 yrs old
2009 101 37 64 34 37 302016 103 59 44 63 31 9
3.4. Data analysisWe used descriptive and inferential statistics to analyse the data in both studies.The means and standard deviations were computed for all of the rating questions.In Study 1, the data from the two survey versionswere combined since no orderingeffects were found. Study 2 had a single data set to analyse since only one versionof the survey was used. In both studies, the PEF and safety ratings were usedto answer the two main research questions that guide this study. The familiarityratings were used to address research question 2.
4. ResultsIn this section, we present results to answer our two main research questions.Section 4.1 presents the results for Q1: What is the relationship betweencustomers’ PEF and safety ratings of car shapes? How do these ratings correlatewith car-shape characteristics? Section 4.2 presents the results for Q2: Howdo customers’ PEF and safety evaluations of car shapes change over time?These questions will be answered through statistical tests conducted on the sixhypotheses that were formulated to address the two research questions.
4.1. The relationship between PEF and safety ratings and howthey correlate to car-shape characteristics
To test hypotheses H1 (cars that are less boxy will receive higher PEF ratings thanother cars) and H2 (cars that are more boxy will receive higher safety ratings thanother cars), the 20 car shapes were classified into three groups: less boxy, mediumboxy, andmore boxy. Two online surveys were used to get individuals’ opinions onthe boxiness of each shape. In one survey, 25 participants were asked to sort the20 car shapes into the three boxiness groups. In another survey, 25 participantswere asked to rate how boxy each shape looked to them on a seven-point scale,where 1 = ‘not boxy’ and 7 = ‘boxy’. The results are summarized in Table 10.The grouping was performed by combining the opinions collected from these twosurveys. Usually, cars with a larger windshield angle (E) and rear glass angle (F)were considered to be more boxy. The average PEF and safety ratings of the threegroups were compared using ANOVA and Tukey tests. Table 2 shows the resultsof the comparisons. The average PEF and safety ratings of Group 1 (less boxy) aresignificantly different from those of Group 3 (more boxy) in both the 2009 and2016 studies. This indicates that hypotheses H1 and H2 cannot be rejected. Carsthat are less boxy and have a smooth contour will be seen as more green, and carsthat are boxier will be perceived as being safer.
The 20 car shapes were classified into three groups using the value of the cowlto front bumper (C) of each shape to test hypothesis H3 (cars that appear largerin the front and rear crumple zones will receive higher safety ratings than other
12/33
available at https://www.cambridge.org/core/terms. https://doi.org/10.1017/dsj.2017.22Downloaded from https://www.cambridge.org/core. Northwestern University Libraries, on 08 Jan 2018 at 21:34:11, subject to the Cambridge Core terms of use,
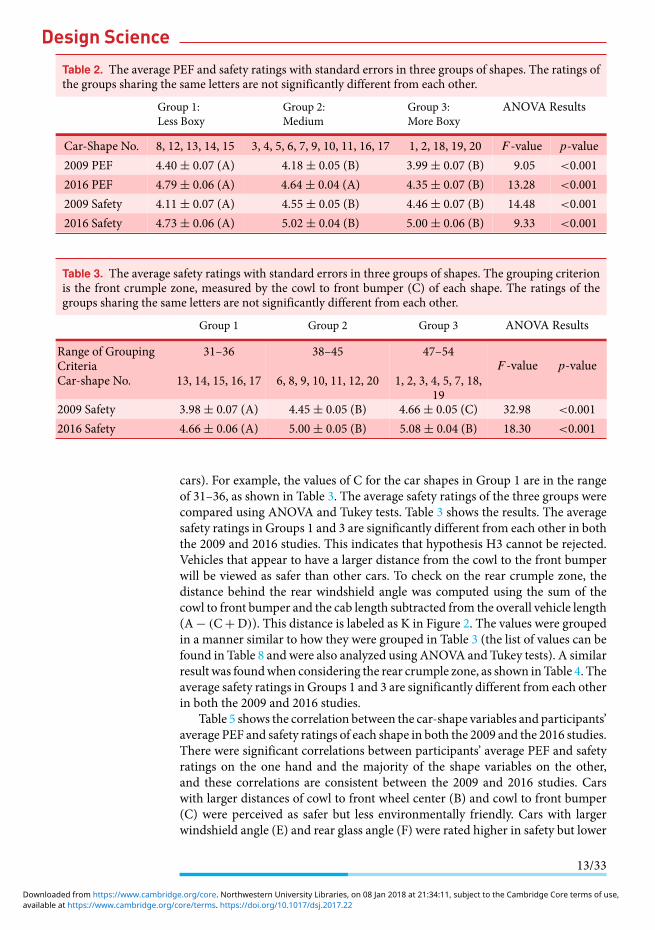
Table 2. The average PEF and safety ratings with standard errors in three groups of shapes. The ratings ofthe groups sharing the same letters are not significantly different from each other.
Group 1:Less Boxy
Group 2:Medium
Group 3:More Boxy
ANOVA Results
Car-Shape No. 8, 12, 13, 14, 15 3, 4, 5, 6, 7, 9, 10, 11, 16, 17 1, 2, 18, 19, 20 F-value p-value2009 PEF 4.40± 0.07 (A) 4.18± 0.05 (B) 3.99± 0.07 (B) 9.05 <0.0012016 PEF 4.79± 0.06 (A) 4.64± 0.04 (A) 4.35± 0.07 (B) 13.28 <0.0012009 Safety 4.11± 0.07 (A) 4.55± 0.05 (B) 4.46± 0.07 (B) 14.48 <0.0012016 Safety 4.73± 0.06 (A) 5.02± 0.04 (B) 5.00± 0.06 (B) 9.33 <0.001
Table 3. The average safety ratings with standard errors in three groups of shapes. The grouping criterionis the front crumple zone, measured by the cowl to front bumper (C) of each shape. The ratings of thegroups sharing the same letters are not significantly different from each other.
Group 1 Group 2 Group 3 ANOVA Results
Range of GroupingCriteriaCar-shape No.
31–36
13, 14, 15, 16, 17
38–45
6, 8, 9, 10, 11, 12, 20
47–54
1, 2, 3, 4, 5, 7, 18,19
F-value p-value
2009 Safety 3.98± 0.07 (A) 4.45± 0.05 (B) 4.66± 0.05 (C) 32.98 <0.0012016 Safety 4.66± 0.06 (A) 5.00± 0.05 (B) 5.08± 0.04 (B) 18.30 <0.001
cars). For example, the values of C for the car shapes in Group 1 are in the rangeof 31–36, as shown in Table 3. The average safety ratings of the three groups werecompared using ANOVA and Tukey tests. Table 3 shows the results. The averagesafety ratings in Groups 1 and 3 are significantly different from each other in boththe 2009 and 2016 studies. This indicates that hypothesis H3 cannot be rejected.Vehicles that appear to have a larger distance from the cowl to the front bumperwill be viewed as safer than other cars. To check on the rear crumple zone, thedistance behind the rear windshield angle was computed using the sum of thecowl to front bumper and the cab length subtracted from the overall vehicle length(A− (C+D)). This distance is labeled as K in Figure 2. The values were groupedin a manner similar to how they were grouped in Table 3 (the list of values can befound in Table 8 and were also analyzed using ANOVA and Tukey tests). A similarresult was foundwhen considering the rear crumple zone, as shown inTable 4. Theaverage safety ratings in Groups 1 and 3 are significantly different from each otherin both the 2009 and 2016 studies.
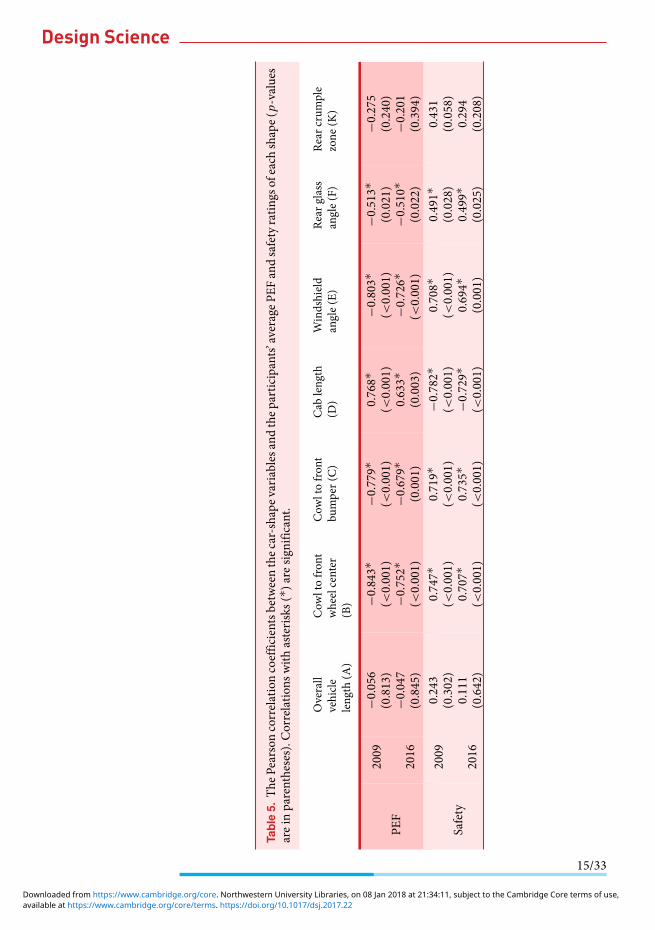
Table 5 shows the correlation between the car-shape variables and participants’average PEF and safety ratings of each shape in both the 2009 and the 2016 studies.There were significant correlations between participants’ average PEF and safetyratings on the one hand and the majority of the shape variables on the other,and these correlations are consistent between the 2009 and 2016 studies. Carswith larger distances of cowl to front wheel center (B) and cowl to front bumper(C) were perceived as safer but less environmentally friendly. Cars with largerwindshield angle (E) and rear glass angle (F) were rated higher in safety but lower
13/33
available at https://www.cambridge.org/core/terms. https://doi.org/10.1017/dsj.2017.22Downloaded from https://www.cambridge.org/core. Northwestern University Libraries, on 08 Jan 2018 at 21:34:11, subject to the Cambridge Core terms of use,
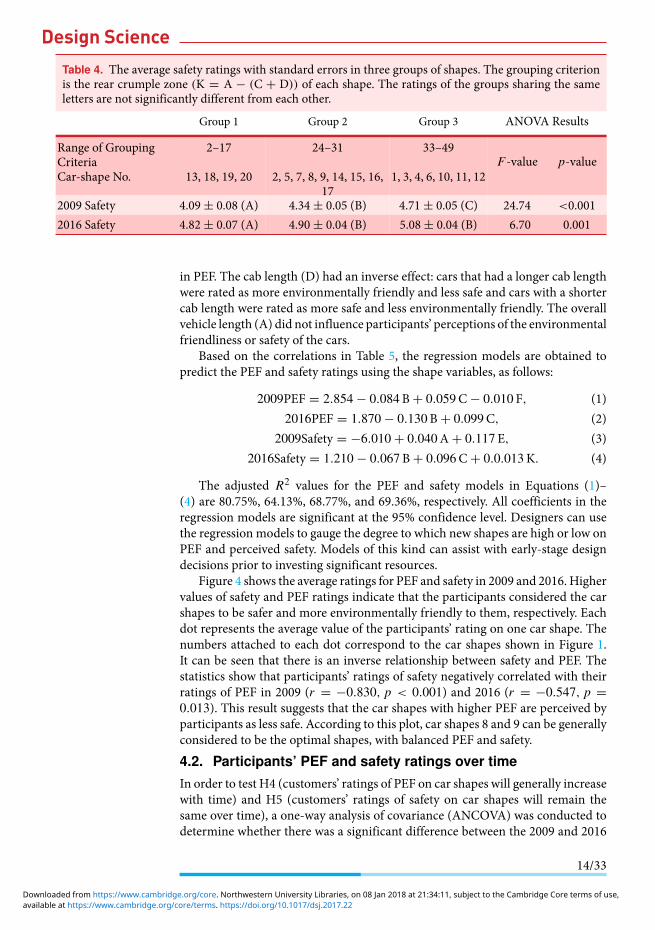
Table 4. The average safety ratings with standard errors in three groups of shapes. The grouping criterionis the rear crumple zone (K = A − (C + D)) of each shape. The ratings of the groups sharing the sameletters are not significantly different from each other.
Group 1 Group 2 Group 3 ANOVA Results
Range of GroupingCriteriaCar-shape No.
2–17
13, 18, 19, 20
24–31
2, 5, 7, 8, 9, 14, 15, 16,17
33–49
1, 3, 4, 6, 10, 11, 12F-value p-value
2009 Safety 4.09± 0.08 (A) 4.34± 0.05 (B) 4.71± 0.05 (C) 24.74 <0.0012016 Safety 4.82± 0.07 (A) 4.90± 0.04 (B) 5.08± 0.04 (B) 6.70 0.001
in PEF. The cab length (D) had an inverse effect: cars that had a longer cab lengthwere rated as more environmentally friendly and less safe and cars with a shortercab length were rated as more safe and less environmentally friendly. The overallvehicle length (A) did not influence participants’ perceptions of the environmentalfriendliness or safety of the cars.
Based on the correlations in Table 5, the regression models are obtained topredict the PEF and safety ratings using the shape variables, as follows:
2009PEF = 2.854− 0.084B+ 0.059C− 0.010 F, (1)2016PEF = 1.870− 0.130B+ 0.099C, (2)
2009Safety = −6.010+ 0.040A+ 0.117E, (3)2016Safety = 1.210− 0.067B+ 0.096C+ 0.0.013K. (4)
The adjusted R2 values for the PEF and safety models in Equations (1)–(4) are 80.75%, 64.13%, 68.77%, and 69.36%, respectively. All coefficients in theregression models are significant at the 95% confidence level. Designers can usethe regression models to gauge the degree to which new shapes are high or low onPEF and perceived safety. Models of this kind can assist with early-stage designdecisions prior to investing significant resources.
Figure 4 shows the average ratings for PEF and safety in 2009 and 2016. Highervalues of safety and PEF ratings indicate that the participants considered the carshapes to be safer and more environmentally friendly to them, respectively. Eachdot represents the average value of the participants’ rating on one car shape. Thenumbers attached to each dot correspond to the car shapes shown in Figure 1.It can be seen that there is an inverse relationship between safety and PEF. Thestatistics show that participants’ ratings of safety negatively correlated with theirratings of PEF in 2009 (r = −0.830, p < 0.001) and 2016 (r = −0.547, p =0.013). This result suggests that the car shapes with higher PEF are perceived byparticipants as less safe. According to this plot, car shapes 8 and 9 can be generallyconsidered to be the optimal shapes, with balanced PEF and safety.4.2. Participants’ PEF and safety ratings over timeIn order to test H4 (customers’ ratings of PEF on car shapes will generally increasewith time) and H5 (customers’ ratings of safety on car shapes will remain thesame over time), a one-way analysis of covariance (ANCOVA) was conducted todetermine whether there was a significant difference between the 2009 and 2016
14/33
available at https://www.cambridge.org/core/terms. https://doi.org/10.1017/dsj.2017.22Downloaded from https://www.cambridge.org/core. Northwestern University Libraries, on 08 Jan 2018 at 21:34:11, subject to the Cambridge Core terms of use,
Tabl
e5.
TheP
earson
correlationcoeffi
cientsbetweenthec
ar-shape
varia
blesandthep
artic
ipants’
averageP
EFandsafetyratin
gsofeach
shape(
p-values
areinparentheses).C
orrelatio
nswith
asteris
ks(*)a
resig
nificant.
Overall
vehicle
leng
th(A
)
Cow
ltofro
ntwheelcenter
(B)
Cow
ltofro
ntbu
mper(C)
Cab
leng
th(D
)Windshield
angle(E)
Rear
glass
angle(F)
Rear
crum
ple
zone
(K)
PEF
2009
2016
−0.056
(0.813)
−0.047
(0.845)
−0.843*
(<0.001)
−0.752*
(<0.001)
−0.779*
(<0.001)
−0.679*
(0.001)
0.768*
(<0.001)
0.633*
(0.003)
−0.803*
(<0.001)
−0.726*
(<0.001)
−0.513*
(0.021)
−0.510*
(0.022)
−0.275
(0.240)
−0.201
(0.394)
Safety
2009
2016
0.243
(0.302)
0.111
(0.642)
0.747*
(<0.001)
0.707*
(<0.001)
0.719*
(<0.001)
0.735*
(<0.001)
−0.782*
(<0.001)
−0.729*
(<0.001)
0.708*
(<0.001)
0.694*
(0.001)
0.491*
(0.028)
0.499*
(0.025)
0.431
(0.058)
0.294
(0.208)
15/33
available at https://www.cambridge.org/core/terms. https://doi.org/10.1017/dsj.2017.22Downloaded from https://www.cambridge.org/core. Northwestern University Libraries, on 08 Jan 2018 at 21:34:11, subject to the Cambridge Core terms of use,
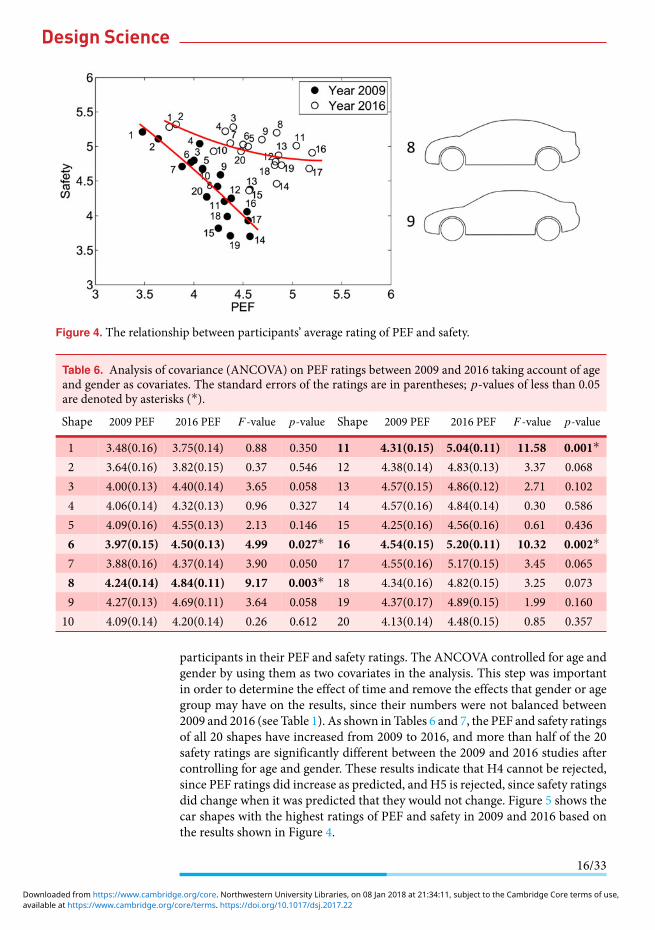
Figure 4. The relationship between participants’ average rating of PEF and safety.
Table 6. Analysis of covariance (ANCOVA) on PEF ratings between 2009 and 2016 taking account of ageand gender as covariates. The standard errors of the ratings are in parentheses; p-values of less than 0.05are denoted by asterisks (*).
Shape 2009 PEF 2016 PEF F-value p-value Shape 2009 PEF 2016 PEF F-value p-value
1 3.48(0.16) 3.75(0.14) 0.88 0.350 11 4.31(0.15) 5.04(0.11) 11.58 0.001*2 3.64(0.16) 3.82(0.15) 0.37 0.546 12 4.38(0.14) 4.83(0.13) 3.37 0.0683 4.00(0.13) 4.40(0.14) 3.65 0.058 13 4.57(0.15) 4.86(0.12) 2.71 0.1024 4.06(0.14) 4.32(0.13) 0.96 0.327 14 4.57(0.16) 4.84(0.14) 0.30 0.5865 4.09(0.16) 4.55(0.13) 2.13 0.146 15 4.25(0.16) 4.56(0.16) 0.61 0.4366 3.97(0.15) 4.50(0.13) 4.99 0.027* 16 4.54(0.15) 5.20(0.11) 10.32 0.002*7 3.88(0.16) 4.37(0.14) 3.90 0.050 17 4.55(0.16) 5.17(0.15) 3.45 0.0658 4.24(0.14) 4.84(0.11) 9.17 0.003* 18 4.34(0.16) 4.82(0.15) 3.25 0.0739 4.27(0.13) 4.69(0.11) 3.64 0.058 19 4.37(0.17) 4.89(0.15) 1.99 0.16010 4.09(0.14) 4.20(0.14) 0.26 0.612 20 4.13(0.14) 4.48(0.15) 0.85 0.357
participants in their PEF and safety ratings. The ANCOVA controlled for age andgender by using them as two covariates in the analysis. This step was importantin order to determine the effect of time and remove the effects that gender or agegroup may have on the results, since their numbers were not balanced between2009 and 2016 (see Table 1). As shown in Tables 6 and 7, the PEF and safety ratingsof all 20 shapes have increased from 2009 to 2016, and more than half of the 20safety ratings are significantly different between the 2009 and 2016 studies aftercontrolling for age and gender. These results indicate that H4 cannot be rejected,since PEF ratings did increase as predicted, and H5 is rejected, since safety ratingsdid change when it was predicted that they would not change. Figure 5 shows thecar shapes with the highest ratings of PEF and safety in 2009 and 2016 based onthe results shown in Figure 4.
16/33
available at https://www.cambridge.org/core/terms. https://doi.org/10.1017/dsj.2017.22Downloaded from https://www.cambridge.org/core. Northwestern University Libraries, on 08 Jan 2018 at 21:34:11, subject to the Cambridge Core terms of use,

Table 7. Analysis of covariance on safety ratings between 2009 and 2016 taking account of age and genderas covariates. The standard errors of the ratings are in parentheses; p-values of less than 0.05 are denotedby asterisks (*).
Shape 2009 Safety 2016 Safety F-value p-value Shape 2009 Safety 2016 Safety F-value p-value
1 5.21(0.13) 5.28(0.11) 1.07 0.303 11 4.21(0.13) 5.01(0.10) 20.22 0.001*2 5.11(0.13) 5.32(0.12) 2.66 0.105 12 4.25(0.14) 4.78(0.13) 8.12 0.005*3 4.80(0.13) 5.28(0.11) 11.18 0.001* 13 4.38(0.13) 4.87(0.12) 8.17 0.005*4 5.04(0.14) 5.22(0.12) 2.66 0.105 14 3.70(0.16) 4.46(0.16) 6.52 0.011*5 4.68(0.13) 5.00(0.11) 3.82 0.052 15 3.82(0.16) 4.36(0.15) 4.56 0.034*6 4.77(0.13) 5.03(0.11) 3.41 0.066 16 4.06(0.15) 4.91(0.13) 14.67 0.001*7 4.71(0.14) 5.05(0.10) 2.84 0.094 17 3.93(0.15) 4.68(0.14) 13.15 0.001*8 4.42(0.13) 5.20(0.12) 19.76 0.001* 18 3.99(0.16) 4.73(0.13) 12.63 0.001*9 4.59(0.14) 5.10(0.10) 11.25 0.001* 19 3.71(0.15) 4.73(0.13) 22.46 0.001*10 4.67(0.14) 4.93(0.13) 1.55 0.214 20 4.27(0.16) 4.93(0.14) 13.73 0.001
Figure 5. The car shapes with the highest PEF and safety ratings in 2009 and 2016.
Figure 6 shows the plot of participants’ average PEF ratings in 2016 againstthose in 2009. Data points above the red diagonal line indicate that participants’PEF ratings of those shapes increased from 2009 to 2016. In 2016, participantsgave higher PEF ratings to all 20 shapes. ThePEF ratings of shapes 8, 11, 16, 17, and6 increased more than those of the other shapes. This result suggests that the 2016participants generally perceived the given car shapes as more environmentallyfriendly than the 2009 participants. Figure 7 shows the plot of participants’ averagesafety ratings in 2016 against those in 2009. Similarly, 2016 participants generallyconsidered the given car shapes to be safer than the 2009 participants. The safetyratings of car shapes 8, 11, 16, and 19 were the most increased by the 2016participants. Car shapes 16 and 17 have the same dimensions (see Table 8) andshape characteristics except for one feature: a rear wheel fender on shape 17. Yet,upon review of the results, both shapes were among the top for PEF ratings butshape 17 was not in the top shapes for safety ratings. The presence of the fenderon shape 17 provided a nuanced effect such that the average ratings on safety wererelatively lower than the ratings of shape 16, as seen in Figure 7.
In order to testH6a (customers’ ratings of PEFwill be positively correlatedwiththeir familiarity ratings of the car shapes) and H6b (customers’ ratings of safetywill be positively correlated with their familiarity ratings of the car shapes), weconducted a correlation analysis and created scatterplots of participants’ average
17/33
available at https://www.cambridge.org/core/terms. https://doi.org/10.1017/dsj.2017.22Downloaded from https://www.cambridge.org/core. Northwestern University Libraries, on 08 Jan 2018 at 21:34:11, subject to the Cambridge Core terms of use,
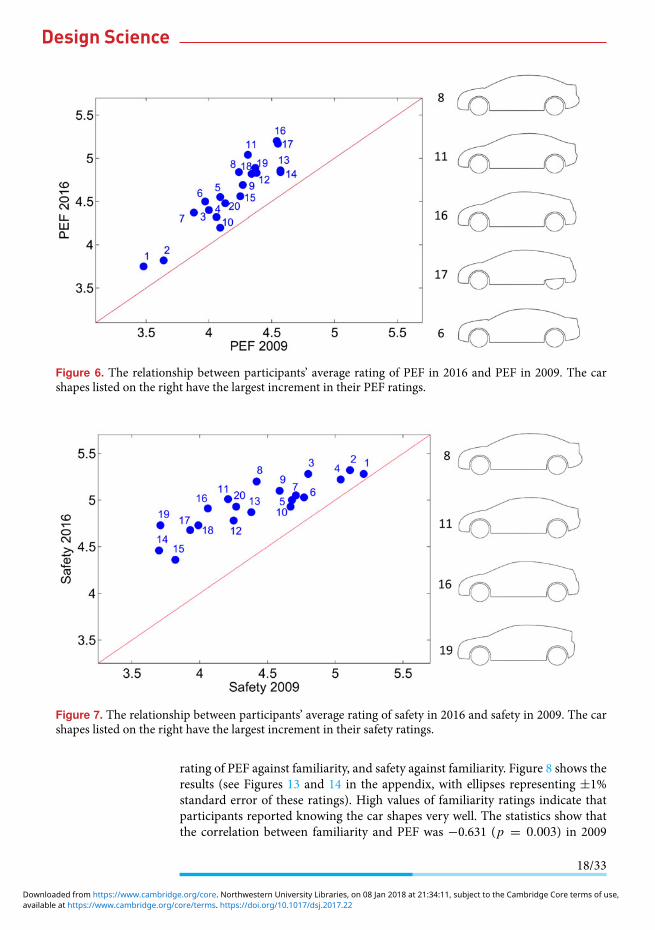
Figure 6. The relationship between participants’ average rating of PEF in 2016 and PEF in 2009. The carshapes listed on the right have the largest increment in their PEF ratings.
Figure 7. The relationship between participants’ average rating of safety in 2016 and safety in 2009. The carshapes listed on the right have the largest increment in their safety ratings.
rating of PEF against familiarity, and safety against familiarity. Figure 8 shows theresults (see Figures 13 and 14 in the appendix, with ellipses representing ±1%standard error of these ratings). High values of familiarity ratings indicate thatparticipants reported knowing the car shapes very well. The statistics show thatthe correlation between familiarity and PEF was −0.631 (p = 0.003) in 2009
18/33
available at https://www.cambridge.org/core/terms. https://doi.org/10.1017/dsj.2017.22Downloaded from https://www.cambridge.org/core. Northwestern University Libraries, on 08 Jan 2018 at 21:34:11, subject to the Cambridge Core terms of use,
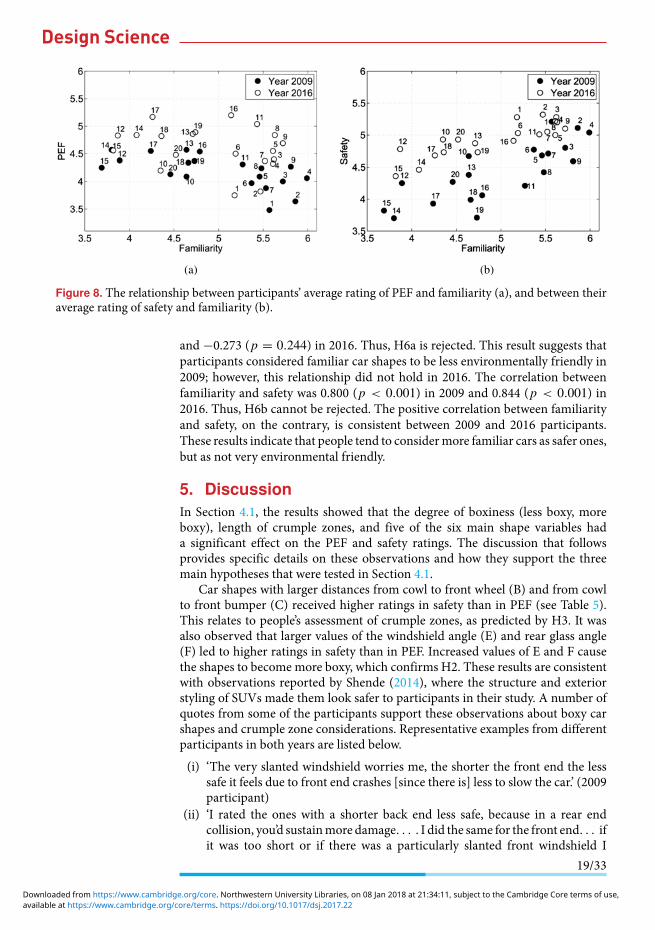
Figure 8. The relationship between participants’ average rating of PEF and familiarity (a), and between theiraverage rating of safety and familiarity (b).
and −0.273 (p = 0.244) in 2016. Thus, H6a is rejected. This result suggests thatparticipants considered familiar car shapes to be less environmentally friendly in2009; however, this relationship did not hold in 2016. The correlation betweenfamiliarity and safety was 0.800 (p < 0.001) in 2009 and 0.844 (p < 0.001) in2016. Thus, H6b cannot be rejected. The positive correlation between familiarityand safety, on the contrary, is consistent between 2009 and 2016 participants.These results indicate that people tend to considermore familiar cars as safer ones,but as not very environmental friendly.
5. DiscussionIn Section 4.1, the results showed that the degree of boxiness (less boxy, moreboxy), length of crumple zones, and five of the six main shape variables hada significant effect on the PEF and safety ratings. The discussion that followsprovides specific details on these observations and how they support the threemain hypotheses that were tested in Section 4.1.
Car shapes with larger distances from cowl to front wheel (B) and from cowlto front bumper (C) received higher ratings in safety than in PEF (see Table 5).This relates to people’s assessment of crumple zones, as predicted by H3. It wasalso observed that larger values of the windshield angle (E) and rear glass angle(F) led to higher ratings in safety than in PEF. Increased values of E and F causethe shapes to become more boxy, which confirms H2. These results are consistentwith observations reported by Shende (2014), where the structure and exteriorstyling of SUVs made them look safer to participants in their study. A number ofquotes from some of the participants support these observations about boxy carshapes and crumple zone considerations. Representative examples from differentparticipants in both years are listed below.(i) ‘The very slanted windshield worries me, the shorter the front end the less
safe it feels due to front end crashes [since there is] less to slow the car.’ (2009participant)
(ii) ‘I rated the ones with a shorter back end less safe, because in a rear endcollision, you’d sustainmore damage. . . . I did the same for the front end. . . ifit was too short or if there was a particularly slanted front windshield I
19/33
available at https://www.cambridge.org/core/terms. https://doi.org/10.1017/dsj.2017.22Downloaded from https://www.cambridge.org/core. Northwestern University Libraries, on 08 Jan 2018 at 21:34:11, subject to the Cambridge Core terms of use,

thought it might be more dangerous than a windshield that was extendedfurther away from the driver.’ (2009 participant)
(iii) ‘A boxier rear of the vehicle makes me feel like it would do better in the eventof a rear collision.’ (2016 participant)
(iv) ‘If it looked like there was more vehicle to absorb the impact of a crash beforereaching the passengers it was probably a little safer.’ (2016 participant)
(v) ‘Cabins that are very close to the front of the car strike me as less safe. Cabinswith a lot of rear window glass also strikeme as unsafe. Large strong bumpersare important for safety and while the bumper can’t be seen in a shape, theshape may lend to the possibility of there being an adequate bumper.’ (2016participant)
It was observed that overall vehicle length (A) had no effect on PEF or safetyratings. As can be seen from Table 8, the overall lengths of the 20 vehicles rangefrom 181 inches to 201 inches. This change is quite small compared with thechanges of other length variables. For example, the distance between cowl andfront wheel center (variable B) ranges from 0 to 25 inches. Participants mostlikely did not notice the change of the overall length across 20 car shapes, whichmay explain why the overall length did not influence participants’ PEF and safetyratings. However, changes in the cab length (D) did have an effect: car shapes withshorter cab lengths were seen asmore safe and shapes with longer cab lengths wereseen as more environmentally friendly. The reason for this is that a shorter cablength increases the values of the windshield angle (E) and rear glass angle (F),making the car more boxy and thus lower on PEF. In like manner, a longer cablength decreases the angles E and F, making the roofline more smooth and lessboxy, which people attribute to higher PEF. This interaction between increasedcar length and increased PEF was also observed in Reid et al. (2012). Tsenget al. (2013) also reported that participants rated vehicle shapes with ‘curvaceousrooflines’ as being more fuel efficient and thus more environmentally friendly.A number of quotes about shape characteristics associated with environmentallyfriendliness were expressed. Representative quotes from different participants in2009 and 2016 are noted below.(i) ‘I believe the design of the vehicles that have more slopes, no angles in
the design are more environmentally friendly and have better air dynamicsaround them.’ (2009 participant)
(ii) ‘The sleeker looking cars looked more environmentally friendly.’ (2016participant)
The inverse relationship between PEF and safety shown in Figure 4 mimicswhat can be foundwhen using objectivemeasures to evaluate safety characteristicsof a vehicle and its fuel efficiency. Work conducted by Crandall & Graham (1989)showed that the higher the fuel efficiency, the less safe a car became due to light-weighting. Although participants were not provided with explicit informationabout technical details of the car shapes, their perceptions aligned with datareported by others. Tseng et al., observed that participants were able to align shapecharacteristics with objective/functional characteristics of the car shapes (Tsenget al. 2013). They noted that participants’ ability to do so may be related to socialnorms and industry norms used in vehicle designs.
In Section 4.2, the results showed significant increases in PEF and safetyratings between 2009 and 2016. Figures 6 and 7 showed that participants from theyear 2016 rated all 20 car shapes higher on PEF and safety than 2009 participants.
20/33
available at https://www.cambridge.org/core/terms. https://doi.org/10.1017/dsj.2017.22Downloaded from https://www.cambridge.org/core. Northwestern University Libraries, on 08 Jan 2018 at 21:34:11, subject to the Cambridge Core terms of use,
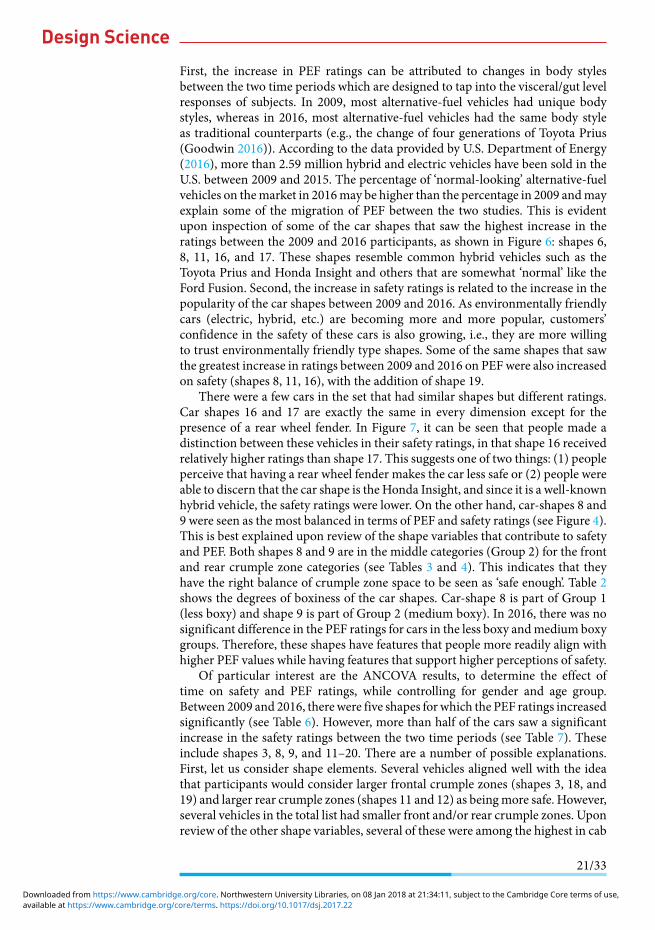
First, the increase in PEF ratings can be attributed to changes in body stylesbetween the two time periods which are designed to tap into the visceral/gut levelresponses of subjects. In 2009, most alternative-fuel vehicles had unique bodystyles, whereas in 2016, most alternative-fuel vehicles had the same body styleas traditional counterparts (e.g., the change of four generations of Toyota Prius(Goodwin 2016)). According to the data provided by U.S. Department of Energy(2016), more than 2.59 million hybrid and electric vehicles have been sold in theU.S. between 2009 and 2015. The percentage of ‘normal-looking’ alternative-fuelvehicles on themarket in 2016may be higher than the percentage in 2009 andmayexplain some of the migration of PEF between the two studies. This is evidentupon inspection of some of the car shapes that saw the highest increase in theratings between the 2009 and 2016 participants, as shown in Figure 6: shapes 6,8, 11, 16, and 17. These shapes resemble common hybrid vehicles such as theToyota Prius and Honda Insight and others that are somewhat ‘normal’ like theFord Fusion. Second, the increase in safety ratings is related to the increase in thepopularity of the car shapes between 2009 and 2016. As environmentally friendlycars (electric, hybrid, etc.) are becoming more and more popular, customers’confidence in the safety of these cars is also growing, i.e., they are more willingto trust environmentally friendly type shapes. Some of the same shapes that sawthe greatest increase in ratings between 2009 and 2016 on PEFwere also increasedon safety (shapes 8, 11, 16), with the addition of shape 19.
There were a few cars in the set that had similar shapes but different ratings.Car shapes 16 and 17 are exactly the same in every dimension except for thepresence of a rear wheel fender. In Figure 7, it can be seen that people made adistinction between these vehicles in their safety ratings, in that shape 16 receivedrelatively higher ratings than shape 17. This suggests one of two things: (1) peopleperceive that having a rear wheel fender makes the car less safe or (2) people wereable to discern that the car shape is the Honda Insight, and since it is a well-knownhybrid vehicle, the safety ratings were lower. On the other hand, car-shapes 8 and9 were seen as the most balanced in terms of PEF and safety ratings (see Figure 4).This is best explained upon review of the shape variables that contribute to safetyand PEF. Both shapes 8 and 9 are in the middle categories (Group 2) for the frontand rear crumple zone categories (see Tables 3 and 4). This indicates that theyhave the right balance of crumple zone space to be seen as ‘safe enough’. Table 2shows the degrees of boxiness of the car shapes. Car-shape 8 is part of Group 1(less boxy) and shape 9 is part of Group 2 (medium boxy). In 2016, there was nosignificant difference in the PEF ratings for cars in the less boxy andmedium boxygroups. Therefore, these shapes have features that people more readily align withhigher PEF values while having features that support higher perceptions of safety.
Of particular interest are the ANCOVA results, to determine the effect oftime on safety and PEF ratings, while controlling for gender and age group.Between 2009 and 2016, therewere five shapes forwhich the PEF ratings increasedsignificantly (see Table 6). However, more than half of the cars saw a significantincrease in the safety ratings between the two time periods (see Table 7). Theseinclude shapes 3, 8, 9, and 11–20. There are a number of possible explanations.First, let us consider shape elements. Several vehicles aligned well with the ideathat participants would consider larger frontal crumple zones (shapes 3, 18, and19) and larger rear crumple zones (shapes 11 and 12) as beingmore safe. However,several vehicles in the total list had smaller front and/or rear crumple zones. Uponreview of the other shape variables, several of these were among the highest in cab
21/33
available at https://www.cambridge.org/core/terms. https://doi.org/10.1017/dsj.2017.22Downloaded from https://www.cambridge.org/core. Northwestern University Libraries, on 08 Jan 2018 at 21:34:11, subject to the Cambridge Core terms of use,
length (D) (listed in decreasing order: shapes 13, 20, 15, 14, 17, 16, 8). Shape 9 is theonly one that does not fit these two explanations. However, it is important to notethat shape 9 happens to be one of the vehicles that is considered to be optimallybalanced in terms of safety and PEF ratings. These considerations indicate thepresence of interaction effects amongst the shapes, which has been noted as animportant area of study in visual studies of this kind (Sylcott et al. 2015).
Next, let us consider the possible influence of social and industry norms(Tseng et al. 2013), as previously mentioned. The results showed that the lessfamiliar participants were with the car shapes, the higher the PEF ratings werein 2009 compared with 2016. One possible explanation is that in 2009, hybridand electric vehicles were still novel, and assessing what one would consider anenvironmentally friendly vehicle was not well established at that time, but sevenyears later, they are now very common. One 2016 participant explicitly indicatedthe role that familiarity had on his evaluations: ‘I chose to rate cars that wereshaped like familiar models that are known to be fuel efficient/environmentallyfriendly higher than ones with traditional body shapes.’ When it comes to safety,the more familiar participants were with the car shapes, the higher the safetyratings were in both 2009 and 2016. This result suggests that people are morefamiliar with the types of visual cues to look for when assessing safety, since theconcept of safety is more familiar than PEF.
6. ConclusionsOur work contributes to an understanding of how customers have changed theirshape-based evaluations after seven years, and it is the first of its kind in thedesign-science community. This study showed that ratings for PEF and perceivedsafetywere inversely correlated, especially in the year 2009. Car shapeswith higherPEF ratings were perceived as being less safe. In like manner, car shapes thatreceived higher perceived safety ratings were seen as being less environmentallyfriendly. Shape elements that contributed to the ratings included the degree ofboxiness of the shapes and the perceived amount of frontal and rear crush space(crumple zones). Car shapes that were less boxy with smoother lines receivedhigher ratings on PEF. In general, shapes that were more boxy and had relativelylarger frontal and/or rear crush space were seen as safe.
However, the participants in 2016 provided significantly higher safety ratingson more than half of the 20 car shapes than the 2009 participants did. Manyof the shapes were not confined to those that were boxy and had larger crushspaces, but resembled some of the common hybrid electric vehicles on the marketsuch as the Toyota Prius. The results suggest that with time, car shapes that wereonce novel can becomemore common and familiar to people, and familiarity wasfound to be positively correlated with perceptions of safety in our studies for bothyears. It is possible that these observations may be applicable to other productdesign contexts that involve inference-based evaluations. Future work wouldinvolve conducting comparative studies in other design contexts to generalizethese results.
A limitation of this research is that only silhouettes and profile views ofthe car shapes were presented to participants. In a real showroom, customerswill synthesize more details about the vehicles, including the color, material,performance specifications (e.g., fuel efficiency and safety information), andphysical contact. Future research opportunities include investigation of otherfactors that can influence people’s perception of the environmental friendliness
22/33
available at https://www.cambridge.org/core/terms. https://doi.org/10.1017/dsj.2017.22Downloaded from https://www.cambridge.org/core. Northwestern University Libraries, on 08 Jan 2018 at 21:34:11, subject to the Cambridge Core terms of use,
and safety of cars. An understanding of the inter-relationship and interplayof these factors will help car designers to create more optimized shapes forcustomers. In addition, future studies may involve carrying out an experimentdesign on the creation of the shapes tomore tightly control the shape variables andperforming a more in-depth study to consider interaction effects among variables(Sylcott et al. 2015).
AcknowledgmentsThe authors would like to thank members of the Research in Engineering andInterdisciplinaryDesign (REID) Laboratory at PurdueUniversity andDr. RichardGonzalez for helpful suggestions on statistical methods. This work was partiallysupported by FordMotor Company and gift funds from the REIDLaboratory. Theopinions presented here are only those of the authors.
Appendix
Table 8. The values of the six car-shape variables and a seventh variable to account for the rear crumplezone (K). The length variables (A, B, C, D, and K) are in inches. The angle variables (E and F) are indegrees (◦).
Shape Overallvehiclelength (A)
Cowl tofront wheelcenter (B)
Cowl tofrontbumper (C)
Cablength(D)
Windshieldangle (E)
Rear glassangle (F)
Rearcrumplezone (K)
1 181 25 54 94 32 27 332 181 25 54 100 32 27 273 190 24 54 103 27 23 334 194 14 47 110 28 20 365 190 16 47 116 27 19 276 196 13 43 110 25 19 437 190 22 52 114 25 21 248 190 7 40 123 23 22 279 190 13 45 114 26 22 3110 201 13 43 121 23 21 3611 195 7 38 109 23 21 4912 189 9 40 112 20 28 3713 186 4 36 132 21 16 1714 184 0 31 127 21 16 2615 192 2 31 130 21 13 3116 185 4 36 125 23 13 2417 185 4 36 125 23 13 2418 184 18 49 119 27 12 1519 179 13 47 130 25 12 220 186 9 42 130 25 40 14
23/33
available at https://www.cambridge.org/core/terms. https://doi.org/10.1017/dsj.2017.22Downloaded from https://www.cambridge.org/core. Northwestern University Libraries, on 08 Jan 2018 at 21:34:11, subject to the Cambridge Core terms of use,
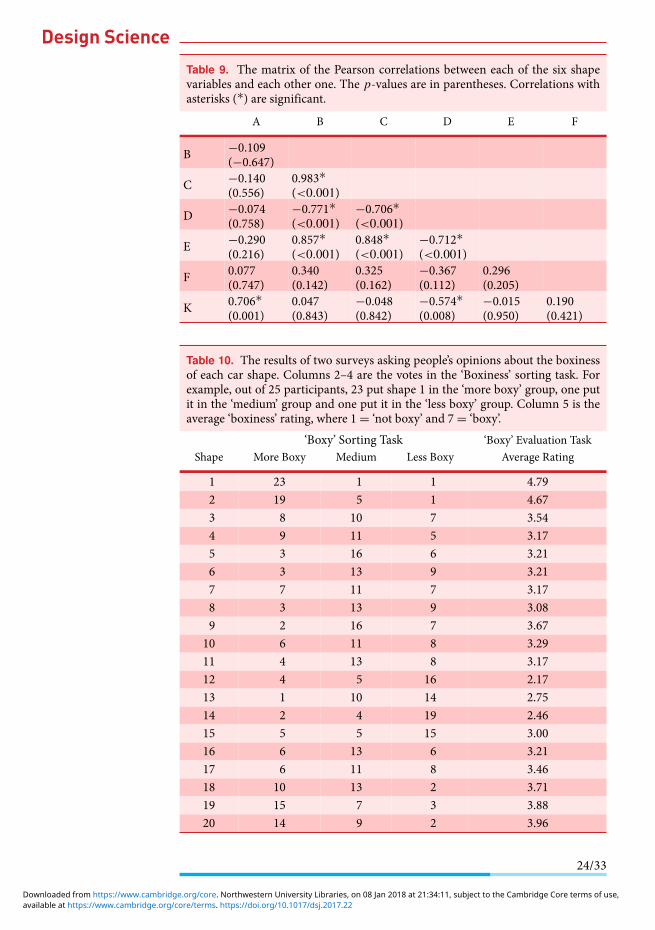
Table 9. The matrix of the Pearson correlations between each of the six shapevariables and each other one. The p-values are in parentheses. Correlations withasterisks (*) are significant.
A B C D E F
B −0.109(−0.647)
C −0.140(0.556)
0.983*(<0.001)
D −0.074(0.758)
−0.771*(<0.001)
−0.706*(<0.001)
E −0.290(0.216)
0.857*(<0.001)
0.848*(<0.001)
−0.712*(<0.001)
F 0.077(0.747)
0.340(0.142)
0.325(0.162)
−0.367(0.112)
0.296(0.205)
K 0.706*(0.001)
0.047(0.843)
−0.048(0.842)
−0.574*(0.008)
−0.015(0.950)
0.190(0.421)
Table 10. The results of two surveys asking people’s opinions about the boxinessof each car shape. Columns 2–4 are the votes in the ‘Boxiness’ sorting task. Forexample, out of 25 participants, 23 put shape 1 in the ‘more boxy’ group, one putit in the ‘medium’ group and one put it in the ‘less boxy’ group. Column 5 is theaverage ‘boxiness’ rating, where 1= ‘not boxy’ and 7= ‘boxy’.
‘Boxy’ Sorting Task ‘Boxy’ Evaluation TaskShape More Boxy Medium Less Boxy Average Rating
1 23 1 1 4.792 19 5 1 4.673 8 10 7 3.544 9 11 5 3.175 3 16 6 3.216 3 13 9 3.217 7 11 7 3.178 3 13 9 3.089 2 16 7 3.6710 6 11 8 3.2911 4 13 8 3.1712 4 5 16 2.1713 1 10 14 2.7514 2 4 19 2.4615 5 5 15 3.0016 6 13 6 3.2117 6 11 8 3.4618 10 13 2 3.7119 15 7 3 3.8820 14 9 2 3.96
24/33
available at https://www.cambridge.org/core/terms. https://doi.org/10.1017/dsj.2017.22Downloaded from https://www.cambridge.org/core. Northwestern University Libraries, on 08 Jan 2018 at 21:34:11, subject to the Cambridge Core terms of use,
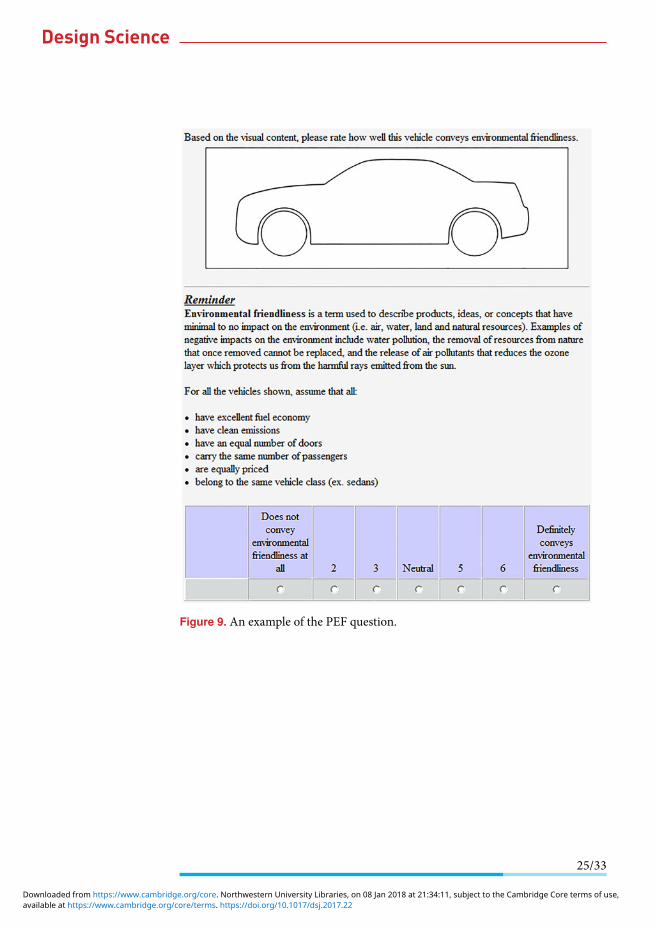
Figure 9. An example of the PEF question.
25/33
available at https://www.cambridge.org/core/terms. https://doi.org/10.1017/dsj.2017.22Downloaded from https://www.cambridge.org/core. Northwestern University Libraries, on 08 Jan 2018 at 21:34:11, subject to the Cambridge Core terms of use,
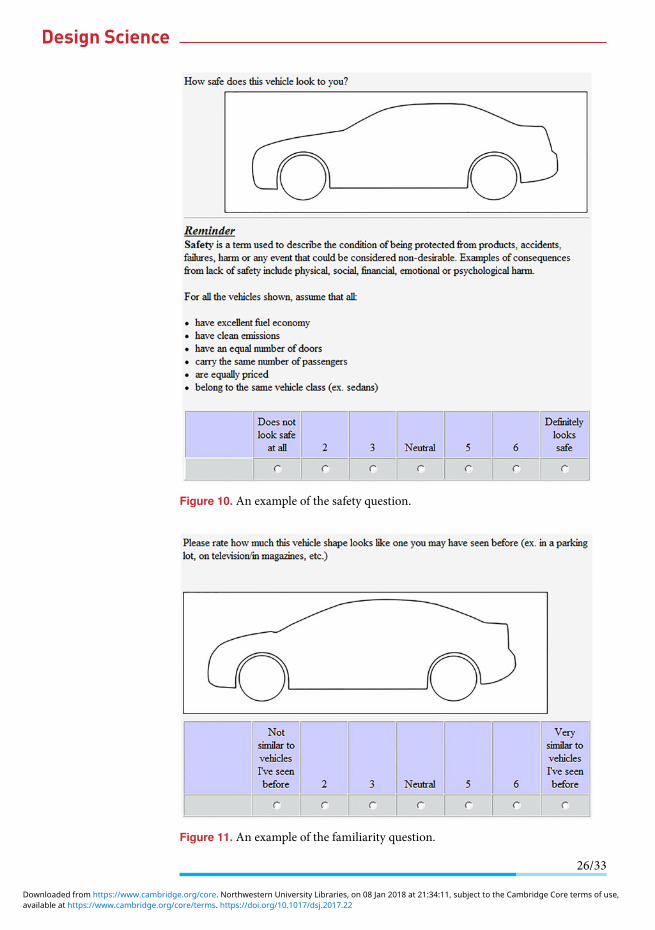
Figure 10. An example of the safety question.
Figure 11. An example of the familiarity question.
26/33
available at https://www.cambridge.org/core/terms. https://doi.org/10.1017/dsj.2017.22Downloaded from https://www.cambridge.org/core. Northwestern University Libraries, on 08 Jan 2018 at 21:34:11, subject to the Cambridge Core terms of use,
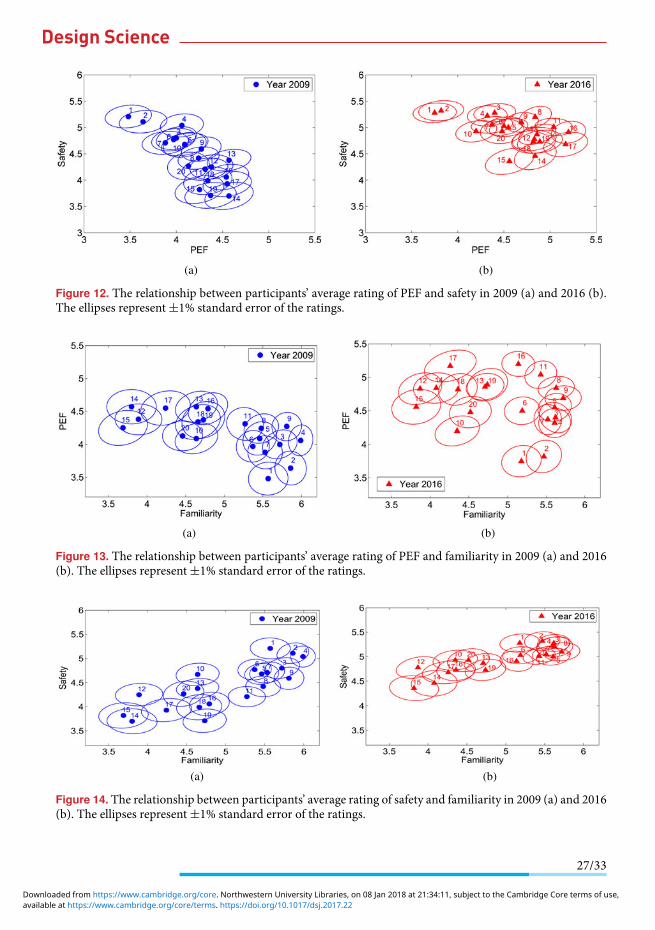
Figure 12. The relationship between participants’ average rating of PEF and safety in 2009 (a) and 2016 (b).The ellipses represent±1% standard error of the ratings.
Figure 13. The relationship between participants’ average rating of PEF and familiarity in 2009 (a) and 2016(b). The ellipses represent±1% standard error of the ratings.
Figure 14. The relationship between participants’ average rating of safety and familiarity in 2009 (a) and 2016(b). The ellipses represent±1% standard error of the ratings.
27/33
available at https://www.cambridge.org/core/terms. https://doi.org/10.1017/dsj.2017.22Downloaded from https://www.cambridge.org/core. Northwestern University Libraries, on 08 Jan 2018 at 21:34:11, subject to the Cambridge Core terms of use,
ReferencesAbbasi, S. M. 2013 The fashion cycle and theories of fashion. Paripex – Indian Journal of
Research 2 (9), 117–119.Anstey, K. J.,Horswill, M. S.,Wood, J. M. &Hatherly, C. 2012 The role of cognitive and
visual abilities as predictors in the multifactorial model of driving safety. AccidentAnalysis & Prevention 45, 766–774.
Artacho-Ramirez, M. A.,Diego-Mas, J. A. & AlcaideMarzal, J. 2008 Influence of themode of graphical representation on the perception of product aesthetic andemotional features: an exploratory study. International Journal of IndustrialErgonomics 38 (11), 942–952.
Ayres, T.,Wood, C., Schmidt, R., Young, D. &Murray, J. 2000 Affordance perceptionand safety intervention. In Proceedings of the Human Factors and Ergonomics SocietyAnnual Meeting, vol. 44, No. 32, pp. 6–51. SAGE Publications.
Bates-Brkljac, N. 2009 Assessing perceived credibility of traditional and computergenerated architectural representations. Design Studies 30 (4), 415–437.
Beverland, M. & Lockshin, L. 2003 A longitudinal study of customers’ desired valuechange in business-to-business markets. Industrial Marketing Management 32 (8),653–666.
Bishop, P. & Bloomfield, R. 2000 A methodology for safety case development. Safety andReliability 20 (1), 34–42.
Bloch, P. H. 1995 Seeking the ideal form: product design and consumer response. TheJournal of Marketing 59 (3), 16–29.
Bolduc, D., Boucher, N. & Alvarez-Daziano, R. 2008 Hybrid choice modeling of newtechnologies for car choice in Canada. Journal of the Transportation Research Record2082, 63–71.
Bolton, R. N. &Drew, J. H. 1991 A longitudinal analysis of the impact of service changeson customer attitudes. The Journal of Marketing 55 (1), 1–9.
Boyd, J. &Mellman, R. 1980 The effect of fuel economy standards on the US automotivemarket: an Hedonic demand analysis. Transportation Research Part A: General 14(5–6), 367–378.
Boztepe, S. 2007 User value: competing theories and models. International Journal ofDesign 1 (2), 55–63.
Brannan, D.,Heeter, J. & Bird, L. 2012 Made with renewable energy: how and whycompanies are labeling consumer products, National Renewable Energy Lab, ReportNo. TP-6A20-53764.
Brooker, G. 1976 The self-actualizing socially conscious consumer. Journal of ConsumerResearch (3), 107–112.
Buhrmester, M., Kwang, T. & Gosling, S. D. 2011 Amazon’s Mechanical Turk: a newsource of inexpensive, yet high-quality, data? Perspectives on Psychological Science 6(1), 3–5.
Bump, P. 2014 Here is when each generation begins and ends, according to facts. TheAtlantic, published on March 25, 2014. https://www.theatlantic.com/national/archive/2014/03/here-is-when-each-generation-begins-and-ends-according-to-facts/359589/.
Burnap, A.,Hartley, J., Pan, Y., Gonzalez, R. & Papalambros, P. Y. 2016 Balancingdesign freedom and brand recognition in the evolution of automotive brand styling.Design Science Journal 2 (e9), doi:10.1017/dsj.2016.9.
Cagan, J. & Vogel, C. 2013 Creating Breakthrough Products. Financial Times Press.Chen, C. 2001 Design for the environment: a quality-based model for green product
development.Management Science 47 (2), 250–263.
28/33
available at https://www.cambridge.org/core/terms. https://doi.org/10.1017/dsj.2017.22Downloaded from https://www.cambridge.org/core. Northwestern University Libraries, on 08 Jan 2018 at 21:34:11, subject to the Cambridge Core terms of use,
Chase, D. & Smith, T. K. 1992 Consumers keen on green but marketers don’t deliver.Advertising Age 63 (29), 2–4.
Chen, W. &Wassenaar, H. J. 2003 An approach to decision-based design with discretechoice analysis for demand modeling. Journal of Mechanical Design 125 (3), 490–497.
Coad, A.,De Haan, P. &Woersdorfer, J. S. 2009 Consumer support for environmentalpolicies: an application to purchases of green cars. Ecological Economics 68 (7),2078–2086.
Crandall, R. & Graham, J. 1989 The effect of fuel economy standards on automobilesafety. The Journal of Law and Economics 32 (1), 97–118.
Creusen, M. E. & Schoormans, J. P. 2005 The different roles of product appearance inconsumer choice. Journal of Product Innovation Management 22 (1), 63–81.
Dagnoli, J. 1991 Consciously green. Advertising Age 14 (9), 14.D’Souza, C. 2004 Ecolabel programmes: a stakeholder (consumer) perspective. Corporate
Communications: An International Journal 9 (3), 179–188.Du, P. &MacDonald, E. F. 2014 Eye-tracking data predict importance of product
features and saliency of size change. Journal of Mechanical Design 136 (8), 081005.Duchowski, A. T. 2007 Eye Tracking Methodology: Theory and Practice. Springer.Du Preez, J. P.,Diamantopoulos, A. & Schlegelmilch, B. 1994 Product standardization
and attribute saliency: a three country empirical comparison. Journal of InternationalMarketing 2 (1), 7–28.
El-Basyouny, K. & El-Bassiouni, M. Y. 2013 Modeling and analyzing traffic safetyperceptions: an application to the speed limit reduction pilot project in Edmonton,Alberta. Accident Analysis & Prevention 51, 156–167.
Evans, L. 2004 Traffic Safety, Science Serving Society. Bloomfield Hills.Flint, D. J. &Woodruff, R. B. 2001 The initiators of changes in customers’ desired value:
results from a theory building study. Industrial Marketing Management 30 (4),321–337.
Goodwin, A. 2016 Take a look back four generations of Toyota Prius (pictures),https://www.cnet.com/roadshow/pictures/history-of-the-toyota-prius-pictures/,April 30, 2016.
Goucher-Lambert, K. & Cagan, J. 2015 The impact of sustainability on consumerpreference judgments of product attributes. Journal of Mechanical Design 137 (8),081401.
Hahnel, U. J., Gölz, S. & Spada, H. 2014 How does green suit me? Consumers mentallymatch perceived product attributes with their domainspecific motives when makinggreen purchase decisions. Journal of Consumer Behaviour 13 (5), 317–327.
Haugen, A. S., Søfteland, E., Eide, G. E., Nortvedt, M. W., Aase, K. &Harthug, S. 2010Patient safety in surgical environments: cross-countries comparison of psychometricproperties and results of the Norwegian version of the Hospital Survey on PatientSafety. BMC Health Services Research 10 (1), 1.
Heffner, R., Kurani, K. S. & Turrentine, T. S. 2007 Symbolism in early markets forhybrid electric vehicles. Technical Report No. UCD-ITS-RR-07-01, Institute ofTransportation Studies, University of California, Davis, CA.
Hoffenson, S., Frischknecht, B. D. & Papalambros, P. Y. 2013 Amarket systems analysisof the US sport utility vehicle market considering frontal crash safety technology andpolicy. Accident Analysis & Prevention 50, 943–954.
Holbrook, M. B. 1999 Consumer Value: a Framework for Analysis and Research.Psychology Press.
29/33
available at https://www.cambridge.org/core/terms. https://doi.org/10.1017/dsj.2017.22Downloaded from https://www.cambridge.org/core. Northwestern University Libraries, on 08 Jan 2018 at 21:34:11, subject to the Cambridge Core terms of use,

Hoyer, W. D. 1984 An examination of consumer decision making for a common repeatpurchase product. Journal of Consumer Research 11 (3), 822–829.
Isa, M. H. M., Ariffin, A. H., Jawi, Z. M. & Kassim, K. A. A. 2012 Purchasing behaviorand perception on safety among car drivers: a study in Klang Valley. In Technology,Science, Social Sciences and Humanities Conference 2012, Langkawi, Kedah, Malaysia.
Jian-you, Z., Xiao-fen, S., Liang, Z., Shuang-xi, Z. & Xi-yang, N. 2013 Driving behaviortheory and computer simulation system of driver’s risk perception based on 3D.Procedia – Social and Behavioral Sciences 96, 1686–1695.
von Kaenel, C. Auto sales hit new record as Americans buy more gas-guzzling cars.Scientific American, https://www.scientificamerican.com/article/auto-sales-hit-new-record-as-americans-buy-more-gas-guzzling-cars/ - last accessed June 1, 2017.
Kassarjian, H. 1971 Incorporating ecology into marketing strategy: the case of airpollution. Journal of Marketing 35, 61–65.
Kaul, V., Singh, S., Rajagopalan, K. & Coury, M. 2010 Consumer attitudes andperceptions about safety and their preferences and willingness to pay for safety. SAETechnical Paper, No. 2010-01-2336.
Kelly, J., Papalambros, P. Y. & Seifert, C. M. 2008 Interactive genetic algorithms for useas creativity enhancement tools. In 2008 AAAI Spring Symposium: Creative IntelligentSystems, pp. 34–39.
Kelly, J. C.,Maheut, P., Petiot, J. F. & Papalambros, P. Y. 2011 Incorporating user shapepreference in engineering design optimisation. Journal of Engineering Design 22 (9),627–650.
Klier, T. & Linn, J. 2010 The price of gasoline and new vehicle fuel economy: evidencefrom monthly sales data. American Economic Journal: Economic Policy 2 (3), 134–153.
Krupa, J. S., Rizzo, D. M., Eppstein, M. J., Lanute, D. B., Gaalema, D. E., Lakkaraju,K. &Warrender, C. E. 2014 Analysis of a consumer survey on plug-in hybrid electricvehicles. Transportation Research Part A: Policy and Practice 64, 14–31.
Kudrowitz, B. M. &Wallace, D. Assessing the quality of ideas from prolific, early-stageproduct ideation. Journal of Engineering Design 24 (2), 120–139.
Kumar, M. & Garg, N. 2010 Aesthetic principles and cognitive emotion appraisals: Howmuch of the beauty lies in the eye of the beholder? Journal of Consumer Psychology 20(4), 485–494.
Lai, H. H., Chang, Y. M. & Chang, H. C. 2005 A robust design approach for enhancingthe feeling quality of a product: a car profile case study. International Journal ofIndustrial Ergonomics 35 (5), 445–460.
Lapierre, J., Tran-Khanh, A. & Skelling, J. 2008 Antecedents of customers’ desired valuechange in a business-to-business context: theoretical model and empirical assessment.Services Marketing Quarterly 29 (3), 114–148.
Laufer, W. S. 2003 Social accountability and corporate greenwashing. Journal of BusinessEthics 43 (3), 253–261.
Lugo, J. E., Schmiedeler, J. P., Batill, S. M. & Carlson, L. 2015 Quantification of classicalgestalt principles in two-dimensional product representations. Journal of MechanicalDesign 137 (9), 094502.
MacDonald, E. F., Gonzalez, R. & Papalambros, P. 2009a The construction ofpreferences for crux and sentinel product attributes. Journal of Engineering Design 20(6), 609–626.
MacDonald, E. F., Gonzalez, R. & Papalambros, P. Y. 2009b Preference inconsistency inmultidisciplinary design decision making. Journal of Mechanical Design 131 (3),031009.
30/33
available at https://www.cambridge.org/core/terms. https://doi.org/10.1017/dsj.2017.22Downloaded from https://www.cambridge.org/core. Northwestern University Libraries, on 08 Jan 2018 at 21:34:11, subject to the Cambridge Core terms of use,

MacDonald, E. F., Lubensky, A., Sohns, B. & Papalambros, P. Y. 2008 Product semanticsand wine portfolio optimisation. International Journal of Product Development 7(1–2), 73–98.
Maniatis, P. 2016 Investigating factors influencing consumer decision-making whilechoosing green products. Journal of Cleaner Production 132, 215–228.
Miller, C.,McIntyre, S. &Mantrala, M. Journal of Marketing Research 30 (2), 142–157.Nagamachi, M. 1995 Kansei engineering: a new ergonomic consumer-oriented
technology for product development. International Journal of Industrial Ergonomics15 (1), 3–11.
Nass, C., Jonsson, I. M.,Harris, H., Reaves, B., Endo, J., Brave, S. & Takayama, L. 2005Improving automotive safety by pairing driver emotion and car voice emotion. InCHI’05 Extended Abstracts on Human Factors in Computing Systems, pp. 1973–1976.ACM.
Noort, G. V., Kerkhof, P. & Fennis, B. M. 2008 The persuasiveness of online safety cues:the impact of prevention focus compatibility of Web content on consumers’ riskperceptions, attitudes, and intentions. Journal of Interactive Marketing 22 (4), 58–72.
Oblinger, D. 2003 Boomers, gen-xers, and millennials: understanding the ‘new students’.Educause Review 38 (4), 36–45.
Orbay, G., Fu, L. & Kara, L. B. 2015 Deciphering the influence of product shape onconsumer judgments through geometric abstraction. Journal of Mechanical Design137 (8), 081103–081104.
Orsborn, S., Cagan, J. & Boatwright, P. 2009 Quantifying aesthetic form preference in autility function. Journal of Mechanical Design 131 (6), 061001.
Orsborn, S., Cagan, J. & Boatwright, P. 2015 Visual conjoint from discrete tocontinuous. In Proceedings of the 20th International Conference on Engineering Design(ICED 15), Milan, Italy, July 27–30, vol. 10, pp. 155–164.
Orth, U. R. &Malkewitz, K. 2008 Holistic package design and consumer brandimpressions. Journal of Marketing 72 (3), 64–81.
Parra, P. A., Kim, H., Shapiro, M. A., Gravani, R. B. & Bradley, S. D. 2014 Home foodsafety knowledge, risk perception, and practices among Mexican–Americans. FoodControl 37, 115–125.
Rand, D. G. 2012 The promise of Mechanical Turk: How online labor markets can helptheorists run behavioral experiments. Journal of Theoretical Biology 299, 172–179.
Reid, T. N., Frischknecht, B. D. & Papalambros, P. Y. 2012a Perceptual attributes inproduct design: fuel economy and silhouette-based perceived environmentalfriendliness tradeoffs in automotive vehicle design. Journal of Mechanical Design 134(4), 041006.
Reid, T. N., Gonzalez, R. D. & Papalambros, P. Y. 2010 Quantification of perceivedenvironmental friendliness for vehicle silhouette design. Journal of Mechanical Design132 (10), 101010.
Reid, T. N.,MacDonald, E. F. &Du, P. 2013 Impact of product design representation oncustomer judgment. Journal of Mechanical Design 135 (9), 091008.
Reisenwitz, T. H. & Iyer, R. 2009 Differences in generation X and generation Y:implications for the organization and marketers. The Marketing Management Journal19 (2), 91–103.
Roosen, J.,Hansen, K. & Thiele, S. 2004 Food safety and risk perception in a changingworld. In 44th Annual Meeting of the Gesellchaft für Wirtschafts- undSozialwissenschaften des Landbaues, Faculty of Agriculture and Horticulture, pp.27–29. Humboldt-Universität zu Berlin.
31/33
available at https://www.cambridge.org/core/terms. https://doi.org/10.1017/dsj.2017.22Downloaded from https://www.cambridge.org/core. Northwestern University Libraries, on 08 Jan 2018 at 21:34:11, subject to the Cambridge Core terms of use,

Saleh, A. M.,Darawad, M. W. & Al-Hussami, M. 2015 The perception of hospital safetyculture and selected outcomes among nurses: an exploratory study. Nursing & HealthSciences 17 (3), 339–346.
Schmitt, R., Köhler, M.,Durá, J. V. &Diaz-Pineda, J. 2013 Objectifying user attentionand emotion evoked by relevant perceived product components. Journal of Sensorsand Sensor Systems 3 (2), 315–324.
Shanker, A. 2012 Q&A. What is customer value and how do you deliver it? TechnologyInnovation Management Review 2 (2), 32–33.
She, J. &MacDonald, E. 2014 Priming designers to communicate sustainability. Journalof Mechanical Design 136 (1), 011001.
Sheller, M. 2004 Automotive emotions feeling the car. Theory, Culture & Society 21 (4–5),221–242.
Shende, V. 2014 Analysis of research in consumer behavior of automobile passenger carcustomer. International Journal of Scientific and Research Publications 4 (2), 1–8.
Smith, K. T. & Brower, T. R. 2012 Longitudinal study of green marketing strategies thatinfluence millennials. Journal of Strategic Marketing 20 (6), 535–551.
Stisser, P. 1994 A deeper shade of green. American Demographics 16 (3), 24–29.Sullivan, G. L. & Burger, K. J. 1987 An investigation of the determinants of cue
utilization. Psychology and Marketing 4 (1), 63–74.Swamy, S.,Orsborn, S.,Michalek, J. & Cagan, J. 2007 Measurement of headlight form
preference using a choice based conjoint analysis. In 2007 Proceedings of the ASMEInternational Design Engineering Technical Conferences and Computers andInformation in Engineering Conference, vol. 6, pp. 197–206.
Sylcott, B., Cagan, J. & Tabibnia, G. 2014 Understanding consumer tradeoffs betweenform and function through metaconjoint and cognitive neuroscience analyses.Journal of Mechanical Design 135 (10), 101002.
Sylcott, B.,Michalek, J., Cagan, J. & Tabibnia, G. 2015 Exploring the role of interactioneffects in visual conjoint analysis. Journal of Mechanical Design 137 (9), 094503.
Sylcott, B.,Orsborn, S. & Cagan, J. 2014 The effect of product representation in visualconjoint analysis. In ASME 2014 International Design Engineering TechnicalConferences and Computers and Information in Engineering Conference, pp.V02AT03A014–V02AT03A014.
Thomas, J. &Walton, D. 2007 Is bigger better? Vehicle size and driver perceptions ofsafety. International Journal of Sustainable Transportation 2 (4), 260–273.
Tovey, M. 1992 Intuitive and objective processes in automotive design. Design Studies 13(1), 23–41.
Tseng, I., Cagan, J. & Kotovsky, K. 2012 Concurrent optimization of computationallylearned stylistic form and functional goals. Journal of Mechanical Design 134 (11),111006.
Tseng, I., Cagan, J., Kotovsky, K. &Wood, M. 2013 Form function fidelity. Journal ofMechanical Design 135 (1), 011006.
Turrentine, T. S. & Kurani, K. S. 2007 Car buyers and fuel economy. Energy Policy 35 (2),1213–1223.
Tversky, A. & Kahneman, D. 1974 Judgment under uncertainty: heuristics and biases.Science 185 (4157), 1124–1131.
U.S. Department of Energy 2016 U.S. HEV Sales by Model, https://afdc.energy.gov/data/10301, Last updated on January 2016.
32/33
available at https://www.cambridge.org/core/terms. https://doi.org/10.1017/dsj.2017.22Downloaded from https://www.cambridge.org/core. Northwestern University Libraries, on 08 Jan 2018 at 21:34:11, subject to the Cambridge Core terms of use,
U.S. Environmental Protection Agency 2013 Light-Duty Automotive Technology,Carbon Dioxide Emissions, and Fuel Economy Trends: 1975 Through 2013. https://www.fueleconomy.gov/feg/pdfs/420r13011_EPA_LD_FE_2013_TRENDS.pdf,Technical Report, December 2013.
Valencia-Romero, A. & Lugo, J. E. 2016 Part-worth utilities of gestalt principles forproduct esthetics: a case study of a bottle silhouette. Journal of Mechanical Design 138(8), 081102.
Vrkljan, B. H. & Anaby, D. 2011 What vehicle features are considered important whenbuying an automobile: an examination of driver preferences by age and gender.Journal of Safety Research 42 (1), 61–65.
Wenzel, T. & Ross, M. 2008 The relationship between vehicle weight/size and safety. InPhysics of Sustainable Energy: Using Energy Efficiently and Producing It Renewably (ed.D. Hafemeister, B. Levi, M. Levine & P. Schwartz), pp. 251–265. Melville.
White, J. 2014 One thing isn’t new in car design: clay prototypes. The Wall Street Journal,published on June 1, 2014. http://www.wsj.com/articles/one-thing-isnt-new-in-car-design-clay-prototypes-1401473645.
Woodruff, R. B. 1997 Customer value: the next source for competitive advantage. Journalof the Academy of Marketing Science 25 (2), 139–153.
Yumer, M. E., Chaudhuri, S.,Hodgins, J. K. & Kara, L. B. 2015 Semantic shape editingusing deformation handles. ACM Transactions on Graphics (TOG) 34 (4), 86–97.
Yusof, J. M., Singh, G. K. B. & Razak, R. A. 2013 Purchase intention ofenvironment-friendly automobile. Procedia – Social and Behavioral Sciences 85,400–410.
33/33
available at https://www.cambridge.org/core/terms. https://doi.org/10.1017/dsj.2017.22Downloaded from https://www.cambridge.org/core. Northwestern University Libraries, on 08 Jan 2018 at 21:34:11, subject to the Cambridge Core terms of use,