the impact of wto accession on economic and trade · the impact of china’s wto accession on trade...
TRANSCRIPT
The Impact of China’s WTO Accession on Trade and Economic Relations across the Taiwan Strait
Zhi Wang*
Economic Research Services U.S. Department of agriculture
Abstract
This paper evaluates the impact of China’s WTO accession on trade and economic
relation across the Taiwan Strait and its implications for rest of the world by a recursive dynamic, 17-region, 25-sector computable general equilibrium (CGE) model according to actual market access commitments that China and Taiwan have made to date. The simulation results show that both China and Taiwan will substantially benefit from their WTO memberships, and their economic interdependence and their dependence with rest of the world will further deepen. The rest of the world may also benefit because of the expansion of world trade and improvement of their international terms of trade, but some developing countries with a endowment structure similar to China, like those in South America and Southeast Asia, may experience keener competition in labor-intensive exports and lower prices for their products. JEL Classification Numbers: F1, F02, C68, P52.
* Zhi Wang is an economist at the Economic Research Services, United State Department of Agriculture. Corresponding address: Room 5141, 1800 M Street, N.W. Washington D.C 20036-5831. Tel:(202)694-5242. Fax:(202)694-5793. E-mail: [email protected]. Views expressed in this paper are those of the author and do not represent the opinions of USDA/ERS.
2
I. Introduction
Taiwan has long been an active player in the world economy and an important trader in the global
market. Its total volume of exports and imports reached $148 billion and $140 billion respectively in
2000. With more than two decades of market-oriented reform, China has also advanced rapidly in
international trade. Its trade volume has grown from $38 billion in 1980 to $474 billion in 2000, doubling
more than three times in two decades, far faster than world trade growth as a whole during the same
period. China, Hong Kong, and Taiwan have been among the fifteen largest trading regions in the world
since 1992. The total external trade of these three Chinese economies reached $810 billion in 1999 (after
minus $137 billion intra-regional trade), far exceeding the total trade of Japan ($731 billion) and equaling
to nearly half of that of the United States. Their roles in the world economy will likely grow as the
integration among the three Chinese economies intensifies by the recent re-unification of Hong Kong and
Macao with China and the anticipated accession to the World Trade Organization (WTO) by both China
and Taiwan.
In spite of huge political differences, complementary factor endowment and mutual economic
interests, geographical proximity and cultural affinity, plus the efficiency of Hong Kong as a "commercial
middleman,” have enabled China and Taiwan to develop a rather intense trade and investment linkages in
the past 15 years. The indirect trade between Taiwan and China increased from less than $1 billion in
1987 to nearly $26 billion in 19991. The dependence of Taiwan’s exports on China and Hong Kong’s
market increased dramatically from less than 8 percent in 1987 to 26 percent in 1997. Cross-Straits trade
has become the major source of Taiwan’s trade surplus in recent years. Surplus with China has exceeded
Taiwan’s total trade surplus every year since 19932, and China has become Taiwan’s second largest
export market, next only to the United States. Taiwan has also become the second largest import source
for China next only to Japan since then. The rapid growth of indirect trade was fueled by Taiwan’s direct
investment in China. The actually used direct investment from Taiwan reached $26.5 billion by the end of
June 2000 and accounted for more than 40 percent of Taiwan’s total overseas investment3. While nearly
60% of China's total FDI inflow during the reform period comes from Taiwan and Hong Kong.
1. Based on Monthly Report of Cross-Straits Economic Statistics, August, 2000, p.22. Council for Mainland Affairs, Taipei, ROC.
2. Based on Monthly Report of Cross-Straits Economic Statistics, August 2000, p.22. Council for Mainland Affairs, Taipei, ROC. 3. Monthly Report of Cross-Straits Economic Statistics, August 2000, p.26 and p.29. Council for Mainland Affairs, Taipei, ROC. The number was based on data from Ministry of Foreign Trade and Economic Cooperation, PRC , while the investment approved by Ministry of Economic affair ROC was $15.8 billion. However, even PRC’s figure

3
Although political tension over the issue of sovereignty promises no easy solution, economic
relations between China and Taiwan are expected to improve further after the two economies enter the
WTO. The increasingly deepening economic tie driven by market forces between the three Chinese
economies may eventually bond them into a common market exemplified by the West European
experience (Cheng, 1998). The world is very likely, therefore, to witness the gradual emergence of a
Chinese Economic Area (CEA) in East Asia. It would contain an array of potential markets that far
exceed that of Europe and has the potential for providing a principal engine of world economic growth in
the new century.
Trade between China and Taiwan, even indirectly go through Hong Kong, is still highly regulated
today. For example, as of the end of 2000, only 56 percent (or 5,777 items) of 10,238 10-digit
commodities under the Harmonized Tariff Schedule (HS) system are permitted to be imported from China
to Taiwan. However, in order to fulfill their membership requirements to the WTO, both China and
Taiwan have to implement their commitment to adopt broad and deep trade liberalization measures to
bring their trade regimes consistent with WTO rules, including de-regulating cross Straits trade and
investment. Implementation of these liberalization measures implies a substantial reduction in tariffs and
non-tariff barriers across all economic sectors and across Straits in one of the world's largest and most
rapidly expanding markets. Obviously, its impact on structure of production and import demand in both
economies will have significant effects on trade patterns across the Taiwan Straits as well as trade
relations between the emerging Chinese Economic Area and its major trade partners. World trade patterns
and production structures in rest of the world will have to adjust to accommodate such changes. What
opportunities will the growing and liberalizing of Chinese markets likely bring to Taiwan and other
countries in the world? What challenges will the rest of the world have to face as the tremendous low-
cost Chinese labor force is integrated into the world economy? How will the increase in the export
competitiveness of Chinese products affect world markets? Who will gain? Who will lose? What are the
geographical and sectoral distributions of these gains and losses? To answer these questions, I used a 17-
region, 25-sector recursive dynamic Computable General Equilibrium (CGE) model with import
embodied technology transfer to estimate the differences in world trade and economic growth under
alternative scenarios of the world trade liberalization with or without China’s and Taiwan’s participation.
The model includes China's and Taiwan’s major trading partners in both developed and developing
might underestimate Taiwan’s “real” investment in China because many Taiwan business began in the mid-90s to investment in China through their holding companies in third tax-exempt countries such as British Central America (Tung, 2001).
4
countries and covers major production and trade activities in the world economy from 1997 to 2010.
Simulation results show that both China and Taiwan will substantially benefit from their WTO
memberships. Their economic structures and trade flows across the Taiwan Strait will undergo substantial
changes. The economic interdependence between China and Taiwan and their interdependence on rest of
the world will further deepen and integration of the two economies will accelerate after both of them enter
the WTO. By viewing China’s and Taiwan’s future development in a comparative world economic
system, this analysis shows that economic integration across the Taiwan Straits is an unavoidable trend
driven by market forces. It will not only benefit Chinese Economic Area as a whole, but will also
consistent with the long-term strategic interest of the United States.
The rest of the paper is organized as follows: the next section outlines the basic structure of the
model used in the analysis. Section 3 provides an economic analysis of production factor endowments and
comparative advantages of China, Taiwan and their major trade partners, while also introduces the data
used in the model. Section 4 describes major assumptions about calibrating the baseline and designing the
simulation scenarios. Major simulation results are presented and discussed in Section 5. Section 6
concludes the paper with its major policy implications.
II Structure of the model
The model used in this paper is an extension of the CGE models used in the China’s WTO
accession study by Wang (1997a, 1997b, 1999) with import embodied technology transfer and trade policy
induced TFP growth. It is part of a family of models used widely to analyze the impact of global trade
liberalization and structural adjustment programs. It focuses on the real side of the world economy and
incorporates considerable detail on sectoral output and real trade flows, both bilateral and global.
However, this structural detail is obtained at the cost of not explicitly modeling financial markets, interest
rates, and inflation. While not designed to generate short-term macroeconomic forecasts, the model could
be linked to a macro economic model including asset flows and generating macro scenarios. Given a
macro scenario, however, this model could then be used to determine the resulting real trade flows and
sectoral structural adjustments for each region in a recursive dynamic framework. Under assumptions for
a likely path of future world economic growth, it generates the pattern of production and trade resulting
from world economic adjustment to the shocks specified in the alternative scenarios.
In this study, 17 fully endogenized regions and 25 production sectors in each region are specified to
represent the world economy. The 17 regions are: (1) the United States, (2) Canada, (3) West Europe (4)
Japan, (5) Australia and New Zealand, (6) Mexico, (7) Korea, (8) Singapore, (9) Taiwan, (10) Hong
Kong, (11) China, (12) South East Asia (ASEAN, includes Malaysia, Thailand, Philippines, Indonesia,
5
and Viet Nam), (13) South Asia (Indian, Bangladesh, Nepal, Pakistan, and Sri Lanka), (14) Latin
American MFA restricted countries (Central America and Caribbean, Brazil, Colombia, Peru, Uruguay),
(15) Mid-east and South African MFA restrict countries (Turkey, Botswana, rest of south African custom
Union, and rest of Middle East), (16) Low income South African countries (Malawi, Mozambique,
Tanzania, Zambia, and rest of sub-Saharan Africa) and (17) Rest of the World.
The 25 sectors are: (1) rice, (2) wheat, (3) other grains (4) oilseeds, (5) plant based fiber, (6) other non-
grain crops, (7) livestock, (8) meats and dairy products, (9) processed food, (10) beverage and tobacco, (11)
forestry and fishery, (12) mineral products, (13) energy products (14) textile, (15) wearing apparel, (16) leather,
shoes and sport goods, (17) other light manufactures, (18) wood and paper products, (19) manufactured
intermediates, (20) motor vehicles and parts, (21) other transport equipment, (22) electronic equipment, (23)
other machinery, (24) utility, housing and construction, (25) transportation and traded services, a portion of
which is allocated to international shipping. (The correspondence between sectors in the model, GTAP and ISIC
are listed in Appendix A).
There are six primary factors of production: agricultural land, natural resources, capital,
agricultural labor, unskilled-labor, and skilled-labor. Skilled- and unskilled-laborers have basic education
in common, but skilled-laborers usually have more advanced training. While the agricultural laborers are
those who have little or no education and work only in farm sectors. Natural resources are sector specific,
while other primary factors are assumed to be mobile across sectors, but immobile across regions. Land
is only used in agricultural sectors.
Agricultural labor and urban unskilled labor are not substitutable in production function, but are
linked by rural-urban migration flows. These flows are endogenous in the model and are driven by the
rural-urban wage differential and structural changes in production and trade. The increase in the skilled
labor force is based on the growth in the stock of tertiary educated labor in each region estimated by the
World Bank (Ahaja and Filmer, 1995), which provides an indication of changes in the numbers of those
qualified for employment as professional and technical workers. That is, as tertiary education grows, the
share of skilled labor force will grow correspondingly.
Accumulation patterns for capital stock depend upon the depreciation rate and gross real
investment rate, the later is set exogenously based on forecast from Oxford world macroeconomic model
(Oxford Economic Forecasting, 1999). However, household savings, government surplus (deficit), and
foreign capital inflow (foreign savings) are assumed to be perfect substitutes and collectively constitute
the source of gross investment in each region. Given the assumption that aggregate real investment is
determined as a share of real GDP, changes in the trade balance, which directly affect foreign savings, are
6
assumed to have only a partial effect on aggregate real investment in the region. Instead, they lead to an
equilibrium adjustment in the domestic savings rate, which partially offsets the change in foreign savings.
Household saving decisions are endogenous in the model. It represents future consumption goods
for the household with zero subsistence quantity (by assuming inter-temporal separable preferences,
ELES demand system). Government surplus (deficit) is the difference between government tax revenue
and its spending, the later is fixed as percentage of each regions GDP based on forecast from the Oxford
model. There are no expectations explicitly specified in the model.
Foreign capital inflow or outflow is determined by the accumulation of the balance of trade,
which is also fixed as percentage of GDP in each region based on the Oxford model’s projection except
for the United States. The model does not include financial markets and portfolio investment. The trade
balance is the only sources of foreign savings (can be inflow or outflow). No explicit specification of
Foreign Direct Investment (FDI). However, it is counted by trade flows, because in order to convert FDI
into production capital, technology and equipment have to be purchased via domestic or international
trade.
There are an economy-wide and a set of sector specific TFP growth variables for each region in
the model. The economy-wide TFP variable is solved endogenously in baseline calibration to match a
pre-specified path of real GDP growth in each region based on forecast from the Oxford model. Then the
economy-wide TFP variable is fixed when alternative scenarios are simulated. In such case the growth
rate of real GDP and the sector specific TFP variables that links productivity growth and imports are
solved endogenously.
Similar to Hertel et. al (1995), the MFA quotas rents are assumed to be captured by
exporting countries as export taxes. These export tax rates are adjusted endogenously to equate
with quotas. Such a treatment assumes that all quotas are binding constraints at the equilibrium.
Consistent with this modeling practice, we divide developing countries subject to MFA quota
restrictions into quota binding and non-binding regions4 based on historical trade statistics.
Quantity constraints only apply to those regions with binding quotas.
4. There are eleven developing regions in the model, nine of them are subject to binding MFA quotas. They are Korea, Singapore, Taiwan, Hong Kong, China, ASEAN, South Asia, Latin America MFA restricted countries, Mid-east and Africa MFA restricted countries. While Low income Africa countries and rest of the world are modeled as MFA quota non-binding countries.
7
III Basic economic force shapes trade patterns between China, Taiwan and rest of the world
The CGE model used in this analysis was calibrated around a world Social Accounting Matrix (SAM)
estimated for 1997 based on version 5 (pre-release) of the Global Trade Analysis Project (GTAP) database
(Hertel, 1997). Details of this type of multi-regional SAM and its construction from the GTAP database are
described in Wang (1994).
This section analyzes fundamental economic forces shaping production and trade patterns among
China, Taiwan and their major trade partners based on information of factor endowments, structure of net
trade contained in the base year data. The purpose of this data based analysis is to provide an overview of
China’s and Taiwan's comparative advantages in the world economy, and trade linkages between them
and their major partners so as to facilitate the understanding of simulation results reported later in this
paper.
3.1 Structure of factor endowment
Table 1 presents the data on factor endowments, intensity, cost, and the relative size of the
economic regions included in the model. It shows that the five high-income OECD regions (USA, Japan,
West Europe, Canada, and Australia/New Zealand) account for less than 15 percent of the global labor
force, but possess more than 70 percent of the world’s capital stock. In contrast, more than 60 percent of
the global labor force with just 6 percent of the world’s production capital resides in the four largest low-
income developing regions (China, South Asia, ASEAN, and low income South Africa). The five high-
income OECD regions are also relatively abundant in skilled-labor, since their skilled labor share in the
world is one or two times more than their world share of total labor force, while the same share is much
smaller relative to their total labor endowment in China, ASEAN, South Asia and Africa. Japan, Korea,
Taiwan, Hong Kong, Singapore, and China are poorly endowed with arable land relative to labor.
Conditions are just the opposite in the United States, Canada, and Australia/New Zealand where land is
abundant and cheap. Western Europe, Mexico and Latin American MFA restricted countries, ASEAN
and South Asia have intermediate amount of arable land per worker and are between the two extremes.
(Insert table 1 here)
Uneven distribution of factor endowments induces wide differences in factor intensities and costs
among regions. Because China, ASEAN, South Asia and other developing countries are poorly endowed
with capital relative to labor, they have the lowest capital intensity (capital stock per worker), the largest
shares of unskilled labor in their total labor force, and the highest rental-wage ratios. The reverse is true
for the five high-income OECD regions. Korea, Singapore, Hong Kong and Taiwan, as newly

8
industrialized economies, fall somewhere between the advanced industrial countries and those developing
countries. They are at a stage of development between the advanced industrial countries and most other
developing countries. This is indicated by the fact that they either have a lower capital intensity or a
higher rental-wage ratio. Their skilled labor share is larger than low-income developing countries, but
only about one half that of high-income developed regions. Their labor costs are only a half or a third of
high-income countries, but much higher than those of low-income developing regions (Table 1).
Japan, Korea, Taiwan, Singapore, and China are poorly endowed with arable land relative to
labor. Therefore, they have the lowest land/labor intensities (arable land per worker) and relatively higher
land returns (relative to labor and capital) compared with other regions. This condition is just the opposite
in the United States, Canada and Australia/New Zealand. Land as an abundant factor earns a relatively
lower return there. These factor endowment differences are quite important for understanding net trade
flows across regions based on conventional trade theory.
3.2 Net trade patterns
Trade theory suggested that world trade patterns are determined by the relative costs in delivering
commodities by trading nations. Although many factors, such as distance, technical efficiency, prices of
intermediate inputs, etc., may influence such costs, the relative scarcity of factor endowments is the most
basic determinant. A country tends to export commodities that require relatively intensive use of the
country's relatively abundant factors of production, and tends to import commodities that use its scarce
production factor intensively. In other words, the direction of net trade flows is a function of the relative
factor-intensity of production, and the relative factor scarcities among countries. The scarcer the
production factors, the higher the cost in production.
Table 2 presents data on sectoral net trade by region in the base year. It shows that the United
States, Canada, Australia/New Zealand, and Rest of the World as land abundant regions, are net exporters
in almost all food and agricultural products, especially those land intensive products such as grains, cotton
and oilseeds. Japan, Korea, Singapore, Taiwan and Hong Kong, as land scarce economies, are net
importers of all food and agricultural products. Western Europe, Mexico, South Asia, Latin American,
Mideast and African MFA restricted countries, with intermediate land endowments, are net exporters and
net importers of different agricultural products. The European countries are net exporters of meat and
milk products, beverages, and processed food, but net importers of land intensive products. Mexico,
ASEAN, South Asia and Latin America MFA restricted countries are net exporters of non-grain crops,
and process food, which are often labor-intensive, but net importers of land-intensive agricultural
products.
9
China also seems consistent with this pattern as its market forces play a more and more import
role in determining production and trade driven by its market oriented economic reform. As a land scarce
economy, it is a net importer of land intensive agricultural products, but a net exporter of labor-intensive
agricultural commodities such as non-grain crops. The on-going domestic economic reform and trade
liberalization as China implements its WTO commitment, will reinforce market forces and further push
China’s agricultural production and trade away from its current grain self-sufficiency policy in the years
to come.
(Insert table 2 here)
The net trade data in Table 2 also demonstrate that labor-intensive manufactured goods (textile,
apparel, leather & shoes, and other light manufactures) and natural resource based products are the major
net imports for the United States, Japan and Western Europe, while capital and skill-intensive
manufactures (manufactured intermediates, motor vehicles, machinery and other transport equipment) are
their major net exports (except for the US in motor vehicles because of its deficit with Japan). The trade
patterns of China and other labor abundant economies such as ASEAN, South Asia, and other MFA
restricted developing countries exhibit some similarities. They are net exporters of labor-intensive
manufactured goods and net importers of capital-intensive manufactured goods. The largest share of the
trade surplus for both China and South Asia comes from light manufactured products ($68 and $23 billion
respectively), while trade surplus in ASEAN countries is more diversified. Electronics, processed food as
well as forest & wood products also contribute a significant portion of their net trade, although labor-
intensive manufactures are also a large trade surplus sector ($21 billion) in the region. At an intermediate
level of capital intensity, Taiwan, Korea, Singapore, and Mexico, are net suppliers and net demanders of
different skill/capital-intensive manufactured goods, while remaining net exporters of labor-intensive
manufactured goods. However, upstream products such as textiles, are a major portions of their net
exports of such products, with more labor intensive exports such as apparel playing less and less role as
they further shift such production to China and other developing countries.
3.3 Comparative position of China and Taiwan in the world economy
The factor endowment and net trade data in the base year reviewed above provides detailed
information on trade patterns between China, Taiwan, and their major trade partners. The impression
given by the data is generally consistent with intuition about these economies based on conventional
international trade theory. At one extreme, China and other labor abundant developing countries are seen
as major competitors in labor-intensive manufactured exports and important importers of

10
capital/technology-intensive products for their modernization program. At the other extreme, Japan,
Western Europe, and the United States are seen as major suppliers of capital/technology-intensive goods
and as the final market for labor-intensive consumer products. Taiwan and other newly industrialized
economies (NIEs) are seen as intermediate between the two extremes. They are important suppliers of
manufactured goods to China and other developing countries, and become both demanders and suppliers
of technology/capital-intensive products from Japan, European Union and the United States, while still
remaining important suppliers of labor-intensive goods for industrial countries.
Numerous studies (Gereffi, 1998) noticed the important role that Asian NIEs have played in the
system of global division of labor along a world commodity production chain that spans many economies,
with each economy performing certain tasks in which it has a comparative advantage. The developed
countries usually provide high-technology software and hardware for the NIEs because of their supper
R&D capabilities. In turn, the NIEs provide intermediates and capital goods for their directly invested
firms in developing countries because of their manufacturing technology and management expertise,
while developing countries produce and export finished goods such as apparel or electronic products to
developed countries because of their cheap labor and raw materials.
Obviously, industrial countries such as the United States and China are generally not competing
economically for international trade at their current stage of development because their comparative
advantages differ greatly. Their different factor endowment structures and difference in technology
development make their trade complementary. Other developing countries compete with each other
and with China for exporting labor-intensive goods and electronic products in industrial countries, and
compete to attract FDI from those countries. Similarly, Japan, Western Europe, and the United States
compete to meet the demand for the technology/capital-intensive goods markets in China and other
developing countries, and to benefit from investment opportunities there.
The structure of factor endowments in China, Taiwan and their major trading partners as well as
their position in the system of the world division of labor is also the basic economic force shaping the
direction of impact of China’s and Taiwan’s WTO entry on world production and trade. Joining the
WTO, especially when industrial countries eliminate restrictions on imports of labor-intensive
manufactures such as textile and apparel from China, would further realize China’s comparative
advantage in producing such goods and increase its net exports. The expansion of labor-intensive
manufactures in China would cause resources to be bid away from farming and drive up demand for
agricultural and capital/technology intensive goods. This would increase China’s net agricultural and
capital/technology intensive imports and push up world market prices for such products. The opposite
11
impact would occur to most developed economies because of their different endowment structures.
Developing countries whose endowment structures are similar to China’s will encounter keener
competition in the world labor-intensive goods markets and face lower prices for their exports.
The impact of China’s and Taiwan’s WTO accession is also affected by China’s and Taiwan’s
current import protection structure and the structure of tariff cut in their WTO offers (which is listed in
Table 4a and 4b respectively). The larger the initial distortion, the deeper the tariff cuts in the offers, the
greater the induced impact. However, the relative factor scarcity and intensity in production discussed
above are the more fundamental force driving the impact and its resulted adjustment pattern in the world
economy. Production resources will be released from those previously highly protected industries in
China and Taiwan, and draw into sectors where China and Taiwan have comparative advantages, thus
enabling them to become more efficient suppliers in the world manufacture goods market.
IV. Baseline Calibration and Simulations Design
Both China’s and Taiwan’s market accession commitments for WTO membership include a
complex package of trade and investment liberalization measures. In this paper, however, only the
following five aspects are considered: (1) tariff reduction in both agricultural and manufacturing products
(China and Taiwan); (2) elimination of non-tariff barriers in manufacturing sectors (China and Taiwan);
(3) reduction of non-tariff barriers in agricultural commodities and liberalization of import quota on
agricultural products (China and Taiwan). The accelerated growth of import quota of rice in Taiwan and
wheat and plant based fiber in China, and elimination of such quotas in 2005; (4) opening of major
service sectors (China); and (5) the phase out of MFA quotas on textile and clothing (China and Taiwan).
Once China and Taiwan become members of the WTO, their exports in textile and apparel in North
America and European markets will be subject to accelerated MFA quota growth from 2001-2004 similar
to other developing countries that are WTO members. The remaining quota restrictions will be eliminated
at the year 2005 according to the Agreement on Textiles and Clothing (ATC)5.
Because both China’s and Taiwan’s market accession commitments to WTO entry will be phased
in over a transition period, a baseline from 1998-2010 is established first as Scenario I (the Uruguay
Round Case) under a set of assumptions. It generates a reference growth path of the world economy with
the implementation of the Uruguay Round trade liberalization, but without China’s and Taiwan’s
5 On January 1, 1995, the ATC entered into force and replaced the old Multi Fiber arrangements (MFA). The ATC
provides for the elimination of the quotas and the complete integration of textiles and apparel into the WTO regime
12
participation. This calibrated “benchmark” will serve as a basis of comparison for counterfactural
simulation conducted in Scenario II.
Table 3 summarizes the major macro economic assumptions and results from the baseline
calibration. It uses the economy-wide TFP variable in each region as a residual and adjustment
mechanism to match the pre-specified real GDP growth rate under assumptions on the three major macro
economic variables (gross investment, government spending, and balance of trade) in the model. It
incorporates the impact of the recent Asian financial crisis by imposing actual negative GDP growth
during 1998-1999 and current account surplus of the affected regions. All the three macro-variables from
2000-2010 are specified as percentages of GDP and are based on forecasts by the Oxford model. China’s
imports of wheat and plant-based fiber and Taiwan’s imports of rice are subject to quota control with a 3
percent annual growth rate. Those quotas are also assumed to be binding and a NTB rate adjusted
endogenously to clear the market6. Because China and Taiwan are excluded from the WTO under this
scenario, their exports in textile and clothing are subjected to a constant growth in MFA quotas and the
quantity restriction continues after 2005. All other MFA quota restricted regions are subjected to
accelerate quota growth and the termination of the quota system in 2005. The base quota growth rates are
calculated from bilateral data provided by the International Textiles and Clothing Bureau in Geneva. The
annual quota growth rate is 25 percent higher for WTO members during 1998-2001 than quota growth
rate in 1995-1997, then an additional 27 percent is applied to the last three years of ATC implementation.
(Insert Table 3 here)
In Scenario II (the Accession Case), all the macro economic assumptions and exogenous growth
factors are the same as in Scenario I, but with both China and Taiwan joining the global trade
liberalization process. The extent of China's tariff reduction is aggregated from the Harmonized
Commodity Description and Coding System (HS) tariff schedules at the 6-digit level based on the US-
China agreement (November, 1999) and weighted by 1998 import data from China's Customs. The import
quotas for wheat and plant fiber is assumed to grow at a 5 percent annual rate and will be eliminated at
the year 2005, and replaced by a 15 percent uniform tariff. Taiwan’s tariff reduction is based on Taiwan’s
official WTO offer provided by its council of Agriculture. It is also aggregated from the 6-digit HS tariff
schedules and weighted by Taiwan’s import data during 1997-2000 from the World Trade Atlas. All non-
tariff barriers of manufacturing products in both China and Taiwan are reduced by 20 percent each year
over a 10-year transition period ending on January 1, 2005. All WTO countries are subject to ATC disciplines, and only WTO members are eligible for ATC benefits.

13
from 2001 and set to zero in 2005, while non-tariff barriers of agricultural commodities are reduced 10
percent a year and eliminated to zero in 2010. A 50 percent cut in protection on traded service sector is
also implemented to represent the opening of major service sectors in China’s WTO offer. The base year
service sector protection rate in China was adopted from Hoekman (1995). Both China’s and Taiwan’s
tariff rates for all sectors each year in the simulation period and China and Taiwan’s initial NTB rates are
listed in Table 4a and 4b. Because China and Taiwan become WTO members under this scenario, their
exports of textile and apparel are subjected to the same treatment as other developing countries.
(Insert Tables 4a and 4b here)
It is well known that China’s tariff collection is significantly below its normal tariff level because
of a large volume of processed trade and extensive import duty exemptions. By 1998, more than 50
percent of all imports in China were inputs used in production of exports and exempted from tariff
collections. This implies that the Chinese economy is more open than it seems and the exiting import
restriction has been largely lifted prior to China’s WTO accession. Several studies have shown that
without accounting the presence of duty exemptions in China’s trade regime leads to serious overestimate
on the impact of China’s WTO entry at both aggregate and sectoral levels (Ianchovichina, Martin and
Fukase 2000, Lejour, 2000). By using 1998 China’s Custom Statistics, I incorporated China’s processing
trade and duty exemption pattern by sectors and by import sources into simulation design, which scale
down the tariff level by routine specific information. The tariff rates in the lower panel of Table 4a are the
tariff level that take duty exemption into consideration, which are substantially lower than normal tariff
(listed in the up panel of Table 4a) and is much closer to China’s actual tariff collect rate at the aggregate
level.
For each of the two scenarios, the CGE model generates results regarding the effects on social
welfare, terms of trade, the volume of trade, output, consumption, the real wages paid to each factor, and
changes in prices and resource allocation. The differences in results generated by the two simulation
scenarios provide estimates of the impact of China’s and Taiwan’s accession to the WTO. However, those
estimates should be regarded as outcomes from conditional projections rather than as forecasts. In reality,
actual trade and output patterns are affected by many more factors than just trade liberalization, such as
domestic macroeconomic and income policy changes.
6 Martin (2001) used China’s average historical import levels from 1961-1997 as a guide, pointed out wheat imports
would be subject to import quotas relatively frequently, maize imports less frequently, and rice imports very infrequently.

14
V. Simulation results
5.1 Impact on trade patterns between China, Taiwan and their major trade partners
Figure 1 shows the time path of net trade flows in agricultural, labor-intensive and capital-
intensive products for China during the simulation period under the two scenarios. Even excluded from
the WTO, China’s net exports of labor intensive products and net import of food and agricultural products
will continue to increase because of China’s rapid industrialization and population growth. WTO
accession will accelerate this trend. The annual growth rate of China’s net exports in labor-intensive
goods will increase from 3.3 percent to 6 percent. Its net food and agricultural imports annual growth rate
will increase from 22 percent to 26 percent, resulting in an additional $166 billion net exports in labor-
intensive manufactures and $73 billion additional net imports in food and agricultural products during the
10 year simulation period (Table 5). In the same period, China's net imports in capital-intensive products
will increase by $7 billion because of its WTO accession (Table 5), although there is a general declining
trend in China’s net capital-intensive imports over time under both simulation scenarios. It is interesting
to note from Table 5 that China’s net exports on three categories of finished capital-intensive
manufactured goods will increase during the 10-year simulation period. They are electronics ($23 billion),
machinery ($42 billion) and other transportation equipment ($19 billion), and those products would
replace part of net exports previously from OECD countries. At the same time, China’s net imports on
manufactured intermediates will dramatically increase by $74 billion, especially from Japan, United
Sates, Taiwan and other Asia NICs. This pattern of net trade changes is consistent with the important
character of China’s manufacturing exports: it is dominated by processing trade with high imported
contents fueled by FDI inflow. Firms in U.S., Japan and Asian NICs provide China with intermediate and
capital goods accompanied with their FDI to China, and China serves as the production and assembling
base for those countries and export finished final products to developed country markets. In the earlier
stage of China’s economic reform, it is concentrated in the labor-intensive sector and now is happening in
the above mentioned three categories of capital intensive products7. (Insert figure 1 and Table 5 here)
Where would those additional net labor-intensive exports from China go and where would those
additional net imports in food and agricultural products by China come from? Table 5 shows that part of
those increased labor intensive exports from China will go to markets in industrial countries, where
import demand increases because of the elimination of MFA quotas, while part of them are substitutes of
15
net exports originally from other MFA restricted developing countries in Asia and Latin America (more
than 70 percent). Table 5 also shows that a large part of those increased net imports of land-intensive
agricultural products to China after it joins the WTO will come from land abundant developed countries
such as Australia, Canada and the United States. However, a significant portion (about a third) of them
will come from other developing countries. The major underlying reason is that China’s entry to the WTO
diverts exports of labor-intensive products from other developing countries to China. The labor-intensive
sectors in those regions cannot attract as many production resources as they could when WTO excludes
China and Taiwan because of reduced profitability from lower world prices for their manufacturing
exports. Therefore, more factors of production will remain in those countries’ agricultural sectors. At the
same time, the increased agricultural import demand from China and Taiwan pushes up world food
prices, agricultural exports become relatively profitable and agricultural imports become relative
expensive. It results in an expansion of production and exports of agricultural products in those countries
(remember most of those countries have an intermediate agricultural land endowment, i.e. they have a
higher land/labor ratio than China’s). However, the increase of production in labor-intensive sectors in
China also demands more manufactured inputs from the world market, causing the manufacturing sector
to expand and agriculture production to decline in Japan, Korea and Taiwan, thus increasing these
countries’ net import demand for food and agricultural products, as shown in Table 5. Another
underlying reason for this disparity other than relative scarcity of agricultural production factors in those
countries is that they are in a higher stage of economic development and have the technology to produce
what China’s manufacturing sector demands. Because of their lower stage of economic development,
most developing countries do not have such capacities or are not able to produce what China’s
manufacture sector needs at a competitive cost.
Why does China’s net imports in capital-intensive products show a declining trend over time in
both simulation scenarios (Figure 1)? It indicates that exports in some capital-intensive products from
China are rising and there is an industrial upgrade process going on as China continues to grow and
industrialize. There are three fundamental factors that contribute to this trend. First, there are quantitative
constraints such as MFA quotas in developed countries’ markets that limit China’s growth potential in
producing labor-intensive products and cause China to divert its production resources to other
manufacturing activities, including capital-intensive sectors. Second, China was undergoing rapid
investment growth and capital accumulation during the last decade. During 1991-2000, China was the
7 Based on China Custom statistics, 93 percent of China’s electronic equipment exports was process exports in
1998, while the numbers for other machinery and other transport equipment were 71 and 77 percent respectively.
16
largest FDI recipient among developing countries, with over $320 billion FDI inflows. The direct impact
is the booming of capital-intensive manufacturing industries. As trade theory points out, an increase in the
supply of capital will lead to an increase in the output of the sector which uses capital intensively, and a
reduction in the output in other sectors that use other factors intensively (Rybczynski theorem). Finally,
as mentioned earlier, China’s manufacturing exports usually contain very high import contents with low
value-added rates due to the rapid growth of processing trade in recent years, which may exaggerate the
extent of industrial upgrade in China’s exports.8
Joining the WTO cannot fundamentally change this trend because China ultimately will upgrade
its industrial structure during its modernization, as most newly industrialized countries are doing now.
But as both Figure 1 and Table 5 show, joining the WTO will increase China’s net imports in capital-
intensive products about $7 billion over the 10-year simulation period. This is because the expansion of
the labor-intensive sector will bid productive resources away from capital-intensive production on the one
hand, and increase domestic demand for such products on the other hand, causing exports to decline and
imports to increase.
(Insert table 6 and 7 here)
As pointed by Naughton (1995), the adjustment of trade flow among East Asia countries and
between East Asia and developed economies since the late 80’s reflected the reorganization of various
global commodity productions among these countries. The basic trend is intermediate and capital goods
were exported from Asian newly industrialized economies to China, where Chinese workers processed
those intermediate goods into finished products and exported them to the developed countries, especially
the United States. At the same time, exports from East Asia newly industrialized economies to developed
countries have been substituted by exports of their direct investment firms in China and thus dramatically
declined. As a result, for example, Taiwan’s trade with both the United States and China has radically
shifted9. Simulation result shows that this redirection of trade flow will further accelerate after both China
and Taiwan enter the WTO. As shown in tables 6 and 7, which report the differences in exports by
destination and import by source between the two simulation scenarios for both China and Taiwan. With
the reduction of trade barriers, total exports increase significantly for both China and Taiwan during the
10-year simulation period. China and Taiwan trade more with each other and the increased trade is
8 For example, the largest items of electronics exports in 1995 were radio cassette players and telephone sets. They are produced from imported semi-processed materials and assembled by spare parts from abroad for re-exports. The portion of production process conducted in China was basically labor intensive in nature.

17
almost totally concentrated in manufacturing sectors ($18 billion labor-intensive and $52 billion capital
intensive). Such a dramatic increase of trade flows in industrial products reflects that the interdependence
of manufacturing activities across the Taiwan Strait is deepening at an accelerated speed as firms on both
sides are further integrated via input-output linkages. Most of Taiwan’s export expansion to China are
intermediates and capital goods demanded by Taiwanese FDI firms in China, which includes textiles
($14.7 billion), manufactured intermediates ($22.8 billion), electronics ($7.1billions) other machinery and
transport equipment ($8.9 billions). The relatively smaller increase of China’s exports to Taiwan comes
from Taiwan’s current highly restrictive import policy for goods from China on which the model
simulation is based, and there is no non-tariff barrier reduction across the Taiwan Strait is incorporated
into the simulation design. However, even under current restrictive trade across the Strait, trade flows
will increase substantially after both China and Taiwan enters the WTO.
While increasing its exports to China dramatically, Taiwan reduces its labor-intensive exports to
many of its trade partners. More than 90 percent of its increased exports because of WTO accession will
go to China. This is because Taiwan, as a newly industrialized economy, is upgrading its industrial
structure and becoming a strong competitor in the world market for manufactured goods, especially in
electronic products and high-end labor-intensive goods. Even though its manufacturing export expansion
to China reduces its labor-intensive exports to other economies, it increases its exports of capital and
technology intensive goods, especially electronic products to rest of the world (its electronic exports
increase $12 billion, or more than 11 percent over the baseline).
Interestingly, different from what happens in Taiwan, table 7 shows that when China increases its
exports to Taiwan, its exports in labor intensive consumer goods and electronics products to other
countries do not decline but increase dramatically. There is no trade diversion in manufactured products
for China, its exports of manufactured products to other countries increase much rapidly than its sales to
Taiwan. There are two factors contributing to this interesting trade pattern. First, the expansion of imports
of capital and intermediate goods from Taiwan enhances the capacity of China to export manufactured
goods. Second, the manufactured goods from Taiwan to China usually contain a large portion of semi-
processed products and parts for assembling or further processing operations in China, then re-export to
9 In 1986, Taiwan’s exports to the United States accounted for 48 percent of its total exports while Taiwan’s exports
to China accounted for only 2 percent. In 1999, Taiwan’s exports to the United States accounted for 25 percent of its total exports while Taiwan’s exports to China accounted for 18 percent.

18
industrial countries10. The dramatic increase of such products imported from Taiwan further boost
China’s manufactured exports.
It is evident from Tables 6 and 7 that WTO entry would increase the complementary of
manufacturing industries across the Taiwan Strait, allow the combination of Taiwan’s capital and know-
how to efficient use of the huge reservoir of low-cost labor in China, making both China and Taiwan
stronger competitors of manufactured products in the world market. Therefore, there is a simultaneous
expansion of capital and technology intensive production and exports from both China and Taiwan except
for motor vehicle sector, especially for electronics, machinery, and other transportation equipment. It
indicates that WTO entry will facilitate the industrial upgrade process for both economies and enable
them to become a stronger competitor in producing relatively sophisticate manufacture products (such as
computers and motor bicycles) to meet the demand for low-end capital and technology intensive products
from both developed and developing economies. There seems a natural division of labor between
manufacturing firms across Strait: Taiwan firms provide China with intermediates and capital goods, and
China serves as the production base for Taiwan and export finished final products to developed countries’
markets. However, such complementary of manufacturing activities across the Strait has a declining trend
in recent years due to rapid economic growth in the south east coast of China. However, because of the
disparity of economic development over China’s vast inland area, such a complementary relation will
exist for a long time if taking main land China as a whole as our simulation results shown.
Another interesting phenomenon is the dramatic increase of manufactured exports from China to
the United Sates during the 10-year simulation period. It suggests that after China and Taiwan enter the
WTO, the U.S. trade deficit with China may increase. However, the total U.S. trade deficit may not
change very much as show in Table 8 because the reductions of U.S trade deficit with Taiwan and other
Asian countries due to China’s WTO accession. As China exports more finished manufactured products
to the United Sates, it will import more intermediate and capital inputs from Taiwan, Hong Kong, Korea,
and Singapore, increasing its trade deficit with those newly industrialized economies (compare China’s
exports to and imports from those economies in Table 7). Such an adjustment is a continuation of Taiwan,
Hong Kong and Korea shifting their trade surplus with industrial countries to China that started in the late
80’s due to production relocation in East Asia, driven by changing comparative advantages of each
economy within the region. The further increase in NIE’s exports of intermediate and capital goods to
China, the further increase in China’s exports of manufactured finished goods to developed countries and
10. The processing trade (processing and assembling, processing with import materials) was 46.7 percent of China’s total exports in 1995, and more than a half of its exports (55.8 percent) in 1996.
19
low-end durable manufactured products to developing countries, the further decline of NIE’s exports of
labor-intensive finished goods to developed countries, and the further increase of NIE’s high technology
products imports from advanced industrial countries are all the results of such an adjustment process.
China and Taiwan’s WTO entry will further accelerate this process.
Figure 2 shows that Taiwan’s total export dependence on China’s market will increase over time
as the result of economic integration among Chinese Economies driven by market forces regardless China
and Taiwan’s WTO membership. However, entry to the WTO will further increase Taiwan’s export
dependence on China by about 3 additional percentage points, decrease its dependence on U.S. and other
countries’ market, thus enable China exceed the United States become its largest export market. China
will absorb more the half of Taiwan’s labor-intensive exports by 2005 and a quarter of Taiwan’s capital-
intensive exports by 2007 if both China and Taiwan enter the WTO. Overall, Taiwan’s export dependence
on China (29.2 percent) and Hong Kong (3.1 percent) combined will over 32 percent at 2010.11
(Insert Figure 2 here)
5.2 Impact on economic growth in China, Taiwan and their major trade partners
The expansion of trade accelerates economic growth, increases real purchasing power for
households. Table 8 summarizes major aggregate economy-wide effects between a WTO with and
without China and Taiwan. Admitting China and Taiwan into the WTO will accelerate world economic
growth, the average annual growth rate of world real GDP would be 0.02 percentage points higher and the
total accumulated world GDP growth would be 0.22 percentage points higher in 2010 than that in the
baseline scenario. However, the strongest stimulus to economic growth occurs to China and Taiwan.
China's real GDP growth would increase by 0.15 percentage points (0.03 percentage points for Taiwan) a
year from 2001 to 2010, and 2.9 percentage points higher (0.5 percentage points higher for Taiwan) in
2010 than in the case if they are excluded from the WTO. Real GDP growth in all developed countries
and most developing countries also increases from China and Taiwan’s WTO accession. These increases
may seem small in annual terms, however, they are notable if accumulated over the whole simulation
period. By 2010, real GDP would be 0.21 percent higher in the United States and 0.15 percent higher in
West Europe than in the case of a WTO without China and Taiwan. Newly Industrialized Economies such
as Singapore, Hong Kong, and Korea that have closer ties with China and Taiwan will benefit more and
grow faster because of China’s and Taiwan’s WTO accession. Certain developing countries that have a
endowment and export structure similar to China’s, may be slightly negatively affected, especially those

20
MFA quota restricted countries in ASEAN, South Asia and South America12. They have to divert
resources from manufacture to food and agricultural products because stronger Chinese competition
would reduce their potential export shares in the world market. This result, however, may be partially due
to the highly aggregate nature of textile and apparel sectors in the model. They are treated as two
commodities. In the real economy, there are thousands of types of textile and apparel products.
Developing countries that produce and export different types or less substitutable textiles and apparels
compared with China will be less effected.
(Insert figure 3 and Table 8 here)
Those gains to economic growth from China's and Taiwan's trade liberalization are mainly
generated from three sources that reinforce each other: (1) more efficient allocation of production factors
through increased specialization according to each country’s comparative advantage, including the
migration of additional agricultural labor to manufacturing activities, which increase labor productivity.
(2) More rapid physical capital accumulation, so that there will be more physical capital stock available in
the economy; which compounds the efficiency gain, and (3) more rapid growth of TFP due to speeding
technology transfer via expansion of capital and intermediate goods imports from advanced industrial
countries. The additional capital accumulation and TFP growth in each region due to China’s and
Taiwan's WTO accession are reported in the first half of Table 8. Since both China and Taiwan adopt
dramatic liberalization measures to meet the WTO entry requirement in the simulation exercises, it is
expected that they will subject to the largest impacts from all the above three sources and gain the most
from their WTO membership. For instance, physical capital accumulation in China will be 1.5 percent
higher in year 2010 and 5.3 million additional agricultural laborers will become production workers in
various manufacturing sectors over the 2001-2010 period if China is admitted into the WTO.
As classical trade theory indicates, removing trade distortions leads to further realization of each
region’s comparative advantage, more efficient allocation of production factors, and expansion of trade.
This type of efficiency gain is driven by each region’s comparative advantages, resulting in a structural
adjustment in each regional economy and reshaping of the world net trade pattern. In addition, there will
be a strong positive feedback between trade expansion and productivity growth. As China expands its
labor-intensive exports to the world market after joining the WTO, Chinese firms will import more capital
11 In 1997, exports from Taiwan to China and Hong Kong accounted for 18.8 percent and 3.8 percent, respectively, of its total exports to the world. 12 Please note it does not mean that these countries’ growth rates will be lower than their current actual growth rate,
it only indicates economic growth in those countries will be lower than the situation excluding China and Taiwan in the world trade liberalization process, in other words, those countries gain less than the case excluding China.
21
and technology intensive goods as both investment and intermediate inputs from industrial counties.
Those goods are usually embodied with advanced technology from other countries, thus stimulating
productivity growth. The simulation results show that WTO membership will accelerate China’s TFP
growth by about 0.12 percentage points a year, and contribute significantly to the additional real GDP
growth due to its entry to the WTO over the whole simulation period.
Households in China and its major trade partners would benefit from further realization of each
region's comparative advantage in a freer trade environment and faster economic growth. As shown in the
second half of Table 8 and Figure 3, real purchase power measured by the Hicksian equivalent variation
rises in almost all regions across the world, about $47 billion a year on average for the world as a whole
over the 2001-2010 period. Similar to other trade liberalization exercises, the liberalizer–China and
Taiwan, gain the most. However, the rest of the world also gains substantially, especially industrial
countries. For example, the U.S. real purchasing power would increase more than $130 billion during the
whole simulation period, and about $24 billion annually after 2010. Only MFA quota restricted
developing counties in Asia, South America and Mexico slightly lose because trade will be diverted away
from those countries to China after China’s WTO entry as discussed in the previous section.
Generally speaking, developed countries and newly industrialized economies in Asia would
benefit relatively more than other developing countries from China’s WTO entry because their factor
endowment and stage of technology development are different from China’s. Favorable changes in
international terms of trade induced by integrating China into the world market are another fundamental
factor. As we discussed earlier, joining the WTO and obtaining the benefit of phasing out the MFA will
enable China to dramatically increase its production and exports of labor intensive products, thus
intensifying competition in the world market. This will in turn reduce export prices in developing
countries and import prices in developed countries, the largest final market for such products. The
expansion of China’s production and trade in labor intensive manufactures result in higher demand for
capital and skill-intensive manufactured goods, thus driving up the world prices for such products, which
are major exports from developed and newly industrialized countries. Such a world price movement
would improve international terms of trade for developed countries relative to developing countries (as
shown in the bottom of Table 8), thus enabling them to benefit relatively more from China's WTO
accession. However, terms of trade may also improve due to China and Taiwan’s WTO entry for those
least developed countries whose development stage are behind China’s. This is because major exports
from those countries are primary products, which will face higher world prices because of the increased
world demand, while the expansion of low-end capital and technology intensive manufacturing products
from China and Taiwan to those countries will lower their import prices.

22
VI. Conclusions and Implications for Cross-Strait Relation Policies
This paper provides a quantitative assessment of the anticipated impact of China’s and Taiwan’s
WTO membership on cross Strait trade and economic relations based on actual market access offers that
China and Taiwan have made to date using a numerical applied general equilibrium model for world
production and trade. Although market access is only a part of WTO membership, the analysis does not
take into account other major aspects of WTO membership, such as reduction of barriers in foreign
investment, protection of intellectual property rights, enforcement of commitment, and cooperation in
dispute settlement. (It at best captures only one aspect of the issue). The results obtained so far already
show that the economic structures in both China and Taiwan as well as the cross Strait economic
relationship will undergo substantial changes after both of them join the WTO. The dependence of
Taiwan’s exports on China will increase more than 3 additional percentage points from the baseline level,
enabling China to replace the U.S. as the number one export market for Taiwan and further enhance
Taiwan as an upstream base for China’s massive manufacturing industries. In the meantime, China will
obtain the benefit from expansion of imports from Taiwan fueled by direct investment to accelerate its
industrialization, reduce the pressure of unemployment and expand its manufacturing exports to rest of
the world because of its huge reservoir of cheap labor and gradually improved infrastructures. This study
has also shown that although China and Taiwan will gain the most from their WTO memberships, rest of
the world, especially developed countries and Asian newly industrialized economies, as well as least
developed countries would also benefit from the expansion of world trade and improvement of their
international terms of trade. Only developing countries with an endowment and export structure similar to
China’s, such as South Asia and ASEAN countries may experience keener competition in labor-intensive
exports and lower prices for their products.
Furthermore, by recognizing the proper position of China and Taiwan in a comparative world
economic system based on their factor endowments and stages of technology development, this analysis
indicates that the economic interdependence between China and Taiwan will further deepen. Moreover,
integration of the two economies will accelerate after both of them enter the WTO. This is a continued
trend that started in the mid 80’s driven by the market based on fundamental economic forces and is a part
of the production relocation process based on changing comparative advantages in East Asia and
consistent with the general trend of economic globalization. In other words, the economic integration
across the Taiwan Strait is not a policy preference but a fact of life determined by the “invisible hand”. It
is bound by both the forces of globalization and production relocation in East Asia, rooted from the
position of China and Taiwan in the dynamic Chain of international comparative advantage. No matter
23
what efforts made by governments on both sides of the Strait, this economic integration process may only
be slowed down or accelerated. The future direction of the course is impossible to change by any political
wills. The failure of the “go to the south” investment strategy promoted by the Taiwan government during
last decades is obvious proof.
As a politically unified China remains a distant goal rather than a short-term possibility, a realistic
and desirable strategy to promote a peaceful and stable cross Strait relation after WTO entry could be
started from resuming the “thee direct links” towards establish a Greater Chinese Common market, which
include Taiwan, Hong Kong and Macao and mainland China as equal active partners. This integrated
economic identity will be able to consider the division of labor among Chinese economies in a global
market perspective and promote the best strategy of industrial structure upgrade for all members. If the
leaders on both sides of the Taiwan Strait have enough political wisdom to make full use of the
opportunity brought by China’s and Taiwan’s WTO entry to establish such deep and broad dimensions of
economic cooperation13 as their clear mid-term objective, it may not only generate economic benefits to
all Chinese economies but also prevent future security incidents in the Taiwan Strait area. This strategy
hence provides a win-win prospect for China, Taiwan and the United States.
For Beijing, it is the best strategy to pursue China’s unification under current conditions.
Reunification via economic integration, when the two sides of the Taiwan Strait are deeply linked by
trade and investment flows and become an organic part of the division of labor system in a highly
integrated Chinese common market, step away from this process will not only hurt firms and workers on
the mainland (especially the south east coast), but also bring nightmare to firms and workers in Taiwan,
any Taiwan independent movement will lose economic steam and become a remote and fade dream of
few, which will better serve Beijing’s long term interests and facilitate and lead to the ultimate
reunification of China.
For Taipei, active engage with China to obtain maximum benefit for Taiwanese people through
negotiation and economic cooperation with Beijing in the unavoidable economic integration process, will
not only enable Taiwanese firms to take a large share of the vast market and make full use of abundant
production resources in the mainland, but will also provide opportunities to use Taiwan’s experience to
shape whole China in the direction of a democratic market economy. This may ultimately reduce the
political and economic difference across the Strait and contribute to democracy and prosperity for all
Chinese people.
13 It includes free trade and mobility of production factors among members, financial and monetary integration and co-ordination of economic policies. It will base on WTO rules to make the institution arrangement for cross strait trade and investment.
24
For Washington, supporting an economic integrated Chinese common market not only create
opportunities for American firms in the world largest potential market, increase the economic
interdependence between American and Chinese economies, which is the foundation for a peaceful and
stable US-China relation, but also help bring stability and security to East Asia, which is an important part
of the long term strategic interest of the United States, and eventually make China a member of America’s
friendly nations.
The results of this paper provide useful insights in understanding the impact of China’s accession
to the WTO on trade and economic relations across the Taiwan Strait and demonstrate that CGE model
can be a valuable tool for policy evaluation. Although the numerical model is large (there are more than
30,000 equations in each simulation period), the results are followed transparently from the model’s
(conceptually straightforward) structure based on basic theory of international trade. However, there are
several obvious limitations need to mention. First, it does not take into account other major aspects of
WTO membership, such as reduction of barriers in foreign investment, protection of intellectual property
rights, securing market access, enforcement of commitment, and cooperation in dispute settlement. It at
best captures only one aspect of the issue at hand. Second, China has not finalized all terms of its WTO
entry when this analysis has finished. There are still uncertainties in the size of its trade concessions, the
time schedule of implementation for each of the liberalization measures, and the length of the phase-in
period, especially regard to quantitative restriction on imports and barriers to service trade. A relatively
stylized representation of trade liberalization measures in these areas was adopted in the simulation
design. Third, the CGE model used in this paper is a highly stylized simplification of the world economy,
and is far from perfect (Wang, 1997a). Finally, there are uncertainties about the size of parameters, such
as elasticities of substitution of products from different sources and elastcities between capital goods
imports and TFP growth, while the actual size of the impact is very sensitive to those key parameters.
(See Appendix table for key parameters used in the model). Therefore, the results reported in this paper
need to be interpreted with caution: they can be viewed as indicative but not as precise real outcomes.

25
References
Ahuja, V. and D. Filmer (1995), ‘Educational Attainment in Developing Countries: New Estimates and
Projections Disaggregated by Gender’, World Bank Policy Research Working Paper 1489,
Washington D.C.
Chow, Peter, Francis Tuan and Zhi Wang “The Impact of WTO Membership on Economic / Trade
Relations Among the Three Chinese Economies -- China, Hong Kong and Taiwan.” Pacific
Economic Review, forthcoming.
Devarajan, Shantayanan, Jeffrey D. Lewis and Sherman Robinson (1990) "Policy Lesson From Trade-
Focused, Two-Sector Models." Journal of Policy Modelling, Vol. 12, No. 4, pp. 625-657.
Gereffi, Gary (1998) “Commodity Chains and Regional Divisions of Labor in East Asia,” in Eun Mee
Kim (ed.), The Four Asian Tigers: Economic Development and the Global Political Economy, San
Diego, CA: Academic Press, pp. 93-124.
Gilbert, John and Thomas Wahl (2000), ‘Applied General Equilibriun Assessments of Trade liberalization
in China’, paper presented at the workshop China’s Accession to the WTO: An Overview of Recent
Analyses, CPB Nethelands bureau for Economic Policy Analysis and Chinese Academy of Social
Sciences, Beijing, China, October 19-20.
Hoekman Bernard (1995), ‘Assessing the General Agreement on Trade in Services’, in Martin,
Will, and Alan Winters (eds), The Uruguay Round and the Developing Economies, World
Bank Discussion Paper 307.
Hertel, Thomas W. eds. (1997) Global Trade Analysis: Modeling and Applications. Cambridge:
Cambridge University Press.
Hertel, Thomas, Will Martin, Koji Yanagishima, and Betina Dimaranan (1995) ‘Liberalizing
Manufactures Trade in a Changing World Economy’, in Martin, Will and Alan Winters (eds), The
Uruguay Round and the Developing Economies, World Bank Discussion Papers 307.
Ianchovichina, Elena, Will Martin and Emiko Fukase “Comparative Study of Trade Liberalization
Regimes: The case of China ‘s Accession to the WTO.” Paper presented at the third conference of
Global Economic Analysis, Melbourne, Australia, June 20-30, 2000.
26
Lewis, Jeffrey D., Sherman Robinson, and Zhi Wang (1995), ‘Beyond the Uruguay Round: the
Implication of an Asian Free Trade Area’, China Economic Review - An International Journal, 7 (1),
35-90.
Lejour, Arjan, “China and the WTO: the impact on China and the world economy.” Paper presented at the
third conference of Global Economic Analysis, Melbourne, Australia, June 20-30, 2000.
Linkins, Linda (1999), ‘ Estimating the Tax Equivalents of U.S. Textile and Apparel Quotas’, Research
Note No. 99-08-A, Office of Economics, U.S. International Trade Commission.
Li, Shantong, Zhi Wang, Fan Zhai and Lin Xu (1998) ,‘The Global and Domestic Impact of China
joining the World Trade Organization’, Washington Center for China Studies and Development
Research Center, the State Council, People’s Republic of China, December.
Oxford Economic Forecasting (1999), The Oxford World Macroeconomic Model, An Overview. Oxford
U.K.: Abbey House.
Tung, Chen-yuan, “China's Economic Leverage and Taiwan's Security Concern with Respect to Cross-
Strait Economic Relations”, PhD dissertation, Johns Hopkins University, 2001.
U.S. International Trade Commission (1999), ‘Assessment of the Economic Effects on the United States
of China’s Accession to the WTO’, Investigation No. 332-403, Publication 3229.
Wang, Zhi (1997a), ‘The Impact of China and Taiwan Joining the World Trade Organization on US an
World Agricultural Trade: A Computable General Equilibrium Analysis’, Technical Bulletin, No.
1858, USDA, Economic Research Service.
Wang, Zhi (1997b), ‘China and Taiwan Access to the World Trade Organization: Implications for U.S.
Agriculture and Trade’ Agricultural Economics, 17:239-264.
Wang, Zhi (1999), ‘Impact of China's WTO Entry on Labor Intensive Export Market --A Recursive
Dynamic CGE Analysis’, The World Economy, 22(3):379-405, May.
Wang, Zhi and Jean Kinsey (1994). “Consumption and Saving Behavior under Strict and Partial
Rationing” China Economic Review - An International Journal, 5: 83-100.
Yao, Shunli and Robert Feenstra, 1999, "China and Hong Kong International Trade Data (For Use at UC
Davis)," Institute of Governmental Affairs, UC Davis.
Zhang , Shuguang, Yansheng Zhang and Zhongxin Wan (1998), Measuring the Costs of Protection in
China, Institute for International Economics, Washington DC.

27
Table 1 Factor Endowment, Intensity, and Relative Size of Model Regions, 1997 United
States Western Europe
Japan Australia & New Zealand
Canada Mexico Korea Singapore Hong Kong
Taiwan China ASEAN South Asia
Latin America MFA
Mid eastAfrica MFA
Low income Africa
Rest of the world
GDP and trade flows Billion U.S. dollars GDP 7945 8374 4255 458 631 389 445 80 140 300 855 573 530 1062 870 174 1902 Exports 853 1007 491 82 231 115 149 126 53 136 239 255 65 114 249 43 337 Imports 1024 962 419 84 217 102 159 136 94 111 215 261 74 161 260 53 394 Relative size in the world Percent GDP 27.4 28.9 14.7 1.6 2.2 1.3 1.5 0.3 0.5 1.0 3.0 2.0 1.8 3.7 3.0 0.6 6.6 Exports 18.8 22.2 10.8 1.8 5.1 2.5 3.3 2.8 1.2 3.0 5.3 5.6 1.4 2.5 5.5 1.0 7.4 Imports 21.7 20.4 8.9 1.8 4.6 2.2 3.4 2.9 2.0 2.4 4.6 5.5 1.6 3.4 5.5 1.1 8.3 Trade dependence Percent Exports/Output 10.7 12.0 11.5 17.9 36.6 29.6 33.5 157.7 38.2 45.5 28.0 44.6 12.2 10.7 28.6 24.9 17.7 Imports/Absorption 12.9 11.5 9.9 18.3 34.4 26.2 35.6 170.0 67.3 37.2 25.2 45.6 13.9 15.2 30.0 30.6 20.7 Share in world factor endowment Percent Land 12.8 5.6 0.3 4.0 3.3 1.8 0.1 0.0 0.0 0.1 9.0 3.5 14.1 5.3 5.8 8.9 25.5 Rural labor 0.3 0.7 0.3 0.1 0.0 0.7 0.2 0.0 0.0 0.1 39.2 8.5 25.7 2.2 2.6 11.7 7.9 Unskilled labor 7.6 10.3 4.4 0.6 0.8 2.0 1.5 0.1 0.2 0.6 14.1 7.1 16.1 7.3 4.7 5.6 17.1 Skilled labor 14.4 16.1 3.7 1.1 1.8 1.5 0.8 0.1 0.2 0.4 18.8 3.7 7.8 4.2 4.1 2.9 18.2 Total labor 4.9 6.5 2.4 0.4 0.6 1.3 0.8 0.1 0.1 0.3 26.2 7.4 19.6 4.6 3.7 8.1 13.0 Capital 22.1 30.4 18.5 1.5 1.9 1.4 1.6 0.3 0.6 0.7 2.6 1.9 1.4 3.6 4.1 0.5 7.0 Factor share in value-added Percent Land 0.6 0.8 0.3 0.8 0.5 3.2 2.5 0.3 0.2 0.7 7.6 5.2 11.7 1.9 1.6 2.5 2.5 Rural labor 0.5 1.5 0.8 2.1 1.4 4.4 2.1 0.5 0.5 1.6 12.0 7.4 10.8 3.1 3.2 15.5 5.0 Unskilled labor 37.9 32.6 35.9 29.3 41.0 19.3 36.5 30.8 25.4 34.2 33.9 23.5 24.1 28.2 29.0 28.3 34.0 Skilled labor 26.1 22.8 22.5 21.8 16.9 9.1 16.2 17.4 19.7 25.0 10.9 8.2 7.9 14.7 15.6 10.9 14.7 Total labor 64.5 56.9 59.2 53.3 59.2 32.8 54.8 48.6 45.6 60.8 56.7 39.0 42.9 45.9 47.7 54.7 53.7 Capital 35.0 42.3 40.5 45.9 40.3 64.0 42.8 51.1 54.2 38.5 35.7 55.8 45.4 52.2 50.7 42.9 43.8 Skill distribution of regional labor force Percent Rural labor 2.3 4.8 4.8 5.5 2.7 23.2 11.8 0.2 0.6 9.3 69.1 52.9 60.3 22.2 32.3 66.5 28.2 Unskilled labor 66.9 69.2 79.3 66.4 64.0 65.4 77.5 73.8 80.9 77.2 23.4 41.8 35.5 68.3 55.8 29.7 57.1 Skilled labor 30.8 26.0 16.0 28.1 33.4 11.4 10.7 26.0 18.6 13.5 7.5 5.3 4.1 9.6 11.9 3.8 14.7 Capital(land) intensity US$ 1,000 per worker Capital/labor 131.7 136.9 222.7 108.9 99.1 30.4 57.0 181.2 141.8 56.7 2.9 7.4 2.1 22.6 33.1 1.9 15.6 Hectares per worker Land/labor 1.28 0.42 0.06 4.80 2.86 0.67 0.07 0.00 0.00 0.09 0.17 0.23 0.35 0.56 0.78 0.54 0.96 Relative factor prices Ratio Rental/wage 0.41 0.54 0.31 0.79 0.69 6.41 1.37 0.58 0.84 1.12 21.72 19.45 49.48 5.03 3.21 41.23 5.22 Land rent/wage 0.70 3.31 8.21 0.32 0.29 14.7 60.2 970.9 342.7 12.6 79.7 57.9 77.4 7.48 4.21 8.34 4.73 Rental/land rent 0.59 0.16 0.04 2.51 2.36 0.44 0.02 0.00 0.00 0.09 0.27 0.34 0.64 0.67 0.76 4.95 1.10 Data Source: Calculated from the 1997 multi-regional SAM estimated by the author from Version 5 (pre-release) GTAP Database and additional factor endowment data collected by the author. Land and total labor (economically active population) endowment data are from the FAO Statistical Year Book, 1999. Factor returns are calculated as value-added data from GTAP divided by their endowments. The disaggregation between skilled and unskilled labor endowment was based on International Labor Office Year Book of Labor Statistics, 1993, and various statistical publications from various countries.
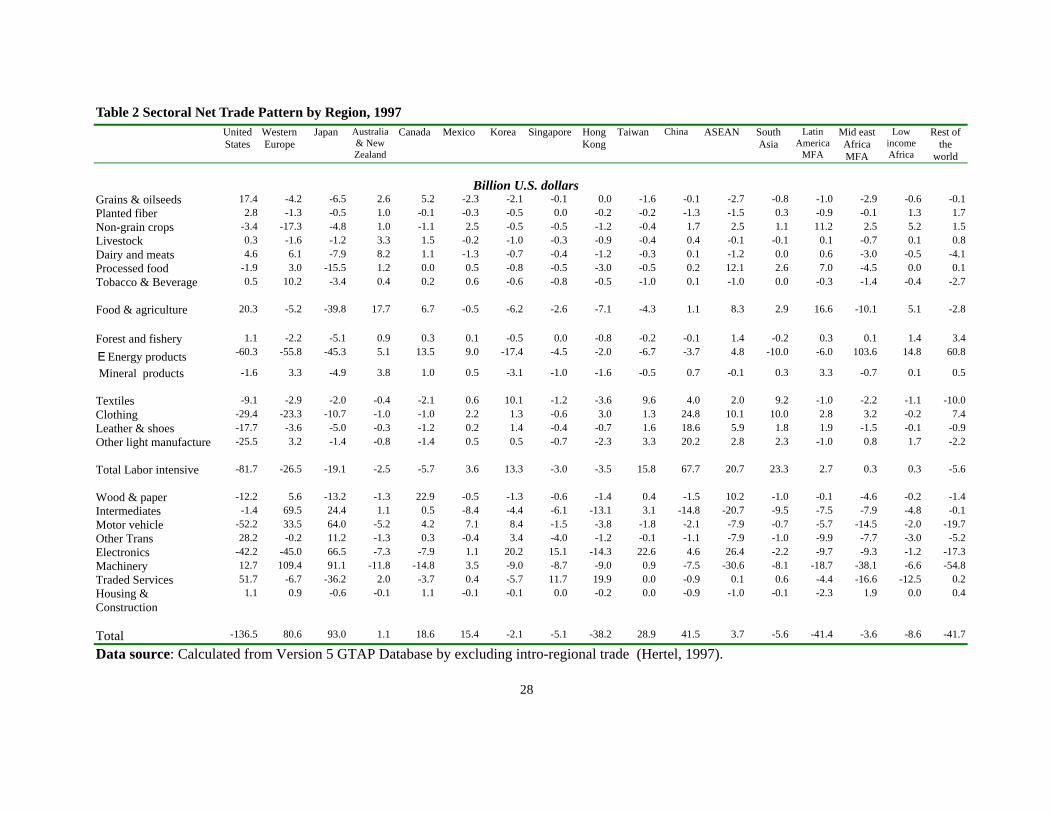
28
Table 2 Sectoral Net Trade Pattern by Region, 1997 United
States Western Europe
Japan Australia & New Zealand
Canada Mexico Korea Singapore Hong Kong
Taiwan China ASEAN South Asia
Latin America
MFA
Mid eastAfrica MFA
Low income Africa
Rest of the
world
Billion U.S. dollars Grains & oilseeds 17.4 -4.2 -6.5 2.6 5.2 -2.3 -2.1 -0.1 0.0 -1.6 -0.1 -2.7 -0.8 -1.0 -2.9 -0.6 -0.1Planted fiber 2.8 -1.3 -0.5 1.0 -0.1 -0.3 -0.5 0.0 -0.2 -0.2 -1.3 -1.5 0.3 -0.9 -0.1 1.3 1.7Non-grain crops -3.4 -17.3 -4.8 1.0 -1.1 2.5 -0.5 -0.5 -1.2 -0.4 1.7 2.5 1.1 11.2 2.5 5.2 1.5Livestock 0.3 -1.6 -1.2 3.3 1.5 -0.2 -1.0 -0.3 -0.9 -0.4 0.4 -0.1 -0.1 0.1 -0.7 0.1 0.8Dairy and meats 4.6 6.1 -7.9 8.2 1.1 -1.3 -0.7 -0.4 -1.2 -0.3 0.1 -1.2 0.0 0.6 -3.0 -0.5 -4.1Processed food -1.9 3.0 -15.5 1.2 0.0 0.5 -0.8 -0.5 -3.0 -0.5 0.2 12.1 2.6 7.0 -4.5 0.0 0.1Tobacco & Beverage 0.5 10.2 -3.4 0.4 0.2 0.6 -0.6 -0.8 -0.5 -1.0 0.1 -1.0 0.0 -0.3 -1.4 -0.4 -2.7 Food & agriculture 20.3 -5.2 -39.8 17.7 6.7 -0.5 -6.2 -2.6 -7.1 -4.3 1.1 8.3 2.9 16.6 -10.1 5.1 -2.8 Forest and fishery 1.1 -2.2 -5.1 0.9 0.3 0.1 -0.5 0.0 -0.8 -0.2 -0.1 1.4 -0.2 0.3 0.1 1.4 3.4
EEnergy products -60.3 -55.8 -45.3 5.1 13.5 9.0 -17.4 -4.5 -2.0 -6.7 -3.7 4.8 -10.0 -6.0 103.6 14.8 60.8
Mineral products -1.6 3.3 -4.9 3.8 1.0 0.5 -3.1 -1.0 -1.6 -0.5 0.7 -0.1 0.3 3.3 -0.7 0.1 0.5 Textiles -9.1 -2.9 -2.0 -0.4 -2.1 0.6 10.1 -1.2 -3.6 9.6 4.0 2.0 9.2 -1.0 -2.2 -1.1 -10.0Clothing -29.4 -23.3 -10.7 -1.0 -1.0 2.2 1.3 -0.6 3.0 1.3 24.8 10.1 10.0 2.8 3.2 -0.2 7.4Leather & shoes -17.7 -3.6 -5.0 -0.3 -1.2 0.2 1.4 -0.4 -0.7 1.6 18.6 5.9 1.8 1.9 -1.5 -0.1 -0.9Other light manufacture -25.5 3.2 -1.4 -0.8 -1.4 0.5 0.5 -0.7 -2.3 3.3 20.2 2.8 2.3 -1.0 0.8 1.7 -2.2 Total Labor intensive -81.7 -26.5 -19.1 -2.5 -5.7 3.6 13.3 -3.0 -3.5 15.8 67.7 20.7 23.3 2.7 0.3 0.3 -5.6 Wood & paper -12.2 5.6 -13.2 -1.3 22.9 -0.5 -1.3 -0.6 -1.4 0.4 -1.5 10.2 -1.0 -0.1 -4.6 -0.2 -1.4Intermediates -1.4 69.5 24.4 1.1 0.5 -8.4 -4.4 -6.1 -13.1 3.1 -14.8 -20.7 -9.5 -7.5 -7.9 -4.8 -0.1Motor vehicle -52.2 33.5 64.0 -5.2 4.2 7.1 8.4 -1.5 -3.8 -1.8 -2.1 -7.9 -0.7 -5.7 -14.5 -2.0 -19.7Other Trans 28.2 -0.2 11.2 -1.3 0.3 -0.4 3.4 -4.0 -1.2 -0.1 -1.1 -7.9 -1.0 -9.9 -7.7 -3.0 -5.2Electronics -42.2 -45.0 66.5 -7.3 -7.9 1.1 20.2 15.1 -14.3 22.6 4.6 26.4 -2.2 -9.7 -9.3 -1.2 -17.3Machinery 12.7 109.4 91.1 -11.8 -14.8 3.5 -9.0 -8.7 -9.0 0.9 -7.5 -30.6 -8.1 -18.7 -38.1 -6.6 -54.8Traded Services 51.7 -6.7 -36.2 2.0 -3.7 0.4 -5.7 11.7 19.9 0.0 -0.9 0.1 0.6 -4.4 -16.6 -12.5 0.2Housing & Construction
1.1 0.9 -0.6 -0.1 1.1 -0.1 -0.1 0.0 -0.2 0.0 -0.9 -1.0 -0.1 -2.3 1.9 0.0 0.4
Total -136.5 80.6 93.0 1.1 18.6 15.4 -2.1 -5.1 -38.2 28.9 41.5 3.7 -5.6 -41.4 -3.6 -8.6 -41.7
Data source: Calculated from Version 5 GTAP Database by excluding intro-regional trade (Hertel, 1997).

29
Table 3 Major Assumptions for Baseline Calibration in the Modela United
States Western Europe
Japan Australia & New Zealand
Canada Mexico Korea Singapore
Hong Kong
Taiwan China ASEAN
South Asia
Latin America
MFA
Mideast & Africa MFA
Low income Africa
Rest of the
World
World Average
Average annual growth rate, %, 2000-2010 Real GDP 3.0 2.5 2.5 3.3 2.8 4.9 4.9 5.1 5.3 4.6 7.6 5.1 5.8 3.8 6.6 3.8 5.6 3.5Labor Force 0.8 -0.1 -0.2 1.0 0.6 2.4 1.1 0.3 0.2 0.8 0.8 1.9 2.2 1.8 3.1 3.0 1.5 1.5Skill Labor 3.1 3.7 2.9 6.7 5.6 2.4 1.1 0.1 4.0 4.1 2.9 5.6 2.2 1.8 6.4 6.4 5.7 4.0TFP 0.7 1.0 1.2 1.0 1.9 0.1 1.9 1.1 1.8 0.9 3.7 1.4 2.2 1.3 3.6 0.7 3.1 1.5
Capital Stock 4.7 2.7 2.5 3.8 3.6 6.6 5.3 6.7 4.6 6.6 9.1 5.8 5.5 3.1 2.7 2.6 3.6 3.8Gross Investment 4.4 3.5 2.7 2.9 3.5 10.5 5.1 5.1 6.4 3.6 7.6 5.1 5.8 3.8 6.6 3.8 5.6 4.4Government Spending 1.9 1.4 1.9 2.6 2.2 3.0 2.8 5.1 7.1 3.4 8.3 5.1 5.8 3.8 6.6 3.8 5.6 2.6Exports 3.7 3.3 1.0 3.6 2.8 5.0 4.1 4.5 3.1 4.4 7.6 6.3 7.7 4.0 7.0 3.1 5.9 4.3Imports 3.4 3.5 3.8 3.1 3.2 6.2 5.3 4.8 4.7 4.2 6.3 5.1 6.2 4.3 5.8 3.7 5.1 4.3
HH. Consumption 2.8 2.3 2.9 3.3 2.8 3.4 5.9 6.2 5.7 5.2 7.7 4.9 5.8 3.9 6.6 3.9 5.6 3.4Total Absorption 3.0 2.4 2.7 3.1 2.8 5.4 5.4 5.5 6.0 4.6 7.7 5.0 5.8 3.8 6.6 3.8 5.6 3.6
Average annual agricultural labor force migration, 1000 persons, 2000-2010 Ag. Labor migration 35 75 42 5 5 124 45 0 0 13 4774 1536 2729 446 1233 1164 1716 13942
Labor composition, %, 2000 Agricultural labor 2.2 4.6 4.4 5.4 2.6 21.8 11.2 0.2 0.7 8.7 67.8 52.7 61.1 22.3 30.3 65.7 27.6 45.8Unskilled labor 64.2 66.0 78.1 60.1 58.5 66.8 78.1 74.4 78.9 76.5 24.3 41.4 34.7 68.1 56.6 30.1 55.8 42.9Skilled labor 33.6 29.5 17.6 34.5 39.0 11.4 10.7 25.4 20.5 14.8 7.9 5.8 4.1 9.6 13.1 4.2 16.6 11.3
Labor composition, %, 2010 Agricultural labor 2.0 4.2 3.7 5.0 2.3 19.1 9.5 0.3 0.7 7.4 61.8 46.5 57.0 19.3 20.8 61.7 23.4 42.2Unskilled labor 55.7 53.2 72.3 35.2 34.8 69.5 79.9 75.0 69.5 72.0 28.4 45.2 38.8 71.1 61.2 32.5 51.7 43.5Skilled labor 42.3 42.7 24.0 59.9 63.0 11.4 10.7 24.8 29.9 20.6 9.8 8.3 4.1 9.6 18.1 5.8 24.9 14.4
Gross investment as % of real GDP 2000 19.8 18.8 24.7 21.9 18.8 22.9 29.3 45.1 29.2 23.8 37.3 32.0 22.7 18.8 21.4 14.9 20.2
2010 22.6 20.7 25.2 21.2 20.2 38.2 29.9 45.1 32.4 21.6 37.3 32.0 22.7 18.8 21.4 14.9 20.2
Government spending as % of nominal GDP 2000 16.2 18.8 9.5 17.7 17.9 9.3 8.7 10.5 7.8 12.4 12.1 9.7 11.0 17.0 21.3 10.3 11.7
2010 14.5 16.8 8.9 16.6 16.8 7.7 7.1 10.5 9.2 11.1 12.9 9.7 11.0 17.0 21.3 10.3 11.7
Balance of trade as % of nominal GDP 2000 -3.0 1.2 2.9 -1.7 2.7 0.4 4.8 11.8 3.1 1.7 1.9 6.2 -1.3 -1.1 -0.4 -5.1 -2.1
2010 -2.4 2.2 1.0 0.1 2.8 -4.2 0.5 8.2 -3.1 1.8 0.8 7.7 -1.3 -1.3 -0.4 -5.1 -1.9
a. Data in bold face are based on forecast by Oxford Macro Economic Model and set exogenously during the calibration (Oxford, 1999). Economy-wide TFP growth is a weighted average ( Dormar weights) of sector level TFP growth generated by the model endogenously.

30
Table 4a Tariff and Non-tariff Protection Rates in China for its WTO Accession (%) 2000 2001 2002 2003 2004 2005 2006 2007 2008-2010 Rate of
Reduction Initial NTBs
Normal Tariff Rice 78.6 63.6 49.7 37.0 25.4 25.4 25.4 25.4 25.4 -67.7 31.0Wheat 2.0 2.0 2.0 2.0 2.0 15.0 15.0 15.0 15.0 na 109.3Other grains 8.9 8.7 8.6 8.4 8.2 8.2 8.2 8.2 8.2 -7.3 78.9Oilseeds 14.3 12.7 11.2 9.6 8.0 8.0 8.0 8.0 8.0 -44.0 94.4Planted fiber 1.0 1.0 1.0 1.0 1.0 15.0 15.0 15.0 15.0 na 72.7Non-grain crops 21.7 19.3 17.0 14.8 12.6 12.6 12.6 12.6 12.6 -41.7 2.9Livestock 20.7 20.1 19.6 19.1 18.5 18.5 18.5 18.5 18.5 -10.4 0.0Dairy and meats 17.0 15.5 13.9 12.4 10.9 10.9 10.9 10.9 10.9 -35.8 2.8Processed food 31.7 28.6 25.5 22.5 19.6 17.6 15.9 15.9 15.9 -50.0 8.7Tobacco & Beverage 50.5 42.9 35.2 27.6 20.0 19.2 19.2 19.2 19.2 -61.9 12.4Forest and fishery 3.5 2.4 2.1 2.1 2.1 2.1 2.1 2.1 2.1 -41.1 1.2Energy products 5.2 3.9 3.9 3.9 3.9 3.9 3.9 3.9 3.9 -24.8 9.4Mineral 9.6 8.7 8.3 8.1 8.0 8.0 8.0 8.0 8.0 -17.4 9.4Textiles 25.4 21.7 17.9 14.4 11.2 9.1 9.1 9.1 9.1 -64.1 7.0Clothing 32.1 28.4 24.9 21.3 17.8 15.0 15.0 15.0 15.0 -53.3 5.1Leather & shoes 12.2 10.4 9.3 8.9 8.6 8.6 8.6 8.6 8.6 -29.6 5.1Other light manufacture 22.1 20.4 18.9 17.7 16.6 15.6 15.6 15.6 15.6 -29.4 1.7Wood & paper 11.4 9.3 7.3 5.7 4.4 4.1 4.1 4.1 4.0 -64.6 11.0Intermediates 11.9 10.1 8.6 7.9 7.3 7.0 6.8 6.6 6.3 -46.7 15.9Motor vehicle 33.4 28.0 22.7 19.3 16.3 13.7 13.7 13.7 13.7 -58.9 26.3Other Trans 4.9 3.8 3.7 3.6 3.5 3.5 3.5 3.5 3.5 -29.3 12.2Electronics 11.6 7.7 3.9 3.0 2.9 2.9 2.9 2.9 2.9 -75.0 7.8Machinery 13.5 10.9 8.6 7.7 7.3 7.3 7.3 7.3 7.3 -46.1 5.1Traded Services 70.9 63.8 56.7 46.1 35.5 35.5 35.5 35.5 35.5 -50.0 0.0Average 17.9 15.1 12.6 10.7 9.3 8.9 8.8 8.8 8.7 -51.4 10.1
Tariff after taking processing trade and duty exemption into account Rice 72.4 58.6 45.8 34.0 23.4 23.4 23.4 23.4 23.4 -67.7 31.0Wheat 1.6 1.5 1.5 1.5 1.5 11.1 11.1 11.1 11.1 na 89.7Other grains 5.9 5.8 5.7 5.6 5.5 5.5 5.5 5.5 5.5 -7.3 78.9Oilseeds 11.8 10.5 9.2 7.9 6.6 6.6 6.6 6.6 6.6 -44.0 94.3Planted fiber 0.9 0.1 0.1 0.1 0.1 1.6 1.6 1.6 1.6 na 6.9Non-grain crops 14.6 13.0 11.4 10.0 8.5 8.5 8.5 8.5 8.5 -41.7 2.9Livestock 7.2 7.0 6.8 6.7 6.5 6.5 6.5 6.5 6.5 -10.4 0.0Dairy and meats 11.1 10.1 9.1 8.1 7.1 7.1 7.1 7.1 7.1 -35.8 2.8Processed food 20.6 18.6 16.6 14.6 12.7 11.5 10.3 10.3 10.3 -50.0 8.5Tobacco & Beverage 25.7 21.8 17.9 14.0 10.1 9.8 9.8 9.8 9.8 -61.9 12.4Forest and fishery 2.5 1.7 1.6 1.5 1.5 1.5 1.5 1.5 1.5 -41.1 1.2Energy products 3.8 2.9 2.9 2.9 2.9 2.9 2.9 2.9 2.9 -24.8 9.4Mineral 4.2 3.8 3.6 3.5 3.5 3.4 3.4 3.4 3.4 -17.4 9.4Textiles 0.9 0.8 0.6 0.5 0.4 0.3 0.3 0.3 0.3 -64.1 7.0Clothing 0.6 0.5 0.5 0.4 0.3 0.3 0.3 0.3 0.3 -53.3 5.1Leather & shoes 0.2 0.2 0.2 0.2 0.1 0.1 0.1 0.1 0.1 -29.5 5.1Other light manufacture 1.6 1.5 1.4 1.3 1.2 1.1 1.1 1.1 1.1 -29.4 1.7Wood & paper 4.6 3.7 2.9 2.3 1.8 1.7 1.6 1.6 1.6 -64.6 11.0Intermediates 3.7 3.2 2.7 2.5 2.3 2.2 2.1 2.1 2.0 -46.7 15.9Motor vehicle 25.0 21.0 17.0 14.5 12.2 10.3 10.3 10.3 10.3 -58.9 26.3Other Trans 4.2 3.3 3.2 3.1 3.0 3.0 3.0 3.0 3.0 -29.3 12.2Electronics 3.3 2.2 1.1 0.8 0.8 0.8 0.8 0.8 0.8 -75.0 7.8Machinery 4.0 3.2 2.5 2.2 2.1 2.1 2.1 2.1 2.1 -46.1 5.1Traded Services 71.0 63.9 56.8 46.2 35.5 35.5 35.5 35.5 35.5 -50.0 0.0Average 8.0 6.9 5.9 5.0 4.2 4.1 4.1 4.1 4.0 -49.6 9.6

31
Data Source: China's tariff cut is aggregated by the author from 6 digit Harmonized Commodity Description and
Coding System (HS) tariff schedules based on US-China agreement (November, 1999) and weighted by 1998 import
data from China's Customs. China’s non-tariff barrier (NTB is the difference between import protection rate in
version 5 GTAP database and China’s tariff after adjustment for duty exemptions. Industrial products are modified
on additional information from Zhang et al. (1998) and Li et al. (1998). Detailed data on processing trade and duty
exemption are kindly provided by Dr. Shunli Yao based on the China trade database maintained at the University of
California-Davis (Yao, Shunli and Robert Feenstra, 1999). The base year sevice sector protection rate was adopted from
Hoekman (1995) and they are tariff equelent of no-tariff barriers.
Table 4b Tariff Rates in Taiwan for its WTO Accession (%) 2000 2001 2002 2003 2004 2005 2006 2007 2008 2009 2010 Rate of
ReductionInitial NTBs
Rice 0.0 0.0 0.0 0.0 0.0 0.0 0.0 0.0 0.0 0.0 0.0 na 2.4Wheat 7.0 7.0 7.0 7.0 7.0 7.0 7.0 7.0 7.0 7.0 7.0 0.0 0.0Other grains 0.2 0.2 0.2 0.1 0.1 0.1 0.1 0.1 0.1 0.1 0.1 -71.4 0.8Oilseeds 0.4 0.4 0.0 0.0 0.0 0.0 0.0 0.0 0.0 0.0 0.0 -98.3 1.9Planted fiber 0.0 0.0 0.0 0.0 0.0 0.0 0.0 0.0 0.0 0.0 0.0 na 0.5Non-grain crops 17.5 14.7 11.8 11.5 11.2 11.0 10.8 10.8 10.8 10.8 10.8 -38.0 10.2Livestock 1.5 1.6 1.7 1.4 1.4 1.4 1.4 1.4 1.4 1.4 1.4 -8.3 0.0Dairy and meats 5.2 4.9 4.7 4.5 4.4 4.4 4.3 4.3 4.3 4.3 4.3 -16.8 7.6Processed food 13.7 12.9 12.1 11.7 11.5 11.3 11.2 11.2 11.2 11.2 11.2 -18.3 4.6Tobacco & Beverage 19.3 17.3 15.4 15.4 15.4 15.3 15.3 15.3 15.3 15.3 15.3 -20.7 30.1 Forest and fishery 9.4 8.8 8.2 8.0 7.8 7.7 7.6 7.6 7.6 7.6 7.6 -18.3 9.7Energy products 2.9 2.7 2.6 2.5 2.5 2.4 2.4 2.4 2.4 2.4 2.4 -15.5 2.8Mineral 5.4 5.0 4.6 4.5 4.4 4.3 4.3 4.3 4.3 4.3 4.3 -21.7 0.8Textiles 6.8 6.5 6.2 6.2 6.1 6.1 6.1 6.1 6.1 6.1 6.1 -10.6 0.8Clothing 12.9 12.2 11.4 11.3 11.3 11.3 11.3 11.3 11.3 11.3 11.3 -13.0 0.3Leather & shoes 4.8 4.7 4.5 4.4 4.3 4.2 4.2 4.2 4.2 4.2 4.2 -13.2 0.6Other light manufacture 3.7 3.0 2.3 2.2 2.2 2.1 2.1 2.1 2.1 2.1 2.1 -43.7 1.1Wood & paper 3.0 1.9 0.7 0.7 0.7 0.7 0.7 0.7 0.7 0.7 0.7 -76.8 1.1Intermediates 3.4 2.9 2.3 2.1 1.9 1.9 1.9 1.9 1.9 1.9 1.9 -45.5 0.7Motor vehicle 38.4 35.4 32.4 29.7 27.1 24.7 22.3 20.5 18.7 16.9 15.2 -60.2 0.0Other Trans 1.4 1.4 1.3 1.3 1.2 1.2 1.2 1.2 1.2 1.2 1.2 -15.5 0.8Electronics 2.6 1.6 0.5 0.5 0.5 0.5 0.5 0.5 0.5 0.5 0.5 -81.1 0.6Machinery 4.7 3.9 3.1 3.1 3.0 3.0 3.0 3.0 3.0 3.0 3.0 -35.8 0.2Traded Services 0.0 0.0 0.0 0.0 0.0 0.0 0.0 0.0 0.0 0.0 0.0 na na Average 4.7 3.9 3.3 3.1 3.0 2.9 2.8 2.8 2.7 2.7 2.6 -43.9 1.2
Data Source: Taiwan's tariff cut is aggregated by the author from 6 digit Harmonized Commodity Description and Coding System (HS) tariff schedules based on Taiwan’s official WTO offer provided by Council for Agriculture, Taiwan and weighted by its import data from 1997-2000 from World Trade Atlas. The weights of each year are 0.1, 0.2,0.3, and 0.4 respectively. Taiwan’s non-tariff barrier (NTB is the difference between import protection rate in version 5 GTAP database.

32
Figure 1 Impact of WTO accession on China's net trade patterns – agricultural, labor and capital intensive products, 2001-2010
Figure 2 WTO entry will increase Taiwan's export dependence on China, but decrease its dependence on U.S. market, especially in manufactured products, 2000-2010
2000 2001 2002 2003 2004 2005 2006 2007 2008 2009 2010
-60
-40
-20
0
20
40
60
80
100
120
Billi
ons
1997
US
Dol
lars
Baseline-Capital Intensive Baseline-Labor Intensive Baseline-Agri.&Food
Accession-Capital Intensive Accession-Labor Intensive Accession-Agri.&Food
Taiwan's Exports to China
2000 2002 2004 2006 2008 20100
10
20
30
40
50
60
Perc
ent o
f Tai
wan
's T
otal
Exp
orts
Total-baseline Capital-baseline Labor-baseline
Total-accession Capital-accession Labor-accession
Taiwan's Exports to the United States
2000 2002 2004 2006 2008 20100
10
20
30
Total-baseline Capital-baseline Labor-baseline
Total-accession Capital-accession Labor-accession
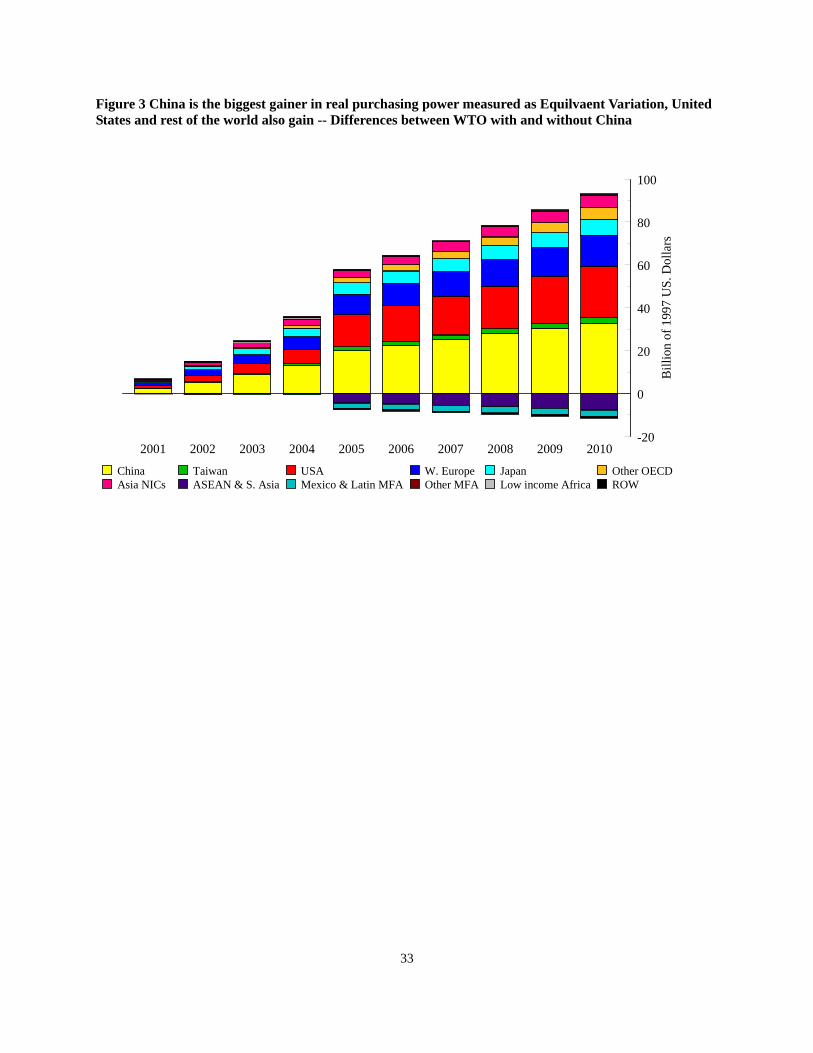
33
Figure 3 China is the biggest gainer in real purchasing power measured as Equilvaent Variation, United States and rest of the world also gain -- Differences between WTO with and without China
2001 2002 2003 2004 2005 2006 2007 2008 2009 2010-20
0
20
40
60
80
100
Bill
ion
of 1
997
US.
Dol
lars
China Taiwan USA W. Europe Japan Other OECDAsia NICs ASEAN & S. Asia Mexico & Latin MFA Other MFA Low income Africa ROW
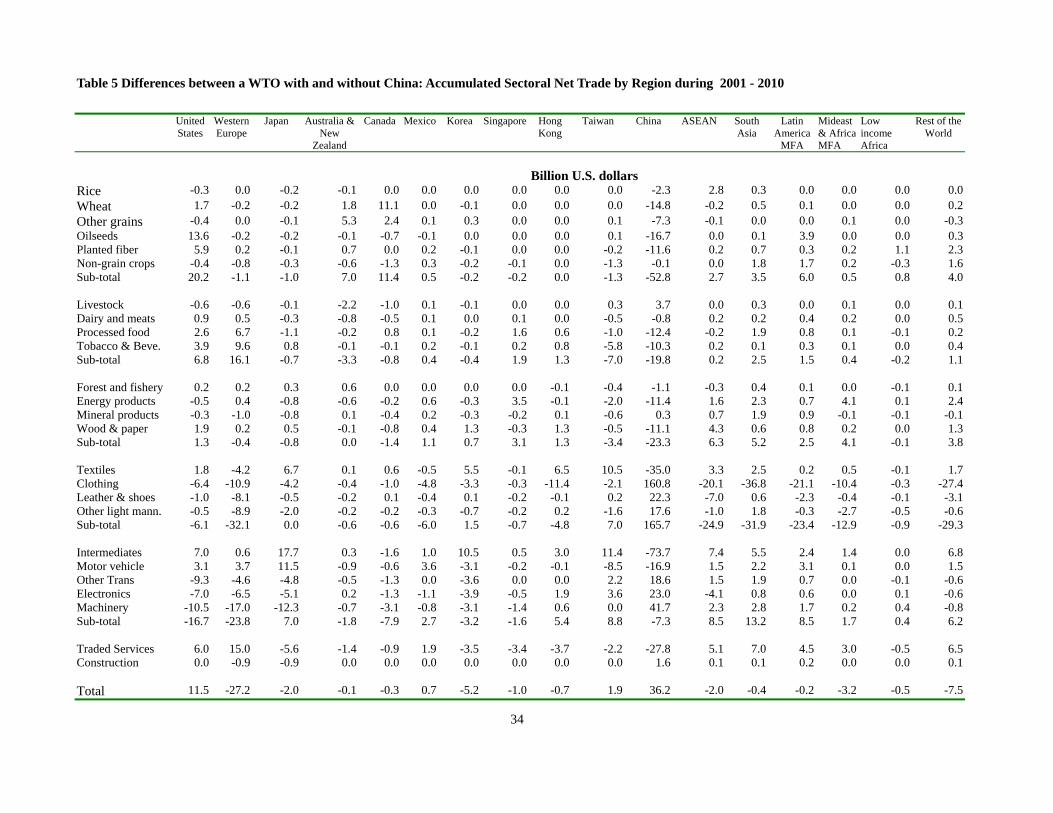
34
Table 5 Differences between a WTO with and without China: Accumulated Sectoral Net Trade by Region during 2001 - 2010 United
States Western Europe
Japan Australia & New
Zealand
Canada Mexico Korea Singapore Hong Kong
Taiwan China ASEAN South Asia
Latin America
MFA
Mideast & Africa MFA
Low income Africa
Rest of the World
Billion U.S. dollars Rice -0.3 0.0 -0.2 -0.1 0.0 0.0 0.0 0.0 0.0 0.0 -2.3 2.8 0.3 0.0 0.0 0.0 0.0Wheat 1.7 -0.2 -0.2 1.8 11.1 0.0 -0.1 0.0 0.0 0.0 -14.8 -0.2 0.5 0.1 0.0 0.0 0.2Other grains -0.4 0.0 -0.1 5.3 2.4 0.1 0.3 0.0 0.0 0.1 -7.3 -0.1 0.0 0.0 0.1 0.0 -0.3Oilseeds 13.6 -0.2 -0.2 -0.1 -0.7 -0.1 0.0 0.0 0.0 0.1 -16.7 0.0 0.1 3.9 0.0 0.0 0.3Planted fiber 5.9 0.2 -0.1 0.7 0.0 0.2 -0.1 0.0 0.0 -0.2 -11.6 0.2 0.7 0.3 0.2 1.1 2.3Non-grain crops -0.4 -0.8 -0.3 -0.6 -1.3 0.3 -0.2 -0.1 0.0 -1.3 -0.1 0.0 1.8 1.7 0.2 -0.3 1.6Sub-total 20.2 -1.1 -1.0 7.0 11.4 0.5 -0.2 -0.2 0.0 -1.3 -52.8 2.7 3.5 6.0 0.5 0.8 4.0 Livestock -0.6 -0.6 -0.1 -2.2 -1.0 0.1 -0.1 0.0 0.0 0.3 3.7 0.0 0.3 0.0 0.1 0.0 0.1Dairy and meats 0.9 0.5 -0.3 -0.8 -0.5 0.1 0.0 0.1 0.0 -0.5 -0.8 0.2 0.2 0.4 0.2 0.0 0.5Processed food 2.6 6.7 -1.1 -0.2 0.8 0.1 -0.2 1.6 0.6 -1.0 -12.4 -0.2 1.9 0.8 0.1 -0.1 0.2Tobacco & Beve. 3.9 9.6 0.8 -0.1 -0.1 0.2 -0.1 0.2 0.8 -5.8 -10.3 0.2 0.1 0.3 0.1 0.0 0.4Sub-total 6.8 16.1 -0.7 -3.3 -0.8 0.4 -0.4 1.9 1.3 -7.0 -19.8 0.2 2.5 1.5 0.4 -0.2 1.1 Forest and fishery 0.2 0.2 0.3 0.6 0.0 0.0 0.0 0.0 -0.1 -0.4 -1.1 -0.3 0.4 0.1 0.0 -0.1 0.1Energy products -0.5 0.4 -0.8 -0.6 -0.2 0.6 -0.3 3.5 -0.1 -2.0 -11.4 1.6 2.3 0.7 4.1 0.1 2.4Mineral products -0.3 -1.0 -0.8 0.1 -0.4 0.2 -0.3 -0.2 0.1 -0.6 0.3 0.7 1.9 0.9 -0.1 -0.1 -0.1Wood & paper 1.9 0.2 0.5 -0.1 -0.8 0.4 1.3 -0.3 1.3 -0.5 -11.1 4.3 0.6 0.8 0.2 0.0 1.3Sub-total 1.3 -0.4 -0.8 0.0 -1.4 1.1 0.7 3.1 1.3 -3.4 -23.3 6.3 5.2 2.5 4.1 -0.1 3.8 Textiles 1.8 -4.2 6.7 0.1 0.6 -0.5 5.5 -0.1 6.5 10.5 -35.0 3.3 2.5 0.2 0.5 -0.1 1.7Clothing -6.4 -10.9 -4.2 -0.4 -1.0 -4.8 -3.3 -0.3 -11.4 -2.1 160.8 -20.1 -36.8 -21.1 -10.4 -0.3 -27.4Leather & shoes -1.0 -8.1 -0.5 -0.2 0.1 -0.4 0.1 -0.2 -0.1 0.2 22.3 -7.0 0.6 -2.3 -0.4 -0.1 -3.1Other light mann. -0.5 -8.9 -2.0 -0.2 -0.2 -0.3 -0.7 -0.2 0.2 -1.6 17.6 -1.0 1.8 -0.3 -2.7 -0.5 -0.6Sub-total -6.1 -32.1 0.0 -0.6 -0.6 -6.0 1.5 -0.7 -4.8 7.0 165.7 -24.9 -31.9 -23.4 -12.9 -0.9 -29.3 Intermediates 7.0 0.6 17.7 0.3 -1.6 1.0 10.5 0.5 3.0 11.4 -73.7 7.4 5.5 2.4 1.4 0.0 6.8Motor vehicle 3.1 3.7 11.5 -0.9 -0.6 3.6 -3.1 -0.2 -0.1 -8.5 -16.9 1.5 2.2 3.1 0.1 0.0 1.5Other Trans -9.3 -4.6 -4.8 -0.5 -1.3 0.0 -3.6 0.0 0.0 2.2 18.6 1.5 1.9 0.7 0.0 -0.1 -0.6Electronics -7.0 -6.5 -5.1 0.2 -1.3 -1.1 -3.9 -0.5 1.9 3.6 23.0 -4.1 0.8 0.6 0.0 0.1 -0.6Machinery -10.5 -17.0 -12.3 -0.7 -3.1 -0.8 -3.1 -1.4 0.6 0.0 41.7 2.3 2.8 1.7 0.2 0.4 -0.8Sub-total -16.7 -23.8 7.0 -1.8 -7.9 2.7 -3.2 -1.6 5.4 8.8 -7.3 8.5 13.2 8.5 1.7 0.4 6.2 Traded Services 6.0 15.0 -5.6 -1.4 -0.9 1.9 -3.5 -3.4 -3.7 -2.2 -27.8 5.1 7.0 4.5 3.0 -0.5 6.5Construction 0.0 -0.9 -0.9 0.0 0.0 0.0 0.0 0.0 0.0 0.0 1.6 0.1 0.1 0.2 0.0 0.0 0.1 Total 11.5 -27.2 -2.0 -0.1 -0.3 0.7 -5.2 -1.0 -0.7 1.9 36.2 -2.0 -0.4 -0.2 -3.2 -0.5 -7.5
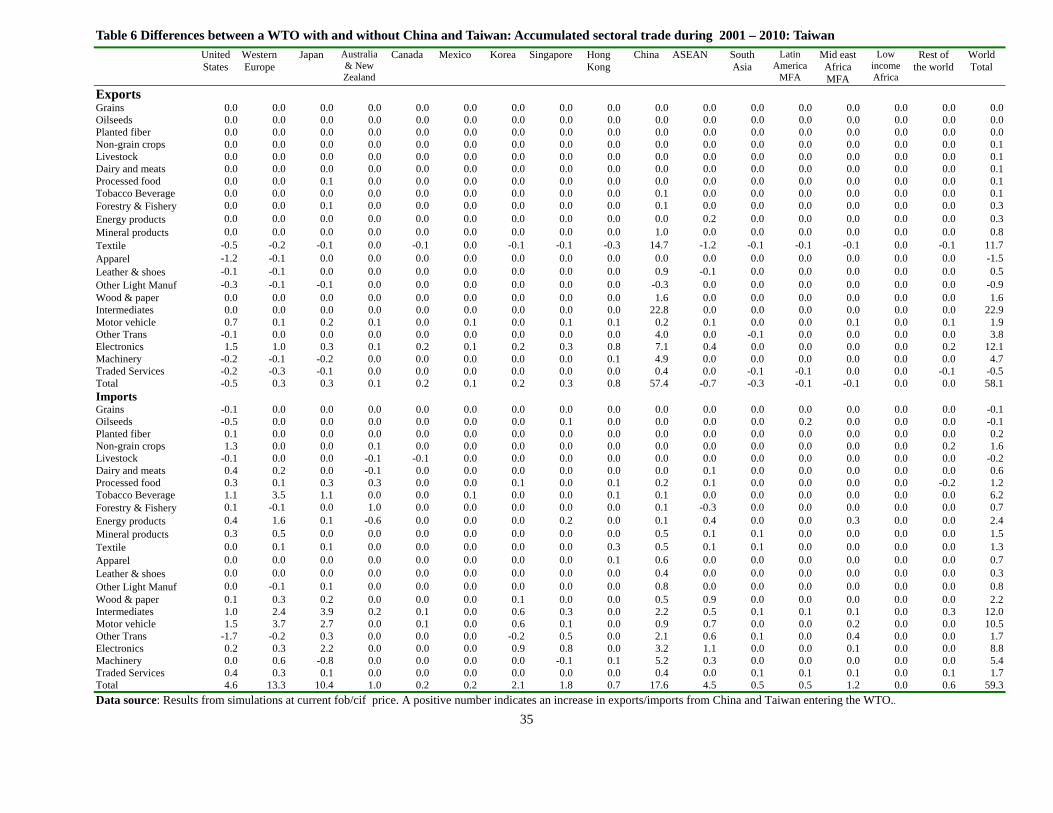
35
Table 6 Differences between a WTO with and without China and Taiwan: Accumulated sectoral trade during 2001 – 2010: Taiwan United
States Western Europe
Japan Australia & New Zealand
Canada Mexico Korea Singapore Hong Kong
China ASEAN South Asia
Latin America
MFA
Mid east Africa MFA
Low income Africa
Rest of the world
World Total
Exports Grains 0.0 0.0 0.0 0.0 0.0 0.0 0.0 0.0 0.0 0.0 0.0 0.0 0.0 0.0 0.0 0.0 0.0 Oilseeds 0.0 0.0 0.0 0.0 0.0 0.0 0.0 0.0 0.0 0.0 0.0 0.0 0.0 0.0 0.0 0.0 0.0 Planted fiber 0.0 0.0 0.0 0.0 0.0 0.0 0.0 0.0 0.0 0.0 0.0 0.0 0.0 0.0 0.0 0.0 0.0 Non-grain crops 0.0 0.0 0.0 0.0 0.0 0.0 0.0 0.0 0.0 0.0 0.0 0.0 0.0 0.0 0.0 0.0 0.1 Livestock 0.0 0.0 0.0 0.0 0.0 0.0 0.0 0.0 0.0 0.0 0.0 0.0 0.0 0.0 0.0 0.0 0.1 Dairy and meats 0.0 0.0 0.0 0.0 0.0 0.0 0.0 0.0 0.0 0.0 0.0 0.0 0.0 0.0 0.0 0.0 0.1 Processed food 0.0 0.0 0.1 0.0 0.0 0.0 0.0 0.0 0.0 0.0 0.0 0.0 0.0 0.0 0.0 0.0 0.1 Tobacco Beverage 0.0 0.0 0.0 0.0 0.0 0.0 0.0 0.0 0.0 0.1 0.0 0.0 0.0 0.0 0.0 0.0 0.1 Forestry & Fishery 0.0 0.0 0.1 0.0 0.0 0.0 0.0 0.0 0.0 0.1 0.0 0.0 0.0 0.0 0.0 0.0 0.3 Energy products 0.0 0.0 0.0 0.0 0.0 0.0 0.0 0.0 0.0 0.0 0.2 0.0 0.0 0.0 0.0 0.0 0.3 Mineral products 0.0 0.0 0.0 0.0 0.0 0.0 0.0 0.0 0.0 1.0 0.0 0.0 0.0 0.0 0.0 0.0 0.8 Textile -0.5 -0.2 -0.1 0.0 -0.1 0.0 -0.1 -0.1 -0.3 14.7 -1.2 -0.1 -0.1 -0.1 0.0 -0.1 11.7 Apparel -1.2 -0.1 0.0 0.0 0.0 0.0 0.0 0.0 0.0 0.0 0.0 0.0 0.0 0.0 0.0 0.0 -1.5 Leather & shoes -0.1 -0.1 0.0 0.0 0.0 0.0 0.0 0.0 0.0 0.9 -0.1 0.0 0.0 0.0 0.0 0.0 0.5 Other Light Manuf -0.3 -0.1 -0.1 0.0 0.0 0.0 0.0 0.0 0.0 -0.3 0.0 0.0 0.0 0.0 0.0 0.0 -0.9 Wood & paper 0.0 0.0 0.0 0.0 0.0 0.0 0.0 0.0 0.0 1.6 0.0 0.0 0.0 0.0 0.0 0.0 1.6 Intermediates 0.0 0.0 0.0 0.0 0.0 0.0 0.0 0.0 0.0 22.8 0.0 0.0 0.0 0.0 0.0 0.0 22.9 Motor vehicle 0.7 0.1 0.2 0.1 0.0 0.1 0.0 0.1 0.1 0.2 0.1 0.0 0.0 0.1 0.0 0.1 1.9 Other Trans -0.1 0.0 0.0 0.0 0.0 0.0 0.0 0.0 0.0 4.0 0.0 -0.1 0.0 0.0 0.0 0.0 3.8 Electronics 1.5 1.0 0.3 0.1 0.2 0.1 0.2 0.3 0.8 7.1 0.4 0.0 0.0 0.0 0.0 0.2 12.1 Machinery -0.2 -0.1 -0.2 0.0 0.0 0.0 0.0 0.0 0.1 4.9 0.0 0.0 0.0 0.0 0.0 0.0 4.7 Traded Services -0.2 -0.3 -0.1 0.0 0.0 0.0 0.0 0.0 0.0 0.4 0.0 -0.1 -0.1 0.0 0.0 -0.1 -0.5 Total -0.5 0.3 0.3 0.1 0.2 0.1 0.2 0.3 0.8 57.4 -0.7 -0.3 -0.1 -0.1 0.0 0.0 58.1 Imports Grains -0.1 0.0 0.0 0.0 0.0 0.0 0.0 0.0 0.0 0.0 0.0 0.0 0.0 0.0 0.0 0.0 -0.1 Oilseeds -0.5 0.0 0.0 0.0 0.0 0.0 0.0 0.1 0.0 0.0 0.0 0.0 0.2 0.0 0.0 0.0 -0.1 Planted fiber 0.1 0.0 0.0 0.0 0.0 0.0 0.0 0.0 0.0 0.0 0.0 0.0 0.0 0.0 0.0 0.0 0.2 Non-grain crops 1.3 0.0 0.0 0.1 0.0 0.0 0.0 0.0 0.0 0.0 0.0 0.0 0.0 0.0 0.0 0.2 1.6 Livestock -0.1 0.0 0.0 -0.1 -0.1 0.0 0.0 0.0 0.0 0.0 0.0 0.0 0.0 0.0 0.0 0.0 -0.2 Dairy and meats 0.4 0.2 0.0 -0.1 0.0 0.0 0.0 0.0 0.0 0.0 0.1 0.0 0.0 0.0 0.0 0.0 0.6 Processed food 0.3 0.1 0.3 0.3 0.0 0.0 0.1 0.0 0.1 0.2 0.1 0.0 0.0 0.0 0.0 -0.2 1.2 Tobacco Beverage 1.1 3.5 1.1 0.0 0.0 0.1 0.0 0.0 0.1 0.1 0.0 0.0 0.0 0.0 0.0 0.0 6.2 Forestry & Fishery 0.1 -0.1 0.0 1.0 0.0 0.0 0.0 0.0 0.0 0.1 -0.3 0.0 0.0 0.0 0.0 0.0 0.7 Energy products 0.4 1.6 0.1 -0.6 0.0 0.0 0.0 0.2 0.0 0.1 0.4 0.0 0.0 0.3 0.0 0.0 2.4 Mineral products 0.3 0.5 0.0 0.0 0.0 0.0 0.0 0.0 0.0 0.5 0.1 0.1 0.0 0.0 0.0 0.0 1.5 Textile 0.0 0.1 0.1 0.0 0.0 0.0 0.0 0.0 0.3 0.5 0.1 0.1 0.0 0.0 0.0 0.0 1.3 Apparel 0.0 0.0 0.0 0.0 0.0 0.0 0.0 0.0 0.1 0.6 0.0 0.0 0.0 0.0 0.0 0.0 0.7 Leather & shoes 0.0 0.0 0.0 0.0 0.0 0.0 0.0 0.0 0.0 0.4 0.0 0.0 0.0 0.0 0.0 0.0 0.3 Other Light Manuf 0.0 -0.1 0.1 0.0 0.0 0.0 0.0 0.0 0.0 0.8 0.0 0.0 0.0 0.0 0.0 0.0 0.8 Wood & paper 0.1 0.3 0.2 0.0 0.0 0.0 0.1 0.0 0.0 0.5 0.9 0.0 0.0 0.0 0.0 0.0 2.2 Intermediates 1.0 2.4 3.9 0.2 0.1 0.0 0.6 0.3 0.0 2.2 0.5 0.1 0.1 0.1 0.0 0.3 12.0 Motor vehicle 1.5 3.7 2.7 0.0 0.1 0.0 0.6 0.1 0.0 0.9 0.7 0.0 0.0 0.2 0.0 0.0 10.5 Other Trans -1.7 -0.2 0.3 0.0 0.0 0.0 -0.2 0.5 0.0 2.1 0.6 0.1 0.0 0.4 0.0 0.0 1.7 Electronics 0.2 0.3 2.2 0.0 0.0 0.0 0.9 0.8 0.0 3.2 1.1 0.0 0.0 0.1 0.0 0.0 8.8 Machinery 0.0 0.6 -0.8 0.0 0.0 0.0 0.0 -0.1 0.1 5.2 0.3 0.0 0.0 0.0 0.0 0.0 5.4 Traded Services 0.4 0.3 0.1 0.0 0.0 0.0 0.0 0.0 0.0 0.4 0.0 0.1 0.1 0.1 0.0 0.1 1.7 Total 4.6 13.3 10.4 1.0 0.2 0.2 2.1 1.8 0.7 17.6 4.5 0.5 0.5 1.2 0.0 0.6 59.3 Data source: Results from simulations at current fob/cif price. A positive number indicates an increase in exports/imports from China and Taiwan entering the WTO..
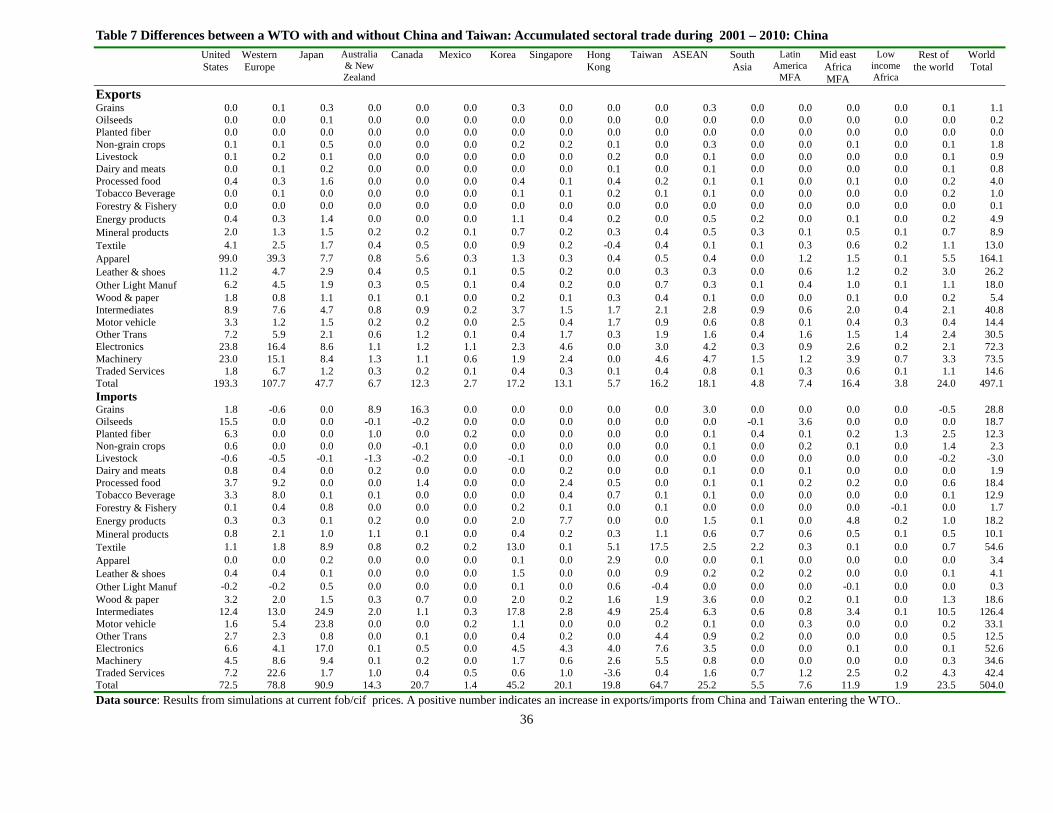
36
Table 7 Differences between a WTO with and without China and Taiwan: Accumulated sectoral trade during 2001 – 2010: China United
States Western Europe
Japan Australia & New Zealand
Canada Mexico Korea Singapore Hong Kong
Taiwan ASEAN South Asia
Latin America
MFA
Mid east Africa MFA
Low income Africa
Rest of the world
World Total
Exports Grains 0.0 0.1 0.3 0.0 0.0 0.0 0.3 0.0 0.0 0.0 0.3 0.0 0.0 0.0 0.0 0.1 1.1 Oilseeds 0.0 0.0 0.1 0.0 0.0 0.0 0.0 0.0 0.0 0.0 0.0 0.0 0.0 0.0 0.0 0.0 0.2 Planted fiber 0.0 0.0 0.0 0.0 0.0 0.0 0.0 0.0 0.0 0.0 0.0 0.0 0.0 0.0 0.0 0.0 0.0 Non-grain crops 0.1 0.1 0.5 0.0 0.0 0.0 0.2 0.2 0.1 0.0 0.3 0.0 0.0 0.1 0.0 0.1 1.8 Livestock 0.1 0.2 0.1 0.0 0.0 0.0 0.0 0.0 0.2 0.0 0.1 0.0 0.0 0.0 0.0 0.1 0.9 Dairy and meats 0.0 0.1 0.2 0.0 0.0 0.0 0.0 0.0 0.1 0.0 0.1 0.0 0.0 0.0 0.0 0.1 0.8 Processed food 0.4 0.3 1.6 0.0 0.0 0.0 0.4 0.1 0.4 0.2 0.1 0.1 0.0 0.1 0.0 0.2 4.0 Tobacco Beverage 0.0 0.1 0.0 0.0 0.0 0.0 0.1 0.1 0.2 0.1 0.1 0.0 0.0 0.0 0.0 0.2 1.0 Forestry & Fishery 0.0 0.0 0.0 0.0 0.0 0.0 0.0 0.0 0.0 0.0 0.0 0.0 0.0 0.0 0.0 0.0 0.1 Energy products 0.4 0.3 1.4 0.0 0.0 0.0 1.1 0.4 0.2 0.0 0.5 0.2 0.0 0.1 0.0 0.2 4.9 Mineral products 2.0 1.3 1.5 0.2 0.2 0.1 0.7 0.2 0.3 0.4 0.5 0.3 0.1 0.5 0.1 0.7 8.9 Textile 4.1 2.5 1.7 0.4 0.5 0.0 0.9 0.2 -0.4 0.4 0.1 0.1 0.3 0.6 0.2 1.1 13.0 Apparel 99.0 39.3 7.7 0.8 5.6 0.3 1.3 0.3 0.4 0.5 0.4 0.0 1.2 1.5 0.1 5.5 164.1 Leather & shoes 11.2 4.7 2.9 0.4 0.5 0.1 0.5 0.2 0.0 0.3 0.3 0.0 0.6 1.2 0.2 3.0 26.2 Other Light Manuf 6.2 4.5 1.9 0.3 0.5 0.1 0.4 0.2 0.0 0.7 0.3 0.1 0.4 1.0 0.1 1.1 18.0 Wood & paper 1.8 0.8 1.1 0.1 0.1 0.0 0.2 0.1 0.3 0.4 0.1 0.0 0.0 0.1 0.0 0.2 5.4 Intermediates 8.9 7.6 4.7 0.8 0.9 0.2 3.7 1.5 1.7 2.1 2.8 0.9 0.6 2.0 0.4 2.1 40.8 Motor vehicle 3.3 1.2 1.5 0.2 0.2 0.0 2.5 0.4 1.7 0.9 0.6 0.8 0.1 0.4 0.3 0.4 14.4 Other Trans 7.2 5.9 2.1 0.6 1.2 0.1 0.4 1.7 0.3 1.9 1.6 0.4 1.6 1.5 1.4 2.4 30.5 Electronics 23.8 16.4 8.6 1.1 1.2 1.1 2.3 4.6 0.0 3.0 4.2 0.3 0.9 2.6 0.2 2.1 72.3 Machinery 23.0 15.1 8.4 1.3 1.1 0.6 1.9 2.4 0.0 4.6 4.7 1.5 1.2 3.9 0.7 3.3 73.5 Traded Services 1.8 6.7 1.2 0.3 0.2 0.1 0.4 0.3 0.1 0.4 0.8 0.1 0.3 0.6 0.1 1.1 14.6 Total 193.3 107.7 47.7 6.7 12.3 2.7 17.2 13.1 5.7 16.2 18.1 4.8 7.4 16.4 3.8 24.0 497.1 Imports Grains 1.8 -0.6 0.0 8.9 16.3 0.0 0.0 0.0 0.0 0.0 3.0 0.0 0.0 0.0 0.0 -0.5 28.8 Oilseeds 15.5 0.0 0.0 -0.1 -0.2 0.0 0.0 0.0 0.0 0.0 0.0 -0.1 3.6 0.0 0.0 0.0 18.7 Planted fiber 6.3 0.0 0.0 1.0 0.0 0.2 0.0 0.0 0.0 0.0 0.1 0.4 0.1 0.2 1.3 2.5 12.3 Non-grain crops 0.6 0.0 0.0 0.0 -0.1 0.0 0.0 0.0 0.0 0.0 0.1 0.0 0.2 0.1 0.0 1.4 2.3 Livestock -0.6 -0.5 -0.1 -1.3 -0.2 0.0 -0.1 0.0 0.0 0.0 0.0 0.0 0.0 0.0 0.0 -0.2 -3.0 Dairy and meats 0.8 0.4 0.0 0.2 0.0 0.0 0.0 0.2 0.0 0.0 0.1 0.0 0.1 0.0 0.0 0.0 1.9 Processed food 3.7 9.2 0.0 0.0 1.4 0.0 0.0 2.4 0.5 0.0 0.1 0.1 0.2 0.2 0.0 0.6 18.4 Tobacco Beverage 3.3 8.0 0.1 0.1 0.0 0.0 0.0 0.4 0.7 0.1 0.1 0.0 0.0 0.0 0.0 0.1 12.9 Forestry & Fishery 0.1 0.4 0.8 0.0 0.0 0.0 0.2 0.1 0.0 0.1 0.0 0.0 0.0 0.0 -0.1 0.0 1.7 Energy products 0.3 0.3 0.1 0.2 0.0 0.0 2.0 7.7 0.0 0.0 1.5 0.1 0.0 4.8 0.2 1.0 18.2 Mineral products 0.8 2.1 1.0 1.1 0.1 0.0 0.4 0.2 0.3 1.1 0.6 0.7 0.6 0.5 0.1 0.5 10.1 Textile 1.1 1.8 8.9 0.8 0.2 0.2 13.0 0.1 5.1 17.5 2.5 2.2 0.3 0.1 0.0 0.7 54.6 Apparel 0.0 0.0 0.2 0.0 0.0 0.0 0.1 0.0 2.9 0.0 0.0 0.1 0.0 0.0 0.0 0.0 3.4 Leather & shoes 0.4 0.4 0.1 0.0 0.0 0.0 1.5 0.0 0.0 0.9 0.2 0.2 0.2 0.0 0.0 0.1 4.1 Other Light Manuf -0.2 -0.2 0.5 0.0 0.0 0.0 0.1 0.0 0.6 -0.4 0.0 0.0 0.0 -0.1 0.0 0.0 0.3 Wood & paper 3.2 2.0 1.5 0.3 0.7 0.0 2.0 0.2 1.6 1.9 3.6 0.0 0.2 0.1 0.0 1.3 18.6 Intermediates 12.4 13.0 24.9 2.0 1.1 0.3 17.8 2.8 4.9 25.4 6.3 0.6 0.8 3.4 0.1 10.5 126.4 Motor vehicle 1.6 5.4 23.8 0.0 0.0 0.2 1.1 0.0 0.0 0.2 0.1 0.0 0.3 0.0 0.0 0.2 33.1 Other Trans 2.7 2.3 0.8 0.0 0.1 0.0 0.4 0.2 0.0 4.4 0.9 0.2 0.0 0.0 0.0 0.5 12.5 Electronics 6.6 4.1 17.0 0.1 0.5 0.0 4.5 4.3 4.0 7.6 3.5 0.0 0.0 0.1 0.0 0.1 52.6 Machinery 4.5 8.6 9.4 0.1 0.2 0.0 1.7 0.6 2.6 5.5 0.8 0.0 0.0 0.0 0.0 0.3 34.6 Traded Services 7.2 22.6 1.7 1.0 0.4 0.5 0.6 1.0 -3.6 0.4 1.6 0.7 1.2 2.5 0.2 4.3 42.4 Total 72.5 78.8 90.9 14.3 20.7 1.4 45.2 20.1 19.8 64.7 25.2 5.5 7.6 11.9 1.9 23.5 504.0 Data source: Results from simulations at current fob/cif prices. A positive number indicates an increase in exports/imports from China and Taiwan entering the WTO..

37
Table 8 Differences between a WTO with and without China: Aggregated Economic Indicators by Region United
States Western Europe
Japan Australia & New Zealand
Canada Mexico Korea Singopare
Hong Kong
Taiwan China ASEAN South Asia
Latin America MFA
Mideast & Africa MFA
Low income Africa
Rest of the
World
World Average
Accumulated Growth from 2000-2010, percentage point change from baseline
Real GDP 0.21 0.15 0.16 0.38 0.37 -0.22 0.50 2.23 0.70 0.52 2.85 -0.22 -1.06 -0.19 0.00 0.06 -0.05 0.22 Real Export 0.25 -0.26 0.35 -0.58 -0.43 -0.31 0.16 0.03 0.07 7.36 54.05 -0.96 -4.34 -0.88 -0.92 -0.52 -0.66 2.94 Real Import 2.62 1.53 2.36 1.66 0.88 -0.52 2.53 1.50 1.63 7.64 31.12 -0.21 -3.86 -0.37 0.31 0.87 0.34 2.68 TFP 0.00 0.00 0.00 0.00 0.00 -0.04 -0.07 -0.22 -0.06 0.16 1.72 -0.09 -0.25 -0.10 -0.12 -0.13 -0.08 0.09 Capital Stock 0.09 0.04 0.05 0.10 0.10 -0.10 0.23 1.08 0.28 0.23 1.50 -0.07 -0.34 -0.06 0.01 0.01 -0.01 0.09
Average Annual Growth Rate from 2000-2010, percentage point change from baseline
Real GDP 0.02 0.01 0.01 0.03 0.03 -0.01 0.03 0.14 0.04 0.03 0.15 -0.02 -0.06 -0.02 0.00 0.00 0.00 0.02 Export 0.02 -0.02 0.03 -0.04 -0.04 -0.02 0.01 0.00 0.01 0.49 2.52 -0.05 -0.23 -0.06 -0.05 -0.04 -0.04 0.20 Import 0.19 0.11 0.17 0.13 0.06 -0.03 0.16 0.10 0.11 0.52 1.67 -0.01 -0.23 -0.02 0.02 0.07 0.03 0.20 TFP 0.00 0.00 0.00 0.00 0.00 0.00 0.00 -0.02 0.00 0.01 0.12 -0.01 -0.02 -0.01 -0.01 -0.01 0.00 0.01 Capital Stock 0.00 0.00 0.01 0.01 0.00 0.00 0.01 0.06 0.02 0.01 0.07 0.00 -0.02 -0.01 0.00 0.00 -0.01 0.01
Agricultural Labor Force Migration, 2001-2010, 1000 persons Accumulated -37 -7 0 -8 -9 -27 0 0 0 18 5333 -318 -347 -152 -33 -146 -161 4103
Change of Equivalent variation, Billion 1997 US$ Accumulated 130.4 85.7 47.4 11.7 14.2 -5.6 16.3 11.6 6.9 15.6 188.1 -3.0 -33.1 -13.0 3.7 1.4 -2.4 476.0
Real Exports, Change from baseline, 2001-2010, Billion 1997 US$ in fob price Accumulated 16.0 -15.8 13.1 -1.9 -5.2 -1.9 1.8 -0.8 0.7 65.8 883.4 -15.4 -15.6 -6.8 -12.5 -1.3 -13.9 889.7
Real imports, Change from baseline, 2001-2010, Billion 1997 US$ in fob price Accumulated 164.7 93.1 60.4 8.0 10.3 -3.5 23.7 11.7 8.5 64.0 460.4 -4.1 -15.7 -5.0 3.9 2.4 7.0 889.7 Nominal trade balance, Change from baseline, Billion US$ Accumulated -2.6 2.3 2.5 -0.1 0.4 0.6 0.5 1.0 0.0 -0.1 -5.8 -1.1 1.5 0.7 0.0 -0.1 0.5 0.0 Term of trade, Change from baseline, percent 2004 0.25 0.23 0.48 0.46 0.15 -0.11 0.59 0.39 0.64 -0.58 -3.35 0.30 -0.03 0.05 0.13 0.22 0.13 2010 0.39 0.24 0.44 1.28 1.20 -0.41 0.82 0.52 0.49 -0.98 -5.66 0.22 -1.93 -0.24 0.05 0.55 0.02
Data source: Results from simulations.

38
Appendix Table Key Substitution Elasticities Used in the Model
Domestic / Imports a
Sources of Imports a
Primary Factors a
Value-added / Intermediate b
Rice 1.760 3.520 0.248 0.628Wheat 1.760 3.520 0.248 0.628Other grains 1.760 3.520 0.248 0.628Oilseeds 1.760 3.520 0.248 0.628Planted fiber 1.760 3.520 0.248 0.628Non-grain crops 1.760 3.520 0.248 0.628Livestock 2.100 4.387 0.248 0.628Dairy and meats 1.430 2.860 1.120 0.628Processed food 1.430 2.860 1.120 0.628Tobacco & Beverage 2.015 4.030 1.120 0.978Forest and fishery 1.820 3.640 0.200 0.628Energy products 1.455 3.245 0.398 1.147Mineral 1.820 3.640 0.977 1.147Textiles 1.430 2.860 1.260 0.978Clothing 2.860 5.720 1.260 0.978Leather & shoes 2.860 5.720 1.260 0.978Other light manufacture 1.820 3.640 1.260 0.978Wood & paper 1.382 2.925 1.260 0.978Intermediates 1.513 2.949 1.260 0.978Motor vehicle 3.380 6.760 1.260 0.804Other Trans 3.380 6.760 1.260 0.804Electronics 1.820 3.640 1.260 0.804Machinery 1.820 3.640 1.260 0.804Traded Services 1.235 2.470 1.407 0.321Housing, utility and construction
1.336 3.021 1.326 0.321
Data Source: a. Down scale from version 5 GTAP elasticities for short run effects (Hertel, 1997). b. Based on G-cubed model (McKibbin, 1998).