the impacts of regular upward bound: results from the
TRANSCRIPT

Contract No.: EA97030001 MPR Reference No.: 8464-600
The Impacts of Regular Upward Bound: Results from the Third Follow-Up Data Collection April 2004 David Myers Rob Olsen Neil Seftor Julie Young Christina Tuttle
Submitted to:
U.S. Department of Education Policy and Program Studies Service 400 Maryland Avenue, SW Room 6W231 Washington, DC 20202
Project Officer:
David Goodwin
Submitted by:
Mathematica Policy Research, Inc. 600 Maryland Ave. S.W., Suite 550 Washington, DC 20024-2512 Telephone: (202) 484-9220 Facsimile: (202) 863-1763
Project Director:
David Myers

This report was prepared for the U.S. Department of Education under Contract Number EA97030001 with Mathematica Policy Research, Inc. David Goodwin served as the contracting officer’s representative. The views expressed herein do not necessarily represent the positions or policies of the Department of Education. No official endorsement by the U.S. Department of Education is intended or should be inferred. U.S. Department of Education Rod Paige Secretary Office of the Under Secretary Eugene Hickok Under Secretary Policy and Program Studies Service Alan Ginsburg Director April 2004 This report is in the public domain. Authorization to reproduce it in whole or in part is granted. While permission to reprint this publication is not necessary, the suggested citation is: U.S. Department of Education, Office of the Under Secretary, Policy and Program Studies Service, The Impacts of Regular Upward Bound: Results from the Third Follow-Up Data Collection, Washington, D.C., 2004. This report is also available on the Department’s Web site at: http://www.ed.gov/about/offices/list/ous/ppss/index.htm1. On request, this publication is available in alternate formats, such as Braille, large print, audiotape, or computer diskette. For more information, please contact the Department’s Alternate Format Center at (202) 260-9895 or (202) 205-8113.
To order copies of this report, write: ED Pubs Education Publications Center U. S. Department of Education P.O. Box 1398 Jessup, MD 20794-1398; Or via electronic mail, send your request to: [email protected]. You may also call toll-free: 1-877-433-7827 (1-877-4-ED-PUBS). If 877 service is not yet available in your area, call 1-800-872-5327 (1-800-USA-LEARN). Those who use a telecommunications device for the deaf (TDD) or a teletypewriter (TTY) should call 1-800-437-0833. To order online, point your Internet browser to: www.edpubs.org.

iii
Acknowledgments
This report on the effects of Upward Bound on student outcomes reflects the contributions of many individuals. The authors would like to thank David Goodwin of the Policy and Program Studies Service of the U.S. Department of Education for his continued support, substantive guidance and encouragement throughout the study. Mary Moore, a principal investigator for the national evaluation of Upward Bound, helped to shape the study design and has helped to interpret study findings. Mark Dynarski provided helpful suggestions on several drafts of the report. Paul Decker led the initial phase of the analysis of program participation, and Larry Radbill conducted the analysis. Tim Silva provided helpful suggestions on the final draft and coordinated the editing process.
The authors would also like to thank the individuals who contributed to the data analysis and
the production of the report. Brittany Dawson, Julia Chou, Valerie Klein and Julia Lin provided excellent research assistance. Daryl Hall edited the report, and Micki Morris prepared the document.


v
CONTENTS
Chapter Page
ACKNOWLEDGMENTS ............................................................................................ iii
EXECUTIVE SUMMARY...........................................................................................xv
I INTRODUCTION .........................................................................................................1 A. CONTEXT AND PURPOSE OF UPWARD BOUND...........................................1 B. RESEARCH DESIGN.............................................................................................4
1. Selection of Upward Bound Projects and Random Assignment .....................4 2. Data Collection ................................................................................................6 3. Estimation of Program Effects.........................................................................7 4. Context for Interpreting Program Effects ........................................................9 5. Subgroup Analysis .........................................................................................11
II UPDATE ON PROGRAM PARTICIPATION, UPWARD BOUND COURSE-TAKING AND EFFECTS ON HIGH SCHOOL OUTCOMES .................15
A. EXPOSURE TO UPWARD BOUND...................................................................15
1. Participation ...................................................................................................15 2. Duration .........................................................................................................15 3. Receipt of Academic and Nonacademic Services..........................................16
B. RECEIPT OF SUPPLEMENTAL SERVICES .....................................................21 C. THE EFFECT OF UPWARD BOUND ON HIGH SCHOOL CREDITS, GRADE POINT AVERAGE AND COMPLETION ............................................24
1. The Effect of Upward Bound on High School Credits, Grade Point
Average and Completion for All Students.....................................................24 2. The Effect of Upward Bound on High School Credits, Grade Point
Average and Completion for Selected Subgroups .........................................25
CONTENTS (continued)
Page
vi
III THE EFFECT OF UPWARD BOUND ON STUDENTS’ POSTSECONDARY EDUCATION EXPERIENCES....................................................................................31
A. THE EFFECT OF UPWARD BOUND ON POSTSECONDARY ENROLLMENT AND PERSISTENCE FOR ALL STUDENTS.........................32
1. The Effect of Upward Bound on Postsecondary Enrollment.........................34 2. The Effect of Upward Bound on Postsecondary Persistence.........................34
B. THE EFFECT OF UPWARD BOUND ON POSTSECONDARY ENROLLMENT AND PERSISTENCE FOR SELECTED SUBGROUPS .........35
1. Subgroups Defined by Educational Expectations..........................................35 2. Subgroups Defined by Academic Risk ..........................................................40 3. Subgroups Defined by the Eligibility Criteria for Upward Bound ................41 4. Subgroups Defined by Race and Ethnicity ....................................................42 5. Subgroups Defined by the Sex of the Student ...............................................50 6. Subgroups Defined by the Likelihood of Being Selected to Participate
in Upward Bound...........................................................................................50 C. THE EFFECT OF UPWARD BOUND ON COLLEGE ENGAGEMENT..........51
IV THE EFFECT OF LONGER UPWARD BOUND PARTICIPATION AND COMPLETION ON POSTSECONDARY ENROLLMENT AND PERSISTENCE.............................................................................................................59
A. RESEARCH QUESTIONS ...................................................................................60 B. RESEARCH METHODS ......................................................................................61 C. THE EFFECT OF LONGER PARTICIPATION AND COMPLETION .............64
1. The Effect of Longer Participation ................................................................65 2. The Effect of Program Completion................................................................65 3. The Effect of Longer Participation and Program Completion on
Enrollment at Four-Year Institutions .............................................................66 4. The Effect of Longer Participation and Program Completion for
Subgroups Defined by Academic Risk ..........................................................68 D. INTERPRETATION OF THE FINDINGS...........................................................69
REFERENCES ...........................................................................................................73

CONTENTS (continued)
Page
vii
APPENDIX A: SAMPLE DESIGN, UNIT NONRESPONSE AND WEIGHTS............................................................................ A-1 APPENDIX B: BASELINE CHARACTERISTICS OF THE TREATMENT AND CONTROL GROUPS, THIRD FOLLOW-UP SURVEY RESPONDENTS......................B-1 APPENDIX C: PROGRAM EFFECTS AND STANDARD ERRORS ..................C-1 APPENDIX D: THE EFFECT OF UPWARD BOUND ON HIGH SCHOOL OUTCOMES BY SELECTED SUBGROUPS ............................. D-1 APPENDIX E: THE EFFECT OF UPWARD BOUND ON COLLEGE ENGAGEMENT BY SELECTED SUBGROUPS.........................E-1 APPENDIX F: METHODS USED TO ESTIMATE THE EFFECTS OF ADDITIONAL UPWARD BOUND PARTICIPATION...............F-1 APPENDIX G: WEIGHTED STANDARD DEVIATIONS FOR ALL OUTCOME VARIABLES.................................................... G-1 APPENDIX H: DATA COLLECTION .................................................................. H-1 APPENDIX I: SAMPLE SIZES AND STANDARD ERRORS FOR REPORTED IMPACT ESTIMATES..............................................I-1

ix
TABLES
Table Page
I.1 RESPONSE RATES ....................................................................................................7 II.1 DURATION AND SURVIVAL ESTIMATES .........................................................17 II.2 UPWARD BOUND ACADEMIC AND ACTIVITY SESSIONS: ALL PARTICIPANTS ...............................................................................................18 II.3 UPWARD BOUND ACADEMIC AND ACTIVITY SESSIONS: PROGRAM COMPLETERS .....................................................................................22 II.4 RECEIPT OF SUPPLEMENTAL SERVICES..........................................................23 II.5 IMPACT OF UPWARD BOUND ON HIGH SCHOOL CREDITS, GRADES AND GRADUATION................................................................................................26 II.6 IMPACT OF UPWARD BOUND ON HIGH SCHOOL CREDITS, GRADES AND GRADUATION FOR STUDENTS WITH HIGHER AND LOWER EDUCATIONAL EXPECTATIONS.........................................................................27 II.7 IMPACT OF UPWARD BOUND ON HIGH SCHOOL CREDITS, GRADES AND GRADUATION BY STUDENTS’ AT-RISK STATUS .................................29 III.1 IMPACT OF UPWARD BOUND ON POSTSECONDARY ENROLLMENT AND CREDITS, INCLUDES ALL SELF-REPORTED POSTSECONDARY ENROLLMENT......................................................................36 III.2 IMPACT OF UPWARD BOUND ON POSTSECONDARY ENROLLMENT AND CREDITS, EXCLUDES UNVERIFIED SELF-REPORTED ENROLLMENT.........................................................................................................37 III.3 IMPACT OF UPWARD BOUND ON POSTSECONDARY ENROLLMENT AND CREDITS FOR STUDENTS WITH HIGHER AND LOWER EDUCATIONAL EXPECTATIONS, INCLUDES ALL SELF-REPORTED POSTSECONDARY ENROLLMENT......................................................................38 III.4 IMPACT OF UPWARD BOUND ON POSTSECONDARY ENROLLMENT AND CREDITS FOR STUDENTS WITH HIGHER AND LOWER EDUCATIONAL EXPECTATIONS, EXCLUDES UNVERIFIED SELF-REPORTED ENROLLMENT.........................................................................39

TABLES (continued)
Table Page
x
III.5 IMPACT OF UPWARD BOUND ON POSTSECONDARY ENROLLMENT AND CREDITS BY STUDENTS’ AT-RISK STATUS, INCLUDES ALL SELF-REPORTED POSTSECONDARY ENROLLMENT .....................................44 III.6 IMPACT OF UPWARD BOUND ON POSTSECONDARY ENROLLMENT AND CREDITS BY STUDENTS’ AT-RISK STATUS, EXCLUDES UNVERIFIED SELF-REPORTED ENROLLMENT................................................45 III.7 IMPACT OF UPWARD BOUND ON POSTSECONDARY ENROLLMENT AND CREDITS BY STUDENTS’ ELIGIBILITY STATUS, INCLUDES ALL SELF-REPORTED POSTSECONDARY ENROLLMENT .....................................46 III.8 IMPACT OF UPWARD BOUND ON POSTSECONDARY ENROLLMENT AND CREDITS BY STUDENTS’ ELIGIBILITY STATUS, EXCLUDES UNVERIFIED SELF-REPORTED ENROLLMENT................................................47 III.9 IMPACT OF UPWARD BOUND ON POSTSECONDARY ENROLLMENT AND CREDITS FOR AFRICAN AMERICAN, WHITE AND HISPANIC STUDENTS, INCLUDES ALL SELF-REPORTED POSTSECONDARY ENROLLMENT.........................................................................................................48 III.10 IMPACT OF UPWARD BOUND ON POSTSECONDARY ENROLLMENT AND CREDITS FOR AFRICAN AMERICAN, WHITE AND HISPANIC STUDENTS, EXCLUDES UNVERIFIED SELF-REPORTED ENROLLMENT ...49 III.11 IMPACT OF UPWARD BOUND ON POSTSECONDARY ENROLLMENT AND CREDITS FOR MALE AND FEMALE STUDENTS, INCLUDES ALL SELF-REPORTED POSTSECONDARY ENROLLMENT .....................................52 III.12 IMPACT OF UPWARD BOUND ON POSTSECONDARY ENROLLMENT AND CREDITS FOR MALE AND FEMALE STUDENTS, EXCLUDES UNVERIFIED SELF-REPORTED ENROLLMENT................................................53 III.13 IMPACT OF UPWARD BOUND ON POSTSECONDARY ENROLLMENT AND CREDITS BY THE LIKELIHOOD OF ADMISSION TO UPWARD BOUND, INCLUDES ALL SELF-REPORTED POSTSECONDARY ENROLLMENT.........................................................................................................54 III.14 IMPACT OF UPWARD BOUND ON POSTSECONDARY ENROLLMENT AND CREDITS BY THE LIKELIHOOD OF ADMISSION TO UPWARD BOUND, EXCLUDES UNVERIFIED SELF-REPORTED ENROLLMENT .........55 III.15 IMPACT OF UPWARD BOUND ON COLLEGE ENGAGEMENT ......................57

TABLES (continued)
Table Page
xi
IV.1 DURATION OF UPWARD BOUND PARTICIPATION AND COMPLETION RATES, EXCLUDING NO-SHOWS .............................................61 IV.2 CHARACTERISTICS OF UPWARD BOUND PARTICIPANTS WHO ENTERED IN NINTH OR TENTH GRADE BY PARTICIPATION DURATION AND COMPLETION STATUS.....................62 IV.3 IMPACT OF AN ADDITIONAL YEAR OF UPWARD BOUND PARTICIPATION ON POSTSECONDARY ENROLLMENT AND CREDITS..........................................................................................................66 IV.4 IMPACT OF UPWARD BOUND COMPLETION ON POSTSECONDARY ENROLLMENT AND CREDITS....................................67 IV.5 IMPACT OF AN ADDITIONAL YEAR OF UPWARD BOUND PARTICIPATION ON POSTSECONDARY ENROLLMENT AND CREDITS BY STUDENTS’ AT-RISK STATUS ...........................................68 IV.6 IMPACT OF UPWARD BOUND COMPLETION ON POSTSECONDARY ENROLLMENT AND CREDITS BY STUDENTS’ AT-RISK STATUS.......................................................................69


xiii
FIGURES
Figure Page
1 IMPACT OF UPWARD BOUND ON POSTSECONDARY ENROLLMENT, BY LEVEL OF EDUCATIONAL EXPECTATIONS ............................................ xix II.1 UPWARD BOUND ACADEMIC SESSIONS TAKEN BY PARTICIPANTS .......19 II.2 UPWARD BOUND NONACADEMIC ACTIVITIES BY PARTICIPANTS..........20


xv
Executive Summary
Policymakers have long been concerned about the disparities in college attendance between more and less advantaged groups of students. Data from the 1990s indicate that students from high-income families were more than twice as likely to attend a four-year college or university as students from low-income families, and this difference is not surprising given disparities in college preparation between high- and low-income high school students. While the vast majority of high-income high school graduates are qualified to attend a four-year college—based on grades and test scores—only half of low-income students have adequate qualifications (Lutz and Carroll, 1998).
Upward Bound is one of the largest and longest running federal programs designed to help
economically disadvantaged students prepare for, enter and succeed in college. Upward Bound is “designed to generate skills and motivation necessary for success in education beyond high school among young people from low-income backgrounds and inadequate secondary school preparation” (Public Law 90-222, Dec. 23, 1967). About 52,000 students now participate in 727 regular Upward Bound projects around the country. At least two-thirds of each project’s participants must be both low-income and potential first-generation college students. Students typically enter the regular Upward Bound program while in ninth or tenth grade. Although students may participate in Upward Bound through the summer following twelfth grade (for three to four years total), participants typically remain in Upward Bound for about 21 months. Projects provide students with a variety of services, including instruction, tutoring and counseling. In addition to regularly scheduled meetings throughout the school year, projects also offer an intensive instructional program that meets daily for about six weeks during the summer. The vast majority of projects are hosted by four-year colleges.
Since December 1991, Mathematica Policy Research, Inc., (MPR) has been conducting the national evaluation of Upward Bound for the U.S. Department of Education (ED). The evaluation has focused on program implementation issues and the effects of the program on student outcomes. The “impact study” is designed to measure the impacts or effects of regular Upward Bound on student outcomes, and it is based on a longitudinal evaluation in which eligible applicants from a nationally representative sample of projects were randomly assigned to Upward Bound or to a control group. Results from the implementation study were presented in Moore (1997a) and effects of Upward Bound on high school outcomes were presented in Myers and Schirm (1999). The results summarized here are based on the national evaluation’s third follow-up data collection, which was completed in 2000. Because the entire sample of students was beyond high school age by that time, the report includes updated findings on the effects of Upward Bound on high school outcomes. In addition, based on data covering the first few years after sample members left high school, the report addresses the following research questions:
• What effect does Upward Bound have on students’ postsecondary experiences?
• Who benefits most from Upward Bound?
• What is the association between staying in Upward Bound and student outcomes?

xvi
Because few other programs provide the same intensive experience as regular Upward Bound, the opportunity to participate in regular Upward Bound is an opportunity for students to get additional help in preparing for college. However, because more intensive programs are costlier than less intensive ones, regular Upward Bound is considerably more expensive than most other precollege programs. The evaluation was designed to test whether students in regular Upward Bound experienced better postsecondary outcomes than if they had participated in other available, but typically less intensive, precollege programs.
Methods and Data
Methods
The first two research questions were addressed by comparing the treatment group to the control group. Because eligible students were randomly assigned to these two groups, and because only treatment students were offered the opportunity to participate in Upward Bound, the differences between the two groups reveal the value-added of regular Upward Bound above and beyond the other programs and services that are available. Upward Bound operates in a service-rich environment, and students who are eligible for Upward Bound may participate in several precollege programs. Therefore, it is not surprising that many of the students assigned to both the treatment and control groups participate in precollege services other than regular Upward Bound. In fact, it is critical to the scientific validity of the study that students in the treatment and control groups have the same opportunities to pursue other services as the typical eligible applicant to regular Upward Bound. This report compares how eligible applicants fare when they are offered an opportunity to participate in the program to how they would fare without that opportunity.
The third research question cannot be addressed using random assignment. To assess the effect of staying in the program for longer periods, the national evaluation used statistical methods that attempted to approximate the rigor of random assignment and, in doing so, allowed us to examine the association between length of participation and student outcomes. Students who stayed in the program for shorter periods of time were statistically matched with similar students who remained in the program for longer periods. Similarly, students who did not complete Upward Bound (did not stay until the spring of their senior year of high school) were matched with similar students who completed the program. Because the matching procedure may not have adjusted for all relevant differences between students who participated for different lengths of time, the results must be interpreted with greater caution than used when assessing results based on random assignment.
Data Sources
Several data sources have informed this report. A nationally representative sample of 67 Upward Bound projects hosted by two- and four-year colleges was selected for the evaluation. In 1993, a survey of these projects was conducted. From 1992 to 1994, a baseline survey was conducted to obtain information on students that applied to these projects. During the same period, eligible applicants in each project were randomly assigned to either a treatment group or a control group. About 1,500 students were assigned to the treatment group, and about 1,300 were assigned to the control group. In 1994-1995, 1996-1997 and 1998-2000, follow-up surveys

xvii
were conducted. The response rates for these surveys were 97 percent, 86 percent and 81 percent, respectively. High school and postsecondary transcripts were also collected. Finally, Upward Bound project staff reported on the participation of students in the program.
When information was most recently collected on Upward Bound, the majority of students
in the study had been out of high school for about two years. Because few students had an opportunity to complete college by that time, this report focuses on how Upward Bound affects preparation for college, college enrollment, the highest level of postsecondary education attended and initial progress in college.1 Subsequent reports will examine college completion.
Overview of Major Findings
Findings in this report suggest that for the average student, Upward Bound (1) increased the number of high school math credits earned by participants, (2) did not affect other measures of high school academic preparation, (3) may have increased enrollment at four-year institutions and (4) did not affect enrollment at postsecondary institutions more generally when all types of postsecondary institutions are considered. Perhaps the most notable effect of Upward Bound was to increase the likelihood of attending four-year colleges and universities relative to other postsecondary institutions for students with lower educational expectations.2 Finally, Upward Bound would have had larger effects if students remained in the program for longer periods of time. Below, we describe the findings in greater detail.
Effects on Postsecondary Outcomes
• Upward Bound had no effect on overall enrollment or total credits earned at postsecondary institutions, but it may have increased enrollment in four-year postsecondary institutions. Almost three-fourths of students in both the treatment group and the control group attended postsecondary institutions, broadly defined to include four-year institutions, two-year institutions, vocational schools and other postsecondary institutions. While the program may have increased the percent of students attending four-year colleges by about 6 percentage points, the evidence is not conclusive (see Chapter III).
1 In this report, the highest level of postsecondary education is defined based on the types of postsecondary
institutions that students attended. Students who had attended a four-year college or university were classified as having enrolled in a four-year institution. Students who had not attended a four-year college or university but had attended a two-year college were classified as having enrolled in a two-year institution. Students who had not attended either a four-year college or university or a two-year college but had attended a vocational school after high school were classified as having enrolled in a vocational postsecondary institution.
2 Lower educational expectations were defined as expecting to complete less than a bachelor’s degree and higher expectations included completing a bachelor’s degree or higher. About 20 percent of the eligible program applicants had lower expectations.
xviii
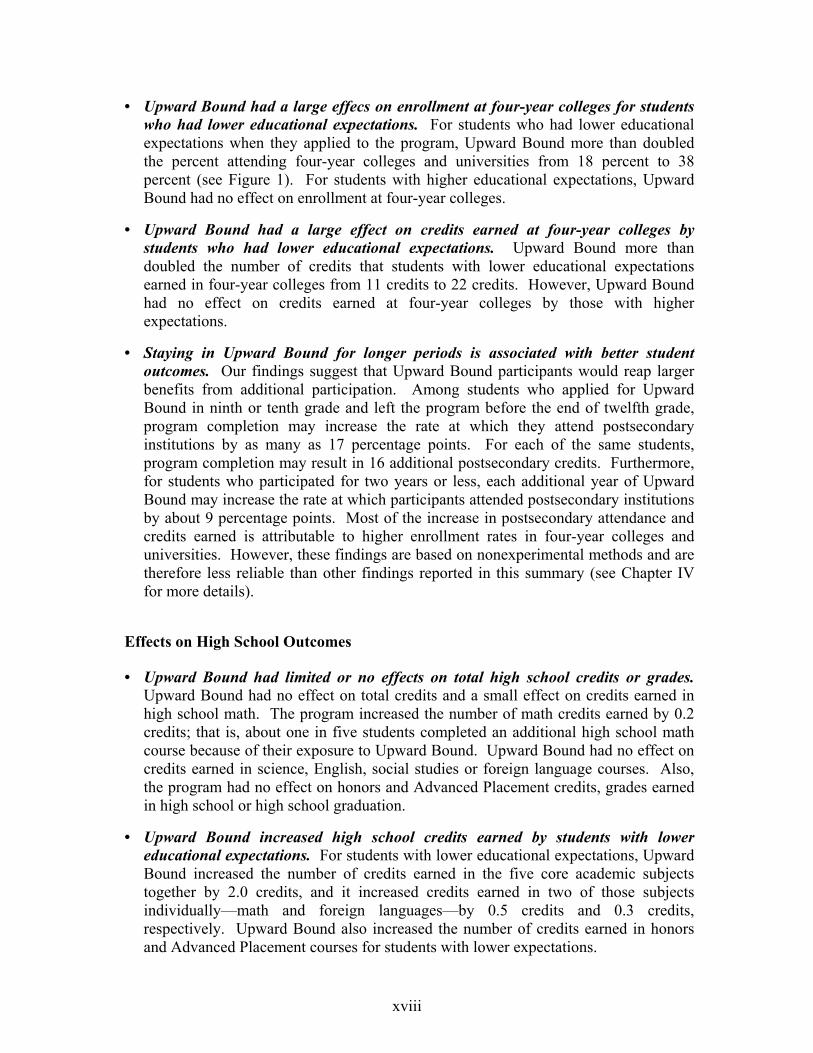
• Upward Bound had a large effecs on enrollment at four-year colleges for students who had lower educational expectations. For students who had lower educational expectations when they applied to the program, Upward Bound more than doubled the percent attending four-year colleges and universities from 18 percent to 38 percent (see Figure 1). For students with higher educational expectations, Upward Bound had no effect on enrollment at four-year colleges.
• Upward Bound had a large effect on credits earned at four-year colleges by students who had lower educational expectations. Upward Bound more than doubled the number of credits that students with lower educational expectations earned in four-year colleges from 11 credits to 22 credits. However, Upward Bound had no effect on credits earned at four-year colleges by those with higher expectations.
• Staying in Upward Bound for longer periods is associated with better student outcomes. Our findings suggest that Upward Bound participants would reap larger benefits from additional participation. Among students who applied for Upward Bound in ninth or tenth grade and left the program before the end of twelfth grade, program completion may increase the rate at which they attend postsecondary institutions by as many as 17 percentage points. For each of the same students, program completion may result in 16 additional postsecondary credits. Furthermore, for students who participated for two years or less, each additional year of Upward Bound may increase the rate at which participants attended postsecondary institutions by about 9 percentage points. Most of the increase in postsecondary attendance and credits earned is attributable to higher enrollment rates in four-year colleges and universities. However, these findings are based on nonexperimental methods and are therefore less reliable than other findings reported in this summary (see Chapter IV for more details).
Effects on High School Outcomes
• Upward Bound had limited or no effects on total high school credits or grades. Upward Bound had no effect on total credits and a small effect on credits earned in high school math. The program increased the number of math credits earned by 0.2 credits; that is, about one in five students completed an additional high school math course because of their exposure to Upward Bound. Upward Bound had no effect on credits earned in science, English, social studies or foreign language courses. Also, the program had no effect on honors and Advanced Placement credits, grades earned in high school or high school graduation.
• Upward Bound increased high school credits earned by students with lower educational expectations. For students with lower educational expectations, Upward Bound increased the number of credits earned in the five core academic subjects together by 2.0 credits, and it increased credits earned in two of those subjects individually—math and foreign languages—by 0.5 credits and 0.3 credits, respectively. Upward Bound also increased the number of credits earned in honors and Advanced Placement courses for students with lower expectations.

xix
Upward Bound had a significantly larger effect on the likelihood of attending a four-year postsecondary institution for students who did not expect to complete a bachelor's degree when they entered Upward Bound than for students who expected to complete a bachelor's degree at that time.
Source: pst-hiexp.log and pst-loexp.log
by Level of Educational Expectations
Figure 1
Impact of Upward Bound on Postsecondary Enrollment,
Four-year Two-year Other
Students with Lower Educational Expectations
18
38
34
17
2
2
0 20 40 60 80 100
Control
Treatment
Percent Attending
58%
54%
Students with Higher Educational Expectations
52
55
23
20
2
4
0 20 40 60 80 100
Control
Treatment
Percent Attending
80%
77%


1
I. Introduction
A. Context and Purpose of Upward Bound
Enrolling in college and completing a degree are important milestones for many young
adults. Besides potential long-term benefits from college attendance and completion, such as
increased wages, there are potential societal benefits that include reducing the burden on social
service agencies and the criminal justice system, increasing local, state and federal tax revenues
and, as some suggest, producing a more educated society that is better able to participate in a
democratic form of government (see, for example, Decker et al. 1997; Oakes et al. 2000).
Although completion of a college education is important from both the perspective of the
individual and society, many potential college students lack the skills or the resources needed to
enter college or complete a college degree. Those who face some of the greatest barriers to
pursuing a postsecondary education often include young adults from low-income families and
families where neither parent has acquired a bachelor’s degree; often, these same students are
students of color (U.S. Department of Education 2001). Related to the low postsecondary
enrollment rates for these students is the well-documented relationship between family
socioeconomic status, race, ethnicity and high school academic preparation (see, for example,
Coleman et al. 1966; Jencks et al. 1972; Mosteller and Moynihan 1972; Congressional Budget
Office 1987; Jacobson et al. 2001). Although progress has been made to close the gap in
achievement test scores between disadvantaged and more-advantaged students, large differences
remain. For example, on achievement tests as reported by the National Assessment of
Educational Progress, about 84 percent of African American students had scores that were lower
than the typical white youth (Jencks and Phillips 1998). Furthermore, data from the National
Education Longitudinal Study (1988-94) suggest that only half of low-income high school

2
graduates are academically prepared to attend four-year colleges or universities (Lutz and
Carroll 1998).
Since the War on Poverty started in the 1960s, many federal, state, community and
privately-funded initiatives have been undertaken to alleviate some of the barriers to attending
college and completing a degree faced by low-income, first-generation college students and
minority students (see, for example, Adelman 2000; Swail and Perna 2000; James, Jurich, and
Estes 2001). Programs range from the Equity 2000, Advancement Via Individual Determination
(AVID) and Gaining Early Awareness and Readiness for Undergraduate Programs (GEAR UP),
which are integrated with the regular high school or middle school experiences, to programs that
more often supplement the high school experience, such as Upward Bound, Talent Search and I
Have a Dream. A review of published reports of these programs suggests that few have been
subjected to rigorous evaluation: the effectiveness of these approaches is generally unknown.3
In December 1991, the U.S. Department of Education initiated a rigorous, longitudinal
evaluation conducted by Mathematica Policy Research (MPR) and its subcontractors, the
Educational Testing Service, Westat, Decision Information Resources and Branch Associates,
Inc., to determine whether the intensive strategy used by Upward Bound enables students to
perform better in high school and subsequently to enter and complete college. This report
summarizes the effect of the regular Upward Bound program on students’ high school and early
postsecondary experiences.4
3 An earlier study of Upward Bound by the Research Triangle Institute (Burkheimer et al. 1979) is one of the
more rigorous evaluations; however, it relied on comparison group methods that may suffer from “selection bias” of the type described on page 6 of this report.
4 Within Upward Bound, three programs operate: regular Upward Bound, Veterans Upward Bound and Upward Bound Math and Science. In 2001, there were 727 regular Upward Bound projects serving 51,641 students, 47 Veterans Upward Bound projects serving 9,936 participants, and 121 Upward Bound Math and Science projects serving 6,003 students.

3
Upward Bound is designed to “generate skills and motivation necessary for success in
education beyond high school among young people from low-income backgrounds and
inadequate secondary school preparation” (Public Law 90-222, Dec. 23, 1967). In FY 2001,
with federal funds of more than $250 million, the regular Upward Bound program served about
51,600 students in 727 projects nationwide. The average cost per student served was about
$4,800 per year, and these expenditures provided a variety of services. Most Upward Bound
projects emphasized academic preparation for attending and completing college and are best
characterized along the following dimensions:
• Upward Bound offers a full range of precollege services. During the academic year participants engage in activities on a regular basis, often weekly; during the summer, they attend an intensive, full-day academic program that typically lasts for about six weeks.
• Upward Bound courses and activities emphasize academics. A key focus of program activities is to help students acquire academic proficiencies in challenging college-prep courses. Projects often require students to take Upward Bound courses during both the summer and school year. Also, almost all projects provide students with tutoring for high school course work and help to prepare them for college entrance exams.
• Upward Bound provides many activities in addition to academic course work. Projects complement academic offerings with a wide range of activities. Students attend plays, visit museums, tour college campuses and learn about and apply for financial aid.
Previous reports from this evaluation have documented the operations of Upward Bound
projects (Moore 1997a), the characteristics of students served by Upward Bound projects (Myers
and Schirm 1997) and the program’s short-term effects on students’ high school experiences
(Myers and Schirm 1999). This report updates previous findings and provides a more complete
picture of students’ early postsecondary experiences.
In the remainder of this chapter, we provide an overview of the evaluation design. Chapter
II updates the findings described in Myers and Schirm (1999). Chapter III describes the
4
program’s effect on postsecondary enrollment, postsecondary persistence and students’
experiences in college. Chapter IV discusses the association of program completion and length
of time students spend in Upward Bound with postsecondary outcomes. Finally, several
appendices present details concerning the evaluation and the data analyses.
B. Research Design
1. Selection of Upward Bound Projects and Random Assignment
The national evaluation of Upward Bound is unique within education evaluation studies
because of two important design elements: (1) a nationally representative sample of Upward
Bound projects and (2) random assignment of eligible applicants to Upward Bound and a control
group. These two design elements provide for both external validity and internal validity; that is,
the ability to generalize the results to the population of regular Upward Bound projects and to
make inferences about the causal effects of Upward Bound on student outcomes.
a. Selection of Upward Bound Projects
For the impact study, we randomly selected 70 Upward Bound projects. These projects are
representative of all regular Upward Bound projects that were located in the 50 states and the
District of Columbia, were hosted by a postsecondary institution, had operated for at least three
years by October 1992 and were not dedicated to serving only students with physical disabilities.
Of the 70 projects we originally selected, 11 could not participate or had to be excluded for
various reasons. For example, some did not plan to recruit new students for the 1992-1993
school year and some had too few applicants to accommodate random assignment. We replaced
8 of these 11 projects with similar, randomly selected projects and ended up with a sample of 67
projects. See Appendix A for a detailed description of the sample selection and weighting
procedures.

5
b. Random Assignment of Eligible Applicants to Upward Bound and a Control Group
During the 1992-1993 and 1993-1994 school years, we randomly assigned eligible
applicants from each project to either a treatment group, which was invited to participate in
Upward Bound, or a control group, which was not invited to participate.5 Eligible applicants
were defined as students whom the projects had recruited and who met the federal eligibility
criteria (low-income or first-generation status) and project-specific criteria for participation. All
of the projects had more applicants than openings, and all served the same number of students
they would have normally served under their usual selection procedures.6 We implemented
random assignment over 14 months so that projects could use their normal recruiting procedures
and enroll students following their usual enrollment schedules. Nationwide, the random
assignment process resulted in a treatment group of about 1,500 students and a control group of
about 1,300 students. A detailed description of the random assignment procedures is presented
in Myers et al. (1993).
5 After randomly assigning students to the treatment and control groups, we discovered that project directors at
the 67 projects conducting random assignment had allowed 29 students in the control group, or about 2.2 percent of control students, to participate in Upward Bound. Although these students continued to receive Upward Bound services, we maintained their original status as members of the control group to preserve the comparability between the two groups due to random assignment. In the follow-up student surveys, an alternative source of information on Upward Bound participation, 43 control group members (3.3 percent) reported that they had participated at Upward Bound projects, including projects that were not conducting random assignment. Sensitivity tests reveal that if we count these 43 students as participants, reestimate the effects of Upward Bound, and round the estimates as done in the report, we obtain impact estimates that often match exactly the estimates presented in the report. Therefore, “crossover” had little effect on the estimates presented in this report. See Appendix C for more details.
6 To accommodate project wishes concerning the composition of the participants served by the program, such as sex, racial or ethnic group balance, we used stratified random sampling to select the treatment and control groups. Despite this, random assignment may have led some Upward Bound projects to select students they would not normally select. While we cannot determine whether this happened, we can assess whether the average effects of the program might be sensitive to such a change. Before random assignment, we asked project directors to rate each applicant as either most likely, somewhat likely or least likely to have been selected under normal selection procedures; in this report, we assessed whether the effects of Upward Bound vary across these three groups. Chapter III provides no evidence that the effects on college enrollment and highest level of postsecondary education varied across groups, but some evidence that the effects on postsecondary persistence were particular large for students classified as least likely to attend (see Table III.13).

6
Random assignment allows us to compute estimates of program effects that should be free
of selection biases. In observational studies, selection biases are often present and produce both
measured and unmeasured differences between the group that receives the intervention and the
comparison group. These differences become confounded with the program’s true effect on
student outcomes. However, because of random assignment, the only systematic difference
between treatment and control groups in this evaluation is that the former was offered the
opportunity to participate in Upward Bound; otherwise, the two groups are statistically
equivalent (see Appendix B, Table B.1). On key demographic variables, there are no differences
between treatment and control groups (for example, gender, race, ethnicity and low-income
status). For some other background variables, small differences exist between the two groups
(for example, how often parents checked on homework, number of times students missed a day
of school and mothers’ educational expectations). To adjust for possible differences in the
treatment and control groups, we computed regression-adjusted estimates of program effects
where we statistically controlled for some background characteristics, such as students’
educational expectations—a strong correlate with parents’ expectations and other parent inputs—
grade at application, race, ethnicity and gender.
2. Data Collection
The analyses described in this report are based on information from students, their schools
and the Upward Bound projects to which they applied. Almost all students in the sample
completed a baseline questionnaire when they applied to Upward Bound (see Table I.1). For
each of the follow-up surveys, high response rates were achieved. In the spring of 1994, we
conducted the first follow-up survey of the students and achieved a 97 percent response rate. In
1996 and 1998, we conducted additional follow-up surveys with response rates of 86 percent and

7
81 percent, respectively. Each time, we also collected transcripts from high schools and
postsecondary education institutions attended by students in the evaluation sample. Appendix A
describes the procedures used to adjust for survey nonresponse, and Appendix H describes the
data collection procedures.
3. Estimation of Program Effects
In the next two chapters, we present estimates of two different types of program effects.
The first type is the effect of being offered the opportunity to participate in Upward Bound, or
the program’s effect on those students who applied and were eligible for Upward Bound. To
estimate this effect, we computed the difference between the average for the treatment group
(those offered the opportunity to participate in Upward Bound) and the average for the control
group (those not offered the opportunity) on a given outcome, such as the proportion ever
enrolled in a four-year college or university.7 The size of this effect depends on two things: (1)
the rate at which students participate in or “show up” for Upward Bound services and (2) the
7 In practice, we estimated program impacts by estimating a linear regression model with the outcome of
interest as the dependent variable. The independent variables included an indication of students’ random assignment status (treatment status), sex, race, ethnicity, educational expectations at baseline, grade at application, and low-income or first-generation status. Including additional control variables in the regression model allowed us to (1) increase the precision with which we estimated the impacts and (2) adjust for chance differences between the treatment and control groups on selected characteristics. More details about the computational procedures are presented in Appendix C. For selected outcomes, we replicated the analyses using a different technique, a logit model, and obtained similar results.
Survey Percent Responding
Baseline (1992 - 1993) 99
First Follow-up (1994 - 1995) 97
Second Follow-up (1996 - 1997) 86
Third Follow-up (1998 - 1999) 81
Table I.1
Response Rates

8
effect of the services on those who actually participate in Upward Bound. By focusing the
analyses on the effect of students being given the opportunity to participate in Upward Bound,
we define the treatment more broadly than simply what the Upward Bound program
accomplishes once students participate in various Upward Bound activities and courses; it also
includes the projects’ efforts in getting students to participate in services.8
The second type of program effect is the effect of actual participation in Upward Bound;
these estimates adjust for students who never showed up for services and indicate the effects for
students who attended at least one session. To compute the effect of participating in Upward
Bound, we used an instrumental variables estimator.9,10 To interpret the instrumental variables
estimates as the true effect of Upward Bound on participants, some untestable assumptions had
to be made.11 Because of these assumptions, and because these estimates may only reflect part
of the effect of offering Upward Bound services to eligible applicants, we focus our discussion
on the first type of program effect. We present both types of program effects in the tables so that
readers may compare findings for all students based on the first type of program effect and for
students who participated based on the second type of effect. In general, the same conclusions
8 About 20 percent of the students who were determined to be eligible for the program never participated. 9 The instrumental variables regression model included the same independent variables as the regression model
to estimate the effect of the opportunity to participate in Upward Bound. However, in the instrumental variables regression model, we specified the treatment indicator as an instrumental variable and assumed that the opportunity to participate in Upward Bound only affects the outcomes of interest through the probability of participating.
10 Angrist, Imbens and Rubin (1996) show that under simple conditions, the instrumental variables estimator is equivalent to the estimator proposed by Bloom (1989).
11 When using this estimator to interpret the estimates as the impact for program participants, we had to make two assumptions. First, we assumed that the program had no impact on students who did not actually attend one or more sessions; that is, early exposure to Upward Bound after being selected for the program was assumed to have no impact on students’ high school, postsecondary or related outcomes. This assumption would be violated, for example, when students who may have declined to participate received encouragement concerning their academic potential from projects and were motivated to perform at a higher level while in high school. Second, we assumed that the proportion of students in the Upward Bound group who did not actually receive services is the same proportion we would have observed among students in the control group if they had been given a chance to participate.

9
emerge from estimates of both types of effects. The effect on participants tends to be 20 to 25
percent larger than the effects on all students, and the difference is attributable to the treatment
group members who did not participate in Upward Bound. For more details on the methods used
to estimate program effects, see Appendix C.
It is possible for the estimated effect of Upward Bound to be positive or negative in
circumstances where the true effect is zero. Because the evaluation is based on a sample of
Upward Bound eligible applicants, the estimated program effects presented in this report contain
what statisticians refer to as “sampling error.” To determine whether the estimated program
effects can be attributed to the true effects of Upward Bound, we tested whether the estimates are
“statistically significant”—significantly different from zero—at three levels that are commonly
used in conducting such tests.12 In the chapters that follow, we argue that Upward Bound had an
effect if the estimated effect is statistically significant at any of these levels. If the estimated
effect of Upward Bound on some outcome variable is statistically insignificant, one should not
necessarily conclude that the true effect of Upward Bound was zero. However, the true effect
was probably small if the estimated effect is statistically insignificant because the sample was
designed to “detect” program effects of moderate size.
4. Context for Interpreting Program Effects
To properly interpret the estimated effects of Upward Bound that are presented in this
report, it is important to understand that they (1) indicate the “value-added” of Upward Bound
given the other programs in which students participate, (2) are based on students who
12 More specifically, we conducted two-tailed tests of the null hypothesis that Upward Bound had no effect
against the alternative that Upward Bound had an effect at the 0.10 level, the 0.05 level and the 0.01 level.

10
participated in Upward Bound in the mid-1990s and (3) are based on students who chose to
participate in Upward Bound for various lengths of time.
a. Value-Added of Upward Bound
Upward Bound operates in a service-rich environment, and students who are eligible for
Upward Bound may participate in several precollege programs. Therefore, it is not surprising
that many of the students assigned to both the treatment and control groups participate in
precollege services other than regular Upward Bound. In fact, it is critical to the scientific
validity of the study that students in the treatment and control groups have the same
opportunities to pursue other services as the typical eligible applicant to regular Upward Bound.
This report provides estimates of the value-added of regular Upward Bound above and
beyond other precollege programs and services that were available. Because eligible students
were randomly assigned to the treatment and control groups, and because—with very few
exceptions—only treatment students were offered the opportunity to participate in regular
Upward Bound, the differences between the two groups provide valid estimates of the value of
that opportunity given the opportunities that students have to participate in other programs.
b. Effects for Students Who Participated During the Mid-1990s
Since the students in the treatment and control groups applied to participate in regular
Upward Bound during the mid-1990s, this report characterizes the effects of Upward Bound as it
operated at that time. Like many educational interventions, Upward Bound is designed to affect
students years after they finish participating in the program. Therefore, one cannot assess the
effects of Upward Bound as it operates today because current participants have not had the
opportunity to attend college or even complete high school. However, this report provides a fair
assessment of Upward Bound today as long as the following two things have not changed much

11
since the mid-1990s: the types of services provided by regular Upward Bound and other
precollege programs and the types students served by these programs.
c. Variation in Exposure to Upward Bound
In considering the effects of regular Upward Bound, it is important to recognize that
students’ Upward Bound experiences vary in the length of participation and, as a result, in the
amount of services received. While the median duration of participation was 19 months, the
duration of participation varied widely across students in the evaluation from a few months to a
few years. Furthermore, the amount of services that students received is directly related to the
length of time that students participated. In the evaluation, the average program completer
participated for about 50-percent longer than the average participant and received about 50-
percent more services. In Chapter II, we provide a more detailed picture of the services received
by students in our sample and the amount of the Upward Bound services received by students in
the treatment group.
5. Subgroup Analysis The national evaluation of Upward Bound was primarily designed to ensure that we could
“detect” (flag as statistically significant) average effects that were relatively small but large
enough to be educationally important. However, the analysis of program effects has included a
subgroup analysis based on six characteristics of students. These six characteristics and the
subgroups defined based on them are listed below:
1. Educational expectations (less than a bachelor’s degree; at least a bachelor’s degree).
2. Academic risk (bottom 20 percent of ninth-grade academic achievement; top 80 percent).
3. Program eligibility (low-income and first-generation; first-generation only; low-income only).

12
4. Race and ethnicity (African American; white; Hispanic).
5. Sex (male; female).
6. Likelihood of admission to Upward Bound as rated by project directors (most likely; somewhat likely; least likely).
Some of the subgroup characteristics, such as race and ethnicity, are immutable characteristics of
the student; others, such as educational expectations, can vary over time. In general, subgroups
are based on characteristics of the students at the time they applied for Upward Bound.13
In the following chapters, we have given special attention to two particular pairs of
subgroups: students with higher and lower educational expectations and students at higher and
lower academic risk. In our baseline student survey prior to random assignment, students were
asked if they expected to complete a graduate degree, complete a bachelor’s degree, attend a
four-year college but not complete a degree, attend a two-year college, graduate from high
school or not complete a high school degree. For the evaluation, we classified students as having
“lower educational expectations” if they did not expect to obtain at least a bachelor’s degree
when they applied for Upward Bound. The previous interim report found large effects for
students with lower educational expectations (Myers and Schirm 1999).
However, when recruiting for Upward Bound, projects may find it difficult to target students
based on their educational expectations. Therefore, we also examine whether high school
transcripts can be used to identify students who are at risk of poor academic outcomes and who
may benefit from Upward Bound services. The assessment of academic risk was based on ninth-
grade academic achievement, as measured by grade point average and the number of credits
earned in each of the five core subjects: math, science, English, foreign language and social
13 Academic risk subgroups were defined based on ninth-grade academic achievement. For students who
applied for Upward Bound in eighth and ninth grades, our measure of academic risk could be affected by Upward Bound participation if Upward Bound raises high school achievement.

13
studies. These variables were weighted using a principal components analysis to create an
academic risk index: higher values of the index indicate higher academic risk. Students were
designated to be at higher academic risk if the value of the index belonged to the top 20 percent
of the distribution for treatment and control students; other students were designated to be at
lower academic risk.14
For small subgroups, we are likely to “detect” subgroup effects—find that the estimated
program effects are statistically significant—only if the effects are relatively large. Therefore,
when we report that the effect for a small subgroup is statistically insignificant, it simply means
that the effect of Upward Bound was not large enough to be detected given the relatively small
sample size; it does not mean that Upward Bound had no effect for this group.
14 A student’s risk designation—higher or lower—differs between this report and the previous report (Myers
and Schirm 1999) for three reasons. First, data collected since the previous report was used to update the high school variables on which the risk index was based. Second, using the updated variables, we reestimated the principal components model and obtained different coefficients or weights from the estimation. These weights were then used to create an updated risk index. When assigning the top half of the distribution to the higher-risk group, we did not see the sharp distinction in impacts that was observed in the previous report. That fact, along with further reflection on the educational expectations results, led us to split students by their level of academic risk in a manner that would parallel the distribution of students in terms of educational expectations. Thus, the third change was to flag only the students in the top 20 percent of the risk index distribution as higher-risk students instead of the top 50 percent, as students with lower educational expectation constitute approximately 20 percent of eligible Upward Bound applicants. Given that this decision to stratify the data was not made a priori, we need to be careful in our interpretation of the results; however, the findings using this split of academic risk are suggestive for the particular subgroups we have created.


15
II. Update on Program Participation, Upward Bound Course-Taking and Effects on High School Outcomes
Myers and Schirm (1999) presented detailed findings on students’ participation in Upward
Bound, including the length of participation and participation in Upward Bound courses and
activities, students’ participation in supplemental services outside of Upward Bound and the
effects of Upward Bound on high school outcomes, such as high school credits and high school
graduation. Although most students had left Upward Bound and high school by the time the data
were last collected, some students were still in high school. With the most recent round of data
collection, we can now provide a more complete picture of students’ participation and program
effects on high school outcomes.
A. Exposure to Upward Bound
1. Participation
Upward Bound programs serve most of the students they admit to their programs.
Approximately 80 percent of treatment group members received some Upward Bound services
and can be classified as “participants.” In other words, four out of five students who were
offered a spot in the regular Upward Bound program to which they applied chose to participate
in that program. Many of the students who chose not to participate indicated on our survey that
transportation problems or the fact that they had taken a job prevented or discouraged them from
participating. See Myers and Schirm (1999) for a more detailed assessment.
2. Duration
How long students participate in Upward Bound varies across participants. This section
presents findings on the duration of program participation. These findings, based on

16
participation reports provided by Upward Bound projects, are similar to interim findings
presented in Myers and Schirm (1999). Key findings include (see Table II.1):15
• The typical number of months participants remained in Upward Bound was 19 months.16
• About 40 percent of participants who applied for Upward Bound in the eighth grade or later were still in the program in the spring of their senior year of high school.
• Students who applied for Upward Bound in the summer after eighth grade typically spent more time in Upward Bound than other participants (42 months).
• Hispanic participants remained in Upward Bound less time than African American participants (15 versus 20 months, on average).
• Typically, students with lower educational expectations stayed in Upward Bound 15 months and those with higher expectations stayed 22 months.
• The most common reason for leaving Upward Bound was to take a job (see Myers and Schirm 1999).
3. Receipt of Academic and Nonacademic Services
With complete data on participants’ activities in Upward Bound, we found that on average,
Upward Bound participants attended about 265 academic Upward Bound sessions (see Table
II.2); 174 of the sessions occurred during the summer program and 91 sessions occurred during
the academic year. Sessions in English, math and science courses constituted the bulk of
participants’ Upward Bound academic course work (see Figure II.1). Although Upward Bound
participants typically attended a substantial number of academic sessions, there was large
15 Results presented in this report concerning length of time spent in Upward Bound differ somewhat from
those presented in the previous report (Myers and Schirm 1999). Myers and Schirm only included Upward Bound participants in the duration analysis who applied for Upward Bound after eighth grade. They used this definition so that most of the sample would have had a chance to complete the program by the time of the last data collection. Here, we have broadened the definition to include all participants who had applied for Upward Bound in the 67 sample projects during the period of late 1992 through early 1994. Some of the participants who were younger and not included in the previous analysis remained in Upward Bound for many months and as a result, for example, the median duration in Upward Bound presented in this report (19 months) is larger than the median duration presented in the previous report (18 months). In general, the differences are modest.
16 The median duration is used to describe the typical number of months that participants remained in Upward Bound.

17
Characteristics
All Students 19 21 64 51 37 17 40
Gender Male 21 21 65 53 38 17 43 FemaleR 17 20 61 47 32 17 33
Race Asian 24 25 87 68 47 14 51 Native American 19 17 58 51 23 12 24 White 21 22 70 53 36 18 41 Hispanic 15 18 * 56 42 31 5 40 African AmericanR 20 22 64 53 39 22 40
Entry into Upward Bound During 8th grade 20 26 67 62 43 41 38 Summer after 8th grade 42 33 * 78 71 63 55 35 During 9th gradeR 11 18 49 41 36 19 26 Summer after 9th grade 24 22 68 56 49 17 36 During 10th grade 20 20 67 55 45 — 48 Summer after 10th grade 17 17 66 49 6 — 51 During 11th or 12th grade 17 14 59 42 0 — 54 Summer after 11th or 12th grade 13 10 ** 52 — — — 59
Low-Income and First-Generation First-Generation and Low-IncomeR 19 21 62 52 36 16 41 Low-Income Only 22 25 78 64 45 24 43 First-Generation Only 14 21 55 45 38 19 33
Director Rating Most likely to be servedR 15 20 66 42 28 12 43 Somewhat likely to be served 19 21 62 50 38 15 38 Least likely to be served 20 21 65 54 37 19 41
Does Student Have College Plan? Bachelor’s degree or moreR 22 22 65 55 39 18 43 Less than a Bachelor’s degree 15 18 * 60 40 29 14 33
Source: f3_0818.logNote: Hyphens indicate too few respondents to compute impact.*/**/*** Difference with modal category is statistically significant at the 0.10 / 0.05 / 0.01 level.R Shows the reference group (modal category) for the tests of statistical significance.† The percent of participants who were still participating in Upward Bound during the spring of their senior year in high school.
Duration and Survival Estimates
Table II.1
24 or more 36 or more
Completion Rate †
(percent)
Months Participating (percent)Median Duration (months)
Mean Duration (months) 12 or more 18 or more

18
variability in the number of sessions attended. For example, while one-quarter of participants
attended 104 or fewer Upward Bound sessions, another quarter attended 405 or more sessions.
In addition to the academic course work completed through the Upward Bound program,
participants engaged in a variety of nonacademic activities. The most common activities
attended, as reported by Upward Bound projects, focused on counseling, followed by skills
development and college preparation courses (see Figure II.2). On average, participants attended
212 activity sessions while in Upward Bound, with nonacademic activities split nearly equally
CoursesEnglish 32 50 82 24 121English as a second language 0 0 0 0 0Foreign language 2 9 12 0 19Math 20 35 56 23 80Computers 3 9 11 0 15Science 16 28 44 11 69Social science 3 7 10 0 12Electives 14 34 48 7 75Other academic sessions 0 2 2 0 0
Total academic sessions 91 174 265 104 405
ActivitiesCollege preparedness 23 28 52 11 80Career exploration 1 2 3 0 5Self awareness 4 5 9 2 12Field trips 6 7 13 3 17Cultural awareness 3 4 7 1 10Counseling sessions 38 28 66 14 84Skill development 32 29 60 20 89Other activities sessions 1 1 2 0 0
Total activities 108 105 212 74 293
Total 199 278 477 201 704
Source: f3_0925.log
Average Total
Table II.2
Upward Bound Academic and Activity Sessions:All Participants
AcademicYear Summers Average
25thPercentile
75thPercentile
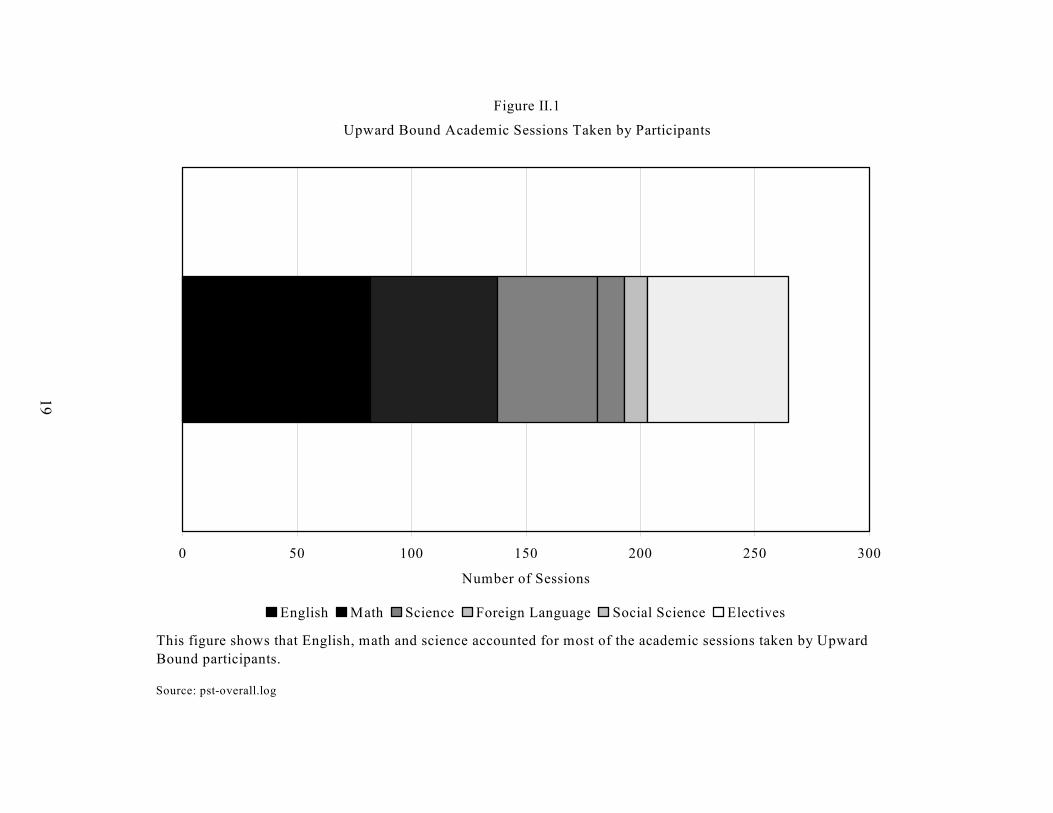
This figure shows that English, math and science accounted for most of the academic sessions taken by UpwardBound participants.
Source: pst-overall.log
Figure II.1
Upward Bound Academic Sessions Taken by Participants
0 50 100 150 200 250 300
Number of Sessions
English Math Science Foreign Language Social Science Electives
19

20
This figure shows that counseling, skill development and college preparation courses accounted for most of theactivities provided by Upward Bound Projects.
Source: f3_0925.log
Figure II.2
Upward Bound Nonacademic Activities by Participants
0 50 100 150 200 250 300
Number of Activities
Counseling Skill Development College Preparation Field Trips Self Awareness Other

21
between the summer and the academic year (see Table II.2). Like the academic sessions, we
found substantial variability in the number of activities attended by Upward Bound participants:
about 25 percent of the participants attended 74 or fewer sessions and about 25 percent attended
293 or more nonacademic sessions.
Another perspective on the academic experiences of Upward Bound participants comes from
focusing on “program completers,” defined as participants who were still in the program in the
spring of their senior year in high school (see Table II.3). On average, program completers
participated in Upward Bound for 50-percent longer than the average program participant (32
months versus 21 months) and participated in 50-percent more Upward Bound sessions—about
398 academic sessions and about 336 nonacademic sessions.
B. Receipt of Supplemental Services
The experiences of students in the control group show what eligible applicants to Upward
Bound would do in the absence of Upward Bound. The results from the most recent data
collection show that between the time students applied for Upward Bound and 1998-1999, more
than half of the control group reported participating in some kind of supplemental services (see
Table II.4). The most common type of supplemental service received by control group members
focused on instruction and tutoring sessions (43 percent), followed closely by programs with a
math or science emphasis (38 percent). We also found that 14 percent of the control group
members reported participating in an Upward Bound Math and Science program and 12 percent
reported participating in Talent Search. In the control group, 2 percent of students appear to
have participated in regular Upward Bound.17 More of the students in the control group obtained
supplemental services during the academic year than the summer (50 percent versus 22 percent).
17 About half of these students (16) participated in one of the programs in the national evaluation.

22
Although some students in the control group received services outside of Upward Bound,
some students in the treatment group also received supplemental services outside of those
offered by Upward Bound. According to the students in our evaluation, 31 percent attended
instructional and tutoring sessions outside of Upward Bound; 25 percent participated in a math or
science program; 14 percent participated in Upward Bound Math and Science; and 8 percent
participated in Talent Search.
CoursesEnglish 51 77 127 79 168English as a second language 0 0 0 0 0Foreign language 4 13 17 0 28Math 33 49 81 53 109Computers 3 12 15 0 25Science 25 38 63 25 91Social science 5 9 14 0 24Electives 26 51 76 38 114Other academic sessions 1 3 3 0 0
Total academic sessions 146 252 398 248 508
ActivitiesCollege preparedness 41 40 81 39 111Career exploration 2 3 6 1 6Self awareness 6 7 13 5 16Field trips 10 10 20 9 29Cultural awareness 5 6 11 4 14Counseling sessions 68 45 113 49 166Skill development 50 42 92 47 128Other activities sessions 1 1 2 0 0
Total activities 183 154 336 199 469
Total 329 406 734 482 902
Source: f3_0925.log
Average Total
Table II.3
Upward Bound Academic and Activity Sessions:Program Completers
Academic 25th 75thYear Summers Average Percentile Percentile
23
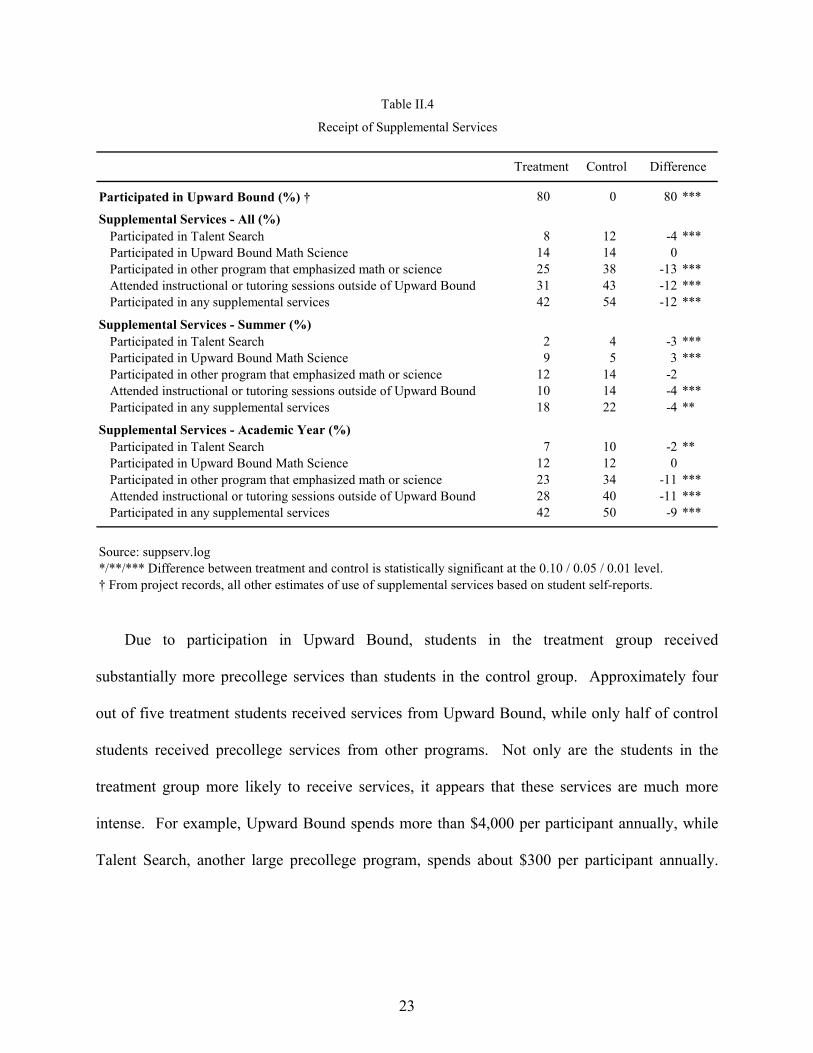
Due to participation in Upward Bound, students in the treatment group received
substantially more precollege services than students in the control group. Approximately four
out of five treatment students received services from Upward Bound, while only half of control
students received precollege services from other programs. Not only are the students in the
treatment group more likely to receive services, it appears that these services are much more
intense. For example, Upward Bound spends more than $4,000 per participant annually, while
Talent Search, another large precollege program, spends about $300 per participant annually.
Participated in Upward Bound (%) † 80 0 80 ***
Supplemental Services - All (%)Participated in Talent Search 8 12 -4 ***Participated in Upward Bound Math Science 14 14 0 Participated in other program that emphasized math or science 25 38 -13 ***Attended instructional or tutoring sessions outside of Upward Bound 31 43 -12 ***Participated in any supplemental services 42 54 -12 ***
Supplemental Services - Summer (%)Participated in Talent Search 2 4 -3 ***Participated in Upward Bound Math Science 9 5 3 ***Participated in other program that emphasized math or science 12 14 -2 Attended instructional or tutoring sessions outside of Upward Bound 10 14 -4 ***Participated in any supplemental services 18 22 -4 **
Supplemental Services - Academic Year (%)Participated in Talent Search 7 10 -2 **Participated in Upward Bound Math Science 12 12 0 Participated in other program that emphasized math or science 23 34 -11 ***Attended instructional or tutoring sessions outside of Upward Bound 28 40 -11 ***Participated in any supplemental services 42 50 -9 ***
Source: suppserv.log*/**/*** Difference between treatment and control is statistically significant at the 0.10 / 0.05 / 0.01 level.† From project records, all other estimates of use of supplemental services based on student self-reports.
Table II.4
Receipt of Supplemental Services
DifferenceTreatment Control

24
C. The Effect of Upward Bound on High School Credits, Grade Point Average and Completion
The central goal of the Upward Bound program has been to increase the college enrollment
and graduation rates of low-income students and students whose parents did not complete
college. Furthermore, research has shown a strong link between high school academic
preparation and college enrollment, particularly for minority students (see, for example,
Adelman 1999; Jencks et al. 1972; Manski and Wise 1983). One way that Upward Bound
projects attempt to raise the college enrollment and graduation rates of disadvantaged students is
through improvements in high school achievement and preparation.
Myers and Schirm (1999) presented a detailed assessment of the effect of Upward Bound on
students’ high school outcomes. Information used in that report was based on the national
evaluation’s second follow-up survey and transcript data that capture the high school experiences
of students in the treatment and control groups. The most recent data collection in 1998-2000
filled in the few remaining gaps for students who had not yet completed high school by 1996 and
allow us to update the previous findings.
Next, we describe the highlights from our analysis of students’ high school experiences
based on the most recent round of data collection. We focus on the results for all students and
then provide results for students with lower and higher educational expectations; program effects
for other subgroups are presented in Appendix D.
1. The Effect of Upward Bound on High School Credits, Grade Point Average and Completion for All Students
For the average eligible applicant, Upward Bound had a statistically insignificant effect on
most high school academic outcomes, including total credits earned in the five core subjects—
math, science, English, social studies and foreign language—credits earned in honors and
Advanced Placement courses, grade point average and high school completion. However,

25
Upward Bound had a statistically significant effect on the number of math credits earned in high
school, raising the average from 3.0 credits to 3.2 credits (see Table II.5). The increase of about
0.2 credits suggests that about one out of five treatment group members completed an additional
math course over and above what they would have completed in the absence of the program.
2. The Effect of Upward Bound on High School Credits, Grade Point Average and Completion for Selected Subgroups
a. Subgroups Defined by Educational Expectations
For students who expected to complete less than a bachelor’s degree (about 20 percent of
eligible applicants), we found that Upward Bound had statistically significant effects on credits
earned in high school (see Table II.6). For these students, Upward Bound raised the average
number of high school credits earned from 19 credits to 21 credits; that is, students in the
treatment group who expected to complete less than a bachelor’s degree completed about the
equivalent of two more high school courses than they would have in the absence of the program.
Much of the increase in high school credits came from additional credits in core academic
subjects (math, science, English, foreign language and social studies); however, the effects were
statistically significant only for credits earned in math and foreign language courses.
Upward Bound also increased the number of honors and Advanced Placement courses
completed by lower-expectation students while in high school (see Table II.6). The increase of
about 0.7 honors and Advanced Placement credits suggests that about 70 percent of the treatment
group with lower educational expectations completed one more honors or Advanced Placement
course than they would have without Upward Bound. For students with lower educational
expectations, the effects of Upward Bound on high school graduation rates and grade point
average were not statistically significant.

26
CreditsTotal 21.2 0.1 0.2 Total Core 13.9 0.4 0.4
Math 3.0 0.2 ** 0.2 **Science 2.7 0.1 0.1 English 3.9 0.0 0.0 Social studies 2.8 0.1 0.1 Foreign language 1.5 0.1 0.1
Computer science 0.8 0.0 0.0 Vocational 1.5 -0.1 -0.1
Advanced Placement and Honors CreditsTotal 1.9 -0.1 -0.2
Total Core 1.9 -0.2 -0.2 Math 0.3 0.0 0.0 Science 0.4 0.0 0.0 English 0.7 -0.1 -0.1 Social studies 0.4 0.0 0.0 Foreign language 0.0 0.0 0.0
Overall Grade Point Average 2.3 0.0 0.0
High School Status (%)Graduated 90 -1 -1 Still in high school 0 0 0 Dropped out 7 0 0 General Educational Development (GED) 3 0 0
Source: hs-overall.log
*/**/*** Impact estimate is statistically significant at the 0.10 / 0.05 / 0.01 level.Note: Hyphens indicate too few respondents to compute impact. Weighted values reported.
Impact Impact
Table II.5
Impact of Upward Bound on High School Credits,Grades and Graduation
All Students Participants
Control Mean

CreditsTotal 21.8 -0.3 18.5 2.0 * -0.4 2.5 *Total Core 14.4 0.0 11.7 1.8 ** 0.0 2.2 **
Math 3.1 0.1 2.6 0.5 ** # 0.1 0.6 **Science 2.9 0.0 2.1 0.3 0.0 0.4 English 4.0 -0.1 3.6 0.4 -0.1 0.5 Social studies 2.9 0.0 2.4 0.3 0.0 0.4 Foreign language 1.6 0.0 1.0 0.3 * 0.0 0.3
Computer science 0.8 0.0 0.6 0.2 * # 0.0 0.2 *Vocational 1.5 -0.1 1.5 0.1 -0.2 0.1
Advanced Placement and Honors CreditsTotal 2.3 -0.3 0.5 0.7 * # -0.4 0.9
Total Core 2.2 -0.3 0.5 0.7 * # -0.4 0.9 Math 0.4 0.0 0.1 0.1 ** 0.0 0.1 **Science 0.5 -0.1 0.1 0.2 * # -0.1 0.2 *English 0.8 -0.1 0.2 0.2 # -0.2 0.3 Social studies 0.5 -0.1 0.1 0.2 # -0.1 0.3 Foreign language 0.1 0.0 0.0 0.0 0.0 0.0
Overall Grade Point Average 2.4 -0.1 1.9 0.1 -0.1 0.2
High School Status (%)Graduated 93 -1 75 2 -2 2 Still in high school 0 0 1 0 0 -1 Dropped out 4 3 * 17 -1 3 * -1 General Educational Development (GED) 2 -1 7 -1 -1 -1
Source: hs-hiexp.log and hs-loexp.logNote: Hyphens indicate too few respondents to compute impact. Weighted values reported.*/**/*** Impact estimate is statistically significant at the 0.10 / 0.05 / 0.01 level.# Indicates that for all students, the impacts are significantly different from the impacts for higher expectations students at the 0.10 level.
Impact Impact Impact
Higher Expectations
Impact
Lower Expectations
Control Mean Control Mean
All Students Participants
Higher
Table II.6
Impact of Upward Bound on High School Credits, Grades and Graduationfor Students with Higher and Lower Educational Expectations
Lower
27

28
Among students who had higher educational expectations (about 80 percent of eligible
applicants), the effects of Upward Bound on students’ grade point average and the number of
high school credits earned overall and in specific subject areas were statistically insignificant.
However, Upward Bound increased the dropout rate for these students from 4 percent to 7
percent.
b. Subgroups Defined by Academic Risk
Upward Bound increased high school credits earned by students at higher academic risk (see
Table II.7). Upward Bound increased the total number of credits earned in core subjects by
higher-risk students—each student took approximately one additional course; however, it had a
statistically insignificant effect on total core credits for lower-risk students. For both types of
students, Upward Bound slightly increased the number of credits earned in certain core
subjects—math, English and social studies for higher-risk students, and math, science and
foreign language for lower-risk students.
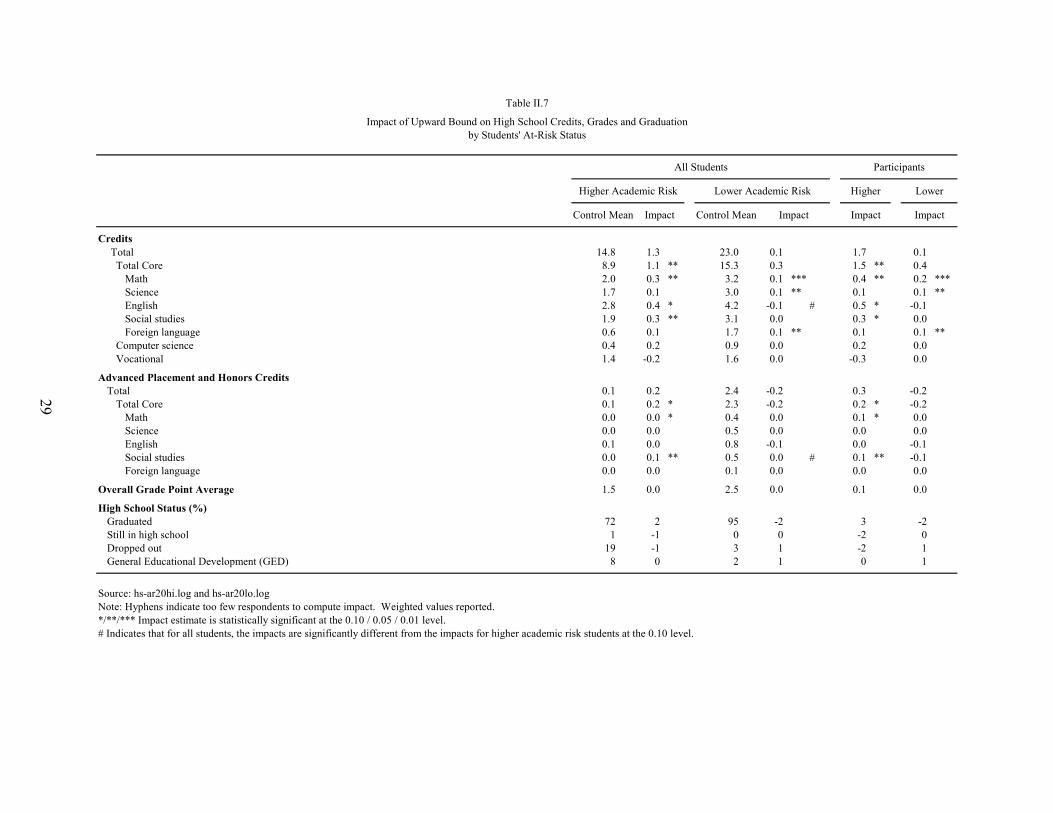
CreditsTotal 14.8 1.3 23.0 0.1 1.7 0.1 Total Core 8.9 1.1 ** 15.3 0.3 1.5 ** 0.4
Math 2.0 0.3 ** 3.2 0.1 *** 0.4 ** 0.2 ***Science 1.7 0.1 3.0 0.1 ** 0.1 0.1 **English 2.8 0.4 * 4.2 -0.1 # 0.5 * -0.1 Social studies 1.9 0.3 ** 3.1 0.0 0.3 * 0.0 Foreign language 0.6 0.1 1.7 0.1 ** 0.1 0.1 **
Computer science 0.4 0.2 0.9 0.0 0.2 0.0 Vocational 1.4 -0.2 1.6 0.0 -0.3 0.0
Advanced Placement and Honors CreditsTotal 0.1 0.2 2.4 -0.2 0.3 -0.2
Total Core 0.1 0.2 * 2.3 -0.2 0.2 * -0.2 Math 0.0 0.0 * 0.4 0.0 0.1 * 0.0 Science 0.0 0.0 0.5 0.0 0.0 0.0 English 0.1 0.0 0.8 -0.1 0.0 -0.1 Social studies 0.0 0.1 ** 0.5 0.0 # 0.1 ** -0.1 Foreign language 0.0 0.0 0.1 0.0 0.0 0.0
Overall Grade Point Average 1.5 0.0 2.5 0.0 0.1 0.0
High School Status (%)Graduated 72 2 95 -2 3 -2 Still in high school 1 -1 0 0 -2 0 Dropped out 19 -1 3 1 -2 1 General Educational Development (GED) 8 0 2 1 0 1
Source: hs-ar20hi.log and hs-ar20lo.logNote: Hyphens indicate too few respondents to compute impact. Weighted values reported.*/**/*** Impact estimate is statistically significant at the 0.10 / 0.05 / 0.01 level.# Indicates that for all students, the impacts are significantly different from the impacts for higher academic risk students at the 0.10 level.
All Students
Table II.7
Impact of Upward Bound on High School Credits, Grades and Graduationby Students' At-Risk Status
Participants
Impact Impact Impact
Higher Academic Risk
Impact
Lower Academic Risk
Control Mean Control Mean
Higher Lower
29

31
III. The Effect of Upward Bound on Students’ Postsecondary Education Experiences
The ultimate goal of the Upward Bound program is to increase the chances that high school
students from low-income families or families in which neither parent has completed a
bachelor’s degree will attend and graduate from institutions of higher education. With
information collected in 1999-2000 from the third follow-up survey of students and from college
transcripts, we have compared the postsecondary experiences of students in the Upward Bound
group (the treatment group) with the experiences of students in the control group approximately
three years after they would have graduated from high school.
This chapter contains estimates of the effect of Upward Bound on: (1) enrollment at any
type of postsecondary institution, including four-year colleges and universities, two-year colleges
and vocational institutions; (2) the highest level of postsecondary education attended, defined as
“four-year” for students who attended a public or private nonprofit four-year college or
university, “two-year” for students who attended a public or private nonprofit two-year college
and “vocational” for students who attended a for-profit institution but no two- or four-year
institution; (3) credits earned of different kinds (remedial, nonremedial and other) and at
different types of postsecondary institutions; and (4) several measures of college engagement.
This chapter focuses on the effects of Upward Bound on postsecondary enrollment and credits
earned at all postsecondary institutions and at four-year colleges and universities. The next
evaluation report will be based on survey interviews conducted in 2002 and postsecondary
transcripts collected in the same year, and information from these sources will allow us to assess
how Upward Bound affects college completion.

32
A. The Effect of Upward Bound on Postsecondary Enrollment and Persistence for All Students
In this section, we present estimates of the effects of regular Upward Bound on
postsecondary attendance, the highest level of postsecondary education attended, and the number
of credits earned at different levels of postsecondary education. In the third follow-up survey,
we asked treatment and control students whether they had attended a college or other school
since leaving high school. If they answered affirmatively, we asked them to provide the names
of the colleges and schools that they had attended. These schools were matched to the 1997-98
Integrated Postsecondary Education Data System (IPEDS) maintained by the National Center for
Education Statistics (NCES) to determine whether they met NCES’s definition of a
postsecondary institution. If so, the information in IPEDS was used to classify the institution as
four-year (public or private, nonprofit), two-year (public or private, nonprofit) or vocational (for-
profit). To assess student progress toward completing postsecondary degrees, MPR requested
transcripts from these institutions for the students who reported having attended them.
This data collection process relies on the treatment and control students to accurately report
the schools they have attended since high school. However, it is likely that some of them
reported attending postsecondary institutions that they never actually attended. For example,
some may have reported schools that they planned to attend but never attended, and others may
have reported schools where they participated in a program (such as Upward Bound) but were
not enrolled as students at the institution. Therefore, it would be desirable to have verification
that students actually attended the schools they reported.
While the process of collecting transcripts was not designed to verify attendance, it
effectively provided such verification in many instances. If a school provided a transcript that
we requested for a student in our sample, then the student clearly attended that school.
Furthermore, some of the reasons given by school staff members for not providing transcripts

33
can be treated as verification of attendance.18 However, in many instances, the reason given for
not providing transcripts does not clearly indicate whether the student attended the school.19
Therefore, the information obtained while collecting transcripts is useful in verifying attendance
in some but not all cases.
In designing the analysis, we faced the following question: if a student reported attending a
postsecondary institution, should we accept that the student had actually enrolled there? If so,
we would almost surely be crediting some sample members with attending colleges and
universities that they never attended. Alternatively, we could require verification that sample
members actually attended the postsecondary institutions that they reported. Under this
approach, we would exclude some schools that students reported but had not attended, but we
would also exclude some schools that our sample members had attended but for whom we did
not receive verification of attendance.
Because both approaches have their merits and drawbacks, we took both approaches and
compared the results. Findings based on the first approach, which does not require verification
of attendance, are reported in the odd-numbered tables; findings based on the second approach,
which requires verification of attendance, are reported in the even-numbered tables. In
describing the results, we tend to focus on the findings based on the first approach to avoid
cluttering the analysis with multiple estimates that tell the same story. However, when the
statistical significance of a key impact estimate depends on whether we attempt to verify
attendance, we present both estimates and indicate that the evidence is not conclusive.
18 For example, in some cases, the college indicated that it could not provide a transcript for the student
because he or she owed money to the school. 19 For example, some schools required written consent from the students themselves even though the law does
not require it, and MPR typically obtained only verbal consent (see Appendix H); these schools may not have even checked whether the student attended the school before indicating that they could not provide us with transcripts.

34
1. The Effect of Upward Bound on Postsecondary Enrollment
Upward Bound did not have a statistically significant effect on whether students enrolled in
any postsecondary institution. About 74 percent of students in the treatment group and 71
percent of students in the control group attended some type of postsecondary institution, and the
difference is not statistically significant (see Table III.1).
It is not clear whether Upward Bound increased enrollment in four-year colleges and
universities. When we include all postsecondary enrollment reported by sample members, as
described earlier, the estimated effect on four-year college enrollment is positive, 6 percentage
points, and statistically significant (see Table III.1).20 However, when we exclude unverified
postsecondary enrollment, the effect falls to 5 percentage points and is statistically insignificant
(see Table III.2). These two estimates are very similar to each other. However, in this
evaluation like many others, we have treated statistical significance at the 0.10 level as the
threshold between strong and weak evidence that the program had an effect (see Chapter I).
Based on this threshold, the estimated effect of 6 percentage points presented in Table III.1
provides strong evidence, and the estimated effect of 5 percentage points presented in Table III.2
provides weak evidence. We believe that both of these estimates are credible and thus the
evidence does not paint a clear picture of whether Upward Bound raised enrollment in four-year
colleges. In future reports, we will reexamine the evidence based on more recent data.
2. The Effect of Upward Bound on Postsecondary Persistence
Upward Bound did not have a statistically significant effect on the total number of credits
earned at postsecondary institutions (Table III.1). On average, treatment students and control
20 This is consistent with the estimated effect of Upward Bound on educational expectations: Upward Bound
increased the percent of students that expected to obtain at least a four-year degree (Myers and Schirm, 1999, Figure III.2).

35
students had earned about 37 credits and 36 credits, respectively, from postsecondary
institutions, and the difference is statistically insignificant.21 The estimated effects on credits
earned at two- and four-year colleges are also statistically insignificant.
B. The Effect of Upward Bound on Postsecondary Enrollment and Persistence for Selected Subgroups
1. Subgroups Defined by Educational Expectations
For students with lower educational expectations—students who did not expect to complete
a bachelor’s degree when they applied to Upward Bound—about half of control group members
attended college and less than one out of five attended a four-year college or university (see
Table III.3). Therefore, the odds of completing a bachelor’s degree are low for students who had
lower educational expectations and did not participate in Upward Bound. However, Upward
Bound more than doubles the likelihood that students with lower educational expectations attend
a four-year college or university, raising the enrollment rate from 18 percent to 38 percent.
Upward Bound increased the number of postsecondary credits earned at four-year colleges
and universities by students with lower educational expectations.22 More specifically, Upward
Bound raised the average number of credits earned at four-year colleges and universities by these
students from 11 credits to 22 credits, almost a one-semester difference. Among students with
higher educational expectations—students who expected to complete a bachelor’s degree or
more before entering the program—the effects of Upward Bound on enrollment and credits were
21 Combined with the postsecondary enrollment rates presented in Section A.1, these estimates suggest that in
both the treatment group and the control group, students who had attended at least one postsecondary institution earned an average of about 50 postsecondary credits.
22 While the estimated effect on total credits earned at all postsecondary institutions is statistically insignificant for students with lower educational expectations, it becomes larger and statistically significant when we use the procedures described earlier to verify postsecondary attendance (see Table III.4).

36
Postsecondary School Status (%)Any postsecondary school 71 3 3 Four-year college 44 6 ** 7 ** Two-year college 24 -5 -6 Vocational school 2 2 2
Credits EarnedAll postsecondary schools 35.8 1.4 1.7
Nonremedial 33.8 0.8 0.9 Remedial 1.5 -0.2 -0.2 Other 0.5 0.8 0.9
Four-year colleges 25.1 3.2 3.6 Nonremedial 24.1 2.3 2.7 Remedial 0.6 0.1 0.1 Other 0.5 0.7 0.9
Two-year colleges 9.6 -1.3 -1.5 Nonremedial 8.6 -1.0 -1.2 Remedial 0.9 -0.3 -0.3 Other 0.0 0.0 0.0
Vocational schools 1.1 -0.4 -0.5 Nonremedial 1.1 -0.5 -0.6 Remedial 0.0 0.0 0.0 Other 0.0 0.1 0.1
Source: pst-overall.logNote: Weighted values reported.*/**/*** Impact estimate is statistically significant at the 0.10 / 0.05 / 0.01 level.
Impact Impact
Table III.1
Impact of Upward Bound on Postsecondary Enrollment and Credits,
All Students Participants
Control Mean
Includes All Self-Reported Postsecondary Enrollment

37
Postsecondary School Status (%)Any postsecondary school 62 3 4 Four-year college 38 5 5 Two-year college 22 -3 -3 Vocational school 2 1 2
Credits EarnedAll postsecondary schools 31.3 0.7 0.8
Nonremedial 29.6 0.2 0.2 Remedial 1.3 -0.1 -0.1 Other 0.4 0.6 0.8
Four-year colleges 21.8 2.2 2.6 Nonremedial 20.8 1.7 2.0 Remedial 0.6 0.0 0.0 Other 0.4 0.6 0.6
Two-year colleges 8.5 -1.4 -1.7 Nonremedial 7.8 -1.3 -1.6 Remedial 0.7 -0.1 -0.1 Other 0.0 0.0 0.0
Vocational schools 0.9 -0.1 -0.1 Nonremedial 0.9 -0.2 -0.2 Remedial 0.0 0.0 0.0 Other 0.0 0.1 0.1
Source: pst-overall.logNote: Weighted values reported.*/**/*** Impact estimate is statistically significant at the 0.10 / 0.05 / 0.01 level.
Impact Impact
Table III.2
Impact of Upward Bound on Postsecondary Enrollment and Credits,
All Students Participants
Control Mean
Excludes Unverified Self-Reported Enrollment

Postsecondary School Status (%)Any postsecondary school 77 3 54 4 4 4 Four-year college 52 4 18 20 ** # 4 24 **Two-year college 23 -3 34 -16 -3 -19 Vocational school 2 3 2 0 3 0
Credits EarnedAll postsecondary schools 40.3 1.0 21.6 6.2 1.2 7.5
Nonremedial 37.9 1.4 20.4 0.1 1.6 0.2 Remedial 1.9 -0.2 0.5 -0.1 -0.3 -0.1 Other 0.5 -0.1 0.6 6.2 -0.1 7.4
Four-year colleges 29.0 2.2 11.0 10.9 *** # 2.5 13.0 *** Nonremedial 27.8 2.2 10.3 4.5 2.6 5.5 Remedial 0.7 0.1 0.0 0.1 0.2 0.2 Other 0.5 -0.2 0.6 6.2 -0.2 7.4
Two-year colleges 10.5 -1.0 7.8 -2.5 -1.2 -3.0 Nonremedial 9.3 -0.6 7.3 -2.3 -0.7 -2.8 Remedial 1.1 -0.4 0.5 -0.2 -0.5 -0.2 Other 0.0 0.0 0.0 - 0.0 -
Vocational schools 0.8 -0.1 2.8 -2.1 -0.2 -2.5 Nonremedial 0.8 -0.2 2.7 -2.0 -0.3 -2.4 Remedial 0.0 0.0 0.0 0.0 0.0 0.0 Other 0.0 0.1 0.0 0.0 0.1 0.0
Source: pst-hiexp.log and pst-loexp.logNote: Hyphens indicate too few respondents to compute impact. Weighted values reported.*/**/*** Impact estimate is statistically significant at the 0.10 / 0.05 / 0.01 level.# Indicates that for all students, the impacts are significantly different from the impacts for higher expectations students at the 0.10 level.
Impact Impact
Higher Expectations Higher
Control Mean Control Mean Impact
Lower Expectations Lower
Impact
Impact of Upward Bound on Postsecondary Enrollment and Credits for Students with Higher and Lower Educational Expectations,
Table III.3
All Students Participants
Includes All Self-Reported Postsecondary Enrollment
38

39
Postsecondary School Status (%)Any postsecondary school 68 2 45 12 2 14 Four-year college 44 1 14 21 ** # 2 25 **Two-year college 21 -1 29 -9 -1 -11 Vocational school 2 2 2 0 2 0
Credits EarnedAll postsecondary schools 36.1 -1.2 16.7 9.2 ** # -1.5 11.0 **
Nonremedial 34.1 -0.9 15.7 4.6 -1.1 5.5 Remedial 1.6 -0.2 0.6 -0.1 -0.3 -0.1 Other 0.4 -0.1 0.4 4.7 -0.1 5.6
Four-year colleges 26.0 -0.2 7.1 13.0 *** # -0.2 15.6 *** Nonremedial 24.9 0.1 6.6 8.2 *** # 0.1 9.9 *** Remedial 0.7 -0.1 0.1 0.1 -0.1 0.1 Other 0.4 -0.2 0.4 4.7 -0.2 5.6
Two-year colleges 9.3 -1.2 7.4 -2.5 -1.4 -3.0 Nonremedial 8.4 -1.0 7.0 -2.3 -1.2 -2.8 Remedial 0.8 -0.1 0.4 -0.1 -0.2 -0.2 Other 0.0 0.0 0.0 - 0.0 -
Vocational schools 0.7 0.1 2.1 -1.3 0.2 -1.6 Nonremedial 0.7 0.0 2.0 -1.3 0.0 -1.5 Remedial 0.0 0.0 0.0 0.0 0.0 0.0 Other 0.0 0.1 0.0 0.0 0.1 0.0
Source: pst-hiexp.log and pst-loexp.logNote: Hyphens indicate too few respondents to compute impact. Weighted values reported.*/**/*** Impact estimate is statistically significant at the 0.10 / 0.05 / 0.01 level.# Indicates that for all students, the impacts are significantly different from the impacts for higher expectations students at the 0.10 level.
Impact of Upward Bound on Postsecondary Enrollment and Credits for Students with Higher and Lower Educational Expectations,
Table III.4
All Students Participants
Excludes Unverified Self-Reported Enrollment
Impact Impact
Higher Expectations Higher
Control Mean Control Mean Impact
Lower Expectations Lower
Impact

40
statistically insignificant for four-year colleges and universities and all postsecondary institutions
(see Table III.3).
The effect of Upward Bound on enrollment in four-year postsecondary institutions is larger
for students with lower educational expectations than for students with higher educational
expectations. This difference suggests that Upward Bound might have larger effects on
enrollment in four-year postsecondary institutions if it served a larger proportion of students who
did not expect to obtain a bachelor’s degree when they applied for Upward Bound. Since it
might be difficult for projects to target students based on their self-reported educational
expectations, the next section addresses whether Upward Bound also has especially large effects
on students whose ninth-grade transcripts suggest that they are at relatively high risk of academic
failure.
2. Subgroups Defined by Academic Risk
Upward Bound had statistically insignificant effects on overall college enrollment for
students at higher academic risk or for students at lower academic risk (see Table III.5). Upward
Bound raised four-year college enrollment for students at lower academic risk; it may also have
raised four-year college enrollment for students at higher academic risk, but the evidence is not
conclusive. When we include all postsecondary enrollment reported by sample members, the
estimated impacts on four-year college enrollment are positive and statistically significant for
both groups—8 percentage points for students at higher academic risk and 7 percentage points
for students at lower academic risk. However, when we exclude unverified postsecondary
enrollment, the effect on higher-risk students becomes statistically insignificant (see Table III.6).
For students at lower academic risk, Upward Bound raised the average number of credits
earned at four-year colleges from 30 credits to 36 credits (see Table III.5). Upward Bound did

41
not have statistically significant effects on total postsecondary credits earned at all types of
institutions for either students at higher academic risk or students at lower academic risk.
Our findings suggest that it is difficult to use ninth-grade transcripts to identify students who
benefit as much from Upward Bound as participants with lower educational expectations. In
future research, we will make further attempts to use information from high school transcripts to
identify students who would reap large benefits from Upward Bound.
3. Subgroups Defined by the Eligibility Criteria for Upward Bound
To be eligible to participate in Upward Bound, students had to be classified as “low-income”
(family income below 150 percent of the poverty line) or “first-generation” (neither parent had
earned a bachelor’s degree). For the largest group of students, those who met both eligibility
criteria, Upward Bound did not have a statistically significant effect on overall postsecondary
enrollment, but it increased enrollment at four-year colleges and universities from 43 percent to
50 percent (see Table III.7). For these students, the effects of Upward Bound on credits earned
from postsecondary institutions are statistically insignificant.
Among students who only met the first-generation criterion, Upward Bound reduced overall
postsecondary enrollment from 80 percent to 73 percent. Interestingly, Upward Bound increased
enrollment at vocational institutions for these students. However, the drop in overall
postsecondary enrollment indicates that the increase in enrollment in vocational institutions was
more than offset by the decrease in enrollment at other types of institutions. For students who
only met the first-generation eligibility criterion, it is not clear whether Upward Bound affected
postsecondary persistence. When we include all postsecondary enrollment reported by sample
members, the estimated impacts on credits earned at four-year and all postsecondary institutions
are positive and statistically significant (see Table III.7). However, when we exclude unverified
postsecondary enrollment, these effects become statistically insignificant (see Table III.8).

42
For the small number of students who only met the low-income eligibility criterion, the
effects of Upward Bound on postsecondary enrollment and credits are statistically insignificant.
Given the small sample size, the effects on this group would have to be very large to expect
significant impact estimates. Therefore, it is difficult to determine the effects of Upward Bound
for this small subgroup.
4. Subgroups Defined by Race and Ethnicity
For white students, Upward Bound increased overall postsecondary enrollment from 58
percent to 69 percent (see Table III.9). It may also have increased four-year college enrollment
for white students, but the evidence is inconclusive. When we include all postsecondary
enrollment reported by sample members, the estimated effect on four-year college enrollment is
statistically insignificant. However, when we exclude unverified postsecondary enrollment, the
effect becomes positive and statistically significant (see Table III.10).
For Hispanic students, Upward Bound increased enrollment at four-year postsecondary
institutions from 38 percent to 50 percent (see Table III.9). It may also have increased overall
postsecondary enrollment for Hispanic students, but the evidence is inconclusive. When we
include all postsecondary enrollment reported by sample members, the estimated impact on
overall postsecondary enrollment is statistically insignificant (see Table III.9). However, when
we exclude unverified postsecondary enrollment, this effect becomes positive and statistically
significant (see Table III.10).
Upward Bound did not have statistically significant effects on postsecondary enrollment or
enrollment in four-year colleges and universities for African American students. While Upward
Bound may have raised enrollment in vocational institutions and reduced enrollment in two-year
colleges for these students, the evidence is not conclusive. When we include all postsecondary
enrollment reported by sample members, the estimated effects on these two outcomes are

43
statistically significant (see Table III.9). However, when we exclude unverified postsecondary
enrollment, the effects become statistically insignificant (see Table III.10).
Our findings suggest that the effects of Upward Bound on persistence at postsecondary
institutions may be especially large for Hispanic students. For these students, Upward Bound
raised the average number of credits earned at four-year colleges and universities from 13 credits
to 28 credits (see Table III.9). For these students, Upward Bound also raised the average number
of credits earned at all postsecondary institutions from 30 credits to 38 credits. For African
American students and white students, there is no conclusive evidence that Upward Bound
affected the number of postsecondary credits earned at any type of postsecondary institution.23
23 While Upward Bound may have increased the number of credits earned at two-year colleges for whites, the
evidence is not conclusive. When we include all postsecondary enrollment reported by sample members, the estimated effect is statistically insignificant (see Table III.9). However, when we exclude unverified postsecondary enrollment, the effect becomes statistically significant (see Table III.10).

Postsecondary School Status (%)Any postsecondary school 51 -6 76 4 # -8 5 Four-year college 19 8 ** 52 7 *** 11 ** 8 ***Two-year college 31 -15 ** 23 -4 -20 ** -4 Vocational school 1 1 2 2 2 2
Credits EarnedAll postsecondary schools 11.8 0.9 42.1 4.0 1.2 4.5
Nonremedial 11.5 -0.3 39.7 3.3 -0.3 3.7 Remedial 0.3 1.2 ** 1.8 -0.5 # 1.5 ** -0.6 Other 0.0 - 0.6 1.2 - 1.4
Four-year colleges 6.7 1.4 29.8 6.6 ** 1.8 7.4 ** Nonremedial 6.6 1.0 28.7 5.4 * 1.3 6.1 * Remedial 0.1 0.4 * 0.6 0.1 0.5 * 0.1 Other 0.0 - 0.5 1.1 - 1.3
Two-year colleges 4.0 0.7 11.2 -2.4 0.9 -2.7 Nonremedial 3.8 -0.1 10.0 -1.8 -0.1 -2.0 Remedial 0.2 0.8 ** 1.2 -0.6 # 1.0 ** -0.7 Other 0.0 - 0.0 0.0 - 0.0
Vocational schools 1.1 -1.2 1.1 -0.2 -1.5 -0.2 Nonremedial 1.1 -1.2 1.0 -0.3 -1.5 -0.3 Remedial 0.0 0.0 0.0 0.0 0.0 0.0 Other 0.0 - 0.0 0.1 - 0.1
Source: pst-ar20hi.log and pst-ar20lo.logNote: Hyphens indicate too few respondents to compute impact. Weighted values reported.*/**/*** Impact estimate is statistically significant at the 0.10 / 0.05 / 0.01 level.# Indicates that for all students, the impacts are significantly different from the impacts for higher academic risk students at the 0.10 level.
Impact ImpactImpact
Higher Academic Risk
Control Mean Control Mean Impact
Lower Academic Risk Higher Lower
Impact of Upward Bound on Postsecondary Enrollment and Credits by Students' At-Risk Status,
Table III.5
Includes All Self-Reported Postsecondary Enrollment
All Students Participants
44
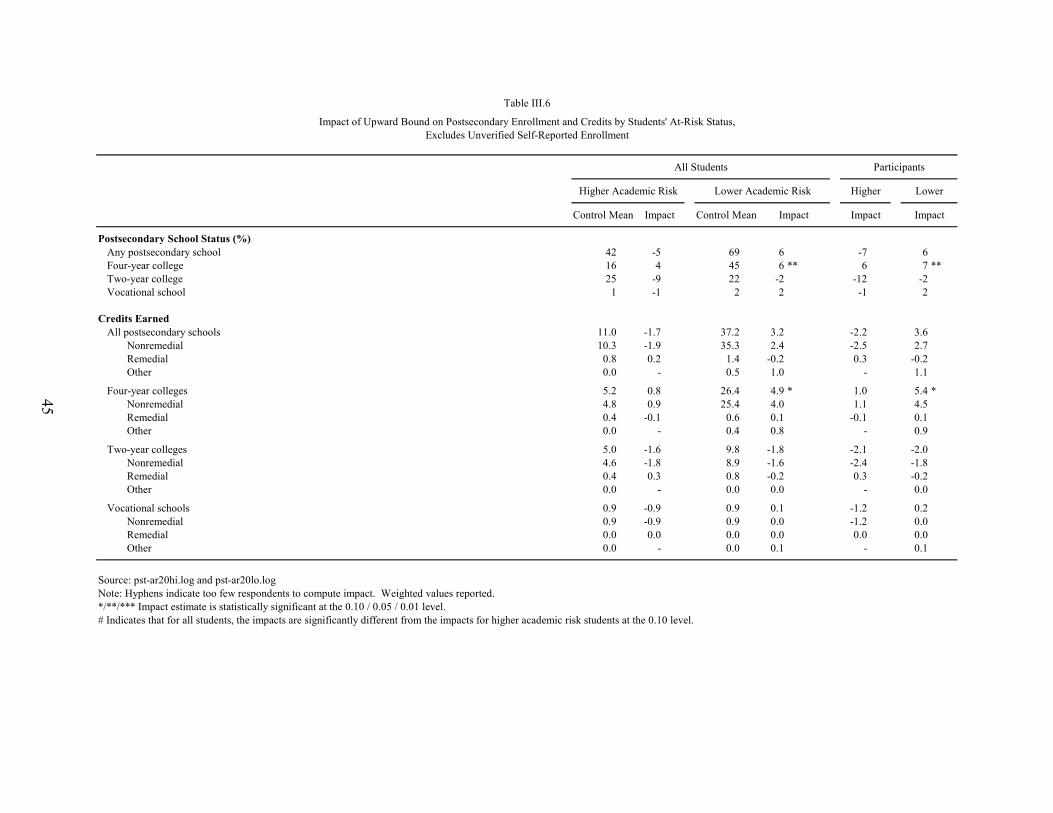
45
Postsecondary School Status (%)Any postsecondary school 42 -5 69 6 -7 6 Four-year college 16 4 45 6 ** 6 7 **Two-year college 25 -9 22 -2 -12 -2 Vocational school 1 -1 2 2 -1 2
Credits EarnedAll postsecondary schools 11.0 -1.7 37.2 3.2 -2.2 3.6
Nonremedial 10.3 -1.9 35.3 2.4 -2.5 2.7 Remedial 0.8 0.2 1.4 -0.2 0.3 -0.2 Other 0.0 - 0.5 1.0 - 1.1
Four-year colleges 5.2 0.8 26.4 4.9 * 1.0 5.4 * Nonremedial 4.8 0.9 25.4 4.0 1.1 4.5 Remedial 0.4 -0.1 0.6 0.1 -0.1 0.1 Other 0.0 - 0.4 0.8 - 0.9
Two-year colleges 5.0 -1.6 9.8 -1.8 -2.1 -2.0 Nonremedial 4.6 -1.8 8.9 -1.6 -2.4 -1.8 Remedial 0.4 0.3 0.8 -0.2 0.3 -0.2 Other 0.0 - 0.0 0.0 - 0.0
Vocational schools 0.9 -0.9 0.9 0.1 -1.2 0.2 Nonremedial 0.9 -0.9 0.9 0.0 -1.2 0.0 Remedial 0.0 0.0 0.0 0.0 0.0 0.0 Other 0.0 - 0.0 0.1 - 0.1
Source: pst-ar20hi.log and pst-ar20lo.logNote: Hyphens indicate too few respondents to compute impact. Weighted values reported.*/**/*** Impact estimate is statistically significant at the 0.10 / 0.05 / 0.01 level.# Indicates that for all students, the impacts are significantly different from the impacts for higher academic risk students at the 0.10 level.
Lower
Impact of Upward Bound on Postsecondary Enrollment and Credits by Students' At-Risk Status,
Table III.6
All Students Participants
Excludes Unverified Self-Reported Enrollment
Impact ImpactImpact
Higher Academic Risk
Control Mean Control Mean Impact
Lower Academic Risk Higher

46
Postsecondary School Status (%)Any postsecondary school 68 5 80 -7 ** # 84 -5 5 -9 ** -5 Four-year college 43 7 ** 49 0 44 10 9 ** 0 10 Two-year college 22 -5 30 -9 36 -12 -5 -11 -13Vocational school 2 2 0 4 ** 4 -3 2 5 ** -3
Credits EarnedAll postsecondary schools 36.7 0.2 32.5 13.0 ** 33.5 7.3 0.2 14.8 ** 7.9
Nonremedial 34.7 -0.9 30.5 14.9 ** # 31.1 9.8 -1.0 17.0 ** 10.6 Remedial 1.6 0.1 1.2 -1.0 1.0 -0.2 0.1 -1.1 -0.2 Other 0.4 1.0 0.8 -0.9 # 1.4 -2.3 1.1 -1.1 -2.5
Four-year colleges 26.4 1.1 20.3 13.9 ** 22.5 7.4 1.3 15.8 ** 8.0 Nonremedial 25.5 0.0 18.8 15.6 *** # 20.4 10.1 0.0 17.8 *** 10.9 Remedial 0.5 0.3 0.7 -0.7 0.6 -0.4 0.3 -0.8 -0.4 Other 0.3 0.9 0.8 -1.0 # 1.4 -2.3 1.0 -1.2 -2.5
Two-year colleges 8.9 -0.4 12.1 -1.3 10.1 1.1 -0.5 -1.5 1.2 Nonremedial 7.8 -0.2 11.6 -1.2 9.8 1.0 -0.2 -1.3 1.0 Remedial 1.1 -0.2 0.5 -0.2 0.3 0.2 -0.2 -0.3 0.2 Other 0.0 0.0 0.0 0.1 0.0 - 0.0 0.1 -
Vocational schools 1.3 -0.6 0.1 0.5 1.0 -1.3 -0.6 0.5 -1.4 Nonremedial 1.3 -0.7 0.1 0.5 1.0 -1.3 -0.8 0.5 -1.4 Remedial 0.0 0.0 0.0 - 0.0 - 0.0 - - Other 0.0 0.1 0.0 - 0.0 - 0.1 - -
Source: pst-lifg.log, pst-low_only.log, and pst-fgenonly.logNote: Hyphens indicate too few respondents to compute impact. Weighted values reported.*/**/*** Impact estimate is statistically significant at the 0.10 / 0.05 / 0.01 level.# Indicates that for all students, the impacts are significantly different from the impacts for low-income and first-generation students at the 0.10 level.
Control Mean Impact
Low-Income & First-Gen. LI & FG
Control Mean Impact
FG Only LI Only
Control Mean Impact
First-Generation Only Low-Income Only
ImpactImpact Impact
Table III.7
Impact of Upward Bound on Postsecondary Enrollment and Credits by Students' Eligibility Status,
Participants
Includes All Self-Reported Postsecondary Enrollment
All Students

47
Postsecondary School Status (%)Any postsecondary school 58 6 78 -15 ** # 68 8 7 -18 ** 8 Four-year college 37 7 ** 47 -9 # 30 18 9 ** -11 19 *Two-year college 20 -1 30 -9 33 -8 -2 -10 -8 Vocational school 2 0 0 5 * 4 -3 0 6 * -3
Credits EarnedAll postsecondary schools 30.5 0.0 33.9 3.3 35.9 13.5 0.0 4.0 14.3
Nonremedial 28.9 -0.8 31.6 5.1 34.0 14.3 -0.9 6.1 15.2 Remedial 1.3 0.0 1.5 -1.1 * 0.8 0.7 0.0 -1.3 * 0.8 Other 0.3 0.8 * 0.8 -0.7 # 1.1 -1.6 0.9 * -0.9 -1.7
Four-year colleges 21.2 1.5 23.4 4.2 25.3 11.8 1.8 5.1 12.6 Nonremedial 20.5 0.8 21.5 6.0 23.7 12.8 0.9 7.2 13.6 Remedial 0.5 0.1 1.1 -0.9 * 0.5 0.6 0.1 -1.1 * 0.6 Other 0.3 0.7 * 0.8 -0.8 # 1.1 -1.6 0.8 * -1.0 -1.7
Two-year colleges 8.1 -1.2 10.4 -1.6 9.7 2.5 -1.4 -2.0 2.7 Nonremedial 7.3 -1.1 10.0 -1.6 9.4 2.3 -1.3 -1.9 2.5 Remedial 0.8 -0.1 0.4 -0.1 0.3 0.2 -0.1 -0.1 0.2 Other 0.0 0.0 0.0 0.1 0.0 - 0.0 0.1 -
Vocational schools 1.1 -0.3 0.1 0.7 ** 0.9 -0.9 -0.4 0.9 ** -0.9 Nonremedial 1.1 -0.4 0.1 0.7 ** # 0.9 -0.9 -0.5 0.9 ** -0.9 Remedial 0.0 0.0 0.0 - 0.0 - 0.0 - - Other 0.0 0.1 0.0 - 0.0 - 0.1 - -
Source: pst-lifg.log, pst-low_only.log, and pst-fgenonly.logNote: Hyphens indicate too few respondents to compute impact. Weighted values reported.*/**/*** Impact estimate is statistically significant at the 0.10 / 0.05 / 0.01 level.# Indicates that for all students, the impacts are significantly different from the impacts for low-income and first-generation students at the 0.10 level.
Table III.8
Impact of Upward Bound on Postsecondary Enrollment and Credits by Students' Eligibility Status,
ParticipantsAll Students
Excludes Unverified Self-Reported Enrollment
FG Only LI Only
Control Mean Impact
First-Generation Only Low-Income Only
ImpactImpact ImpactControl Mean Impact
Low-Income & First-Gen. LI & FG
Control Mean Impact

Postsecondary School Status (%)Any postsecondary school 77 -2 58 11 *** # 65 8 -3 14 *** 9 Four-year college 50 4 35 8 38 12 ** 5 10 14 **Two-year college 25 -10 ** 21 5 # 25 -4 -12 ** 6 -5Vocational school 1 4 ** 2 -1 * # 2 0 4 ** -1 0
Credits EarnedAll postsecondary schools 38.6 -1.9 32.6 4.6 30.0 7.9 * -2.2 5.5 9.0 *
Nonremedial 36.6 -2.9 31.5 4.6 27.6 8.4 * -3.3 5.4 9.6 ** Remedial 1.6 0.1 0.9 0.1 2.1 -0.5 0.1 0.1 -0.5 Other 0.5 0.9 0.2 0.0 0.2 -0.1 1.0 0.0 -0.1
Four-year colleges 31.1 -1.8 20.6 2.1 13.1 15.3 *** # -2.0 2.5 17.4 *** Nonremedial 30.0 -2.7 20.0 2.0 12.7 15.2 *** # -3.1 2.4 17.3 *** Remedial 0.7 0.2 0.4 0.1 0.3 0.0 0.2 0.1 0.0 Other 0.4 0.7 0.2 0.0 0.1 0.1 0.8 0.0 0.1
Two-year colleges 6.6 -0.3 11.1 2.9 14.9 -5.2 -0.4 3.4 -5.9 Nonremedial 5.7 -0.2 10.6 2.9 13.0 -4.7 -0.2 3.4 -5.4 Remedial 0.8 -0.1 0.5 0.0 1.9 -0.5 -0.2 0.0 -0.5 Other 0.1 0.0 0.0 0.0 0.0 - 0.0 0.0 -
Vocational schools 1.0 0.2 0.8 -0.2 1.9 -2.5 0.2 -0.3 -2.8 Nonremedial 0.9 0.0 0.8 -0.2 1.8 -2.3 0.0 -0.3 -2.6 Remedial 0.0 0.0 0.0 - 0.0 0.0 0.0 - 0.0 Other 0.0 0.2 0.0 - 0.1 -0.2 0.2 - -0.2
Source: pst-black.log, pst-white.log, and pst-hisp.logNote: Hyphens indicate too few respondents to compute impact. Weighted values reported.*/**/*** Impact estimate is statistically significant at the 0.10 / 0.05 / 0.01 level.# Indicates that for all students, the impacts are significantly different from the impacts for African American students at the 0.10 level.
Impact ImpactControl Mean Impact Control Mean ImpactImpact Control Mean Impact
Afr Amer White HispanicAfrican American HispanicWhite
Participants
Table III.9
Impact of Upward Bound on Postsecondary Enrollment and Credits for African American, White and Hispanic Students,Includes All Self-Reported Postsecondary Enrollment
All Students
48

49
Postsecondary School Status (%)Any postsecondary school 68 -7 52 15 *** # 56 16 *** # -8 18 *** 18 ***Four-year college 44 -1 30 10 ** 31 14 *** # -1 11 ** 16 ***Two-year college 22 -7 19 8 ** # 23 -2 -8 9 ** -2 Vocational school 1 1 2 -1 ** # 2 3 1 -2 ** 3
Credits EarnedAll postsecondary schools 33.6 -3.7 30.1 4.8 25.1 7.8 * -4.4 5.7 * 8.7 *
Nonremedial 31.8 -4.3 29.2 4.8 * 23.4 7.5 * -5.2 5.7 * 8.4 * Remedial 1.5 -0.2 0.7 0.0 1.4 0.3 -0.2 0.0 0.4 Other 0.3 0.9 * 0.2 0.0 0.2 0.0 1.0 * 0.0 0.0
Four-year colleges 26.4 -2.0 19.4 1.6 12.2 12.1 *** # -2.4 1.9 13.5 *** Nonremedial 25.3 -2.7 18.8 1.7 11.7 11.9 *** # -3.2 2.0 13.3 *** Remedial 0.8 0.0 0.4 -0.1 0.3 0.0 0.0 -0.1 0.0 Other 0.3 0.7 0.2 0.0 0.2 0.1 0.8 0.0 0.1
Two-year colleges 6.3 -1.8 10.0 3.6 * # 11.5 -3.6 -2.2 4.4 * -4.0 Nonremedial 5.6 -1.6 9.6 3.6 * # 10.3 -3.8 -1.9 4.3 * -4.3 Remedial 0.7 -0.2 0.3 0.1 1.1 0.3 -0.3 0.1 0.3 Other 0.0 0.0 0.0 0.0 0.0 - 0.0 0.0 -
Vocational schools 0.9 0.1 0.6 -0.3 1.4 -0.9 0.2 -0.4 -1.0 Nonremedial 0.9 -0.1 0.6 -0.3 1.3 -0.8 -0.1 -0.4 -0.9 Remedial 0.0 0.0 0.0 - 0.0 0.0 0.0 - 0.0 Other 0.0 0.2 0.0 - 0.1 -0.1 0.2 - -0.1
Source: pst-black.log, pst-white.log, and pst-hisp.logNote: Hyphens indicate too few respondents to compute impact. Weighted values reported.*/**/*** Impact estimate is statistically significant at the 0.10 / 0.05 / 0.01 level.# Indicates that for all students, the impacts are significantly different from the impacts for African American students at the 0.10 level.
Participants
Table III.10
Impact of Upward Bound on Postsecondary Enrollment and Credits for African American, White, and Hispanic Students,
All Students
Excludes Unverified Self-Reported Enrollment
Afr Amer White HispanicAfrican American HispanicWhite
Impact Control Mean Impact Impact ImpactControl Mean Impact Control Mean Impact

50
5. Subgroups Defined by the Sex of the Student
Upward Bound may have raised the enrollment rate of young men and young women in
four-year institutions, but the evidence is not conclusive. When we include all postsecondary
enrollment reported by sample members, the estimated effect on four-year college enrollment is
7 percentage points and statistically significant for both groups (see Table III.11). However,
when we exclude unverified postsecondary enrollment, the effect becomes smaller and
statistically insignificant for both groups (see Table III.12).
The impacts of Upward Bound on postsecondary credits are positive for men. For young
men, Upward Bound increased the total number of postsecondary credits from 19 credits to 27
credits (see Table III.11). For young women, the estimated effect is statistically insignificant.
6. Subgroups Defined by the Likelihood of Being Selected to Participate in Upward Bound
Before students were randomly assigned to the treatment group or control group, we asked
project directors to rate students they had determined eligible for their program according to the
likelihood that they would have been selected to participate in Upward Bound in the absence of
the experiment. We used these ratings to assess whether the program’s effects would change if
project directors dipped further into the pool of eligible applicants to select different types of
students.
Upward Bound raised four-year college enrollment by students who were most likely to be
selected for Upward Bound (see Table III.13).24 For these students, Upward Bound raised four-
year college enrollment 10 percentage points to 52 percent; this represents a 24 percent increase
over the enrollment rate for similar students in the control group (42 percent). For students who
24 In general, when we tested whether differences in impacts existed among these three groups, we found no
statistically significant differences. This suggests that our evaluation did not distort the group of students served.

51
were somewhat likely to be selected, the estimated effects of Upward Bound on postsecondary
enrollment are statistically insignificant. For students who were least likely to be selected,
Upward Bound may raise four-year college enrollment but the evidence is inconclusive. When
we include all postsecondary enrollment reported by sample members, the estimated effect on
four-year college enrollment is statistically insignificant for these students (see Table III.13).
However, when we exclude unverified postsecondary enrollment, the estimated effect becomes
larger and statistically significant (see Table III.14).
The effect of Upward Bound on postsecondary persistence appears to be largest for the
students that projects are least likely to serve. For students who were least likely to be selected
for the program, Upward Bound increased the number of credits earned at four-year institutions
from 9 to 33 credits—large impacts for a small subgroup of treatment students (see Table III.13).
For these students, Upward Bound may have also increased the number of credits earned at all
postsecondary institutions (see Table III.13), but the estimated impact becomes statistically
insignificant when we exclude unverified postsecondary enrollment (see Table III.14). For
students who were somewhat likely to be selected, the effects of Upward Bound on the total
number of credits earned at all postsecondary institutions and the number of credits earned at
four-year institutions were statistically insignificant. For students who were most likely to be
selected, Upward Bound may have raised the average number of credits earned at four-year
colleges and universities (see Table III.13), but the estimated impact becomes statistically
insignificant when we exclude unverified postsecondary enrollment (see Table III.14).
C. The Effect of Upward Bound on College Engagement
Besides assessing the effects of Upward Bound on postsecondary enrollment and credits, we
examined the effects of the program on a set of related outcomes that describe students’

52
Postsecondary School Status (%)Any postsecondary school 59 4 75 3 5 3 Four-year college 33 7 * 49 7 * 8 * 8 *Two-year college 24 -3 24 -6 -3 -7 Vocational school 1 0 2 3 0 3
Credits EarnedAll postsecondary schools 18.5 8.9 ** 42.1 -1.3 # 10.2 ** -1.5
Nonremedial 17.0 8.5 ** 39.9 -1.9 # 9.8 ** -2.2 Remedial 1.1 -0.1 1.7 -0.1 -0.1 -0.2 Other 0.4 0.5 0.6 0.7 0.5 0.8
Four-year colleges 12.5 7.0 ** 29.7 1.7 8.0 ** 2.0 Nonremedial 11.5 6.9 ** 28.7 0.8 7.9 ** 0.9 Remedial 0.5 -0.1 0.6 0.2 -0.1 0.2 Other 0.4 0.2 0.5 0.8 0.2 0.9
Two-year colleges 5.8 1.2 10.9 -2.1 1.4 -2.5 Nonremedial 5.3 1.3 9.8 -1.8 1.5 -2.1 Remedial 0.5 0.0 1.1 -0.4 -0.1 -0.4 Other 0.0 0.0 0.0 0.0 0.0 0.0
Vocational schools 0.2 0.6 1.4 -0.9 0.7 -1.1 Nonremedial 0.2 0.3 1.4 -0.9 0.4 -1.0 Remedial 0.0 0.0 0.0 0.0 0.0 0.0 Other 0.0 0.3 0.0 0.0 0.3 -0.1
Source: pst-male.log and pst-female.logNote: Hyphens indicate too few respondents to compute impact. Weighted values reported.*/**/*** Impact estimate is statistically significant at the 0.10 / 0.05 / 0.01 level.# Indicates that for all students, the impacts are significantly different from the impacts for male students at the 0.10 level.
Impact of Upward Bound on Postsecondary Enrollment and Credits for Male and Female Students,
Table III.11
All Students Participants
Includes All Self-Reported Postsecondary Enrollment
Impact
Female Female
Impact Impact Impact
Male Male
Control Mean Control Mean

Postsecondary School Status (%)Any postsecondary school 50 9 * 67 2 10 * 2 Four-year college 26 6 43 4 7 5 Two-year college 23 -1 21 -3 -1 -3 Vocational school 1 4 * 2 0 4 * 1
Credits EarnedAll postsecondary schools 17.9 6.6 * 36.5 -1.6 7.6 * -1.9
Nonremedial 16.7 6.1 * 34.6 -2.1 7.0 * -2.5 Remedial 1.0 -0.2 1.4 -0.1 -0.2 -0.1 Other 0.2 0.7 0.5 0.5 0.7 0.6
Four-year colleges 12.4 4.6 25.5 1.2 5.3 1.4 Nonremedial 11.7 4.3 24.4 0.6 4.9 0.7 Remedial 0.5 0.0 0.6 0.0 0.0 0.0 Other 0.2 0.4 0.4 0.5 0.4 0.6
Two-year colleges 5.4 0.2 9.8 -2.0 0.2 -2.4 Nonremedial 4.9 0.3 9.0 -1.9 0.4 -2.3 Remedial 0.5 -0.1 0.8 -0.1 -0.2 -0.1 Other 0.0 0.0 0.0 0.0 0.0 0.0
Vocational schools 0.2 1.7 ** 1.2 -0.8 # 2.0 ** -0.9 Nonremedial 0.2 1.5 ** 1.2 -0.8 # 1.7 ** -0.9 Remedial 0.0 0.0 0.0 0.0 0.0 0.0 Other 0.0 0.3 0.0 0.0 0.3 0.0
Source: pst-male.log and pst-female.logNote: Hyphens indicate too few respondents to compute impact. Weighted values reported.*/**/*** Impact estimate is statistically significant at the 0.10 / 0.05 / 0.01 level.# Indicates that for all students, the impacts are significantly different from the impacts for male students at the 0.10 level.
Impact
Female Female
Impact Impact Impact
Male Male
Control Mean Control Mean
Impact of Upward Bound on Postsecondary Enrollment and Credits for Male and Female Students,
Table III.12
All Students Participants
Excludes Unverified Self-Reported Enrollment
53

54
Postsecondary School Status (%)Any postsecondary school 65 9 74 2 68 4 10 2 5 Four-year college 30 15 50 1 42 10 *** 17 1 12 ***Two-year college 34 -7 23 -4 23 -6 -7 -5 -6Vocational school 0 0 1 5 * 2 0 0 5 * 0
Credits EarnedAll postsecondary schools 28.5 17.3 ** 40.0 -4.9 # 33.3 4.3 19.6 ** -5.7 5.0
Nonremedial 27.0 17.9 *** 38.2 -4.8 # 30.9 3.0 # 20.3 *** -5.5 3.5 Remedial 1.2 -0.5 1.3 0.4 1.8 -0.5 -0.5 0.5 -0.6 Other 0.3 -0.1 0.5 -0.5 0.6 1.9 * -0.2 -0.6 2.2 *
Four-year colleges 8.8 24.4 *** 31.6 -4.4 # 22.0 4.9 * # 27.7 *** -5.1 5.7 * Nonremedial 8.1 24.7 *** 30.5 -4.0 # 21.1 3.1 # 28.0 *** -4.6 3.6 Remedial 0.3 -0.1 0.8 0.0 0.4 0.2 -0.2 0.0 0.2 Other 0.3 -0.1 0.4 -0.4 0.6 1.6 -0.2 -0.5 1.9
Two-year colleges 17.3 -4.1 7.6 -0.2 10.0 -0.7 -4.7 -0.2 -0.8 Nonremedial 16.4 -3.8 7.0 -0.5 8.6 0.0 -4.3 -0.6 0.0 Remedial 0.9 -0.3 0.5 0.4 ** 1.4 -0.8 * -0.4 0.4 ** -0.9 * Other 0.0 - 0.1 0.0 0.0 0.1 - 0.0 0.1
Vocational schools 2.4 -3.0 0.8 -0.4 1.1 0.1 -3.4 -0.4 0.1 Nonremedial 2.4 -3.0 0.7 -0.3 1.1 -0.2 -3.4 -0.3 -0.2 Remedial 0.0 - 0.0 0.0 0.0 0.0 - 0.0 0.0 Other 0.0 - 0.1 -0.1 0.0 0.2 - -0.1 0.2
Source: pst-rating_h.log, pst-rating_m.log, and pst-rating_l.logNote: Hyphens indicate too few respondents to compute impact. Weighted values reported.*/**/*** Impact estimate is statistically significant at the 0.10 / 0.05 / 0.01 level.# Indicates that for all students, the impacts are significantly different from the impacts for least likely students at the 0.10 level.
MostSomewhat
ImpactImpactImpactControl Mean Control Mean ImpactImpact Control Mean Impact
Least Likely
Participants
Table III.13
Impact of Upward Bound on Postsecondary Enrollment and Credits by the Likelihood of Admission to Upward Bound,Includes All Self-Reported Postsecondary Enrollment
All Students
LeastSomewhat Likely Most Likely

Postsecondary School Status (%)Any postsecondary school 57 11 65 0 60 5 13 0 6 Four-year college 24 18 ** 42 -2 37 9 *** 21 * -2 10 ***Two-year college 32 -7 21 -1 21 -3 -7 -1 -3 Vocational school 1 0 2 3 2 0 0 4 0
Credits EarnedAll postsecondary schools 28.1 10.4 32.5 -3.4 30.6 1.4 11.7 -4.0 1.7
Nonremedial 26.8 10.9 31.0 -3.2 28.7 0.3 12.2 -3.8 0.3 Remedial 0.9 -0.1 1.2 0.1 1.5 -0.4 -0.1 0.1 -0.4 Other 0.4 -0.3 0.4 -0.3 0.5 1.5 * -0.4 -0.4 1.8 *
Four-year colleges 12.7 16.8 *** 25.1 -3.2 # 20.2 3.1 # 18.9 *** -3.8 3.6 Nonremedial 12.0 17.1 *** 24.1 -2.8 # 19.3 1.7 # 19.2 *** -3.3 2.0 Remedial 0.3 0.1 0.8 -0.2 0.5 0.1 0.1 -0.2 0.1 Other 0.4 -0.3 0.3 -0.3 0.5 1.3 -0.4 -0.3 1.5
Two-year colleges 13.6 -4.2 6.6 -0.2 9.5 -1.8 -4.8 -0.2 -2.1 Nonremedial 12.9 -4.0 6.1 -0.5 8.5 -1.3 -4.6 -0.6 -1.6 Remedial 0.7 -0.2 0.4 0.3 1.0 -0.4 * -0.2 0.4 -0.5 * Other 0.0 - 0.1 0.0 0.0 0.0 - 0.0 0.0
Vocational schools 1.8 -2.1 0.8 0.0 0.9 0.1 -2.4 0.0 0.2 Nonremedial 1.8 -2.1 0.8 0.0 0.8 0.0 -2.4 0.1 0.0 Remedial 0.0 - 0.0 0.0 0.0 0.0 - 0.0 0.0 Other 0.0 - 0.0 0.0 0.0 0.2 - 0.0 0.2
Source: pst-rating_h.log, pst-rating_m.log, and pst-rating_l.logNote: Hyphens indicate too few respondents to compute impact. Weighted values reported.*/**/*** Impact estimate is statistically significant at the 0.10 / 0.05 / 0.01 level.# Indicates that for all students, the impacts are significantly different from the impacts for least likely students at the 0.10 level.
LeastSomewhat Likely Most Likely
ParticipantsAll Students
MostSomewhatLeast Likely
Table III.14
Impact of Upward Bound on Postsecondary Enrollment and Credits by the Likelihood of Admission to Upward Bound,Excludes Unverified Self-Reported Enrollment
Impact Control Mean Impact ImpactImpactImpactControl Mean Control Mean Impact
55

56
experiences while attending postsecondary institutions. Previous research has shown, for
example, that postsecondary students who are more engaged in school are more likely to persist
and graduate (Braxton 2000). For the national evaluation of Upward Bound, we measured
students’ engagement by asking them to report on the frequency with which they used academic
counseling services, obtained personal counseling, received help from a learning skills center,
received tutoring services, engaged in services offered by a minority student center or obtained
services from a health center during their first year of college. We also measured students’ use
of services provided by Student Support Services,25 receipt of financial aid and whether students
had met with faculty or an advisor about academic issues, participated in study groups outside of
class, worked for pay while in college or participated in activities outside of class such as
intramural sports and school clubs.
For most of the college engagement outcomes that we examined, the estimated effects of
Upward Bound are statistically insignificant (see Table III.15). For example, Upward Bound did
not have a statistically significant effect on the rate at which students received financial aid in
college. However, Upward Bound slightly increased the receipt of personal counseling, the use
of learning skills centers and the use of tutoring services during students’ first year in college
(see Table III.15). Upward Bound also increased the employment rate and hours worked by
students in college. For college sophomores, Upward Bound raised the employment rate from 37
percent to 47 percent and the average number of hours worked per week from 10 to 12 hours per
week. The effects of Upward Bound on college engagement outcomes for different subgroups
do not suggest any notable findings (see Appendix E).
25 Student Support Services is a federal program designed to provide low-income and first-generation college
students with opportunities for academic development, assist them in meeting basic college requirements and motivate them toward completing their degrees.

57
Residence in focused housing (%) 1 0 0
Days per year of parent or student contact with school 72.2 2.0 2.4
Academic counseling 1.4 0.2 0.2 Personal counseling 0.4 0.2 ** 0.3 **Learning skills center services 0.8 0.2 * 0.3 *Tutoring services 1.0 0.3 *** 0.4 ***Minority student services 0.4 0.1 0.1 Health services 0.6 0.0 0.1 Other 0.0 0.0 0.0
Student Support Services 5 1 1 McNair Post-Baccalaureate Achievement Program 1 0 0
Student received financial aid (%) 55 -1 -2
Talked with faculty in office about academic matters 2.1 0.1 0.1 Met with advisor concerning academic plans 1.7 0.1 0.1 Had informal contact with advisor or other faculty 1.6 0.2 ** 0.3 **Participated in study groups outside of class 2.4 -0.1 -0.1 Went to events with friends from school 3.1 0.1 0.1 Participated in school clubs 1.3 0.1 0.1 Attended career-related lectures, conventions, or field
trips with friends 1.4 0.0 0.0 Participated in intramural or intercollegiate sports,
music, drama, etc. 1.2 0.0 0.0 Cut classes 1.5 0.0 0.0
While in college or other school, student worked for pay (%)Freshman year 45 1 1 Sophomore year 37 10 *** 11 ***
Approximate hours worked per week during:Freshman year 12.9 -1.4 -1.7 Sophomore year 10.0 2.0 *** 2.4 ***
Source: pss-overall.logNote: Weighted values reported.*/**/*** Impact estimate is statistically significant at the 0.10 / 0.05 / 0.01 level.
Impact
How often during first year of postsecondary school student:
Impact
Table III.15
Impact of Upward Bound on College Engagement
All Students Participants
How often during first year in postsecondary school student used the following supplemental services
Participation in federally supported programs while in postsecondary school (%)
Control Mean


59
IV. The Effect of Longer Upward Bound Participation and Completion on Postsecondary Enrollment and Persistence
It is possible that students would reap larger benefits from Upward Bound if they spent more
time in the program. The typical participant remains in Upward Bound for a little more than a
year and a half, and most participants do not complete the program (see Chapter II). In this
chapter, we describe the relationships between two postsecondary outcomes—postsecondary
enrollment and credits—and two measures of the extent to which students participated in
Upward Bound—the duration of program participation and program completion. In measuring
these relationships, we attempt to estimate the effects of additional participation on
postsecondary enrollment and credits.
As we describe later, the estimated effects of additional participation may overstate the true
effects due to selection bias. With this caution in mind, our findings suggest that keeping
students in Upward Bound for longer periods may substantially improve their postsecondary
outcomes. Although these findings may appear at odds with the findings described in Chapter III
on the effect of Upward Bound on postsecondary outcomes, our analysis suggests that the
findings in Chapters III and IV are not inconsistent with each other (see Section D).
Findings reported in this chapter suggest that the effects of Upward Bound on postsecondary
enrollment and persistence would increase if Upward Bound projects implemented retention
programs that raised the average length of program participation. However, the findings do not
suggest that the effects of Upward Bound would increase if projects focused their recruiting on
the types of students who tend to have long spells of participation. For example, students with
higher educational expectations tend to have long spells of participation (see Chapter II, Table

60
II.1). However, these students tend to reap smaller benefits from Upward Bound than students
with lower educational expectations (see Chapter III, Table III.2).
A. Research Questions
To assess the potential for keeping students in Upward Bound for longer periods of time, we
classified participants as “low-duration participants” (1 to 12 months of participation), “medium-
duration participants” (13 to 24 months of participation) or “high-duration participants” (25 or
more months of participation), and also as program “completers” (still participating in the spring
of senior year) or “noncompleters.” Among Upward Bound participants, 35 percent participate
for 1 to 12 months, 28 percent participate for 13 to 24 months and 36 percent participate for 25
or more months; 40 percent complete the program, that is, participate in Upward Bound through
high school graduation (see Table IV.1).26 These findings suggest that there is considerable
opportunity to increase the completion rate and the length of time that participants remain in the
program.
To better understand the potential effects of Upward Bound retention on postsecondary
enrollment and credits, we address two research questions:
1. For low- and medium-duration participants, hereafter referred to as “lower-duration participants,” how much higher would their postsecondary enrollment rate and persistence be if they participated for an additional year?
2. For noncompleting participants, how much higher would their postsecondary enrollment rate and persistence be if they completed Upward Bound?
26 Students who complete Upward Bound participate for different lengths of time depending on whether they
enter the program in eighth grade, ninth grade, tenth grade or eleventh grade.

61
B. Research Methods
To answer these questions, we compared the outcomes for students with relatively low
levels of participation to those for students with relatively high levels of participation. A simple
comparison of students with different levels of Upward Bound participation, however, may fail
to reveal the effects of additional participation. While random assignment ensures that there will
be no systematic differences between treatment and control students, it does not ensure there will
be no systematic differences between completers and noncompleters or among students who
choose to participate in Upward Bound for different lengths of time. The characteristics of
students may influence how long they choose to participate in Upward Bound and whether they
complete Upward Bound. If so, the average characteristics of students will vary with the level of
Upward Bound participation. For example, we found that students who participate in Upward
Bound for longer periods of time are more likely to be female and have higher grade point
averages in ninth grade than students who participate for shorter periods (see Table IV.2); we
find similar differences between completers and noncompleters. Therefore, we cannot infer the
effects of additional Upward Bound participation simply from differences in average outcomes
between lower- and higher-duration students and between completers and noncompleters.
Duration 1-12 months 13-24 months 25+ months Rates
All Cohorts of Participants 21 35 28 36 40
8th Grade Cohort 31 24 17 60 359th Grade Cohort 21 38 18 44 3310th Grade Cohort 18 35 41 24 4811th Grade Cohort 12 43 57 — 57
Source: char1.log
Completion
Table IV.1
Duration of Upward Bound Participation and Completion Rates,
Distribution of DurationMean
Excluding No-Shows

62
Male 41 36 24 39 25Female 60 64 76 61 75
African American 44 42 44 41 47White 19 31 23 25 21Hispanic 29 16 26 24 25Other Race 8 11 8 10 7
Low-Income and First-Generation 74 84 81 77 83First-Generation Only 22 10 15 19 12Low-Income Only 4 6 5 5 5
High School or Less 4 3 4 6 1Some College 17 20 17 19 16Finish Four-year College 43 37 37 36 43More Than a Four-year Degree 28 27 33 29 30
Total Credits 5.7 6.1 6.1 5.8 6.2Advanced Placement and Honors Credits 0.6 0.3 0.5 0.4 0.5Overall Grade Point Average 2.1 2.4 2.5 2.1 2.5
Less than 1 Hour / Week 11 8 3 11 21-10 Hours / Week 68 66 76 70 71More than 10 Hours / Week 21 26 20 19 26
Less than 1 Hour / Week 41 38 34 40 341-10 Hours / Week 46 49 55 47 5411-15 Hours / Week 5 7 8 6 7More than 15 Hours / Week 5 4 3 4 4
Disobeying Rules 46 42 42 46 39In-school Suspension 24 11 14 20 12Out-of-school Suspension 14 12 10 14 9
Very Sure 84 90 87 84 92Less Sure 16 10 13 16 8
Source: char2.log
Yes
Participation Duration (Months) Completion Status
Table IV.2
Characteristics of Upward Bound Participants Who Entered in Ninth or Tenth Gradeby Participation Duration and Completion Status
1-12 13-24 25+ No
Homework (%)
Extracurricular Activities (%)
Disciplinary Problems (%)
Graduation probability (self-assessed, %)
Race (%)
Low-Income and First-Generation (%)
Characteristics
Academic Achievement - Ninth Grade
Educational Expectations (%)
Sex (%)

63
Because students with different levels of Upward Bound participation have different
characteristics, we used statistical matching to select samples of lower- and higher-duration
students with similar observed characteristics and samples of noncompleters and completers with
similar characteristics.27 To measure the potential effects of participating in Upward Bound for
an additional year, we matched low-duration participants to similar medium-duration
participants, and we matched medium-duration participants to similar high-duration
participants.28 Likewise, to measure the potential effects of program completion on
noncompleters, we matched noncompleters to similar completers. The matching process ensured
that matched samples contained participants with similar demographic characteristics,
educational aspirations and ninth-grade academic performance.29
In this analysis, we restricted our sample to students who entered Upward Bound in ninth or
tenth grade. We excluded students who applied for Upward Bound in the eighth grade because
they had not yet entered high school and therefore we could not obtain information on their
previous academic performance from high school transcripts. Because postsecondary enrollment
and credits were the key outcomes for this analysis, and because academic performance before
college influences these outcomes, it was important to match students with similar academic
performance before they entered Upward Bound. We also excluded students who applied for
Upward Bound after tenth grade. Their window of opportunity to participate in Upward Bound
27 Unlike random assignment, which ensures two statistically equivalent groups that are similar in terms of
observed and unobserved characteristics, the matching procedures can only create groups that are similar in terms of observed characteristics.
28 These matches allow us to simulate what the outcomes of low-duration participants would have been had they instead been medium-duration participants and what the outcomes of medium-duration participants would have been had they instead been high-duration participants.
29 We used propensity score matching to select the matched samples. See Appendix F for additional details.

64
was relatively short—two years—so the potential for increasing the length of their participation
in Upward Bound was limited.
Once matching was completed, we estimated program effects using the same methods
employed throughout this report. For example, consider the comparison of noncompleters to
similar completers. We treated completers as the “treatment group”—the group that received
additional Upward Bound services—and noncompleters as the “control group.” The treatment-
control difference in mean outcomes provides an estimate of the potential benefit of additional
Upward Bound participation.30
Although the matched samples have similar demographic characteristics, educational
expectations and ninth-grade academic performance, they may differ in ways not revealed by the
data collected for the evaluation. For example, our matched samples of completers and
noncompleters may differ in their motivation to attend college. Unobserved differences between
matched samples may bias the estimates presented in the next section. Therefore, we must
interpret these estimates cautiously (see Section D).
C. The Effect of Longer Participation and Completion
Though subject to the caveats described earlier and presented in more detail at the end of
this chapter, findings from this analysis suggest:
• Longer participation may yield larger effects. For students who participated in Upward Bound for less than two years, an additional year of Upward Bound participation may raise the postsecondary enrollment rate by as much as 9 percentage points and the average number of postsecondary credits earned by as many as nine credits.
30 Mean outcomes were regression-adjusted with the same linear model used throughout the report to compute
the impacts of the opportunity to participate in Upward Bound (see Chapter I, footnote 6), with additional covariates on ninth-grade academic performance and Upward Bound cohort.

65
• Program completion may yield larger effects. For Upward Bound participants who did not complete the program, program completion may raise postsecondary enrollment by as much as 17 percentage points and the average number of postsecondary credits by as much as 16 credits.
• The effect of additional participation operates through greater enrollment at four-year institutions. Additional Upward Bound participation seems to raise enrollment at four-year institutions and, as a consequence, raises overall postsecondary enrollment.
• The effect of additional participation on postsecondary enrollment and credits is similar for students with higher and lower ninth-grade academic performance. For none of the relevant outcomes is there a statistically significant difference in the effects of additional participation between higher- and lower-risk students; almost all of the estimated effects are similar for the two groups.
1. The Effect of Longer Participation
Our findings suggest that Upward Bound would have a much larger effects on lower-
duration participants—students who participated for no more than 24 months—if it could keep
them in the program longer (see Table IV.3). About 69 percent of lower-duration participants
had attended a postsecondary institution between high school and the third follow-up survey.
Our results suggest that if these participants had stayed in Upward Bound an additional year, 78
percent would have attended a postsecondary institution, and the average number of
postsecondary credits earned would have risen from 30 to 40.
2. The Effect of Program Completion
Our findings also suggest that Upward Bound might have a larger effect on noncompleters if
it retained them through high school graduation (see Table IV.4). If noncompleters remained in
Upward Bound through program completion, we estimate that they would on average participate
for an additional 22 months—almost two years.31 Therefore, one might expect the effects of
31 For students who entered Upward Bound in ninth or tenth grade, the average duration for noncompleters was
just over nine months. For completers from this same group, the average duration in the program was more than 31 months.

66
program completion to be approximately twice that of an additional year of participation, and our
analysis confirms that expectation. For noncompleters, our estimates suggest program
completion would raise postsecondary enrollment rates from 74 percent to 91 percent.32
Additional estimates suggest that completing Upward Bound would raise the average number of
postsecondary credits earned by noncompleters from 37 to 53.
3. The Effect of Longer Participation and Program Completion on Enrollment at Four-Year Institutions
Just as Upward Bound participation raises enrollment rates at four-year colleges and
universities (see Chapter III, Table III.1), additional Upward Bound participation also seems to
raise enrollment rates at these institutions. For lower-duration participants, our estimates suggest
32 For comparison, 87 percent of Upward Bound completers attended a postsecondary institution.
Lower-DurationParticipants
Postsecondary School Status (%)Any postsecondary school † 69 9 ***Four-year college 46 13 ***Two-year college 21 -4 *Vocational school 2 1
Credits Earned (mean)All postsecondary schools † 30.4 9.4 ***Four-year colleges 22.6 6.8 ***Two-year colleges 6.9 2.5 Vocational schools 0.9 0.2
Source: means.log and out_imp.log*/**/*** Impact estimate is statistically significant at the 0.10 / 0.05 / 0.01 level.† Includes four-year, two-year, vocational, and other postsecondary schools that could not be classified.
Table IV.3
Additional Year
Postsecondary Enrollment and CreditsImpact of an Additional Year of Upward Bound Participation on
Impact of an

67
that an additional year of participation would raise enrollment rates at four-year colleges and
universities from 46 percent to 59 percent (see Table IV.3). For noncompleters, our estimates
suggest that program completion would raise enrollment rates at four-year institutions from 52
percent to 75 percent (see Table IV.4).
Furthermore, the effect of additional participation on four-year college enrollment appears to
generate a positive effect on overall postsecondary enrollment. The estimated effect of an
additional year of participation on overall postsecondary enrollment—9 percentage points—can
be attributed to the 13 percentage point increase in enrollment at four-year colleges and
universities (see Table IV.3). Similarly, the estimated effect of program completion on overall
postsecondary enrollment—17 percentage points—can be attributed to the 23 percentage point
increase in enrollment at four-year colleges and universities (see Table IV.4). Therefore,
additional Upward Bound participation seems to raise enrollment at four-year institutions and, as
a consequence, raises overall postsecondary enrollment.
Noncompleters
Postsecondary School Status (%)Any postsecondary school † 74 17 ***Four-year college 52 23 ***Two-year college 18 -8 **Vocational school 3 3
Credits Earned (mean)All postsecondary schools † 37.1 15.8 ***Four-year colleges 27.7 12.3 ***Two-year colleges 8.5 3.9 *Vocational schools 0.8 -0.3
Source: means.log and out_imp.log*/**/*** Impact estimate is statistically significant at the 0.10 / 0.05 / 0.01 level.† Includes four-year, two-year, vocational, and other postsecondary schools that could not be classified.
Table IV.4
Completion
Postsecondary Enrollment and CreditsImpact of Upward Bound Completion on
Impact of Program

68
4. The Effect of Longer Participation and Completion for Subgroups Defined by Academic Risk
For lower-duration students, our findings suggest that an additional year of Upward Bound
would raise enrollment at four-year colleges and overall postsecondary enrollment for both
students at higher risk of academic failure and students at lower risk of academic failure (see
Table IV.5). The estimated effect of an additional year of Upward Bound participation on four-
year college enrollment is 12 percentage points for higher-risk students and 13 percentage points
for lower-risk students. As a result, Upward Bound raised overall postsecondary enrollment for
both groups, by 7 percentage points for higher-risk students and by 8 percentage points for
lower-risk students. For both higher-risk and lower-risk students, an additional year of Upward
Postsecondary School Status (%)Any postsecondary school † 47 7 * 76 8 ***Four-year college 31 12 *** 51 13 ***Two-year college 15 -4 23 -6 **Vocational school 1 -1 2 0
Credits Earned (mean)All postsecondary schools † 12.2 6.7 ** 37.2 12.1 ***Four-year colleges 7.5 6.6 ** 28.2 10.4 ***Two-year colleges 3.9 0.4 7.9 1.7 Vocational schools 0.7 -0.3 0.9 0.1
Source: means.log and out_imp.log*/**/*** Impact estimate is statistically significant at the 0.10 / 0.05 / 0.01 level.The impacts for higher risk and lower risk students are not significantly different from each other at the 0.10 level.† Includes four-year, two-year, vocational, and other postsecondary schools that could not be classified.
Postsecondary Enrollment and Credits by Students' At-Risk Status
Lower-Duration Impact of an Lower-Duration Impact of anAdditional Year
Table IV.5
Impact of an Additional Year of Upward Bound Participation on
Additional YearParticipants
Higher Risk
Participants
Lower Risk

69
Bound also seems to raise the number of postsecondary credits earned in four-year colleges and
overall.
For noncompleters, our findings suggest that Upward Bound completion would raise
postsecondary enrollment and credits earned for both students at higher risk of academic failure
and students at lower risk of academic failure (see Table IV.6). For example, the estimated
effects on overall postsecondary enrollment are 18 percentage points for higher-risk students and
16 percentage points for lower-risk students; the estimated effects on total postsecondary credits
are approximately 24 credits for higher-risk students and 19 credits for lower-risk students.
D. Interpretation of the Findings
Our findings suggest that the potential effects of retaining Upward Bound participants who
would otherwise leave the program early may be large. They suggest that an additional year of
Postsecondary School Status (%)Any postsecondary school † 52 18 * 80 16 ***Four-year college 37 29 *** 57 22 ***Two-year college 14 -13 19 -9 ***Vocational school 1 2 4 3
Credits Earned (mean)All postsecondary schools † 18.7 24.1 *** 43.6 19.1 ***Four-year colleges 11.9 14.4 33.3 17.4 ***Two-year colleges 6.3 8.6 * 9.3 2.3 Vocational schools 0.5 1.1 1.0 -0.6
Source: means.log and out_imp.log*/**/*** Impact estimate is statistically significant at the 0.10 / 0.05 / 0.01 level.The impacts for higher risk and lower risk students are not significantly different from each other at the 0.10 level.† Includes four-year, two-year, vocational, and other postsecondary schools that could not be classified.
Noncompleters Completion Noncompleters Completion
Table IV.6
Impact of Upward Bound Completion onPostsecondary Enrollment and Credits by Students' At-Risk Status
Higher Risk Lower Risk
Impact of Program Impact of Program

70
participation would raise the postsecondary enrollment rate for lower-duration participants by
about 9 percentage points, and that program completion would raise the postsecondary
enrollment rate for noncompleters by about 20 percentage points.
However, we suspect the true effects of additional participation are probably smaller than
the estimates presented in this chapter. Although we used rigorous statistical methods in our
analysis, we could not randomly assign students to different levels of Upward Bound
participation. Therefore, it is likely that unobserved differences between the matched samples
have generated selection bias in the estimates reported in this chapter. Because participants
decide how long to participate and whether to complete the program (unless they are expelled),
the groups may differ along many dimensions, including unmeasured characteristics like the
motivation to attend college. If so, the estimated effects of additional participation, based on
comparisons between these groups, may be partly attributable to differences in motivation that
predated the Upward Bound participation of these students.
While the selection bias could be positive or negative, we suspect that selection bias leads us
to overestimate the effects of additional participation. It seems likely that more motivated
students participate longer in Upward Bound and complete Upward Bound at higher rates than
less motivated students. If so, higher-duration participants would tend to be more motivated than
lower-duration participants, and completers would tend to be more motivated than
noncompleters. Furthermore, it seems likely that more motivated students enroll in college at
higher rates than less motivated students. If so, higher-duration students should have higher
college enrollment rates than lower-duration students because higher-duration students tend to be
more motivated, and completers should have higher college enrollment rates than noncompleters
because completers tend to be more motivated. While matching may reduce the motivational

71
differences between the samples, we expect that these differences partially explain the large
positive effects of additional participation reported in this chapter.33
Given the nature of selection bias, it is impossible to know for certain whether it exists and,
if so, how large it is. But we should not assume that the estimates reported in this chapter greatly
overstate the effects of additional Upward Bound participation. An exercise we conducted
suggests that the magnitudes of the estimates reported in this chapter are credible. The estimated
effects of an additional year of Upward Bound on college enrollment, which are presented in this
chapter, are roughly consistent with the estimated effects of actual participation presented in
Chapter III when you account for the average length of participation and the characteristics of
lower-duration participants.34 Therefore, the estimated effects of additional Upward Bound
participation are consistent with the possibility that for lower-duration students who applied for
Upward Bound in ninth or tenth grade, Upward Bound raises the likelihood of college attendance
by about 9 percentage points per year of participation.
33 If unobserved factors have led to selection bias, the bias was probably not reduced much by matching
because the characteristics used in matching were weak predictors of how long students participated in Upward Bound and whether they completed the program. For example, only 6 out of the 19 variables used in matching lower-risk completers and noncompleters were significantly related to program completion at the 10 percent level; for higher-risk completers and noncompleters, 9 out of the 19 variables were used in matching were significantly related to program completion at the 10 percent level.
34 In Chapter III, we estimated that Upward Bound raised enrollment at four-year colleges for participants by 7 percentage points (see “Participants” column in Table III.1). However, this estimate is a function of the types of students served by the program and the duration of their participation in Upward Bound. The estimated impacts reported in Chapter III were based on all participants, while the estimated impacts reported in this chapter were based on a subgroup of participants that included students who entered Upward Bound in ninth or tenth grade (see Appendix F). These participants had somewhat lower than average educational expectations when they entered the program, and Chapter III found larger impacts for lower-expectation students. For students who entered Upward Bound in ninth or tenth grade, the estimated impacts of Upward Bound participation on enrollment at four-year colleges were 26 percentage points for lower-expectation students and 6 percentage points for higher-expectation students. These impacts correspond to annual impacts of 17 percentage points and 5 percentage points, respectively, for lower- and higher-expectation students. Weighting these estimates by the proportion of lower- and higher-expectation students among lower-duration students who entered Upward Bound in ninth or tenth grade yields an estimate of the annual impact of Upward Bound participation on four-year college enrollment (8 percentage points) that is to the same order of magnitude as the estimated impact of an additional year of Upward Bound on four-year college enrollment (13 percentage points, see Table IV.3). We find a similar degree of consistency between the annual impacts of Upward Bound participation and the impact of an additional year of participation on enrollment at two-year colleges.


73
References
Adelman, Cliff. “Answers in the Tool Box: Academic Intensity, Attendance Patterns, and Bachelor’s Degree Attainment.” Washington, D.C.: U.S. Department of Education, Office of Educational Research and Improvement, 1999.
Adelman, Cliff. “Participation in Outreach Programs Prior to High School Graduation: Socioeconomic Status by Race.” Paper presented at the ConnectED Conference, San Diego, Jan. 10, 2000.
Angrist, Joshua D., Guido W. Imbens and Donald B. Rubin. “Identification of Causal Effects Using Instrumental Variables.” Journal of the American Statistical Association, Vol. 91, No. 434, June 1996.
Berker, Lutz and C. Dennis Carroll. “Access to Postsecondary Education for the 1992 High School Graduates.” Washington, D.C.: U.S. Department of Education, Office of Educational Research and Improvement, 1998 (http://nces.ed.gov/pubs98/access/98105.pdf).
Bloom, Howard. “Accounting for No-Shows in Experimental Evaluation Designs.” Evaluation Review, Vol. 8, 1984.
Braxton, John M. (ed.). Reworking the Student Departure Puzzle. Nashville, Tenn.: Vanderbilt University Press, 2000.
Burkheimer, Graham J., Jay R. Levinsohn, Helen P. Koo and Arthur M. French. “A Study of the National Upward Bound and Talent Search Programs. Vol. IV. Evaluation Study of the Upward Bound Program.” Research Triangle Park, N.C.: Research Triangle Institute, 1976.
Burkheimer, Graham J. et al. “Final Report: Evaluation Study of the Upward Bound Program--A Second Follow-Up.” Research Triangle Park, N.C.: Research Triangle Institute, 1979.
Cohen, Jacob. Statistical Power Analysis for the Behavioral Sciences. Second Edition. Hillsdale, N.J.: Lawrence Erlbaum, 1988.
Coleman, James, E. Campbell, C. Hobson, J. McPartland, A. Mood, F. Weinfield and R. York. “Equality of Educational Opportunity.” Washington, D.C.: U.S. Department of Health, Education, and Welfare, 1966.
Congressional Budget Office. “Educational Achievement: Explanations and Implications of Recent Trends.” Washington, D.C.: Congressional Budget Office, August 1987.
Decker, Paul T., Jennifer King Rice, Mary T. Moore and Mary R. Rollefson. “Education and the Economy: An Indicators Report.” Washington, D.C.: U.S. Department of Education, National Center for Education Statistics, Office of Educational Research and Improvement, April 1997.

References (continued)
74
Jacobson, Jonathan, Cara Olsen, Jennifer King Rice, Stephen Sweetland and John Ralph. “Educational Achievement and Black-White Inequality.” Washington, D.C.: U.S. Department of Education, National Center for Education Statistics, Office of Educational Research and Improvement, 2001.
James, Donna Walker, Sonia Jurich and Steve Estes. “Raising Minority Academic Achievement: A Compendium of Education Programs and Practices.” Washington, D.C.: American Youth Policy Forum, 2001.
Jencks, Christopher, Marshall Smith, Henry Acland, Mary Jo Bane, David Cohen, Herbert Gintis, Barbara Heyns and Stephen Michelson. Inequality: A Reassessment of the Effect of Family and Schooling in America. New York: Basic Books, 1972.
Jencks, Christopher and Meredith Phillips (ed.). The Black-White Test Score Gap. Washington, D.C.: Brookings Institution Press, 1998.
Manksi, Charles F. and David A. Wise. College Choice in America. Cambridge, Mass.: Harvard University Press, 1983.
Moore, Mary T. “The National Evaluation of Upward Bound: A 1990's View of Upward Bound Programs Offered, Students Served, and Operational Issues.” Washington, D.C.: U.S. Department of Education, 1997a.
Moore, Mary T. “Developing Math and Science Skills Among Disadvantaged Youth: A Review of the Upward Bound Precollege Math/Science Centers.” Report submitted to the U.S. Department of Education. Washington, D.C.: Mathematica Policy Research, Inc., 1997b.
Mosteller, Frederick and Daniel Moynihan. On Equality of Educational Opportunity. New York: Vintage Books, 1972.
Myers, David, Mary Moore, Allen Schirm and Zev Waldman. “The National Evaluation of Upward Bound: Design Report.” Report submitted to the U.S. Department of Education. Report submitted to the U.S. Department of Education. Washington, D.C.: Mathematica Policy Research, Inc., November 1993.
Myers, David and Allen Schirm. “The Impacts of Upward Bound: Final Report on Phase I of the National Evaluation.” Report submitted to the U.S. Department of Education. Washington, D.C.: Mathematica Policy Research, Inc., April 1999 (http://www.ed.gov/offices/OUS/PES /higher/upward.pdf).
Myers, David and Allen Schirm. “The Short-Term Impact of Upward Bound: An Interim Report.” Report submitted to the U.S. Department of Education. Washington, D.C.: Mathematica Policy Research, Inc., May 1997.
Oakes, Jeannie, Karen Hunter Quartz, Steve Ryan and Martin Lipton. Becoming Good American Schools: The Struggle for Civic Virtue in Education Reform. San Francisco: Jossey-Bass, 2000.

References (continued)
75
Rosenbaum, Paul R. and Donald B. Rubin. “The Central Role of the Propensity Score in Observational Studies for Causal Effects.” Biometrika, 70, 41-55, 1983.
Rosenbaum, Paul R. and Donald B. Rubin. “Constructing a Control Group Using Multivariate
Matched Sampling Methods That Incorporate the Propensity Score.” The American Statistician, 39, 33-38, 1985.
Swail, Scott and Laura Perna. “A View of the Landscape: Results of the National Survey of
Outreach Programs.” Outreach Program Handbook 2001. New York: The College Board, 2000.
U.S. Department of Education. “The Condition of Education, 2001.” Washington, D.C.: National Center for Education Statistics, 2001.
U.S. Department of Health and Human Services, National Institutes of Health, National Institute of Child Health and Human Development. “Teaching Children to Read: An Evidence-Based Assessment of the Scientific Research Literature on Reading and Its Implications for Reading Instruction.” NIH Pub. No. 00-475. Rockville, Md.: DHHS, 2000.


APPENDIX A
SAMPLE DESIGN, UNIT NONRESPONSE AND WEIGHTS


A-3
In this appendix, we describe how the treatment and control samples were selected for the
Upward Bound evaluation. We also describe how weights were assigned to members of both
samples to account for the sample design and missing data due to unit nonresponse.
A. Sample Design
For the impact study, we selected a nationally representative sample of eligible Upward
Bound applicants in two stages. First, a nationally representative sample of Upward Bound
projects was selected to serve as “primary sampling units” (PSUs). Second, eligible applicants in
the projects were randomly assigned to treatment and control groups.
1. First-Stage Sampling: Selection of Projects
The “universe” of projects for the impact study—the collection of projects whose students
are eligible to be selected for the study sample—consists of active regular Upward Bound
projects that (1) are located in the 50 states and the District of Columbia, (2) are hosted by
postsecondary educational institutions, (3) had operated for at least three years by October 1992
and (4) were not serving only students with physical disabilities. Veterans projects and math and
science projects are not considered regular projects. During the period when the impact study
sample of students was being selected (roughly May 1992 through March 1994), there were 395
Upward Bound projects that met the definition of the universe.35
From the universe of 395 projects, we selected a sample of 70 projects using stratified
random sampling: each project in the universe was assigned to a group of projects (a stratum),
and a sample was drawn from each stratum. Sampling rates varied across strata, so some
35 Some projects funded in the 1989-1992 grant cycle were defunded in the 1992-1995 grant cycle and
therefore eliminated from the universe. Projects newly funded in the 1992-1995 and later grant cycles were also excluded from the universe.

A-4
projects had a greater chance of being selected than other projects. Stratification with
disproportionate sampling (unequal sampling rates) was used to ensure that enough projects—
and therefore enough students—were selected to support precise estimates for relatively small
but important analytic subgroups, such as students in large projects or students in projects hosted
by two-year postsecondary institutions.
Table A.1 displays the 46 strata used to select projects in the first-stage sampling for the
impact study. The table also shows, for each stratum, the number of projects in the universe, the
number of projects selected for the sample and the number of projects in which random
assignment of students was carried out. Within each stratum, projects were selected using simple
random sampling without replacement. Thus, although selection probabilities varied across
strata, each project in a given stratum had the same chance of being selected. That chance equals
the number of projects selected divided by the number of projects in the universe in that
stratum.36
Strata are defined, in part, by cross-tabulating three stratifying variables: (1) location of the
host institution, (2) type and control of the host institution and (3) project size. Type and control
was ascertained from the 1990-1991 Integrated Postsecondary Education Data System (IPEDS)
Institutional Characteristics file. The project size variable has three categories: (1) small (60 or
fewer students), (2) medium (61 to 99 students) and (3) large (100 or more students). Enrollment
figures were obtained from the 1990-1991 Upward Bound performance reports.
36 Three of the projects in the sample are backups selected randomly from the same strata as three originally
selected projects for which it was determined that random assignment would be inappropriate. Two of the three originally selected projects were operating under special administrative provisions, and the third project had, for several years, been unable to fill all available openings. These three projects that were replaced by backups are included in the universe counts in Table A.1.

A-5
Stratum
Urban: Four-year, PublicSmall:
African Americanb 14 2 2 Latino 4 1 1
Other 7 1 1Medium:
Asian 5 2 2Native American 2 1 1Latino 9 2 2Other 56 1 1
Large: African American 25 3 3
Latino 6 3 3White 2 1 1Other 6 1 1
Urban: Four-year, Private Small:
African American 8 1 1Other 5 1 1
Medium: Asian 4 1 1African American 38 3 3Latino 3 2 2Other 5 1 1
Large: Asian 2 1 1African American 22 5 3Other 3 1 1
Urban: Two-year Small:
Native American 1 1 1African American 9 3 3Latino 3 1 1Other 5 1 1
Medium: Asian 2 1 1African American 10 3 3Other 4 1 1
Large 3 1 1
Sample
Number of Projects
Table A.1
Selection of Upward Bound Projects for the Impact Study
Universe Selected Respondentsa

A-6
Stratum
Rural: Four-year, Public Small:
White 6 1 1Other 6 1 1
Medium:Native American 7 3 2Latino 4 1 1Other 30 1 1
Large:African American 5 1 1Other 10 2 2
Rural: Four-year, Private Small 7 1 1Medium 14 2 2Large 4 1 1
Rural: Two-yearSmall:
African American 4 2 2White 5 1 1Other 6 1 1
Medium:African American 5 1 1White 8 2 2Other 5 1 1
Large:White 3 1 1Other 3 1 1
Total 395 70 67
a Respondents are projects in which random assignment was carried out.b At least 50 percent of the students served by "African American projects" are classified as African Americanaccording to the 1990-91 Upward Bound performance reports. Native American, Latino, and white projects aresimilarly defined. (Native American includes Alaskan Native.) For Asian projects, at least 25 percent of thestudents served are classified as Asian or Pacific Islander.
TABLE A.1 (continued )
Number of Projects
Sample
Universe Selected Respondentsa

A-7
Although some strata are defined entirely in terms of the location, type and size variables,
many strata are defined by also taking into account projects’ racial and ethnic compositions. At
least 25 percent of the students served by “Asian projects” are classified as Asian or Pacific
Islander. For a Native American (including Alaskan Native), African American, Latino or white
project, at least 50 percent of the students served are classified as members of the specified racial
or ethnic group. Data on race and ethnicity were obtained from Upward Bound performance
reports.
When possible, projects were sampled proportionately by racial and ethnic composition
within classifications based on the other three stratifying variables. Thus, differences by racial
and ethnic composition in the overall rates at which projects were sampled are due largely to
disproportionate sampling by size and type and control. Small projects, large projects and
projects hosted by two-year postsecondary institutions were oversampled to provide adequate
sample sizes for subgroup analyses.
2. Second-Stage Sampling: Selection of Students
For each of the 67 projects selected in the first stage, we identified its main recruiting
period(s)—typically spring 1993, fall 1993 or both—that fell during the student sample intake
period for the impact study (roughly October 1992 to March 1994). With few exceptions,
eligible students applying to Upward Bound during a project’s main recruiting period(s) were
selected with certainty for the baseline impact study sample and subject to random assignment to
treatment (Upward Bound) and control groups. The exceptions were students designated as
“exempt” from random assignment and students randomly chosen as “givebacks.” We discuss
these exceptions after describing how random assignment was conducted.

A-8
a. Random Assignment
When a project had completed recruiting for a given recruiting period, we selected eligible
applicants at random to fill all available program openings. Eligible applicants not selected for
Upward Bound and assigned to the treatment group were assigned to the control group or, more
accurately, to a waiting list that could be used to fill certain future program openings. The
waiting list and students selected from it, so-called “post-initial treatments” (PITs), are discussed
in the next section.37
At least one round of random assignment was conducted in each of 67 projects.38 In 17
projects with more than one recruiting period, there were two or more rounds of random
assignment. We conducted a total of 87 rounds of random assignment.
Many Upward Bound project directors were concerned that the element of chance
introduced by random assignment could severely unbalance the student composition of their
programs. For example, it would be possible for all students in a cohort to be from just one
target school or to be female. The former outcome could have seriously damaged relationships
with target schools whose students were not selected, while the latter might have hampered
program operations if there were not enough dormitory rooms available for females during the
summer session. Therefore, project directors were allowed to specify random assignment strata
and, subject to the existence of enough eligible applicants, to allocate available program
37 As we discuss later, students designated as post-initial treatments will not necessarily be members of the
treatment group for baseline or follow-up analyses. 38 As indicated in Table A.1, random assignment was not carried out in 3 of the 70 projects selected for the
sample. The stated policy of one of those three projects was to serve all eligible applicants. Although not policy, the practice of another project was also to serve all eligible applicants because there were just enough students to fill program openings, leaving none to form a control group. The third project had its funding cut and had no openings for new students. These three projects could not be replaced by backups even though, as noted earlier, three other projects in which random assignment could not be carried out had been replaced. Backups could not be selected because random assignment was determined to be infeasible only after it had been announced that no additional projects would be selected for the impact study. Failure to carry out random assignment in originally selected projects may introduce bias of unknown direction and magnitude into sample estimates.

A-9
openings across the strata to obtain the desired mix of students.39 In all, there were 339 random
assignment strata. Within a given stratum, random assignment was conducted as described
earlier. The eligible applicants in the stratum were chosen at random to fill the available
openings in the stratum. Students not picked for Upward Bound were assigned to the waiting
list.
b. Exemptions, Givebacks and PITs
Exemptions. At the request of Upward Bound project directors, a very small number of
students applying to Upward Bound were exempt from random assignment because it was
determined that allowing the assignment of such students to be subject to the vagaries of chance
could be unusually or permanently disruptive to normal program operations. For example, if a
project and a local child protective services agency had a prior agreement that all eligible
students referred by the agency would be accepted into Upward Bound, that agreement was not
violated for the evaluation, and students referred during the sample intake period were exempt
from random assignment. Strict policies of accepting all siblings into the program or accepting
none of them were honored, and they accounted for a few exemptions. For instance, one of a
pair of twins applying to a project with such a policy was exempt from random assignment,
while the other twin was subject to random assignment. The exempt twin would be allowed to
participate in Upward Bound only if the nonexempt twin were randomly assigned to the
treatment group. All exempt students were designated as nonresearch cases and were excluded
from all analyses.
39 Stratification was also needed in some instances to ensure that a project did not violate the federal
requirement that two-thirds of the project’s students be both low-income and potential first-generation college. For projects with multiple rounds of random assignment, each round had its own set of strata.

A-10
Givebacks. Some projects recruited many more eligible applicants than were needed to fill
available program openings and form a control group of adequate size. In such instances, we
randomly selected students from the control group and “gave them back” to the projects
immediately after random assignment. These givebacks could be selected by the projects to fill
program openings when the impact study student intake period had ended. Although subject to
random assignment, givebacks are not part of the baseline or follow-up samples. All 97
givebacks (distributed across 11 projects) are nonresearch cases.
PITs. After being selected for Upward Bound, some students never enter the program.
Other students enter but leave before completing the program. Therefore, Upward Bound
projects typically maintain waiting lists of students so that program openings can be filled
without having to either mount a full-scale recruiting effort or wait until the next recruiting
period.
During the sample intake period for the evaluation, projects were not allowed to have their
own waiting lists: all nonexempt applicants were subject to random assignment.40 To enable
projects to maintain full enrollment under such conditions, we assigned students not selected for
Upward Bound to an evaluation waiting list, rather than a strict control group. Students could be
randomly selected from the evaluation waiting list to fill program openings, although such use of
the waiting list was subject to time and size restrictions. Specifically, students could not be
selected off the waiting list after a certain date—typically, the start of the next recruiting period.
Also, for a given random assignment stratum, a student could not be selected from the waiting
list if the selection of a student reduced the number of students remaining on the waiting list to
40 Even students who applied to Upward Bound and were placed on a project’s waiting list prior to the sample
intake period for the study were generally subject to random assignment. The only exceptions were students who had previously been promised admission when openings became available. Such students were among the small number of exemptions.

A-11
less than about two-thirds the number of students originally assigned to the treatment group.
Students randomly selected from the evaluation waiting list are designated as PITs. The next
section discusses how PITs are used in baseline and third follow-up analyses.
B. Weighting
Students were assigned weights that we have used in estimating impacts. Weighting has
three purposes. First, it ensures that the sample “weights up” to the universe, producing correct
totals (subject to sampling variability).41 Second, for purposes of estimation, weighting
“undoes” the effects of disproportionate sampling so that two strata with the same number of
students in the universe are counted equally, even if they have different numbers of students in
the sample. Third, weighting adjusts for nonresponse.
In the following sections, we describe how we assigned baseline and third follow-up
weights. We constructed separate third follow-up weights for analyzing data from the survey,
high school transcripts, postsecondary transcripts and participation reports from the 67
evaluation projects. To exclude exemptions and givebacks from all analyses, we assigned them
zero baseline and third follow-up weights. In contrast, all PITs were included in baseline
analyses and received nonzero baseline weights. As we will discuss later, whether a PIT
received a nonzero third follow-up weight depended on when that student was selected from the
evaluation waiting list.
41 For example, without weighting, a total estimated from a simple one-in-two random sample would, on
average, fall short of the true (population) total by 50 percent.

A-12
1. Baseline Weights
We assigned nonzero baseline weights to 3,028 students—all nonexempt students except
givebacks.42 A student’s baseline weight is:
s
s
(number of applicants )1w = x ,project selection probability (number of applicants - number of givebacks )
where s indexes the student’s random assignment stratum. This baseline weight is the inverse of
the student’s probability of being selected for the baseline sample. That selection probability is:
s
s
(number of applicants - number of givebacks )p = project selection probability x .(number of applicants )
The first term is project selection probability in the first stage of sampling, that is, the probability
that the project to which the student applied was selected. The second term is the student
selection probability in the second stage of sampling, that is, the probability that the student was
selected conditional on the selection of the student’s project. Put differently, this term equals the
probability that the student was retained in the experimental sample after being randomly
assigned, which equals the probability of not being selected as a “giveback.” The product for the
first and second terms gives the student’s overall (unconditional) probability of selection for the
evaluation. The first- and second-stage selection probabilities are easy to calculate. The first-
stage probability equals the proportion of all projects in the stratum that conducted random
42 For the baseline sample, students were designated as treatments or controls based on their initial random
assignment status. Students initially selected for Upward Bound are treatments, while students initially placed on the evaluation waiting list, including students who later became PITs, are controls.

A-13
assignment for the evaluation (see Table A.1). The second-stage probability equals the
proportion of all nonexempt students who were not “givebacks.”
Two simple examples illustrate how we calculated baseline weights. For an applicant to a
large, rural project hosted by a private, four-year university, the project selection probability is
1/4: according to Table A.1, random assignment was carried out in one of the four large, rural
projects hosted by private, four-year universities. If there were seven other applicants (for a
total of eight) and no givebacks in the student’s random assignment stratum, the second-stage
selection probability equals one and the overall selection probability equals 1/4 × 1 = 1/4.
Therefore, the student’s baseline weight is four (the inverse of 1/4), implying that the student
represents herself or himself and three other students who applied to projects but were not
selected for the first-stage sample. Alternatively, if there were four givebacks instead of none,
the second-stage selection probability equals 4/8, and the overall selection probability equals 1/4
× 4/8 = 1/8. Then, the student’s baseline weight is eight, implying that the student represents
himself or herself, one giveback and six other students (two applicants to each of three projects
not selected for the evaluation).
2. Third Follow-Up Survey Weights
As discussed in the previous section, 3,028 students received nonzero baseline weights. For
the third follow-up survey, we set aside the 184 students classified as nonresearch cases (see the
next section) and focused on the other 2,844 students. Our goal was to complete interviews with
all 2,844 students; we succeeded in interviewing 2,292 students, which corresponds to an 81
percent response rate.43 Next, we discuss how we weighted students for the analyses of the third
43 Item nonresponse (failure to answer individual questions) created little missing data beyond that created by
unit nonresponse (failure to answer any questions).

A-14
follow-up survey data to account for sampling and unit nonresponse. These weights are
designed to allow the treatment students who responded the survey to represent the population of
Upward Bound eligible applicants nationwide and the control students who responded to the
survey to represent the same population. We begin by describing how we designated students as
treatments, controls or nonresearch cases.
a. Designating Students as Treatment, Control or Nonresearch
Of the 3,028 students who received nonzero baseline weights, 1,524 were designated as
treatments, 1,320 as controls and 184 as nonresearch cases for the third follow-up analysis. All
1,479 students assigned to the treatment group at initial random assignment are designated as
treatments for this analysis. Similarly, all 1,320 students assigned to the evaluation waiting list
at initial random assignment and not randomly selected from it as PITs are controls.
Of the 229 PITs, 45 are designed as treatments for the third follow-up analyses; the rest are
designated as nonresearch cases. A PIT was designated as a treatment if two conditions were
satisfied. First, the PIT had the opportunity to begin participating in Upward Bound at
essentially the same time (often the same day) as the original treatments in the PIT’s random
assignment stratum. Second, the PIT did not replace a treatment who dropped out of Upward
Bound (or never showed up). PITs satisfying these two conditions were designated as treatments
because it is assumed that they would have been original treatments had the Upward Bound
project director not underestimated the number of open slots that were available at the initial
random assignment.44 As noted before, all other PITs were designated as nonresearch cases.
44 Project directors often do not regard a slot as open until there is strong evidence that a previously enrolled
student has dropped out. Therefore, rather than delaying student selection until the “last minute,” some slots that were later confirmed as open were not filled in the initial random assignment.

A-15
b. Survey Weights
Survey weights were developed to account for the probability of being assigned to the
treatment group for treatment students, the probability of being assigned to the control group for
control students and the probability of responding to the survey. The following steps were taken
to compute survey weights:
1. Calculate control totals. We summed the baseline weights of all students (treatment, control and nonresearch) in each weighting class to obtain 297 control totals.45
2. Estimate propensity scores. For each treatment and control group member, we estimated the probability that the student responded to the survey, conditional on a set of baseline characteristics.46
3. Compute preliminary survey weights. We multiplied each student’s baseline weight by the inverse of his or her propensity score to compute a preliminary survey weight.
4. Post-stratify the sample to compute final survey weights. To compute final survey weights, the preliminary weights were ratio-adjusted to ensure that the final weights for treatments and controls separately summed to the control totals within each weighting class. Final weights for all nonrespondents and nonresearch cases were set to zero.
3. Third Follow-Up High School Transcript Weights
To construct nonresponse-adjusted weights for the third follow-up analyses of high school
transcript data, we followed similar procedures used to construct weights for third follow-up
45 In 42 of the original 339 random assignment strata, the response rate for either the treatment group or the
control group was zero. These 42 strata were combined with other strata based on propensity scores, whose estimation is described later in the text. We combined an empty stratum with a nonempty stratum based on the similarity of students’ propensity scores, as measured by the difference in the average propensity scores between students in a given empty stratum and students in a nonempty stratum with which the empty stratum might be combined. The nonempty stratum with the smallest difference was judged the most similar to the empty stratum. We did not combine strata across projects. Propensity scores were used to combine strata into weighting classes because these scores reflect a broad range of characteristics related to nonresponse and to the outcomes that are examined in the impact analysis.
46 The probability was obtained for all 2,844 treatment and control students from two logistic regression models, one for the treatment group and the other for the control group. These models predict response to the third follow-up survey as a function of the control variables from the regression model used to estimate impacts: sex, race, educational aspirations, grade level at program application, and eligibility status—first-generation, low-income or both. Estimation of these propensity score models revealed that sex, race, educational expectations and eligibility status were significant predictors of response to the third-followup survey for at least one of the two groups.

A-16
survey data. We attempted to collect high school transcript data for the subgroup of the 2,844
treatment and control students who had not yet completed high school by the previous round of
transcript data collection. After the round of transcript data collection that followed the fielding
of the third follow-up survey, we had collected at least some high school transcripts for 95
percent of all treatment and control students. Because some sample members did not respond to
the survey and therefore did not provide us with a current list of all high schools they had
attended, we cannot distinguish between survey nonrespondents with partial transcript
information and survey nonrespondents with complete transcript information. Thus, we chose to
treat the 95 percent of treatment and control students for whom we had any transcript data as
respondents when developing high school transcript weights. The high school transcript weights
are designed to allow the treatment students for whom we had received transcripts to represent
the population of Upward Bound eligible applicants nationwide, and to allow the control students
for whom we had received transcripts to represent the same population.
In computing high school transcript weights, we used the same four steps taken to compute
survey weights, including the same propensity score model—inserting an indicator for transcript
response as the dependent variable—and the same weighting classes for post-stratification.
4. Third Follow-Up Postsecondary Transcript Weights
In the third follow-up survey, 1,737 students reported that they had attended some type of
postsecondary institution. Some students reported institutions that were not really postsecondary
institutions (for example, the Job Corps), and others reported schools that were not in IPEDS and
were not institutions that maintain transcripts. We classify as “postsecondary institutions” all
schools that can be found in IPEDS or could otherwise be located and determined to be a
transcript-providing institution. We classify as “postsecondary students” all 1,524 treatments
and controls who responded to the third follow-up survey and reported having attended one or

A-17
more “postsecondary institutions.” We requested transcripts from each of the postsecondary
institutions attended by the 1,524 postsecondary students unless the students refused to give
consent for the release of their transcripts.
Of the 1,524 postsecondary students, we received transcripts from all the postsecondary
institutions they attended for 1,375 of them, a response rate of 90 percent. To develop
postsecondary transcript weights that adjust the survey weights to account for variability in
likelihood of receiving complete postsecondary transcript data for postsecondary students, we
took the following four steps:
1. Calculate control totals for postsecondary students, separately for treatment and control students. For the treatment and control groups separately, we summed the third follow-up survey weights of postsecondary students in each random assignment stratum to obtain 224 control totals.
2. Calculate control totals for postsecondary students, separately for treatment and control students. For the treatment and control groups separately, we summed the third follow-up survey weights of postsecondary students in each random assignment stratum to obtain 224 control totals.
3. Calculate control totals for postsecondary students, separately for treatment and control students. For the treatment and control groups separately, we summed the third follow-up survey weights of postsecondary students in each random assignment stratum to obtain 224 control totals.47
4. Estimate propensity scores. Among postsecondary students, we estimated the probability that we received complete postsecondary transcript data for the student.48
47 In 73 of the 297 weighting classes used to develop the survey weights, the response rate for either the
treatment group or the control group was zero. These 73 cells were combined with other cells based on propensity scores, whose estimation is described later. These cells were combined for the same reason and in the same manner that the original 339 random assignment strata were combined to form 297 weighting classes for developing the survey weights.
48 This estimate was computed by multiplying together two estimated probabilities: the probability that the student gave consent for us to obtain his or her transcripts, and the probability that we were able to obtain those records if consent was given. For the treatment and control groups separately, we estimated two logit models—one to predict consent, the other to predict receipt of complete transcript data conditional on consent. The first model predicts consent as a function of some of the control variables from the regression model used to estimate impacts, sex, race, and educational aspirations, along with counts of the number of four-year, two-year, and other colleges that the student attended. The second model predicts receipt of all transcripts requested as a function of sex, the school counts for four-year, two-year, and other colleges, and current college status (current college attendance and college completion).

A-18
5. Compute preliminary postsecondary transcript weights. After computing the control totals, we multiplied each student’s baseline weight by the inverse of his or her propensity score.
6. Post-stratify the sample to compute final postsecondary transcript weights. The preliminary weight was then ratio-adjusted to ensure that the final postsecondary transcript weights for treatments and controls sum to their respective control totals within each of the 224 weighting classes. For all nonrespondents, nonresearch cases and third follow-up survey nonrespondents, the final postsecondary transcript weight equals zero; for survey respondents who were not classified as postsecondary students, the final postsecondary transcript weight equals the third follow-up survey weight.
The postsecondary transcript weights are designed to make two samples representative of
the population of Upward Bound eligible applicants nationwide: treatment students who
responded to the third follow-up survey and for whom we had transcripts from every
postsecondary institution attended, and control students who met the same two criteria.
5. Third Follow-Up Upward Bound Participation Weights
One goal of the evaluation is to describe the patterns of program participation among
applicants who are accepted into the program. Therefore, we examined the participation
behavior of the 1,524 students assigned to the treatment group (the group offered the chance to
participate in Upward Bound); we weight them to represent all eligible applicants.
However, we have incomplete participation data for 17 Upward Bound participants from the
treatment group. For these participants, we received participation reports in previous rounds of
data collection, did not receive a participation report in the latest round of data collection and
were unable to compensate using self-reported survey data. To develop participation weights
that adjust the survey weights to account for the probability of receiving complete participation
data for treatment students, we took the following three steps:
1. Calculate control totals for postsecondary students, separately for treatment and control groups. For each group, we summed the baseline weights of all 3,028

A-19
treatment, control and nonresearch cases in each random assignment stratum to obtain 339 control totals.
2. Compute baseline treatment weights. The probability of assignment to the treatment group varied across random assignment strata. Therefore, for each stratum, a baseline treatment weight was computed by dividing the baseline weight by the proportion of students randomly assigned to the treatment group.
3. Post-stratify the sample to compute participation weights. The treatment group was post-stratified into three weighting classes: one class of students who had completed their Upward Bound participation before the previous round of data collection and two classes of students who had not completed their participation before the previous round of data collection—those with baseline treatment weights greater than 20 and those with smaller weights. For the first weighting class, our participation information is complete: the participation weight was set to the baseline treatment weight. For the second and third weighting classes separately, the participation weight is computed as the baseline treatment weight times the inverse of the weighted “response” rate for the weighting class, that is, the weighted proportion of students with complete participation information. For all nonparticipants and the 17 students with incomplete participation information, the participation weight was set to zero.


APPENDIX B
BASELINE CHARACTERISTICS OF THE TREATMENT AND CONTROL GROUPS, THIRD FOLLOW-UP SURVEY RESPONDENTS


B-3
Baseline Characteristics
Educational expectations1
Student 16.5 17.1 -0.6Father 16.6 16.8 -0.2Mother 16.7 17.1 -0.4 *
How often talked with parents about2
Courses 1.9 2.0 -0.1School activities 2.0 2.1 -0.1Studies 1.9 2.0 -0.2 ***Grades 2.4 2.5 -0.1 *Transferring to another school 0.7 0.7 -0.1Taking ACT or SAT exam 1.0 1.1 -0.1 *College plans 2.2 2.4 -0.2 *
How often parent2
Checked on homework 2.1 2.2 -0.1 **Helped with homework 1.6 1.8 -0.2Gave special privileges 1.9 1.9 0.0Limited privileges 1.7 1.7 0.0Required chores 2.6 2.6 0.0Limited TV and video time 1.5 1.4 0.1Limited time with friends 2.1 2.0 0.0
Times Late for school 2.7 2.8 -0.1Skipped classes 0.9 0.7 0.3Missed a day of school 3.8 3.5 0.3 **In trouble for not following school rules 1.1 1.1 -0.1Put on in-school suspension 0.4 0.3 0.1Suspended 0.2 0.2 0.0Transferred for disciplinary reasons 0.0 0.0 0.0Arrested 0.0 0.0 0.0Spent time in juvenile home 0.0 0.0 0.0 *
Parent (%)Attended school meeting 63 67 -4 **Spoke with teachers 70 74 -4Visited classes 48 49 -1Attended school event 63 66 -3
Hours spentOn homework3 7.0 7.6 -0.7 *On school-sponsored activities3 4.5 5.2 -0.7Playing video games (weekdays)4 1.0 0.8 0.1 **Playing video games (weekends)4 1.4 1.3 0.1 **
Grade at application 9.4 9.4 0.0
Table B.1
Baseline Characteristics of the Treatment and Control Groups,
Difference
Third Follow-up Survey Respondents
Treatment Control

B-4
Baseline Characteristics
Low-Income and First-Generation (%)Low-Income and First-Generation 79 79 0Low-Income Only 4 4 0First-Generation Only 16 17 0
Race (%)Hispanic 22 22 0White 22 20 2African-American 49 52 -4Other Race 7 6 1
Gender (%)Male 29 28 0Female 71 72 0
Sample Size 1,265 1,027
Source: f3_0142.logNote: The numbers in the "Difference" column may not exactly equal the difference between the numbers in the "Treatment" and "Control" columns due to rounding; weights used to account for survey nonresponse.*/**/*** Impact estimate is statistically significant at the 0.10 / 0.05 / 0.01 level.1 Expected years of schooling.2 Coding: 0=never, 1=rarely, 2=sometimes, 3=often.3 Hours per week.
Difference
TABLE B.1 (continued )
Treatment Control

APPENDIX C
PROGRAM IMPACTS AND STANDARD ERRORS


C-3
This appendix describes how we estimated the effects (impacts) of Upward Bound—both
the opportunity to participate and actual participation—and how we estimated the standard errors
of the estimates.
A. Computing Program Impacts
Some policymakers and program operators may be most interested in learning about the
effects of offering Upward Bound services to eligible applicants. Others may be more interested
in learning about the effects of actually participating in Upward Bound. The evaluation literature
refers to the first impact as the “intended to treat effect” (ITT) and the second impact as the
“complier average causal effect” (CACE). Our estimates of the ITT are based on a comparison
of students randomly assigned to the treatment group with students randomly assigned to the
control group. Our estimates of the CACE are based on a comparison of Upward Bound
participants to nonparticipants, using the outcome of random assignment, treatment or control
status, as an instrumental variable to predict program participation.
1. Impacts of the Opportunity to Participate in Upward Bound (ITT)
In order to compute the average impact of the opportunity to participate in Upward Bound,
we estimate a statistical model that predicts the outcome of interest as a function of treatment
status and background characteristics, such as educational expectations, sex, race, ethnicity and
grade level at application. We include baseline characteristics in the model to increase the
precision with which we estimate program impacts and to capture chance differences in baseline
characteristics that remained after students were randomly assigned to the treatment and control
groups. The basic form of the model is:
(C.1)10 1 2i i iiy = + + +T Xβ β β ε

C-4
where yi is the outcome of interest; Ti equals 1 if the student was randomly assigned to the
treatment group and equals 0 otherwise; Xi is a vector that includes baseline characteristics of the
student; 1iε is a random error term that captures the effects of unobserved factors that influence
the outcome; and 0β , 1β and 2β are parameters or vectors of parameters to be estimated. The
parameter of most interest is 1β because it shows the impact of being offered the opportunity to
participate in Upward Bound on student outcomes. We estimate the parameters in equation C.1
using ordinary least squares for both categorical and continuous outcomes. All regression
models are weighted to account for the sampling design and unit nonresponse (see Appendix A).
2. Impacts of Participation in Upward Bound (CACE)
To compute the CACE estimator for the impact of participating in Upward Bound, we
estimate the relationship between the opportunity to participate and participation and the
relationship between participation and student outcomes. These relationships can be expressed
as:
(C.2)
where yi is the outcome of interest; Ti equals 1 for students who were randomly assigned to the
treatment group and equals 0 for other students; Xi is a vector that includes background variables;
Pi equals 1 for students who were randomly assigned to the treatment group and participated in
Upward Bound and equals 0 for other students; εpi and εyi are random error terms that capture the
effects of unobserved factors that influence both participation and the outcome; and 0α , 1α , 2α ,
0β , 1β and 2β are parameters or vectors of parameters to be estimated. The parameter of greatest
interest is 1β because it shows the impact of participating in Upward Bound on the outcome.
0 1 2
0 1 2
i i i pi
i i yii
= + + +P T X= + + +y P X
α α α εβ β β ε

C-5
We estimate the parameters in equation C.2 using the instrumental variables estimator. This
technique allows us to compute asymptotically unbiased and efficient estimates of the
parameters. The parameter 1β can be interpreted as the causal impact for “compliers,” that is,
students who were induced to participate in Upward Bound by the randomly assigned offer.49 To
implement the instrumental variables estimator, we use the two-stage least squares procedure
when either continuous or categorical outcomes are analyzed.
The CACE estimator used throughout the report does not account for the fact that some
Upward Bound control group members were offered the chance to participate in regular Upward
Bound and subsequently participated in the program. (See footnote 5 in Chapter V.) However,
results from a sensitivity test suggest that accounting for “crossover,” as it is commonly called,
would have very little effect on the estimated impacts of participating in Upward Bound as
presented in this report. Table C.1 provides the impact estimates from Table III.1 using methods
that account for crossover. A comparison of Tables III.1 and C.1 indicate that accounting for
crossover has a negligible effect on the estimated impacts of participating in regular Upward
Bound.
B. Calculating Standard Errors
To determine whether impact estimates are statistically significant, we computed standard
errors that account for the sample design of the study, which is described in Appendix A. The
first stage of sampling in the evaluation involved selecting a stratified random sample of Upward
Bound projects. The second stage of the sampling process involved taking a random sample of
eligible students and assigning them to the treatment group; the remaining students were
49 See Angrist, Imbens, and Rubin (1996).

C-6
Postsecondary School Status (%)Any postsecondary school 71 3 3 Four-year college 44 6 ** 8 ** Two-year college 24 -5 -6 Vocational school 2 2 2
Credits EarnedAll postsecondary schools 35.8 1.4 1.7
Nonremedial 33.8 0.8 1.0 Remedial 1.5 -0.2 -0.2 Other 0.5 0.8 1.0
Four-year colleges 25.1 3.2 3.8 Nonremedial 24.1 2.3 2.8 Remedial 0.6 0.1 0.1 Other 0.5 0.7 0.9
Two-year colleges 9.6 -1.3 -1.6 Nonremedial 8.6 -1.0 -1.2 Remedial 0.9 -0.3 -0.4 Other 0.0 0.0 0.0
Vocational schools 1.1 -0.4 -0.5 Nonremedial 1.1 -0.5 -0.6 Remedial 0.0 0.0 0.0 Other 0.0 0.1 0.1
Source: pst-overall.logNote: Weighted values reported.*/**/*** Impact estimate is statistically significant at the 0.10 / 0.05 / 0.01 level.
Impact Impact
Table C.1
Impact of Upward Bound on Postsecondary Enrollment and Credits,
All Students Participants
Control Mean
Accounting for the 43 Control Group Members Who Reported Participating in Regular Upward Bound

C-7
assigned to the control group. Given that projects were first sampled and then students were
sampled, we have a cluster sample of students and not a simple random sample of students.
To accommodate the complex sample design, we use bootstrapping techniques to compute
estimates of the standard errors of the impact estimates and other statistical parameters used in
the evaluation. Bootstrap samples of projects were selected from the 67 evaluation projects,
impacts were computed for each bootstrap sample, and standard errors were computed by
measuring the variability in impact estimates across bootstrap samples. Bootstrapping allows us
to compute a direct estimate of the variability without making assumptions about the
independence of students within projects.


APPENDIX D
THE EFFECT OF UPWARD BOUND ON HIGH SCHOOL OUTCOMES BY SELECTED SUBGROUPS


D-3
CreditsTotal 21.1 0.4 21.7 -0.8 20.7 0.5 0.4 -1.1 0.5
Total Core 13.8 0.5 14.4 -0.4 13.6 1.2 0.6 -0.6 1.2 Math 2.9 0.2 * 3.1 0.0 2.9 0.2 0.2 * 0.0 0.3 Science 2.7 0.1 2.8 -0.3 2.8 0.3 0.1 -0.4 0.3 English 3.9 0.0 3.9 0.1 3.8 0.0 0.0 0.1 0.0 Social Studies 2.8 0.1 3.0 -0.3 * # 2.9 0.1 0.2 -0.4 0.1 Foreign Language 1.4 0.1 1.6 0.1 1.3 0.5 * 0.1 0.1 0.5 *
Computer Science 0.8 0.0 0.9 -0.2 0.4 0.2 0.0 -0.3 0.3 Vocational 1.5 -0.1 1.4 -0.1 1.4 -0.2 -0.1 -0.2 -0.2
Advanced Placement and Honors CreditsTotal 2.0 -0.4 2.0 0.2 0.8 1.7 ** # -0.4 0.2 1.8 **
Total Core 1.9 -0.4 1.9 0.1 0.8 1.7 ** # -0.4 0.1 1.7 **Math 0.3 0.0 0.4 -0.1 ** 0.1 0.3 ** # 0.0 -0.2 ** 0.3 **Science 0.4 -0.1 0.4 0.0 0.1 0.4 ** # -0.1 0.0 0.4 **English 0.7 -0.2 0.6 0.2 0.4 0.5 * # -0.2 0.2 0.5 *Social Studies 0.4 -0.1 0.5 0.1 0.1 0.4 *** # -0.1 0.1 0.4 ***Foreign Language 0.0 0.0 0.0 0.0 0.0 0.1 * 0.0 0.0 0.1 *
Overall Grade Point Average 2.3 0.0 2.3 -0.1 2.1 0.4 *** # 0.0 -0.2 0.4 ***
High School Status (%)Graduated 89 0 93 -3 94 5 0 -4 5 Still in high school 0 0 0 0 0 - 0 0 - Dropped out 8 -1 5 5 1 -1 -1 6 -1 General Educational Development (GED) 3 1 2 -1 5 -4 1 -2 -5
Source: hs-lifg.log, hs-low_only.log, and hs-fgenonly.logNote: Hyphens indicate too few respondents to compute impact. Weighted values reported.*/**/*** Impact estimate is statistically significant at the 0.10 / 0.05 / 0.01 level.# Indicates that for all students, the impacts are significantly different from the impacts for low-income and first-generation students at the 0.10 level.
Table D.1
Impact of Upward Bound on High School Credits, Grades and Graduationby Students' Eligibility Status
ParticipantsAll Students
Low-Inc. and First-Gen.
Impact Impact
First-Generation Only Low-Income Only
Control Mean Control Mean Control MeanImpact Impact Impact Impact
FG Only LI OnlyLI and FG

D-4
CreditsTotal 21.4 -0.8 20.4 0.9 ** # 21.5 1.4 ** # -1.0 1.1 ** 1.6 *
Total Core 14.0 -0.2 13.3 0.9 ** # 14.1 1.0 * -0.3 1.1 ** 1.2 *Math 3.0 0.0 2.8 0.3 ** 3.0 0.4 *** # 0.0 0.3 ** 0.5 ***Science 2.9 -0.1 2.6 0.2 *** 2.5 0.3 * -0.2 0.3 *** 0.3 *English 3.9 -0.1 3.7 0.2 * # 4.1 0.1 -0.1 0.2 * 0.1 Social Studies 2.9 0.0 2.8 0.2 * 2.8 0.1 0.0 0.2 * 0.1 Foreign Language 1.5 0.1 1.3 0.1 1.7 0.1 0.1 0.1 0.1
Computer Science 0.8 0.0 0.7 0.0 0.9 0.1 0.0 0.0 0.1 Vocational 1.5 -0.3 1.5 0.0 1.5 0.0 -0.3 0.0 0.1
Advanced Placement and Honors CreditsTotal 2.0 0.1 1.0 -0.1 2.8 -0.8 0.2 -0.1 -0.9
Total Core 1.9 0.1 0.9 -0.1 2.7 -0.9 0.2 -0.1 -1.0 Math 0.3 0.0 0.2 0.0 0.5 -0.2 0.0 0.0 -0.2 Science 0.4 0.0 0.1 0.0 0.6 -0.2 0.0 0.1 -0.2 English 0.7 0.0 0.4 -0.1 0.9 -0.2 0.0 -0.1 -0.2 Social Studies 0.4 0.1 * 0.2 0.0 0.7 -0.3 0.1 * 0.0 -0.3 Foreign Language 0.0 0.0 0.1 0.0 0.1 0.0 0.0 0.0 0.0
Overall Grade Point Average 2.2 -0.1 2.4 0.1 2.3 0.0 -0.1 0.1 0.0
High School Status (%)Graduated 94 -2 82 5 ** # 88 1 -3 7 ** 1 Still in high school 1 -1 0 0 0 2 -1 0 2 Dropped out 5 0 10 1 8 -1 -1 2 -1 General Educational Development (GED) 1 4 ** 8 -7 ** # 4 -2 4 ** -8 ** -2
Source: hs-black.log, hs-white.log, and hs-hisp.logNote: Hyphens indicate too few respondents to compute impact. Weighted values reported.*/**/*** Impact estimate is statistically significant at the 0.10 / 0.05 / 0.01 level.# Indicates that for all students, the impacts are significantly different from the impacts for African American students at the 0.10 level.
Impact Control MeanControl Mean
Hispanic
ParticipantsAll Students
WhiteAfrican American
Table D.2
Impact of Upward Bound on High School Credits, Grades and Graduationfor African American, White, and Hispanic Students
Control Mean ImpactImpact Impact Impact Impact
Afr. Amer. White Hispanic

D-5
CreditsTotal 19.4 0.5 21.9 0.1 0.5 0.1
Total Core 12.6 0.5 14.4 0.3 0.6 0.4 Math 2.7 0.2 3.1 0.1 0.2 0.2 *Science 2.5 0.0 2.8 0.1 0.0 0.1 English 3.6 0.1 4.0 0.0 0.1 0.0 Social Studies 2.6 0.1 2.9 0.1 0.1 0.1 Foreign Language 1.1 0.1 1.6 0.1 0.1 0.1
Computer Science 0.6 0.1 0.8 0.0 0.1 0.0 Vocational 1.4 0.0 1.6 -0.1 -0.1 -0.1
Advanced Placement and Honors CreditsTotal 1.0 0.1 2.3 -0.3 0.1 -0.3
Total Core 0.9 0.2 2.3 -0.3 0.2 -0.4 Math 0.2 0.0 0.4 0.0 0.0 0.0 Science 0.2 0.0 0.5 -0.1 0.0 -0.1 English 0.4 0.0 0.8 -0.1 0.0 -0.1 Social Studies 0.2 0.1 0.5 -0.1 # 0.1 -0.1 Foreign Language 0.0 0.0 ** 0.1 0.0 # 0.0 ** 0.0
Overall Grade Point Average 2.0 0.1 2.4 -0.1 0.1 -0.1
High School Status (%)Graduated 85 2 92 -1 3 -1 Still in high school 0 1 0 0 1 0Dropped out 8 -2 6 1 -3 1 General Educational Development (GED) 6 -1 2 1 -1 1
Source: hs-male.log and hs-female.logNote: Hyphens indicate too few respondents to compute impact. Weighted values reported.*/**/*** Impact estimate is statistically significant at the 0.10 / 0.05 / 0.01 level.# Indicates that for all students, the impacts are significantly different from the impacts for male students at the 0.10 level.
Impact ImpactControl Mean Impact Control Mean Impact
All Students Participants
Table D.3
Impact of Upward Bound on High School Credits, Grades and Graduationfor Male and Female Students
Male FemaleMale Female

CreditsTotal 19.9 0.9 21.6 0.0 21.0 0.2 1.0 -0.1 0.3
Total Core 12.8 1.1 14.3 0.1 13.6 0.4 1.2 0.2 0.5 Math 2.7 0.4 ** 3.1 0.1 2.9 0.2 * 0.5 ** 0.1 0.2 *Science 2.6 0.0 2.8 0.0 2.7 0.1 0.0 0.0 0.1 English 3.6 0.3 4.0 0.0 3.8 0.0 0.3 0.0 0.0 Social Studies 2.6 0.2 2.9 0.0 2.8 0.1 0.2 -0.1 0.2 Foreign Language 1.2 0.2 1.5 0.1 1.5 0.0 0.3 0.1 0.0
Computer Science 0.9 -0.2 0.8 0.0 0.7 0.0 -0.2 0.0 0.1 Vocational 1.8 -0.2 1.5 -0.2 1.5 0.0 -0.3 -0.3 0.1
Advanced Placement and Honors CreditsTotal 0.8 0.1 2.7 -0.1 1.4 -0.1 0.1 -0.1 -0.1
Total Core 0.8 0.1 2.6 -0.1 1.4 -0.1 0.1 -0.1 -0.1 Math 0.1 0.1 0.5 -0.1 0.2 0.0 0.1 -0.1 0.0 Science 0.2 0.0 0.5 0.0 0.3 0.0 0.0 0.0 0.0 English 0.3 0.1 0.9 0.0 0.5 -0.1 0.1 0.0 -0.1 Social Studies 0.2 0.0 0.6 0.0 0.3 0.0 0.0 0.0 0.0 Foreign Language 0.0 0.0 0.1 0.0 0.0 0.0 0.0 0.0 0.0
Overall Grade Point Average 2.1 0.0 2.4 -0.1 2.3 0.1 0.0 -0.2 0.1
High School Status (%)Graduated 78 2 92 0 90 -1 2 0 -2 Still in high school 0 - 0 0 0 0 - 0 0 Dropped out 13 5 5 1 8 -2 6 1 -2 General Educational Development (GED) 9 -7 * 3 0 2 3 # -8 * 0 3
Source: hs-rating_h.log, hs-rating_m.log, and hs-rating_l.logNote: Hyphens indicate too few respondents to compute impact. Weighted values reported.*/**/*** Impact estimate is statistically significant at the 0.10 / 0.05 / 0.01 level.# Indicates that for all students, the impacts are significantly different from the impacts for least likely students at the 0.10 level.
Most Likely
Control Mean Control Mean Control MeanImpact ImpactImpact
Least Likely Somewhat Likely
Table D.4
Impact of Upward Bound on High School Credits, Grades and Graduationby the Likelihood of Admission to Upward Bound
All Students Participants
Impact
Somewhat MostLeast
Impact Impact
D-6

APPENDIX E
THE EFFECT OF UPWARD BOUND ON COLLEGE ENGAGEMENT BY SELECTED SUBGROUPS


E-3
Residence in focused housing (%) 1 1 1 0 1 0
Days per year of parent or student contact with school 77.3 1.4 54.0 6.4 1.7 7.7
Academic counseling 1.6 0.0 0.7 0.4 0.1 0.5 Personal counseling 0.4 0.3 *** 0.3 0.1 0.3 *** 0.1 Learning skills center services 0.9 0.2 * 0.4 0.1 0.2 0.1 Tutoring services 1.2 0.2 ** 0.5 0.5 * 0.3 ** 0.5 *Minority student services 0.5 0.0 0.2 0.1 0.0 0.1 Health services 0.7 0.0 0.2 0.0 0.0 0.0 Other 0.0 0.0 0.1 0.0 0.0 -0.1
Student Support Services 5 2 4 -3 # 2 -3 McNair Post-Baccalaureate Achievement Program 1 0 1 -1 0 -2
Student received financial aid (%) 61 -1 40 -2 -1 -3
How often during first year of postsecondary school student:Talked with faculty in office about academic matters 2.4 -0.2 1.1 0.4 -0.2 0.5 Met with advisor concerning academic plans 2.0 0.0 0.9 0.5 * 0.0 0.6 *Had informal contact with advisor or other faculty 1.9 0.1 0.8 0.6 * 0.1 0.8 *Participated in study groups outside of class 2.7 -0.3 1.3 0.4 -0.4 0.4 Went to events with friends from school 3.5 0.0 2.0 0.3 0.0 0.4 Participated in school clubs 1.4 0.0 0.9 0.3 0.0 0.3 Attended career-related lectures, conventions, or field
trips with friends 1.6 -0.2 0.8 0.2 -0.2 0.2 Participated in intramural or intercollegiate sports,
music, drama, etc. 1.4 -0.1 0.7 0.2 -0.2 0.2 Cut classes 1.7 -0.1 1.0 0.1 -0.1 0.2
Source: pss-hiexp.log and pss-loexp.logNote: Hyphens indicate too few respondents to compute impact. Weighted values reported.*/**/*** Impact estimate is statistically significant at the 0.10 / 0.05 / 0.01 level.# Indicates that for all students, the impacts are significantly different from the impacts for higher expectations students at the 0.10 level.
Table E.1
For Higher and Lower Educational Expectations Students
Impact Impact
Higher Expectations Higher
ImpactControl MeanControl Mean
Participants
Lower
Impact of Upward Bound on College Engagement
Lower Expectations
How often during first year in postsecondary school student used the following supplemental services
Participation in federally supported programs while in postsecondary school (%)
All Students
Impact

E-4
Residence in focused housing (%) 1 -1 1 1 -1 1
Days per year of parent or student contact with school 55.3 -0.7 77.2 2.9 -1.0 3.2
Academic counseling 0.7 0.1 1.6 0.3 ** 0.1 0.3 *Personal counseling 0.2 0.4 ** 0.4 0.2 * 0.5 ** 0.2 *Learning skills center services 0.6 -0.1 0.8 0.4 ** # -0.2 0.4 **Tutoring services 0.5 0.1 1.2 0.4 *** 0.1 0.5 ***Minority student services 0.0 0.2 *** 0.5 0.1 0.2 *** 0.1 Health services 0.2 0.0 0.7 0.1 0.0 0.1 Other 0.0 0.0 0.0 0.0 0.0 0.0
Student Support Services 6 -3 5 2 -4 2 McNair Post-Baccalaureate Achievement Program 0 0 1 0 0 0
Student received financial aid (%) 35 -13 61 2 -17 2
How often during first year of postsecondary school student:Talked with faculty in office about academic matters 1.3 -0.3 2.3 0.2 -0.4 0.2 Met with advisor concerning academic plans 1.1 -0.1 1.9 0.2 * -0.1 0.2 *Had informal contact with advisor or other faculty 0.9 0.0 1.8 0.4 *** 0.0 0.4 ***Participated in study groups outside of class 1.2 0.0 2.7 -0.1 -0.1 -0.1 Went to events with friends from school 1.7 0.1 3.5 0.1 0.2 0.1 Participated in school clubs 0.5 -0.1 1.5 0.2 * -0.1 0.2 *Attended career-related lectures, conventions, or field
trips with friends 0.9 -0.3 ** 1.5 0.1 # -0.4 ** 0.1 Participated in intramural or intercollegiate sports,
music, drama, etc. 0.5 0.0 1.3 0.0 0.0 0.0 Cut classes 1.1 -0.5 1.7 0.1 -0.7 0.1
Source: pss-ar20hi.log and pss-ar20lo.logNote: Hyphens indicate too few respondents to compute impact. Weighted values reported.*/**/*** Impact estimate is statistically significant at the 0.10 / 0.05 / 0.01 level.# Indicates that for all students, the impacts are significantly different from the impacts for higher academic risk students at the 0.10 level.
All Students Participants
Impact ImpactImpact
Higher Academic Risk
Control Mean
Lower Academic Risk Higher Lower
Impact of Upward Bound on College Engagement
Table E.2
by Students' At-Risk Status
How often during first year in postsecondary school student used the following supplemental services
Participation in federally supported programs while in postsecondary school (%)
ImpactControl Mean

E-5
Residence in focused housing (%) 1 1 2 -1 3 -4 1 -2 -5
Days per year of parent or student contact with school 70.5 5.6 81.5 -15.5 * # 67.9 8.1 6.6 -18.6 * 8.6
Academic counseling 1.4 0.2 1.5 0.0 1.4 0.6 * 0.2 0.0 0.6 *Personal counseling 0.3 0.2 * 0.4 0.3 ** 0.4 0.3 0.2 * 0.4 ** 0.3Learning skills center services 0.7 0.2 * 0.9 0.0 0.9 0.0 0.3 * 0.0 0.0 Tutoring services 1.0 0.3 ** 1.5 0.0 0.7 1.2 *** 0.3 ** 0.0 1.2 ***Minority student services 0.4 0.1 0.3 0.1 0.3 0.1 0.1 0.1 0.1Health services 0.5 0.0 0.6 0.0 0.5 0.5 0.0 0.0 0.5Other 0.0 0.0 0.1 -0.2 0.0 0.1 * 0.0 -0.2 0.1 *
Student Support Services 5 1 4 1 6 0 1 2 -1McNair Post-Baccalaureate Achievement Program 1 0 1 0 0 - 0 0 -
Student received financial aid (%) 54 0 59 -12 ** 56 5 -1 -14 ** 5
How often during first year of postsecondary school student:Talked with faculty in office about academic matters 2.0 0.2 2.5 -0.8 * # 2.1 0.8 0.2 -0.9 * 0.8Met with advisor concerning academic plans 1.6 0.3 ** 2.0 -0.5 ** # 2.5 -0.5 0.3 ** -0.6 ** -0.5Had informal contact with advisor or other faculty 1.5 0.3 ** 1.8 -0.2 1.9 -0.5 0.4 ** -0.2 -0.5Participated in study groups outside of class 2.3 0.1 2.9 -1.5 ** # 2.2 1.3 *** # 0.1 -1.8 ** 1.4 ***Went to events with friends from school 3.0 0.1 3.6 -0.4 3.6 0.9 * 0.1 -0.5 0.9 *Participated in school clubs 1.2 0.0 1.6 -0.3 0.9 1.2 ** # 0.1 -0.4 1.3 **Attended career-related lectures, conventions, or field
trips with friends 1.4 0.0 1.5 -0.2 1.3 1.1 * # 0.0 -0.3 1.1 *Participated in intramural or intercollegiate sports, 1.2 -0.2 0.0 0.8
music, drama, etc. -0.1 1.0 0.0 1.2 0.7 Cut classes 1.4 0.0 2.1 -0.7 1.4 1.5 *** # 0.0 -0.8 1.6 ***
Source: pss-lifg.log, pss-low_only.log, and pss-fgenonly.logNote: Hyphens indicate too few respondents to compute impact. Weighted values reported.*/**/*** Impact estimate is statistically significant at the 0.10 / 0.05 / 0.01 level.# Indicates that for all students, the impacts are significantly different from the impacts for lower-income and first-generation students at the 0.10 level.
Table E.3
Impact of Upward Bound on College Engagementby Students' Eligibility Status
All Students Participants
Low-Inc. and First-Gen. LI and FG FG Only LI OnlyLow-Income OnlyFirst-Generation Only
Impact Impact ImpactControl Mean Control Mean ImpactImpact
How often during first year in postsecondary school student used the following supplemental services
Participation in federally supported programs while in postsecondary school (%)
Control Mean Impact

E-6
Residence in focused housing (%) 2 1 0 0 0 1 1 0 2
Days per year of parent or student contact with school 74.1 -0.2 54.5 13.2 ** 85.9 5.4 -0.2 15.8 ** 6.0
Academic counseling 1.4 0.2 1.1 0.4 ** 1.5 0.3 * 0.2 0.5 ** 0.3 *Personal counseling 0.4 0.3 *** 0.3 0.1 0.3 0.2 0.3 *** 0.1 0.2Learning skills center services 0.9 0.2 0.5 0.3 0.6 0.3 0.2 0.4 0.4 Tutoring services 1.2 0.3 * 0.5 0.3 0.8 0.6 * 0.3 * 0.3 0.6 *Minority student services 0.5 0.2 0.0 0.1 0.4 -0.1 0.2 0.1 -0.1Health services 0.6 0.1 0.5 0.1 0.5 -0.1 0.1 0.2 -0.1Other 0.0 0.0 0.0 0.0 0.1 -0.1 0.0 0.0 -0.1
Student Support Services 6 1 2 4 ** 4 0 1 5 ** 0McNair Post-Baccalaureate Achievement Program 2 -1 0 0 0 0 -1 0 0
Student received financial aid (%) 60 -5 46 7 ** 51 -2 -6 9 ** -2
How often during first year of postsecondary school student:Talked with faculty in office about academic matters 2.3 -0.3 1.8 0.6 ** # 1.8 0.5 # -0.4 0.7 ** 0.6 *Met with advisor concerning academic plans 2.0 0.0 1.4 0.2 1.4 0.3 0.0 0.2 0.3Had informal contact with advisor or other faculty 1.8 0.1 1.3 0.5 ** 1.3 0.1 0.1 0.6 ** 0.1Participated in study groups outside of class 2.5 -0.2 1.9 0.5 * 2.4 -0.4 -0.3 0.6 * -0.4 Went to events with friends from school 3.2 0.0 2.7 0.4 *** 3.2 0.0 0.1 0.5 *** 0.0Participated in school clubs 1.4 0.0 1.0 0.3 ** 1.2 -0.2 0.0 0.4 ** -0.3Attended career-related lectures, conventions, or field
trips with friends 1.7 -0.2 0.9 0.2 1.2 0.2 -0.3 0.2 0.2 Participated in intramural or intercollegiate sports, 1.5 -0.3 0.0 0.3
music, drama, etc. -0.2 0.8 0.0 0.7 0.3 Cut classes 1.6 -0.2 1.6 0.2 1.2 0.2 -0.2 0.2 0.3
Source: pss-black.log, pss-white.log, and pss-hisp.logNote: Hyphens indicate too few respondents to compute impact. Weighted values reported.*/**/*** Impact estimate is statistically significant at the 0.10 / 0.05 / 0.01 level.# Indicates that for all students, the impacts are significantly different from the impacts for African American students at the 0.10 level.
Control Mean Impact
HispanicWhite
ImpactControl Mean
African American
All Students Participants
Table E.4
Impact of Upward Bound on College Engagementfor African American, White and Hispanic Students
Impact
How often during first year in postsecondary school student used the following supplemental services
Participation in federally supported programs while in postsecondary school (%)
Control Mean Impact Impact Impact
Afr. Amer. White Hispanic

E-7
Residence in focused housing (%) 2 -1 1 1 -1 1
Days per year of parent or student contact with school 54.8 5.3 79.1 1.2 6.0 1.4
Academic counseling 1.2 0.2 1.4 0.2 0.2 0.2 Personal counseling 0.4 0.5 *** 0.4 0.1 # 0.6 *** 0.1 Learning skills center services 0.7 0.4 0.8 0.2 0.4 0.2 Tutoring services 0.8 0.5 * 1.1 0.2 ** 0.6 * 0.3 **Minority student services 0.2 0.4 *** 0.5 0.0 # 0.4 *** -0.1 Health services 0.3 0.2 ** 0.6 0.0 0.2 ** 0.0 Other 0.0 0.0 0.0 0.0 0.0 0.0
Student Support Services 5 1 5 1 1 1 McNair Post-Baccalaureate Achievement Program 1 -1 1 0 -1 0
Student received financial aid (%) 43 3 60 -3 4 -3
How often during first year of postsecondary school student:Talked with faculty in office about academic matters 1.7 0.1 2.2 0.1 0.2 0.1 Met with advisor concerning academic plans 1.5 0.0 1.8 0.2 0.1 0.2 Had informal contact with advisor or other faculty 1.2 0.4 * 1.7 0.2 * 0.4 * 0.2 *Participated in study groups outside of class 2.1 -0.2 2.5 -0.1 -0.2 -0.1 Went to events with friends from school 2.8 0.1 3.2 0.1 0.2 0.1 Participated in school clubs 1.0 0.2 1.4 0.0 0.2 0.0 Attended career-related lectures, conventions, or field
trips with friends 1.0 0.1 1.5 -0.1 0.2 -0.1 Participated in intramural or intercollegiate sports,
music, drama, etc. 1.7 0.0 1.0 -0.1 0.1 -0.1 Cut classes 1.2 0.2 1.6 -0.1 0.3 -0.2
Source: pss-male.log and pss-female.logNote: Hyphens indicate too few respondents to compute impact. Weighted values reported.*/**/*** Impact estimate is statistically significant at the 0.10 / 0.05 / 0.01 level.# Indicates that for all students, the impacts are significantly different from the impacts for male students at the 0.10 level.
Impact of Upward Bound on College Engagement
Table E.5
for Male and Female Students
All Students Participants
ImpactImpact
Male Female
ImpactControl MeanControl Mean
Female
How often during first year in postsecondary school student used the following supplemental services
Participation in federally supported programs while in postsecondary school (%)
Male
Impact
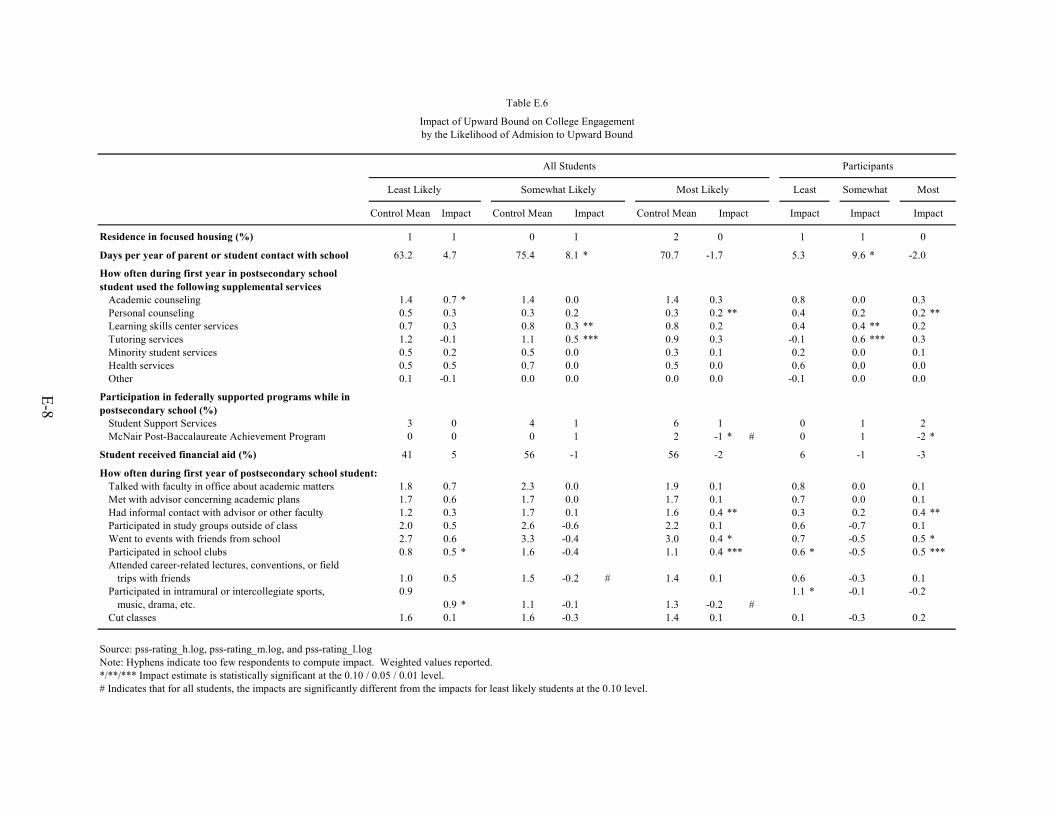
E-8
Residence in focused housing (%) 1 1 0 1 2 0 1 1 0
Days per year of parent or student contact with school 63.2 4.7 75.4 8.1 * 70.7 -1.7 5.3 9.6 * -2.0
Academic counseling 1.4 0.7 * 1.4 0.0 1.4 0.3 0.8 0.0 0.3Personal counseling 0.5 0.3 0.3 0.2 0.3 0.2 ** 0.4 0.2 0.2 **Learning skills center services 0.7 0.3 0.8 0.3 ** 0.8 0.2 0.4 0.4 ** 0.2 Tutoring services 1.2 -0.1 1.1 0.5 *** 0.9 0.3 -0.1 0.6 *** 0.3Minority student services 0.5 0.2 0.5 0.0 0.3 0.1 0.2 0.0 0.1Health services 0.5 0.5 0.7 0.0 0.5 0.0 0.6 0.0 0.0Other 0.1 -0.1 0.0 0.0 0.0 0.0 -0.1 0.0 0.0
Student Support Services 3 0 4 1 6 1 0 1 2McNair Post-Baccalaureate Achievement Program 0 0 0 1 2 -1 * # 0 1 -2 *
Student received financial aid (%) 41 5 56 -1 56 -2 6 -1 -3
How often during first year of postsecondary school student:Talked with faculty in office about academic matters 1.8 0.7 2.3 0.0 1.9 0.1 0.8 0.0 0.1Met with advisor concerning academic plans 1.7 0.6 1.7 0.0 1.7 0.1 0.7 0.0 0.1Had informal contact with advisor or other faculty 1.2 0.3 1.7 0.1 1.6 0.4 ** 0.3 0.2 0.4 **Participated in study groups outside of class 2.0 0.5 2.6 -0.6 2.2 0.1 0.6 -0.7 0.1 Went to events with friends from school 2.7 0.6 3.3 -0.4 3.0 0.4 * 0.7 -0.5 0.5 *Participated in school clubs 0.8 0.5 * 1.6 -0.4 1.1 0.4 *** 0.6 * -0.5 0.5 ***Attended career-related lectures, conventions, or field
trips with friends 1.0 0.5 1.5 -0.2 # 1.4 0.1 0.6 -0.3 0.1 Participated in intramural or intercollegiate sports, 0.9 1.1 * -0.1 -0.2
music, drama, etc. 0.9 * 1.1 -0.1 1.3 -0.2 #Cut classes 1.6 0.1 1.6 -0.3 1.4 0.1 0.1 -0.3 0.2
Source: pss-rating_h.log, pss-rating_m.log, and pss-rating_l.logNote: Hyphens indicate too few respondents to compute impact. Weighted values reported.*/**/*** Impact estimate is statistically significant at the 0.10 / 0.05 / 0.01 level.# Indicates that for all students, the impacts are significantly different from the impacts for least likely students at the 0.10 level.
All Students
How often during first year in postsecondary school student used the following supplemental services
Participation in federally supported programs while in postsecondary school (%)
Control Mean
Table E.6
Impact of Upward Bound on College Engagementby the Likelihood of Admision to Upward Bound
Participants
MostSomewhat
Impact ImpactImpactControl Mean
LeastLeast Likely
Control Mean Impact Impact
Most LikelySomewhat Likely
Impact

APPENDIX F
METHODS USED TO ESTIMATE THE EFFECTS OF ADDITIONAL UPWARD BOUND PARTICIPATION


F-3
The duration and completion analyses presented in Chapter IV are designed to measure the
potential benefits of additional Upward Bound participation, defined as longer Upward Bound
participation for students who participate for a relatively short period of time and Upward Bound
completion for noncompleting participants. The two “target” populations for this analysis—
students who could be targeted for program retention efforts—are students who participated in
Upward Bound for less than two years and noncompleting participants. To estimate the effects
of additional Upward Bound participation on the target populations, we matched samples from
the target populations to appropriate comparison samples. While we had no firm rule for how
comparable the two weighted samples must be, two samples were considered comparable if the
weighted means of baseline variables were similar between the two samples, that is, if the two
samples appear to represent the same population. The remainder of this appendix describes the
target and comparison samples, details the rules used in matching and assesses the comparability
of the matched target and comparison samples.
A. Selecting Target and Comparison Samples to be Matched
To measure the impacts of an additional year of Upward Bound participation, we defined the
target population to be all Upward Bound participants who participated for no more than two
years. This population consists of low-duration participants, who participated for 1 to 12
months, and medium-duration participants, who participated for 13 to 24 months. For each of
these two subgroups of the target population, we selected a comparison population of students
who participated in Upward Bound for roughly one more year than students in the target
population—medium-duration participants for targeted low-duration participants, and high-
duration participants (who participated for more than 24 months) for targeted medium-duration
participants. To measure the impacts of program completion on noncompleters, we defined the

F-4
target population to be all participants who do not complete Upward Bound (noncompleters) and
the comparison population to be all participants who do complete the program (completers).
The treatment group provides samples of students from the target and comparison
populations that can be used to measure the potential impacts of additional Upward Bound
participation. We restricted our sample to students who (1) applied for Upward Bound in ninth
or tenth grade at one of the 67 evaluation projects, (2) were assigned to the treatment group and
(3) ultimately participated in Upward Bound. We excluded students who applied for Upward
Bound in eighth grade. We excluded students who applied for Upward Bound in eighth grade
because high school transcripts were unavailable for them—they had not yet attended high
school—and thus we had no information on their academic achievement prior to program entry.
Because the key outcomes of this analysis are college enrollment and persistence, and because
academic achievement prior to college influences these outcomes, it was important to match
students with similar achievement prior to entering Upward Bound. We also excluded students
who applied for Upward Bound after tenth grade because their window of opportunity to
participate in Upward Bound was relatively short: their maximum spell of participation was no
more than two years. Therefore, the potential for increasing the length of participation for these
students is fairly limited. The sample is restricted to Upward Bound participants so that we can
measure the impacts of longer spells of participation relative to shorter spells and the impact of
program completion relative to participation without completion.
Because of missing data due to survey nonresponse and “transcript” nonresponse (see
Appendix H), we needed to impose two further restrictions. Because it was important to match
students with similar achievement prior to entering Upward Bound, we dropped students for
whom we lacked ninth-grade transcripts. Furthermore, because the third follow-up survey was
used to collect information on the postsecondary institutions that sample members had attended,

F-5
we dropped students who did not complete a third follow-up interview. These restrictions
generated a sample of 762 target and comparison sample members from the 1,523 students
assigned to the treatment group. These participants were divided into target and comparison
samples, and matching algorithms were applied to select matched target and comparison
samples.
Postsecondary transcripts provided information on postsecondary credits earned, but we
were unable to collect a complete set of postsecondary transcripts for 28 percent of all
postsecondary students in our treatment and control samples. While transcript weights were
developed to account for incomplete transcript data in the experimental samples, for the analyses
in Chapter IV, we needed to account for incomplete transcript data in our nonexperimental
comparison samples. Instead of developing weights for the comparison samples, we selected
additional matched samples for the subgroup of 717 students for whom we have a complete set
of postsecondary transcripts.
B. Selecting Matched Target and Comparison Samples
For each matching exercise, the target and comparison samples were split into two
subgroups: (1) students whose ninth-grade transcripts suggest that they were at relatively high
risk of academic failure (higher-risk students) and (2) students whose ninth-grade transcripts
suggest that they were at relatively low risk of academic failure (lower-risk students). This split
was motivated by the need to compute impacts separately for these two subgroups.
Within each of the two subgroups, we estimated propensity scores on which the two samples
were matched (Rosenbaum and Rubin 1983; Rosenbaum and Rubin 1985). An unweighted logit
model was estimated to distinguish between members of the two samples; the dependent variable
was coded as 1 for target sample members and 0 for comparison sample members. The

F-6
explanatory variables contain information about gender, race, educational aspirations, time spent
on homework, ninth-grade academic achievement and Upward Bound cohort.50 Furthermore, the
baseline weight, which reflects the probability that the student’s project was selected into the
evaluation, was included as an explanatory variable.51 The model was used to estimate the log
odds of being in the target sample conditional on the explanatory variables for each target and
comparison sample member.52
Separately for higher- and lower-risk students, we matched target sample members to
“comparable” comparison sample members. Two students were deemed comparable when their
log odds were sufficiently close. We matched each target sample member to all comparison
sample members who were deemed comparable.53 Target sample members for whom we were
unable to find a comparable comparison sample member were excluded from the matched target
sample because no comparison student could provide credible information about the outcomes
we would have observed with additional Upward Bound participation. All comparison sample
members who were matched to one or more target sample members were included in the
matched comparison sample.
The matched comparison sample was weighted to represent the same segment of the
Upward Bound population that is represented by the matched target sample. For each
comparison student, c, who was matched to a single target student, t, we assigned a weight of
50 See the first column of Table F.1 for a complete list of variables. 51 While we had experimented with weighting the propensity score model, we were generally able to obtain
more comparable matched target and comparison samples when we included the baseline weight as an explanatory variable in the propensity score model.
52 The log odds of being in the target sample equals the natural log of P(1) / P(0), where P(1) equals the probability of being in the target sample and P(0) equals the probability of being in the comparison sample. These probabilities were predicted using the estimated coefficients from the logit model.
53 Therefore, we matched target sample members to comparison sample members “with replacement.”

F-7
c t tw w n= , where tw equals the weight of the target student, and tn equals the number of
comparison students who were matched to the target student. That is, the weight of target
student t was distributed equally to all comparison students to whom t was matched. However,
most comparison students were matched to multiple target students. Therefore, for each matched
comparison student, we assigned a weight of c
c t tt M
w w n∈
= ∑ , where cM is the set of target students
who were matched to the comparison student.
The most challenging task in selecting an algorithm for choosing the matched target and
comparison samples was selecting “caliper ranges” that define how close the log odds of
matched target and comparison sample members must be. Narrow caliper ranges can leave
many target sample members unmatched when similar students could be found in the
comparison sample; wide caliper ranges generate matches between students who are not really
comparable. We tested several different caliper ranges in matching the target samples to the
comparison samples. One caliper range that we tested corresponds to the smallest possible range
under which all target sample members match at least one comparison sample member. Other
caliper ranges that we tested correspond to the smallest possible ranges under which fixed
proportions of the target sample—less than 100 percent—match at least one comparison sample
member. Each caliper range generated different matched target and comparison samples;
therefore, selecting a caliper range was equivalent to selecting a pair of matched target and
comparison samples. Ultimately, we selected the widest caliper range that led to matched target
and comparison samples with a small number of significant differences in variables that describe
baseline characteristics and ninth-grade academic achievement.

F-8
The resulting matched samples were used to measure the impacts of additional Upward
Bound participation in Chapter IV. To measure the impacts of an additional year of Upward
Bound, the matched target sample consisted of the following groups:
• Higher-risk low-duration students who were matched to one or more higher-risk medium-duration students.
• Lower-risk low-duration students who were matched to one or more lower-risk medium-duration students.
• Higher-risk medium-duration students who were matched to one or more higher-risk high-duration students.
• Lower-risk medium-duration students who were matched to one or more lower-risk high-duration students.
To measure the impacts of completing Upward Bound for noncompleters, the matched target
sample consisted of the following groups:
• Higher-risk noncompleters who were matched to one or more higher-risk completers.
• Lower-risk noncompleters who were matched to one or more lower-risk completers.
The matched comparison sample consisted of all the comparison sample members to whom
target sample members were matched.
C. Describing and Assessing the Matched Samples
Through the process described in Section B, we were able to select comparable matched
target and comparison samples for answering the questions posed in Chapter IV. Included in this
appendix are four tables that can be used to assess the matched samples, along with two tables
that compare the average characteristics of the matched and unmatched target sample members.
Tables F.1 and F.2 describe the full and matched samples of lower-duration and higher-duration
students by level of academic risk and overall; Table F.3 presents the mean characteristics of the
lower-duration target sample separately for both matched and unmatched students and overall.

F-9
Tables F.4 and F.5 describe the full and matched samples of noncompleters and completers by
level of academic risk and overall; Table F.6 presents the mean characteristics of the target
sample of noncompleters separately for both matched and unmatched students and overall.
Each table shows that while the unmatched target and comparison samples differ from each
other, the matched target and comparison samples are more comparable to each other. For each
group, the first set of columns, titled “Full Samples,” provides mean values for the baseline
characteristics of the target and comparison samples, along with an indicator for the level at
which the difference in means is statistically significant. The second set of columns, titled
“Matched Samples,” provides mean values for the baseline characteristics of the matched target
and comparison samples, also followed by an indicator of the level of statistical significance for
the difference. The means for the full samples—both the target sample and the comparison
sample—and means for the matched target sample are weighted to account for unequal sampling,
survey nonresponse and, where appropriate (Tables F.2 and F.5), the absence of complete
postsecondary transcript data. In contrast, the matched comparison sample means are weighted
to account for the results from matching, as described in Section B.
An assessment from each table suggests that matching was successful in producing samples
that are comparable in the characteristics that we examined based on data collected for the
evaluation. To assess the performance of matching in balancing the two samples, we compare
the number of statistically significant baseline differences between the full target and
comparison samples to the number of statistically significant baseline differences between the
matched target and comparison samples.54 Typically, the target and comparison samples are
54 Our tests for significant differences account for heteroscedasticy due to unequal weighting but do not
account for the correlation between the means of the two samples due to matching. Mean differences are flagged as statistically significant at the 10 percent (*), 5 percent (**), and 1 percent (***) levels.

F-10
significantly different on several baseline characteristics, and the matched target and comparison
samples are significantly different on fewer baseline characteristics. The matching algorithm
generated matched samples that appear to differ primarily in the extent of their participation.
The remainder of this appendix shows that the matched target and comparison samples are
comparable. Table F.1 illustrates the comparability of the matched samples of lower- and
higher-duration participants. For the overall target and comparison samples, combining higher-
and lower-risk students together, higher-duration participants were significantly more likely to be
female, to have higher ninth-grade GPAs and credits and to spend more time on homework each
week than lower-duration participants. Our preferred caliper range selects a matched target
sample consisting of 90 percent of the 463 lower-duration target sample members. The matched
comparison sample is significantly different from the matched target sample on only 2 of the 17
baseline characteristics—whether the student applied for Upward Bound before 1994 and
whether the student spent 1 to 10 hours per week on homework. For students with complete
postsecondary transcript data, the matched comparison sample only differs from the matched
target sample with respect to the year of Upward Bound application (Table F.2). For the higher-
risk group, there are five significant differences between the matched samples (see Tables F.1
and F.2); for the lower-risk group, there is one significant difference between them.
Table F.4 illustrates the comparability of the matched samples of noncompleters and
completers. For the overall target and comparison samples, completers were significantly more
likely to be female, to have higher ninth-grade GPAs and to spend more time on homework each
week than noncompleters. Our preferred caliper range selects a matched target sample
consisting of 90 percent of the 412 noncompleters. As shown in Table F.4, the matched
comparison sample is significantly different from the matched target sample only in ninth-grade
GPA. For students with complete postsecondary transcript data, the matched comparison sample

F-11
also differs from the matched target sample in the percentage of students who only met the first-
generation eligibility criterion (see Table F.5). For the higher-risk group, there are two
significant differences between the matched samples for both survey respondents (see Table F.4)
and those with complete postsecondary transcripts (see Table F.5); for the lower-risk group,
there is one significant difference for survey respondents, and there are three significant
differences for those with complete postsecondary transcripts.
We believe that the matched target and comparison samples provide credible estimates of
the potential impacts of additional Upward Bound participation. Each matched comparison
sample is roughly as similar to its corresponding matched target sample in the number of
significant baseline differences as we would expect under random assignment.55 Furthermore,
the baseline variables we used to assess the comparability of matched samples provide
information on demographic characteristics, prior academic achievement and other factors that
may influence postsecondary enrollment and persistence. Thus, the findings in Chapter IV
should have strong internal validity relative to many other nonexperimental analyses.
Additionally, 90 percent of students in the target sample were matched and included in the
analysis. Therefore, the findings in Chapter IV probably also have strong external validity.
55 The notable exception occurred in matching lower-duration target sample members and higher-duration
comparison sample members. In this case, the limited number of students in comparison sample pool resulted in more significant differences between the matched target and comparison samples than would have been expected from random assignment.

Higher Academic Risk Lower Academic Risk Overall
SD SD SD SD SD SD
Male (%) 39 23 38 37 31 26 ** 29 33 34 25 *** 31 34
Race (%)White 19 11 19 19 25 29 28 27 23 25 26 25 Hispanic 9 23 * 10 20 ** 30 25 21 24 25 24 19 23 Other Race 10 5 13 7 7 9 9 13 8 8 10 12
Low-Income and First-Generation (%)First-Generation Only 11 4 ** 13 7 21 14 13 14 18 12 13 12 Low-Income Only 0 3 0 3 ** 4 6 5 6 3 5 ** 4 5
Educational Expectations (%) Some College 30 29 41 25 * 9 17 * 12 21 15 20 19 22 Finish Four-year College 37 31 29 37 46 38 41 33 44 37 * 38 34 Master's Degree or Equivalent 5 8 6 15 * 9 11 11 14 8 11 ** 10 14 PhD, MD, or Professional Degree 14 8 8 9 24 20 25 24 21 18 20 20
Academic Achievement - Ninth GradeTotal Credits 4.3 5.0 ** 4.9 4.9 6.7 6.5 ** 6.6 6.5 6.0 6.2 ** 6.2 6.1 Advanced Placement and Honors Credits 0.0 0.3 * 0.1 0.1 0.7 0.5 0.7 0.2 0.5 0.5 0.6 0.2 Overall Grade Point Average 1.4 1.6 *** 1.6 1.8 2.5 2.6 2.6 2.7 2.2 2.4 * 2.3 2.4 Higher Academic Risk (%) 100 100 100 100 0 0 0 0 27 21 26 26
Homework (%) 1-10 Hours / Week 45 63 *** 56 78 ** 70 74 65 73 63 72 *** 63 74 ** More than 10 Hours / Week 24 21 17 16 25 23 31 24 25 22 27 22
Upward Bound CohortGrade at UB Application 9.4 9.3 9.5 9.4 9.5 9.5 ** 9.6 9.6 9.5 9.4 ** 9.5 9.5 Applied for UB Before 1994 (%) 66 78 67 61 65 66 72 51 ** 65 69 70 54 **
Students 116 95 105 94 347 458 313 396 463 553 418 490
Source: balance.logNote: The matched samples represent those in the target sample (T) of lower-duration participants who were matched using the caliper range which yields a 90 percent match rate for the comparisongroup (C) of higher-duration participants.*/**/*** Difference between T and C is statistically significant at the 0.10 / 0.05 / 0.01 level, indicated in the SD columns.
Full Samples Matched Samples
Table F.1
Matching Lower-Duration Target Sample Members (T) and Higher-Duration Comparison Sample Members (C),Survey Respondents
Full Samples Matched Samples Full Samples Matched Samples
T C T C T C T C T C T C
F-12
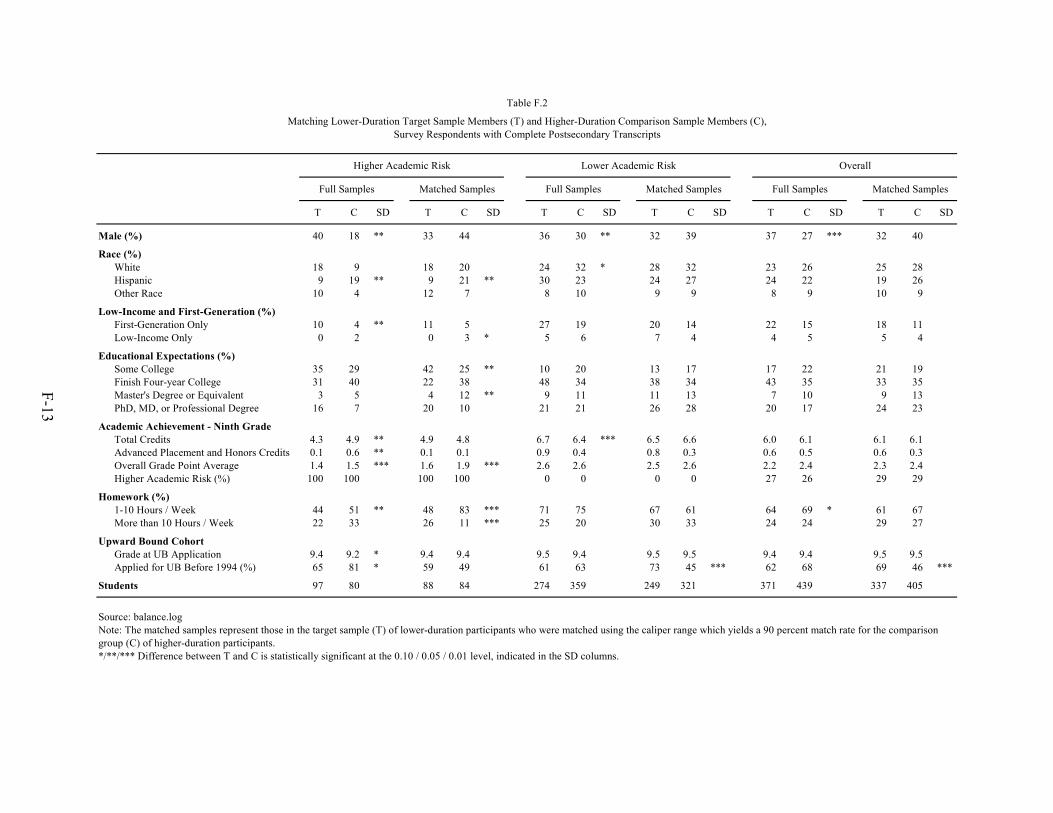
Higher Academic Risk Lower Academic Risk Overall
SD SD SD SD SD SD
Male (%) 40 18 ** 33 44 36 30 ** 32 39 37 27 *** 32 40
Race (%)White 18 9 18 20 24 32 * 28 32 23 26 25 28 Hispanic 9 19 ** 9 21 ** 30 23 24 27 24 22 19 26 Other Race 10 4 12 7 8 10 9 9 8 9 10 9
Low-Income and First-Generation (%)First-Generation Only 10 4 ** 11 5 27 19 20 14 22 15 18 11 Low-Income Only 0 2 0 3 * 5 6 7 4 4 5 5 4
Educational Expectations (%) Some College 35 29 42 25 ** 10 20 13 17 17 22 21 19 Finish Four-year College 31 40 22 38 48 34 38 34 43 35 33 35 Master's Degree or Equivalent 3 5 4 12 ** 9 11 11 13 7 10 9 13 PhD, MD, or Professional Degree 16 7 20 10 21 21 26 28 20 17 24 23
Academic Achievement - Ninth GradeTotal Credits 4.3 4.9 ** 4.9 4.8 6.7 6.4 *** 6.5 6.6 6.0 6.1 6.1 6.1 Advanced Placement and Honors Credits 0.1 0.6 ** 0.1 0.1 0.9 0.4 0.8 0.3 0.6 0.5 0.6 0.3 Overall Grade Point Average 1.4 1.5 *** 1.6 1.9 *** 2.6 2.6 2.5 2.6 2.2 2.4 2.3 2.4 Higher Academic Risk (%) 100 100 100 100 0 0 0 0 27 26 29 29
Homework (%) 1-10 Hours / Week 44 51 ** 48 83 *** 71 75 67 61 64 69 * 61 67 More than 10 Hours / Week 22 33 26 11 *** 25 20 30 33 24 24 29 27
Upward Bound CohortGrade at UB Application 9.4 9.2 * 9.4 9.4 9.5 9.4 9.5 9.5 9.4 9.4 9.5 9.5 Applied for UB Before 1994 (%) 65 81 * 59 49 61 63 73 45 *** 62 68 69 46 ***
Students 97 80 88 84 274 359 249 321 371 439 337 405
Source: balance.logNote: The matched samples represent those in the target sample (T) of lower-duration participants who were matched using the caliper range which yields a 90 percent match rate for the comparisongroup (C) of higher-duration participants.*/**/*** Difference between T and C is statistically significant at the 0.10 / 0.05 / 0.01 level, indicated in the SD columns.
T C T CT C T CT C T C
Table F.2
Matching Lower-Duration Target Sample Members (T) and Higher-Duration Comparison Sample Members (C),Survey Respondents with Complete Postsecondary Transcripts
Full Samples Matched Samples Full Samples Matched Samples Full Samples Matched Samples
F-13

F-14
Male (%) 40 31 34 53 34 36
Race (%)White 15 26 23 24 28 28Hispanic 43 19 25 29 20 21Other Race 2 10 8 11 12 12
Low-Income and First-Generation (%)First-Generation Only 34 13 18 27 11 13Low-Income Only 1 4 3 2 5 5
Educational Expectations (%) Some College 2 19 15 9 17 16 Finish Four-year College 61 38 44 40 38 38 Master's Degree or Equivalent 1 10 8 7 12 11 PhD, MD, or Professional Degree 23 20 21 22 23 23
Academic Achievement - Ninth GradeTotal Credits 5.6 6.2 6.0 6.0 6.0 6.0Advanced Placement and Honors Credits 0.5 0.6 0.5 0.1 0.3 0.3Overall Grade Point Average 2.0 2.3 2.2 2.1 2.4 2.4Higher Academic Risk (%) 30 26 27 24 25 25
Homework (%) 1-10 Hours / Week 66 63 63 73 70 70 More than 10 Hours / Week 16 27 25 22 24 24
Upward Bound CohortGrade at UB Application 9.4 9.5 9.5 9.6 9.6 9.6Applied for UB Before 1994 (%) 49 70 65 62 54 55
Students 45 418 463 45 418 463
Source: unmatch.logNote: An unmatched participant is one who is unable to be matched with a comparison group member within the caliperrange.
Unweighted
All
Table F.3
Comparison of Unmatched, Matched and All Participants,Duration Analysis, Survey Respondents
Unmatched Matched All Unmatched Matched
Weighted

Higher Academic Risk Lower Academic Risk Overall
SD SD SD SD SD SD
Male (%) 34 31 28 32 33 21 *** 25 29 33 22 ** 26 30
Race (%)White 17 12 22 21 29 22 23 35 25 20 23 31 Hispanic 16 13 20 27 29 30 28 14 25 27 26 18 Other Race 9 2 12 10 8 7 9 15 9 6 10 14
Low-Income and First-Generation (%)First-Generation Only 10 2 * 11 11 26 13 23 15 21 11 * 20 14 Low-Income Only 1 3 1 3 4 5 4 5 3 5 3 5
Educational Expectations (%) Some College 25 21 33 23 12 16 11 12 16 16 18 15 Finish Four-year College 33 46 25 36 41 40 42 34 39 41 37 35 Master's Degree or Equivalent 4 15 5 9 10 12 11 15 8 12 9 13 PhD, MD, or Professional Degree 14 9 8 16 25 20 28 31 21 18 22 26
Academic Achievement - Ninth GradeTotal Credits 4.3 5.0 *** 4.9 5.0 6.7 6.5 6.5 6.4 5.9 6.3 6.1 6.0 Advanced Placement and Honors Credits 0.0 0.6 0.0 0.1 0.7 0.6 0.8 0.3 0.5 0.6 * 0.6 0.2 Overall Grade Point Average 1.3 1.7 *** 1.5 1.8 ** 2.5 2.7 2.6 2.7 * 2.2 2.5 *** 2.3 2.5 **Higher Academic Risk (%) 100 100 100 100 0 0 0 0 31 15 *** 29 29
Homework (%) 1-10 Hours / Week 48 63 60 84 *** 74 74 74 66 66 73 ** 70 71 More than 10 Hours / Week 23 35 18 13 20 23 23 28 21 25 22 23
Upward Bound CohortGrade at UB Application 9.3 9.4 9.4 9.4 9.4 9.5 *** 9.4 9.4 9.4 9.5 *** 9.4 9.4 Applied for UB Before 1994 (%) 70 76 74 68 59 65 59 55 62 66 64 59
Students 108 51 98 51 304 299 274 262 412 350 372 313
Source: balance.logNote: The matched samples represent those in the target sample (T) of noncompleting participants who were matched using the caliper range which yields a 90 percent match rate for the comparisongroup (C) of completing participants.*/**/*** Difference between T and C is statistically significant at the 0.10 / 0.05 / 0.01 level, indicated in the SD columns.
T C T CT C T CT C T C
Table F.4
Matching Noncompleting Target Sample Members (T) and Completing Comparison Sample Members (C),Survey Respondents
Full Samples Matched Samples Full Samples Matched Samples Full Samples Matched Samples
F-15

Higher Academic Risk Lower Academic Risk Overall
SD SD SD SD SD SD
Male (%) 36 19 * 29 31 33 27 23 37 33 25 25 35
Race (%)White 17 8 21 22 26 24 22 39 * 24 21 22 34 Hispanic 16 10 20 20 30 28 28 15 26 24 26 17 Other Race 9 2 12 12 8 9 9 12 8 7 10 12
Low-Income and First-Generation (%)First-Generation Only 9 2 9 6 30 19 27 12 24 15 ** 22 11 *Low-Income Only 0 3 0 3 4 6 5 4 3 5 4 4
Educational Expectations (%) Some College 29 16 38 22 11 19 10 15 17 18 18 17 Finish Four-year College 28 62 19 31 48 34 46 36 43 40 39 35 Master's Degree or Equivalent 3 8 4 8 10 12 11 16 8 11 9 14 PhD, MD, or Professional Degree 15 7 9 23 20 22 23 25 18 18 19 24
Academic Achievement - Ninth GradeTotal Credits 4.4 4.8 ** 5.0 4.9 6.7 6.4 *** 6.5 6.4 * 6.0 6.0 6.1 6.0 Advanced Placement and Honors Credits 0.0 1.1 * 0.1 0.1 0.9 0.6 1.1 0.2 0.6 0.7 0.8 0.2 Overall Grade Point Average 1.3 1.6 *** 1.5 1.8 ** 2.5 2.7 2.6 2.8 ** 2.2 2.4 2.3 2.5 **Higher Academic Risk (%) 100 100 100 100 0 0 0 0 29 22 27 27
Homework (%) 1-10 Hours / Week 47 43 60 84 *** 73 77 73 71 65 69 70 75 More than 10 Hours / Week 20 56 14 10 22 20 25 25 21 28 22 21
Upward Bound CohortGrade at UB Application 9.3 9.3 9.3 9.4 9.3 9.5 *** 9.4 9.4 9.3 9.4 *** 9.4 9.4 Applied for UB Before 1994 (%) 68 83 * 72 64 58 61 60 54 61 66 63 57
Students 87 46 78 47 254 225 229 194 341 271 307 241
Source: balance.logNote: The matched samples represent those in the target sample (T) of noncompleting participants who were matched using the caliper range which yields a 90 percent match rate for the comparisongroup (C) of completing participants.*/**/*** Difference between T and C is statistically significant at the 0.10 / 0.05 / 0.01 level, indicated in the SD columns.
T C T CT C T CT C T C
Table F.5
Matching Noncompleting Target Sample Members (T) and Completing Comparison Sample Members (C),Survey Respondents with Complete Postsecondary Transcripts
Full Samples Matched Samples Full Samples Matched Samples Full Samples Matched Samples
F-16

F-17
Male (%) 70 26 33 65 32 35
Race (%)White 38 23 25 55 30 32Hispanic 21 26 25 23 20 20Other Race 2 10 9 8 13 13
Low-Income and First-Generation (%)First-Generation Only 25 20 21 30 14 16Low-Income Only 0 3 3 0 5 4
Educational Expectations (%) Some College 8 18 16 10 17 17 Finish Four-year College 46 37 39 33 36 35 Master's Degree or Equivalent 3 9 8 13 13 13 PhD, MD, or Professional Degree 18 22 21 18 23 23
Academic Achievement - Ninth GradeTotal Credits 5.3 6.1 5.9 6.0 6.0 6.0Advanced Placement and Honors Credits 0.0 0.6 0.5 0.0 0.2 0.2Overall Grade Point Average 1.5 2.3 2.2 1.6 2.4 2.4Higher Academic Risk (%) 42 29 31 25 26 26
Homework (%) 1-10 Hours / Week 44 70 66 60 71 70 More than 10 Hours / Week 18 22 21 18 23 23
Upward Bound CohortGrade at UB Application 9.0 9.4 9.4 9.1 9.4 9.4Applied for UB Before 1994 (%) 56 64 62 38 54 52
Students 40 372 412 40 372 412
Source: unmatch.logNote: An unmatched participant is one who is unable to be matched with a comparison group member within the caliperrange.
Unweighted
All
Table F.6
Comparison of Unmatched, Matched and All Participants,Completion Analysis, Survey Respondents
Unmatched Matched All Unmatched Matched
Weighted


APPENDIX G
WEIGHTED STANDARD DEVIATIONS FOR ALL OUTCOME VARIABLES


G-3
High School Outcomes
CreditsTotal 6.6Total Core 4.9
Math 1.2Science 1.3English 1.5Social Studies 1.2Foreign Language 1.1
Computer Science 0.8Vocational 1.5
Advanced Placement and Honors CreditsTotal 3.5
Total Core 3.3Math 0.8Science 0.9English 1.2Social Studies 0.8Foreign Language 0.3
Grade Point AverageOverall 0.8
Math 0.9Science 0.9English 0.9Social Studies 1.0Foreign Language 1.1
High School Status (%)Graduated 31Still in high school 6Dropped out 26General Educational Development (GED) 17
Source: hs-overall.log
Standard Deviation
Table G.1
Weighted Standard Deviations for High School Outcome Variables

G-4
Postsecondary Outcomes
Postsecondary School Status (%)Any postsecondary school 45Four-year college 50Two-year college 41Vocational school 16
Credits EarnedAll postsecondary schools 44.8
Nonremedial 43.2 Remedial 4.1 Other 9.8
Four-year colleges 41.5 Nonremedial 39.8 Remedial 3.1 Other 9.6
Two-year colleges 20.8 Nonremedial 20.0 Remedial 2.8 Other 1.0
Vocational schools 7.7 Nonremedial 7.2 Remedial 0.3 Other 1.6
Source: pst-overall.log
Table G.2
Weighted Standard Deviations for Postsecondary Outcome Variables,Transcript Information
Standard Deviation

G-5
Postsecondary Outcomes
Residence in focused housing (%) 11
Frequency of parent or student contact with school (days/year) 63.5
Academic counseling 2.0Personal counseling 1.3Learning skills center services 1.8Tutoring services 2.2Minority student services 1.4Health services 1.4Other 0.2
Participation in federally supported programs while in postsecondary school (%)Student Support Services 22McNair Post-Baccalaureate Achievement Program 10
Student received financial aid (%) 50
How often during first year of postsecondary school student:Talked with faculty in office about academic matters 2.4Met with advisor concerning academic plans 2.0Had informal contact with advisor or other faculty 2.3Participated in study groups outside of class 2.7Went to events with friends from school 3.1Participated in school clubs 2.4Attended career-related lectures, conventions, or field trips with friends 2.0Participated in intramural or intercollegiate sports, music, drama, etc. 2.3Cut classes 2.2
While in college or other school, student worked for pay during (%):Freshman year 50Sophomore year 49
Approximate hours worked per week during:Freshman year 15.8Sophomore year 14.8
Source: pss-overall.log
How often during first year in postsecondary school student used the following supplemental services
Table G.3
Weighted Standard Deviations for Postsecondary Outcome Variables,Survey Information
Standard Deviation


APPENDIX H
DATA COLLECTION


H-3
This appendix describes and assesses the procedures for collecting the data that contributed
to this report. These data come from three different sources:
1. The third follow-up survey of students.
2. Secondary and postsecondary transcripts.
3. Administrative records from Upward Bound programs.
The collection of administrative records from Upward Bound programs was straightforward.
Therefore, this appendix focuses on procedures for obtaining completed interviews in the third
follow-up survey and for collecting academic transcripts.
A. Third Follow-Up Survey of Students
The third follow-up survey was conducted between October 1998 and December 1999. This
survey was the third conducted after students were randomly assigned to Upward Bound and a
control group, and it was designed to collect information on secondary and postsecondary
outcomes approximately six years after random assignment.
1. Data Collection Modes
One week before we began interviewing, we sent a letter to all study participants. The letter
indicated that we would call them to complete an interview for an important study, and it
encouraged them to participate. In addition, the letter indicated that we would pay them $10 for
completing the interview.
Most interviews were administered using computer-assisted telephone interviewing (CATI).
CATI interviews took about 20 minutes to complete. When a CATI interview was not possible,
we attempted to interview the sample member in person or obtain a completed questionnaire
through the mail. In February 1999, questionnaires were mailed to study participants that could
not be reached by telephone. Five additional follow up mailings were conducted after the first

H-4
mailing, with the last set of questionnaires being sent out in November 1999. In addition, field
staff located some sample members and asked them to complete the self-administered
questionnaire.
2. Locating
Throughout the data collection period, locating staff used services such as Deltech and
Choicepoint to obtain updated addresses and phone numbers for study participants that were
difficult to reach. In addition, student financial aid files were also used to search for updated
addresses.
3. Methods Used to Obtain a High Response Rate
Financial incentives and field locating were used to obtain a high response rate for the
survey.
a. Incentives
We conducted an experiment to measure the benefits of incentives in obtaining a high
response rate for this sample. After we had interviewed 64 percent of the sample, the remaining
36 percent of the sample was divided into three groups: the first group received a $10 check, the
second group received a letter promising a $10 payment for completing the survey, and the third
group received only a letter encouraging them to complete and return the survey. The response
rates after three weeks indicated that sample members responded differently to the different
incentive schemes. The response rates after three weeks were 16 percent for the first group, 7
percent for second group and 3 percent for the third group. Based on these results, an incentive
check was enclosed for everyone in subsequent mailings.
For the final mailing in November 1999, the incentive amount was increased to $25. This
mailing sought to increase the response rate among control participants, which was lower than

H-5
that for the treatment group. (In October 1999, the response rate for the control group was 76
percent versus 84 percent for the treatment group.) After obtaining updated address information
on some participants from student financial aid files, we sent questionnaires to the control
nonrespondents and to a select group of treatment nonrespondents. Through this effort, the
difference in response rates between treatment and control participants was reduced to 5
percentage points.
b. Field Locating
To reduce the gap in response rates among the treatment and control groups and to increase
the overall response rate, field locating was added to the data collection methods for one month
near the end of the data collection period. Field staff were hired and trained in cities with high
nonresponse rates to locate students that had not been reached by phone or by mail.56
4. Response Rates
Of the 3,006 eligible sample members from the treatment, control and nonresearch groups,
2,448 completed a third follow-up interview.57 Therefore, the response rate for the full sample
was 81 percent. The response rates for the control group, the treatment group and the non-
research group were 79 percent, 83 percent and 85 percent, respectively. Table H.1 displays the
number of completed interviews, the number of eligible nonrespondents, the number ineligible
because they had deceased and the number ineligible for other reasons for the control group, the
treatment group and the non-research group respectively.
56 Field staff obtained seven completed interviews by locating sample members, giving them copies of the
questionnaire, waiting while the questionnaires were completed, and sending the completed questionnaires back to MPR. Field staff obtained some additional completed interviews by asking sample members to complete the questionnaires and send them to MPR, and by giving sample members the toll-free number necessary to complete a telephone interview.
57 See Appendix A for a description of how students were assigned to the three groups.

H-6
B. Transcript Data Collection
For the third follow-up analysis of Upward Bound, secondary and postsecondary transcripts
were collected between May 1999 and May 2000. Academic transcripts provided the primary
source of information on postsecondary achievement. Transcript requests were made from
institutions that were reported by sample members in the third follow-up survey of students and
in earlier surveys.
1. Preparation for Requesting Transcripts
Information about students’ secondary and postsecondary enrollment was primarily obtained
from follow-up interviews. Students reported the secondary and postsecondary institutions that
they had attended. We were also able to obtain information about postsecondary enrollment of
some nonrespondents using financial aid files from the Department of Education.58
To obtain mailing addresses for the schools that were attended by sample members, we
matched schools that were reported by survey respondents to directories of secondary and
postsecondary schools maintained by the U.S. Department of Education. Secondary schools
58 The financial aid files also enabled us to get updated addresses of participants that we had not been able to
locate previously. Mail surveys were sent to these participants, and new school information provided on returned surveys was entered into the database for future transcript requests.
Completed Interview 1,027 1,265 156 2,448
Eligible Nonrespondent 281 250 27 558
Ineligible - Deceased 4 2 1 7
Ineligible - Other 2 0 0 2
Total 1,314 1,517 184 3,015
Table H.1
Response Rates for the Third Follow-up Survey of Students
Control Group Treatment Group Non-research Group Full Sample

H-7
were matched to the Common Core of Data (CCD); postsecondary schools were matched to the
Integrated Postsecondary Education Data System (IPEDS).59
2. Procedures for Requesting Transcripts
Each school was sent a transcript request packet that included:
• A letter, printed on Department of Education letterhead, that explained the purpose of the study and the reason we were requesting transcripts.
• A statement of Authorization and Confidentiality, which cited the Family Educational Rights and Privacy Act and included questions and answers regarding consent and confidentiality.
• A transcript checklist of all the materials that we requested from the school, including student transcripts, a course catalog, grade descriptions and a transcript reimbursement form, which would indicate the reimbursement that the school required for providing the requested transcripts.
• A postage-paid business reply envelope for sending the transcripts.
• A disclosure notice to be placed in each student’s file, indicating that a copy of his or her transcript was released to Mathematica Policy Research as an agent to the U.S. Department of Education.
3. Follow-Up Procedures
For schools that did not respond to our initial request for transcripts, we mailed another
request for student transcripts. These mailings were done periodically as we tracked the schools
that had not yet sent the requested transcripts and corrected requests that contained errors.
As the targeted end date for collecting transcripts approached, interviewers started calling
schools directly to inquire about the status of our requests. Many schools responded to these
calls by faxing us the requested transcripts. When the school indicated that they could not
59 Students were asked to provide the name and state of each secondary and postsecondary school they
attended, but sometimes misspellings or incomplete information resulted in some invalid requests for student transcripts as schools were matched with an incorrect address and transcripts were requested from the wrong school. When a school indicated that they could not fill a request because they had no record of the student whose transcript we requested, it was sometimes due to such mismatches. In these cases, we attempted to learn the correct name and address of the school where the student was enrolled and make a new transcript request.

H-8
provide one or more of the requested transcripts, the interviewer completed a problem sheet
indicating the reason. The reason generally fell into one of the following categories:
• The student was never enrolled at the school according to the school’s records. When this occurred, our first response was to call the school and provide more information on the student (e.g., provide or verify date of birth and dates of attendance) to see if a transcript could be located with additional information. In many cases, the school was able to locate and provide transcripts once additional information was provided. In other cases, the school provided some information that helped us determine where we might obtain the needed transcripts.60 When all other attempts to locate the student’s transcript failed, we tried to contact the student directly to verify his or her enrollment at the school. If we were unable to reach the student and the school had no record of the student having ever attended, we finally marked the case as an invalid request. When we did reach the student and the student confirmed the information in the database, we would call the school again to ask them to check their records, providing any additional information that might help them locate the transcript. Typically, after we called the school again and confirmed the student’s attendance dates, the transcript was located and sent.
• Transcripts were held by the school district. Some schools only held the transcripts of currently enrolled students and all other transcripts were sent to the school district. In this situation, the school would sometimes forward the request packet to the district. Other times, the school returned the materials to us, and we sent them to the school district.
• The student transferred to another school. When the student had transferred to another school, a transcript was requested from the school to which the student had transferred. In some cases, the registrar or school secretary forwarded the request materials to the transfer school. In other cases, the request materials were sent back to us and we sent a new request to the transfer school.
60 For example, some school principals and registrars indicated that their school was often confused with
another school having the same or a similar name and suggested that we direct our request to the other school. In this case, we would call the alternate school to find out if the student was ever enrolled there. If so, we made a correction to the database and sent a request to the newly identified school.

H-9
• The school would not release any transcript without student’s written consent. Many schools returned the transcript request materials with no transcripts, indicating that they required written consent from each student whose transcript we were requesting. A problem sheet was completed for these cases, and they were forwarded to the survey manager for follow-up. As a first step, the survey manager called the school to explain that, as an agent of the Department of Education, Mathematica Policy Research was authorized to collect student transcripts for the purposes of this study and that, according to the laws of FERPA, schools are permitted to release student transcripts to the Department of Education without the written consent of students participating in the study. It was also explained that students had given verbal consent over the telephone or written consent when they completed the mail survey, and that we did not request transcripts for any students who refused consent. Some schools agreed to send the requested transcripts upon hearing this explanation. Others reiterated that signed consent was required by school policy. In this case, we sent written consent forms to the students for them to sign and return to Mathematica so that we could obtain their student transcript for the impact study. A $10 check and a postage-paid return envelope were included with the form as an incentive to complete and return it. Several students did sign and return the consent form, but many of the letters came back unopened because we no longer had a valid address for the student.
• The school would not release transcripts without advance payment. In these cases, we sent a check to cover the cost of each transcript, along with a list of the students whose transcripts we were requesting.
• The school would not release a transcript until the student paid an outstanding debt. In some cases we were eventually able to obtain these transcripts as students paid whatever bills they owed the school. When the debt remained unpaid, however, there was no way we could get the transcript. These cases were marked as unfilled requests.
4. Reimbursements
When reimbursement forms were returned to us with student transcripts, we sent checks to
the schools requesting reimbursement and a list of the students whose transcripts we received.
Not all schools requested reimbursement for the transcripts. In all, 741 checks were issued
totaling $5,397.
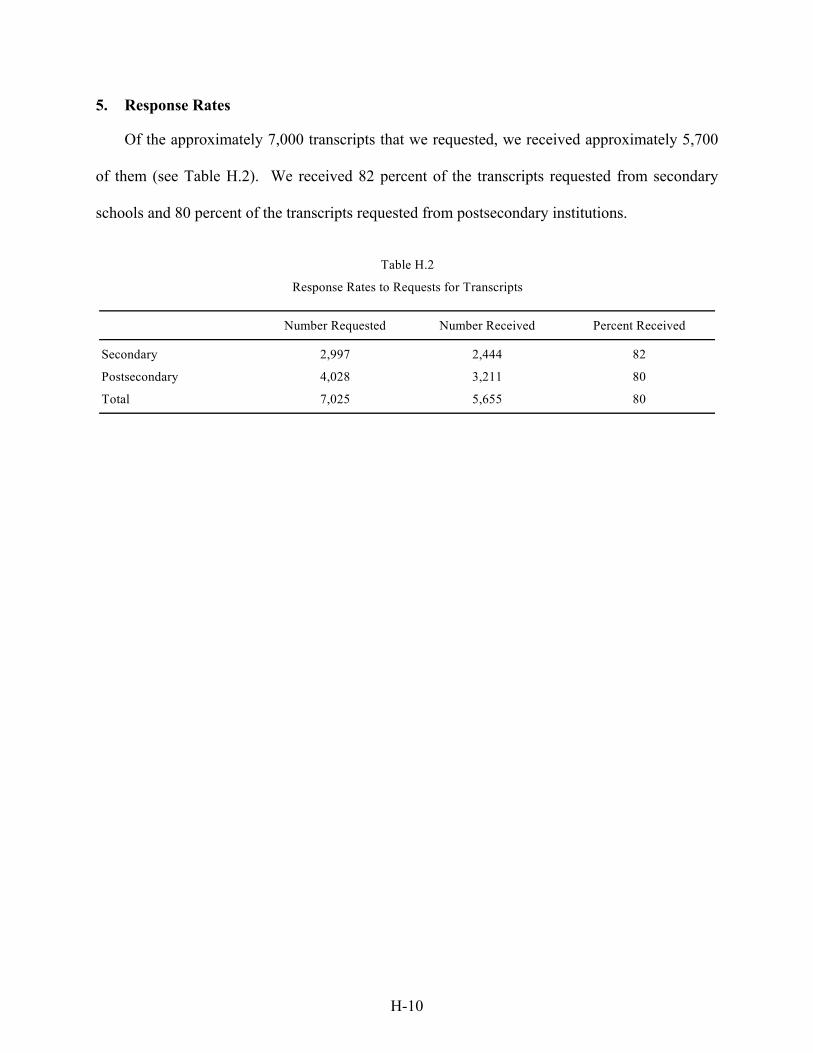
H-10
5. Response Rates
Of the approximately 7,000 transcripts that we requested, we received approximately 5,700
of them (see Table H.2). We received 82 percent of the transcripts requested from secondary
schools and 80 percent of the transcripts requested from postsecondary institutions.
Number Requested Number Received Percent Received
Secondary 2,997 2,444 82
Postsecondary 4,028 3,211 80
Total 7,025 5,655 80
Table H.2
Response Rates to Requests for Transcripts

APPENDIX I
SAMPLE SIZES AND STANDARD ERRORS FOR REPORTED IMPACT ESTIMATES


I-3
CreditsTotal 2,687 0.55 0.65
Total Core 2,687 0.41 0.49Math 2,687 0.08 0.09Science 2,687 0.10 0.11English 2,687 0.12 0.15Social Studies 2,687 0.08 0.10Foreign Language 2,687 0.07 0.08
Computer Science 2,687 0.03 0.04Vocational 2,687 0.09 0.11
Advanced Placement and Honors CreditsTotal 2,687 0.25 0.30
Total Core 2,687 0.26 0.32Math 2,687 0.06 0.07Science 2,687 0.07 0.09English 2,687 0.08 0.10Social Studies 2,687 0.05 0.06Foreign Language 2,687 0.01 0.01
Overall Grade Point Average 2,673 0.09 0.10
High School Status (%)Graduated 2,291 3.57 4.18Still in high school 2,291 0.38 0.44Dropped out 2,291 1.96 2.29General Educational Development (GED) 2,291 1.75 2.05
Source: hs-overall.log† The standard error of the estimated impact of being offered the opportunity to participate in Upward Bound (see Chapter I, Section B, Subsection 3).‡ The standard error of the estimated impact of actually participating in Upward Bound (see Chapter I, Section B, Subsection 3).
Standard Error † Standard Error ‡
Table 1.1
Sample Sizes and Standard Errors for Reported Impact Estimates: Table II.5
All Students Participants
Sample Size

CreditsTotal 1,994 0.86 467 1.22 1.05 1.51
Total Core 1,994 0.60 467 0.90 0.72 1.11Math 1,994 0.10 467 0.21 0.12 0.26Science 1,994 0.16 467 0.19 0.20 0.24English 1,994 0.14 467 0.28 0.18 0.33Social Studies 1,994 0.10 467 0.22 0.12 0.27Foreign Language 1,994 0.11 467 0.17 0.13 0.22
Computer Science 1,994 0.06 467 0.11 0.07 0.14Vocational 1,994 0.12 467 0.30 0.16 0.37
Advanced Placement and Honors CreditsTotal 1,994 0.39 467 0.43 0.48 0.57
Total Core 1,994 0.39 467 0.41 0.49 0.54Math 1,994 0.05 467 0.03 0.07 0.04Science 1,994 0.11 467 0.10 0.13 0.13English 1,994 0.13 467 0.14 0.17 0.18Social Studies 1,994 0.09 467 0.17 0.12 0.22Foreign Language 1,994 0.01 467 0.02 0.02 0.02
Overall Grade Point Average 1,982 -0.09 465 0.14 -0.11 0.17
High School Status (%)Graduated 1,700 1.91 403 14.82 2.28 17.76Still in high school 1,700 0.20 403 1.12 0.24 1.33Dropped out 1,700 1.43 403 10.60 1.73 12.71General Educational Development (GED) 1,700 1.01 403 4.67 1.19 5.61
Source: hs-hiexp.log and hs-loexp.log† The standard error of the estimated impact of being offered the opportunity to participate in Upward Bound (see Chapter I, Section B, Subsection 3).‡ The standard error of the estimated impact of actually participating in Upward Bound (see Chapter I, Section B, Subsection 3).
All Students Participants
Higher
Table I.2
Sample Sizes and Standard Errors for Reported Impact Estimates: Table II.6
Lower
Std Error † Std Error ‡ Std Error ‡
Higher Expectations
Std Error †
Lower Expectations
Sample Size Sample Size
I-4

CreditsTotal 528 0.79 2,114 0.29 1.06 0.34
Total Core 528 0.54 2,114 0.24 0.72 0.28Math 528 0.12 2,114 0.05 0.16 0.06Science 528 0.10 2,114 0.05 0.13 0.06English 528 0.22 2,114 0.13 0.30 0.15Social Studies 528 0.13 2,114 0.05 0.18 0.06Foreign Language 528 0.08 2,114 0.04 0.10 0.05
Computer Science 528 0.14 2,114 0.04 0.19 0.05Vocational 528 0.18 2,114 0.06 0.23 0.07
Advanced Placement and Honors CreditsTotal 528 0.12 2,114 0.25 0.16 0.29
Total Core 528 0.10 2,114 0.25 0.14 0.30Math 528 0.02 2,114 0.06 0.03 0.07Science 528 0.03 2,114 0.07 0.03 0.08English 528 0.03 2,114 0.07 0.04 0.08Social Studies 528 0.05 2,114 0.05 0.06 0.06Foreign Language 528 0.01 2,114 0.01 0.01 0.02
Overall Grade Point Average 528 0.04 2,114 0.01 0.05 0.01
High School Status (%)Graduated 411 6.01 1,768 3.16 7.75 3.53Still in high school 411 1.05 1,768 0.38 1.34 0.43Dropped out 411 5.27 1,768 1.57 6.83 1.77General Educational Development (GED) 411 2.60 1,768 1.79 3.32 1.99
Source: hs-ar20hi.log and hs-ar20lo.log† The standard error of the estimated impact of being offered the opportunity to participate in Upward Bound (see Chapter I, Section B, Subsection 3).‡ The standard error of the estimated impact of actually participating in Upward Bound (see Chapter I, Section B, Subsection 3).
Std Error † Std Error ‡ Std Error ‡
Higher Academic Risk
Std Error †
Lower Academic Risk
Sample Size Sample Size
Higher Lower
All Students
Table I.3
Sample Sizes and Standard Errors for Reported Impact Estimates: Table II.7
Participants
I-5

CreditsTotal 2,133 0.56 411 1.01 143 1.34 0.66 1.42 1.41
Total Core 2,133 0.46 411 0.53 143 1.00 0.55 0.73 1.04Math 2,133 0.10 411 0.13 143 0.24 0.12 0.17 0.25Science 2,133 0.09 411 0.22 143 0.26 0.11 0.32 0.27English 2,133 0.13 411 0.14 143 0.32 0.15 0.18 0.33Social Studies 2,133 0.09 411 0.16 143 0.26 0.10 0.24 0.27Foreign Language 2,133 0.10 411 0.17 143 0.29 0.12 0.23 0.30
Computer Science 2,133 0.05 411 0.17 143 0.16 0.06 0.26 0.17Vocational 2,133 0.09 411 0.34 143 0.30 0.10 0.48 0.31
Advanced Placement and Honors CreditsTotal 2,133 0.35 411 0.38 143 0.66 0.42 0.54 0.70
Total Core 2,133 0.35 411 0.32 143 0.65 0.42 0.43 0.68Math 2,133 0.07 411 0.05 143 0.14 0.08 0.07 0.14Science 2,133 0.09 411 0.07 143 0.17 0.10 0.09 0.18English 2,133 0.11 411 0.14 143 0.26 0.14 0.20 0.28Social Studies 2,133 0.07 411 0.10 143 0.12 0.09 0.15 0.12Foreign Language 2,133 0.01 411 0.02 143 0.08 0.02 0.03 0.08
Overall Grade Point Average 2,122 -0.03 408 -0.12 143 0.40 0.11 0.13 0.14
High School Status (%)Graduated 1,801 3.73 362 3.61 128 3.68 4.38 4.37 3.91Still in high school 1,801 0.46 362 0.19 128 0.00 0.54 0.23 0.00Dropped out 1,801 2.01 362 2.95 128 1.88 2.37 3.60 1.99General Educational Development (GED) 1,801 1.91 362 1.31 128 3.26 2.24 1.56 3.48
Source: hs-lifg.log, hs-low_only.log, and hs-fgenonly.log† The standard error of the estimated impact of being offered the opportunity to participate in Upward Bound (see Chapter I, Section B, Subsection 3).‡ The standard error of the estimated impact of actually participating in Upward Bound (see Chapter I, Section B, Subsection 3).
Std Error ‡
FG Only LI OnlyLI and FG
Std Error ‡ Std Error ‡
Low-Inc. and First-Gen.
Std Error † Std Error †
First-Generation Only Low-Income Only
Sample Size Sample Size Sample SizeStd Error †
ParticipantsAll Students
Table I.4
Sample Sizes and Standard Errors for Reported Impact Estimates: Table D.1
I-6

CreditsTotal 1,143 0.68 761 0.38 503 0.71 0.89 0.46 0.80
Total Core 1,143 0.44 761 0.37 503 0.53 0.55 0.45 0.61Math 1,143 0.07 761 0.11 503 0.15 0.09 0.14 0.17Science 1,143 0.19 761 0.07 503 0.15 0.25 0.09 0.16English 1,143 0.10 761 0.10 503 0.19 0.13 0.13 0.22Social Studies 1,143 0.05 761 0.10 503 0.16 0.07 0.12 0.18Foreign Language 1,143 0.09 761 0.07 503 0.11 0.11 0.09 0.12
Computer Science 1,143 0.06 761 0.05 503 0.08 0.08 0.06 0.09Vocational 1,143 0.20 761 0.16 503 0.16 0.26 0.19 0.18
Advanced Placement and Honors CreditsTotal 1,143 0.16 761 0.14 503 0.86 0.19 0.17 0.94
Total Core 1,143 0.16 761 0.14 503 0.86 0.19 0.16 0.94Math 1,143 0.05 761 0.04 503 0.19 0.06 0.05 0.20Science 1,143 0.05 761 0.04 503 0.19 0.06 0.04 0.21English 1,143 0.08 761 0.06 503 0.21 0.10 0.07 0.23Social Studies 1,143 0.05 761 0.03 503 0.26 0.07 0.04 0.29Foreign Language 1,143 0.01 761 0.02 503 0.04 0.02 0.02 0.04
Overall Grade Point Average 1,139 -0.09 758 0.08 500 -0.01 0.11 0.06 0.20
High School Status (%)Graduated 962 2.94 672 2.67 415 5.55 3.50 3.28 6.32Still in high school 962 0.48 672 0.23 415 1.90 0.56 0.27 2.18Dropped out 962 1.72 672 2.53 415 3.19 2.01 3.02 3.63General Educational Development (GED) 962 1.47 672 3.05 415 2.74 1.81 3.66 3.16
Source: hs-black.log, hs-white.log, and hs-hisp.log† The standard error of the estimated impact of being offered the opportunity to participate in Upward Bound (see Chapter I, Section B, Subsection 3).‡ The standard error of the estimated impact of actually participating in Upward Bound (see Chapter I, Section B, Subsection 3).
Std Error ‡ Std Error ‡
Afr. Amer. White Hispanic
Sample Size Std Error ‡Std Error † Std Error †
Table I.5
Sample Sizes and Standard Errors for Reported Impact Estimates: Table D.2
Hispanic
ParticipantsAll Students
WhiteAfrican American
Std Error † Sample SizeSample Size
I-7

CreditsTotal 864 0.91 1,823 0.48 1.06 0.58
Total Core 864 0.58 1,823 0.41 0.67 0.49Math 864 0.13 1,823 0.09 0.16 0.10Science 864 0.11 1,823 0.10 0.13 0.13English 864 0.20 1,823 0.09 0.23 0.11Social Studies 864 0.13 1,823 0.08 0.15 0.10Foreign Language 864 0.08 1,823 0.08 0.10 0.10
Computer Science 864 0.07 1,823 0.03 0.08 0.04Vocational 864 0.15 1,823 0.11 0.18 0.14
Advanced Placement and Honors CreditsTotal 864 0.18 1,823 0.26 0.20 0.32
Total Core 864 0.15 1,823 0.28 0.17 0.36Math 864 0.06 1,823 0.05 0.08 0.07Science 864 0.05 1,823 0.08 0.05 0.10English 864 0.06 1,823 0.08 0.07 0.10Social Studies 864 0.05 1,823 0.07 0.06 0.09Foreign Language 864 0.01 1,823 0.02 0.01 0.02
Overall Grade Point Average 864 0.06 1,809 -0.05 0.07 -0.07
High School Status (%)Graduated 699 5.67 1,592 3.67 6.52 4.35Still in high school 699 1.06 1,592 0.33 1.21 0.39Dropped out 699 2.45 1,592 2.26 2.82 2.68General Educational Development (GED) 699 3.80 1,592 1.54 4.38 1.83
Source: hs-male.log and hs-female.log† The standard error of the estimated impact of being offered the opportunity to participate in Upward Bound (see Chapter I, Section B, Subsection 3).‡ The standard error of the estimated impact of actually participating in Upward Bound (see Chapter I, Section B, Subsection 3).
Males FemalesMales Females
All Students Participants
Table I.6
Sample Sizes and Standard Errors for Reported Impact Estimates: Table D.3
Std Error ‡ Std Error ‡Sample Size Std Error † Sample Size Std Error †
I-8

CreditsTotal 264 1.02 1,011 0.58 1,403 0.53 1.21 0.70 0.62
Total Core 264 0.73 1,011 0.49 1,403 0.39 0.87 0.59 0.46Math 264 0.17 1,011 0.10 1,403 0.08 0.19 0.12 0.10Science 264 0.18 1,011 0.15 1,403 0.08 0.21 0.19 0.09English 264 0.21 1,011 0.15 1,403 0.12 0.25 0.18 0.14Social Studies 264 0.31 1,011 0.08 1,403 0.09 0.37 0.10 0.11Foreign Language 264 0.15 1,011 0.09 1,403 0.08 0.18 0.11 0.10
Computer Science 264 0.25 1,011 0.05 1,403 0.05 0.28 0.06 0.06Vocational 264 0.20 1,011 0.16 1,403 0.09 0.25 0.21 0.10
Advanced Placement and Honors CreditsTotal 264 0.42 1,011 0.20 1,403 0.21 0.50 0.24 0.25
Total Core 264 0.42 1,011 0.23 1,403 0.21 0.50 0.28 0.24Math 264 0.09 1,011 0.07 1,403 0.04 0.10 0.09 0.04Science 264 0.13 1,011 0.06 1,403 0.06 0.16 0.07 0.07English 264 0.11 1,011 0.08 1,403 0.07 0.14 0.10 0.08Social Studies 264 0.13 1,011 0.03 1,403 0.05 0.16 0.04 0.06Foreign Language 264 0.04 1,011 0.02 1,403 0.01 0.04 0.02 0.02
Overall Grade Point Average 263 0.02 1,009 -0.12 1,392 0.05 0.13 0.18 0.07
High School Status (%)Graduated 232 10.47 873 1.90 1,179 4.88 12.11 2.24 5.71Still in high school 232 0.00 873 0.46 1,179 0.66 0.00 0.54 0.76Dropped out 232 8.20 873 1.31 1,179 2.50 9.44 1.54 2.92General Educational Development (GED) 232 4.08 873 1.11 1,179 2.80 4.60 1.31 3.28
Source: hs-rating_h.log, hs-rating_m.log, and hs-rating_l.log† The standard error of the estimated impact of being offered the opportunity to participate in Upward Bound (see Chapter I, Section B, Subsection 3).‡ The standard error of the estimated impact of actually participating in Upward Bound (see Chapter I, Section B, Subsection 3).
Std Error ‡ Std Error ‡ Std Error ‡
Somewhat MostLeast
All Students Participants
Table I.7
Sample Sizes and Standard Errors for Reported Impact Estimates: Table D.4
Most Likely
Sample Size Sample Size Sample SizeStd Error † Std Error †Std Error †
Least Likely Somewhat Likely
I-9

I-10
Postsecondary School Status (%)Any postsecondary school 2,292 3.91 4.58Four-year college 2,292 2.67 3.13Two-year college 2,292 3.43 4.02Vocational school 2,292 1.38 1.62
Credits EarnedAll postsecondary schools 1,842 3.05 3.53
Nonremedial 1,842 3.34 3.87 Remedial 1,842 0.25 0.29 Other 1,842 0.62 0.71
Four-year colleges 1,842 2.16 2.50 Nonremedial 1,842 2.41 2.79 Remedial 1,842 0.17 0.19 Other 1,842 0.61 0.70
Two-year colleges 1,842 2.06 2.37 Nonremedial 1,842 1.87 2.15 Remedial 1,842 0.25 0.28 Other 1,842 0.03 0.04
Vocational schools 1,842 0.56 0.65 Nonremedial 1,842 0.51 0.59 Remedial 1,842 0.01 0.02 Other 1,842 0.10 0.12
Source: pst-overall.log† The standard error of the estimated impact of being offered the opportunity to participate in Upward Bound (see Chapter I, Section B, Subsection 3).‡ The standard error of the estimated impact of actually participating in Upward Bound (see Chapter I, Section B, Subsection 3).
Standard Error † Standard Error ‡
Table I.8
Sample Sizes and Standard Errors for Reported Impact Estimates: Table III.1
All Students Participants
Sample Size

I-11
Postsecondary School Status (%)Any postsecondary school 2,292 4.93 5.78Four-year college 2,292 3.39 3.97Two-year college 2,292 3.22 3.77Vocational school 2,292 1.09 1.28
Credits EarnedAll postsecondary schools 2,292 2.96 3.46
Nonremedial 2,292 3.14 3.68 Remedial 2,292 0.20 0.24 Other 2,292 0.47 0.55
Four-year colleges 2,292 2.20 2.56 Nonremedial 2,292 2.37 2.76 Remedial 2,292 0.15 0.17 Other 2,292 0.46 0.53
Two-year colleges 2,292 1.66 1.95 Nonremedial 2,292 1.54 1.81 Remedial 2,292 0.15 0.18 Other 2,292 0.03 0.03
Vocational schools 2,292 0.43 0.50 Nonremedial 2,292 0.39 0.45 Remedial 2,292 0.01 0.01 Other 2,292 0.09 0.11
Source: pst2-overall.log† The standard error of the estimated impact of being offered the opportunity to participate in Upward Bound (see Chapter I, Section B, Subsection 3).‡ The standard error of the estimated impact of actually participating in Upward Bound (see Chapter I, Section B, Subsection 3).
Standard Error † Standard Error ‡
Table I.9
Sample Sizes and Standard Errors for Reported Impact Estimates: Table III.2
All Students Participants
Sample Size

Postsecondary School Status (%)Any postsecondary school 1,701 2.71 403 11.67 3.15 13.99Four-year college 1,701 3.31 403 8.92 3.84 10.66Two-year college 1,701 2.43 403 12.07 2.90 14.56Vocational school 1,701 2.22 403 1.33 2.67 1.59
Credits EarnedAll postsecondary schools 1,331 3.73 344 4.02 4.33 4.84
Nonremedial 1,331 3.73 344 6.35 4.33 7.78 Remedial 1,331 0.27 344 0.25 0.31 0.30 Other 1,331 0.34 344 4.97 0.39 6.14
Four-year colleges 1,331 2.70 344 3.51 3.12 4.23 Nonremedial 1,331 2.85 344 4.28 3.29 5.19 Remedial 1,331 0.26 344 0.08 0.30 0.10 Other 1,331 0.32 344 4.97 0.37 6.14
Two-year colleges 1,331 2.18 344 2.60 2.53 3.18 Nonremedial 1,331 1.95 344 2.61 2.26 3.20 Remedial 1,331 0.29 344 0.25 0.33 0.30 Other 1,331 0.04 344 0.00 0.05 0.00
Vocational schools 1,331 0.49 344 1.81 0.57 2.20 Nonremedial 1,331 0.43 344 1.80 0.50 2.19 Remedial 1,331 0.02 344 0.03 0.02 0.03 Other 1,331 0.12 344 0.02 0.14 0.03
Source: pst-hiexp.log and pst-loexp.log† The standard error of the estimated impact of being offered the opportunity to participate in Upward Bound (see Chapter I, Section B, Subsection 3).‡ The standard error of the estimated impact of actually participating in Upward Bound (see Chapter I, Section B, Subsection 3).
Std Error ‡ Std Error ‡
Higher Expectations Higher
Sample Size Sample Size Std Error †
Lower Expectations Lower
Std Error †
Sample Sizes and Standard Errors for Reported Impact Estimates: Table III.3
Table I.10
All Students Participants
I-12

Postsecondary School Status (%)Any postsecondary school 1,701 4.57 403 10.36 5.38 12.38Four-year college 1,701 4.60 403 8.43 5.41 10.10Two-year college 1,701 2.51 403 10.12 2.96 12.16Vocational school 1,701 1.48 403 1.21 1.77 1.45
Credits EarnedAll postsecondary schools 1,701 3.61 403 4.59 4.27 5.53
Nonremedial 1,701 3.56 403 3.71 4.20 4.45 Remedial 1,701 0.24 403 0.21 0.28 0.25 Other 1,701 0.26 403 3.44 0.30 4.15
Four-year colleges 1,701 2.82 403 4.29 3.32 5.19 Nonremedial 1,701 2.83 403 2.22 3.33 2.64 Remedial 1,701 0.19 403 0.11 0.22 0.13 Other 1,701 0.23 403 3.44 0.27 4.15
Two-year colleges 1,701 1.79 403 2.37 2.13 2.83 Nonremedial 1,701 1.67 403 2.36 1.98 2.82 Remedial 1,701 0.16 403 0.18 0.19 0.22 Other 1,701 0.04 403 0.00 0.04 0.00
Vocational schools 1,701 0.45 403 1.21 0.53 1.44 Nonremedial 1,701 0.40 403 1.20 0.48 1.43 Remedial 1,701 0.01 403 0.03 0.01 0.03 Other 1,701 0.11 403 0.02 0.13 0.02
Source: pst2-hiexp.log and pst2-loexp.log† The standard error of the estimated impact of being offered the opportunity to participate in Upward Bound (see Chapter I, Section B, Subsection 3).‡ The standard error of the estimated impact of actually participating in Upward Bound (see Chapter I, Section B, Subsection 3).
Std Error ‡ Std Error ‡
Higher Expectations Higher
Sample Size Sample Size Std Error †
Lower Expectations Lower
Std Error †
Sample Sizes and Standard Errors for Reported Impact Estimates: Table III.4
Table I.11
All Students Participants
I-13
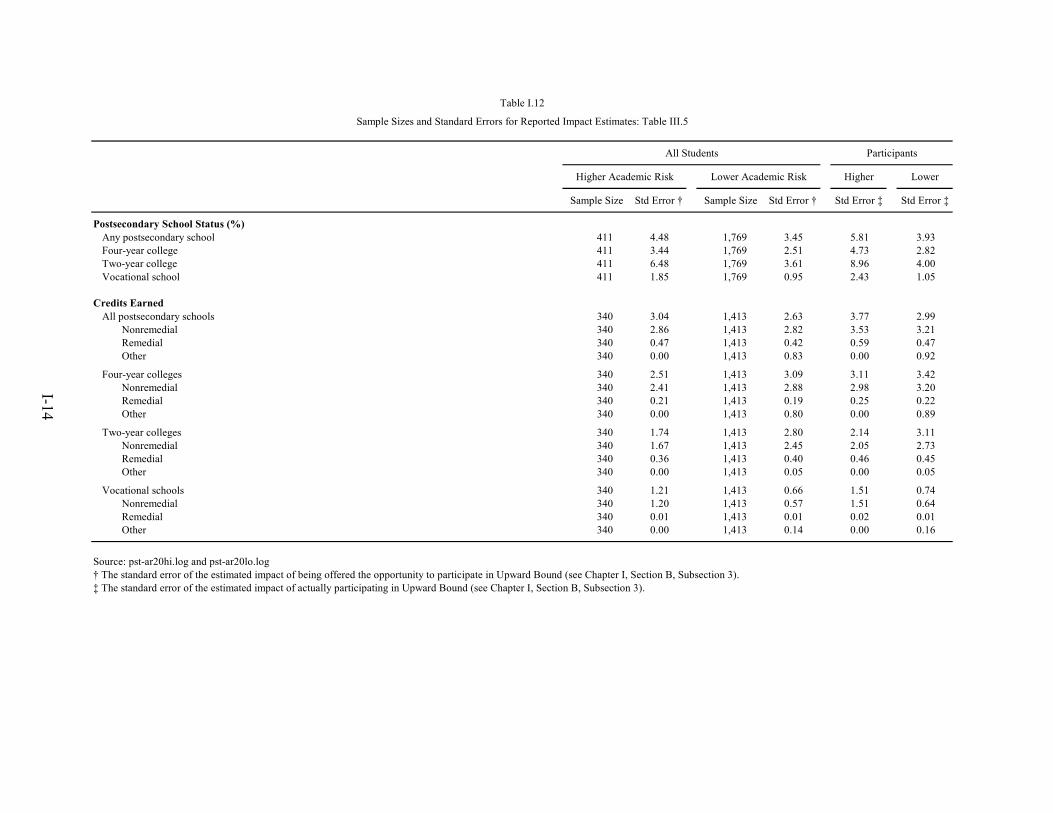
Postsecondary School Status (%)Any postsecondary school 411 4.48 1,769 3.45 5.81 3.93Four-year college 411 3.44 1,769 2.51 4.73 2.82Two-year college 411 6.48 1,769 3.61 8.96 4.00Vocational school 411 1.85 1,769 0.95 2.43 1.05
Credits EarnedAll postsecondary schools 340 3.04 1,413 2.63 3.77 2.99
Nonremedial 340 2.86 1,413 2.82 3.53 3.21 Remedial 340 0.47 1,413 0.42 0.59 0.47 Other 340 0.00 1,413 0.83 0.00 0.92
Four-year colleges 340 2.51 1,413 3.09 3.11 3.42 Nonremedial 340 2.41 1,413 2.88 2.98 3.20 Remedial 340 0.21 1,413 0.19 0.25 0.22 Other 340 0.00 1,413 0.80 0.00 0.89
Two-year colleges 340 1.74 1,413 2.80 2.14 3.11 Nonremedial 340 1.67 1,413 2.45 2.05 2.73 Remedial 340 0.36 1,413 0.40 0.46 0.45 Other 340 0.00 1,413 0.05 0.00 0.05
Vocational schools 340 1.21 1,413 0.66 1.51 0.74 Nonremedial 340 1.20 1,413 0.57 1.51 0.64 Remedial 340 0.01 1,413 0.01 0.02 0.01 Other 340 0.00 1,413 0.14 0.00 0.16
Source: pst-ar20hi.log and pst-ar20lo.log† The standard error of the estimated impact of being offered the opportunity to participate in Upward Bound (see Chapter I, Section B, Subsection 3).‡ The standard error of the estimated impact of actually participating in Upward Bound (see Chapter I, Section B, Subsection 3).
Std Error ‡ Std Error ‡Std Error †
Higher Academic Risk
Sample Size Sample Size Std Error †
Lower Academic Risk Higher Lower
Sample Sizes and Standard Errors for Reported Impact Estimates: Table III.5
Table I.12
All Students Participants
I-14

Postsecondary School Status (%)Any postsecondary school 411 6.90 1,769 3.45 9.09 3.95Four-year college 411 3.16 1,769 3.04 4.17 3.46Two-year college 411 7.26 1,769 3.02 9.75 3.38Vocational school 411 0.79 1,769 1.53 1.00 1.70
Credits EarnedAll postsecondary schools 411 2.73 1,769 2.28 3.49 2.57
Nonremedial 411 2.63 1,769 2.46 3.38 2.77 Remedial 411 0.27 1,769 0.26 0.34 0.29 Other 411 0.00 1,769 0.62 0.00 0.68
Four-year colleges 411 1.65 1,769 2.56 2.10 2.84 Nonremedial 411 1.50 1,769 2.44 1.92 2.73 Remedial 411 0.23 1,769 0.18 0.29 0.21 Other 411 0.00 1,769 0.59 0.00 0.66
Two-year colleges 411 1.99 1,769 2.02 2.53 2.25 Nonremedial 411 1.95 1,769 1.85 2.50 2.06 Remedial 411 0.27 1,769 0.21 0.35 0.24 Other 411 0.00 1,769 0.04 0.00 0.04
Vocational schools 411 0.84 1,769 0.56 1.10 0.64 Nonremedial 411 0.84 1,769 0.49 1.10 0.55 Remedial 411 0.01 1,769 0.01 0.01 0.01 Other 411 0.00 1,769 0.13 0.00 0.15
Source: pst2-ar20hi.log and pst2-ar20lo.log† The standard error of the estimated impact of being offered the opportunity to participate in Upward Bound (see Chapter I, Section B, Subsection 3).‡ The standard error of the estimated impact of actually participating in Upward Bound (see Chapter I, Section B, Subsection 3).
Std Error ‡ Std Error ‡Std Error †
Higher Academic Risk
Sample Size Sample Size Std Error †
Lower Academic Risk Higher Lower
Sample Sizes and Standard Errors for Reported Impact Estimates: Table III.6
Table I.13
All Students Participants
I-15

Postsecondary School Status (%)Any postsecondary school 1,802 4.69 362 3.67 128 8.01 5.50 4.43 8.76Four-year college 1,802 3.19 362 6.30 128 10.73 3.75 7.78 11.39Two-year college 1,802 3.89 362 7.77 128 8.81 4.59 9.44 9.46Vocational school 1,802 1.21 362 1.83 128 3.46 1.43 2.26 3.68
Credits EarnedAll postsecondary schools 1,453 2.93 292 5.94 97 12.85 3.42 7.22 14.05
Nonremedial 1,453 3.11 292 5.95 97 12.42 3.63 7.28 13.48 Remedial 1,453 0.24 292 0.67 97 0.57 0.29 0.78 0.63 Other 1,453 0.59 292 0.75 97 1.96 0.68 0.86 2.14
Four-year colleges 1,453 2.72 292 5.92 97 12.54 3.18 6.82 13.67 Nonremedial 1,453 2.89 292 5.99 97 12.19 3.37 6.89 13.17 Remedial 1,453 0.23 292 0.55 97 0.58 0.27 0.63 0.65 Other 1,453 0.56 292 0.75 97 1.96 0.66 0.86 2.14
Two-year colleges 1,453 1.34 292 4.50 97 4.74 1.57 5.28 5.21 Nonremedial 1,453 1.21 292 4.36 97 4.74 1.42 5.13 5.21 Remedial 1,453 0.21 292 0.34 97 0.28 0.25 0.40 0.30 Other 1,453 0.04 292 0.08 97 0.00 0.05 0.09 0.00
Vocational schools 1,453 0.71 292 0.39 97 1.51 0.83 0.46 1.65 Nonremedial 1,453 0.65 292 0.39 97 1.51 0.76 0.46 1.65 Remedial 1,453 0.02 292 0.00 97 0.00 0.02 0.00 0.00 Other 1,453 0.13 292 0.00 97 0.00 0.15 0.00 0.00
Source: pst-lifg.log, pst-low_only.log, and pst-fgenonly.log† The standard error of the estimated impact of being offered the opportunity to participate in Upward Bound (see Chapter I, Section B, Subsection 3).‡ The standard error of the estimated impact of actually participating in Upward Bound (see Chapter I, Section B, Subsection 3).
Sample Size Std Error †
Low-Inc. and First Gen. LI and FG
Sample Size Std Error †
FG Only LI Only
Sample Size Std Error ‡
First-Generation Only Low-Income Only
Std Error ‡Std Error † Std Error ‡
Table I.14
Sample Sizes and Standard Errors for Reported Impact Estimates: Table III.7
ParticipantsAll Students
I-16

Postsecondary School Status (%)Any postsecondary school 1,802 5.25 362 6.04 128 10.05 6.16 7.49 10.72Four-year college 1,802 2.98 362 6.71 128 11.09 3.51 8.47 11.60Two-year college 1,802 3.44 362 7.88 128 8.56 4.05 9.58 9.20Vocational school 1,802 0.52 362 2.73 128 3.46 0.61 3.34 3.68
Credits EarnedAll postsecondary schools 1,802 2.78 362 6.16 128 9.33 3.27 7.37 9.81
Nonremedial 1,802 2.88 362 6.11 128 8.92 3.39 7.29 9.36 Remedial 1,802 0.19 362 0.61 128 1.05 0.22 0.74 1.10 Other 1,802 0.41 362 0.59 128 1.47 0.49 0.72 1.57
Four-year colleges 1,802 2.12 362 5.40 128 8.85 2.49 6.41 9.32 Nonremedial 1,802 2.19 362 5.32 128 8.41 2.57 6.28 8.84 Remedial 1,802 0.15 362 0.56 128 1.09 0.17 0.68 1.14 Other 1,802 0.39 362 0.59 128 1.47 0.46 0.72 1.57
Two-year colleges 1,802 1.45 362 3.75 128 3.18 1.70 4.57 3.42 Nonremedial 1,802 1.35 362 3.67 128 3.15 1.59 4.48 3.39 Remedial 1,802 0.15 362 0.24 128 0.25 0.18 0.29 0.27 Other 1,802 0.03 362 0.06 128 0.00 0.04 0.07 0.00
Vocational schools 1,802 0.50 362 0.37 128 1.02 0.58 0.44 1.09 Nonremedial 1,802 0.44 362 0.37 128 1.02 0.51 0.44 1.09 Remedial 1,802 0.01 362 0.00 128 0.00 0.01 0.00 0.00 Other 1,802 0.11 362 0.00 128 0.00 0.14 0.00 0.00
Source: pst2-lifg.log, pst2-low_only.log, and pst2-fgenonly.log† The standard error of the estimated impact of being offered the opportunity to participate in Upward Bound (see Chapter I, Section B, Subsection 3).‡ The standard error of the estimated impact of actually participating in Upward Bound (see Chapter I, Section B, Subsection 3).
Sample Size Std Error †
Low-Inc. and First Gen. LI and FG
Sample Size Std Error †
FG Only LI Only
Sample Size Std Error ‡
First-Generation Only Low-Income Only
Std Error ‡Std Error † Std Error ‡
Table I.15
Sample Sizes and Standard Errors for Reported Impact Estimates: Table III.8
ParticipantsAll Students
I-17

Postsecondary School Status (%)Any postsecondary school 962 3.85 673 3.70 415 6.16 4.63 4.64 7.10Four-year college 962 3.11 673 4.95 415 5.12 3.64 5.92 5.86Two-year college 962 4.17 673 4.66 415 5.05 5.15 5.62 5.70Vocational school 962 1.82 673 0.64 415 1.57 2.25 0.79 1.79
Credits EarnedAll postsecondary schools 742 4.23 560 3.69 344 4.53 4.80 4.38 5.06
Nonremedial 742 4.50 560 3.51 344 4.41 5.09 4.16 4.89 Remedial 742 0.26 560 0.54 344 0.70 0.30 0.63 0.78 Other 742 0.70 560 0.19 344 0.49 0.79 0.22 0.55
Four-year colleges 742 4.10 560 3.13 344 5.30 4.67 3.67 5.64 Nonremedial 742 4.36 560 3.09 344 5.34 4.95 3.62 5.67 Remedial 742 0.30 560 0.41 344 0.57 0.34 0.48 0.65 Other 742 0.68 560 0.19 344 0.38 0.78 0.22 0.42
Two-year colleges 742 1.17 560 2.48 344 4.04 1.33 3.13 4.49 Nonremedial 742 1.09 560 2.38 344 3.83 1.23 3.01 4.27 Remedial 742 0.20 560 0.31 344 0.31 0.22 0.37 0.34 Other 742 0.06 560 0.01 344 0.00 0.07 0.01 0.00
Vocational schools 742 0.89 560 0.48 344 1.58 1.02 0.57 1.82 Nonremedial 742 0.80 560 0.48 344 1.57 0.91 0.57 1.80 Remedial 742 0.03 560 0.00 344 0.02 0.03 0.00 0.02 Other 742 0.18 560 0.00 344 0.18 0.20 0.00 0.20
Source: pst-black.log, pst-white.log, and pst-hisp.log† The standard error of the estimated impact of being offered the opportunity to participate in Upward Bound (see Chapter I, Section B, Subsection 3).‡ The standard error of the estimated impact of actually participating in Upward Bound (see Chapter I, Section B, Subsection 3).
Std Error ‡ Std Error ‡Sample Size Std Error † Sample Size Std Error †Std Error † Sample Size Std Error ‡
Afr. Amer. White HispanicAfrican American HispanicWhite
Participants
Table I.16
Sample Sizes and Standard Errors for Reported Impact Estimates: Table III.9
All Students
I-18

Postsecondary School Status (%)Any postsecondary school 962 8.64 673 4.13 415 5.50 10.43 5.13 6.08Four-year college 962 5.48 673 4.44 415 4.44 6.53 5.30 4.90Two-year college 962 4.49 673 3.51 415 4.47 5.46 4.27 5.08Vocational school 962 0.70 673 0.70 415 2.92 0.83 0.85 3.28
Credits EarnedAll postsecondary schools 962 5.99 673 2.98 415 4.32 7.20 3.38 4.82
Nonremedial 962 6.04 673 2.87 415 4.25 7.27 3.25 4.73 Remedial 962 0.24 673 0.38 415 0.55 0.29 0.45 0.62 Other 962 0.52 673 0.13 415 0.40 0.62 0.15 0.45
Four-year colleges 962 4.99 673 3.43 415 3.80 5.97 4.10 4.07 Nonremedial 962 5.11 673 3.35 415 3.78 6.12 4.01 4.04 Remedial 962 0.23 673 0.33 415 0.48 0.27 0.39 0.55 Other 962 0.50 673 0.12 415 0.36 0.59 0.15 0.40
Two-year colleges 962 1.56 673 2.00 415 2.75 1.90 2.50 3.09 Nonremedial 962 1.40 673 1.94 415 2.69 1.70 2.43 3.02 Remedial 962 0.21 673 0.18 415 0.34 0.25 0.21 0.39 Other 962 0.05 673 0.01 415 0.00 0.06 0.01 0.00
Vocational schools 962 0.65 673 0.29 415 1.26 0.77 0.35 1.44 Nonremedial 962 0.57 673 0.29 415 1.24 0.67 0.35 1.42 Remedial 962 0.02 673 0.00 415 0.01 0.02 0.00 0.01 Other 962 0.16 673 0.00 415 0.07 0.20 0.00 0.08
Source: pst2-black.log, pst2-white.log, and pst2-hisp.log† The standard error of the estimated impact of being offered the opportunity to participate in Upward Bound (see Chapter I, Section B, Subsection 3).‡ The standard error of the estimated impact of actually participating in Upward Bound (see Chapter I, Section B, Subsection 3).
Std Error ‡ Std Error ‡Sample Size Std Error † Sample Size Std Error †Std Error † Sample Size Std Error ‡
Afr. Amer. White HispanicAfrican American HispanicWhite
Participants
Table I.17
Sample Sizes and Standard Errors for Reported Impact Estimates: Table III.10
All Students
I-19

Postsecondary School Status (%)Any postsecondary school 699 4.04 1,593 4.94 4.63 5.83Four-year college 699 3.48 1,593 3.40 3.98 4.02Two-year college 699 2.91 1,593 4.31 3.35 5.16Vocational school 699 1.11 1,593 1.81 1.27 2.16
Credits EarnedAll postsecondary schools 563 3.78 1,279 4.22 4.34 4.89
Nonremedial 563 3.69 1,279 4.51 4.23 5.23 Remedial 563 0.35 1,279 0.29 0.40 0.33 Other 563 0.75 1,279 0.74 0.86 0.86
Four-year colleges 563 3.23 1,279 3.07 3.70 3.58 Nonremedial 563 3.28 1,279 3.28 3.75 3.82 Remedial 563 0.28 1,279 0.21 0.32 0.25 Other 563 0.69 1,279 0.73 0.79 0.84
Two-year colleges 563 1.94 1,279 2.84 2.23 3.28 Nonremedial 563 1.93 1,279 2.66 2.22 3.08 Remedial 563 0.21 1,279 0.25 0.24 0.29 Other 563 0.02 1,279 0.05 0.02 0.06
Vocational schools 563 0.57 1,279 0.77 0.66 0.90 Nonremedial 563 0.36 1,279 0.76 0.41 0.89 Remedial 563 0.02 1,279 0.02 0.03 0.02 Other 563 0.29 1,279 0.04 0.33 0.04
Source: pst-male.log and pst-female.log† The standard error of the estimated impact of being offered the opportunity to participate in Upward Bound (see Chapter I, Section B, Subsection 3).‡ The standard error of the estimated impact of actually participating in Upward Bound (see Chapter I, Section B, Subsection 3).
Sample Sizes and Standard Errors for Reported Impact Estimates: Table III.11
Table I.18
All Students Participants
Std Error †
Females Females
Std Error † Std Error ‡ Std Error ‡
Males Males
Sample Size Sample Size
I-20

Postsecondary School Status (%)Any postsecondary school 699 4.90 1,593 5.45 5.63 6.44Four-year college 699 3.91 1,593 3.68 4.50 4.35Two-year college 699 3.73 1,593 3.74 4.27 4.45Vocational school 699 2.16 1,593 1.01 2.47 1.20
Credits EarnedAll postsecondary schools 699 3.75 1,593 4.09 4.29 4.86
Nonremedial 699 3.63 1,593 4.32 4.14 5.13 Remedial 699 0.33 1,593 0.23 0.37 0.27 Other 699 0.54 1,593 0.59 0.62 0.69
Four-year colleges 699 3.56 1,593 3.03 4.07 3.58 Nonremedial 699 3.53 1,593 3.22 4.04 3.80 Remedial 699 0.26 1,593 0.18 0.29 0.22 Other 699 0.45 1,593 0.57 0.52 0.68
Two-year colleges 699 1.55 1,593 2.26 1.79 2.69 Nonremedial 699 1.52 1,593 2.15 1.75 2.55 Remedial 699 0.18 1,593 0.17 0.21 0.20 Other 699 0.01 1,593 0.04 0.02 0.05
Vocational schools 699 0.76 1,593 0.56 0.86 0.66 Nonremedial 699 0.59 1,593 0.55 0.67 0.65 Remedial 699 0.02 1,593 0.01 0.02 0.01 Other 699 0.28 1,593 0.02 0.32 0.02
Source: pst2-male.log and pst2-female.log† The standard error of the estimated impact of being offered the opportunity to participate in Upward Bound (see Chapter I, Section B, Subsection 3).‡ The standard error of the estimated impact of actually participating in Upward Bound (see Chapter I, Section B, Subsection 3).
Sample Sizes and Standard Errors for Reported Impact Estimates: Table III.12
Table I.19
All Students Participants
Std Error †
Females Females
Std Error † Std Error ‡ Std Error ‡
Males Males
Sample Size Sample Size
I-21

Postsecondary School Status (%)Any postsecondary school 232 11.20 873 2.72 1,180 4.82 13.04 3.20 5.60Four-year college 232 9.29 873 4.12 1,180 3.35 10.90 4.85 3.87Two-year college 232 6.68 873 3.18 1,180 4.25 7.68 3.75 4.98Vocational school 232 0.75 873 2.62 1,180 0.79 0.88 3.09 0.92
Credits EarnedAll postsecondary schools 185 6.81 691 5.83 960 2.86 8.05 6.64 3.30
Nonremedial 185 6.66 691 6.03 960 2.93 7.84 6.87 3.38 Remedial 185 0.43 691 0.37 960 0.45 0.50 0.42 0.52 Other 185 0.37 691 0.36 960 1.06 0.43 0.42 1.22
Four-year colleges 185 8.68 691 5.40 960 2.54 9.77 6.17 2.91 Nonremedial 185 8.59 691 5.53 960 2.71 9.64 6.31 3.12 Remedial 185 0.25 691 0.33 960 0.20 0.30 0.38 0.23 Other 185 0.37 691 0.32 960 1.03 0.43 0.37 1.18
Two-year colleges 185 5.43 691 1.84 960 1.50 6.36 2.11 1.74 Nonremedial 185 5.21 691 1.87 960 1.28 6.12 2.13 1.48 Remedial 185 0.36 691 0.19 960 0.42 0.41 0.21 0.49 Other 185 0.00 691 0.07 960 0.04 0.00 0.08 0.05
Vocational schools 185 2.55 691 0.76 960 0.61 3.02 0.88 0.70 Nonremedial 185 2.55 691 0.75 960 0.48 3.02 0.87 0.55 Remedial 185 0.00 691 0.02 960 0.03 0.00 0.02 0.03 Other 185 0.00 691 0.08 960 0.20 0.00 0.09 0.23
Source: pst-rating_h.log, pst-rating_m.log, and pst-rating_l.log† The standard error of the estimated impact of being offered the opportunity to participate in Upward Bound (see Chapter I, Section B, Subsection 3).‡ The standard error of the estimated impact of actually participating in Upward Bound (see Chapter I, Section B, Subsection 3).
Somewhat
Std Error ‡Std Error ‡Std Error ‡Sample Size Sample Size Std Error †Std Error † Sample Size Std Error †
Least Likely
Participants
Table I.20
Sample Sizes and Standard Errors for Reported Impact Estimates: Table III.13
All Students
LeastSomewhat Likely Most Likely Most
I-22

Postsecondary School Status (%)Any postsecondary school 232 12.01 873 4.53 1,180 4.52 14.06 5.33 5.26Four-year college 232 8.89 873 5.49 1,180 3.26 10.52 6.47 3.77Two-year college 232 6.76 873 3.20 1,180 3.60 7.79 3.77 4.21Vocational school 232 1.54 873 2.37 1,180 0.52 1.76 2.79 0.60
Credits EarnedAll postsecondary schools 232 7.44 873 4.58 1,180 3.38 8.76 5.41 3.93
Nonremedial 232 7.22 873 4.55 1,180 3.59 8.52 5.36 4.19 Remedial 232 0.39 873 0.31 1,180 0.29 0.45 0.37 0.34 Other 232 0.40 873 0.23 1,180 0.87 0.46 0.27 1.02
Four-year colleges 232 6.08 873 4.37 1,180 2.55 7.07 5.16 2.96 Nonremedial 232 5.92 873 4.30 1,180 2.70 6.89 5.08 3.13 Remedial 232 0.30 873 0.26 1,180 0.20 0.34 0.31 0.23 Other 232 0.40 873 0.19 1,180 0.84 0.46 0.23 0.98
Two-year colleges 232 3.78 873 1.60 1,180 1.93 4.29 1.88 2.26 Nonremedial 232 3.58 873 1.56 1,180 1.72 4.07 1.83 2.02 Remedial 232 0.31 873 0.19 1,180 0.24 0.35 0.23 0.28 Other 232 0.00 873 0.06 1,180 0.03 0.00 0.07 0.03
Vocational schools 232 1.78 873 0.58 1,180 0.47 2.04 0.68 0.55 Nonremedial 232 1.78 873 0.57 1,180 0.36 2.04 0.68 0.42 Remedial 232 0.00 873 0.01 1,180 0.02 0.00 0.02 0.02 Other 232 0.00 873 0.03 1,180 0.17 0.00 0.03 0.20
Source: pst2-rating_h.log, pst2-rating_m.log, and pst2-rating_l.log† The standard error of the estimated impact of being offered the opportunity to participate in Upward Bound (see Chapter I, Section B, Subsection 3).‡ The standard error of the estimated impact of actually participating in Upward Bound (see Chapter I, Section B, Subsection 3).
Somewhat
Std Error ‡Std Error ‡Std Error ‡Sample Size Sample Size Std Error †Std Error † Sample Size Std Error †
Least Likely
Participants
Table I.21
Sample Sizes and Standard Errors for Reported Impact Estimates: Table III.14
All Students
LeastSomewhat Likely Most Likely Most
I-23
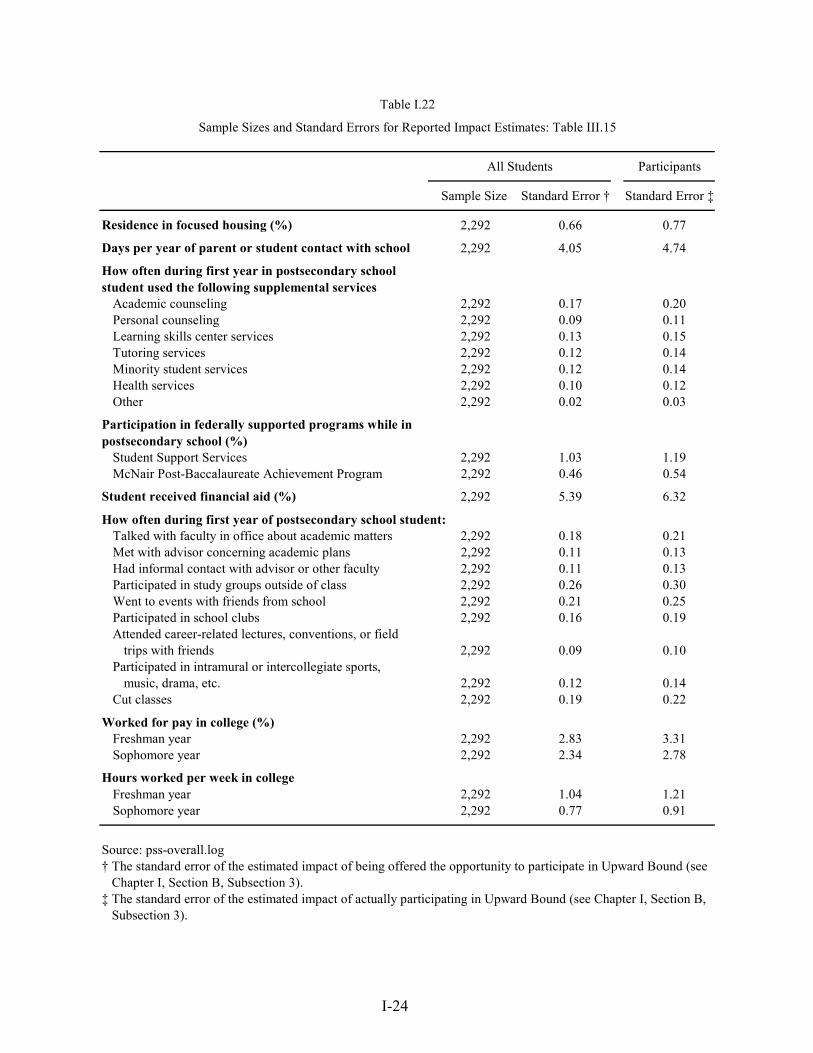
I-24
Residence in focused housing (%) 2,292 0.66 0.77
Days per year of parent or student contact with school 2,292 4.05 4.74
Academic counseling 2,292 0.17 0.20Personal counseling 2,292 0.09 0.11Learning skills center services 2,292 0.13 0.15Tutoring services 2,292 0.12 0.14Minority student services 2,292 0.12 0.14Health services 2,292 0.10 0.12Other 2,292 0.02 0.03
Student Support Services 2,292 1.03 1.19McNair Post-Baccalaureate Achievement Program 2,292 0.46 0.54
Student received financial aid (%) 2,292 5.39 6.32
Talked with faculty in office about academic matters 2,292 0.18 0.21Met with advisor concerning academic plans 2,292 0.11 0.13Had informal contact with advisor or other faculty 2,292 0.11 0.13Participated in study groups outside of class 2,292 0.26 0.30Went to events with friends from school 2,292 0.21 0.25Participated in school clubs 2,292 0.16 0.19Attended career-related lectures, conventions, or field
trips with friends 2,292 0.09 0.10Participated in intramural or intercollegiate sports,
music, drama, etc. 2,292 0.12 0.14Cut classes 2,292 0.19 0.22
Worked for pay in college (%)Freshman year 2,292 2.83 3.31Sophomore year 2,292 2.34 2.78
Hours worked per week in collegeFreshman year 2,292 1.04 1.21Sophomore year 2,292 0.77 0.91
Source: pss-overall.log† The standard error of the estimated impact of being offered the opportunity to participate in Upward Bound (see Chapter I, Section B, Subsection 3).‡ The standard error of the estimated impact of actually participating in Upward Bound (see Chapter I, Section B, Subsection 3).
How often during first year of postsecondary school student:
Standard Error ‡
Table I.22
Sample Sizes and Standard Errors for Reported Impact Estimates: Table III.15
All Students Participants
How often during first year in postsecondary school student used the following supplemental services
Participation in federally supported programs while in postsecondary school (%)
Sample Size Standard Error †

Residence in focused housing (%) 1,701 0.85 403 0.79 0.99 0.95
Days per year of parent or student contact with school 1,701 3.23 403 19.67 3.80 23.56
Academic counseling 1,701 0.26 403 0.33 0.31 0.40Personal counseling 1,701 0.09 403 0.17 0.11 0.20Learning skills center services 1,701 0.13 403 0.22 0.15 0.26Tutoring services 1,701 0.11 403 0.24 0.13 0.29Minority student services 1,701 0.17 403 0.18 0.20 0.22Health services 1,701 0.13 403 0.11 0.16 0.13Other 1,701 0.01 403 0.04 0.02 0.05
Student Support Services 1,701 1.48 403 2.09 1.71 2.49McNair Post-Baccalaureate Achievement Program 1,701 0.71 403 1.44 0.85 1.74
Student received financial aid (%) 1,701 4.06 403 11.86 4.81 14.23
How often during first year of postsecondary school student:Talked with faculty in office about academic matters 1,701 0.23 403 0.41 0.28 0.49Met with advisor concerning academic plans 1,701 0.15 403 0.29 0.17 0.35Had informal contact with advisor or other faculty 1,701 0.19 403 0.36 0.23 0.43Participated in study groups outside of class 1,701 0.30 403 0.31 0.36 0.37Went to events with friends from school 1,701 0.28 403 0.34 0.33 0.41Participated in school clubs 1,701 0.29 403 0.31 0.35 0.37Attended career-related lectures, conventions, or field
trips with friends 1,701 0.22 403 0.30 0.27 0.36Participated in intramural or intercollegiate sports,
music, drama, etc. 1,701 0.22 403 0.22 0.26 0.26Cut classes 1,701 0.16 403 0.43 0.19 0.51
Source: pss-hiexp.log and pss-loexp.log† The standard error of the estimated impact of being offered the opportunity to participate in Upward Bound (see Chapter I, Section B, Subsection 3).‡ The standard error of the estimated impact of actually participating in Upward Bound (see Chapter I, Section B, Subsection 3).
How often during first year in postsecondary school student used the following supplemental services
Participation in federally supported programs while in postsecondary school (%)
All Students
Std Error †
Lower
Sample Sizes and Standard Errors for Reported Impact Estimates: Table E.1
Lower Expectations
Table I.23
Std Error ‡ Std Error ‡
Higher Expectations Higher
Std Error †Sample SizeSample Size
Participants
I-25

Residence in focused housing (%) 411 0.81 1,769 0.86 1.02 0.97
Days per year of parent or student contact with school 411 8.28 1,769 4.61 10.57 5.22
Academic counseling 411 0.22 1,769 0.13 0.27 0.15Personal counseling 411 0.17 1,769 0.10 0.23 0.11Learning skills center services 411 0.19 1,769 0.16 0.24 0.18Tutoring services 411 0.17 1,769 0.16 0.22 0.17Minority student services 411 0.05 1,769 0.13 0.06 0.15Health services 411 0.09 1,769 0.11 0.11 0.13Other 411 0.02 1,769 0.03 0.03 0.03
Student Support Services 411 3.11 1,769 1.23 3.95 1.39McNair Post-Baccalaureate Achievement Program 411 0.53 1,769 0.53 0.65 0.60
Student received financial aid (%) 411 9.76 1,769 3.02 13.07 3.43
How often during first year of postsecondary school student:Talked with faculty in office about academic matters 411 0.40 1,769 0.18 0.52 0.20Met with advisor concerning academic plans 411 0.19 1,769 0.12 0.24 0.13Had informal contact with advisor or other faculty 411 0.23 1,769 0.13 0.30 0.14Participated in study groups outside of class 411 0.23 1,769 0.24 0.30 0.27Went to events with friends from school 411 0.25 1,769 0.14 0.32 0.16Participated in school clubs 411 0.23 1,769 0.12 0.29 0.13Attended career-related lectures, conventions, or field
trips with friends 411 0.17 1,769 0.10 0.22 0.11Participated in intramural or intercollegiate sports,
music, drama, etc. 411 0.15 1,769 0.10 0.20 0.12Cut classes 411 0.33 1,769 0.15 0.44 0.16
Source: pss-ar20hi.log and pss-ar20lo.log† The standard error of the estimated impact of being offered the opportunity to participate in Upward Bound (see Chapter I, Section B, Subsection 3).‡ The standard error of the estimated impact of actually participating in Upward Bound (see Chapter I, Section B, Subsection 3).
How often during first year in postsecondary school student used the following supplemental services
Participation in federally supported programs while in postsecondary school (%)
Std Error †Sample Size
Sample Sizes and Standard Errors for Reported Impact Estimates: Table E.2
Table I.24
All Students Participants
Std Error ‡ Std Error ‡Std Error †
Higher Academic Risk
Sample Size
Lower Academic Risk Higher Lower
I-26

Residence in focused housing (%) 1,802 0.64 362 2.15 128 3.79 0.75 2.60 4.04
Days per year of parent or student contact with school 1,802 3.74 362 8.52 128 12.39 4.38 10.37 13.31
Academic counseling 1,802 0.17 362 0.34 128 0.33 0.20 0.41 0.36Personal counseling 1,802 0.09 362 0.17 128 0.36 0.10 0.21 0.39Learning skills center services 1,802 0.13 362 0.24 128 0.40 0.15 0.28 0.43Tutoring services 1,802 0.12 362 0.26 128 0.45 0.14 0.32 0.48Minority student services 1,802 0.10 362 0.38 128 0.46 0.12 0.46 0.50Health services 1,802 0.09 362 0.21 128 0.46 0.10 0.25 0.50Other 1,802 0.01 362 0.13 128 0.05 0.01 0.16 0.05
Student Support Services 1,802 1.00 362 3.90 128 5.08 1.16 4.68 5.47McNair Post-Baccalaureate Achievement Program 1,802 0.55 362 1.68 128 0.00 0.64 2.01 0.00
Student received financial aid (%) 1,802 5.78 362 5.62 128 9.89 6.79 6.88 10.64
How often during first year of postsecondary school student:Talked with faculty in office about academic matters 1,802 0.19 362 0.42 128 0.51 0.22 0.53 0.54Met with advisor concerning academic plans 1,802 0.13 362 0.25 128 0.47 0.15 0.31 0.50Had informal contact with advisor or other faculty 1,802 0.14 362 0.24 128 0.42 0.16 0.29 0.46Participated in study groups outside of class 1,802 0.22 362 0.60 128 0.42 0.25 0.75 0.44Went to events with friends from school 1,802 0.27 362 0.38 128 0.52 0.32 0.46 0.56Participated in school clubs 1,802 0.16 362 0.45 128 0.51 0.19 0.54 0.57Attended career-related lectures, conventions, or field
trips with friends 1,802 0.11 362 0.25 128 0.55 0.12 0.30 0.62Participated in intramural or intercollegiate sports, 1,802 0.34 0.65
music, drama, etc. 0.17 362 0.28 128 0.59 0.20Cut classes 1,802 0.17 362 0.57 128 0.55 0.19 0.71 0.59
Source: pss-lifg.log, pss-low_only.log, and pss-fgenonly.log† The standard error of the estimated impact of being offered the opportunity to participate in Upward Bound (see Chapter I, Section B, Subsection 3).‡ The standard error of the estimated impact of actually participating in Upward Bound (see Chapter I, Section B, Subsection 3).
Std Error ‡Sample Size Sample Size Std Error †Std Error †
How often during first year in postsecondary school student used the following supplemental services
Participation in federally supported programs while in postsecondary school (%)
Sample Size Std Error ‡
All Students
Std Error †
Participants
Low-Inc. and First-Gen. LI & FG FG Only LI OnlyLow-Income OnlyFirst-Generation Only
Std Error ‡
Sample Sizes and Standard Errors for Reported Impact Estimates: Table E.3
Table I.25
I-27

Residence in focused housing (%) 962 1.33 673 0.50 415 1.13 1.56 0.62 1.32
Days per year of parent or student contact with school 962 4.49 673 6.34 415 7.12 5.32 7.88 8.05
Academic counseling 962 0.22 673 0.21 415 0.15 0.26 0.25 0.17Personal counseling 962 0.09 673 0.16 415 0.17 0.11 0.19 0.19Learning skills center services 962 0.14 673 0.23 415 0.22 0.17 0.28 0.25Tutoring services 962 0.15 673 0.25 415 0.34 0.17 0.29 0.37Minority student services 962 0.14 673 0.06 415 0.21 0.16 0.07 0.24Health services 962 0.16 673 0.15 415 0.13 0.19 0.18 0.15Other 962 0.01 673 0.03 415 0.06 0.02 0.03 0.07
Student Support Services 962 1.81 673 1.79 415 1.82 2.10 2.04 2.10McNair Post-Baccalaureate Achievement Program 962 0.89 673 0.35 415 0.60 1.06 0.42 0.68
Student received financial aid (%) 962 5.75 673 3.15 415 10.36 6.99 4.04 11.82
How often during first year of postsecondary school student:Talked with faculty in office about academic matters 962 0.23 673 0.30 415 0.32 0.28 0.36 0.35Met with advisor concerning academic plans 962 0.16 673 0.19 415 0.24 0.19 0.23 0.27Had informal contact with advisor or other faculty 962 0.16 673 0.24 415 0.21 0.19 0.30 0.24Participated in study groups outside of class 962 0.30 673 0.26 415 0.32 0.36 0.30 0.36Went to events with friends from school 962 0.25 673 0.16 415 0.41 0.30 0.19 0.47Participated in school clubs 962 0.26 673 0.13 415 0.23 0.31 0.17 0.26Attended career-related lectures, conventions, or field
trips with friends 962 0.21 673 0.14 415 0.31 0.26 0.17 0.34Participated in intramural or intercollegiate sports, 962 0.15 0.25
music, drama, etc. 0.20 673 0.13 415 0.22 0.24Cut classes 962 0.22 673 0.27 415 0.34 0.26 0.32 0.39
Source: pss-black.log, pss-white.log, and pss-hisp.log† The standard error of the estimated impact of being offered the opportunity to participate in Upward Bound (see Chapter I, Section B, Subsection 3).‡ The standard error of the estimated impact of actually participating in Upward Bound (see Chapter I, Section B, Subsection 3).
Participation in federally supported programs while in postsecondary school (%)
Sample Size Std Error ‡ Std Error ‡Std Error †Sample Size
Table I.26
Sample Sizes and Standard Errors for Reported Impact Estimates: Table E.4
Std Error †
How often during first year in postsecondary school student used the following supplemental services
Std Error ‡
African American
All Students Participants
Afr Amer WhiteWhite Hispanic
Sample Size Std Error †
Hispanic
I-28

Residence in focused housing (%) 699 1.14 1,593 0.81 1.34 0.94
Days per year of parent or student contact with school 699 6.60 1,593 5.29 7.57 6.25
Academic counseling 699 0.26 1,593 0.23 0.29 0.27Personal counseling 699 0.17 1,593 0.09 0.20 0.10Learning skills center services 699 0.25 1,593 0.13 0.28 0.16Tutoring services 699 0.29 1,593 0.12 0.33 0.14Minority student services 699 0.12 1,593 0.18 0.14 0.21Health services 699 0.09 1,593 0.13 0.10 0.15Other 699 0.01 1,593 0.03 0.01 0.04
Student Support Services 699 1.95 1,593 1.36 2.24 1.58McNair Post-Baccalaureate Achievement Program 699 0.68 1,593 0.55 0.79 0.65
Student received financial aid (%) 699 4.08 1,593 6.68 4.69 7.94
How often during first year of postsecondary school student:Talked with faculty in office about academic matters 699 0.25 1,593 0.19 0.29 0.23Met with advisor concerning academic plans 699 0.18 1,593 0.13 0.20 0.15Had informal contact with advisor or other faculty 699 0.21 1,593 0.11 0.24 0.13Participated in study groups outside of class 699 0.30 1,593 0.29 0.34 0.35Went to events with friends from school 699 0.24 1,593 0.26 0.27 0.30Participated in school clubs 699 0.19 1,593 0.20 0.21 0.24Attended career-related lectures, conventions, or field
trips with friends 699 0.15 1,593 0.11 0.18 0.13Participated in intramural or intercollegiate sports,
music, drama, etc. 699 0.23 1,593 0.14 0.27 0.16Cut classes 699 0.20 1,593 0.27 0.23 0.32
Source: pss-male.log and pss-female.log† The standard error of the estimated impact of being offered the opportunity to participate in Upward Bound (see Chapter I, Section B, Subsection 3).‡ The standard error of the estimated impact of actually participating in Upward Bound (see Chapter I, Section B, Subsection 3).
How often during first year in postsecondary school student used the following supplemental services
Participation in federally supported programs while in postsecondary school (%)
Males
Std Error † Std Error ‡Std Error ‡
Males Females
Std Error †Sample SizeSample Size
Females
Sample Sizes and Standard Errors for Reported Impact Estimates: Table E.5
Table I.27
All Students Participants
I-29

Residence in focused housing (%) 232 2.09 873 0.79 1,180 0.97 2.42 0.91 1.14
Days per year of parent or student contact with school 232 13.13 873 4.18 1,180 5.57 15.29 4.92 6.51
Academic counseling 232 0.41 873 0.23 1,180 0.19 0.47 0.27 0.22Personal counseling 232 0.32 873 0.14 1,180 0.09 0.37 0.17 0.10Learning skills center services 232 0.43 873 0.13 1,180 0.15 0.50 0.15 0.18Tutoring services 232 0.40 873 0.17 1,180 0.17 0.46 0.21 0.20Minority student services 232 0.44 873 0.14 1,180 0.09 0.51 0.16 0.10Health services 232 0.36 873 0.15 1,180 0.07 0.42 0.17 0.08Other 232 0.08 873 0.03 1,180 0.01 0.09 0.03 0.02
Student Support Services 232 2.34 873 1.46 1,180 1.69 2.70 1.72 1.96McNair Post-Baccalaureate Achievement Program 232 0.28 873 0.63 1,180 0.78 0.31 0.75 0.92
Student received financial aid (%) 232 10.37 873 4.04 1,180 6.53 12.26 4.75 7.63
How often during first year of postsecondary school student:Talked with faculty in office about academic matters 232 0.50 873 0.18 1,180 0.24 0.58 0.21 0.28Met with advisor concerning academic plans 232 0.44 873 0.15 1,180 0.16 0.49 0.18 0.19Had informal contact with advisor or other faculty 232 0.26 873 0.16 1,180 0.19 0.31 0.18 0.22Participated in study groups outside of class 232 0.51 873 0.50 1,180 0.24 0.59 0.58 0.28Went to events with friends from school 232 0.44 873 0.35 1,180 0.23 0.52 0.42 0.26Participated in school clubs 232 0.31 873 0.38 1,180 0.16 0.35 0.44 0.18Attended career-related lectures, conventions, or field
trips with friends 232 0.33 873 0.16 1,180 0.15 0.37 0.19 0.17Participated in intramural or intercollegiate sports, 232 0.20 0.30
music, drama, etc. 0.48 873 0.17 1,180 0.26 0.55Cut classes 232 0.34 873 0.28 1,180 0.18 0.39 0.33 0.20
Source: pss-rating_h.log, pss-rating_m.log, and pss-rating_l.log† The standard error of the estimated impact of being offered the opportunity to participate in Upward Bound (see Chapter I, Section B, Subsection 3).‡ The standard error of the estimated impact of actually participating in Upward Bound (see Chapter I, Section B, Subsection 3).
How often during first year in postsecondary school student used the following supplemental services
Table I.28
Sample Sizes and Standard Errors for Reported Impact Estimates: Table E.6
Participation in federally supported programs while in postsecondary school (%)
Sample Size
LeastLeast Likely
Sample Size Std Error † Std Error ‡Std Error † Std Error ‡Std Error ‡Sample Size
Somewhat Likely
Std Error †
MostSomewhatMost Likely
ParticipantsAll Students
I-30

I-31
Sample Size
Postsecondary School Status (%)Any postsecondary school 463 2.26Four-year college 463 3.36Two-year college 463 2.22Vocational school 463 1.72
Credits Earned (mean)All postsecondary schools 373 2.08Four-year colleges 373 2.55Two-year colleges 373 1.64Vocational schools 373 0.48
Source: means.log and out_imp.log† The standard error of the estimated impact of being offered the opportunity to participate in Upward Bound (see Chapter I, Section B, Subsection 3).
Standard Error †
Table I.29
Sample Sizes and Standard Errors for Reported Impact Estimates: Table IV.3
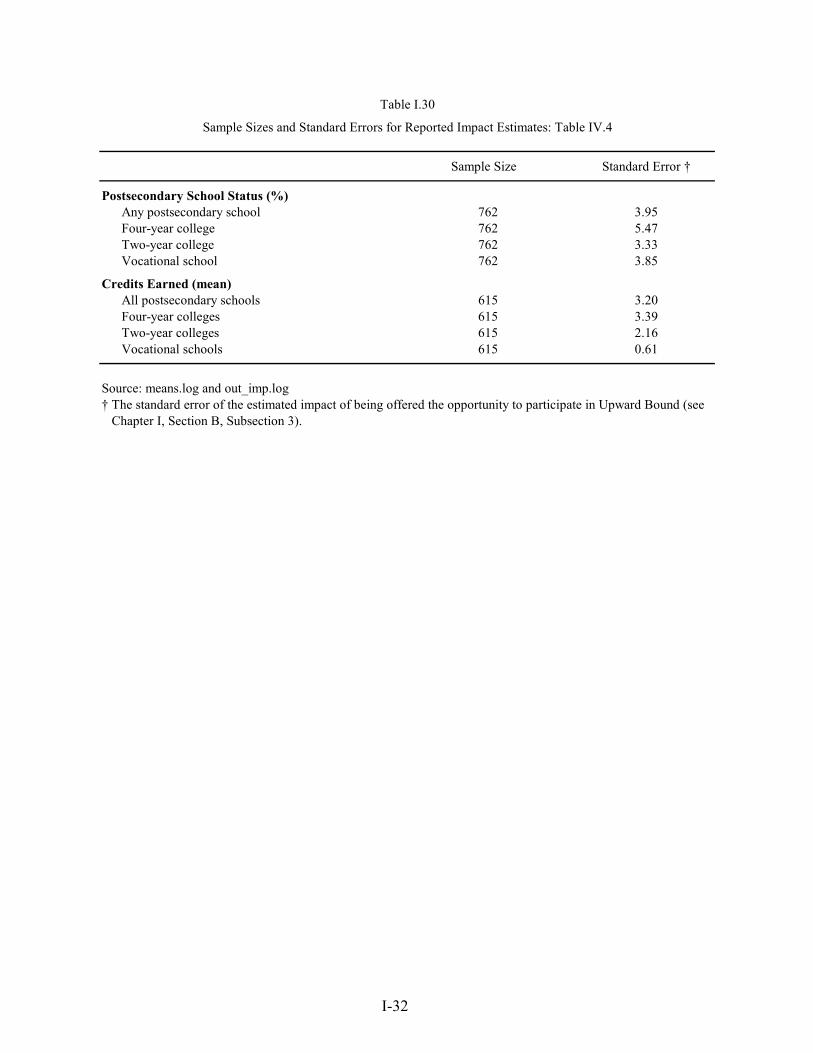
I-32
Sample Size
Postsecondary School Status (%)Any postsecondary school 762 3.95Four-year college 762 5.47Two-year college 762 3.33Vocational school 762 3.85
Credits Earned (mean)All postsecondary schools 615 3.20Four-year colleges 615 3.39Two-year colleges 615 2.16Vocational schools 615 0.61
Source: means.log and out_imp.log† The standard error of the estimated impact of being offered the opportunity to participate in Upward Bound (see Chapter I, Section B, Subsection 3).
Standard Error †
Table I.30
Sample Sizes and Standard Errors for Reported Impact Estimates: Table IV.4

I-33
Postsecondary School Status (%)Any postsecondary school 116 4.08 347 2.83Four-year college 116 4.15 347 4.09Two-year college 116 4.54 347 2.29Vocational school 116 0.76 347 1.83
Credits Earned (mean)All postsecondary schools 97 3.15 276 2.37Four-year colleges 97 3.11 276 2.44Two-year colleges 97 1.57 276 1.77Vocational schools 97 0.40 276 0.56
Source: means.log and out_imp.log† The standard error of the estimated impact of being offered the opportunity to participate in Upward Bound (see Chapter I, Section B, Subsection 3).
Table I.31
Sample Sizes and Standard Errors for Reported Impact Estimates: Table IV.5
Std Error †Sample Size
Higher Risk
Sample Size Std Error †
Lower Risk

I-34
Postsecondary School Status (%)Any postsecondary school 159 9.27 603 4.26Four-year college 159 10.19 603 6.58Two-year college 159 12.75 603 3.27Vocational school 159 3.34 603 4.60
Credits Earned (mean)All postsecondary schools 133 8.78 482 3.95Four-year colleges 133 9.45 482 4.22Two-year colleges 133 4.60 482 2.68Vocational schools 133 1.50 482 0.78
Source: means.log and out_imp.log† The standard error of the estimated impact of being offered the opportunity to participate in Upward Bound (see Chapter I, Section B, Subsection 3).
Table I.32
Sample Sizes and Standard Errors for Reported Impact Estimates: Table IV.6
Higher Risk Lower Risk
Sample Size Std Error † Sample Size Std Error †