the implementation of the senator paul simon water for the
TRANSCRIPT

International Housing Coalition1875 I Street NW, Suite 500Washington, D.C. 20006Phone: 202-408-8506; Fax: 202-429-9574Email [email protected]
www.intlhc.orgApril 2011
The Implementation of the Senator Paul Simon Water for the Poor Act2008-2010
prepared by Stephen W. Giddings

PREFACE
This report reviews and analyzes how funds used to implement the Senator Paul Simon Water
for the Poor Act have been used since FY 2008. The report seeks to determine the extent to
which the funding for the Water for the Poor Act has met the intent and objectives of the Act.
The report is based on a review of USAID and State Department reports, trips to three USAID
missions in Africa and discussions with USAID officials and water and sanitation advocacy
organizations and program implementers.
This study was sponsored by the International Housing Coalition (IHC). Stephen Giddings, a
consultant to the IHC and former USAID official, prepared the report. Nicole Weir of the IHC
made the field visits to Africa.
The IHC would like to thank the many people who provided information for the report or who
commented on drafts of the report. Nicole Weir and Anjali Bean of the IHC staff provided useful
comments and editorial suggestions at many stages of the preparation process. David Douglas
and John Oldfield of Water Advocates reviewed a draft of the report and offered many useful
and substantive comments. Discussions with Dan Deeley and James Franckiewicz of the USAID
Water Team helped the author and the IHC to understand USAID policy and program issues and
suggested refinements the data in the report. Paul Stimers of K& L Gates reviewed the text for
accuracy. The report was made possible by a grant from the Wallace Genetic Foundation.
The IHC believes that water and sanitation programs are crucial to the development of countries
in the developing world. These programs are particularly important to addressing the needs of
urban slum dwellers and the poor and can serve as critical elements of slum improvement
programs.
The IHC is a non-profit advocacy and education organization located in Washington D.C. that
supports “housing for all” and seeks to raise the priority of housing on the international
development agenda. The conditions of slums and the poor housing of slum dwellers are of
particular concern. The IHC supports the basic principles of private property rights, secure
tenure, effective title systems and efficient and equitable housing finance systems – all essential
elements to economic growth, civic stability and democratic values. To learn more about the
IHC, visit its website at www.intlhc.org.
Bob Dubinsky, President and CEO, International Housing Coalition

EXECUTIVE SUMMARY
Background
One of the fundamental goals of the Senator Paul Simon Water for the Poor Act of 2005 (P.L. 109-121)
(hereinafter referred to as the WFPA) was to make access to safe drinking water and adequate sanitation
for the poor a specific policy objective of U.S. foreign assistance. The Act also sought to enable the
U.S. government (USG), acting through the Department of State (DOS) and U.S. Agency for
International Development (USAID), to play a leadership role in achieving the Millennium
Development Goal (MDG) of halving the number of people without sustainable access to safe drinking
water and basic sanitation by 2015.
Recognizing that the role of safe drinking water and decent sanitation is critical to promoting sustainable
urban growth and development and to improving the lives of the urban poor, the International Housing
Coalition (IHC) conducted an analysis of the USG’s progress in meeting the important goals of the
legislation.
Major Findings
While there has been encouraging progress in the efforts of DOS and USAID to address some of the
goals of the WFPA, there are also a number of areas where results have been mixed or are difficult to
measure.
The WFPA and subsequent appropriations legislation have indeed put water and sanitation
programs for the poor much more solidly on the U.S. foreign assistance map than they were
prior to 2005. Congress and the Administration have shown strong support for water and
sanitation funding.
Funding for the WFPA has been substantial. Beginning in FY 2008, Congress issued
directives in appropriations acts requiring USAID to allocate minimum levels of funding for
activities that meet the purposes of the legislation: $300 million in FY 2008 and FY 2009 and
$315 million in FY 2010, totaling $915 million for the three years. USAID has met the directive
levels and in FY 2009 actually allocated an additional $144 million in funding beyond the
directive level for activities meeting the purposes of the WFPA.1
WFPA has become a significant USAID activity and has achieved important results. In FY
2010, USAID estimates that it allocated $344 million for water, sanitation, and hygiene (WASH)
activities meeting the purposes of the WFPA, again exceeding the minimum directive level. By
comparison, before the WFPA in FY 2005 USAID allocated just over $200 million for WASH
activities. Also in response to the WFPA, the proportion of funding for WASH to overall water
sector funding has risen from about 40% in FY 2003 to about 78% in FY 2009. USAID
estimates that in FY 2009, 6.4 million people gained first time access to an improved source of
drinking water and 3.4 million people gained first time access to an improved sanitation facility.
1 This was due in large measure to a supplemental appropriation for Pakistan, Jordan, West Bank/Gaza, and Afghanistan.

USAID has also continued to make progress in strengthening its capacity to design and
implement water and sanitation programs (although starting from a very low base). The
recent hiring of a USAID Global Water Coordinator is a very positive step. Additionally, since
2008, USAID has hired more than 30 new professionals who are working at least part time on
water and sanitation issues.
On the other hand, the most significant shortcoming, recognized by all of those who have
assessed the implementation of the WFPA, is the failure of the DOS to fulfill the
requirement of the legislation for the development of a comprehensive strategy for WASH
that includes measureable goals, benchmarks and timetables for implementation. This is
despite Secretary Clinton’s exhortation on World Water Day in 2010 to raise water and
sanitation issues to a new “higher level.” USAID’s recent completion of a “Framework for
Action” and a “Results Framework” for water and sanitation that identifies goals, objectives and
indicators, is a good start, but it is not a substitute for the robust and comprehensive U.S.
government strategy needed to sustain the momentum created by the WFPA.
The IHC analysis also confirms and amplifies the findings of a recent GAO Report2 that
while USAID has indeed targeted the majority of its efforts towards “high priority”
countries, the distribution of funding levels is not consistently related to country water and
sanitation needs. Furthermore, funding is not related to an objective analysis of whether or
not the assistance is expected to “make the greatest difference in promoting good health,
economic development, poverty reduction, women’s empowerment, conflict prevention and
environmental sustainability” as required in the legislation. This has resulted in just five
countries3 of strategic importance to U.S. interests, some with relatively low levels of need,
receiving 54% of total WASH funding in FY 2009 and fewer than 10 countries receiving two-
thirds of the FY 2010 allocations. The past three years have also witnessed the increasing use of
the funding account that supports U.S. strategic interests (the Economic Support Fund-ESF) to
meet the directive levels and the decreasing use of the account that supports countries with the
greatest needs (Development Assistance-DA).4
Other Findings
There is a need for more complete, accurate and disaggregated data on WASH funding and
results. Currently, there is no disaggregated information to verify if most USAID WASH
investments have benefitted the poor, women, and vulnerable groups, despite missions’ claims
that they target areas where the poor predominate.
It is also not possible to make a determination on whether the legislatively mandated balance
between WASH programs in rural, peri-urban and urban areas is being met, although anecdotal
information indicates that programs benefitting rural areas receive disproportionate emphasis.
Relatively little work appears to have been done in the area of policy reform.
Despite the increases in funding, water and sanitation programs have not succeeded in becoming
institutionalized as a priority sector for most USAID field missions. Should the congressional
directives not be continued, there is a risk that funding for the sector will decline relative to other
priorities.
2 Report to Congressional Requesters, US Water and Sanitation Aid, September, 2010
3 Jordan, West Bank/Gaza, Afghanistan, Sudan and Pakistan
4 The proportion of Economic Support Funding (ESF) to meet the directive levels increased from 34% in FY 2008 to more
than 50% in FY 2010 while the proportion from the Development Assistance (DA) account decreased from 52% to 38% over
the same period.

Many missions still lack the human resources and technical capacity to manage scaled up
programs in water and sanitation.
Improved results tracking and follow up are needed to determine whether or not the results of
water and sanitation investments are sustainable over time.
Major Recommendations
As soon as possible, DOS/USAID should complete a robust strategy for implementing the
WFPA that includes specific and measurable goals, benchmarks, and timetables to assess its
progress. Water and sanitation for the poor should also become an important component of the
joint DOS/USAID Strategic Plan.
DOS should clarify the basis for the designation of high priority countries and allocate resources
on the basis of the need of countries for water and sanitation and on an objective analysis of
where the funding is expected to make the greatest difference in promoting good health,
economic development, poverty reduction, women’s empowerment, conflict prevention, and
environmental sustainability.
The policy and practice of increasing the use of the ESF Account at the expense of the DA
Account to fund activities attributable to the WFPA should be changed.
Increased resources should be allocated to water and sanitation investments and programs in
urban and peri-urban areas where populations are growing most rapidly and where the results can
reach the greatest numbers of people.
WASH programming should be linked to other sector activities, initiatives, and policies as they
affect urban and peri-urban areas (e.g. Feed the Future, Global Climate Change, Global Health,
and the proposed new urban strategy).
USAID should verify that its investments in water and sanitation are sustainable through site
visits and/or surveys that confirm its prior year investments are indeed continuing to function as
planned two to three years later.
USAID should continue to increase its technical capacity at both headquarters and the field
levels to design and implement WASH programs (including urban WASH programs) in order to
institutionalize water and sanitation as a staple of the U.S. government foreign assistance
program, much as is the case for health, democracy and governance, food security, and private
sector development.
Other Recommendations
USAID should increase its efforts to provide policy level assistance to local and national
governments to scale up the impacts of its assistance.
USAID should make the water and sanitation sector a test case for the development of a model
methodology for performance management and for a meta-evaluation to help operationalize its
new evaluation policy.
To increase funding resources, greater use of USAID’s Development Credit Authority (DCA) to
finance water and sanitation investments should be encouraged.

1
I. Background
A. The Senator Paul Simon Water for the Poor Act of 2005
One of the most important goals of the Senator Paul Simon Water for the Poor Act of 2005 (P.L.
109-121) (hereinafter referred to as the WFPA) is to make access to safe water and sanitation a
specific policy objective of U.S. foreign assistance. To accomplish this, the agencies
implementing the foreign assistance program, primarily the Department of State (DOS) and the
U.S. Agency for International Development (USAID), needed to specifically recognize the
importance of water and sanitation sector as a key component in foreign assistance policy and
strategic planning documents. Furthermore, Congress needed to support the Act with adequate
resources to achieve its purposes.1 Two key policy documents are the joint DOS/USAID
Strategic Plan for 2007-2012 and the associated Foreign Assistance Framework (FAF); both
provide broad strategic guidance to U.S. government (USG) foreign assistance agencies.
Major recommendations of the WFPA that are analyzed in this paper include:
Assistance should be targeted to high priority countries;2
Assistance should promote access to improved water and sanitation for the very poor,
women and vulnerable groups in accordance with national poverty reduction
strategies;
Assistance should promote policy reform and strengthen the capacity of recipient
governments to expand and sustain access to safe water and sanitation;
Assistance should reflect a balance between urban, peri-urban and rural areas; and
Efforts should be made to leverage resources from the non-governmental and private
sectors.
Assistance should reflect a balance of grants, loans and guarantees
The WFPA also required that DOS develop a Water and Sanitation Strategy and required proper
monitoring of the Act to ensure that assistance reaches the intended targets and meets the
purpose of the Act.
B. Subsequent Appropriations Legislation
The WFPA is an authorization and not an appropriations act and as such, no specific
appropriation of funds to implement the act is made through it. No appropriations were made to
fund the WFPA until FY 2008.
In FY 2006, including disaster-related funding, but excluding Iraq, USAID obligated $289
million for water supply, sanitation and wastewater management. In FY 2007, this number fell
to $213 million (including disaster related funding) of which 26% went to just three countries
(Pakistan, Jordan, and the West Bank/Gaza) and 49% to Sub-Saharan Africa.
1 Prior to the WFPA, USAID obligations for water supply, sanitation, and wastewater management (excluding Iraq,
Afghanistan and disaster related assistance) totaled $160 million in FY 2003, $240 million in FY 2004 and $217
million in FY 2005. 2 Defined as countries that exhibit a great need for increased access to water and sanitation facilities and countries
where assistance is expected to make the greatest difference in promoting good health, economic development,
poverty reduction, women‘s empowerment, conflict prevention and environmental sustainability.

2
The FY 2008 Consolidated Appropriations Act directed that $300 million of appropriated funds
be made available for long term safe drinking water and sanitation supply projects only to
―implement the …WFPA.‖ This includes water management related to safe drinking water and
sanitation. The funding was to be directed towards high priority countries, pursuant to the
WFPA. The FY 2008 Appropriations Act further provided that $150 million of the total should
be from the ―Development Assistance‖ (DA) Account and that $125 million should be made
available to Sub-Saharan Africa. Finally, USAID was discouraged from using the International
Disaster Assistance (IDA) Account for long term water and sanitation projects.
It should be noted that the appropriations legislation did not increase the overall level of foreign
assistance funding by the amount of the water and sanitation directive. The legislation stated
merely that ―of the funds appropriated in this Act,‖ $300 million shall be made available for safe
drinking water and sanitation. This necessitated trade-offs with other programs not receiving
directives.
The FY 2009 Consolidated Appropriations Act directed that $300 million of appropriated funds
be made available for water and sanitation projects pursuant to the WFPA. Of the total, $125
million was to be made available for projects in Sub-Saharan Africa. No congressional intent
was expressed on the proportion of funding to be from the DA Account. The FY 2009
Appropriations Act also reiterated that funding should go to high priority countries and that
increasing access to safe drinking water should continue to be the highest priority. Finally, it
stipulated that up to $20 million should be made available for public-private partnerships,
particularly with non-governmental organizations (NGOs).
The FY 2010 Consolidated Appropriations Act directed that $315 million of the funds
appropriated be made available for long term safe water and sanitation projects pursuant to the
WFPA. In FY 2010, priority was again given to Sub-Saharan Africa although no specific
amount was noted, and there was no language related to the DA Account. Public-private
partnerships were not mentioned although university partnerships were encouraged. Priority was
again given to increasing access to safe drinking water and sanitation and USAID was
encouraged to obligate funds left from previous years ―in a timely manner.‖
In sum, over the three-year period FY 08-10, Congress has directed that $915 million in
appropriated funds be made available pursuant to the WFPA, that assistance be allocated to high
priority countries, and that priority be accorded to safe drinking water and sanitation programs.
New legislation, the Senator Paul Simon Water for the World Act, designed to strengthen the
Water for the Poor Act, was introduced in the 111th
Congress, with a goal of providing first time
access to safe water and sanitation to 100 million people in high priority countries over a six year
period. The legislation passed the Senate by unanimous consent but was not brought before the
House for a vote before the congressional session ended. It has recently been re-introduced into
the 112th
Congress.
3
II. Purpose of this Report
The purpose of this report is to assess the progress of the U.S. government in meeting the goals,
objectives, and targets of the Paul Simon Water for the Poor Act and subsequent Appropriations
Acts using existing data sources, reports, and selected interviews.3 The report also begins to
identify some best practices being employed by USAID missions to implement the WFPA. The
report deals primarily with USAID, as it is the principal implementer of the WFPA, and with the
DOS‘s leadership in providing strategic direction to the water and sanitation sector. However, it
will also note the contributions of the Millennium Challenge Corporation (MCC) in furthering
the USG commitment to improving water supply and sanitation services in developing countries.
It should be noted that, unless otherwise stated, this report focuses on funding attributed to the
WFPA, while recognizing that total obligations in the water and sanitation sector exceed those
directly attributable to the legislation.
This report also incorporates information gathered on a trip to Uganda, Kenya and Tanzania by
Nicole Weir of the IHC in July 2010 and from follow up interviews with several key advocates
of water related foreign assistance. Finally the report takes into account the findings of a
September 2010 Government Accountability Office (GAO) report on the U.S. government
implementation of the WFPA, which provides further information and analysis.
III. Key Findings
A. Development of a Comprehensive Water, Sanitation, and Hygiene Strategy The WFPA mandates the development of a comprehensive strategy for water, sanitation, and
hygiene. The strategy is to include: ―specific and measurable goals, timetables, and identified
resource needs to improve affordable and equitable access to safe water and sanitation; methods
to coordinate and integrate U.S. water and sanitation programs with other U.S. development
programs and with programs of other countries and an assessment of the commitments of
governments of countries that receive assistance to policies that support affordable and equitable
access to safe water and sanitation.‖
The 2010 assessment by CARE, WaterAid, and the Natural Resources Defense Council (NRDC)
of the DOS 2010 Water for the Poor Act Report to Congress concluded that ―despite being
mandated five years ago, there still is no comprehensive USG strategy for foreign assistance
related to WASH.‖ The assessment acknowledges that the 2008 ―Framework for Action‖ issued
by USAID and current USAID efforts to develop a ―Results Framework‖ with indicators for
measuring the impact of U.S. assistance to water and sanitation represent progress towards the
3 This interim report relies on data and information contained in the following documents: Department of State Annual Reports to Congress on the Water for the Poor Act from 2007-2010; 2008, 2009 and 2010 USAID Reports on Safeguarding the World’s Water; GAO Report to Congressional Requesters, U. S. Water and Sanitation Aid, September, 2010; WHO/UNICEF Progress Report on Sanitation and Drinking Water, 2010 Update; Addressing Water Challenges in the World: A Framework for Action, USAID 2009; USAID Bureau for Africa, Planned USAID Activities in Water, Sanitation and Hygiene to Meet the FY 08 and FY 09 Directives; USAID Guidance on Utilization of the FY 2008 Water Earmark; A series of reports by Earl Kessler in 2009 on specific USAID mission implemented water and sanitation activities; Table on FY 10 653(a) Water Earmark Allocations provided by USAID; Summary USAID Water Activities in Sub-Saharan Africa Meeting the Directive under the Senator Paul Simon Water for the Poor Act of 2005 FY 2009; Trip Report of Nicole Weir of the IHC on Uganda, Kenya and Tanzania.

4
development of a strategy but that nothing has been done to take the framework ―to the next
level‖ and develop it into a robust and comprehensive strategy.
One of the major findings of the 2010 GAO Report to Congressional Requesters is also that the
DOS has yet to develop a comprehensive water and sanitation strategy with ―specific and
measurable goals, benchmarks and timetables to assess its progress.‖4 Nor has it developed an
estimate for the funding required to achieve its objective.
There is scant evidence in any of the official reports and documents to indicate that much
progress has been made during the past year in developing such a comprehensive strategy. The
State Department‘s 2010 Water for the Poor Act Report to the Congress makes no mention that
such a strategy is being developed and notes only that: ―Previous reports to Congress on the
implementation of the WFPA have described in detail the U.S. government‘s goals, objectives,
and approaches to addressing international water challenges.‖ It goes on further to note: ―At the
same time, we are continuing to strengthen and expand the number of country-specific plans and
strategies.‖5
While individual country water and sanitation strategies are undoubtedly valuable and a step
forward, the lack of an overall U.S. government strategic approach and of a strong political
commitment from the White House is a serious policy shortcoming and begs the question of
whether DOS is indeed as serious about increasing the priority of water and sanitation issues as
its Annual Reports to Congress purport. This is particularly troublesome in light of the forceful
speech Secretary of State Clinton made on World Water day 2010 that elevated water and
sanitation issues to a new strategic level. The secretary charged the USAID Administrator and
the Under Secretary for Democracy and Global Affairs ―to review current efforts and identify
specific steps to strengthen the United States‘ capacity to deliver sustainable, measurable results.
This process is underway.‖6
A very positive step at USAID is the recent appointment of a senior level USAID Global Water
Coordinator ―responsible for coordinating the implementation of key water policy initiatives,
including USAID's water strategy, as well as related areas in the Presidential Policy Directive
(PPD) on Global Development, the Quadrennial Diplomacy and Development Review (QDDR),
USAID Forward, and the integration of the USAID water programs and policies with new
agency initiatives that are critically dependent on water (i.e. Feed the Future, Global Health, and
Global Climate Change).‖ The appointment of the Global Water Coordinator at USAID has re-
energized the process of developing a comprehensive strategy and expectations are that a draft
strategy will be ready for discussion with the public by the summer of 2011.
4 GAO Report to Congressional Requesters, U.S. Water and Sanitation Aid, p. 25.
5 U.S. Department of State, 2010 Water for the Poor Act Report to Congress, p.4.
6 Ibid., p. 4.

5
B. Overall USAID Funding Levels for Water, Sanitation and Hygiene.
The 2010 USAID Report Safeguarding the World’s Water and the 2010 State Department Report
to Congress note that overall USAID obligations7 for drinking water, sanitation and hygiene,
water resources management, water productivity, and disaster risk reduction have been
increasing steadily since FY 2007, the first year before the initial directive. The total water
sector obligations have increased from $263 million in FY 2007 to $489 million in FY 2008 and
finally to $630 million in FY 2009. This reflects obligations for the sector which go beyond
those attributable to the WFPA directives.
In FY 2009, USAID ―over-subscribed‖ the $300 million directive by allocating some $144
million in additional funding beyond the directive level for activities that meet the statutory
WFPA eligibility requirements. 8
However, it should be noted that $125 million of the additional
funding was allocated to just four countries (Pakistan, Jordan, West Bank/Gaza, and
Afghanistan) through two supplemental appropriations acts and that without the supplementals,
the allocations (estimated obligations) would have only slightly exceeded the statutory directive
levels. Although the definition of the directive expanded slightly in FY 2009 to permit greater
latitude to include some water productivity and water resource management activities, the large
majority (78%) of allocations meeting the directive levels remained as in the previous year
composed of water supply, sanitation and hygiene (WASH) activities.
When International Development Association (IDA) levels and Food for Peace (FFP) levels are
included, the data indicate that USAID budget allocations (estimated obligations) for WASH
increased from $389 million in FY 2008 to $493 million in FY 2009 – a healthy 26.7% increase.
Excluding FFP but including IDA (disaster assistance funding), USAID estimates for FY 2010
indicate that $460 million will be allocated to water, sanitation, and hygiene. FY 2010 IDA
assistance for WASH, some of which is counted towards the directive (the proportion
contributing towards sustainable development), was estimated at $101 million or 18% of total
sector wide assistance as compared to $91.4 million in FY 2008 and $98.9 million in FY 2009.
It is important to note that FFP is not to be attributed to meeting the directive and only a portion
of IDA funding—the portion that contributes to ―sustainable development‖—may be attributed
to the WFPA. 9
The data also indicate that the proportion of funding for drinking water supply, sanitation, and
hygiene as a percentage of total funding for the sector has remained fairly constant at around
80% over the period FY 2007-FY 2009. While the absolute levels of WASH funding do appear
to be increasing, the WFPA directives since FY 2008 do not seem to have had the effect of
increasing the proportion of total sector resources directed to WASH activities over the past three
years.
7 In the 2009 Report, USAID used the term ―estimated obligations‖ whereas in the 2010 report it changed the
terminology to ―budget allocations.‖ USAID has clarified that the terms mean the same thing, but the more recent
language more accurately describes the process. 8 This includes $383 million in water and sanitation funding from the Development Assistance, Economic Support
Funds (ESF) and Global Health Child Survival Accounts (GHCS) and $70.9 million from the disaster assistance
(IDA) account. 9 Table 4 indicates that $98.9 million in IDA obligations for water supply and sanitation were made in FY 2009, of
which $70.9 million went toward activities that provided ―sustainable‖ water supply and sanitation and met the 2009
statutory requirements.

6
It should be noted, nonetheless, that the proportion of overall sector-wide funding for WASH has
increased from just 40% in FY 2003 to about 78% in FY 2009 (including FFP and IDA
assistance). Estimated USAID FY 2010 allocations indicate that WASH represents about 83%
overall sector-wide funding (including IDA accounts). This represents an important re-set of
priorities over the period FY 2003-2009 toward an increased focus on water, sanitation, and
hygiene and the achievement of the Millennium Development Goal (MDG) to reduce by half the
population of the world without sustainable access to safe drinking water and basic sanitation by
2015.
Another encouraging trend is that the Administration itself has finally begun to acknowledge the
importance of water and sanitation as critical element in U.S. assistance policy by requesting
$302 million in the FY 2012 budget request to Congress for programs to address the WFPA.
The FY 2011 request level was $239.5 million. Although this is a bit below the $315 directive
levels of FY 2010 and 2011, it represents real progress and underscores that the Administration
is beginning to take much more seriously the need to increase its support for WASH
programming.
C. Targeting of Assistance to High Priority Countries
As noted above, the WFPA directs that assistance programs focus on high priority countries.
This designation includes both countries that exhibit a high need for increased access to
improved water and sanitation facilities and countries where the assistance is expected to make
the greatest difference in promoting good health, economic development, poverty reduction,
women’s empowerment, conflict prevention, and environmental sustainability. In addition, the
various Appropriations Acts have directed that a significant proportion of the WFPA funding
($125 million in FY 2008 and in FY 2009, no amount specified in FY 2010) be targeted to Sub-
Saharan Africa where most of the countries in greatest need are located. While objective and
verifiable criteria for determining levels of need for improved water supply and sanitation
facilities are generally accepted by the development community, determining countries where the
assistance can make the greatest difference to development outcomes is more subjective and
allows DOS and USAID the leeway to classify as ―high priority‖ countries which may be of
strategic interest to the USG, but exhibit relatively lower levels of need.
An examination of the country allocations confirms that DOS and USAID have indeed used this
flexibility to provide significant levels of funding to several ―high priority‖ countries of strategic
importance to the USG, but of relatively lower need without establishing quantifiable criteria for
determining how the funding would make the greatest difference in promoting good health,
economic development, poverty reduction, women‘s empowerment, conflict prevention, and
environmental sustainability. Thus, the designation of countries with relatively low levels of
need as high priority is not entirely transparent and allows for considerable subjective
interpretation by DOS/USAID.
The GAO report also noted that the designation of high priority countries is not ―consistently
associated with data on need for water and sanitation.‖ The criteria for State‘s designation of
high priority countries in FY 2008 and FY 2009 included (1) need for water and sanitation; (2)
conditions in the country that would support long-term sustainable results; (3) U.S. comparative
advantage (with respect to other donors); (4) opportunities to leverage funds; (5) consistency

7
with U.S. foreign policy objectives and (6) compliance with statutory directives that affect
foreign assistance allocations.10
However, the GAO Report found that USAID missions did not
identify the processes for recording and quantifying the specific factors considered or the relative
weights given these factors. The State Department also did not identify how it considered and
weighted the various factors.
In FY 2008, the USG identified 36 countries as ―high priority‖ (16 in Sub-Saharan Africa) and
reduced this list to 31 countries in FY 2009 (15 in Sub-Saharan Africa). Tables 2 and 2.2
demonstrate that generally speaking, the countries with the highest needs (i.e. the highest
percentage of populations lacking access to improved water and sanitation) are high priority
countries for WFPA funding and countries with low needs are not a high priority. There are,
nonetheless, some notable exceptions. Five of the 20 countries with the highest needs, all in sub-
Saharan Africa (Niger, Togo, Chad, Sierra Leone, and Eritrea) are not on the high priority list.
All of these are ―non-presence‖ counties without a USAID mission, although they may benefit
from regional programs. It is also noteworthy that more than 14% of the total FY 2009 WASH
investments in Sub-Saharan Africa were in Sudan, where the need is of course great, but where
U.S. strategic interests are also high.
Over the three-year period FY 2008-2010, Sub-Saharan Africa, arguably the most needy region
in the world in terms of water and sanitation deficits, has indeed received the largest proportional
directive allocation of WFPA funding, more than $345 million of the $944 million cumulative
amount allocated to meeting the statutory directive (36.5%).11
The total allocated by USAID to
Africa to meet the directive requirements has risen from $108.2 million in FY 2008 to $127
million in FY 2010 (excluding disaster related assistance).12
Conversely, three countries with very low need, Jordan, Lebanon, and West Bank/Gaza and one
with relatively low water need (although with a fairly high need for improved sanitation
facilities), Pakistan, all received substantial funding under the WFPA. Jordan, in fact, has been
the second largest recipient of WFPA funding (second to West Bank/Gaza), almost $ 120 million
in budget allocations from FY 2008-2010. Yet, just 4% of the population lacks access to an
improved drinking water source and 2% lacks access to an improved sanitation facility. Lebanon
has received almost $25 million over the same period yet 0% of the population lacks access to an
improved source of water and to an improved sanitation facility. Finally, 9% of the West
Bank/Gaza population lacks access to an improved water supply and 11% to improved sanitation
while the budget allocations for the country totaled $161.3 million from FY 2008-2010.13
However, in the Gaza area, USAID estimates that only 5 to 10% of the water supply is actually
clean enough to drink due to abysmal sewage disposal. Nonetheless, there would not appear to
be any objective and critical analysis for State/USAID‘s determination that providing substantial
funding to several of these ―high priority‖ countries would make the greatest difference in terms
10
Ibid., p.30. 11
Although the FY 2010 Congressional directive was $315 million, USAID has allocated $344 million in FY 2010
to meet the directive. The directive amounts in FY 2008 and FY 2009 were $300 million. 12
It is important to keep in mind the distinction between allocations to solely meet the directive requirement ($300
million in FY 2009) and the total budget allocations for water sanitation and hygiene that meet the statutory
eligibility requirements ($454 million in FY 2009). USAID significantly exceeded the directive level for water,
sanitation and hygiene in FY 2009. 13
This included $102.2 million in the FY 2009 Supplemental.

8
of development outcomes. These countries are, of course, of strategic importance to U.S.
interests.
Most of the water and sanitation funding for countries in the Middle East (as well as
Afghanistan) comes from the Economic Support Fund (ESF) account, which targets countries of
strategic importance to the United States. It should be noted that no funding attributed to the
WFPA has been allocated to Iraq from FY 2008-2010. An examination of the data reveals that
the proportion of overall water and sanitation funding14
(excluding IDA and nominal amounts
from Europe, Eurasia, and Central Asia) from the ESF account has been increasing steadily,
from $83.3 million in FY 2008 (34.2%) to $141.8 million in FY 2009 (48.4%) to $171.3 million
in FY 2010 (51.3%). Conversely, the proportion from the Development Assistance (DA) account
has been steadily decreasing from $126.8 million (52.2%) to $117.9 million in FY 2009 (40.3%)
to $129.7 million in FY 2010 (38.8%). The WFPA funding levels attributed to the Global
Health and Child Survival (GHCS) Account have remained fairly steady over the period at $33-
35 million.
The lifting of the FY 2008 directive on the use of the DA account obviously gave the USG the
latitude to allocate increased ESF funding to countries of strategic importance and not
necessarily to those in greatest need. Indeed, the four countries of Pakistan, Afghanistan, Jordan,
and the West Bank/Gaza, account for almost 38% of all funding allocated to meeting the
statutory requirements (including the supplementals) from FY 2008-FY 2010.
This is not to say that some of the countries receiving WFPA funding from the ESF account are
not needy—in fact Afghanistan and Sudan are among the neediest. Yet it does point to a trend
of increasing reliance on the more discretionary ESF account to meet the directive levels and a
continued shift in funding towards countries of strategic importance at the expense of countries
in greatest need.
The GAO report confirms this trend. From 2006-2009, total WASH obligations in the Middle
East almost tripled, from $59 million in FY 2006 to $177 million in FY 2009 while in Sub-
Saharan Africa they more than doubled (from $81 million to $167 million) and increased in Asia
by more than 300% (from $36 million to $114 million). Obligations decreased slightly over the
same period in Latin America and the Caribbean and in Europe and Eurasia.15
As noted above, the USG has been discouraged by Congress from using the IDA account to meet
the requirements of the water and sanitation directives. However, USAID and the State
Department have determined that a certain proportion of IDA funding contributes to ―sustainable
development‖ and ―meets the statutory requirements.‖ In FY 2008, $33 million of the total of
the overall directive amount was met through the IDA account while in the FY 09 State
Department Report to Congress notes that $71.3 million in IDA funds met the statutory
requirements. It is thus worth keeping in mind that IDA remains an important component of the
USG‘s efforts to meet the directive, despite being discouraged from doing so by Congress.
14
This includes the ESF, DA and Global Health and Child Survival and Health (GHCS) Accounts. 15
GAO Report, pp. 16-17.

9
An analysis of the regional distribution of funding of USAID allocations for water, sanitation
and hygiene to meet the directive levels (excluding FFP and IDA) shows that between FY 2008
and FY 2009 the initial percentage of allocations in Africa increased slightly from 35.4% to
36.9% and slightly in Latin America and the Caribbean, from 6.3% to 6.9%, while in the Middle
East they decreased slightly from 21.6% to 20.6% and in Asia from 28.5% to 27.3%.
Percentages for Europe and Eurasia are negligible. For FY 2010 the initial percentages of
USAID FY 2010 funding allocated towards meeting the directive are: Africa – 36.8%; Middle
East – 22.9%; Asia – 21.8 %; and Latin America – 7.1%. The general trend of the initial
allocations over the three years FY 2008- 2010 shows steady percentages of water, sanitation and
hygiene funding going to Africa, the Middle East, and Latin America and a relative decline
going to Asia. Again, these figures refer only to the initial distribution of the directive funds
($300 million in FY 2008 and FY 2009, $344 million in FY 2010)—the percentages change
significantly in favor of Asia and the Middle East when actual USAID allocations (estimated
obligations) for WASH are considered.16
With respect to results, the GAO report calculated that
between 2006 and 2009, about 45% of reported beneficiaries of WASH assistance—almost 11
million of the more than 24 million beneficiaries worldwide—were in the Middle East/North
Africa region.
Funding for the Latin America and the Caribbean region is absolutely and proportionately small
and only one country in the region, Haiti, is a priority. In FY 2009, just $13.4 million was
obligated for water, sanitation, and hygiene programs in Latin America and the Caribbean and in
FY 2010, $24.6 million (including $10.5 million for Haiti). Nonetheless substantial numbers of
people in Latin America, particularly in the rural areas, continue to lack access to improved
water and sanitation. According to the United Nations (UN), Latin America has the second
lowest coverage of improved drinking water in rural areas among all regions of the world. The
comparatively low to moderate level of overall need, on average, in Latin America is due to the
high degree of urbanization and the relatively good coverage of urban water and sanitation
systems that the countries in the region (other than Haiti) exhibit. Furthermore, most Latin
American countries are not high foreign policy priorities of strategic importance to the United
States. Thus, despite the needs in Latin America, the USG has chosen to prioritize other regions
for its water and sanitation programs.
Within the regions, the distribution of the WFPA attributions among the countries also merits
some reflection. In Africa, Sudan has received 15.8% of the total funding for the region ($52.6
million) over the three-year period FY 2008-2010, the majority of it from the ESF account. In
FY 2009 it was allocated 23.3% of the regional total. This is more than twice as much as any
other country in the region and obviously reflects the US commitment to the Comprehensive
Peace Agreement of 2005 and the independence referendum. Other large water and sanitation
programs in Africa are Ethiopia, the Democratic Republic of the Congo (DRC), and Liberia, all
exhibiting high levels of need for improved water and sanitation. Within the Middle East,
16
This calculation is important because the initial allocation of the directive amounts at the beginning of the Fiscal
Year show USAID‘s intent in allocating funding against the directives. The actual obligations totals reflect the
actual totals allocated at the end of the Fiscal Year. The percentages change when actual total budget allocations for
WASH (estimated obligations) (which include IDA, Food for Peace and supplementals are considered). From FY
2008 to FY 2009 the proportion of actual total budget allocations for WASH decreased in Africa from 44.6% to
33.9% and in Latin America and the Caribbean from 6.3% to 3.0% while they increased in Asia from 17.8% to
23.1% and in the Middle East from 24.4% to 36%, due in large measure to the supplementals.

10
Jordan has received 36.2% of the regional total ($119.4 million) over the three year period FY
2008-2010 although the amount allocated decreased to $25.1 million in FY 2010. West
Bank/Gaza has received 48.8% of the regional total ($161.3 million, including $102.2 million in
the FY 2009 Supplemental).17
The FY 2010 allocation for the West Bank/Gaza was $40 million.
In Asia, Afghanistan has received 29.6% of the regional funding from FY 2008-2010 ($68.6
million), Pakistan 20.8% ($40.4 million) and Indonesia 15.7% ($36.5 million).
The overall conclusion from the analysis is that while technically complying with the letter of the
WFPA mandate and the various Appropriations Acts to focus on high priority countries, the
interpretation by DOS and USAID of ―high priority‖ countries has allowed it to allocate
disproportionately high funding levels to countries deemed to be of strategic importance to the
USG, some of which exhibit relatively low levels of need, without analyzing whether or not the
funding for these strategic countries can be expected to “make the greatest difference in
promoting good health, economic development, poverty reduction, women’s empowerment,
conflict prevention and environmental sustainability” as required by the WFPA. This has
undoubtedly affected the ability of USAID to target greater levels of assistance to countries with
the largest deficits (needs) in water and sanitation coverage.
As the GAO Report to Congress advocates, DOS/USAID should in the future make available the
analysis for classifying countries as high priority and justify the funding to some of them with
relatively low levels of need on the basis of the potential for making the greatest difference in
achieving development results as defined in the legislation.
D. Observations on Other Major Policy Points of the WFPA
1. Achieve a balance between grants, loans, and guarantees Grants make up almost the entirety of funding for water and sanitation projects assisted by the
USG. USAID no longer makes development loans. Its primary mechanism for providing
guarantees is the Development Credit Authority (DCA), created through the Appropriations Act
of 1998. The first DCA guarantee was approved in 1999. Through the DCA program, the USG
issues a partial guarantee covering up to 50% of the risk of loans made by private sector financial
institutions in developing counties for eligible development activities. Because it is a guarantee
and not a loan, every dollar of USG funding can leverage up to $30 in local currency loans.
Although a number of guarantees have been awarded to finance water and sanitation projects,
they have never been a very important part of the DCA portfolio. Approximately $46 million
worth of guarantees were made in this sector through from FY 1999-FY 2010, (about 2% of total
guarantees).18
However, the number of guarantees for water and sanitation programs has been
falling for the past three years, from three in FY 2008 (Kenya, the Philippines and Albania) to
one in FY 2009 (Uganda) and none in FY 2010.
In 2009 USAID‘s DCA Office created a special Water Finance website with the objective of
promoting sustainable financing for USAID assisted pro-poor water and sanitation projects. The
site provides a Water Finance Tool Kit which provides detailed information on how USAID
17
These totals are the sum of all budget allocations from FY 2008 and 2009 and the directive allocations from FY
2010. 18
Source: USAID, Credit Guarantees: Year in Review 2010.

11
missions can integrate finance into broader water and sanitation strategies and a step by step
guide to developing a DCA program in water and sanitation.
Recent examples of DCA assisted water and sanitation activities include: (1) the Philippine
Water Revolving Fund where USAID mobilized more than $37 million to facilitate loans made
by the Japanese aid agency to local water utilities to provide improved water service to 1.4
million Filipinos over a three-year period; (2) a partial credit guarantee designed to increase
lending to small community-managed water enterprises in Kenya; and (3) a guarantee to help
Albanian municipalities access commercial credit for infrastructure projects, including water
supply and improved sanitation.
Despite the DCA guidance and the Water Finance Tool Kit, very few missions have actually
integrated DCA guarantees into their water and sanitation programs. Because of the substantial
degree of leveraging, USAID could make much greater use of the DCA vehicle for the financing
of commercially viable privately financed water and sanitation projects and significantly increase
the numbers of people with access to improved water and sanitation. However, USAID officials
indicated that the use of the DCA mechanism depends greatly on the country context—i.e. the
DCA vehicle is not always an appropriate tool for priority investments. Nonetheless, overall, it
must be concluded that a balance between grants and loans for water and sanitation programs
has not been achieved and that there is an opportunity for greater use of the DCA financing
vehicle, particularly for infrastructure type programs.
2. Achieve a balance between programs serving urban, peri-urban and
rural areas The statistical reporting by USAID and the State Department does not separately track whether
water and sanitation investments benefit urban, peri-urban or rural areas. The USAID Foreign
Assistance Coordination and Tracking System (FACTS) does not disaggregate obligations or
results by locational categories. The only way to assess whether the desired balance is being
achieved (without an extensive survey) is to examine the individual country sections of USAID
and DOS reports. For Sub-Saharan Africa, the separate reports provided by USAID‘s Africa
Bureau provide some additional insights into this issue.
Overall it would appear that the significant majority of water and sanitation programs financed
by USAID serve rural populations, particularly in Sub-Saharan Africa. This might be true for a
number of reasons. First, statistically rural areas in most developing countries generally have
significantly higher percentages of people without access to an improved water supply and
improved sanitation facilities than do urban areas. Second, programs in rural areas may be less
complex and less costly than urban infrastructure projects. 19
Third, the withering away of urban
programming capacity that has occurred over the past decade has left USAID with little expertise
in designing more complex urban infrastructure programs. Fourth, many of the NGOs working
in the water and sanitation sector have a distinctly rural bias. Finally, in many countries
(particularly in Africa), a large proportion of the overall USAID Mission portfolio tends to be
focused in rural areas and in an effort to program the WFPA earmarked funds quickly and
expeditiously it may have been quite simply easier and faster for many Missions to add on to
19
The Kenya mission, in its interview with Nicole Weir, noted that working in urban areas is ―complex‖ and that it
―simply doesn‘t know how to do it.‖

12
existing implementing mechanisms operating in rural areas than to design new programs with a
more balanced geographical approach.20
A number of Africa missions, although a minority, have nonetheless directed at least some of
their water and sanitation resources towards urban and peri-urban areas. An examination of
available material indicates that in FY 08, 37% of missions engaged in capacity building
programs for water and/or sanitation utilities. It is to be presumed that at least some of these were
urban-based since utility companies tend to operate more frequently in urban areas. In addition,
under the SUWASA program (Sustainable Water and Sanitation in Africa) competitions were
held among Africa missions for initiating programs in utility reforms and expanding services for
poor consumers.
Some of the missions in Asia have specifically targeted urban and peri-urban populations for
their water and sanitation programs. For example, USAID/India has supported urban
infrastructure finance and urban health programs through the FIRE-D (Financial Institutions
Reform and Expansion for Debt/Infrastructure) and FIRE-II projects and the Health and Hygiene
Alliance. The second phase of USAID/India‘s Point of Use Water Disinfectant and Zinc
Treatment (PUUZN) project will reach 520,000 in 480 urban slums as well as 600,000 people in
930 rural poor villages. USAID/Indonesia has recently launched a five-year Urban Water,
Sanitation and Hygiene program as a successor to the Environmental Services Project and is
collaborating with AusAID on an urban water program and USAID/Philippines is contributing to
the Water Revolving Fund that in part serves urban areas. In Latin America, the Bolivia mission
initiated six sewer collection systems that included connections in the El Alto (near La Paz) peri-
urban area and the Santa Cruz metropolitan area. In Haiti, most of the earthquake damage
occurred in Port-au Prince and USAID disaster assistance has been focused on the capital city.
In the Middle East, USAID/Jordan supported the Amman water company‘s efforts to improve
services, reduce water loses and analyze its tariff structure. Yet overall, rural areas seem to have
been the focus of the majority of the USAID water and sanitation investments, particularly in
Sub-Saharan Africa.
The predominance of programming in rural areas is shortsighted. The world is rapidly urbanizing
and it is estimated that virtually all of the population growth over the next 50 years will be in
urban areas, with the developing world absorbing most of the increase. Continued progress is
being made in increasing access to water and sanitation for rural dwellers in most countries.21
However, because of rapid urbanization, it is estimated that by 2015, the number of urban
residents without access to improved sources of water and adequate sanitation will actually
increase to some 240 million.
20
The Uganda mission is an exception in this regard. For the past several years, many of the mission‘s programs
focused on northern areas of the country that had been in conflict. The conflict had decimated physical
infrastructure and human capacity, particularly in rural areas. With a need to obligate the WFPA funding quickly,
the mission did not feel that it could easily find reliable partners in the rural areas to implement water and sanitation
programs. It therefore chose to work primarily in the urban and peri-urban areas where it had some more
established partners. 21
The 2010 USAID Report Safeguarding the World’s Water, notes that in eight countries rural water coverage is
actually declining.

13
The situation is worse with respect to sanitation than for water supply many countries. Almost
all of this urban population increase will be in developing countries. The continued growth of
urban slums in many countries exacerbates the situation. Health conditions in many urban slums
and informal peri-urban settlements, despite the greater proximity of health facilities, are in fact
worse than they are in many rural areas due to adverse environmental factors, such as industrial
contamination of water and improper maintenance of overtaxed sanitation facilities. Shared
sanitation facilities are not considered ―improved‖ yet the extreme densities of the urban slums
make the realization of individual sanitary household facilities difficult to achieve.
In addition, national statistics on water and sanitation coverage may mask the reality of the
situation facing the urban poor. The WHO has concluded that poor populations tend to be under-
represented in national health surveys. For example, in Indonesia, national statistics indicate that
the coverage rate for improved water in Jakarta is greater than 90%. However, neighborhood
surveys that include a large number of informal residents conclude that less than 25% of the
urban population is served by improved water sources while the rest depend on rivers, lakes,
private vendors and other sources. The World Bank has noted that in urban areas, especially
slums and informal settlements, ―the limited number of access points must be widely shared,
which dramatically increases waiting time and often simply overwhelms the system.‖22
The
reality is that dense urban areas, especially those neighborhoods where the poor reside, are very
often more under-serviced than the national statistics would indicate. Finally, although they may
be more costly because they tend to be larger, urban infrastructure programs serve much higher
densities and the cost per person may actually be lower than might be first apparent. More
research on this question would be helpful.
In conclusion, an examination of the available data would indicate that the balance between
urban, peri-urban and rural water and sanitation programs is not being adequately achieved
and efforts should be made to increase the levels of WFPA funding for urban and peri-urban
areas which are absorbing the bulk of the population increases in many countries, particularly
in Sub-Saharan Africa and Asia.
USAID should also make efforts to disaggregate statistical information on obligations between
rural, peri-urban, and urban areas so as to better monitor this balance. This should not be
particularly burdensome on USAID missions. It is already being done by the Millennium
Challenge Corporation for its programs in water and sanitation. The USAID Guidelines to
Missions for the Utilization of FY 08 Water Earmark Funds, which missions are still presumably
using to guide their water and sanitation programming, should also be amended to include the
congressional intent for a balanced program between urban, peri-urban and rural areas. The
Guidelines are currently silent on this issue.
3. Priority in the use of water and sanitation funding should be accorded to the poor,
women, and vulnerable groups Again, the statistical reporting of both USAID and DOS does not track whether or not the
funding is being targeted to the poor, women, and vulnerable groups. FACTS does not
disaggregate data by income levels. Some previous USAID programs, for example the Housing
Guarantee Loan program of the 1980s and 1990s, required USAID to assure that a majority of
22
World Bank, World Development Report, 2004: Making Services Work for Poor People, p, 160

14
the guarantees supported programs benefiting the urban poor and tracking systems were
developed to monitor this requirement. However, such tracking does not appear to be applied to
the water and sanitation program funding attributed to the WFTP directive.
The 2008 USAID guidelines indicate merely ―the purpose of this earmark is to increase
sustainable access to safe drinking water and sanitation and improve hygiene.‖ It goes on to say
that ―a preference should be given to activities that focus on the poor.‖
The guidelines stipulate that missions and operating units must report on two standard indicators:
(1) the number of people in target areas with access to improved drinking water supply as a
result of USG assistance and (2) the number of people in target areas with access to improved
sanitation facilities as a result of USG assistance. Presumably most USAID missions choose
target areas where the poor are prevalent but there is no means of verifying this statistically. The
guidelines also add that ―additional information and or justifications may be solicited from
operating units to … disaggregate funding into more detailed activity sub-categories consistent
with the areas described above.‖ However, FACTS does not achieve this further disaggregation
regarding the focus on the poor, women and other vulnerable groups.
Evidence on how missions may be interpreting this preference for the poor, women, and other
vulnerable groups lies in both Earl Kessler‘s country reports and in the interviews in Africa
conducted by Nicole Weir. Specifically the Kenya mission noted that ―the targeted populations
are rural and considered ‗the poor.‘‖ Thus, the entire amount of directive funding is deemed to
have met the congressional intent of serving the poor. The same interpretation is held by the
missions in Uganda and Tanzania—all of the funding meeting the directive is considered to be
serving the poor. Nonetheless, it is also clear that a considerable proportion of the water and
sanitation funding in at least some missions may not be specifically targeting the poor.
For example, in Jordan, the second largest recipient of WFPA-attributed funding from FY 2008-
2010, significant WFPA-attributable resources have been invested in water and wastewater
treatment facilities that will serve the entire population. USAID also invested more than $100
million in a desalinization plant serving greater Amman, which provides water for 700,000
people throughout the metropolitan area, although it is not clear if the funding for the plant was
attributed to the directive. Thus, while it may well be that most missions do indeed choose
target areas where the poor predominate, the country reports do not allow for verification on
this issue.
With respect to another congressional intent, without expressly targeting women, it is likely that
most USAID water and sanitation programs automatically favor women. This is because women
traditionally are the family members who fetch water and employ point of use water treatments,
seek improved sanitation, and are more careful about family hygiene. Many missions have also
used their WFPA earmark to improve sanitation in schools, especially to construct separate
facilities to afford more privacy for girls. Thus by the very nature of the interventions, without
expressly measuring the number of women versus men served, it would seem likely that the
WFPA mandate to accord priority to women and vulnerable populations (e.g. children) is
probably being met satisfactorily.

15
Nonetheless, it is recommended that USAID investigate the feasibility of disaggregating the data
on beneficiaries by income level and gender without overly burdening the missions. This would
allow for a more complete analysis of whether or not the requirement of the WFPA to target the
poor, women, and vulnerable groups is indeed being met.
4. Leverage resources from the non-governmental and private sectors It would appear that many USAID missions are indeed leveraging significant levels of resources
from the non-governmental and private sectors. This is not, however, systematically reported in
the statistical tables of USAID and DOS annual reports. Thus, it is not possible from these
reports on water and sanitation to verify if the up to $20 million in FY 2009 directive funding
was made available to support partnerships with the private sector, non-governmental
organizations, and other donors. Nonetheless, the individual country write-ups, as well as the
separate reports of the Africa Bureau, do make note of a growing number of public private
partnerships, Global Development Alliances (GDAs) and funding leveraged from other donors.
For example the Water and Development Alliance (WADA) between USAID and Coca Cola in
16 African countries has provided access to a clean drinking water supply to more than 24,000
people, provided access to sanitation services to more than 3,200 people, and reached thousands
more with training, education, and outreach to raise awareness and change WASH-related
behaviors. In addition, Ghana is developing a water sector GDA with Proctor and Gamble and
Madagascar partnered with an innovative social enterprise to install and manage wells. Finally,
nine other Africa missions have involved the domestic and international private sectors in the
marketing and sale of water purification and other hygiene products, low cost drilling, operation
of water and sanitation facilities, and manufacturing spare parts.
In Asia, as mentioned above, the Philippine Water Revolving Fund involves a partnership
between USAID, the Japanese aid organization, and Filipino private banks whose risk is reduced
through the DCA guarantee mechanism. USAID/Pakistan created three private sector water and
sanitation partnerships: one with Unilever to provide soap to USAID hand washing activities, a
second with Medentech to provide 20 million Aquatab POU water purification treatments and a
third with Mobilink to distribute educational and promotional messages on its mobile phone
network.
In Latin America, USAID Ecuador supported the Fund for the Protection of Water (FONAG)
that leveraged $2 million from the World Bank, the Eco-Fund, the French Institute for
Development Research, the ‗Life for Quito‘ Corporation, and Quito‘s municipal water company.
The fund is used to protect water basins that supply water to Quito and surrounding areas. The
Ecuador mission replicated this public-private conservation model in four other areas, which
raised a $1 million endowment from hydroelectric companies, municipal water companies and
private foundations.
The 2010 State Department Report on the Paul Simon Water for the Poor Act notes that in
addition to the above examples, USAID missions in Armenia, Cambodia, India, Senegal and
Tanzania partnered with local private sector companies, community-based organizations and ―in
some cases global corporations such as Coca-Cola, Unilever and Proctor and Gamble‖ to
leverage additional private financing for clean water and hygiene programs.

16
Although data on leveraging is not systematically captured by the USAID reporting systems for
water and sanitation, it would appear that many missions are indeed forming public private
alliances and Global Development Alliances (GDAs) that leverage significant resources from the
private sector. This would suggest that the FY 2009 Congressional language stipulating that $20
million be made available for public private partnerships is being observed. Many missions also
provide the essential technical assistance required for the World Bank, the Asia and Africa
Development Banks, the Inter-American Development Bank, and various UN organizations to
implement critical infrastructure programs. It would nonetheless be helpful for USAID to
provide at least an order of magnitude on resources leveraged from other donors and the private
sector so that this element of congressional intent could be better tracked.
5. Promote policy reform and strengthen the capacity of recipient governments to
expand access to safe water and sanitation In order to achieve the MDG of halving by 2015 the proportion of the population without
sustainable access to safe drinking water and basic sanitation, many countries must significantly
scale up their efforts. While the worldwide MDG target for water supply access would appear to
be achievable, some countries still face enormous challenges — 884 million people worldwide
still rely on unimproved water sources for their drinking, cooking, bathing and other domestic
activities. Of these, 84 % (746 million) live in rural areas. Access to adequate sanitation is
another matter — it would appear that efforts to meet the MDG target for sanitation will fall far
short. According to the UN, 2.5 billion people worldwide remain un-served by basic sanitation,
almost 38% of the world‘s population. More than 1.2 billion people, 18% of the world‘s
population still practice open defecation, the majority in rural areas. The problem is most acute
in Southern Asia where 580 million people lack adequate sanitation and in Sub-Saharan Africa
where 370 million additional people must be served just to meet the MDG target of 63%
sanitation coverage.
While projects implemented by donors and non-governmental organizations are undeniably
providing tangible benefits to millions, they cannot by themselves meet the demand for safe
water and adequate sanitation in the developing world. Rather, it must be the countries
themselves that undertake the policy reforms, build the human capacity, and marshal the
financial resources required to ―go to scale‖ in water and sanitation programs.
Information on USAID policy reform programs for water and sanitation is not centrally or
systematically gathered so it is difficult to determine the extent to which the missions are
providing policy level assistance. Unfortunately, however, it appears from an examination of
publicly available documentation that relatively few USAID missions are implementing policy
reform efforts in water and sanitation with national governments, local governments and utilities.
A review of the narrative descriptions of country water and sanitation programs, based on
available information from the annual FY 2009 State Department and USAID reports, indicates
that no mission provides national policy related technical assistance in water and sanitation work.
Only two, India and the Philippines, are providing technical assistance in facilitating access to
finance for water and sanitation. Three missions reported such policy-based work in FY 2008.
The extent of this type of assistance may, however, be understated due to lack of more detailed
information in the standard reports. For example, the FY 2009 Africa Bureau report on water

17
and sanitation activities notes that nine (of 23) missions (bilateral and regional) worked at the
national and local levels ―to improve the institutional framework for water and sanitation
management and to build governance capacity.‖ As examples, the report cites USAID/Burundi‘s
efforts in establishing a National Water Authority, training programs for civil servants in Mali
and Sudan and expanding incentive-based management systems for water operations in Uganda.
Nonetheless, national level policy work in water and sanitation clearly does not seem to be a
priority for most USAID missions, the majority of which are implementing programs to expand
coverage and usage through small scale infrastructure projects and water purification and
hygiene programs as well as targeting improved sanitation and better hygiene in schools. The
reason for this is not clear. However, it may be because USAID missions prefer to leave the
national policy level work to the larger donor organizations such as the World Bank, UN
organizations, and the regional development banks, given that USAID‘s capacity to provide such
assistance is still limited.
A number of missions are providing technical assistance and strengthening the capacity of
municipalities to provide improved infrastructure management and finance — primarily through
local governance programs. This may include water and sanitation. Many of the health
programs are also strengthening the capacity of local health clinics to provide information on the
prevention of disease transmission through better hygiene and point of use water purification.
However, the USAID and State Department reports do not systematically report this type of
assistance — in fact just one mission in Africa, Uganda, mentions capacity building in water and
sanitation for municipalities, and two, Angola and Sudan, report capacity building activities for
local utilities. Angola also reports capacity building for NGOs working in the water sector.
Mention should also be made of the centrally-funded Sustainable Water and Sanitation for Africa
(SUWASA) project, which was procured in FY 2009. The purpose of the SUWASA project is to
increase the sustainability of water and sanitation investments through innovative financing,
improved governance and management and improved service delivery for the poor in Africa.
Results should begin to appear in FY 2011.
In sum, while national level policy work and capacity building at both local and national levels
may be going on to some extent, it is not being regularly reported by many missions and it
therefore difficult to assess whether this WFPA key point is being as seriously addressed as the
legislation recommends. Yet available evidence points to a conclusion that not very much policy
level assistance is indeed being funded. Such information would be helpful to allow for an
objective discussion of whether or not the USG is looking hard enough at ways to scale up its
efforts in water and sanitation.
It should be further noted that USAID has begun over the past two years to rebuild its internal
capacity to design and manage water and sanitation programs. USAID has done this by hiring
some 30 new professionals in 2008 who are working at least part time in the sector, both as mid-
career Foreign Service Officers and through the Development Leadership Initiative (DLI)
program for more Junior Officers. In 2009, USAID estimates that at least 100 people in
Washington and in the field were working at least part time on water and sanitation issues. As
these professionals gain more experience, it may be possible for USAID to provide greater levels

18
of policy guidance, technical assistance and capacity building activities at the national and local
levels and to increase their work with utilities in promoting sustainable water and sanitation
programs.
E. Results Achieved.
The 2010 USAID Report on Safeguarding the World’s Water notes that in FY 2009, USAID-
sponsored programs worldwide provided improved water supply to 6.4 million people of whom
approximately 4.5 million received first-time access to an improved supply and more than 3.4
million people received first time access to improved sanitation in 57 countries. USAID-
sponsored programs to improve the quality of water at its point of use also resulted in 7.8 billion
liters (2 billion gallons) of disinfected drinking water. It should be noted that these results reflect
total obligations for the sector as a whole and not just the WFPA earmarked amounts. The 2010
State Department Report on the WFPA notes: ―throughout FY 2009, USAID grants were largely
targeted to support water and sanitation projects that involve low-tech solutions such as water
purification, public taps, small-scale piped water, tube wells, small sewer systems, septic tanks
and hygienic latrines. USAID also made critical investments in education programs that promote
behavior that contributes to good sanitation and hygiene.‖23
These numbers compare with 7.7 million gaining improved access to safe drinking water supply,
6.3 million with improved access to sanitation facilities, and 7.4 billion liters of water disinfected
in FY 08. The GAO report indicated that the reason for the decrease in the number of
beneficiaries was a change in the indicators. Prior to 2007, USAID reported the number of
people gaining first time access (as defined in the Millennium Development Goal) ―to an existing
water source or sanitation facility as well as those gaining improved access.‖ Starting in FY
2007, ―USAID reported only the number of people gaining access to an improved source of
drinking water, such as a protected well, and number of people gaining first time access to an
improved sanitation facility, such as a latrine.‖24
In addition, multi-year capital projects (such as
water treatment facilities) may cause a jump in the number of beneficiaries only in the year in
which they are completed.
F. Impact of the WFPA directive on Mission Programming While several of the goals of the WFPA are to be quantifiable, e.g. to reduce by 50% from a
1990 baseline year the proportion of people unable to reach or afford safe water and basic
sanitation by 2015, a fundamental goal of the legislation is to make access to safe water and
basic sanitation a basic foreign policy objective of the United States. This can only happen if
water and sanitation programs become institutionalized over the long term as an important
development sector in those organizations implementing foreign assistance programs.
As important as the congressional directives have been in increasing the focus on water and
sanitation, it cannot be taken for granted that the specific directives will continue to be mandated
by Congress every year. As noted above, an encouraging sign is the increased request for water
and sanitation funding in the President‘s FY 2012 budget request to Congress to $302 million.
This indicates that the Administration is finally beginning to understand the need to increase the
levels of resources for WASH programs. However, it will be important that the directives
23
Department of State, 2010 Report to Congress on the Paul Simon Water for the Poor Act, p.4. 24
GAO Report, pp.14-15.

19
continue until USAID firmly establishes water and sanitation as a priority sector and missions
designing and implementing development programs regard water and sanitation as important as
other sectors such as health, food security and economic growth. Otherwise, once the directives
end, attention to the sector may slip as other priorities emerge.
The degree to which the WFPA has already begun to become institutionalized in USAID
programming can be approximated by examining a few factors. Have missions and other
operating units changed their important strategic documents, such as their Mission Strategic
Plans and their Results Frameworks? Have they carried out new water and sanitation
assessments? Have they developed new water and sanitation strategies? Have they strengthened
their staffing (or re-configured their existing staffing pattern) to deploy more human resources to
the design and implementation of water and sanitation programs? Have they participated in
USAID training activities designed to deepen mission understanding of water and sanitation
issues. Finally, have they, ―taken the path of least resistance‖ in programming WFPA earmarked
funding by simply augmenting already existing health or education programs by adding a new
element dealing with water and sanitation, as opposed to developing new approaches or initiating
new procurements?
Unfortunately this kind of information is not readily available in summary form on a worldwide
basis. However, by culling the separate annual reports of USAID‘s Africa Bureau on water and
sanitation activities, it is possible to glean some insights on the degree to which the missions in
the Africa region have taken the WFPA ―to heart‖ by really changing their perspective and
beginning to institutionalize water and sanitation programming within their portfolios. The GAO
report also provides further insights on this issue.
The FY 2009 Africa activity report summary and the individual country narratives shed some
light on this. The report summary notes that nine missions (of 23 in the region) undertook
assessments of their WASH programs and/or developed new water and sanitation strategies. It
further notes that 22 missions (almost all) invested in WASH staff training. Tables 3 and 3.2
―Key Factors in Assessing the Implementation of the Water for the Poor Act‖ further illustrate
the kinds of activities undertaken by the Africa missions to address the water and sanitation
sector. In addition to strategies and assessments, Table 4 also identifies missions that have
undertaken major new procurements in the water and sanitation sector, which illustrates that they
have begun to ―ramp up‖ their water and sanitation programming.
The Ghana, Kenya, and Senegal missions stand out in this regard. During FY 2009,
USAID/Ghana developed a water and sanitation strategy and released a Request for Applications
(RFA) for a major new $13.5 million project. The project has five components: support for
water and sanitation infrastructure; small grants to encourage partnerships; capacity building;
behavior change; and leveraging resources through partnerships with private companies.
USAID/Kenya developed a new water and sanitation strategy that stresses the use of market
forces to better serve the poor. USAID/Senegal has just launched a water and sanitation
initiative (and completed a significant new procurement) that will improve sustainable access to
WASH in targeted small towns, rural, and peri-urban areas of the country.

20
It would nonetheless appear from an examination of the data that most of the missions in Africa
during the first two years of the directive ―took the path of least resistance.‖ Many simply
modified existing contracts or grant agreements to program the WFPA funding. This was
probably due to the fact that new strategy development takes considerable time and that
significant lead time is also required to design and implement new procurement instruments.
Pressure to obligate quickly (although WFPA funding is two-year money) may also have driven
missions to take the most expeditious route to programming the WFPA funds. Additionally,
missions may have been reluctant to undertake a real strategic exercise because of the
uncertainty of continued funding for water and sanitation. Finally, many missions may not be
sufficiently staffed or well-enough trained to undertake creative new directions in addressing
water and sanitation deficiencies. Again, although the human resource situation has been
improving over the past two years, the pace of hiring or dedicating staff for water and sanitation
programs may be influenced by the uncertain nature of long-term funding for the sector.25
Information identifying the number of missions that may have modified their Results
Frameworks (and how they have modified them) to accommodate the WFPA directives would
also be enlightening, but this is beyond the scope of this report.
The GAO report provides some further insights on this issue. The report notes that of the 15
missions where the GAO conducted structured interviews, seven reported having changed the
types of their water and sanitation activities while seven indicated that the legislation and
directives had little or no effect on their activities (one did not respond). Furthermore, the report
indicated that whether or not a country had been designated as ―high priority‖ had no significant
impact on the proportion of the mission‘s budget allocated to WASH activities (3.2% for high
priority countries vs. 3.1% for non-priority countries).26
In efforts to monitor the implementation of the WFPA worldwide, it would be extremely helpful
to have the other USAID regional Bureaus—Asia, the Middle East and Latin America and the
Caribbean—prepare summary activity reports along the lines of the Africa Bureau reports. This
would provide much more complete information on the details of the water and sanitation
programming and results on a mission by mission basis.
Whether or not the USAID ―culture‖ has changed to the point where water and sanitation
programming becomes institutionalized as much as it has for other sectors such as agriculture,
health, democracy, and governance programs and private sector programs will become more
apparent from results achieved with FY 2010 and FY 2011 funding. By then missions will have
had sufficient lead times to make the necessary strategic and tactical adjustments to their
portfolios. They should also have increased their human technical capacity to design and
manage water and sanitation programs. The directives will not last forever—for this reason
sufficient momentum must be achieved so that when they do disappear, water and sanitation
initiatives do not fall back off the radar screen.
25
This is the case in all three Africa missions interviewed by Nicole Weir. 26
GAO Report, p. 31.
21
IV. Need for more complete and accurate information on water and sanitation funding
and results.
The above discussion highlights the need for more comprehensive, precise and accurate program
results and budget data on USAID and State Department water and sanitation investments in
order to address all of the concerns highlighted in the Senator Paul Simon Water for the Poor
Act. The WFPA Act is not just about increasing the levels of USG support for water and
sanitation. Directing the funding to countries in greatest need and to countries where the
development impact is expected to be greatest (i.e. where the assistance is expected to make the
greatest difference in promoting good health, economic development, poverty reduction,
women‘s empowerment, conflict prevention, and environmental sustainability) is an extremely
important consideration. Likewise, considerations such as the urban/peri-urban/urban balance; a
focus on the poor, women, and vulnerable groups; use of all of USAIDS‘s grant and guarantee
tools; the leveraging of funding; and increased focus on policy level assistance to scale up
results are also important. Only through the compilation of more complete and robust data can
such considerations be taken properly into account. To do so, USAID must expand its data
gathering efforts.
Another important consideration is the sustainability of USG assistance over time. While initial
investments in water and sanitation are critical towards meeting the MDGs, these investments
must be maintained in order to preserve their benefits. The world is unfortunately full of
development projects that cease to function after a year or two because of faulty or inappropriate
design or inadequate provision for maintenance. The USG should therefore be concerned that its
investments continue to function over time and that the beneficiaries continue to benefit. It
would therefore behoove USAID to selectively verify through surveys or site visits that its prior
year investments in water and sanitation are indeed functioning as planned.
The current Administration has strongly endorsed results-based programming and USAID has
recently issued a new Evaluation Policy which is designed to increase the number of evaluations
conducted by the Agency and builds evaluation directly into the project cycle. It also proposes
to conduct occasional thematic or meta-evaluations on Agency policies, practices and priorities.
The value of such evaluations depends heavily, however, on the accumulation of reliable and
disaggregated data. The WFPA would be a very good candidate for the development of a model
methodology for performance management and for such meta-evaluations that would begin to
provide some real data on important aspects of the USG investments in water and sanitation
issues that are not now captured, such as urban/rural distribution, focus on the poor and
disadvantaged, public-private partnerships, consistent measurement of water and sanitation
results and sustainability of investments. This would make the annual reporting on the WFPA
much more robust. It is therefore recommended that the strengthened USAID Office of
Learning, Evaluation and Research (PPL/LER) use the water and sanitation sector as a pilot for
implementing important components of its new Evaluation Policy. The Director27
of the USAID
Office of Learning, Evaluation and Research has indicated some interest in this idea.
27
The Director of the Office of Learning, Evaluation and Research recently left USAID.

22
V. A Note on the Millennium Challenge Account (MCA)
While the Millennium Challenge Account investments are not counted towards the WFPA
directive, several MCA Compacts include important water and sanitation components.
According to the 2010 State Department Report to Congress on the WFPA, in FY 2009 the
Millennium Challenge Corporation (MCC) obligated $31.9 million for WASH programs. This
compares with FY 2008 MCC obligations of $547 million in the water and sanitation sectors, of
which almost 80% was for safe drinking water and sanitation projects in three countries—
Lesotho, Mozambique, and Tanzania. In addition, in FY 2008 the MCC ―committed‖ $166
million for water and sanitation activities in Burkina Faso, Mongolia, and Tanzania.28
Mozambique‘s Compact includes more than $200 million in investments in drinking water
supply, sanitation, and hygiene and Lesotho‘s Compact includes more than $150 million in such
investments. Other country programs with large water and sanitation components are Georgia
($64.5 million) and Tanzania ($66.3 million).
It should be noted that the MCC ―Compacts‖ cover a five-year period. Disbursements occur
throughout the implementation period, but the MCC counts as an ―obligation‖ the full amount of
the compact in the year in which it ―enters into force.‖ This may lead to misleading conclusions
if not properly explained and accounts for the wild swings in obligations from year to year.
Between 2005 and 2009, the MCC obligated almost $530 million for WASH projects in six
countries. 29
However, just 3% of the total, ($16 million) was actually disbursed for these
activities over the five year period. Nonetheless, the large Mozambique and Lesotho programs
are expected to begin disbursing much more rapidly in the next few years, which will sharply
increase the overall disbursement levels.
It is important to distinguish between the broad water sector activities being supported by the
MCC from the water and sanitation work that is being carried out in response to the Paul Simon
Water for the Poor Act. Besides the investments in WASH activities, the MCC has supported
substantial programs to increase irrigation and other water productivity initiatives.
28
MCC ―commits‖ funding at Compact signing, while obligations are recorded at entry into force of the Compact.
The unusually large level of obligations in FY 08 was due to the entry into force of the Mozambique and Lesotho
Compacts. Obligations will thus appear only in the year in which the Compact enters into force. Disbursements
will continue through the life of the Compact. 29
Georgia ($64.5 million), Ghana ($13 million), El Salvador ($23 million), Mozambique ($203 million) Lesotho
($159 million) and Tanzania ($66.3 million).

23
VI. Concluding Observations
It cannot be disputed that the Senator Paul Simon Water for the Poor Act and the subsequent
appropriations legislation have put water and sanitation programs much more solidly on the USG
foreign assistance map than they were previously and that obligations for WASH have risen
substantially since the enactment of the legislation. However, the substantial increases in
obligations for WASH activities did not really begin until Congress included specific minimum
funding directives in the Appropriations Acts beginning in FY 2008.
It is also clear that while substantial efforts have been made by the major implementing agencies,
primarily USAID, to comply with the priorities of the Act, there have been shortcomings as well
as anomalies in the way the Act has been implemented.
Perhaps the most significant shortcoming is that five years after the passage of the Act, the USG
still does not have a comprehensive strategy for its implementation with specific and measurable
goals, benchmarks, and timetables to assess progress. The development of a Framework for
Action and a Results Framework in 2008-9 is a positive step in the right direction, but a serious
effort must be mounted as soon as possible to complete a robust strategy. The recent
appointment of the Global Water Coordinator at USAID has reinvigorated the strategic planning
process and USAID and State indicate that they will complete a draft for discussion of a
comprehensive strategy by the summer of 2011.
While the bulk of the obligated funding which is attributable to the directives has indeed been in
―priority countries,‖ the analysis of outside observers, including the GAO, has concluded that
―high priority designations are not consistently associated with data on need for water and
sanitation.‖30
Additionally, while high priority countries may also include those where
assistance is expected to make the ―greatest difference in promoting good health, economic
development, poverty reduction, women‘s empowerment, conflict prevention, and environmental
sustainability,‖ there does not appear to have been any serious analysis done by DOS or USAID
to justify the inclusion of countries in the priority category based on the ―greatest difference‖
criteria.
Moreover, the proportion of overall funding attributable to the directive that has been allocated
through the ESF account has increased steadily to almost 50% while the proportion allocated
through the DA Account has correspondingly decreased. This indicates that the budget
allocations are increasingly being directed to countries on the basis of foreign policy
considerations and less so on development or need criteria. Just four countries—Pakistan,
Afghanistan, Jordan and the West Bank/Gaza—account for almost 38% of all funding attributed
to meeting the congressional directives from FY 2008-FY 2010.
There are a number of other specific concerns identified in the WFPA that should be more
closely monitored. These include the need to focus the assistance on the poor, women, and
vulnerable groups; the need to strike a balance between investments in rural, peri-urban, and
urban areas; the need to make use of grants, loans, and guarantees; the need to leverage resources
from the private sector, non-governmental organizations, and other donors; and the need to
30
GAO Report to Congress 2010, op. cit., p. 32.

24
provide policy level assistance as well as specific project assistance in order to scale up the
impact of USG funding. USAID needs to better disaggregate the data on obligations and results
in order to measure these considerations.
In terms of reporting on the WFPA, it would be helpful if USAID and the State Department
could make information on actual disbursements available publicly. It should be noted that the
MCC is able to track disbursements promptly and to make this information available to the
public relatively quickly. Were State and USAID to begin doing this, the quantitative results on
numbers of people served could be more directly related to the levels of disbursements and the
impact of the programs more precisely measured. Aggregated disbursement information is
currently recorded only in the FACTS system to which outside parties do not have access.
It is critical that the Senator Paul Simon Water for the World Act, recently re-introduced into the
current Congress, be adopted to sustain the momentum created by the WFPA and that for the
next several years the directives continue at least at current levels so that USAID implementing
units firmly root water and sanitation programs into their country programming. USAID is
constantly consumed by administration initiatives, currently Global Health, Global Climate
Change, and Feed the Future. Given increasingly tight budgets, these initiatives can easily
crowd out other important development sectors such as water and sanitation. The directives, if
continued, should prevent this from happening in the water and sanitation sector. Again, the
President‘s FY 2012 budget request of $302 million for water and sanitation is an encouraging
sign, but in a tight budgetary situation it may be difficult to sustain.
It will also be critically important that USAID continue to strengthen its cadre of professionals
with expertise in water and sanitation issues. This would help to ensure that demand for
increased programming in this sector is driven from within and not externally created. It would
help significantly to institutionalize water and sanitation as a staple of the USG assistance
program, much as is the case for health, democracy, food security, and private sector
development programs.
The tendency of some missions to add on to existing implementation mechanisms to program the
WFPA earmark may indicate that a lack of staff resources made it difficult to develop new water
and sanitation strategies and create new instruments and approaches. This could also portend
that without an increase in staff resources, they may have difficulty in programming continued
higher levels of funding for WASH. It is possible that some missions that more typically rely on
the DA and Global Health and Child Survival (GHCS) accounts may find it hard to absorb the
resources without additional human and technical capacity. As a result, there is a possibility that
the incremental funding may continue to go disproportionately towards the large ESF-supported
countries such as Afghanistan, Pakistan, Jordan, and West Bank/Gaza and not to countries with
the highest levels of need.
Finally, while the focus of this report is more on USAID, it will be important that the State
Department follow up on Secretary Clinton‘s commitment on World Water Day 2010. Clinton
committed that the State Department would channel the ―five streams of action into a mighty
river,‖ making sure that the work on water issues is not just ―of the moment‖ but ―stands the test
of time.‖ While the State Department does not directly implement many water and sanitation

25
programs, its leadership in keeping water and sanitation issues on the front burner is extremely
important. In the absence of such leadership and constant pressure from Congress, attention to
the sector could languish.
VII. Recommendations
Major Recommendations
As soon as possible, DOS/USAID should complete a robust strategy for implementing
the WFPA that includes specific and measurable goals, benchmarks, and timetables to
assess its progress. Water and sanitation for the poor should also become an important
component of the joint DOS/USAID Strategic Plan.
DOS should clarify the basis for the designation of high priority countries and allocate
resources on the basis of the need of countries for water and sanitation and on an
objective analysis of where the funding is expected to make the greatest difference in
promoting good health, economic development, poverty reduction, women‘s
empowerment, conflict prevention and environmental sustainability.
The policy and practice of increasing the use of the ESF Account at the expense of the
DA Account to fund activities attributable to the WFPA should be changed.
Increased resources should be allocated to water and sanitation investments and programs
in urban and peri-urban areas where populations are growing most rapidly and where the
results can reach the greatest numbers of people.
Water and sanitation programming should be linked to other sector activities, initiatives
and policies as they affect urban and peri-urban areas (e.g. Feed the Future, Global
Climate Change, Global Health and the proposed new urban strategy).
USAID should verify that its investments in water and sanitation are sustainable by
verifying through site visits and/or surveys that its prior year investments are indeed
continuing to function as planned two to three years later.
USAID should continue to increase its technical capacity at both headquarters and the
field levels to design and implement WASH programs in order to institutionalize water
and sanitation as a staple of the U.S. government foreign assistance program, much as is
the case for health, democracy and governance, food security and private sector
development.

26
Other Recommendations
USAID should increase its efforts to provide policy level assistance to local and national
governments to scale up the impacts of its assistance.
USAID should make the water and sanitation sector a test case for the development of a
model methodology for performance management and for a meta-evaluation to help
operationalize its new evaluation policy.
To increase funding resources, greater use of USAID‘s Development Credit Authority to
finance water and sanitation investments should be encouraged.

27
Table 1: 2008-2009 USAID Missions' Obligations under Water For the Poor Act
FY 2008 Obligations* FY 2009 Obligations**
Region Mission Water Supply &
Sanitation ($ m)
IDA Water Supply &
Sanitation ($ m)**
Total 2008 earmark ($
m)
Water Supply &
Sanitation ($m)
IDA Water Supply &
Sanitation ($ m)****
Total 2009 earmark ($
m)
Africa Angola 0.995 0.995 3.000 3.000
Benin 0.355 0.355 0.500 0.500
Botswana 0.200 0.200 0.000
Burkina Faso 0.000 0.000
Burundi 0.755 0.755 0.250 0.250
Chad 1.232 1.232 2.449 2.449
Comoros 0.000 0.050 0.050
Cote d'Ivoire 0.927 0.927 0.000
Democratic Republic of the Congo
7.033 1.526 8.559 6.500 3.873 10.373
Eritrea 1.393 1.393 0.000
Ethiopia 6.049 7.754 13.803 6.500 8.318 14.818
Ghana 2.325 2.325 3.000 3.000
Guinea-Bissau
0.100 0.100 0.000
Kenya 5.425 1.510 6.935 5.500 2.824 8.324
Liberia 2.604 2.604 2.349 0.050 2.399
Madagascar 3.602 3.602 5.111 5.111
Malawi 0.323 0.323 0.300 0.300
Mali 0.710 0.710 1.500 1.500
Mauritania 0.000 0.025 0.025
Mozambique 4.014 0.655 4.669 1.250 1.250
Namibia 0.343 0.343 0.350 0.350
Niger 0.000 0.050 0.050
Nigeria 3.705 3.705 2.150 2.150
Rwanda 0.723 0.723 1.950 1.950
Senegal 2.200 0.050 2.250 3.600 0.050 3.650
Sierra Leone 0.000 0.000
Somalia 1.727 8.829 10.556 1.500 1.260 2.760
South Africa 0.990 0.990 0.000
Sudan 22.625 29.140 51.765 15.940 22.980 38.920
Tanzania 1.995 1.995 3.600 3.600
Togo 0.050 0.050 0.000
Uganda 3.878 4.605 8.483 5.250 5.250

28
Table 1 continued: 2008-2009 USAID Missions' obligations under Water For the Poor Act
FY 2008 Obligations* FY 2009 Obligations**
Africa cont.
Mission Water Supply &
Sanitation ($ m)
IDA Water Supply &
Sanitation ($ m)**
Total 2008 earmark ($
m)
Water Supply &
Sanitation ($m)
IDA Water Supply &
Sanitation ($ m)****
Total 2009 earmark ($
m)
USAID Africa Regional
7.225 7.225 4.000 4.000
USAID East Africa Regional
1.000 1.000 1.000 1.000
USAID Southern Africa regional
2.000 2.000 1.000 6.108 7.108
USAID West Africa Regional
5.000 5.000 7.000 0.374 7.374
Africa Undistributed
0.000 0.000 0.000 10.000 10.000
Zambia 2.547 2.547 4.100 4.100
Zimbabwe 2.105 2.105 13.636 13.636
Development Grants Program (Africa)
10.000 10.000 0.000
Middle East
Middle East Regional
0.100 0.100 0.000
Egypt 1.416 1.416 1.700 1.700
Iraq 21.575 21.575 13.010 13.010
Jordan 41.700 41.700 34.500 34.500
Yemen 0.000 0.300 0.250 0.550
Lebanon 8.000 8.000 6.500 6.500
USAID Middle East Regional (OMEP)
3.718 3.718 0.000
West Bank/Gaza
19.162 19.162 102.200 102.200

29
Table 1 continued: 2008-2009 USAID Missions' obligations under Water For the Poor Act
FY 2008 Obligations* FY 2009 Obligations**
Asia Mission Water Supply &
Sanitation ($ m)
IDA Water Supply &
Sanitation ($ m)**
Total 2008 earmark ($
m)
Water Supply &
Sanitation ($m)
IDA Water Supply &
Sanitation ($ m)****
Total 2009 earmark ($
m)
Afghanistan 11.583 2.445 14.028 21.500 1.074 22.574
Asia Regional 2.020 2.020 0.580 0.580
Bangladesh 1.416 1.495 2.911 1.500 0.159 1.659
Burma 2.234 2.234 0.810 0.810
Cambodia 5.283 5.283 1.350 1.350
East Timor 3.270 0.200 3.470 5.000 5.000
India 7.000 0.317 7.317 2.900 1.003 3.903
Indonesia 8.431 0.005 8.436 9.823 9.823
Laos 0.000 0.250 0.250
Nepal 0.268 0.268 0.194 0.194
Pakistan 6.725 0.760 7.485 24.305 16.673 40.978
Papua New Guinea
0.053 0.053 0.000
Philippines 1.519 1.519 2.639 0.216 2.855
Sri Lanka 0.194 0.194 2.239 2.239
Tajikistan 0.000 0.031 0.031
Regional Development Mission Asia
6.950 6.950 6.160 6.160
Uzbekistan 0.040 0.040 0.000
Vietnam 0.132 0.132 0.000
Europe &
Eurasia
Armenia 0.887 0.887 1.207 1.207
Azerbaijan 0.020 0.020 0.010 0.010
Georgia 0.500 0.750 1.250 0.500 0.456 0.956
Joint Eurasia Regional
0.290 0.290 0.000
Kosovo 4.500 4.500 0.000
Russia 0.050 0.050 0.200 0.200

30
Table 1 continued: 2008-2009 USAID Missions' obligations under Water For the Poor Act
FY 2008 Obligations* FY 2009 Obligations**
Mission Water Supply &
Sanitation ($ m)
IDA Water Supply &
Sanitation ($ m)**
Total 2008 earmark ($
m)
Water Supply &
Sanitation ($m)
IDA Water Supply &
Sanitation ($ m)****
Total 2009 earmark ($
m)
Latin America &
the Caribbean
Bolivia 3.000 3.000 2.800 2.800 Colombia 0.700 0.700 0.700 0.700
Dominican Republic
0.100 0.100 0.000
Ecuador 5.787 0.192 5.979 3.000 3.000
Guatemala 0.250 0.250 0.250 0.041 0.291
Haiti 10.060 0.545 10.605 4.100 4.100
Mexico 0.901 0.901 0.000
Nicaragua 0.200 0.286 0.486 1.353 1.353
Peru 0.000 1.270 1.270
USAID Caribbean Regional
0.000 0.014 0.014
Central Programs
USAID Economic Growth. Agriculture and Trade (EGAT)
7.660 7.660 4.450 4.450
USAID Global Health (GH)
5.200 5.200 5.200 5.200
USAID Office of Development Partners
6.798 6.798 15.300 15.300
Other State Oceans and International Environment and Scientific Affairs (OES)
0.000 0.550 0.550
TOTAL 275.510 91.401 366.911 358.728 98.786 457.514

31
*Source: Page 91 of "Safeguarding the World's Water 2008 Report on the USAID Water Sector Activities" ** $61.981 million of the total $91.398 listed here went towards activities that met the 2008 statutory requirements for the Act; it is unclear which missions 'activities were supported by the $61.981 million
****Source: Page 10-12 Senator Paul Simon Water for the Poor Act Report to Congress. DRAFT ** $71.270 million of the total $98.787 listed here went towards activities that met the 2008 statutory requirements for the Act; it is unclear which missions 'activities were supported by the $71.270 million

32
Table 1.2: Allocations From Foreign assistance Accounts to Meet Water for the Poor Statutory Requirements by Funding Account ($ millions)
Fiscal Year 2008 Fiscal Year 2009 Fiscal Year 2010
2008-2010
Region Mission DA CSH ESF AEECA IDA GHAI Grand Total DA GHCS/USAID ESF AEECA IDA
Grand Total DA GHCS/USAID ESF AEECA
Grand Total
Mission Total
Africa Angola 1.000 1.000 3.000 3.000 3.000 3.000 7.000
Benin 0.250 0.250 0.500 0.500 0.500 0.500 1.250
Botswana 0.200 0.000 0.000
Burundi 1.000 0.050 1.050 0.250 0.250 1.300
Cote D'Ivoire 0.927 0.000 0.000
Democratic Republic of the Congo 3.000 1.250 4.250 1.500 5.000 6.500 1.500 5.000 6.500 17.250
Ethiopia 1.650 1.100 1.880 2.750 5.000 1.500 6.500 7.500 1.500 9.000 18.250
Ghana 2.000 0.300 2.300 2.000 1.000 3.000 5.000 1.000 6.000 11.300
Kenya 4.000 1.000 1.125 5.000 4.000 1.500 5.500 7.500 1.500 9.000 19.500
Liberia 2.500 0.150 2.650 0.150 9.000 9.150 0.150 11.000 11.150 22.950
Madagascar 2.269 0.700 2.969 4.250 1.250 5.500 5.000 0.720 5.720 14.189
Malawi 0.300 0.006 0.300 0.300 0.300 0.300 0.300 0.900
Mali 0.500 0.200 0.700 1.000 0.500 1.500 2.000 0.500 2.500 4.700
Mozambique 2.000 0.600 3.214 2.600 0.750 1.250 2.000 3.000 1.250 4.250 8.850
Namibia 0.343 0.000 1.000 1.000 1.000
Nigeria 2.000 0.150 1.705 2.150 2.000 0.150 2.150 3.500 0.150 3.650 7.950
Rwanda 0.100 0.300 0.400 0.400 1.000 1.000 2.000 0.950 2.000 2.950 5.350
Senegal 2.000 0.200 2.200 4.500 0.500 5.000 5.000 0.500 5.500 12.700
Somalia 2.000 0.500 2.500 0.500 1.000 1.500 0.500 0.500 4.500
South Africa 0.990 0.000 0.000
Sudan 6.000 4.940 5.200 16.140 4.940 11.000 15.940 4.500 16.000 20.500 52.580

33
Table 1.2 continued: Allocations From Foreign Assistance Accounts to Meet Water for the Poor Statutory Requirements by Funding Account ($ millions)
Fiscal Year 2008 Fiscal Year 2009 Fiscal Year 2010
2008-2010
Region Mission DA CSH ESF AEECA IDA GHAI
Grand Total DA
GHCS/USAID ESF
AEECA IDA
Grand Total DA
GHCS/USAID ESF
AEECA
Grand Total
Mission Total
Africa cont. Tanzania 3.000 0.145 3.000 5.000 5.000 5.000 5.000 13.000
Uganda 2.000 0.250 1.528 2.250 5.000 0.250 5.250 6.500 0.250 6.750 14.250
Zambia 2.000 0.900 0.005 2.900 3.200 0.900 4.100 5.000 0.900 5.900 12.900
USAID Africa Regional 7.065 0.360 7.425 4.000 4.000 4.000 4.000 15.425
USAID East Africa Regional 1.000 1.000 1.000 1.000 3.000 3.000 5.000
USAID Southern Africa Regional 2.000 2.000 2.000 2.000 3.000 3.000 7.000
USAID West Africa Regional 3.000 3.000 8.000 8.000 8.000 8.000 19.000
Africa Allocation from Office of Development Partners 0.000
10.000 10.000 10.000
Attributions
10.000
15.000
25.000 25.000
AFRICA TOTAL
52.084
13.500
15.200 0.000
15.000
12.468
95.784
66.950 17.690
26.000 0.000
0.000
110.640
76.000 16.670
32.000 2.000
126.670 333.094
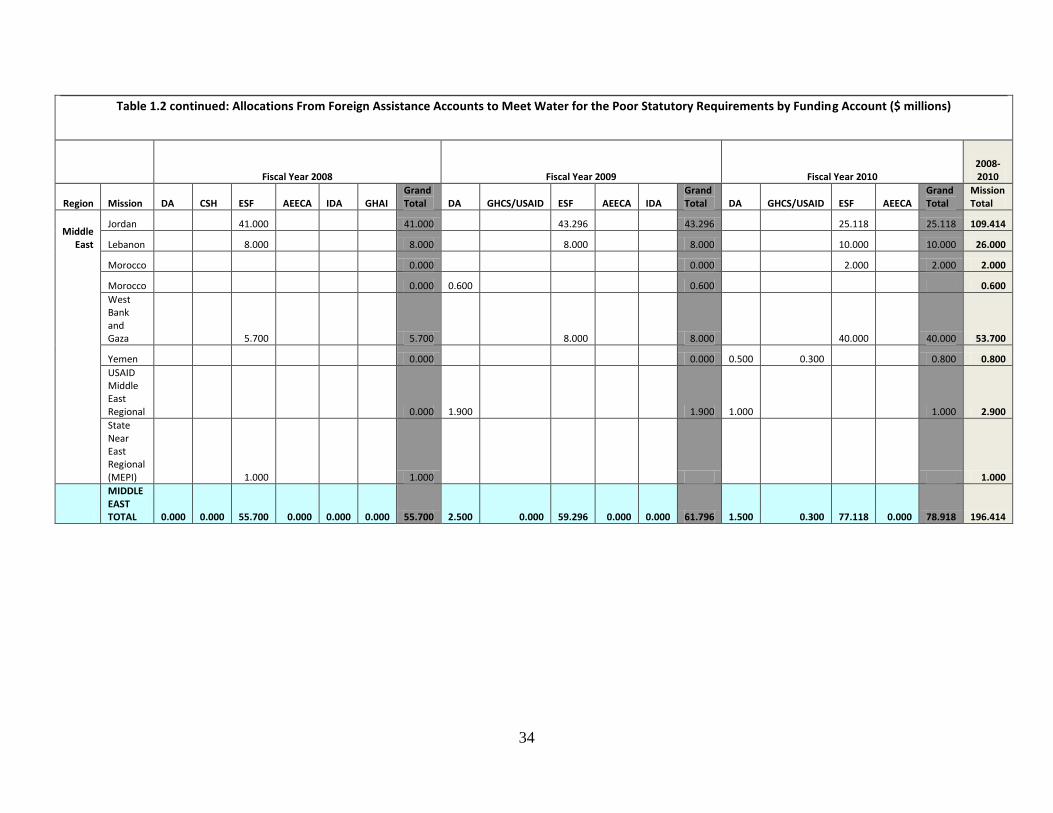
34
Table 1.2 continued: Allocations From Foreign Assistance Accounts to Meet Water for the Poor Statutory Requirements by Funding Account ($ millions)
Fiscal Year 2008 Fiscal Year 2009 Fiscal Year 2010
2008-2010
Region Mission DA CSH ESF AEECA IDA GHAI Grand Total DA GHCS/USAID ESF AEECA IDA
Grand Total DA GHCS/USAID ESF AEECA
Grand Total
Mission Total
Middle East
Jordan 41.000 41.000 43.296 43.296 25.118 25.118 109.414
Lebanon 8.000 8.000 8.000 8.000 10.000 10.000 26.000
Morocco 0.000 0.000 2.000 2.000 2.000
Morocco 0.000 0.600 0.600 0.600
West Bank and Gaza 5.700 5.700 8.000 8.000 40.000 40.000 53.700
Yemen 0.000 0.000 0.500 0.300 0.800 0.800
USAID Middle East Regional 0.000 1.900 1.900 1.000 1.000 2.900
State Near East Regional (MEPI) 1.000 1.000 1.000
MIDDLE EAST TOTAL 0.000 0.000 55.700 0.000 0.000 0.000 55.700 2.500 0.000 59.296 0.000 0.000 61.796 1.500 0.300 77.118 0.000 78.918 196.414

35
Table 1.2 continued: Allocations From Foreign Assistance Accounts to Meet Water for the Poor Statutory Requirements by Funding Account ($ million)
Fiscal Year 2008 Fiscal Year 2009 Fiscal Year 2010
2008-2010
Region Mission DA CSH ESF AEECA IDA GHAI Grand Total DA GHCS/USAID ESF AEECA IDA
Grand Total DA GHCS/USAID ESF AEECA
Grand Total
Mission Total
Asia Afghanistan 11.894 2.000 4.505 18.399 2.500 18.000 20.500 2.500 27.156 29.656 68.555
Bangladesh 4.400 1.500 5.900 1.500 1.500 1.000 1.500 2.500 9.900
Cambodia 4.000 1.350 5.350 1.350 1.350 1.350 1.350 8.050
India 3.000 1.000 4.000 2.000 1.000 3.000 1.250 1.000 2.250 9.250
Indonesia 12.500 4.350 16.850 2.000 7.673 9.673 0.150 9.823 9.973 36.496
Kyrgyz Republic 0.000 1.630 1.630 1.630
Pakistan 2.950 2.500 1.650 7.100 3.500 21.805 25.305 3.500 12.507 16.007 48.412
Philippines 0.250 1.269 1.519 2.508 0.339 2.847 1.250 0.339 1.589 5.955
Sri Lanka 0.000 0.000 0.000
Tajikistan 0.000 1.821 1.821 0.031 0.850 0.881 2.702
Timor-Leste 5.000 5.000 5.000 5.000 2.000 2.000 12.000
Uzbekistan 0.000 0.200 0.200 0.200
Asia Middle East Regional 0.000 2.000 2.000 2.000 2.000 4.000
USAID Regional Development Mission-Asia 7.700 7.700 7.000 7.000 7.000 7.000 21.700
Asia and Near East Regional 3.170 3.170 3.170
ASIA TOTAL 54.864 12.700 7.424 0.000 0.000 0.000 74.988 20.508 10.189 47.478 3.651 0.000 81.826 14.500 10.370 49.486 0.850 75.206 232.020

36
Table 1.2 continued: Allocations from Foreign Assistance Accounts to Meet Water for the Poor Statutory Requirements by Funding Account ($ millions)
Fiscal Year 2008 Fiscal Year 2009 Fiscal Year 2010
2008-2010
Region Mission DA CSH ESF AEECA IDA GHAI Grand Total DA GHCS/USAID ESF AEECA IDA
Grand Total DA GHCS/USAID ESF AEECA
Grand Total
Mission Total
Central Programs
USAID Democracy Conflict and Humanitarian Assistance (DCHA) 0.000 0.341 0.341 0.341
USAID Economic Growth, Agriculture and Trade 9.086 9.086 9.340 9.340 8.920 8.920 27.346
USAID Global Health 5.200 5.200 5.200 5.200 5.200 5.200 15.600
USAID ODP- Development Grants Program 0.000 8.000 8.000 18.000 18.000 26.000
CENTRAL PROGRAMS TOTAL 9.086 5.200 0.000 0.000 0.000 0.000 14.286 17.340 5.200 0.000 0.000 0.341 22.881 26.920 5.200 0.000 0.000 32.120 69.287

37
Table 1.2 continued: Allocations from Foreign Assistance Accounts to Meet Water for the Poor Statutory Requirements by Funding Account ($ millions)
Fiscal Year 2008 Fiscal Year 2009 Fiscal Year 2010
2008-2010
Region Mission DA CSH ESF AEECA IDA GHAI Grand Total DA GHCS/USAID ESF AEECA IDA
Grand Total DA GHCS/USAID ESF AEECA
Grand Total
Mission Total
Latin America and the Caribbean
Bolivia 3.000 3.000 2.500 0.700 3.200 3.200 0.700 3.900 10.100
Dominican Republic 2.200 2.200 2.400 2.400 4.600
Colombia 0.000 0.000 0.700 0.700 0.700
Ecuador 3.000 2.000 0.794 5.794 3.000 3.000 3.000 3.000 11.794
Guatemala 0.000 0.750 0.250 1.000 1.000 0.250 1.250 2.250
Haiti 0.562 0.500 2.425 0.010 3.497 0.500 8.500 9.000 0.500 10.000 10.500 22.997
Mexico 1.000 1.000 1.000
Nicaragua 1.000 1.000 2.000 2.000 2.353 0.353 2.706 5.706
Peru 0.000 0.000 1.270 1.270 2.540 2.540
USAID Caribbean Regional 0.000 0.000 0.000
LATIN AMERICA AND THE CARIBBEAN TOTAL 10.762 2.500 3.219 0.000 0.000 0.010 16.491 3.219 0.000 0.000 0.010 16.491 10.650 1.450 8.500 0.000 0.000 20.600 47.741

38
Sources: Safeguarding the World's Water 2008, Senator Paul Simon Water for the Poor Act Report 2009, Table 1: Allocations 2010 (Not published yet)
Table 1.2 continued: Allocations from Foreign Assistance Accounts to Meet Water for the Poor Statutory Requirements by Funding Account ($ millions)
Fiscal Year 2008 Fiscal Year 2009 Fiscal Year 2010
2008-2010
Region Mission DA CSH ESF AEECA IDA GHAI
Grand Total DA
GHCS/USAID ESF
AEECA IDA
Grand Total DA
GHCS/USAID ESF
AEECA
Grand Total
Mission Total
Europe and Eurasia
Armenia 1.00
0 1.000 1.20
7 1.207 1.00
0 1.000 3.207
Georgia 0.53
0 0.530 0.50
0 0.500 0.50
0 0.500 1.530
Kosovo 4.50
0 4.500 0.000 2.00
0 2.000 6.500
Russia 0.000 0.000 0.17
0 0.170 0.170
Ukraine 0.000 0.000 1.00
0 1.000 1.000
EUROPE & EURASIA TOTAL 0 0
0.00
6.030 0.000 0.000 6.030 0.000 0.000 0.000
1.707 0.000 1.707 0.000 0.000 0.000
4.670 4.670 12.407
Other
State Oceans and International Environmental and Scientific Affairs (OES)
0.50 0.500 0.550 0.550 2.000 2.000 3.050
Unallocated
1.00
18.103 19.103 19.103
TOTAL 126.796
33.900
84.343
6.030
33.103
12.478
284.182
110.517 33.079
133.324
5.368
16.832
290.050
120.370 41.040
160.604
7.520
340.184 914.416

39
Table 2: Percentage of population without access to improved sanitation facilities for missions receiving WFP allocations in 2008 or 2009
Country
Proportion of population without access to an improved sanitation facility (urban)
Proportion of population without access to an improved sanitation facility (rural)
Proportion of population without access to an improved sanitation facility (total)
Kosovo** - - - Uzbekistan - - - Lebanon 0 - - Niger 66 96 91 Chad 77 96 91 Madagascar 85 90 89 Burkina Faso 67 94 89 Ethiopia 71 92 88 Togo 76 97 88 Benin 76 96 88 Sierra Leone 76 94 87 Ghana 82 93 87 Eritrea 48 96 86 Mozambique 62 96 83 Haiti 76 90 83 Liberia 75 96 83 Guinea-Bissau 51 91 79 Somalia 48 94 77
Democratic Republic of the Congo 77 77 77 Cote d'Ivoire 64 89 77 Tanzania 68 79 76 Bolivia 66 91 75 Cambodia 33 82 71 Kenya 73 68 69 India 46 79 69 Nepal 49 73 69 Nigeria 64 72 68 Namibia 40 83 67 Sudan 45 82 66 Mali 55 68 64 Comoros 50 70 64

40
Table 2 continued: Percentage of population without access to improved sanitation facilities for missions receiving WFP allocations in 2008 or 2009
Country
Proportion of population without access to an improved sanitation facility (urban)
Proportion of population without access to an improved sanitation facility (rural)
Proportion of population without access to an improved sanitation facility (total)
Afghanistan 40 70 63 Zimbabwe 44 63 56
Papua New Guinea 29 59 55 Azerbaijan 49 61 55 Pakistan 28 71 55 Burundi 51 54 54 Uganda 62 51 52 Zambia 41 57 51 Timor-Leste 24 60 50 Senegal 31 62 49 Indonesia 33 64 48 Nicaragua 37 63 48 Yemen 6 67 48 Bangladesh 44 48 47 Laos 14 62 47 Rwanda 50 45 46 Malawi 49 43 44 Angola 14 82 43 Botswana 26 61 40 Peru 19 64 32 Iraq 24 34 27 Colombia 19 45 26 Vietnam 6 33 25 Philippines 20 31 24 South Africa 16 35 23 Burma 14 21 19 Guatemala 11 27 19
Dominican Republic 13 26 17 Mexico 10 32 15 Russia 7 30 13 West Bank/Gaza 9 16 11 Armenia 5 20 10 Sri Lanka 12 8 9

41
Table 2 continued: Percentage of population without access to improved sanitation facilities for missions receiving WFP allocations in 2008 or 2009
Country
Proportion of population without access to an improved sanitation facility (urban)
Proportion of population without access to an improved sanitation facility (rural)
Proportion of population without access to an improved sanitation facility (total)
Ecuador 4 16 8 Egypt 3 8 6 Tajikistan 5 6 6 Jordan 2 3 2
Source: WHO/UNICEF Progress on Sanitation and Drinking-Water 2010 Update pages 38-52; 2008 data **No information available for Kosovo Note: This table shows countries ranked by the proportion of the population without access to an improved sanitation facility. The countries highlighted in green are "priority countries" for US water and sanitation activities for the 2009 fiscal year. The priority countries are listed on Page 7 of the Senator Paul Simon Water for the Poor Act Report to Congress, June 2010- DRAFT.

42
Table 2.2: Percentage of population without access to improved water source for missions receiving WFP allocations in 2008 or 2009
Country Proportion of population without
access to an improved drinking
water source (urban)
Proportion of population without
access to an improved drinking
water source (rural)
Proportion of population without
access to an improved drinking
water source (total)
Kosovo** - - - Somalia 33 91 70 Ethiopia 2 74 62
Papua New Guinea 13 67 60 Madagascar 29 71 59 Democratic
Republic of the Congo
20 72 54
Mozambique 23 71 53 Niger 4 61 52
Afghanistan 22 61 52 Sierra Leone 14 74 51
Chad 33 56 50 Angola 40 62 50
Tanzania 20 55 46 Mali 19 56 44
Sudan 36 48 43 Laos 28 49 43
Nigeria 25 58 42 Kenya 17 48 41 Togo 13 59 40
Zambia 13 54 40 Eritrea 26 43 39
Guinea-Bissau 17 49 39 Cambodia 19 44 39
Yemen 28 43 38 Yemen 28 43 38
Haiti 29 45 37 Rwanda 23 38 35 Uganda 9 36 33 Liberia 21 49 32
Timor-Leste 14 37 31 Senegal 8 48 31
Tajikistan 6 39 30 Burma 25 31 29

43
Table 2.2 continued: Percentage of population without access to improved water source for missions receiving WFP allocations in 2008 or 2009
Country Proportion of population without
access to an improved drinking
water source (urban)
Proportion of population without
access to an improved drinking
water source (rural)
Proportion of population without
access to an improved drinking
water source (total)
Burundi 17 29 28 Benin 16 31 25
Burkina Faso 5 28 24 Iraq 9 45 21
Cote d'Ivoire 7 32 20 Azerbaijan 12 29 20 Indonesia 11 29 20
Bangladesh 15 22 20 Malawi 5 23 20 Ghana 10 26 18
Zimbabwe 1 28 18 Peru 10 39 18 Peru 10 39 18
Nicaragua 2 32 15 Bolivia 1 33 14
Dominican Republic 13 16 14 Uzbekistan 2 19 13
India 4 16 12 Nepal 7 13 12
Pakistan 5 13 10 Sri Lanka 2 12 10
Philippines 7 13 9 South Africa 1 22 9
West Bank/Gaza 9 9 9 Namibia 1 12 8
Colombia 1 27 8 Vietnam 1 8 6
Guatemala 2 10 6 Mexico 4 13 6 Ecuador 3 12 6
Botswana 1 10 5 Comoros 9 3 5 Comoros 9 3 5
Russia 2 11 4

44
Table 2.2 continued: Percentage of population without access to improved water source for missions receiving WFP allocations in 2008 or 2009
Country
Proportion of population without access to an improved drinking water source (urban)
Proportion of population without access to an improved drinking water source (rural)
Proportion of population without access to an improved drinking water source (total)
Armenia 2 7 4 Jordan 2 9 4 Georgia 0 4 2 Egypt 0 2 1 Lebanon 0 0 0
Source: WHO/UNICEF Progress on Sanitation and Drinking-Water 2010 Update pages 38-52; 2008 data **No information available for Kosovo Note: This table shows countries ranked in descending order by the proportion of the population without access to an improved water source. The countries highlighted in green are "priority countries" for US water and sanitation activities for the 2009 fiscal year. The priority countries are listed on Page 7 of the Senator Paul Simon Water for the Poor Act Report to Congress, June 2010- DRAFT.

45
Table 3 : Key dimensions of USAID missions' water and sanitation program funded by WFP 2008 (Y = Yes)
Mission
Infrastructure & Facility
Construction Type of Programs Capacity Building Enabling
Environment
Modification New
Strategy
Assessment of Water &
Sanitation sector
Water Supply Sanitation
Point
of Use Hygiene School Municipality Utility
CBO/NGO Policy
Access
to Finance
Africa Regional Program Y Y Y Y
USAID East Africa Regional Y Y Y
USAID Southern
Africa Regional
USAID
West Africa Regional Y* Y* Y*
Afghanistan Y
Bangladesh
India Y Y Y Y Y
Pakistan Y Y Y Y
Indonesia Y Y Y Y
Philippines Y Y
Tajikistan Y
RDMA Y Y Y Y
ECO-Asia Y Y
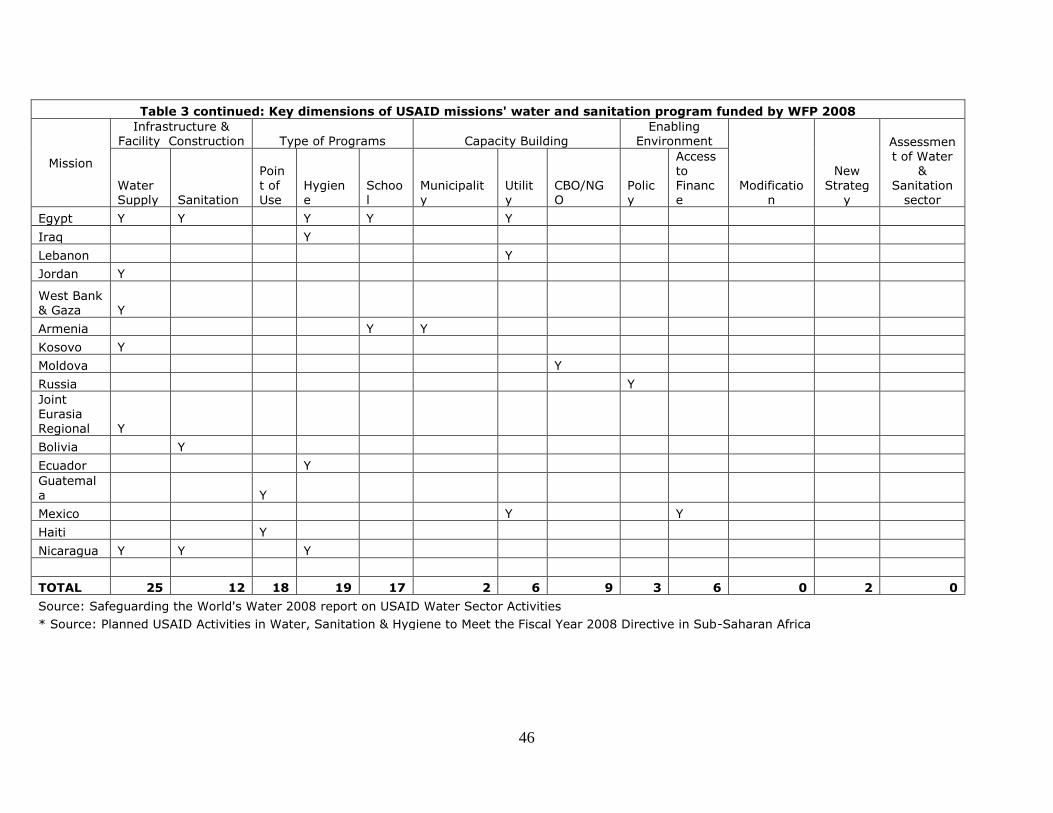
46
Table 3 continued: Key dimensions of USAID missions' water and sanitation program funded by WFP 2008
Mission
Infrastructure & Facility Construction Type of Programs Capacity Building
Enabling Environment
Modification
New Strateg
y
Assessment of Water
& Sanitation
sector Water Supply Sanitation
Point of Use
Hygiene
School
Municipality
Utility
CBO/NGO
Policy
Access to Finance
Egypt Y Y Y Y Y
Iraq Y
Lebanon Y
Jordan Y
West Bank & Gaza Y
Armenia Y Y
Kosovo Y
Moldova Y
Russia Y
Joint Eurasia Regional Y
Bolivia Y
Ecuador Y
Guatemala Y
Mexico Y Y
Haiti Y
Nicaragua Y Y Y
TOTAL 25 12 18 19 17 2 6 9 3 6 0 2 0
Source: Safeguarding the World's Water 2008 report on USAID Water Sector Activities
* Source: Planned USAID Activities in Water, Sanitation & Hygiene to Meet the Fiscal Year 2008 Directive in Sub-Saharan Africa

47
Table 3.2 Key dimensions of USAID missions' water and sanitation program funded by WFP 2009
Mission
Infrastructure & Facility
Construction Type of Programs Capacity Building Enabling
Environment
Modification New
Strategy
Assessment of Water & Sanitation
sector Water Supply Sanitation
Point of Use Hygiene School Municipality Utility NGO/CBO Policy
Access to Finance
Angola Y Y Y Y
Benin* Y Y
Burkina Faso*
Burundi* Y Y Y
DRC Y Y Y Y Y Y Y
Chad* Y Y Y
Ethiopia Y Y Y Y Y Y Y
Ghana Y Y Y Y
Kenya* Y Y Y Y
Liberia Y Y Y
Madagascar** Y Y Y Y
Malawi* Y Y Y
Mali* Y Y Y
Mozambique* Y Y Y Y
Nigeria Y Y Y Y Y Y Y
Rwanda* Y Y
Senegal* Y Y Y Y
Somalia Y Y Y Y
Sudan* Y Y Y Y Y Y Y
Tanzania Y Y Y Y
Uganda* Y Y Y
Zambia* Y Y Y Y Y
Zimbabwe* Y Y

48
Table 3.2 continued: Key dimensions of USAID missions' water and sanitation program funded by WFP 2009
Mission
Infrastructure & Facility
Construction Type of Programs Capacity Building Enabling
Environment
Modification New
Strategy
Assessment of Water & Sanitation
sector Water Supply Sanitation
Point of Use Hygiene School Municipality Utilities NGO/CBO Policy
Access to Finance
USAID Africa
Regional Program* Y
USAID East
Africa Regional* Y Y Y Y Y
USAID Southern Africa Regional * Y Y Y Y Y
USAID West Africa Regional* Y Y
Afghanistan Y Y Y Y
Bangladesh Y Y
Cambodia Y Y Y
India Y Y Y
Indonesia Y Y
Pakistan Y Y Y Y Y
Philippines Y Y Y Y Y Y
Timor Y Y
Armenia Y Y Y Y
Georgia Y Y Y
Kosovo Y Y Y Y

49
Table 3.2 continued: Key dimensions of USAID missions' water and sanitation program funded by WFP 2009
Mission
Infrastructure & Facility
Construction Type of Programs Capacity Building
Enabling
Environment
Modification New
Strategy
Assessment of Water & Sanitation
sector Water Supply Sanitation
Point of Use Hygiene School Municipality Utilities NGO/CBOs Policy
Access to Finance
Dominican
Republic Y Y Y Y
Ecuador Y Y Y Y
Haiti Y Y Y Y Y
Jordan Y Y
Lebanon Y Y
West Bank/Gaza Y Y Y
TOTAL 27 24 24 27 21 5 6 10 0 4 2 4 6
*Source: Summary USAID Water Activities in Sub-Saharan Africa: Meeting the Directive under the Senator Paul Simon Water for the Poor Act of 2005
(FY 2009)
Source: Senator Paul Simon Water for the Poor Act Report to Congress June 2010 DRAFT ** Source: Summary of USAID Water Activities in Sub-Saharan Africa: Meeting the Directive under the Senator Paul Simon Water for the Poor Act of 2005 FY 2009

50
Table 4 Best Practices in WASH implementation by Sub-Saharan African Missions
Mission Major Procurement for WASH contractors
Modification New Strategy Assessment of Water & Sanitation Sector
Other
Democratic Republic of the Congo
March/April 2009 Axes Project conducted an evaluation that included water & sanitation sector
Kenya Developed mission wide strategy to guide WASH programming that features multiple-use systems and improves food security & incomes (FY 2009)
Burundi USG resources supported 3 comprehensive studies on water resources management which produced two sector policies; as well as an institutional framework (FY 09)
Ethiopia $4,346,400 allocated to community based small service providers and the pastoral livelihoods initiative (FY 09)
Funded a water consultant to begin the mission's long-term water development strategy (FY 09)
Ghana Developed a WatSan strategy & released a RFA for the WatSan Project (FY 09)
USG hired a Water & Sanitation Specialist to manage the program (FY 09)
Mozambique USG conducted an assessment in May 2009 to develop a strategic framework for multi-purpose water sanitation & hygiene programming

51
Table 4 continued: Best Practices in WASH implementation in Sub-Saharan African Missions
Mission Major Procurement for WASH
contractors
Modification New Strategy Assessment of Water &
Sanitation sector
Other
Senegal With FY 09 funds, USAID added a maternal and child
health component for the introduction and social marketing of a point of use water
purification product for diarrheal disease control.
The USG designed and established several integrated
implementing mechanisms for WASH activities (FY 2009)
Tanzania New integrated WSH program set to begin in Q2 of FY10 (formed
from the findings and
recommendations from the sector rapid assessment
Conducted a water supply, sanitation and hygiene sector
rapid assessment
(FY 09)
Uganda $3,000,000 allocated
for the Northern Uganda Development of Enhanced Local Governance, Infrastructure and livelihoods (NUDEIL)
program. Program
will rehabilitate & build approximately 400 boreholes and/or shallow wells in the target area.
Situational analysis
carried out on Pader and Kitgum, Uganda(FY 09)
*Source: Summary USAID Water Activities in Sub-Saharan Africa: Meeting the Directive under the Senator Paul Simon WFPA
of 2005 (FY 2009)