the importance of emerging capital markets stern...
TRANSCRIPT
1
The Importance of Emerging Capital Markets
by
Richard M. Levich
Stern School of BusinessNew York University
First Draft: November 20, 2000
Revised Draft: December 15, 2000
Current Draft: March 1, 2001
_____________
Prepared for the Brookings-Wharton Papers on Financial Services, 4th Annual Conference on “Integratingthe Emerging Market Countries into the Global Financial System,” Washington, D.C., January 11-2, 2001.

2
The Importance of Emerging Capital Marketsby
Richard M. Levich_________________________
1. Introduction
In a little under two decades, the spread of market-oriented policies has turned the
once so-called lesser-developed countries into emerging markets. In 1982, the 32
developing country stock markets surveyed by the International Finance Corporation (IFC)
had a market capitalization of $67 billion representing about 2.5% of world market
capitalization. By the end of 1999, the IFC identified 81 emerging stock markets with total
market capitalization exceeding $3,000 billion or 8.5% of world equity market
capitalization. In 1999, the value of outstanding domestic debt securities trading in
emerging markets exceeded $1.4 trillion, representing 4.7% of the global bond market and
a several-fold increase over the total 20 years earlier. On the other hand, bank lending to
emerging markets in 1999 totaled only $783.7 billion (11.9% of consolidated international
claims of BIS reporting banks), a relatively small increase over the $517.6 billion (36.9% of
the total) in claims held by banks in 1980.
Many forces underlie these broad trends. The debt crisis of the early 1980s cooled
bankers’ appetite for sovereign loans to developing nations. The financial crises in the
second half of the 1990s (in Mexico 1995, Asia 1997, and Russia 1998 along with other
hot spots) brought a fresh reminder of the perils of cross-border lending. In contrast, public
financial markets for equity and debt securities were encouraged by market-oriented
policies to permit private ownership of economic activities, including ownership to a larger
extent by foreigners. Massive privatization programs, corporate restructuring, and financial

3
innovations (such as global offerings and changes to the financial infrastructure) helped to
fuel the process.
As dramatic as these changes have been, emerging financial markets still reflect a
continuum of market conditions. Some markets are maturing and on course toward
converging and integrating into the world of mature, developed financial markets. Markets
in other countries are almost non-existent or deserving of the “frontier” label given by the
IFC to markets one step below emerging.
This paper will present data that sketches the size and scope of financial markets in
emerging nations. Our focus is on the markets for foreign exchange, debt securities,
equities, and bank lending in emerging nations. We will present descriptive information
about these markets, and analyze some of the important institutional features that have
affected their growth and development. While the paper is largely descriptive, we will
attempt to analyze the overall importance of emerging financial markets, not from the
standpoint of how they contribute to their own national development, but rather from the
standpoint of how they contribute to the opportunities for investors and financial
intermediaries from developed nations.
In international economics, it is often the case that the gains from international trade
in goods or capital are proportional to the difference in some measure between the two
trading nations. Thus, the gains from trade are enhanced when there is a greater
difference in relative factor endowments, relative prices, or technology on a pre-trade
basis. In many respects, economists have used this concept to assess the impact of
bringing emerging financial markets into the picture. The potential gains are greatest as
the pre-trade marginal product of capital differs (expected value gains) or as the time

4
pattern of asset returns differ (diversification gains from imperfect correlation in
business cycles or financial market conditions).
However, an argument can be made that emerging markets have paid a price for
being “too different,” meaning laden with idiosyncratic risks, weak institutions, and poor
corporate governance. These are properties that discourage investors and lessen the
prospects for reaping the full gains from international trade in capital. If this is the case,
then emerging markets may find that their future lies in becoming more integrated into
the world financial markets rather than remaining on the fringes where they risk being
marginalized. A related consideration is whether countries should attempt to reform their
own institutions and markets to encourage this type of integration, or simply “outsource”
many financial market activities (such as listing, clearing and settlement) to more
mature markets that have experience and credibility.
In the next section of this paper, we present an overview of emerging nations and
the nature of their financial markets. In Section 3, we review more detailed data on the
markets for foreign exchange, fixed income, equity, and bank lending in emerging
markets. Where appropriate, we assess primary as well as secondary market data, and
the role of recent and prospective innovations for the market. In Section 4, we re-
examine the importance of emerging markets in light of recent findings about the nature
of emerging market returns and the investment opportunities open to investors from
mature markets. A summary and conclusions are in the final section.
2. A Helicopter View of Emerging Markets
a. Defining Emerging Markets and Countries
5
To begin, it is important to define what we mean by an emerging market (EM).
The International Finance Corporation (IFC) uses income per capita and market
capitalization relative to GNP for classifying equity markets. If either (1) a market
resides in a low- or middle-income economy, or (2) the ratio of investable market
capitalization to GNP is low, then the IFC classifies the market as emerging. The IFC
identified 81 such countries in their Emerging Stock Markets Factbook 2000. Countries
that meet the income criteria (in 1998, high income was defined by the World Bank as
$9,361 per capita GNP) and have an investable market capitalization to GNP ratio in the
top 25% of all emerging markets for three consecutive years become part of the
Emerging Markets Data Base (EMDB) Index.1 Currently, this index is comprised of 30
countries. Countries are “graduated” from the EMDB Index if their income rises into the
high-income category for three consecutive years.2
In September 1996, the IFC began calculating an index for “frontier” markets that
were relatively illiquid but still met several criteria based on market capitalization,
turnover, number of listings, and development prospects. Currently the S&P/IFC
Frontier Index is comprised of 20 countries.3 Figure 1 charts GNP per capita against
market capitalization as a percentage of GNP to show the general characteristics of
developed, emerging, and frontier equity markets.
1 Unless otherwise noted, all World Bank and IFC statistics are taken from various issues of the EmergingStock Markets Factbook, published by the International Finance Corporation from 1987-1999, and byStandard & Poor’s in 2000.2 In March 31, 1999, Portugal became the first graduate from the IFC emerging market indices.3 In 1998, Slovakia graduated from the Frontier Index to join the S&P/IFC Investable Index.

6
Perhaps surprisingly, several countries (South Korea, Mexico, Czech Republic,
Hungary, and Poland) are classified as emerging even though they are members of the
Organization for Economic Cooperation and Development (OECD). Greece, a member
of the OECD as well as the European Economic and Monetary Union (EMU), is also
classified as an emerging market. Figure 1 suggests that Greece may soon be a
candidate for graduation.4
Bond markets are classified as emerging on a similar basis. However, on those
criteria, both Hong Kong and Singapore (nations with high per capita GNP and well
developed equity markets) are classified as “emerging” from the standpoint of their bond
markets.
b. How Large are Global and Emerging Financial Markets?
Table 1 shows a snapshot of various absolute and relative size measures of
emerging and developed markets in 1998. As of 1998, the World Bank reported
development indicators for 206 countries, of which 155 (or about 75%) were classified
as emerging. As shown in Table 1, emerging market nations represent the vast majority
of the world’s population (about 85% of 5.8 billion people in 1998), but a far smaller
share of world GNP (only 21.7% of a $28.8 trillion world total in 1998). The combination
of low income and high population results in GNP per capita of only $1,246 in EM
nations, compared to $25,480 in the developed nations. Income growth in EM nations
4 Indeed, in July 2000, Morgan Stanley Capital International (MSCI), one of the leading providers of globalindices and benchmark related products, reclassified Greece as a developed market. The MSCI decisioncame shortly after Greek admission to EMU was announced. However, Standard and Poor’s continues toclassify Greece as an emerging market for the S&P/IFC indices.

7
has generally been faster so that the 21.7% share for emerging markets is the largest in
recent history, rising from about 12% in 1987. (See Figure 2)
By definition, financial markets in EM nations have a smaller profile than in
developed countries. While all developed countries have an equity marketplace, of the
155 EM nations only 81 have equity markets that are tracked in any way by the IFC.
And in those 81 markets, equity markets are small relative to their economies with
market capitalization at only 30-40% of GNP, as compared to 70-80% of GNP in the
developed markets (See Figure 3). Indeed, the surge of initial public offerings,
privatization sales and rising share prices helped push the market capitalization to GNP
ratio in developed markets to over 110% in 1998.
The major categories of financial markets have shown spectacular growth over
the last 20 years, but with few exceptions, the role played by emerging market nations
remains small. World equity market capitalization has grown from under $3.0 trillion in
1980 to over $36 trillion in 1999 (See Figure 4). Over this period, the EM share has
grown from roughly 3.0% to 8.5%, after hitting a peak of 12.5% in 1994. Over the same
period, the size of the world bond market has grown on a similar scale, from $4.0 trillion
in 1981 to more than $31 trillion in 1999.5 (See Figure 5) The share of debt securities in
emerging markets has grown from around 3.0% in 1990 to almost 5.0% in 1999,
representing $1.4 trillion in outstanding bonds.6 (See Figure 6) Like equity markets,
5 The size of the bond market is based on the face value of bonds outstanding and not current marketvalues. See Merrill Lynch, “Size and Structure of the World Bond Market,” various issues.6 Bank for International Settlements, International Monetary and Banking Developments, Table 16a.Merrill Lynch estimates the local debt market in emerging markets at $1.2 trillion or 3.86% of the globaltotal in 1999.

8
bond market capitalization relative to GDP is far smaller in emerging markets than in
developed markets (See Table 1). Worldwide trading in the foreign exchange (FX)
market has expanded from $620 billion per day in 1989 to $1,500 billion per day in
1998. This market is also predominately located in the same high-income countries as
other financial markets (See Table 1). But Singapore and Hong Kong retain a 7% and
4% share (respectively) of total global trading, while another 3.3% of FX trading is
spread across more than 20 other EM countries.7
Over the last 25 years, derivatives markets for financial futures, options, and
swaps have grown from negligible or non-existent markets to gargantuan and essential
components of international financial management.8 The BIS estimates that the notional
value of outstanding financial derivative instruments (i.e. futures, options, and swaps on
currencies, interest rates, and stock market indices) exceeded $100 trillion at year-end
1999. And daily turnover in exchange traded financial derivative instruments exceeded
$1.3 trillion in 1999.9 Hong Kong and Singapore together accounted for 10% of global
over-the-counter FX derivative turnover in 1998, but only about 2% of global over-the
counter interest rate derivative turnover. Many EM nations have organized futures and
options exchanges for some agricultural products, metals, or local foreign currency and
interest rate products. These markets are small by world standards with the exception of
Brazil and Korea.10
7 Bank for International Settlements, Central Bank Survey of Foreign Exchange and Derivatives MarketActivity 1998, May 1999.8 The Economist referred to swaps as “the glue that binds together the world’s financial system.” See TheEconomist, June 10, 2000, page 81.9 Bank for International Settlements, BIS Quarterly Review, August 2000, pp. 29-30.10 The Korea Stock Exchange is a notable exception. Options on the KOSPI 200 were the most activelytraded option contract in the world in 1999, with turnover totaling 80 million contracts.
9
Overall, these figures leave the impression that financial markets in emerging
markets are small in comparison to their own economies and in comparison to markets
elsewhere. Still, small may be beautiful if investments in emerging markets offer
superior returns or happen to be weakly correlated with other investment returns so that
they contribute a diversification benefit.
Measures of Integration – Price and Quantity
Regardless of whether emerging markets are segmented from or integrated with
financial markets in the rest of the world, they may still make an important addition to
the investor’s opportunity set. Marketplaces are said to be segmented when they offer
different returns for the same unit of risk bearing. Marketplaces are integrated when
they offer similar returns for investments that reflect similar measures of risk.
When segmentation is present, we expect that investors from the capital
abundant country where returns are low will make investments in the capital scarce
country where the marginal product of capital (and returns) are high. Investments of this
sort should eventually equalize the returns across markets, and integrate the markets.
Or consider a case where investors in one market (A) will buy bonds from a issuer at a
9.0% yield, but another group of investors (perhaps offshore) would pay a higher price
for the same bonds to yield 8.5%. This difference in evaluation reflects a market
segmentation, which should eventually close as the issuer offers more bonds for sale
offshore, or investors in both locations converge on a similar pricing formula.
When markets are integrated, simple expected value gains are ruled out, but
diversification gains are still available to the extent that returns in emerging markets are

10
weakly correlated with core investments, and do not simply mimic the pattern of returns
on investments already in place. In such an idealized setting, the world is a single
market and emerging markets could be likened to a market segment, such as rust-belt
stocks, or small-firm stocks, or high-tech stocks. In this setting, a rational, index-style
investor will hold some proportion of a portfolio that reflects all risky assets, including
emerging market assets.
As a practical matter, segmentation and integration may be thought of as two
extreme points on a continuum. Integration may be time varying and many markets are
better described as either partially segmented or partially integrated.11 Testing for
integration versus segmentation is notoriously difficult. Integration implies that assets
with similar risks will have similar prices. If the classic one-factor asset pricing model
prevails, then asset returns will vary systematically only with that one single (global)
factor. If a multi-factor pricing model prevails, then emerging market assets will be
priced to reflect how much of each factor they represent, but using the prices that have
been established for these factors worldwide. The absence of substantial capital flows
(either gross or net) between markets need not imply market segmentation, because
investors could be (1) setting prices to eliminate expected value gains, and (2) using
synthetic instruments (e.g. tracking securities) to mimic the returns of overseas assets.
The presence of substantial capital flows (either gross or net) certainly establishes that
there are linkages between markets, but not necessarily integration.12
11 Bekaert and Harvey (1995).12 The pricing discrepancies in Shell Oil, Unilever, and other Siamese twin stocks observed by Froot andDabora (1999) suggests that even the market for the same company’s stock may not be integrated.

11
Data on net private capital flows to emerging markets in Table 2 show that these
flows were substantial, reaching $227 billion, or 3.5% of GDP in 1995. Flows remained
robust in 1996, but fell off sharply in 1997 with the advent of the Asian crisis in July, and
fell further in 1998 when compounded by the Russian crisis in August. The change in
the composition of these flows is also significant. Net portfolio flows hit $110 billion in
1994 but fell to under $9 billion by 1998. Bank lending was curtailed with net reductions
in loans in 1997, 1998, and 1999. Net foreign direct investment (FDI) flows increased
substantially to nearly $150 billion in 1999. Indeed, FDI accounted for more than the
sum of all capital flows in 1998 and 1999, given that there were net redemptions in the
other two categories.
3. Financial Markets in Emerging Market Nations
a. Foreign Exchange Markets
Although foreign exchange is the world’s largest financial market, there is little
systematic reporting of turnover activity. The Bank for International Settlements conducts a
triennial survey of the foreign exchange market that reflects the most systematic effort to
measure the size of the foreign exchange market. The most recent survey, conducted in
April 1998, covers 43 countries including 21 emerging markets as listed in Table 3. The
emerging market countries account for 14.45% of global foreign exchange trading activity,
with a somewhat higher share of spot market transactions (17.4%) and a lower share of
outright forward volume (9.3%). Our list includes Singapore and Hong Kong, which are
classified as developed markets for purposes of equity markets. Excluding Singapore and
Hong Kong, emerging markets account for only 3.47% of global foreign exchange

12
turnover. Roughly two-thirds of this trading is in the spot market. In most cases these
emerging market countries report trading is either outright forward contracts or FX swaps.
The BIS reports that the bulk of forwards and FX swaps are short term, but they can
extend out to one year, and longer in some cases.13
To gain another perspective on FX trading, we scale the annual volume of FX
trading by GNP, by GNP calculated using PPP exchange rates, and by equity market
capitalization. The results in Table 4 show that annual FX turnover is between and 27 and
31 times GNP in developed countries, and between 3 and 6 times GNP in emerging
markets (excluding Hong Kong and Singapore). Thus, FX turnover in developed markets
is roughly 4 to 10 times greater than in emerging markets. The results appear less
extreme when we scale by equity market capitalization. Annual FX turnover is about 40
times market capitalization in developed countries, but only about 22 times market
capitalization in emerging markets – a difference of about 2-to-1. A scatter diagram of
foreign exchange trading volume versus equity market capitalization (see Figure 7) shows
several developed countries that plot within the range of emerging countries. However,
these developed countries with small FX markets tend to be those (Austria, Finland,
Ireland, Portugal, Sweden) that were linked to the Deutsche Mark, or now to the euro, and
have less need to structure their own local currency market.
b. Bank Lending
Over the last 20 years, the role of bank lending to emerging markets has varied,
with banks at times being a major supplier of funds and at other times withdrawing funds
13 In some cases a non-deliverable forward contract is traded offshore even when there is an onshoremarket for forwards. See J.P. Morgan Guide to Emerging Local Markets (1997).

13
and lowering exposures. In the period preceding the debt crisis of the 1980s, bank lending
represented virtually all of the net private flow of capital to developing countries. (See
Table 2) Throughout the 1980s, banks were writing down and withdrawing capital from
developing countries. The 1990s saw a resumption of bank lending, but from 1997-1999
banks reduced their lending to emerging market countries by more than $200 billion.
A recent study by Palmer (2000) focuses on U.S. bank exposure to emerging
market countries. While U.S. banks have increased their lending to foreign counterparties
by 11.2% (to $755.5 billion) in the two years ending June 1999, claims on emerging
market counterparties actually declined by 6.1% ($183.2 billion). Claims on emerging
market counterparties thus represented a 24.2% share of all U.S. bank claims on
foreigners, but only a 4.3% of U.S bank total assets. The decline in emerging market
lending by U.S. banks reflects a still shaper decline (-18.2%) in cross-border lending, and
a modest increase (8.8%) in local claims.14 This changing mix may reflect a desire to keep
an active presence in local markets, while reducing overall exposures.
In addition to cross-border and local claims, revaluation gains on foreign exchange
and derivative contracts represent a third category of possible exposure. At year-end
1997, U.S. banks had revaluation gains totaling $16.7 billion on derivative contracts – or
about 8.2% of their overall claims with emerging market counterparties. By June 1999,
these revaluation gains had been reduced to only $5.5 billion through a combination of
several factors. In some cases, the derivative contracts were short-term, and paid off. In
other cases, market fundamentals reversed course and removed gains from some
14 Local claims on foreign counterparties are booked in the overseas offices of the U.S. bank, while cross-border claims are usually booked from the U.S. bank’s head office.

14
derivative positions. And in other cases, banks wrote off some contracts where payment
seemed unlikely.
The longer run behavior of U.S. bank lending to emerging markets allows more
useful comparisons. In Table 5, we see the severe drop in U.S. bank claims between 1982
and 1990, followed by a substantial return to lending that puts claims on emerging markets
at $176.1 billion in 1998, or modestly above the level of 1982. However, the composition of
claims shows a radical shift away from cross-border claims and toward local claims, which
expanded seven-fold over the 16 years. To the extent that these local claims are funded
and denominated in local currency, banks are not exposed to the foreign currency risk in
cross-border lending. However, banks retain their exposure to counterparty credit risks,
which may be greater now with fewer explicit or implicit public sector guarantees in effect.
In the lower part of Table 5, we see that in 1982, U.S. bank claims on emerging
market counterparties amounted to 12% of total bank assets, and represented more than
200% of total bank capital. By 1998, emerging market claims represented only 4.3% of
U.S. banks total assets, and 41.6% of their total capital. This transformation resulted first
from a reduction in U.S. bank claims on emerging markets through about 1990, and
second from an increase in U.S. bank capital positions in 1994 and 1998.
Overall, these figures suggest that U.S. banks still have considerable exposure to
emerging market countries, even though it is substantially less than in the 1980s. As a
percentage of total assets, U.S. bank claims on emerging markets are smaller than these
countries’ share of world GNP or equity market capitalization, but similar to the share of
emerging market debt securities in the global market.

15
c. Debt Securities Markets
Regional Trends. In Figure 6, we referred to BIS data showing that the aggregate
size of emerging country debt markets has grown from about $450 billion in 1989 to over
$1.4 trillion in 1999, representing growth from about 3% to 5% of the world market. Taken
together, the Bank for International Settlements, Merrill Lynch, and J.P. Morgan report on
27 emerging market countries with domestic debt securities markets. A list of the 20
markets compiled by Merrill Lynch is presented in Table 6. Across these 20 markets,
Asian countries represent 60% of the overall market, with 21% in Latin America and the
remaining 19% in Eastern Europe, the Middle East and Africa. Government debt
represents 72% of the market, corporate debt about 25%, and the remainder represents
Eurobond issues by local obligors.
A closer look at the data reveals some important regional differences and
differences within regions. A local currency bond market may develop through fiscal deficit
financing. In Brazil and Mexico, we see that government bonds account for the entire local
bond market, and in Argentina and several European markets, the government share
exceeds 85%. A local currency bond market may also develop as a means to channel
high rates of domestic savings into private investments. In the nine Asian markets
(excluding China), corporate bonds account for 45% of their local bond markets, and
almost all (97%) of the corporate bonds across these 20 emerging markets.
Despite the higher savings propensity in East Asian countries, their bond markets
remain at varying stages of development. In Figure 8, we see that the local bond market
as a percentage of GDP clusters in the 30-50% range for Malaysia, Korea, Philippines and
India, while this ratio is under 10% in Hong Kong, Thailand, China and Indonesia. Despite

16
their relatively large size, a recent OECD report cautions that most emerging debt markets
lack a full yield curve running from one month to several years, and this prevents them
from functioning as deep and liquid markets.15 The Philippines is one exception with a
yield curve that extends to twenty years, albeit with questionable liquidity for certain issues.
Market liquidity could be influenced by size as well as institutional features such as
the presence of a short-term money market, or the use of government bonds for reserve
requirements. Estimates of the bid-ask spread as a measure of market liquidity are shown
in Figure 9. These spreads are huge in comparison to those in U.S. markets. The range of
spreads (from 5 basis points on Indian T-bills to 150 basis points on Indonesian T-bonds)
is also substantial, but no clear pattern emerges to relate these spreads to market size.
Whatever the source of supply, market development is aided when there is a strong
demand from institutional investors. Pension reforms in Latin America have helped
increase institutional demand. But elsewhere, restrictions on institutional investors and
inadequate regulations plus the dominant role of banks in emerging financial markets,
have held back institutional demand.16
Primary Markets. A recent study by Aylward and Glen (2000) chronicles the
development of primary markets for debt and equity securities in emerging markets.
Aylward and Glen examine primary securities activity over 1980-1995 for 32 countries
including 24 emerging markets, 4 Asian Tigers (Hong Kong, Korea, Singapore, and
Taiwan) and 4 developed countries (G4: Germany, Japan, United Kingdom, and United
15 “The Development of Fixed-Income Securities Markets in Emerging Market Economies: Key Issues andPolicy Actions,” Financial Market Trends, No. 74, October 1999.16 “The Development of Fixed-Income Securities Markets in Emerging Market Economies: Key Issues andPolicy Actions,” Financial Market Trends, No. 74, October 1999.
17
States). Over this 16-year period, these 32 countries raised $28.4 trillion through primary
markets, representing $13.4 trillion in the first 11 years (1980-90) and another $15.0 trillion
in the last 5 years (1991-95) as shown in Table 7.
In the 1991-95 period, almost 95% of the funds raised were debt securities, and not
surprisingly, the vast bulk of these (97%) were issued in the G4 and 4 Asian Tiger
countries.17 However, Aylward and Glen remind us that these same 8 countries also
represent more than 85% of world GDP. So on a relative basis, emerging markets may be
said to have relatively important primary capital markets. Once primary markets have been
scaled by GDP, the relative importance of primary markets appears less concentrated.
Indeed, in 1995 after scaling by GDP, eleven emerging market countries had primary
equity markets as large as the United States and larger than the other G3 countries.
However, in the primary debt markets, emerging nations lag far behind the G4 even when
scaled by GDP. This is not so apparent in the long-term government sector, but very
pronounced in the long-term private sector. As a result, emerging markets have turned
more to international issues (e.g. Yankee bonds, Eurobonds, and depositary receipt
programs) that represented 20% of all equity issues and 10% of all debt issues in the
1991-95 period. These international issues represent a separate channel of funding
outside of domestic primary markets.
Secondary Market Spreads. While our discussion has so far focused on domestic
debt securities markets, analysis of pricing and returns is generally based on a mixture of
17 Short-term debt issues are not included in these data. Private placements also are not included. Privatecapital sources could be important in emerging markets where wealth may be more concentrated. Butemerging markets may also lack institutional investors and venture capital firms that aid private capitalformation.

18
international and domestic issues. The J. P. Morgan Emerging Markets Bond Index Plus
(EMBI+) is a popular index for tracking the total return on traded emerging market debt
instruments.18 The EMBI+ includes external-currency denominated Brady bonds, loans,
Eurobonds and local market instruments. The current composition of EMBI+ includes 15
countries. As of June 30, 1995, the index was heavily weighted toward Brady issues (80%)
and Latin American countries (80%).
Not surprisingly, spreads on emerging market debt securities (relative to U.S.
Treasury yields) are typically large and prone to sharp jumps during crisis periods as
shown in Figure 10. In 1995 at the onset of the Mexican crisis, the yield spread on
emerging market issues spiked to over 1,700 basis points, compared to about 350 basis
points for U.S. high-yield bonds. During the Russian crisis, spreads spiked to over 1,200
basis points. The pattern of yield spreads varies somewhat across countries as shown in
Figure 11. Korean spreads spiked in late 1997 during their chapter of the Asian crisis, but
spreads in China, Hungary, and Russia were fairly tranquil. During the Russian crisis in
1998, virtually all markets spiked. After Brazil’s exchange rate crisis in early 1999, Latin
American spreads remained high, while spreads elsewhere declined more rapidly.
In addition, spreads are typically greater (and sometimes by substantially amounts)
for non-investment grade issues compared to investment-grade emerging market bonds.
During the Russian crisis (September 1998) spreads for B-rated obligors were nearly
2,000 basis points compared to a 375 basis points for BBB-rated obligors. Prior to the
18 See “Introducing the Emerging Markets Bond Index Plus (EMBI+),” J.P. Morgan Securities, Inc., July12, 1995 available through the J.P. Morgan website at <www.jpmorgan.com>.
19
Asian crisis (June 1997), B-rated obligors were priced at only 400 basis points over U.S.
Treasuries while the spread for BBB-rated firms was less than 175 basis points.19
Secondary Market Returns and Risk. In the environment just described, we expect
returns on emerging market bonds to be volatile. Measures of risk and return for the period
1991-2000 prepared by the International Monetary Fund (2000) are shown in Figure 12.
The annualized differential between emerging market returns (represented by the EMBI
Global Index) and mature market returns (based on an equally-weighted portfolio of U.S.
investment grade and non-investment grade corporate debt) is shown on the vertical axis.
The horizontal axis shows the impact on portfolio risk (σ) by rebalancing from a 100%
mature market portfolio to a 90% mature / 10% emerging market mix. Figure 12 shows
that in almost every year, emerging markets would have added risk, and sometimes a
substantial amount of risk, to a mature market portfolio. The impact on return was less
consistent, producing a positive contribution in some years and a negative contribution in
others. Over the entire sample, the IMF report concludes that emerging market debt would
have added about 5 percent per year to portfolio returns, but at a cost of adding 16 percent
to portfolio risk.20 The report suggests that given the more conservative posture of bond
investors and the lower return environment, this represents an unfavorable trade-off, and
that the case for adding emerging market bonds to a core portfolio depends on added
returns rather than on risk reduction.
The correlation between emerging bond market returns and other market returns
shows that emerging bond markets are priced in context with other markets, but that the
19 International Monetary Fund (2000), p. 64.20 Ibid., p. 67.

20
degree of correlation varies over time. For example, over the 1994-2000 period, the
correlation of weekly returns on the EMBI Global Index and returns on the Dow-Jones
Industrials, S&P 500, and NASDAQ indices was 0.39, 0.37 and 0.30 respectively. The
correlation of emerging market bonds with the Merrill Lynch U.S. high-yield bond index
was 0.38. All of these correlations are significant at the 5% level, but there is considerable
time variation as shown in Figure 13.21 A multivariate analysis by the IMF (2000, pp. 60-2)
shows that the U.S. high-yield market is always significant and the most important variable
explaining emerging market debt returns. U.S. equity returns also are always significant
explanatory variables. The results suggest that returns on emerging market debt are quite
sensitive to measures of profitability, the business cycle, and the risk appetite of investors
in mature markets.
d. Equity Markets
Regional and Institutional Comparisons. In Figure 4, we observed that the
emerging equity markets have grown since 1980 to reach an aggregate size of $3
trillion or about 8.5% of global market capitalization in 1999. This market capitalization
reflects the sum of 81 individual equity markets with market capitalization ranging from
$4 million for Azerbaijan to $376 billion for Taiwan. Among these 81 markets, the IFC
lists seven countries with market capitalization under $100 million, and 27 countries with
market capitalization under $1 billion.22 The largest emerging equity markets such as
Taiwan, China ($330 billion), and Korea ($308 billion) have larger market capitalization
21 Ibid., p. 60-1.22 To get another perspective on how small emerging equity markets are, note that the average marketcapitalization for a single New York Stock Exchange (NYSE) firm was $3.7 billion at year-end 1999, whilethe largest single firm, General Electric had a market capitalization of $575 billion.

21
than several developed country markets including Austria ($33 billion), New Zealand
($28 billion) and Singapore ($198 billion), but still at least an order of magnitude smaller
than developed country markets like the United States ($16.6 trillion), Japan ($4.6
trillion) or the United Kingdom ($2.9 trillion).
At year-end 1999, roughly one-half of the $3 trillion in emerging market
capitalization was in Asian markets, another 19% in Latin America, and the remaining
31% split evenly between Eastern European markets and Middle East/Africa. The 30
countries in the S&P/IFC investable index represent 95% of total emerging market
capitalization, while the 20 countries in the frontier index represent a mere 1% of the
total.
Despite the small size of emerging equity markets, more domestic companies
are listed on these exchanges (over 26,000) than in developed country markets (about
23,000 firms listed). (See Table 8) Thus, the average market capitalization per firm in
emerging markets ($117 million) is far smaller than in developed country markets
($1,413 million). Again, however, there is considerable variation. The largest average
market capitalization firms are in Mexico and Taiwan (both at $0.8 billion). This is a
larger figure than for several developed country markets such as Canada and New
Zealand.
Market concentration is another statistic with wide variation across countries. In
emerging market countries, the S&P/IFC measures concentration as the percentage of
market capitalization accounted for by the largest ten firms. According to this measure,
concentration in emerging markets varies from 30-60%. In developed countries, the
International Federation of Stock Exchanges measures concentration as the percentage

22
of market capitalization accounting for by the largest 5% of all firms. According to this
measure, concentration in developed country markets varies from 55-85%.
Market turnover, measured as the annual volume of trading as a percentage of
market capitalization, varies substantially across countries (column 5 of Table 8).
Among these countries, Korea has the highest turnover rate (347% in 1999) followed by
Taiwan with a 286% turnover rate. Several other countries (including the United States)
had turnover near to or exceeding 100%. At the other extreme, some developed
countries (such as Belgium) and emerging markets had turnover below 30%. These
data suggest that liquidity varies considerably across market, as high trading volume
tends to reduce liquidity risks and trading costs. But liquidity could vary as well within a
market, with greater liquidity for a small number of high capitalization stocks, and much
lower liquidity otherwise.
Other factors such as transaction taxes, explicit and implicit transaction costs,
and conditions for clearing and settlement affect the overall cost of trading and, in turn,
the volume of trading in a market. While many governments have imposed securities
transaction taxes, their impact has been muted by rules that allow investors to shift into
nontaxed substitutes or to shift their trading from onshore to offshore locations to avoid
taxation. In the last ten years, both developed and emerging markets have shown a
greater tendency to lower or eliminate rather than adding to their turnover taxes.
Stated settlement periods for equity transactions are fairly uniform around the
world. Many emerging markets stipulate settlement periods of T+3 days (e.g. Argentina,
Brazil, Czech Republic, Jordan, Peru, and Thailand), or T+2 days (e.g. Chile, Korea,
23
and Mexico), or even less.23 These compare favorably with the T+2 settlement cycle in
Germany, T+3 in the United States and Japan, and T+5 in London. However, these
figures mask differences in operational efficiency and the possibility of operational
failures post-trade that confront emerging equity markets.
S&P (2000, p. 402-3) provides survey information comparing settlement
performance, safekeeping in regard to the collection of dividends, and operational risks
across emerging market countries. The settlement performance benchmark, for
example, is based on the proportion of failed trades, the average trade size, length of
time for a failed trade, and local interest cost. While some emerging markets (e.g.
Turkey) have achieved settlement performance records that surpass many developed
markets, and many emerging markets are improving on these operational risk
benchmarks, the survey data give the impression that operational inefficiencies are
common and material in most emerging markets.
Finally, transaction costs are another factor that distinguish emerging from
developed markets. S&P (2000, p. 404) reports the results of a study that regularly
surveys the trading costs in both developed and emerging markets. These trading costs
include explicit costs such as brokerage commissions and fees, and the implicit impact
that trading has on market prices. Across 150 large global institutional investors
surveyed, average round-trip trading costs in the fourth quarter of 1999 were estimated
at 0.90 percent in developed country markets, and 1.80 percent in emerging markets. In
developed country markets, round-trip trading costs were lowest in France (0.53
23 Settlement is T+1 day in Uruguay and Taiwan, and even T+0 days for book entry securities in Poland.See Citibank Country Profiles, version 4.0, September 1998 for a list. See the International Federation ofStock Exchanges website <http://www.fibv.com/marketin.asp> for similar data.
24
percent) and highest in Ireland (1.73 percent).24 While in emerging markets, round-trip
trading costs were lowest in Brazil (0.88 percent) and highest in the Czech Republic
(3.59 percent).
Overall, these statistics show that emerging markets are a heterogeneous group
and differ from developed markets in some important categories such as size, liquidity,
trading costs and operational efficiency. Our description reinforces the view that a small
shift in investor allocations toward or away from emerging markets could have a large
impact on equity prices. It also suggests that higher trading costs and lower operating
efficiencies in emerging markets may underlie the trend toward trading depositary
receipts and tracking securities in developed markets.
Primary Markets. Earlier we noted the study by Aylward and Glen (2000) on the
development of primary markets for debt and equity in emerging markets. While
emerging equity markets are small, we see (in Table 7) that in 1991-95, primary equity
markets raised capital equal to 1.4% of GDP in emerging markets compared to only
1.0% of GDP in the G4 countries. Even over the entire 1980-95 period, equity capital
raised in emerging market countries (0.9% of GDP) is comparable to the G4 countries
(1.0% of GDP).
Despite this relative level of fundraising, absolute scale matters and may explain
why emerging markets have turned to international issues (such as depositary receipts)
as an additional source of equity funding. Depositary receipt programs were rare for
emerging markets prior to 1990. But in most years since 1992, emerging market
24 In this study, estimated trading costs for institutional investors in the United States were 0.70 percentbased on an average of NYSE and NASDAQ trading costs.

25
companies have accounted for the majority of new depositary receipt programs and
capital raised through this channel.25
Secondary Market Returns and Risk. Offering a detailed analysis of emerging
equity market return and risk is beyond the scope of this paper. Figure 12 plots the
return and risk properties of emerging market equities (the IFC investable index) in
relation to an MSCI index of mature markets. For the period January 1988 – June 2000,
the results show that emerging market equities produced 3% higher annual returns and
added about 1% to portfolio risk. In contrast to bonds, in several years (1989, 1992,
1993, and 1996) a 10% position in emerging equity markets would have reduced overall
portfolio risk.
Studies by Bekaert et al. (1998) and Bekaert and Harvey (1997) among others
suggest that the pattern of returns in emerging markets is much different from that in
developed markets. In particular, the evidence shows that emerging market returns are
generally nonnormally distributed, and that these deviations from normality appear to be
time varying as well. The presence of substantial skewness and kurtosis in returns
suggests that simple two-parameter asset pricing models where returns are a linear
function of systematic (beta) risk will fail. Indeed, the results in Bekaert et al. (1998) show
that returns in emerging markets can be related to volatility (total risk) and various other
economic and country risk measures.
The relative level of volatility in emerging versus mature markets and the correlation
of returns are important determinants of the gains from international diversification into
emerging markets. While volatility in emerging equity markets has historically exceeded
25 International Monetary Fund (2000) , p. 73.

26
volatility in mature markets, over the 1990s these volatilities tended to converge. The crisis
periods in 1994-5 and 1997-8 were exceptions where volatility in emerging markets
temporarily spiked.26 The correlation of mature and emerging equity markets has also
generally increased over the 1990s as shown in Table 9. Over the most recent 5-year
interval, the correlation of returns on the S&P 500 with the IFC regional indices as well as
the IFC global composite index is about 0.50. This is a sharp increase in correlation when
compared to the 1989-94 period, and an important element underlying the limited
diversification gains for portfolios containing an allocation to emerging market equities.
4. The Importance of Emerging Financial Markets Reconsidered
a. The Traditional Arguments Lending Importance to Emerging Markets
The traditional arguments lending support to a role for emerging markets in
developed market investor portfolio rested on two simple points. First, as small, capital
scarce countries, emerging markets could offer investors higher returns than those
available in more mature capital abundant countries. Given their low initial income levels,
continued capital flows could support an extended period of economic growth. Second,
again as small countries, emerging market returns were likely to be weakly correlated with
returns in developed markets, thus creating a diversification benefit. These effects could
operate in tandem, thus giving investors a free lunch of higher expected returns and lower
risks. Using historical data, portfolio theory was used to determine the optimal percentage
26 See International Monetary Fund (2000), p. 67.

27
of a portfolio to allocate to international securities, including emerging markets.27
While the simple story is appealing, it comes to a sudden halt when confronted with
data showing that investor portfolios are heavily weighted toward domestic securities. As
typically estimated, home country bias is so severe that in 1995, U.S. portfolios in the
aggregate are thought to hold only about 10% foreign equities and fewer than 5% foreign
bonds. Home bias appears to be strongest in Japan (roughly 5% in foreign equity
holdings) but less severe in the United Kingdom and Germany (roughly 20% in foreign
holdings).28
Explanations abound for home country bias. Some countries have severely limited
foreign ownership of domestic equity shares. Investing overseas takes greater resources
in the form of trading costs and arranging for many details attendant on foreign investing
(e.g. the foreign exchange transaction, clearing, settlement and custody of securities,
collection of foreign dividends, rights offerings, etc.). The foreign investor faces foreign
exchange risk, and possibly an information disadvantage as local investors may be better
informed or better equipped to receive and interpret foreign financial statements and news
about the foreign macroeconomic environment. It is true that institutional investors who
employ professional agents can overcome many of these barriers. But at the margin
foreign investing may still entail additional costs and risks.29
27 For example, using 1970-1996 data, Lewis (1999, p. 572) estimates that a 39% share in foreignsecurities would have allowed US$ based investors to reach the risk minimizing point on the mean-variance efficient frontier. Smith and Walter (1998) show that a 22% allocation to emerging markets withinthe foreign portfolio establishes another risk minimizing point. The implied overall share of emergingmarkets (0.39 x 0.22 = 0.086) is remarkably close to the market capitalization share of emerging marketsin the world market.28 See Tesar and Werner (1998), p. 298-9.29 Tesar and Werner (1998) contend that the high volume of cross-border trading in securities suggeststhat high transaction costs are probably not a barrier responsible for home country bias.

28
Alternate theories can be constructed that support overweighting home assets. For
example, Baxter, Jermann and King (1998) develop a model where investors also
consume nontraded goods that rely intensively on nontraded, domestic factors of
production. In their model, an overweight position in home equities is an effective hedge
against future consumption of nontraded goods. Other models introduce deviations from
Purchasing Power Parity as an additional international risk factor. When the PPP
assumption is dropped, domestic securities may form a better hedge against exchange
rate uncertainty than foreign securities, thereby creating a rationale for home country bias.
In this context, a study by Glassman and Riddick (1996) cannot reject that the observed
home-biased portfolio weights are equal to their optimal values. However a similar study
by Cooper and Kaplanis (1994) rejects PPP deviations as an explanation of home country
bias.
In a recent survey on home country bias in equities, Lewis (1999, p. 589) concludes
that “two decades of research on equity home bias has yet to provide a definitive answer
as to why domestic investors do not invest more heavily in foreign assets.” The evidence
on market integration does not directly address the home bias issue. The use of home
assets to hedge PPP deviations does not create a large demand for home assets. Lewis
finds no evidence that shares in multinationals provide an indirect way to gain international
diversification benefits. And while existing barriers to international investment are costly to
overcome, Lewis concludes that this is not a credible argument for home bias because (1)
the gains to international diversification appear substantial, and (2) the turnover rate in
foreign securities is higher than in domestic securities which undermines the cost
argument. Lewis suggests that the only plausible avenue left open is to consider the
29
impact of estimation error and uncertainty in the choice of foreign portfolio weights. Once
uncertainty is taken into account, we cannot reject the hypothesis that the expected
performance of home biased portfolios is no worse than the performance of portfolios with
foreign investments.
b. Recent Arguments for Overweighting Home Country Investments
A recent paper by Kraay et al. (2000) offers up a new set of stylized facts on 68
country portfolios, and a new theoretical approach to modeling the composition of
portfolios. The authors construct a new database that allows them to analyze the
composition of 68 country portfolios over a 30-year period ending in 1997. Their analysis
yields four stylized facts: (1) Net foreign assets as a percent of wealth is small and actually
negative for most countries. The exceptions are a few rich countries. (2) There is a strong
positive relation between a country’s net financial wealth and its net foreign asset position.
(3) The share of net foreign assets in a country’s portfolio is highly persistent. (4) Gross
foreign asset positions are small and consist mostly of foreign loans rather than foreign
equity.
To explain these patterns, the authors examine a simple model that imbeds a
probability of crisis and default. Given diminishing returns on capital and production risks,
all investors would hold the same portfolio of capital distributed to equalize the risk-
adjusted rate of return across countries. But the presence of sovereign risk generates a
home bias in the demand for capital. The interplay of these two factors determines the
shape of country portfolios. Kraay et al. show that small changes in benchmark values (in
particular, a small increment in political risk to two large scale defaults per century) are
30
sufficient to produce substantially home biased portfolios that are broadly similar to the
actual stylized figures.
As puzzling and troublesome as home country bias is, it may be more deeply
engrained in investor behavior and have a domestic counterpart. Coval and Moskowitz
(1999) show that U.S. investment managers have a preference for companies that are
geographically close to the manager.30 The findings are particularly striking because the
United States market reflects a single currency, as well as fairly uniform regulation,
taxation, political risk, language and culture. Coval and Moskowitz find that U.S.
investment managers exhibit a preference for locally headquartered firms that are small,
highly levered, and produce nontraded goods. The results suggest that information
asymmetry between local and non-local investors may drive the preference for
geographically proximate investments. The authors calculate that roughly one-third of
the home-bias puzzle in an international context may be the result of geographic
distance, rather than the result of national borders.
And other recent research suggests that the cost of home bias (in the
international context) may not be as great as previously thought. To begin, the menu of
foreign securities within easy reach of domestic investors has expanded significantly in
recent years. This menu includes American Depositary Receipts (ADRs), closed-end
country funds, open-end country index funds and other tracking securities (WEBS –
World Equity Benchmark Shares).31 ADRs allow investors to purchase and trade foreign
securities more conveniently (in their own time zone, own currency, through their own
30 See Huberman (1999) for a related study showing that a customer of a U.S. Regional Bell OperatingCompany (RBOC) is more likely to invest in his local company than an RBOC from another service area.31 See Appendix 1 for further information on ADRs and WEBS.
31
broker, and with clearing and settlement in their own country) albeit still subject to the
same foreign exchange and pricing risks as if they had traded the underlying foreign
security in the foreign market. As of December 31, 1999 there were 2,085 ADRs
comprising 1,713 available to retail investors and another 372 Rule 144a securities.
These ADRs represent companies from 78 countries with more than $6 trillion in market
capitalization at end-of-1999. In 1999 alone, companies and governments from 33
countries raised a record $22 billion through 113 depositary receipt offerings.32
What benefit can these alternative home-oriented securities yield? Errunza et al.
(1999) examine whether portfolios of domestically traded securities – including
multinational firms, country funds, ADR shares, and industry indices – can mimic the
returns on foreign indices. Using data from 1973 to 1993 for seven developed and nine
emerging markets, the authors find that a set of domestically traded assets including
market indices, industry portfolios, 30 multinationals, closed-end country funds and
ADRs are successful at mimicking the gains from international portfolio diversification.
These results support the view that investors may be able to recreate most of the
international diversification benefits by holding domestically traded assets. In this view,
“home bias” in investor portfolios need not be associated with lost international
investment or diversification opportunities.33
c. The Importance of Being Similar
32 Bank of New York press release available at <www.bankofny.com/adr/adr010300.htm>.33 The authors also show that incremental gains from creating true internationally diversified portfolioshave been declining over time in relation to these homemade portfolios. The authors take this asevidence that barriers to international investment have been declining over time.

32
While international economics and portfolio theory celebrate how national
differences create the opportunities for gains through trade, the prospective gains from
international financial diversification presume certain similarities – with respect to the
institutional and legal safeguards affecting the ownership and transfer of equity shares in
foreign markets, and the flow of information that investors use to value shares and monitor
corporations in mature markets. Absent these similarities, foreign shares will have
elements of risk that do not generate returns and cannot be diversified away. In this
context, it becomes rational for home investors to underweight foreign shares.
A recent study by Morck, Yeung, and Yu (2000) calculates the percentage of stocks
in one market that rise or fall over one-week and two-week holding periods. The authors
find that in emerging markets it is common for 60%, 65%, 70% or more stocks to move in
the same direction (up or down). By comparison, in mature markets, the figure is closer to
50%, suggesting that these assets are approximately fairly priced, and driven by favorable
or unfavorable news that occurs with roughly equal chance. The empirical result in
emerging markets is not related to fundamentals, but it is consistent with an absence of
firm-specific information and noise trading. The higher firm-specific variation in returns in
mature markets signals more firm-specific information and stronger investor property rights
that promotes informed arbitrage. By implication, an effective financial information and
analyst community and strong property rights are preconditions for enabling emerging
markets to graduate to mature markets.
In some respects, the recent expansion of cross-listing and capital raising activities
using ADRs and other depositary receipt programs offers a way for emerging market firms
to link into the institutional framework underpinning mature markets. Remarks in a recent

33
IMF report underscore the importance of this trend. The IMF (2000, p. 73) writes that
growth in the depositary receipt market represents “the strongest force behind the
globalization of emerging equity markets.” By using depositary receipts, firms in emerging
markets are unbundling the location of trading, and all the institutional details of trading
(clearing, settlement, custody, information disclosure, etc.) from the nationality of the
issuer of the security. Rather than trying to replicate an NYSE or NASDAQ in emerging
markets, depositary receipts allow firms to tap into an acknowledged marketplace and
signal their intention to align their interests more with shareholders. While this trend may
have negative implications for stock exchanges in emerging markets, it is a positive
development from the standpoint of raising capital and lowering the cost of capital for
emerging nations.
Indeed, the notion of outsourcing versus replicating a financial market activity
could have broader implications for emerging markets. As we just noted, by using
ADRs, an emerging market firm outsources the provision of a stock exchange, clearing
and settlement services, and safe custody to acknowledged market agents. The same
might be said of bond issues that are outsourced to the Eurobond or Rule 144a
markets, institutional frameworks that are outside the boundaries of an emerging nation.
The recent interest in currency boards is also an example of outsourcing, whereby the
country shuts down its own efforts to establish a credible domestic monetary policy, and
instead adopts the monetary policy of a pegging partner. And we might interpret that
rise of foreign direct investment in emerging nations as another form of outsourcing,
whereby corporate governance is transferred to other, more acknowledged and credible

34
providers of this asset. The possible scope and success of these outsourcing efforts
remains to be seen.
Finally, the creeping convergence in correlation among mature and emerging
market returns appears to possibly be generating an unexpected benefit – for the
emerging nations. As financial market liberalization has progressed in emerging markets
and as the correlation of returns across emerging and mature markets has advanced,
investors are now asking whether emerging markets are still a separate asset class, or
can they be considered part of an integrated world financial market? Saunders and Walter
(2000) examine a wide range of factors that impact financial market integration (e.g.
financial liberalization, increased openness to foreign direct investment, growth of ADRs
and similar cross-listings, growth of country funds and tracking securities, and cross border
M&A transactions). In addition, the authors document the convergence in the correlation of
returns across markets and find that to a greater extent, returns in emerging markets are
driven by common global factors. They conclude that “it is hard to argue that the top 10 to
15 largest emerging market countries should be viewed as a separate class from those
countries considered to be developed.” 34
While one might take an “absence of differences” as bad news, in the real world of
global benchmarking it may in fact turn out to be good news for emerging markets. As a
separate asset class, institutional investors might easily decide not to invest in, or track, a
small and specialized part of the global market. But if emerging markets are part of a
larger, global benchmark, institutional investors will be much more inclined to hold
emerging market securities – albeit for reasons related to herding and that investment
34 Saunders and Walter (2000), p. 22.
35
managers do not want to turn in a track record too far from the benchmark. The IMF puts
the case as follows:
The result of the inclusion of emerging markets into theglobal benchmarks implies that the investment decision ofsuch managers will start from a baseline of a certainproportion in emerging markets (5.8% in the ACWI Freeindex in June 2000), which can then be increased ordecreased rather than a baseline of zero, which might thenbe increased but with little long-term commitment by themanager to the emerging market asset class.35
If indeed emerging markets join the mature markets in the popular global
benchmarks, there will be strong incentives for countries to gain admittance to this
important club. Good countries that gain admission will get a small slice of a large pie. Bad
countries that fail the admission test may face financial market obscurity. The power of
benchmarking to influence institutional investor behavior is also apparent in the bond
market. Home bias in bond markets is more pronounced and international investment less
advanced. Global equity indices pre-date bond indices by about 10-15 years. The IFC
equity indices date from the early 1980s while the J.P. Morgan debt indices date only from
the early to mid-1990s. It is possible that the absence of a benchmark for international
investors to manage against has handicapped the development of emerging country bond
markets.
The above analysis assumes that institutional investors follow a full replication
strategy, implying that to track an index with 500 securities these investors would hold
all 500 securities with market value weights. But full replication might not be required to
track the benchmark closely, and full replication could be a very costly strategy.
35 International Monetary Fund (2000), p. 70-1. The ACWI Free is the Morgan Stanley All Country WorldIndex reflecting the free float, or investable securities, in each market.

36
Consequently, some investors will weigh possible cost savings against the tracking
error that is introduced by holding fewer than 500 securities. How does this apply to the
case of emerging markets joining a global index? If the transaction costs in small
emerging markets are particularly high, and returns well correlated with other markets,
institutional investors may be able to track the global index very well without holding
emerging market securities. Thus, graduating from emerging market to mature market
status could harbor a negative impact for smaller countries.
A related risk faces once emerging markets like Ireland or Greece that are now part
of the larger EMU. With currency risk removed, domestic investors that were tracking the
local index have strong incentives to diversify out of local equities.36 Thus EMU may
promote capital flows to smaller nations, but not necessarily the development of capital
markets.
5. Summary and Conclusions
Emerging markets remain important as the home to 85% of the world’s population
and investment projects likely to have among the highest private and social returns.
International capital flows are an important ingredient to get the world closer to its
theoretically optimum production possibility frontier. Healthy capital markets with a sound
financial infrastructure are essential to guide capital to its most productive uses worldwide.
However, emerging financial markets are small relative to mature markets, and
typically small relative to their GDP. These facts make emerging markets vulnerable to
large inward and outward capital flows from global investors. But emerging financial
36 See “Squaring the Circle,” Financial Times, January 8, 2001, page 18.

37
markets have grown in many ways over the last 20 years. They have become larger in
absolute size, as a proportion of world markets, and as a proportion of domestic GDP.
Progress is being made in the financial infrastructure that heretofore created
unseen and unrewarded risks for investors. But emerging markets still trail in the kind of
financial transparency and safeguards that attract investors. Financial innovations such as
ADRs, country funds, and other tracking securities represent ways for foreign investors to
take positions in foreign assets without the administrative and overhead costs and risks of
the emerging marketplaces themselves.
Primary markets for debt and equity also have been developing in emerging
markets. Secondary market returns in equities appear to have grown more correlated with
global factors, and in this sense more integrated into world markets. While greater
correlation of returns might signal bad news for emerging markets (because investors will
expect lower diversification gains), it may really only signal a new chapter for emerging
markets. Entering the sphere of globally integrated capital markets will mean playing by
the rules of that market. That in turn means offering projects, securities, marketplaces, and
investor safeguards that compete with those offered in the mature markets. Those
countries that meet this test will be rewarded with a proportional (or overweighted)
allocation of a large global pool of capital. Countries that graduate into the world indices
become more of a mainstream class of assets rather than an exotic class. While there is
virtue and value in being different, in international investment it seems there is also value
to commonalities that reassure investors and help promote stable, long-term investment
flows.

38
Appendix 1
American Depositary Receipts (ADRs) and World Equity Benchmark Shares (WEBS)
The American Depositary Receipt (ADR) is an old financial innovation,
introduced by Morgan Guaranty Bank in 1927 as a way to help American’s purchase
shares in the British retailer Selfridge’s by overcoming many of the institutional barriers
to international investment. In order to issue an ADR, a U.S. bank takes custody of the
foreign shares in their foreign office. Then an ADR can be issued as a claim against
these foreign shares. This can be particularly valuable when there are doubts about the
authenticity of foreign shares as in some recent issues of Russian ADR shares.37
Owners of the ADR have the right to redeem their ADR and obtain the true underlying
foreign shares, which can then be sold on the foreign market. Arbitrage of this sort
ensures that the price of the ADR and the underlying shares will be nearly identical.
The bank issuing the ADR provides various services including collection of all
dividends and rights offerings in foreign currency and distributing the proceeds in US$
to the ADR owner. Owners of ADRs can trade them in the U.S. market without recourse
to the original foreign shares, without using the foreign exchange market, and without
relying on foreign clearing and settlement. The underlying foreign shares remain at all
times with the custodian. The ADR system thus can substantially reduce the cost of
trading in foreign shares.
ADRs may be sponsored or unsponsored. In a sponsored offering, the foreign
firm pays a fee to the depositary bank to cover the cost of the ADR program. In an
37 See Levich (2001, p. 565).
39
unsponsored offering, the ADR is created by demand from U.S. investors and securities
firms to facilitate trading in a popular foreign issue.
There are different “levels” of ADRs depending on the level of information
disclosure offered by the foreign firm. With only the home country annual report, the firm
qualifies as a Level 1 ADR and over-the-counter trading on so-called “pink sheets.” If
the company meets the disclosure requirements of a U.S. exchange it may be listed for
trading as a Level 2 ADR. Firms that comply fully with U.S. accounting principles and
disclosure requirements qualify as Level 3 ADRs and may raise equity capital through
public offerings. A firm could also issue ADRs through a Rule 144a program that limits
access to qualified institutional investors, but does not require compliance with U.S.
accounting principles or SEC registration and disclosure requirements.
World Equity Benchmark Shares (WEBS) are shares in an index fund intended to
track the performance of a single country index. Introduced in1996, WEBS are currently
available for 21 MSCI country indices, including 5 emerging markets (Brazil, Malaysia,
Mexico, South Korea and Taiwan). WEBS are listed on the American Stock Exchange.
WEBS combine elements of both closed-end and open-end mutual funds. Like a
closed-end fund, WEBS are exchange traded and can be bought and sold at any time of
day, and even sold short. Similar to an open-end fund, the number of shares or units
outstanding is flexible. WEBS can be created (when their market price exceeds the cost
of the underlying shares) or purchased and liquidated (when their market price is less
than the cost of the underlying shares). This type of arbitrage keeps the WEBS price
close to the underlying index price.38
38 WEBS are now known as iShares to imply index shares of exchange traded mutual funds. For moreinformation about the composition of iShares, see <www.ishare.com>.

40
References
Aylward, Anthony and Jack Glen, "Primary Securities Markets: Cross Country Findings,"International Finance Corporation, Discussion Paper No. 39, April 2000.
Baxter, Marianne, Urban J. Jermann, and Robert G. King. "Nontraded Goods, NontradedFactors, and International Non-Diversification," Journal of International Economics,44, no. 2 (April 1998): 211-29.
Bekaert, Geert, Claude B. Erb, Campbell R. Harvey, and Tadas E. Viskanta. "TheBehavior of Emerging Market Returns," In Emerging Market Capital Flows.Richard M. Levich, editor, Boston: Kluwer Academic Publishers, 1998.
Bekaert, Geert and Campbell R. Harvey. “Time-Varying World Market Integration,”Journal of Finance 50 (1995): 403-44.
Bekaert, Geert and Campbell R. Harvey. “Emerging Market Equity Volatility,” Journal ofFinancial Economics 43 (1997): 29-77.
Cooper, Ian A. and Evi Kaplanis. “Home Bias in Equity Portfolios: Inflation Hedging andInternational Capital Markets,” Review of Financial Studies 7, no. 1 (1994): 45-60.
Coval, Joshua D. and Tobias J. Moskowitz. “Home Bias at Home: Local EquityPreference in Domestic Portfolios,” Journal of Finance, 54 no. 6 (December 1999):2045-73.
Errunza, Vihang, Ked Hogan and Mao-Wei Hung. “Can the Gains from InternationalDiversification be Achieved Without Trading Abroad?” Journal of Finance, 54 no. 6(December 1999): 2075-107.
Froot, Kenneth A. and Emil Dabora. “How Are Stock Prices Affected by the Location ofTrade?” Journal of Financial Economics 53 (August 1999): 182-216.
Glassman, Debra A. and Leigh A. Riddick. "Why Empirical International Portfolio ModelsFail: Evidence that Model Misspecification Creates Home Asset Bias," Journal ofInternational Money and Finance 15, no. 2 (April 1996): 275-312.
Huberman, Gur. “Familiarity Breeds Investment,” working paper, Columbia UniversityBusiness School, November 1999.
International Monetary Fund. International Capital Markets: Developments, Prospects,and Key Policy Issues, (Washington, D.C.: International Monetary Fund):September 2000

41
J.P Morgan Bank, J.P. Morgan Guide to Emerging Local Markets, New York, 1997.
Kraay, Aart, Norman Loayza, Luis Serven, and Jaume Ventura. “Country Portfolios,”NBER Working Paper 7795, July 2000.
Levich, Richard M. International Financial Markets: Prices and Policies, second edition,(Burr Ridge, Illinois: McGraw-Hill/Irwin), 2001.
Lewis, Karen K. “Trying to Explain Home Bias in Equities and Consumption,” Journal ofEconomic Literature XXXVII (June 1999): 571-608.
Morck, Randall, Bernard Yeung, and Wayne Yu. “The Information Content of StockMarkets: Why Do Emerging Markets Have Synchronous Stock PriceMovements?” Journal of Financial Economics (November 2000): forthcoming.
Organization for Economic Cooperation and Development, “The Development of Fixed-Income Securities Markets in Emerging Market Economies: Key Issues andPolicy Actions,” Financial Market Trends, No. 74, October 1999.
Palmer, David E. “U.S. Bank Exposure to Emerging Market Countries during RecentFinancial Crises,” Federal Reserve Bulletin, (February 2000): 81-96.
Saunders, Anthony and Ingo Walter. “Are Emerging Market Equities a Separate AssetClass?” Stern School of Business Working Paper, July 2000.
Smith, Roy C. and Ingo Walter. ”Rethinking Emerging Markets,” In Emerging MarketCapital Flows. Richard M. Levich, editor, Boston: Kluwer Academic Publishers,1998.
Standard & Poor’s, Emerging Markets Factbook 2000, (New York: Standard & Poor’s),2000.
Tesar, Linda L. and Ingrid M. Werner. “The Internationalization of Securities MarketsSince the 1987 Crash,” Brookings-Wharton Papers on Financial Services (1998):281-349.

Source: Standard and Poor's, Emerging Stock Markets Factbook 2000 . GDP+MktCap_1980-99 MktCap V. GNP (3)
Figure 1Market Capitalization as Percentage of GNP vs. GNP Per Capita
Spain
ItalyGermany
Canada
FranceJapan
NetherlandsU.K. U.S.
Switzerland
MexicoIsrael
Taiwan
Greece
IndiaIndonesia
China
Philippines
Morocco
Egypt Thailand
Iran Russia
Columbia
Malaysia
S. Africa
Chile
Turkey
Korea
Argentina
S. Arabia
Czech RepPoland
BrazilHungary
MauritiusEstonia
Lebanon
CroatiaKenya
Jamaica
Tunisia
Trinidad
Slovenia
1
10
100
1,000
100 1,000 10,000 100,000
1998 GNP per Capita (US$)
1998
Mar
ket
Cap
ital
izat
ion
/ G
NP
(as
%)
Developed Market Emerging Market Frontier Market

Source: International Finance Corporation, Emerging Stock Markets Factbook , various issues. GDP+MktCap_1980-99 Fig 2
Figure 2GNP in Emerging and Developed Market Countries
0
5
10
15
20
25
30
1992 1993 1994 1995 1996 1997 1998
US
$ T
rilli
on
s
0.0%
5.0%
10.0%
15.0%
20.0%
25.0%
Emerging Market GNP Developed Market GNP EM as % of World

Source: International Finance Corporation, Emerging Stock Markets Factbook , various issues. GDP+MktCap_1980-99 Fig 3
Figure 3Equity Market Capitalization as a Percent of National GNP
0%
20%
40%
60%
80%
100%
120%
1992 1993 1994 1995 1996 1997 1998
Mature Markets Emerging Markets

Source: International Finance Corporation, Emerging Stock Markets Factbook , various issues. GDP+MktCap_1980-99 Fig 4
Figure 4World Equity Market Capitalization and Emerging Market Share
4.2%4.2%2.5%2.4%
8.5%
3.2%3.1% 3.7% 3.7% 5.1% 6.0% 6.4% 7.9% 9.1%12.0% 12.5% 10.8% 11.1% 9.4% 7.0%
0
5,000
10,000
15,000
20,000
25,000
30,000
35,000
40,000
1980 1981 1982 1983 1984 1985 1986 1987 1988 1989 1990 1991 1992 1993 1994 1995 1996 1997 1998 1999
US
$ B
illio
ns
World Market Capitalization Emerging Market Capitalization (and % share)
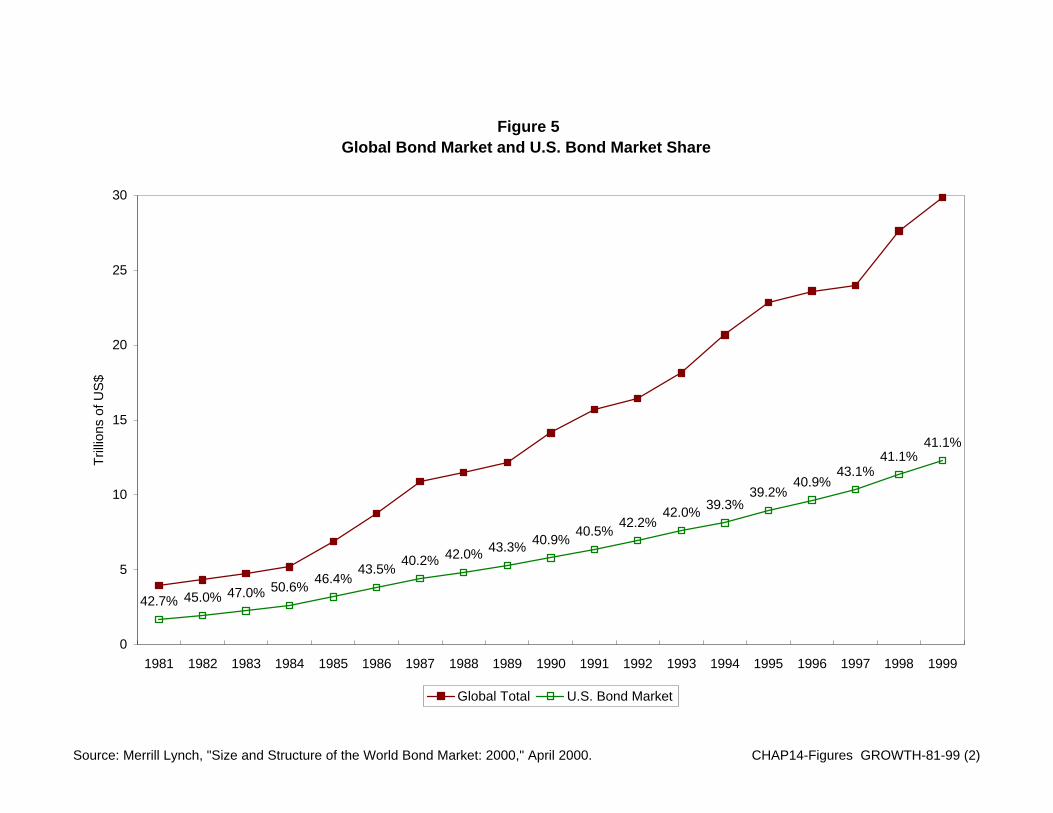
Source: Merrill Lynch, "Size and Structure of the World Bond Market: 2000," April 2000. CHAP14-Figures GROWTH-81-99 (2)
Figure 5Global Bond Market and U.S. Bond Market Share
41.1%41.1%
43.1%40.9%
39.2%39.3%42.0%
42.2%40.5%
40.9%43.3%42.0%40.2%43.5%
46.4%50.6%47.0%45.0%42.7%
0
5
10
15
20
25
30
1981 1982 1983 1984 1985 1986 1987 1988 1989 1990 1991 1992 1993 1994 1995 1996 1997 1998 1999
Trill
ions
of U
S$
Global Total U.S. Bond Market

Source: Bank for International Settlements, International Banking and Financial Market Developments , various issues. anx16a Domestic Debt
Figure 6. Domestic Debt Securities in Emerging MarketsAmount Outstanding at Year-End
0
200
400
600
800
1000
1200
1400
1600
1989 1990 1991 1992 1993 1994 1995 1996 1997 1998 1999
US
$ B
illio
ns
0.0%
1.0%
2.0%
3.0%
4.0%
5.0%
6.0%
Domestic Debt Outstanding % of World Total

FX Emerging Mkts FX Vol v. Mkt Cap (3)
Figure 7Annual Foreign Exchange Trading Volume vs. Equity Market Capitalization, 1998
TaiwanBrazilGreece
Mexico S. Africa
ArgentinaS. Arabia
Thailand
Russia
S. Korea
IndiaPoland
Chile MalaysiaIndonesia
Czech Rep
Hungary
Hong Kong
Philippines
China
Singapore
Portugal Finland
Norway
AustriaIrelandSpain
SwedenBelgium
CanadaItaly
NetherlandsAustralia
New Zealand
DenmarkLuxembourg
SwitzerlandFrance
GermanyJapan
U.S.
U.K.
10
100
1,000
10,000
100,000
1,000,000
1,000 10,000 100,000 1,000,000 10,000,000 100,000,000
Equity Market Capitalization (US$ Millions)
An
nu
al F
X T
rad
ing
Vo
lum
e (U
S$
Bill
ion
s)
Emerging Markets Developed Markets
Source: Bank for International Settlements, Central Bank Survey of Foreign Exchange and Derivatives Market Activity, 1998 and Standard and Poor's, Emerging Stock Markets Factbook, 2000 , and author's calculations.
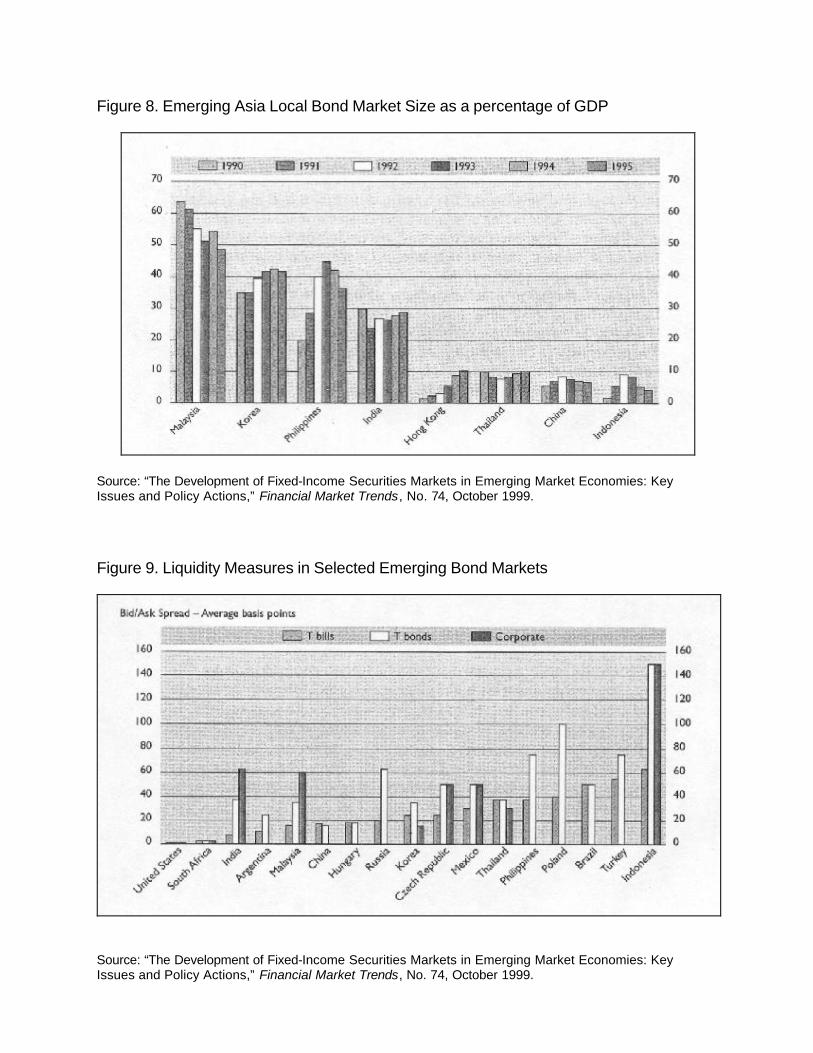
Figure 8. Emerging Asia Local Bond Market Size as a percentage of GDP
Source: “The Development of Fixed-Income Securities Markets in Emerging Market Economies: Key Issues and Policy Actions,” Financial Market Trends, No. 74, October 1999. Figure 9. Liquidity Measures in Selected Emerging Bond Markets
Source: “The Development of Fixed-Income Securities Markets in Emerging Market Economies: Key Issues and Policy Actions,” Financial Market Trends, No. 74, October 1999.

Figure 10. Yield Spreads on Emerging Market and U.S. High-Yield Bonds
Source: International Capital Markets: Developments, Prospects, and Key Policy Issues, (Washington, D.C.: International Monetary Fund): September 2000, p. 57.

Figure 11. Yield Spreads for Selected Emerging Eurobonds
Source: International Capital Markets: Developments, Prospects, and Key Policy Issues,
(Washington, D.C.: International Monetary Fund): September 2000, p. 63.

Figure 12. Risk-Return Characteristics of Emerging Market Equities and Bonds
Source: International Capital Markets: Developments, Prospects, and Key Policy Issues, (Washington, D.C.: International Monetary Fund): September 2000, p. 57.

Figure 13. Correlation Between U.S. Stock Markets and Emerging Market Debt
Source: International Capital Markets: Developments, Prospects, and Key Policy Issues,
(Washington, D.C.: International Monetary Fund): September 2000, p. 60.

Table 1. Summary Measures of Absolute and Relative Size of Emerging MarketCountries, 1998.
World Developed Markets Emerging MarketsPopulation 5.8 billion 15% 85%
GNP $28.8 trillion 78.3% 21.7%
GNP per capita $4,966 $25,480 $1,246
Equity marketcapitalization a $36.0 trillion 91.5% 8.5%
Equity marketcapitalization/GNP 0.936 1.10 0.30
Bond marketcapitalization a $31.1 trillion 95.3% 4.7%
Bond marketcapitalization/GNP 1.007 1.221 0.232
FX trading / day $1.5 trillion 85.7% 14.3%b
Annual FX trading / GNP 29.1 27.2 31.0c
Notes:(a) Data for 1999(b) Includes 7% share in Singapore and 4.0% in Hong Kong(c) Drops to 6.2 excluding Singapore and Hong Kong
Sources: Standard & Poor’s, Emerging Stock Markets Factbook 2000; Merrill Lynch,“Size and Structure of the World Bond Market: 2000,” April 2000; Bank forInternational Settlements, Central Bank Survey of Foreign Exchange andDerivatives Market Activity, 1998, May 1999.

Table 2. Net Private Capital Flows to Emerging Markets, 1992-99.
Average1977-82
Average1983-89 1990 1991 1992 1993 1994 1995 1996 1997 1998 1999
Total (US$ billions) 30.5 8.8 39.8 92.9 112.6 172.1 136.3 226.9 215.9 147.6 75.1 80.5Net foreign direct investment 11.2 13.3 19.5 28.8 35.4 59.4 84.0 92.6 113.2 138.6 143.3 149.8
Net portfolio investment -10.5 6.5 6.2 22.5 56.1 84.4 109.6 36.9 77.8 52.9 8.5 23.3Bank loans and other 29.8 -11.0 14.2 41.7 21.0 28.3 -57.3 97.4 24.9 -44.0 -76.7 -92.5
As a percent of GDP NA NA NA NA 2.3 3.0 2.3 3.5 3.0 2.0 1.1 1.1Net foreign direct investment NA NA NA NA 0.7 1.0 1.4 1.4 1.6 1.9 2.1 2.1
Net portfolio investment NA NA NA NA 1.1 1.5 1.9 0.6 1.1 0.7 0.1 0.3Bank loans and other NA NA NA NA 0.4 0.5 -1.0 1.5 0.4 -0.6 -1.1 -1.3
Source: Data for 1977-1991 are from International Capital Markets: Developments, Prospects, and Key PolicyIssues, (Washington, D.C.: International Monetary Fund): August 1995, pp. 3. Data for 1992-1999 are fromInternational Capital Markets: Developments, Prospects, and Key Policy Issues, (Washington, D.C.:International Monetary Fund): September 2000, pp. 46-7.

Table 3. Foreign Exchange Turnover in Emerging Market Countries, Daily Volumein US$ Millions.
Country Total SpotOutrightForward FX Swaps
Typical SpotTransactionSize in US$
MillionsArgentina 2,244 2,107 137 0 10
Brazil 5,127 5,127 0 0 5Chile 1,255 789 466 0 5
China 211 211 0 0 10Czech Republic 5,027 2,130 0 2,897 2-5
Greece 7,185 3,123 774 3,288 € 5-10Hong Kong 78,555 30,985 3,720 43,850 5-10
Hungary 1,417 984 153 280 naIndia 2,441 1,156 382 903 1-5
Indonesia 1,540 729 78 733 5Malaysia 1,140 343 61 736 5-10
Mexico 8,622 6,262 403 1,957 10Philippines 759 356 178 224 3-5
Poland 2,664 2,123 53 488 naSaudi Arabia 2,310 1,297 409 604 na
Russia 6,763 6,036 658 68 naSingapore 138,986 59,872 4,408 74,706 5
South Africa 8,848 3,727 1,618 3,503 3South Korea 3,502 2,512 287 703 5
Taiwan 4,763 3,404 606 754 1-5Thailand 3,042 891 188 1,962 2-5
EM Total286,401 134,164 14,579 137,656
EM Total - Ex Singapore, HK 68,860 43,307 6,451 19,100World Total 1,981,619 771,996 156,660 1,052,962
EM Total (%) 14.45% 17.38% 9.31% 13.07%EM Total - Ex Singapore, HK (%) 3.47% 5.61% 4.12% 1.81%
EM Total 100.00% 46.84% 5.09% 48.06%EM Total - Ex Singapore, HK 100.00% 62.89% 9.37% 27.74%
World Total 100.00% 38.96% 7.91% 53.14%
Sources: Bank for International Settlements, Central Bank Survey of ForeignExchange and Derivatives Market Activity, 1998, May 1999. Total volume(Table E-4), Spot volume (Table E-9), Outright forward volume (Table E-10), and FX swaps volume (Table E-11). Typical spot transaction sizefrom J.P. Morgan Guide to Emerging Local Markets, November 1997.
Note: The J.P. Morgan Guide to Emerging Local Markets lists four otheremerging countries and their estimated daily trading volume: Egypt ($100-300 MM), Israel ($300-500 MM), Slovak Republic ($1,000 MM), Turkey($500 MM) and Venezuela ($75-100 MM).

Table 4. Annual Foreign Exchange Turnover Relative to GNP and Equity MarketCapitalization, 1998.
No. ofCountries
Annual FXVolume in
Billions
FX Turnover/ GNP
FX Turnover/ GNP (PPP)
FX Turnover /Equity MarketCapitalization
Average, allcountries 42 12,252.2 29.1 31.9 40.7
Average, EmergingMarkets only a 21 3,545.9 31.0 32.7 41.3
Average, EmergingMarkets (exceptHong Kong and
Singapore) a19 942.3 6.2 3.1 22.4
Average, DevelopedMarkets only b 21 20,958.5 27.2 31.0 40.2
Source: Bank for International Settlements, Central Bank Survey of ForeignExchange and Derivatives Market Activity, 1998, May 1999. Total volume(Table E-4).
Notes: (a) Average excludes Taiwan for which there is no GNP data.(b) Average excludes Luxembourg for which there is no GNP data.
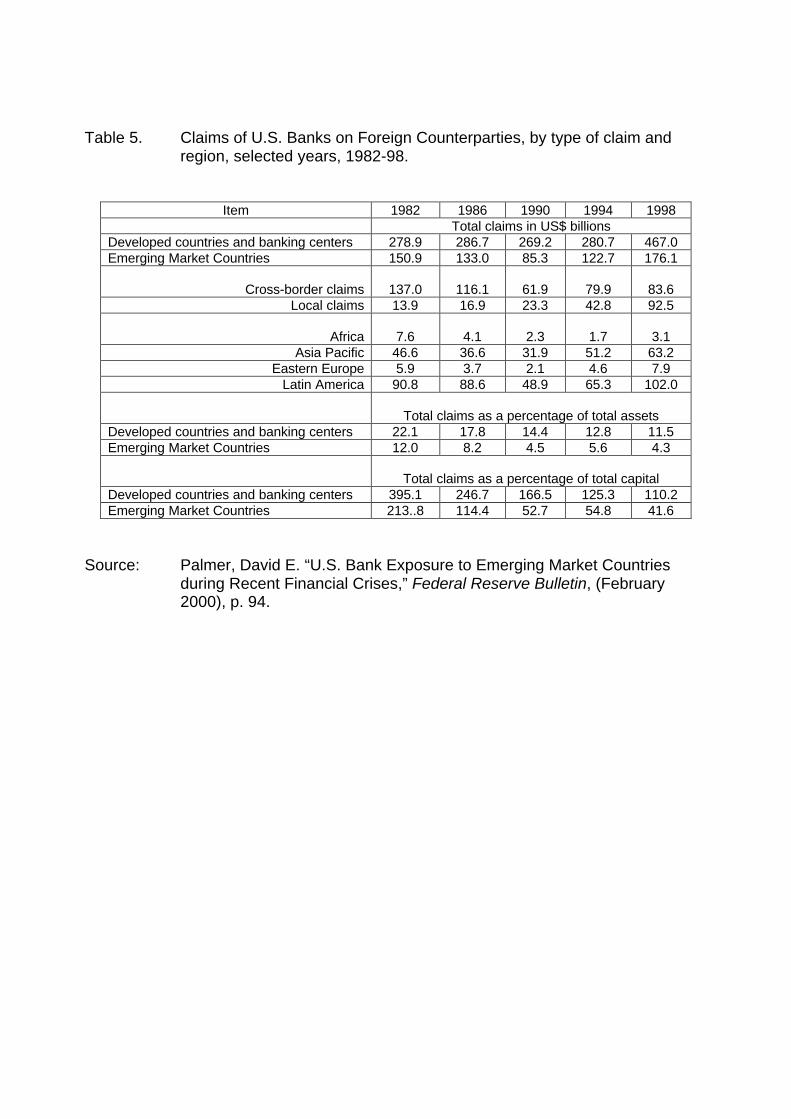
Table 5. Claims of U.S. Banks on Foreign Counterparties, by type of claim andregion, selected years, 1982-98.
Item 1982 1986 1990 1994 1998Total claims in US$ billions
Developed countries and banking centers 278.9 286.7 269.2 280.7 467.0Emerging Market Countries 150.9 133.0 85.3 122.7 176.1
Cross-border claims 137.0 116.1 61.9 79.9 83.6Local claims 13.9 16.9 23.3 42.8 92.5
Africa 7.6 4.1 2.3 1.7 3.1Asia Pacific 46.6 36.6 31.9 51.2 63.2
Eastern Europe 5.9 3.7 2.1 4.6 7.9Latin America 90.8 88.6 48.9 65.3 102.0
Total claims as a percentage of total assetsDeveloped countries and banking centers 22.1 17.8 14.4 12.8 11.5Emerging Market Countries 12.0 8.2 4.5 5.6 4.3
Total claims as a percentage of total capitalDeveloped countries and banking centers 395.1 246.7 166.5 125.3 110.2Emerging Market Countries 213..8 114.4 52.7 54.8 41.6
Source: Palmer, David E. “U.S. Bank Exposure to Emerging Market Countriesduring Recent Financial Crises,” Federal Reserve Bulletin, (February2000), p. 94.

Table 6. Size of Global Emerging Bond Markets1999 Nominal Value Outstanding, US$ Billions
Country Amount Government% Share
Corporate% Share
Eurobond% Share
Argentina 9.8 86.7 NA 13.3 Brazil 208.6 100.0 NA 0.0 China 72.8 91.3 8.7 0.0 Czech Republic 2.1 100.0 NA 0.0 Greece 87.8 88.4 2.9 8.7 Hong Kong 70.3 18.6 57.5 23.9 Hungary 10.7 98.1 1.9 0.0 India 135.7 70.4 29.6 0.0 Indonesia 7.1 5.6 94.4 0.0 Malaysia 37.8 56.1 43.9 0.0 Mexico 33.7 100.0 NA 0.0 Pakistan 4.8 100.0 NA 0.0 Philippines 62.0 39.2 60.5 0.3 Poland 19.1 89.5 NA 10.5 Singapore 5.4 25.9 74.1 0.0 South Africa 72.0 90.0 0.8 9.2 South Korea 226.5 52.3 47.7 0.0 Taiwan 63.7 60.3 35.8 3.9 Thailand 36.1 72.9 27.1 0.0 Turkey 31.2 100.0 NA 0.0
Total 1,197.2 72.2% 24.7% 3.1%
Emerging as % ofGlobal Market
3.86%
Source: Merrill Lynch, Size and Structure of the World Bond Market: 2000, April2000, p. 14.

Table 7. Primary Market Activity, 1980-1995
Equity 1980-85 1986-90 1991-95 1980-95% of Grand
total 1980-85 1986-90 1991-95 1980-9524 Emerging markets 12.40 45.60 111.50 169.50 17.60% 0.60 0.70 1.40 0.904 Asian Tigers 5.40 48.30 83.00 136.70 28.22% 0.70 1.50 2.80 1.70G4 278.70 610.60 613.30 1502.60 5.56% 0.70 1.40 1.00 1.00Total (N=32) 296.50 704.40 807.80 1808.70 6.36% 0.60 0.90 1.50 1.00
Lt Govt Debt24 Emerging markets 66.00 169.40 335.50 570.90 59.27% 2.70 3.30 5.30 3.704 Asian Tigers 2.30 9.80 46.40 58.60 12.10% 0.40 0.80 1.40 0.80G4 2,527.20 3,414.30 6,366.60 12,308.10 45.58% 5.80 5.60 7.90 6.50Total (N=32) 2,595.40 3,593.60 6,748.50 12,937.50 45.47% 3.10 3.50 5.20 4.00
LT SOE Debt24 Emerging markets 4.00 18.10 37.40 59.60 6.19% 0.10 0.20 0.30 0.204 Asian Tigers 4.20 2.70 20.20 27.10 5.59% 0.30 0.10 0.40 0.30G4 589.20 668.70 1,190.80 2,448.70 9.07% 1.10 1.10 1.70 1.30Total (N=32) 597.40 689.60 1,248.40 2,535.40 8.91% 0.40 0.30 0.50 0.40
LT Private Debt24 Emerging markets 9.40 33.60 120.30 163.30 16.95% 0.20 0.60 0.90 0.604 Asian Tigers 19.80 63.00 179.20 262.00 54.09% 2.40 2.50 3.60 2.80G4 1,308.30 3,525.30 5,910.80 10,744.30 39.79% 4.80 6.80 7.60 6.40Total (N=32) 1,337.50 3,621.90 6,210.30 11,169.60 39.26% 1.60 1.90 2.20 1.90
Grand totals24 Emerging markets 91.80 266.70 604.70 963.30 3.60 4.80 7.90 5.404 Asian Tigers 31.70 123.80 328.80 484.40 3.80 4.90 8.20 5.60G4 4,703.40 8,218.90 14,081.50 27,003.70 12.40 14.90 18.20 15.20
Total (N=32) 4,826.80 8,609.50 15,015.00 28,451.20 5.70 6.60 9.40 7.30
US$ billion % of GDP
Source: Aylward and Glen (1999) Aylward-Glen_TableA1 Table A1

Table 8Market Statistics on U.S. and World Stock Markets, 1999
1999 (1) (2a) (2b) (3) (4) (5)
CountryMarket Capitalization
Number of Listed Domestic Companies
Number of Listed Foreign Companies
Average Company Size
Market Concentration
Market Turnover Ratio
Developed MarketsAustralia 427,683 1,217 70 351 76.8 28.0Belgium 184,942 172 122 1075 59.0 27.5Canada 800,914 3,767 48 213 72.7 54.2France 1,475,457 968 176 1524 80.8 62.4Germany 1,432,190 933 234 1535 79.2 107.5Hong Kong 609,090 695 13 876 84.1 51.4Italy 728,273 241 6 3022 60.8 82.7Japan 4,546,937 2,470 43 1841 68.3 52.5Netherlands 695,209 344 154 2021 72.2 145.1New Zealand 28,352 114 58 249 56.6 45.0Singapore 198,407 355 45 559 64.9 66.9Switzerland 693,127 239 173 2900 79.1 78.0United Kingdom 2,933,280 1,945 448 1508 79.3 51.9United States 16,635,114 7,651 835 2174 70.8 123.5Other Developed 1,567,964 2,215 NA 708 NA NA
Total 32,956,939 23,326 NA 1413 NA NAEmerging MarketsBrazil 227,962 478 2 477 32.6 44.9Chile 68,228 285 0 239 42.3 11.4China 330,703 950 0 348 30.3 134.2India 184,605 5,963 0 31 31.2 84.4Indonesia 64,087 277 0 231 47.6 46.2Korea 308,534 725 0 426 59.1 346.7Malaysia 145,445 757 3 192 33.4 39.8Mexico 154,044 188 4 819 53.2 29.3Philippines 48,105 226 1 213 42.2 47.2Poland 29,577 221 0 134 59.0 44.6South Africa 262,478 668 24 393 23.0 33.7Taiwan 375,991 462 0 814 36.4 286.2Thailand 58,365 392 0 149 46.8 89.2Other Emerging Markets 815,747 14,722 NA 55 NA NA
Total 3,073,871 26,314 NA 117 NA NAWorld Total 36,030,810 49,640 NA 726 NA NA
Notes:
Column 5: Annual trading value / Market capitalization, Emerging Stock Markets Factbook , 2000, p. 15.
Column 2a: ibid, pp. 22-3. Column 2b: International Federation of Stock Exchanges, Tables I.1 and V.1 at website, http://www.fibv.com/
Column 4: Data for developed countries represent the largest 5% of firms. Source: International Federation of Stock Exchanges, Table I.7.1 at website, http://www.fibv.com. Data for emerging markets represent the ten largest firms as percentage of market capitalization. Source: Emerging Stock Markets Factbook , 2000, p. 46.
Column 3: in US$ millions; column (1)/column (2a)
Column 1: Emerging Stock Markets Factbook 2000 , pp. 16-7; US$ millions.
Source: Levich (2001). CHAP15-Table Brookings-Table8

Table 9. IFC Global Composite Total Return Index Correlations(Returns in US$)
Correlation of U.S. S&P 500with
Dec 89 –Dec 94
Dec 90 –Dec 95
Dec 91 –Dec 96
Dec 92 –Dec 97
Dec 93 –Dec 98
Dec 94 –Dec 99
IFCG Composite 0.29 0.24 0.19 0.37 0.62 0.56
IFCG Latin America 0.40 0.38 0.22 0.41 0.52 0.46
IFCG Asia 0.19 0.10 0.11 0.26 0.54 0.50
IFCG Europe Mid-East/Africa NA NA NA NA 0.57 0.50
Source: Emerging Stock Markets Factbook, editions of 1995-2000.