the importance of relative standards in adhd...
TRANSCRIPT

The Importance of Relative Standards in ADHD Diagnoses: Evidence Based on Exact Birth
Dates*
Todd E. Elder Michigan State University 110 Marshall-Adams Hall East Lansing, MI 48824
May 2010
Abstract
This paper presents evidence that diagnoses of Attention-Deficit / Hyperactivity Disorder
(ADHD) are driven largely by subjective comparisons across children in the same grade in school.
Roughly 8.4 percent of children born in the month prior to their state’s cutoff date for kindergarten
eligibility – who typically become the youngest and most developmentally immature children
within a grade – are diagnosed with ADHD, compared to 5.1 percent of children born in the month
immediately afterward. A child’s birth date relative to the eligibility cutoff also strongly
influences teachers’ assessments of whether the child exhibits ADHD symptoms but is only
weakly associated with similarly measured parental assessments, suggesting that many diagnoses
may be driven by teachers’ perceptions of poor behavior among the youngest children in a
classroom. These perceptions have long-lasting consequences: the youngest children in fifth and
eighth grades are nearly twice as likely as their older classmates to regularly use stimulants
prescribed to treat ADHD.
Keywords: ADHD, symptoms, diagnoses, regression discontinuity JEL Codes: I10, I21, J13, J24 * I thank seminar participants at Cornell University, McMaster University, Michigan State University, the University of Michigan, Ohio State University, Western Ontario University, the University of Windsor, and the University of Wisconsin-Madison for helpful comments and suggestions. Stacy Dickert-Conlin and Steven Haider provided helpful comments on an earlier draft. I gratefully acknowledge financial assistance from the National Institute of Child Health and Human Development under grant R03HD054683. The content is solely the responsibility of the author and does not necessarily represent the views of the National Institute of Child Health and Human Development or the National Institutes of Health. Email: [email protected]. Telephone: (517) 355-0353. Fax: (517) 432-1068.

2
I. Introduction
Attention-deficit / hyperactivity disorder (ADHD) is the most commonly diagnosed
behavioral disorder among children, with diagnosis rates ranging from 8 to 12 percent in OECD
countries (Biederman and Faraone, 2006). Fueled largely by increasing recognition of ADHD as a
legitimate disorder within the medical community, prescriptions of psychostimulants to children
diagnosed with ADHD rose by more than 700 percent in the U.S. between 1991 and 2005 (Mayes
and Erkulwater, 2008). In 2006, the Centers for Disease Control and Prevention estimated that 4.5
million children under age 18 were diagnosed with ADHD, with roughly 2.5 million of these
children regularly using prescription medication to treat their symptoms (Bloom and Cohen, 2007).
Despite the rapid growth in ADHD diagnoses, treatment, and related expenditures,
researchers and practitioners disagree about the disorder’s underlying incidence – published
estimates vary from less than 2 percent to nearly 17 percent. This lack of consensus has
contributed to intense public debate about whether ADHD is over- or under-diagnosed in
American children. The dramatic increase in the use of prescription stimulants intended to treat
ADHD has also spawned widespread concern that millions of children regularly use potentially
harmful medications to treat a disorder with inherently subjective symptoms (LeFever et al., 2003).
In this paper, we investigate the role that subjective comparisons across children play in
ADHD diagnoses by assessing whether children who are young relative to their classmates in
school are disproportionately diagnosed with and eventually treated for ADHD. We also analyze
the relationship between a child’s age relative to his classmates and both teacher- and parent-
reported assessments of ADHD symptoms. Under the assumption that the underlying chemical
and neurological incidence of ADHD does not vary by a child’s date of birth, evidence of an effect
of a child’s age-for-grade on measures of ADHD would imply that within-grade comparisons
across children play a significant role in the perception of symptoms and eventual diagnoses.
We analyze data from the Early Childhood Longitudinal Study-Kindergarten cohort
(ECLS-K), which is uniquely suited to studying ADHD because it includes parent and teacher
reports of ADHD symptoms, diagnoses, and stimulant-based treatments. We study the
relationship between a child’s age-for-grade and these measures of ADHD by focusing on
discontinuities in school starting age between children born just before and just after statewide

3
kindergarten eligibility cutoff dates, which determine whether a child is eligible to enroll in
kindergarten in a given school year.1 For example, a child born in October may begin kindergarten
the year he turns five if he lives in a state with a cutoff of December 1, but the same child would
have to delay kindergarten enrollment until the following year if he lived in a state with a cutoff of
September 1 (the most common cutoff date, applying in 15 states in 2010).
Our analyses produce three substantive findings. First, ADHD diagnoses among children
born just prior to their state’s kindergarten eligibility cutoff are more than 60 percent more
prevalent than among those born immediately afterward. This discontinuity implies that the
ADHD diagnosis rate among the youngest children in a classroom is 5.4 percentage points higher
than it would have been if those children had instead waited an additional year to begin
kindergarten. Given that the baseline ECLS-K diagnosis rate is 6.4 percent, this estimate
represents a substantial effect. Second, the youngest kindergarten entrants are significantly more
likely than their older classmates to use behavior-modifying prescription stimulants in grades 5
and 8. The influence of school starting age on stimulant usage is particularly pronounced for
methylphenidate, commonly known by the brand name Ritalin: children born just before a cutoff
are more than twice as likely to regularly use methylphenidate as those born immediately
afterward. If these patterns are driven entirely by inappropriate diagnoses and treatment among
the youngest children in a grade, our estimates imply that roughly 20 percent of the 2.5 million
children who use stimulants intended to treat ADHD have been misdiagnosed. Such inappropriate
treatment is particularly worrisome because of the unknown impacts of long-term stimulant usage
on children’s health. Although no studies have directly measured long-term health outcomes
among those treated for ADHD, chronic use of ADHD stimulants causes persistent cardiovascular
changes (namely, increases in blood pressure and resting pulse rates) that are known to be strongly
associated with morbidity and mortality among adults (Nissen, 2006).
Finally, a child’s school starting age strongly affects teachers’ perceptions of whether the
child exhibits ADHD-related symptoms but only weakly influences similarly measured parental
1 Authors such as Bedard and Dhuey (2006), Cascio (2009), Cascio and Lewis (2006), Datar (2006), Elder and Lubotsky (2009), Fertig and Kluve (2005), Fredriksson and Öckert (2005), McCrary and Royer (2006), and McEwan and Shapiro (2008) have used identification strategies based on eligibility cutoffs to estimate the effect of a child’s school starting age on a number of outcomes, including test scores, grade repetition, educational attainment and earnings.

4
perceptions. Discontinuities around eligibility cutoffs in teacher reports of hyperactivity and
inattentiveness are four times larger than the corresponding discontinuities based on parent reports.
These patterns suggest that teachers’ opinions of children are the key mechanisms driving the
relationship between school starting age and ADHD diagnoses. Current National Institute of
Mental Health (NIMH) guidelines for diagnosis explicitly instruct health professionals to consider
whether a child exhibits attention deficits and hyperactivity relative to his or her peers, but these
relative assessments are presumably intended to compare children of the same ages, rather than
children of different ages within the same grade (NIMH, 2008). Our results are consistent with
teachers using within-grade comparisons across students to assess whether a child has ADHD
symptoms, but these “symptoms” may merely reflect emotional or intellectual immaturity among
the youngest children in a classroom.2
II. Background and Literature Review
In 1999, the U.S. Surgeon General reported that roughly 20 percent of American children
exhibited signs of emotional or behavioral disorders (U.S. Department of Health and Human
Services, 1999). As the incidence and importance of behavioral disorders such as ADHD has
come to light, researchers in a variety of disciplines have sought to assess the effects of these
disorders on children’s outcomes. In particular, studies of the effects of ADHD have consistently
found strong negative correlations between ADHD diagnoses and outcomes in childhood and
adolescence. However, these relationships may stem from unobservable factors that influence
both ADHD diagnoses and outcomes, such as the presence of other mental or emotional
problems.3
2 Some degree of subjectivity in ADHD diagnoses may be unavoidable because its primary symptoms, inattentiveness and hyperactivity, are apparent in nearly all children, especially those under the age of six (National Collaborating Centre for Mental Health, 2009). A positive diagnosis requires that these symptoms cause “significant impairment” due to their frequency or severity, and a judgment of what constitutes “significant impairment” may be inherently subjective. 3 Mannuzza and Klein (2000) summarize several longitudinal studies of the effects of ADHD symptoms on long-run outcomes. These studies consistently show that children diagnosed with ADHD have worse outcomes into adolescence than those not diagnosed with ADHD, with especially large differences in educational attainment and measures of mental health, but all of the studies are limited in their ability to control for confounding factors associated with both ADHD diagnoses and outcomes.

5
Currie and Stabile (2006, 2009) address a potential source of bias in estimates of the effects
of ADHD by estimating models that include sibling fixed effects, which capture family-level
unobserved correlates of both ADHD and outcomes. Using the NLSY and the Canadian National
Longitudinal Study of Children and Youth, they show that children exhibiting high levels of
ADHD symptoms at early ages performed poorly on future cognitive tests and were
disproportionately likely to repeat a grade in school. These effects are essentially insensitive to the
inclusion of the sibling fixed effects, suggesting that unobserved family-level heterogeneity does
not drive the relationship between ADHD and child outcomes. Similarly, Fletcher and Wolfe
(2008) use data from the NLSY and Add Health to examine the effects of ADHD symptoms on
long-run outcomes such as educational attainment. Fletcher and Wolfe find that ADHD symptoms
are negatively associated with these long-run outcomes but that some of the estimated effects
disappear in models that include sibling fixed effects. These authors also show that a child’s
ADHD symptoms are negatively related to his siblings’ outcomes, perhaps because of
compensating behavior of parents.
A particular strength of the Currie and Stabile (2006, 2009) and Fletcher and Wolfe (2008)
studies lies in their focus on parent- and teacher-reported ADHD symptom levels instead of
diagnoses. Their measures of ADHD thus do not depend on whether a child was ever evaluated by
a medical professional, which may be correlated with parental engagement, income, or other
determinants of outcomes. Furthermore, a diagnosis of ADHD requires evidence of symptoms in
two or more settings, such as at home and at school, highlighting the role of the school
environment in the detection and diagnosis of ADHD. As a result, the binary measures of ADHD
diagnoses studied by authors such as Mannuzza and Klein (2000) also capture characteristics of
schools that may directly affect student outcomes. All of these studies focus on either symptoms
or diagnoses, but not both, because of data limitation issues – until the release of the ECLS-K, no
nationally representative data source included measures of both ADHD-related symptoms and
diagnoses. We turn next to describing these ECLS-K data in more detail.

6
III. Data and Descriptive Findings
The ECLS-K is a National Center for Education Statistics (NCES) longitudinal survey that
initially included 18,644 kindergarteners from over 1000 kindergarten programs in the fall of the
1998-1999 school year. Individuals were re-sampled in the spring of 1999, the fall and spring of
the 1999-2000 school year (when most of the students were in first grade), and again in the spring
of 2002, 2004, and 2007 (when most were in third, fifth, and eighth grade, respectively). NCES
also interviewed parents and teachers in each survey wave.
We match each child in the ECLS-K to the state-mandated kindergarten eligibility cutoff
that applied in the child’s state of residence in 1998.4 14,333 children with valid information on
state of residence appear in the initial survey and at least one other interview. Excluding children
living in states without statewide cutoffs results in a sample of 11,784 children. Appendix Table 1
lists the cutoff laws in place in all states and the District of Columbia in 1998.
As noted above, the ECLS-K is particularly useful for studying ADHD because it includes
binary measures of ADHD diagnoses and treatment as well as teacher and parent reports of
ADHD-related symptoms. Reported ADHD symptom levels provide different (and arguably
better, as emphasized by Currie and Stabile, 2006) information than indicators of diagnosis, but
each of these measures plays an important role in the analyses below.
Binary Indicators of ADHD Diagnoses and Medication Usage
In all waves of the ECLS-K, restricted-use data files include parental reports of whether a
child has been diagnosed with a learning problem such as ADHD, autism, dyslexia, developmental
delays, or learning disabilities. We create a binary indicator equal to one if a child was ever
diagnosed with ADHD as of the spring 2007 survey and zero otherwise (Appendix A provides
detailed information about the creation of this variable). Additionally, in the spring of 2004 and
2007, parents who reported in any survey that their child had been diagnosed with ADHD or
4 State of residence in the ECLS is listed in the base year ECLS-K restricted-use “Geocoded Location” files (procedures for applying for NCES restricted-use data are explained on the ECLS-K website: http://nces.ed.gov/ecls/Kindergarten.asp). State kindergarten cutoffs were matched to ECLS-K respondents and obtained from individual state statutes as well as from the Education Commission of the States.

7
related disorders were asked a follow-up question about the usage of prescription medication
intended to treat them:
“In an earlier year of the study, someone in your household told us that {CHILD} has
attention deficit disorder, ADHD, or hyperactivity. Is {CHILD} now taking any prescription
medicine for the condition related to {HIS/HER} ADD, ADHD, or hyperactivity?”
Parents who answered affirmatively were then asked an open-ended question about which
medication their child was currently taking. Responses included methylphenidate, sold under the
brand names Ritalin, Metadate, and Concerta, and amphetamine-based drugs such as Adderall and
Dexedrine. We create two indicator variables based on these questions; the first equals one if a
child uses any prescription medication in either 2004 or 2007 and zero otherwise, and the second
equals one if the child specifically uses methylphenidate and zero otherwise.5
Figure 1 presents graphical evidence of the relationship between ADHD diagnoses and a
child’s month of birth. The darkly shaded bars in Panel A show average ADHD diagnosis rates by
birth month in the 15 states with September 1 cutoff dates. The results are striking: diagnosis rates
rise steadily with birth month from January to August but then fall sharply between August and
September. 10.0 percent of children born in August are diagnosed with ADHD, more than twice
the 4.5 percent diagnosis rate among those born in September. These rates are statistically
distinguishable at conventional significance levels (t = 3.10). The lightly shaded bars in the figure
show the corresponding fractions of children who regularly use prescription stimulants to control
ADHD symptoms. The monthly averages track diagnosis rates closely, and children born in
August are more than twice as likely to use stimulants as those born in September (8.3 versus 3.5
percent; t = 2.47). These sizeable differences in diagnosis and medication rates between the
youngest (born in August) and oldest (born in September) children in a grade suggest that the
youngest children may be over-diagnosed (and over-medicated), the oldest children are under-
diagnosed, or both.6
5 We create a measure focused on methylphenidate in particular because it is almost exclusively prescribed to treat ADHD. In contrast, amphetamines, the other treatments typically prescribed for ADHD, are also frequently used to treat depression, epilepsy, narcolepsy, and other disorders (National Collaborating Centre for Mental Health, 2009). 6 Not all children enter kindergarten as soon as they are legally eligible, and the fraction of children who voluntarily delays kindergarten is especially high in birth months just before eligibility cutoff dates. Elder and Lubotsky (2009) find that nearly 30 percent of those born less than one month before a cutoff date wait an additional year to enter

8
Panel B of the figure presents analogous findings for states with December 1 or 2
kindergarten entrance cutoffs. In these states, the biggest month-to-month change now appears
between November and December. The ADHD diagnosis rate among children born in November
is 6.8 percent, more than triple the 1.9 percent rate among those born in December. The
corresponding rates of stimulant usage are 5.0 and 1.5 percent, respectively. Only 4.1 percent of
children born in August in these states are diagnosed with ADHD, compared to 10.0 percent of
August-born children living in the September 1 cutoff states. This 5.9 percentage-point difference
is surprising because both samples of August-born children start school at approximately the same
age; the average school starting age among August-born children is 5.17 in the September 1 cutoff
states and 5.09 in the December 1 and 2 cutoff states. The discrepancy in diagnoses may partly be
driven by more aggressive diagnostic practices in the September 1 cutoff states, which have 2.3
percentage-point higher overall diagnosis rates than do the December 1 and 2 cutoff states. Under
the assumption that these cross-state differences account for 2.3 percentage-point higher diagnosis
rates in every month, a 3.6 (= 5.9 – 2.3) percentage-point differential remains, which is
significantly different from zero (t = 2.09). This pattern suggests that what matters for ADHD
diagnoses and treatment is not merely that these children are young when they enter kindergarten,
but that they are young relative to their classmates. Put differently, many August-born children
diagnosed with ADHD and living in states with September 1 cutoffs may have never been
diagnosed had they simply lived in a state with a December cutoff.7
ADHD-Related Symptoms Based on Teacher and Parent Reports
Teachers in the first, second, and fourth waves of the ECLS-K rate individual students on
scales from 1 (“never”) to 4 (“very often”) on 24 different dimensions intended to measure social,
emotional, and cognitive development. NCES does not release data on each of these 24 items
kindergarten in ECLS-K. Nonetheless, the average school starting age of those born just before eligibility cutoffs is roughly 0.66 years lower than those born just afterward. 7 Patterns of ADHD diagnoses and treatment in the neighborhood of other cutoff dates generate similar inferences as those based on Figure 1. For example, ADHD diagnosis rates among children born in December in states with December 31 or January 1 cutoffs are roughly 60 percent higher than among children born in January in the same states (17.4 percent versus 10.9 percent). In a combined sample of the seven states with December or January cutoffs, the overall and August-born diagnosis rates are both 5.1 percent, while the overall and August-born diagnosis rates among those in the states with September 1 cutoffs are 6.4 percent and 10.0 percent, respectively.
9
individually, instead aggregating them to five composite scales known as Social Rating Scales
(SRS).8 The first, the “approaches to learning” scale, includes six items that rate a child’s
attentiveness, task persistence, eagerness to learn, learning independence, flexibility, and
organization. Similarly, the “self-control” scale includes four items that measure a child’s ability
to control his behavior, and the “interpersonal skills” scale includes five items that measure a
child’s ability to interact with others. For all three of these scales, higher scores are associated
with higher levels of development. The fourth scale, “externalizing problem behaviors”, includes
five items that rate the frequency with which a child acts impulsively, interrupts ongoing activities,
fights with other children, gets angry, and argues. Finally, the “internalizing problem behaviors”
scale includes four items that rate the presence of anxiety, sadness, loneliness, and low self-esteem.
In these latter two scales, higher scores are associated with worse social development. All five of
the composite scales are measured as averages of the underlying items and therefore have a range
of possible values from 1 to 4.
A diagnosis of ADHD requires evidence of at least six symptoms of inattention or at least
six symptoms of hyperactivity, with these symptoms persisting for six or more months before the
age of seven (as noted above, these symptoms much be present in at least two settings). Appendix
A lists the specific criteria for ADHD diagnosis, given in the American Psychiatric Association’s
Diagnostic and Statistical Manual-IV, Text Revision (DSM-IV-TR; American Psychiatric
Association, 2000), and provides more details about the SRS composites. The “approaches to
learning” and “externalizing problem behaviors” scales overlap with DSM-IV-TR criteria most
closely, with the former measuring several aspects of attentiveness and the latter measuring
behaviors related to hyperactivity and impulsiveness, and we present evidence below that all five
SRS composites are correlated with actual ADHD diagnoses.
Parents of ECLS-K children also provide SRS assessments, although some of the scales are
modified to reflect children’s behavior in the home rather than at school. The “approaches to
learning” and “self-control” scales are identical to those completed by teachers, but instead of an
“interpersonal skills” scale, parents complete a “social interaction” scale intended to measure
8 The Social Rating Scales used by NCES are adaptations of the scales designed by Gresham and Elliot (1990). Because the scales are copyright-protected, their precise wording cannot be reproduced here; we refer interested readers to Gresham and Elliott (1990).

10
similar concepts. Parents also complete “impulsive/overactive” and “sad/lonely” scales which are
similar to the “externalizing problem behaviors” and “internalizing problem behaviors” scales,
respectively; for example, three of the four items on the “sad/lonely” and “internalizing problem
behaviors” scales are identical. Again, Appendix A provides more details on the coding and
construction of these scales, as well as information on all other variables used in the analyses
below.
Descriptive Statistics
Table 1 presents descriptive statistics in the base ECLS-K sample of 11,784 children. The
column labeled “Full Sample” lists overall sample means of each of the listed variables and also
includes standard deviations of non-binary variables. The top rows in the table show that 6.4
percent of all children are diagnosed with ADHD by spring 2007 (when most are in eighth grade),
4.5 percent regularly use behavior-modifying stimulants, and 3.1 percent use methylphenidate in
particular. The next two columns consider children born fewer than 181 days before their state’s
eligibility cutoff and fewer than 181 days after the cutoff, respectively, essentially dividing a year
into two halves. Those born before the cutoff dates are roughly 50 percent more likely to be
diagnosed with ADHD (0.075 versus 0.051) and to use behavioral medications in grade five (0.054
versus 0.035) than those born after cutoff dates. The latter group is also nearly half a year older
when they enter kindergarten, on average (5.618 versus 5.197).
The table also shows the relationship between a child’s date of birth relative to the cutoff
dates and the fall 1998 teacher and parent SRS composites. For the first three teacher composites,
“approaches to learning”, “self-control”, and “interpersonal skills”, the means in the third column
are all significantly higher than in the second column. As described above, a higher rating on
these scales corresponds to more favorable social development. The means of the “externalizing
problem behaviors” and “internalizing problem behaviors” composite scores, which are negatively
related to social development, are lower in the third column than in the second. The parental SRS
composites show a similar pattern across all five composites, but the differences between columns
are much smaller. For example, the between-column differences in the “approaches to learning”
scales are 0.188 (= 3.079 – 2.891) based on teacher reports but only 0.031 (= 3.131 – 3.100) based

11
on parent reports, with t-statistics for equality across columns of 14.92 and 3.38, respectively.
Overall, children born after kindergarten cutoffs, who enter school at older ages, are perceived by
both teachers and parents as being more socially and cognitively developed than children born
before the cutoffs.
Although several of the SRS items overlap with clinical symptoms of ADHD, these scales
do not strictly measure ADHD symptoms, and some of them are intended to measure other
concepts entirely. In order to capture the variation in the scales that is related to ADHD diagnoses,
i.e., the variation which can be interpreted as measuring ADHD symptoms, we generate two
“predicted ADHD” variables based on the scales’ relationship to diagnoses. Specifically, we
estimate two separate probit models of ADHD diagnoses as functions of the SRS composites:
},,{),0(5
10 ptjuSRSIADHD ij
k
ijkjkji ∈>++= ∑=
γγ (1)
where SRSijk refers to the kth composite score for child i as reported by a teacher (j = t) or a parent
(j = p), uit and uip are both assumed to be univariately normally distributed, and I(·) denotes an
indicator function. We then generate two predicted ADHD scores equal to the predicted
probabilities from these models, one based on teachers’ SRS and one based on parental SRS. As
shown in the table, the average predicted ADHD scores based on teachers’ SRS composites are
0.064, 0.072, and 0.058 in columns (1), (2), and (3), respectively. The 0.014 difference between
columns (2) and (3) is more than half of the 0.024 difference in actual diagnoses rates. The
corresponding difference across columns in the prediction based on parental SRS is only 0.003.
This pattern previews our central results below – the age gradient in predicted ADHD based on the
teacher SRS composites closely mirrors the gradient in ADHD diagnoses, but a child’s age is only
weakly associated with predicted ADHD based on parents’ SRS composites.
We turn next to evidence of the power of the SRS composites in predicting ADHD
diagnoses. The first four columns in Panel A of Table 2 show ADHD diagnosis rates by quartile
of each of the teacher composites. All five of the composites are strongly related to ADHD
diagnosis rates, which fall monotonically across quartile for the first three and rise monotonically
across quartile for the last two. The “approaches to learning” scale, which measures several
aspects of attentiveness, is especially predictive of diagnoses: 14.1 percent of children rated in the
12
lowest quartile of this scale are diagnosed with ADHD, compared to only 1.7 percent of children in
the highest quartile.
The last column of the table lists marginal effects from probit estimates of equation (1).
The estimates show that only the “approaches to learning” and “externalizing problem behaviors”
scales are powerful predictors of ADHD diagnoses in a multivariate framework. For example, the
marginal effect associated with the “externalizing problem behaviors” scale is 0.069 (0.005).
Because the standard deviation of this scale is 0.632, a one-standard-deviation increase is
associated with a 4.3 (= 6.9 × 0.632) percentage-point increase in the probability of being
diagnosed with ADHD, conditional on the other four scales. Surprisingly, the coefficient on the
“interpersonal skills” scale is small and positive, implying that children with better interpersonal
skills are more likely to be diagnosed with ADHD, conditional on the other scales. The “self-
control” and “internalizing problem behaviors” scales are not significantly related to diagnoses.
These patterns make sense because, as indicated above, the “approaches to learning” and
“externalizing problem behaviors” scales overlap most closely with DSM-IV-TR criteria for
ADHD diagnoses.
Panel B of the table shows the relationships between the parent SRS composites and
diagnoses. The first four columns again show diagnosis rates by quartile of each composite, while
the last column shows marginal effects based on probit estimates of (1). As in panel A, all five
composites are pairwise correlated with ADHD diagnoses, but the magnitude of the probit
estimates mirrors how closely the composites correspond to DSM-IV ADHD symptoms.
Specifically, the “approaches to learning” scale and “impulsive / overactive” scales strongly
predict ADHD diagnoses. The “self-control” scale also predicts diagnoses, albeit less strongly,
and the coefficients on the “social interaction” and “sad / lonely” scales are insignificantly
different from zero. Again, these estimates suggest that the predicted ADHD scores measure
ADHD symptoms, rather than related but distinct concepts such as extroversion or cognitive
skills.9
9 In order to further address concerns that the predicted ADHD scores may measure concepts other than ADHD symptoms, we pursue two additional strategies. First, we include ECLS-K kindergarten math and reading test scores as controls in estimating equation (1), but we exclude the test scores when creating the predicted ADHD measures. The resulting predicted probabilities capture the associations between the Social Rating Scales and ADHD diagnoses that are unrelated to observable cognitive skills, as measured by the test scores. Second, in estimating equation (1) we

13
Given that parents and teachers are primarily responsible for decisions to send students to
mental health professionals for evaluation, it is not surprising that parent and teacher assessments
of attentiveness and hyperactivity are closely related to diagnoses. We next consider the influence
of a child’s school starting age on these assessments, as well as on diagnoses and treatment with
behavior-modifying stimulants.
IV. The Effects of School Starting Age on ADHD Diagnoses, Symptoms, and Stimulant
Usage
The graphical evidence presented in Figure 1 suggested that ADHD-related measures are
closely related to a child’s school starting age (denoted SSAi hereafter), and we now analyze this
relationship more formally. Consider a model of an ADHD-related variable (again denoted
ADHDi) as a function of SSAi, the number of days (daysi) between a child’s date of birth and the
eligibility cutoff date, and a vector of observable characteristics Xi:
iiiii XdaysgSSAADHD εγα +++= ')( . (2)
In equation (2), α measures the effect of school starting age on ADHD. The smooth function g(·)
allows the number of days between a child’s date of birth and the eligibility cutoff date to directly
affect ADHD. We measure the variable daysi such that it equals -1 for children born on the day
before the eligibility cutoff, 0 for children born on the cutoff date itself, 1 for children born on the
day after the cutoff, and so on. Therefore, if daysi > 0, then a child must wait an additional year to
enroll in kindergarten, while a child for whom daysi ≤ 0 may begin school that fall. The
observable characteristics Xi include indicators for gender, race, ethnicity, family structure, the
marital status of the child’s primary caregiver, Census region, urbanicity, parental education, and
log family income (Appendix A describes these variables in more detail).
exclude all children born within 100 days of their state’s eligibility cutoff date, based on a concern that discontinuities in the Social Rating Scales and in ADHD diagnoses may both be driven by factors (such as unobservable cognitive skills) that vary systematically with the age of the child. Excluding these children ensures that a discontinuity in a scale at a cutoff date will generate a corresponding discontinuity in the predicted ADHD measure only if the scale predicts ADHD diagnoses among children born nowhere near the cutoff date. Neither of these alternative strategies had a substantive effect on the point estimates presented below in Table 3; for example, the estimate in the last column of Table 3 changes from -0.036 to -0.038 when we exclude children born within 100 days of the cutoff date in estimating equation (1).
14
As noted by Elder and Lubotsky (2009), children with pre-existing behavioral problems
such as ADHD are disproportionately likely to voluntarily delay kindergarten enrollment until the
year after they are first eligible. The resulting correlation between ADHD and school starting age
induces positive bias in OLS estimates of α. Therefore, we will estimate α via instrumental
variables, focusing on discontinuities in the neighborhood of entrance cutoff dates as potentially
exogenous sources of variation in school starting age.
To measure variation in school starting age in the neighborhood of eligibility cutoffs, we
model it as a function of the same covariates Xi described above, another smooth function f(·) of
daysi, and an indicator for whether the child was born after the cutoff, denoted as I(daysi > 0):
iiiii uXdaysfdaysISSA +++>= βλ ')()0( . (3)
Imbens and Lemieux (2008) show that instrumental variables estimation of the system given by
equations (2) and (3), where the indicator function I(daysi > 0) is used to instrument for SSAi, is
equivalent to the well-known fuzzy regression discontinuity (RD) design. The estimates of α are
therefore identified by the discontinuities in school starting age and ADHD at the school entrance
cutoffs. The principal advantage of focusing on discontinuities at the cutoffs lies in the fact that
the expectation of εi, representing unobservable determinants of ADHD, need not be unrelated to a
child’s birth date in order to obtain consistent estimates of α. As long as E(εi) is a smooth function
of daysi, i.e., as long as the underlying incidence of ADHD symptoms does not vary
discontinuously in the neighborhood of school eligibility cutoffs, a fuzzy RD design will produce
consistent estimates of α. A number of studies using similar identification strategies, including
Black et al. (2008), Dickert-Conlin and Elder (2010), Dobkin and Ferreira (2009), and McEwan
and Shapiro (2008), have found no evidence of discontinuities in unobservable determinants of
child outcomes at eligibility cutoff dates; we return to this issue below in Table 4.
Table 3 presents instrumental variables estimates of α based on equations (2) and (3). The
first column presents results from models in which both f(daysi) and g(daysi) are quadratic
functions and all observations are included regardless of the value of daysi.10 In the top row, the
10 Following commonly-used nomenclature, this model is labeled as a “global polynomial model” in the table. The f(·) and g(·) functions are allowed to differ for those born after and before the cutoff, so the estimated model is
.)]0([)]0([ 232
210 iiiiiiiii daysIdaysdaysIdaysdaysdaysSSAADHD εδδδδα +>×+>×+++= Note that all
binary models are estimated via linear two stage least squares, but nonlinear methods based on probits and logits yield

15
dependent variable is the binary measure of ADHD diagnosis. The point estimate of -0.049
implies that an additional year of school starting age is associated with a 4.9 percentage-point
reduction in ADHD diagnoses, a large effect relative to the sample diagnosis rate of 6.4 percent.
Similarly, the second and third sets of results show that an additional year of school starting age
reduces behavioral medication usage by 4.5 percentage points and methylphenidate usage by 3.9
percentage points. Both of these estimates are slightly larger than their corresponding sample
means, implying that starting school one year earlier more than doubles the likelihood that a child
will eventually use these medications. The bottom two sets of results show that a child’s age in
school also affects teacher and parent perceptions of the child’s behavioral development. A one-
year increase in school starting age decreases predicted ADHD diagnoses based on teacher SRS
composites by 3.5 percentage points and decreases predicted ADHD diagnoses based on parent
composites and by 1.1 percentage points. Because daysi is discrete, we adopt the inference
procedure suggested by Lee and Card (2008) and report standard errors clustered by daysi
throughout the table.
The remaining columns of Table 3 present estimates of α based on specifications that,
unlike those in column (1), only include children born within a 100 day “window” centered at an
eligibility cutoff. In these models, the f(·) and g(·) functions are both linear and are fitted
separately for individuals born before and after the cutoffs (these specifications are commonly
referred to as “local linear models”, cf. Fan and Gijbels, 1996, and Imbens and Lemieux, 2008).
These specifications are intuitively appealing because only data in the neighborhood of the cutoffs
contribute to estimates of α, but in this context, the only substantive effect of focusing on births
near eligibility cutoffs is a loss of precision – all of the point estimates in column (2) are close to
their corresponding values in column (1). In the three models with binary dependent variables, the
standard errors in column (2) are nearly double those in column (1). Precision also slightly
decreases in the two models of predicted ADHD diagnoses.
similar results. For example, the instrumental variables estimate of α in the top row is -0.049, which equals the reduced-form estimate of the discontinuity in ADHD diagnosis rates, -0.032, divided by 0.66, the corresponding estimated discontinuity in school starting age from equation (3). The estimated reduced-form discontinuity in the binary ADHD measure based either a probit or logit model of ADHD diagnosis is -0.033, implying a fuzzy RD estimate of -0.050, which is statistically indistinguishable from the estimate of -0.049 reported in the table.

16
Column (3) presents estimates from specifications that include controls for the individual
characteristics Xi, and column (4) includes both Xi and state fixed effects. These additional
controls affect the estimates of α only slightly in most cases; for example, for the binary ADHD
diagnosis measure, the point estimate decreases from -0.049 in column (2) to -0.054 in column (4).
The estimates in columns (2) and (4) are statistically indistinguishable at the 5 percent significance
level in all cases. The insensitivity of the estimates to the inclusion of a rich set of covariates and
state indicators implies that observable characteristics of children do not vary discontinuously at
eligibility cutoffs, in agreement with the findings of previous studies. This pattern provides some
reassurance that the unobservable determinants of outcomes also do not vary discontinuously at
cutoff dates, as is necessary for consistency of estimates of α.
To complement the estimates in Table 3, Figure 2 shows the reduced-form relationship
between a child’s birth date relative to eligibility cutoffs and three measures of ADHD. Panel A
shows ADHD diagnosis rates by daysi among children born within 100 days of cutoff dates, with
the smoothed g(·) function overlaid on the data points. The smoothed estimated diagnosis rates are
roughly 3.2 percentage points higher among children born immediately before a cutoff than those
born just afterward. Panels B and C show analogous patterns for predicted ADHD rates based on
the teacher and parental SRS composites, respectively. Mirroring the results in Table 3, the 2.5
percentage-point discontinuity in Panel B is much larger than the 0.7 percentage-point
discontinuity in Panel C. This visual evidence highlights the importance of a child’s age in school
in affecting teachers’ evaluations of behavior, both absolutely and in comparison to the analogous
parental evaluations.
Local linear estimates like those presented in columns (2)-(4) of Table 3 are robust to
smooth associations between the underlying incidence of ADHD and a child’s date of birth, but
they are typically sensitive to the width of the window of data used to generate them. To show the
effect of window widths on both point estimates and standard errors, Figure 3 presents estimates
and pointwise 95 percent confidence intervals for α based on all windows from 6 to 200 days, i.e.,
including children born within 3 to 100 days of their school’s cutoff date.11 Panel A presents the
11 Fan and Gijbels (1996) develop methods for calculating optimal window widths for local linear regressions, but the optimal widths depend on the dependent variable used in the regressions. We view the graphs shown in Figure 3 as the simplest and most transparent way to illustrate the sensitivity of the estimates to the choice of window width.

17
results for ADHD diagnoses. Precision increases monotonically with window width, and the point
estimate is relatively stable starting at a window width of roughly 70 days. Panels B, C, and D
show analogous results for methylphenidate usage, predicted ADHD based on teachers’ SRS
composites, and predicted ADHD based on parents’ SRS composites, respectively. As in Panel A,
the point estimates stabilize at windows of approximately 50 to 70 days, so that the solid lines in
all panels are essentially flat between 70 and 200 days. At windows of less than 50 days, the
confidence intervals are wide in all cases. In Panel B, the point estimates are positive based on
these narrow windows, although the confidence intervals include both large positive and negative
effects, making these estimates essentially uninformative. In all cases, the point estimates are
insensitive to the inclusion of quadratic and cubic functions of daysi as controls (these additional
results are not reported for brevity but are available upon request). The robustness of the estimates
to both window width and the functional form of g(·) suggests that unmeasured associations
between a child’s birth date and the underlying incidence of ADHD are not driving the estimates in
Table 3.
As a final way to explore the validity of the identifying assumptions underlying the
regression discontinuity estimates, Table 4 presents estimates of the effects of school starting age
on several additional measures of childhood health and observable covariates that are associated
with ADHD diagnoses. Panel A of the table focuses on several indicators of childhood health
available in ECLS-K. The top row presents estimates of the effects of school starting age on a
binary indicator for whether a child was ever diagnosed with a hearing problem, based on the same
four specifications shown in Table 3 (Appendix A describes the construction of this variable and
all others included in the table). The estimates range from -0.004 to -0.001 across the columns and
are never statistically significant. Similarly, school starting age is only weakly related to diagnoses
of mobility problems, speech problems, and asthma. The estimated effects on speech problems are
consistently negative but are always insignificant and small compared to the overall diagnosis rate
of 11.0 percent. In the bottom row of Panel A, the dependent variable is a binary measure of
whether the child was ever diagnosed with any learning problem other than ADHD, based on
parental reports of diagnoses of developmental delays, autism, dyslexia, mental retardation,
cerebral palsy, socio-emotional behavior disorder, or other nonspecific “learning disabilities”. The

18
point estimates are practically and statistically insignificant in all four specifications. Dhuey and
Lipscomb (2010) found that school starting age is related to diagnoses of disabilities in the ECLS-
K, particularly learning disabilities, but the estimates in Tables 3 and 4 show that this effect is
entirely driven by ADHD. Within-grade comparisons across children do not appear to play a
significant role in the diagnoses of learning disabilities other than ADHD.
Panel B of Table 4 presents estimates of the relationships between school starting age and
family SES, birth weight, maternal education, and a binary measure of whether the child is white
and non-Hispanic. All of these characteristics have been found to be correlated with ADHD
diagnoses, with some authors even speculating that birth weight directly causes ADHD (e.g., Mick
et al., 2002). None of the estimates are statistically or practically significant, implying that none of
the characteristics vary discontinuously in the neighborhood of eligibility cutoffs. For example,
the coefficient on birth weight in column (1) is 0.636, which is only 3 percent of the sample
standard deviation of birth weight. The absence of discontinuities in these correlates of ADHD
provides further support for a causal interpretation of the association between school starting age
and ADHD.
The Role of Teachers in ADHD Diagnoses
The estimates in Table 3 show that school starting age has much stronger effects on
teachers’ perceptions of child behavior than on similarly measured parental perceptions. Panels C
and D of Figure 3 underscore this difference – for windows wider than 50 days, the 95 percent
confidence intervals in these panels do not overlap. What drives this discrepancy? The answer
may stem from teachers and parents using different reference groups in assessing a child’s
behavior and development. Teachers presumably form their opinions of a child’s behavior by
comparing the child to others in the same classroom. Like teachers, parents likely form their
assessments based on comparisons across children, but they might compare their child’s behavior
to that of others of roughly the same age, not others in the same grade. This difference in
reference groups may be particularly pronounced at the beginning of the kindergarten year, when
the wave 1 ECLS-K interviews took place (all wave 1 surveys were collected between September
and early December). Parents may be unable to accurately gauge the developmental level of their
19
child’s classmates so soon after the beginning of formal schooling, making those classmates an
uninformative reference group.
Although the use of different reference groups by teachers and parents is one plausible
reason for the relatively large discontinuity in teacher-reported predicted ADHD, other
explanations could produce similar results. For example, teachers may simply be better equipped
than parents to objectively assess a child’s development, possibly because parents are susceptible
to social desirability bias in evaluating their children.12 If so, the relatively small discontinuity in
parent-reported predicted ADHD may reflect mean-reverting measurement error in parental
evaluations. This conjecture implies that, compared to parental evaluations, teacher evaluations
will have more predictive power for ADHD diagnoses in general, not only in the neighborhood of
eligibility cutoffs. As shown in Table 2, the pseudo-R2 values based on probit estimates of
equation (1) are 0.120 and 0.106 when the teacher and parent assessments are used to predict
ADHD, respectively. As a result, the standard deviations of teacher- and parent-reported predicted
ADHD are 0.061 and 0.054, respectively. This discrepancy in explanatory power is consistent
with measurement error in parent evaluations, but it is too modest to account for the difference in
the sizes of the discontinuities. Specifically, when measured in standard deviation units, the
discontinuity in teacher-reported predicted ADHD is 0.59 (= 0.036 / 0.061), nearly four times
larger than the discontinuity in parent-reported predicted ADHD of 0.14 (= 0.008 / 0.054). If
measurement error were solely responsible for the differences between parents’ and teachers’
reports, the two discontinuities would have similar magnitudes when measured in standard
deviation units.
Another alternative explanation for the large discontinuity in teacher-reported predicted
ADHD may stem from teachers’ use of absolute standards, rather than relative standards, in
evaluating a child’s development. The SRS questions ask how often a child exhibits a particular
behavior without explicitly asking for relative comparisons, so teachers might have absolute
standards in mind when assigning ratings. Moreover, the discontinuities in SRS composites at
eligibility cutoffs are consistent with the use of absolute standards if young children truly are less
emotionally and cognitively developed than their older classmates. We next consider evidence
12 We thank an anonymous reviewer for pointing out this possibility.

20
that can potentially identify whether teachers’ assessments are primarily based on absolute or
relative standards.13
The top panel of Figure 4 shows the averages of teacher-reported predicted ADHD by birth
month, separately for children born in states with September 1 and December 1 or 2 cutoffs.
Overall, the means of teacher-reported predicted ADHD are nearly identical across the two groups
of states (0.065 and 0.064, respectively), but among children born in August, the average is 0.084
in the September 1 states and 0.065 in the December 1 or 2 states. This difference is statistically
distinguishable from zero at conventional levels (t = 3.46). August-born children in the two sets of
states are roughly similar in age at the beginning of kindergarten, as described above, and those in
the September 1 states score slightly higher on NCES-administered math and reading achievement
tests (although the differences are not statistically significant). Despite these similarities in
objective measures of development, teachers systematically report that the former group of
children is less well-developed than the latter. These findings do not change if we instead compare
children in the September 1 states to children in all seven states with December or January cutoffs:
in these seven states, the mean of teacher-reported ADHD among August-born children is 0.066,
again significantly lower than 0.084. These comparisons suggest that teachers’ perceptions of a
child are at least partly driven by the child’s age relative to his or her classmates, conditional on
the child’s absolute age.14,15
13 Similarly, the estimated discontinuities in ADHD diagnoses are consistent with the use of absolute standards in diagnoses if children are diagnosed based on whether their behavioral problems exceed some absolute, grade-specific threshold. This scenario would generate disproportionately high diagnosis rates among the youngest children in a grade if they behave poorly compared to older children. Like the use of relative within-grade comparisons, these grade-dependent absolute standards would arguably be an inappropriate basis for diagnoses, which should presumably involve standards which are age-dependent, not grade-dependent. 14 In addition to the kindergarten assessments, teachers complete Social Rating Scales in the Fall 2000 (one year after kindergarten) and Fall 2002 (three years after kindergarten) surveys. The sample means of the scales are roughly constant over time, even as the ECLS-K cohort’s behavior and learning skills improve with age. In contrast, the assessments change markedly for children who repeat a grade. For example, among children who are in kindergarten in both the base year and in the following school year, the average teacher-reported predicted ADHD rate decreases significantly, from 0.103 to 0.077 (t = 7.82). Both of these findings are consistent with the interpretation that a child’s location in the classroom age distribution affects teachers’ SRS, even conditional on the child’s own age. 15 As noted by an anonymous reviewer, children who start school at relatively young ages might behave poorly in an effort to “stand out”, possibly because they cannot stand out in desirable ways due to their relative lack of cognitive development. In other words, having relatively old peers may cause young children to behave worse than they otherwise would. While it is unlikely that this behavioral response is solely responsible for the age gradient in diagnoses and teacher assessments, it is consistent with all of the empirical results shown above, including those in Figure 4.

21
Panel B of the figure, which shows averages of parent-reported predicted ADHD across
birth month for the two sets of states, suggests that within-grade comparisons across students play
no significant role in parents’ evaluations. In fact, the average parent-reported predicted ADHD
among August-born students is slightly lower in states with September 1 cutoffs than in states with
December 1 or 2 cutoffs.
Finally, Figure 5 provides further evidence of the sensitivity of teacher and parent
assessments to a child’s school starting age by presenting the relationships between each of the ten
SRS composites and a child’s date of birth relative to kindergarten eligibility cutoffs. The panels
in the left column of the figure refer to the five teacher SRS composites, while the panels in the
right column refer to the analogous parent composites (the bottom panels on the second page of the
figure refer to the “predicted ADHD” variables, replicating Panels B and C of Figure 2). All of the
composites are standardized to have zero mean and unit variance. The figure reveals a clear
pattern: every discontinuity in the left column is larger than the corresponding discontinuity in the
right column. For example, children born immediately before an eligibility cutoff score
approximately 0.50 standard deviations lower on the teacher-reported “approaches to learning”
scale than children born just afterward, but the discontinuity in the parent-reported “approaches to
learning” scale is only 0.08. The large discontinuity in the “approaches to learning” composite
accounts for much of the discontinuity in teacher-reported predicted ADHD; for example, the
estimated discontinuity in teacher-reported predicted ADHD declines from -0.054 to -0.027 when
we exclude it from equation (1). However, all five pairs of composites show that teachers’
assessments of a child’s development are more sensitive to the child’s age than are parents’
assessments.
The sensitivity of teacher-reported ADHD symptoms to school starting age provides strong
evidence that teachers’ opinions drive much of the association between ADHD diagnoses and
school starting age. By extension, these patterns also imply that teachers play a vital role in
ADHD diagnoses more generally. Although teachers cannot diagnose ADHD, the requirement
that ADHD symptoms must be present in at least two settings makes their opinions instrumental in

22
decisions to send a child to be evaluated by a mental health professional.16 Moreover, current
NIMH guidelines for diagnosis explicitly instruct doctors to consider whether the child exhibits
attention deficits and hyperactivity relative to his or her peers, and presumably these relative
assessments rely heavily on teachers’ opinions (NIMH, 2008). As a result, teachers’ beliefs about
whether a child has ADHD are highly correlated with whether the child is eventually diagnosed,
even conditional on parental assessments of the child’s behavior.
Heterogeneity in ADHD-Related Outcomes and the Effects of School Starting Age
Previous research has shown that ADHD diagnosis rates vary widely by race, ethnicity,
gender, and even state of birth (LeFever et al., 2003). Although this variation may reflect
heterogeneity in the underlying incidence of ADHD symptoms, it may instead stem from
heterogeneity in the mechanisms driving ADHD diagnoses, i.e., the mapping from symptoms to
diagnoses. If so, relative comparisons across children may play a larger role in ADHD diagnoses
among some groups of children than among others. In order to investigate this possibility, we first
show how ADHD symptoms and diagnoses vary by race, ethnicity, and SES, and we then assess
whether the association between ADHD and school starting age varies by these characteristics.
Panel A of Table 5 presents average values of ADHD-related variables in ECLS-K by race
and ethnicity. As shown in column (1), 8.4 percent of white non-Hispanic children are diagnosed
with ADHD by eighth grade, compared to 5.1 percent of black non-Hispanic children and 4.1
percent of Hispanics. The means of the ADHD-related variables relative to those of white non-
Hispanics are shown in brackets; for example, diagnosis rates among blacks are 60.7 percent of
those among whites. Columns (2) and (3) show that racial disparities in medication usage are even
more pronounced than the disparities in diagnosis rates. Both black and Hispanic children are less
than 40 percent as likely as white children to regularly use methylphenidate as eighth graders.
16 The ECLS-K includes information on whether a child was ever evaluated for treatment by a mental health professional, regardless of whether the evaluation resulted in a diagnosis. Instrumental variables estimates of the effect of school starting age on a binary indicator of whether a child was evaluated are similar to the estimated effect of school starting age on diagnosis. For example, in a specification identical to column (4) of Table 3, the estimate of α is -0.050 (0.017) in a model of evaluations, compared to -0.054 (0.018) in a model of diagnoses. Full results are available upon request.
23
Although white children are disproportionately diagnosed with and treated for ADHD,
columns (4) and (5) show that they have lower average symptom levels than black and Hispanic
children. Predicted ADHD diagnosis rates among black children are 41.8 percent higher than
among white children based on teacher-reported symptom levels and 33.3 percent higher based on
parental reports.17 Hispanic children also have higher predicted diagnosis rates than white non-
Hispanic children even though they are less than half as likely to be diagnosed. These
discrepancies may be driven by racial differences in parents’ demand for treatment conditional on
symptom levels or by differential access to medical care, as documented by authors such as Currie
and Gruber (1996).
Panel B of Table 5 displays average values of the ADHD-related variables by SES quartile,
based on a composite ECLS-K measure of SES incorporating parental education, occupation, and
income. The evidence for heterogeneity in conditional diagnosis rates is not as dramatic here as in
Panel A, but some similarities are apparent. For example, children in the lowest SES quartile have
45.2 to 79.4 percent higher predicted ADHD rates than those in the top quartile, yet they are only
13.9 percent more likely to be diagnosed and are less likely to be treated with stimulants.
The top two panels of Table 5 suggest that the mechanisms underlying ADHD diagnoses
vary substantially by race and SES.18 As argued above, relative comparisons across children are
essential components of these mechanisms, so we next consider whether the importance of relative
comparisons varies across race and SES. Specifically, in Panel C we present estimates of the
effects of school starting age on ADHD for five ECLS-K subsamples: white non-Hispanics, black
non-Hispanics, Hispanics, children in the highest SES quartile, and children in the lowest SES
quartile. All specifications include births within 100-day windows centered at eligibility cutoffs
and control for observable covariates Xi and state indicators, matching the specifications in the last
17 The racial disparities in reported ADHD symptom levels are robust to alternative measures of symptoms. For example, following Currie and Stabile (2006), we created two binary measures equal to one if a child’s predicted ADHD score is at or above the 90th percentile of all predicted ADHD scores based on the teacher and parent SRS composites, respectively. Black children are roughly twice as likely as white children to be in the top decile of both the teacher-based measure (17.6 versus 9.7 percent) and the parent-based measure (18.5 versus 9.2 percent). 18 As is widely recognized, ADHD prevalence also varies substantially by gender. In the ECLS-K, overall diagnosis rates are 9.1 percent among males and 3.3 percent among females. Unlike race- or SES-based differentials, this difference closely mirrors differences in symptoms; for example, 15.6 percent of males are in the top decile of predicted ADHD scores based on the teacher assessments, compared to 6.2 percent of females. Conditional on symptoms, rates of medication usage also do not differ substantially by gender.

24
column of Table 3. For every subsample, the estimates imply that school starting age reduces
diagnoses, stimulant usage, and predicted diagnoses based on teacher assessments. The point
estimates are larger among Hispanic children than among both black and white non-Hispanics in
four of the five cases, but we are wary of drawing strong conclusions from this pattern because
none of the racial differences are statistically significant at conventional levels. Likewise, the
estimates for low- and high-SES children are statistically indistinguishable and similar in
magnitude in all five cases.
Overall, Table 5 shows that the mapping between ADHD symptoms and diagnoses varies
across race and SES, but there is only weak evidence for heterogeneity in the relationship between
school starting age and ADHD. Regardless of a child’s race or SES, teachers’ assessments of
behavior and development depend on the child’s age relative to his peers. As a result, relatively
young children of all races and SES backgrounds are disproportionately likely to be diagnosed
with ADHD.
V. Summary and Discussion
Diagnoses of attention-deficit / hyperactivity disorder (ADHD) among children have
increased dramatically in recent decades, along with prescriptions of stimulants intended to treat
the symptoms of ADHD. These rapid increases have been the source of much controversy about
the definition and treatment of ADHD, and even about whether ADHD is a “real” condition.
Substantial variation in diagnosis rates across states, races, and ethnicities has amplified these
concerns, leading researchers to suspect that diagnoses and treatments are not solely based on
underlying neurological conditions.
We have presented evidence that ADHD diagnosis rates vary systematically with the age at
which a child begins kindergarten, with an additional year of school starting age reducing the
likelihood of diagnosis by 5.4 percentage points. This age gradient is large relative to the 6.4
percent baseline diagnosis rate in the ECLS-K. Similarly, beginning kindergarten one year later
reduces the likelihood that a child uses behavior-modifying stimulants in eighth grade by 4.4
percentage points and reduces the likelihood of using methylphenidate in particular by 3.8
percentage points.

25
The ECLS-K data used in this study are unique in that they include measures of ADHD
diagnoses as well as teacher and parent reports of ADHD-related symptoms. These teacher and
parent assessments shed light on the mechanisms underlying the negative effects of school starting
age on diagnoses. Specifically, teachers’ evaluations of a child’s development are closely related
to the child’s location in the classroom age distribution. In contrast, parental assessments are only
weakly related to a child’s age-for-grade, perhaps because parents’ frames of reference include
children of similar ages, rather than children in the same grade. Our estimates suggest that
teachers play a vital role in decisions to refer children to medical professionals for evaluation and
possible diagnosis. This role is reinforced by current NIMH diagnostic guidelines that require
evidence of ADHD symptoms in at least two settings, such as at home and in the classroom.
The most troubling aspect of the close association between school starting age and ADHD
is that it suggests that many children diagnosed with ADHD may not have any underlying
biological markers of the disorder. In particular, children who are young for their grade may be
diagnosed inappropriately if teachers and parents mistake their immaturity for ADHD. Among
children born in the six months after their state’s kindergarten eligibility cutoff date, the ADHD
diagnosis rate is 5.1 percent, roughly 20 percent lower than the 6.4 percent overall diagnosis rate.
If medical professionals diagnose these relatively old children if and only if it is medically
appropriate to do so, and if the true incidence of ADHD does not vary by birth date, then 20
percent of the 4.5 million children currently identified as having ADHD have been misdiagnosed.
For many of these 900,000 children, transient deficiencies in maturity led to comparatively long-
lasting use of stimulants intended to treat ADHD symptoms.
Inappropriate diagnoses may impose substantial costs, in the form of adverse health
impacts and the direct financial costs of stimulant therapy. Although no large-scale studies have
assessed the long-term physical effects of the medications used to treat ADHD, the existing
evidence suggests that chronic stimulant use may have numerous harmful effects. First,
randomized clinical trials have consistently found that ADHD medications affect the
cardiovascular system, raising users’ pulse rates and blood pressures. In one of the earliest
experimental studies of methylphenidate, Ballard et al. (1976) found that clinically relevant doses
raised average pulse rates by 8.1 beats per minute and increased systolic blood pressure by 6.2 mm
26
Hg relative to placebo. Recent studies such as Biederman et al. (2006) have found similar effects
of modern extended-release methylphenidate delivery systems, implying that users experience
elevated pulse rates and blood pressure throughout the course of treatment, i.e., for several hours
each day and, in most cases, for many years. Based in part on this evidence, the FDA’s Drug
Safety and Risk Management Advisory Committee voted in 2006 to add “black box” warnings –
the strongest warnings used by the FDA – to packaging of ADHD stimulants in order to describe
their cardiovascular risks. In describing the Committee’s decision, Nissen (2006) writes, “[b]lood-
pressure changes of this magnitude, particularly during long-term therapy, are known to increase
morbidity and mortality… blood-pressure changes [represent] such a reliable predictor of
cardiovascular outcomes that class labeling would be appropriate in most cases.”
In addition to possibly harming cardiovascular health, ADHD medications dramatically
reduce children’s growth rates. The NIMH’s Multimodal Treatment Study of ADHD (MTA
Cooperative Group, 2004) found that in a 24-month randomized trial, children continuously treated
with stimulants grew 1.92 centimeters (0.76 inches) less in height and gained 3.80 kg (8.36
pounds) less in weight than those treated with placebo, on average. Moreover, children who ended
treatment after 14 months continued to grow more slowly over the next 10 months than those
continuously given placebo, suggesting that these growth deficits may be irreversible. These
unexpected findings suggest that chronic stimulant usage may harm children in a number of ways,
only some of which are well understood. These potential risks may be justified by therapeutic
effects for children who have the biological markers of ADHD, but those who are diagnosed
merely because of transient immaturity may not experience any offsetting benefits.19
Inappropriate ADHD diagnoses also impose substantial financial costs on the families of
affected children, insurance providers, and taxpayers. Birnbaum et al. (2005) and Swensen et al.
(2003) estimate that stimulant treatments for ADHD cost $1.6 to $2.5 billion annually in the U.S.,
and Martin (2003) estimates that $400 to $450 million of these costs are paid by Medicaid. If 20
percent of diagnosed and treated cases are medically inappropriate, roughly $320-$500 million is
spent annually on ADHD treatments for inappropriately diagnosed children, at a cost to Medicaid
19 Outram (2010) reviews several studies showing that methylphenidate does not improve the cognitive performance of adults who do not have ADHD. To our knowledge, no existing studies have investigated the effects of methylphenidate on children who do not have ADHD.

27
of $80-$90 million. These estimates merit consideration in assessing whether Medicaid should
continue to cover stimulant-based treatments for ADHD.
Finally, we note that the use of within-grade standards as a basis for ADHD diagnoses may
harm the oldest children in a classroom, rather than the youngest. ADHD symptoms in relatively
old children may be difficult to recognize in comparison to the hyperactivity and inattentiveness
exhibited by their “normal” younger classmates. As a result, legitimate cases of ADHD in older
children may go undiagnosed, possibly leading to long-term adverse effects on academic success
and social adjustment. Whether relatively young children are over-diagnosed, relatively old
children are under-diagnosed, or both, current efforts to define and diagnose ADHD evidently fall
short of an objective standard.

28
References
American Psychiatric Association, 2000. Diagnostic and Statistical Manual of Mental Disorders,
Fourth Edition, Text Revision. Washington, DC. Ballard, J.E., R. Boileau, E.K. Sleator, B.H. Massey, and R.L. Sprague, 1976. “Cardiovascular
Responses of Hyperactive Children to Methylphenidate.” Journal of the American Medical
Association 236, 2870–2874.
Bedard, Kelly, and Elizabeth Dhuey, 2006. “The Persistence of Early Maturity: International Evidence of Long-Run Age Effects,” Quarterly Journal of Economics, 121(4), 1437-1472.
Biederman Joseph, and Stephen V. Faraone, 2006. “Attention-Deficit Hyperactivity Disorder,”
The Lancet, 366(1): 237-248. Biederman, Joseph, Michael C. Monuteaux, Thomas Spencer, Timothy E. Wilens, Heather A.
MacPherson, and Stephen V. Faraone, 2008. “Stimulant Therapy and Risk for Subsequent Substance Use Disorders in Male Adults with ADHD: A Naturalistic Controlled 10-Year Follow-Up Study,” American Journal of Psychiatry, 165(5): 597-603.
Birnbaum, Howard G., Ronald C. Kessler, Sarah W. Lowe, Kristina Secnik , Paul E. Greenberg,
Stephanie A. Leong and Andrine R. Swensen, 2005. “Costs of Attention Deficit–Hyperactivity Disorder (ADHD) in the US: Excess Costs of Persons with ADHD and Their Family Members in 2000,” Current Medical Research and Opinion, 21(2): 195-205.
Black, Sandra, Paul Devereux, and Kjell Salvanes, 2008. “Too Young to Leave the Nest? The
Effects of School Starting Age.” NBER Working paper #13969.
Bloom, Barbara, and Robin Cohen, 2007. “Summary Health Statistics for U.S. Children: National
Health Interview Survey, 2006,” Vital Health Statistics 10(234): 1-79. Cascio, Elizabeth, 2009. “Maternal Labor Supply and the Introduction of Kindergartens into
American Public Schools,” Journal of Human Resources, 44(1): 140-170. Cascio, Elizabeth and Ethan Lewis, 2006. “Schooling and the AFQT: Evidence from School Entry
Laws,” Journal of Human Resources, 41(2): 294–318. Currie, Janet, and Jonathan Gruber, 1996. “Health Insurance Eligibility, Utilization of Medical
Care, and Child Health,” Quarterly Journal of Economics, 111(2): 431–466. Currie, Janet, and Mark Stabile, 2006. “Child Mental Health and Human Capital Accumulation:
the Case of ADHD,” Journal of Health Economics, 25(6): 1094-1118. Currie, Janet, and Mark Stabile, 2009. “Mental Health in Childhood and Human Capital,” in An
Economic Perspective on the Problems of Disadvantaged Youth, Jonathan Gruber, ed. University of Chicago Press, Chicago.

29
Datar, Ashlesha, 2006. “Does Delaying Kindergarten Entrance Give Children a Head Start?”
Economics of Education Review, 25 (1): 43-62. Dickert-Conlin, Stacy, and Todd Elder, 2010. “Suburban Legend: School Cutoff Dates and the
Timing of Births,” Economics of Education Review, forthcoming. Dhuey, Elizabeth, and Stephen Lipscomb, 2010. “Disabled or Young? Relative Age and Special
Education Diagnoses in Schools,” Economics of Education Review, forthcoming. Dobkin, Carlos, and Fernando Ferreira, 2010. “Do School Entry Laws Affect Educational
Attainment and Labor Market Outcomes?” Economics of Education Review, 29(1), 40-54. Elder, Todd E., and Darren H. Lubotsky, 2009. “Kindergarten Entrance Age and Children’s
Achievement: Impacts of State Policies, Family Background, and Peers,” Journal of
Human Resources, 44(3), 641-683. Fan, Jianqing, and Irene Gijbels, 1996. Local Polynomial Modeling and Its Applications.
Chapman and Hall, London. Fertig, Michael and Jochen Kluve, 2005. “The Effect of Age at School Entry on Educational
Attainment in Germany,” IZA Discussion Paper No. 1507. Fletcher, Jason, and Barbara Wolfe, 2008. “Child Mental Health and Human Capital
Accumulation: The Case of ADHD Revisited,” Journal of Health Economics, 27(3): 794-800.
Fredriksson, Peter, and Bjorn Öckert, 2005. “Is Early Learning Really More Productive? The
Effect of School Starting Age on School and Labour Market Performance,” IZA Discussion Paper No. 1659.
Gresham, F. M., & Elliott, S. N., 1990. Social Skills Rating System Manual. American Guidance
Service, Inc., Circle Pines, MN. Imbens, Guido, and Thomas Lemieux, 2008. “Regression Discontinuity Designs: A Guide to
Practice,” Journal of Econometrics, 127(2): 615-635. Kim, Yong, Merilee A. Teylan, Matthew Baron, Adam Sands, Angus C. Nairn, and Paul
Greengard, 2009. “Methylphenidate-Induced Dendritic Spine Formation and ∆FosB Expression in Nucleus Accumbens,” Proceedings of the National Academy of Sciences,
106(8): 2915-2920. Lee, David, and David Card, 2008. “Regression Discontinuity Inference with Specification Error,”
Journal of Econometrics, 142(2): 655-674.
30
LeFever, Gretchen, Andrea Arcona, and David Antonuccio, 2003. “ADHD among American Schoolchildren: Evidence of Overdiagnosis and Overuse of Medication,” The Scientific
Review of Mental Health Practice, 2(1): 49-60. Mannuzza, Salvatore, and Rachel Klein, 2000. “Long Term Prognosis in Attention-
Deficit/Hyperactivity Disorder,” Child and Adolescent Psychiatric Clinics of North
America, 9(3): 711-26. Mannuzza, Salvatore, Rachel Klein, Nhan Truong, John Moulton III, Erica Roizen, Kathryn
Howell, and Francisco Castellanos, 2008. “Age of Methylphenidate Treatment Initiation in Children With ADHD and Later Substance Abuse: Prospective Follow-Up into Adulthood,” American Journal of Psychiatry, 165(5): 604-609.
Martin, Leslie, 2003. “Trends in Psychotropic Medication Costs for Children and Adolescents, 1997-2000,” Archives of Pediatric and Adolescent Medicine, 157(10): 997-1004.
Mayes, Rick, and Jennifer Erkulwater, 2008. “Medicating Kids: Pediatric Mental Health Policy and the Tipping Point for ADHD & Stimulants,” Journal of Policy History, 20(3): 309-343.
McCrary, Justin, and Heather Royer, 2006. “The Effect of Maternal Education on Fertility and Infant Health: Evidence from School Entry Policies Using Exact Date of Birth,” Mimeo, University of Michigan.
McEwan, Patrick J. and Joseph S. Shapiro, 2008. “The Benefits of Delayed Primary School
Enrollment: Discontinuity Estimates Using Exact Birth Dates,” Journal of Human
Resources, 43(1): 1-29. Mick, Eric, Joseph Biederman, Jefferson Prince, Marianna Fischer, and Steven Faraone, 2002.
“Impact of Low Birth Weight on Attention-Deficit Hyperactivity Disorder,” Journal of
Developmental & Behavioral Pediatrics, 23(1): 16-22. MTA Cooperative Group, 2004. “National Institute of Mental Health Multimodal Treatment
Study of ADHD Follow-up: Changes in Effectiveness and Growth After the End of Treatment,” Pediatrics, 113(4): 762-769.
National Center for Education Statistics, 2001. ECLS-K Base Year Public-Use Data Files and
Electronic Codebook, U.S. Department of Education, Washington, DC. National Collaborating Centre for Mental Health, 2009. Attention Deficit Hyperactivity Disorder:
The NICE Guideline on Diagnosis and Management of ADHD in Children, Young People,
and Adults, British Psychological Society and The Royal College of Psychiatrists, London. National Institute of Mental Health, 2008. Attention Deficit Hyperactivity Disorder, National
Institutes of Health (NIH publication # 08-3572), U.S. Department of Health and Human Services, Bethesda, MD.

31
Nissen, Steven, 2006. “ADHD Drugs and Cardiovascular Risk,” The New England Journal of
Medicine, 354(14): 1445-1448. Outram, Simon, 2010. “The Use of Methylphenidate among Students: The Future of
Enhancement?” Journal of Medical Ethics, 36(4): 198-202.
Steele M, M. Weiss, J. Swanson, J. Wang, R. Prinzo, and C. Binder, 2006. “A Randomized, Controlled Effectiveness Trial of OROS-Methylphenidate Compared to Usual Care with Immediate-Release Methylphenidate in Attention Deficit-Hyperactivity Disorder,” Canadian Journal of Clinical Pharmacology 13(1): e50–62.
Swensen A., H. Birnbaum, K. Secnik, M. Marynchenko M, P. Greenberg, and A. Claxton, 2003. “Attention-deficit/hyperactivity disorder: increased costs for patients and their families,”
Journal of the American Academy of Child and Adolescent Psychiatry, 42, 1415-1423.
U.S. Department of Health and Human Services, 1999. Mental Health: A Report to the Surgeon
General. U.S. Department of Health and Human Services, Rockville, MD.

32
Figure 1: Rates of ADHD Diagnosis and Behavioral Medication Usage by Birth Month, ECLS-K
0.0
2.0
4.0
6.0
8.1
Jan Feb Mar Apr May Jun Jul Aug Sep Oct Nov Dec
A: States with September 1 Kindergarten Entrance Cutoffs
ADHD diagnosis rates Medication usage rates
0.0
2.0
4.0
6.0
8
Jan Feb Mar Apr May Jun Jul Aug Sep Oct Nov Dec
B: States with December 1 or 2 Kindergarten Entrance Cutoffs
ADHD diagnosis rates Medication usage rates

33
Figure 2: Average Actual and Predicted ADHD Diagnoses by Birth Date Relative to Eligibility Cutoffs
0.0
5.1
.15
-100 -50 0 50 100
A: ADHD Diagnoses
0.0
5.1
.15
-100 -50 0 50 100
B: Predicted ADHD based on Teacher SRS Composites
0.0
5.1
.15
-100 -50 0 50 100Birth date relative to kindergarten cutoff date
Smoothed values Daily Averages
C: Predicted ADHD based on Parent SRS Composites
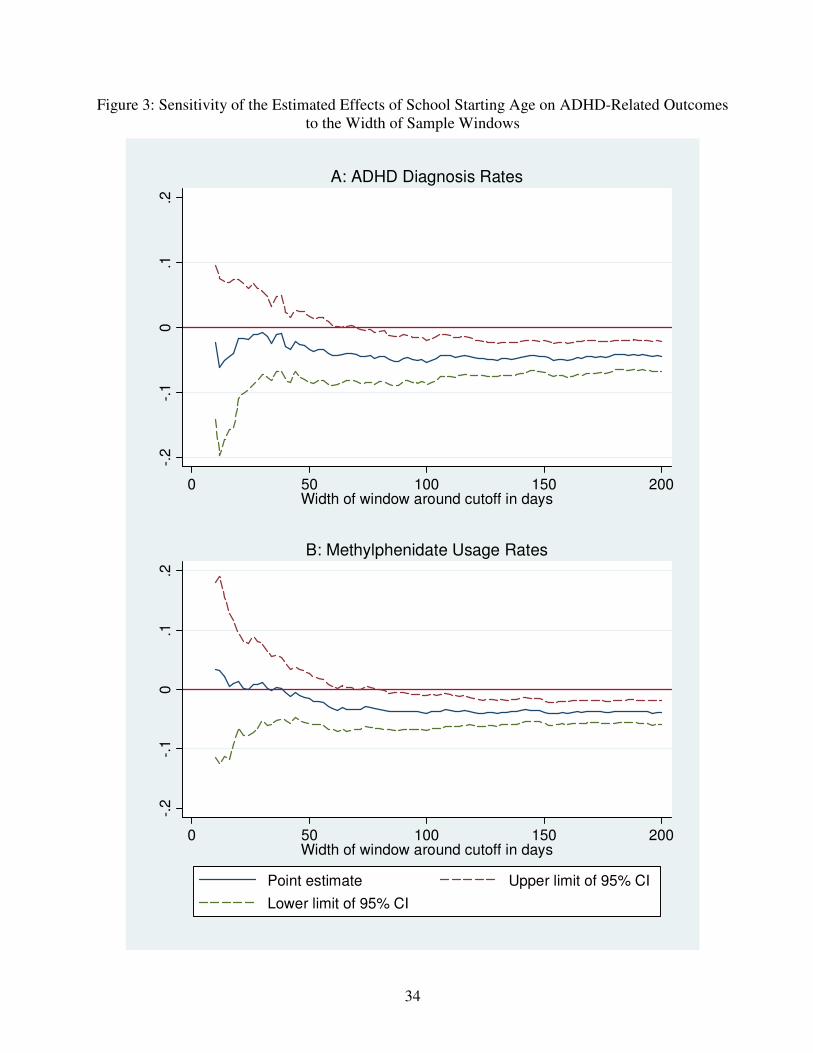
34
Figure 3: Sensitivity of the Estimated Effects of School Starting Age on ADHD-Related Outcomes to the Width of Sample Windows
-.2
-.1
0.1
.2
0 50 100 150 200Width of window around cutoff in days
A: ADHD Diagnosis Rates-.
2-.
10
.1.2
0 50 100 150 200Width of window around cutoff in days
Point estimate Upper limit of 95% CI
Lower limit of 95% CI
B: Methylphenidate Usage Rates

35
Figure 3 (cont.): Sensitivity of the Estimated Effects of School Starting Age on ADHD-Related Outcomes to the Width of Sample Windows
-.08
-.0
6-.
04
-.02
0.0
2
0 50 100 150 200Width of window around cutoff in days
C: Predicted ADHD Diagnoses Based on Teacher SRS Composites-.
08
-.0
6-.
04
-.02
0.0
2
0 50 100 150 200Width of window around cutoff in days
Point estimate Upper limit of 95% CI
Lower limit of 95% CI
D: Predicted ADHD Diagnoses Based on Parent SRS Composites

36
Figure 4: Predicted ADHD Rates by Birth Month and Eligibility Cutoff, ECLS-K
0.0
2.0
4.0
6.0
8
Jan Feb Mar Apr May Jun Jul Aug Sep Oct Nov Dec
A: Predicted ADHD Based on Teacher Reports
September 1 Cutoffs December 1 or 2 Cutoffs
0.0
2.0
4.0
6.0
8
Jan Feb Mar Apr May Jun Jul Aug Sep Oct Nov Dec
B: Predicted ADHD Based on Parent Reports
September 1 Cutoffs December 1 or 2 Cutoffs

Figure 5: Average Teacher (Left) and Parent (Right) SRS Composite Ratings by Birth Date Relative to Cutoff Dates
-1-.
50
.51
-100 -50 0 50 100
Approaches to Learning-1
-.5
0.5
1
-100 -50 0 50 100
Self-Control
-1-.
50
.51
-100 -50 0 50 100Birth date relative to Kindergarten Cutoff Date
Smoothed values Daily Averages
Interpersonal Skills
-1-.
50
.51
-100 -50 0 50 100
Approaches to Learning
-1-.
50
.51
-100 -50 0 50 100
Self-Control
-1-.
50
.51
-100 -50 0 50 100Birth date relative to Kindergarten Cutoff Date
Smoothed values Daily Averages
Social Interaction
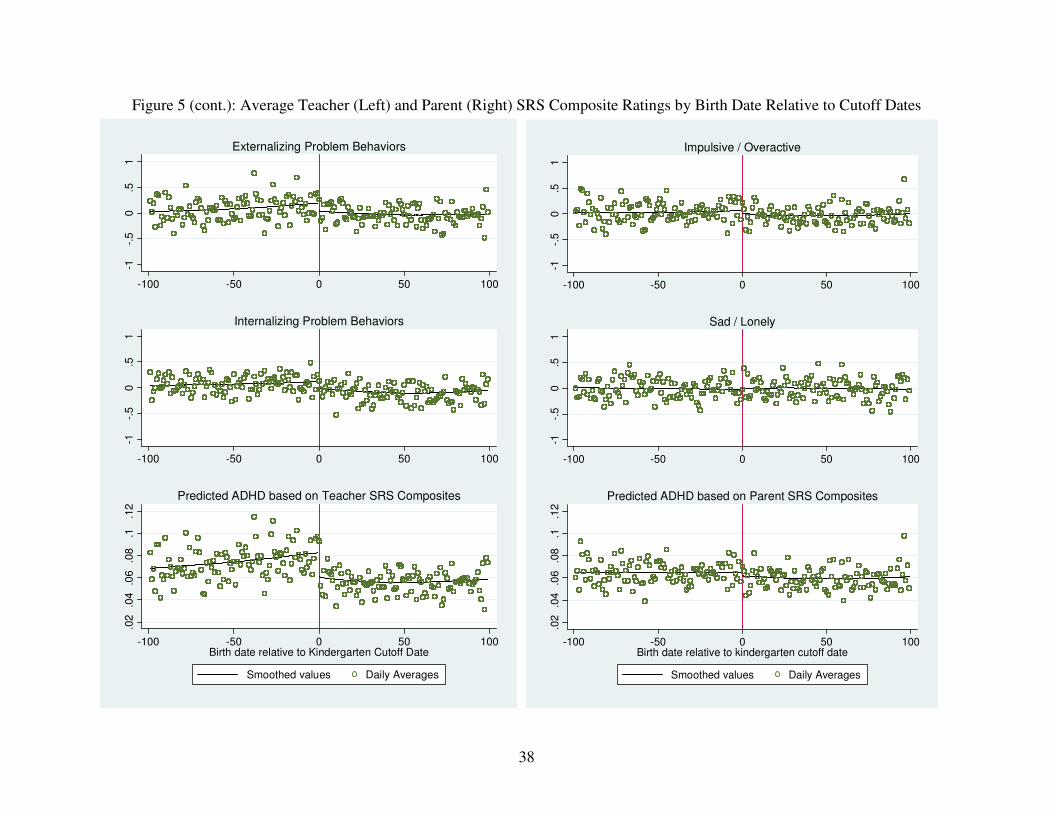
38
Figure 5 (cont.): Average Teacher (Left) and Parent (Right) SRS Composite Ratings by Birth Date Relative to Cutoff Dates
-1-.
50
.51
-100 -50 0 50 100
Externalizing Problem Behaviors
-1-.
50
.51
-100 -50 0 50 100
Internalizing Problem Behaviors
.02
.04
.06
.08
.1.1
2
-100 -50 0 50 100Birth date relative to Kindergarten Cutoff Date
Smoothed values Daily Averages
Predicted ADHD based on Teacher SRS Composites
-1-.
50
.51
-100 -50 0 50 100
Impulsive / Overactive
-1-.
50
.51
-100 -50 0 50 100
Sad / Lonely
.02
.04
.06
.08
.1.1
2
-100 -50 0 50 100Birth date relative to kindergarten cutoff date
Smoothed values Daily Averages
Predicted ADHD based on Parent SRS Composites
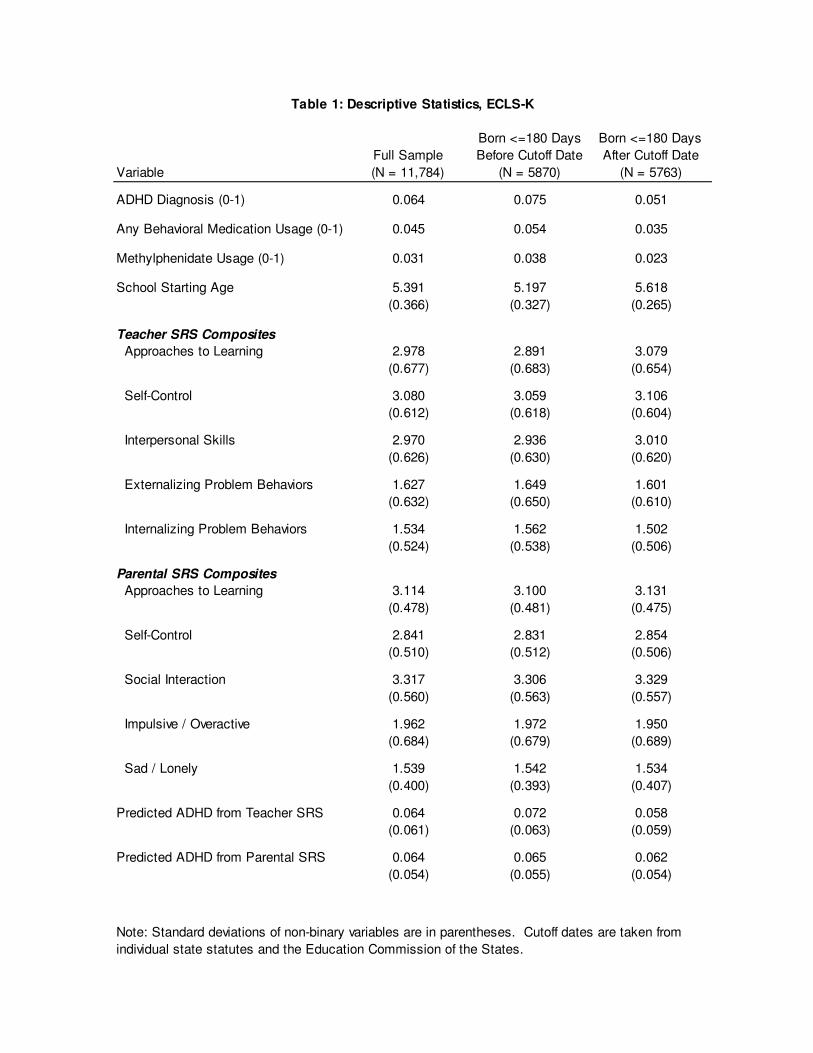
Full Sample
Born <=180 Days
Before Cutoff Date
Born <=180 Days
After Cutoff Date
Variable (N = 11,784) (N = 5870) (N = 5763)
ADHD Diagnosis (0-1) 0.064 0.075 0.051
Any Behavioral Medication Usage (0-1) 0.045 0.054 0.035
Methylphenidate Usage (0-1) 0.031 0.038 0.023
School Starting Age 5.391 5.197 5.618
(0.366) (0.327) (0.265)
Teacher SRS Composites
Approaches to Learning 2.978 2.891 3.079
(0.677) (0.683) (0.654)
Self-Control 3.080 3.059 3.106
(0.612) (0.618) (0.604)
Interpersonal Skills 2.970 2.936 3.010
(0.626) (0.630) (0.620)
Externalizing Problem Behaviors 1.627 1.649 1.601
(0.632) (0.650) (0.610)
Internalizing Problem Behaviors 1.534 1.562 1.502
(0.524) (0.538) (0.506)
Parental SRS Composites
Approaches to Learning 3.114 3.100 3.131
(0.478) (0.481) (0.475)
Self-Control 2.841 2.831 2.854
(0.510) (0.512) (0.506)
Social Interaction 3.317 3.306 3.329
(0.560) (0.563) (0.557)
Impulsive / Overactive 1.962 1.972 1.950
(0.684) (0.679) (0.689)
Sad / Lonely 1.539 1.542 1.534
(0.400) (0.393) (0.407)
Predicted ADHD from Teacher SRS 0.064 0.072 0.058
(0.061) (0.063) (0.059)
Predicted ADHD from Parental SRS 0.064 0.065 0.062
(0.054) (0.055) (0.054)
Table 1: Descriptive Statistics, ECLS-K
Note: Standard deviations of non-binary variables are in parentheses. Cutoff dates are taken from
individual state statutes and the Education Commission of the States.
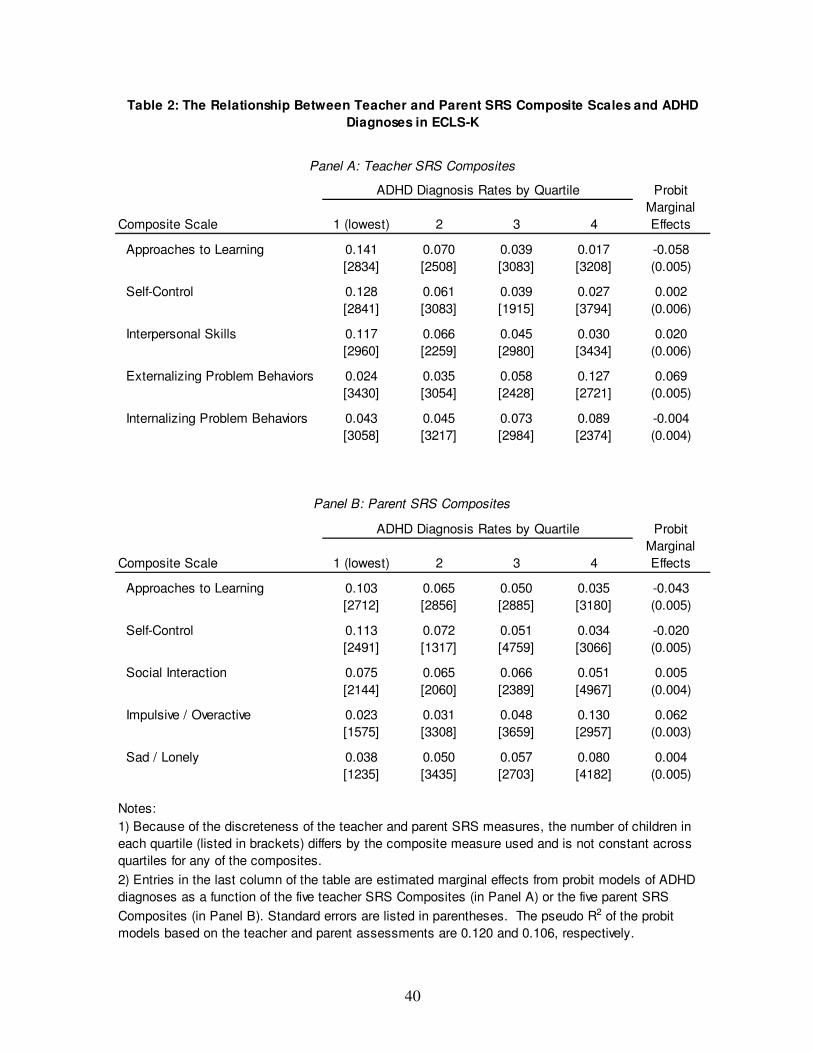
40
Probit
Composite Scale 1 (lowest) 2 3 4
Marginal
Effects
Approaches to Learning 0.141 0.070 0.039 0.017 -0.058
[2834] [2508] [3083] [3208] (0.005)
Self-Control 0.128 0.061 0.039 0.027 0.002
[2841] [3083] [1915] [3794] (0.006)
Interpersonal Skills 0.117 0.066 0.045 0.030 0.020
[2960] [2259] [2980] [3434] (0.006)
Externalizing Problem Behaviors 0.024 0.035 0.058 0.127 0.069
[3430] [3054] [2428] [2721] (0.005)
Internalizing Problem Behaviors 0.043 0.045 0.073 0.089 -0.004
[3058] [3217] [2984] [2374] (0.004)
Probit
Composite Scale 1 (lowest) 2 3 4
Marginal
Effects
Approaches to Learning 0.103 0.065 0.050 0.035 -0.043
[2712] [2856] [2885] [3180] (0.005)
Self-Control 0.113 0.072 0.051 0.034 -0.020
[2491] [1317] [4759] [3066] (0.005)
Social Interaction 0.075 0.065 0.066 0.051 0.005
[2144] [2060] [2389] [4967] (0.004)
Impulsive / Overactive 0.023 0.031 0.048 0.130 0.062
[1575] [3308] [3659] [2957] (0.003)
Sad / Lonely 0.038 0.050 0.057 0.080 0.004
[1235] [3435] [2703] [4182] (0.005)
Notes:
Table 2: The Relationship Between Teacher and Parent SRS Composite Scales and ADHD
Diagnoses in ECLS-K
ADHD Diagnosis Rates by Quartile
Panel A: Teacher SRS Composites
Panel B: Parent SRS Composites
1) Because of the discreteness of the teacher and parent SRS measures, the number of children in
each quartile (listed in brackets) differs by the composite measure used and is not constant across
quartiles for any of the composites.
ADHD Diagnosis Rates by Quartile
2) Entries in the last column of the table are estimated marginal effects from probit models of ADHD
diagnoses as a function of the five teacher SRS Composites (in Panel A) or the five parent SRS
Composites (in Panel B). Standard errors are listed in parentheses. The pseudo R2 of the probit
models based on the teacher and parent assessments are 0.120 and 0.106, respectively.

41
Sample
(1) (2) (3) (4)
ADHD Diagnosis 0.064 -0.049 -0.049 -0.052 -0.054
(0.009) (0.017) (0.017) (0.018)
Any Behavioral Medication Usage 0.045 -0.045 -0.041 -0.042 -0.044
(0.011) (0.019) (0.021) (0.022)
Methylphenidate Usage 0.031 -0.039 -0.039 -0.036 -0.038
(0.010) (0.018) (0.018) (0.018)
Predicted ADHD based on:
Teacher SRS Composites 0.064 -0.035 -0.040 -0.035 -0.036
(0.061) (0.004) (0.005) (0.004) (0.004)
Parent SRS Composites 0.064 -0.011 -0.009 -0.008 -0.008
(0.054) (0.003) (0.004) (0.004) (0.004)
Global polynomial model X
Local linear model X X X
Include Covariates X X
State Indicators X
Note: The entries for each model are the coefficient and standard error in parentheses. All standard errors
are robust to clustering by "days", a child's date of birth relative to the school eligibility cutoff. Covariates
are described in the text. Estimates for "Local linear" models are based on windows of 100 days, i.e., the
estimation samples include all births within 50 days on either side of a kindergarten entrance cutoff.
Outcome
Table 3: Regression Discontinuity Estimates of the Effect of School Starting Age on ADHD
Diagnoses, Medication Usage, and Predicted ADHD Diagnoses
Mean and
S.D.

42
Health Problem (1) (2) (3) (4)
Hearing 0.025 -0.004 -0.004 -0.001 -0.002
(0.008) (0.009) (0.011) (0.012)
Mobility 0.013 -0.005 -0.004 0.002 0.001
(0.004) (0.006) (0.005) (0.006)
Speech 0.110 -0.020 -0.022 -0.020 -0.024
(0.017) (0.023) (0.018) (0.017)
Asthma 0.118 -0.019 -0.025 0.006 0.006
(0.018) (0.033) (0.032) (0.031)
Non-ADHD Learning Problem 0.041 -0.004 -0.002 -0.004 -0.006
(0.013) (0.018) (0.018) (0.018)
Sample
(1) (2) (3) (4)
SES Composite 0.023 -0.044 -0.025 … …
(0.799) (0.036) (0.057) … …
Birth Weight in Ounces 117.130 -0.636 -0.919 … …
(21.134) (1.327) (1.740) … …
Mother's Education 12.960 -0.161 0.073 … …
(3.104) (0.173) (0.242) … …
White, non-Hispanic 0.567 -0.029 0.001 … …
(0.033) (0.043) … …
Global polynomial model X
Local linear model X X X
Include Covariates X X
State Indicators X
Table 4: Regression Discontinuity Estimates of the Effect of School Starting Age on non-ADHD
Health Problems and Observable Covariates
Sample
Mean
Note: The entries for each model are the coefficient and standard error in parentheses. All standard
errors are robust to clustering by "days", a child's date of birth relative to the school eligibility cutoff.
Covariates are described in the text. Estimates for "Local linear" models are based on windows of
100 days, i.e., the estimation samples include all births within 50 days on either side of a
kindergarten entrance cutoff.
Panel A: Non-ADHD Health Problems
Panel B: Observable Covariates
Background Characteristic
Mean and
S.D.
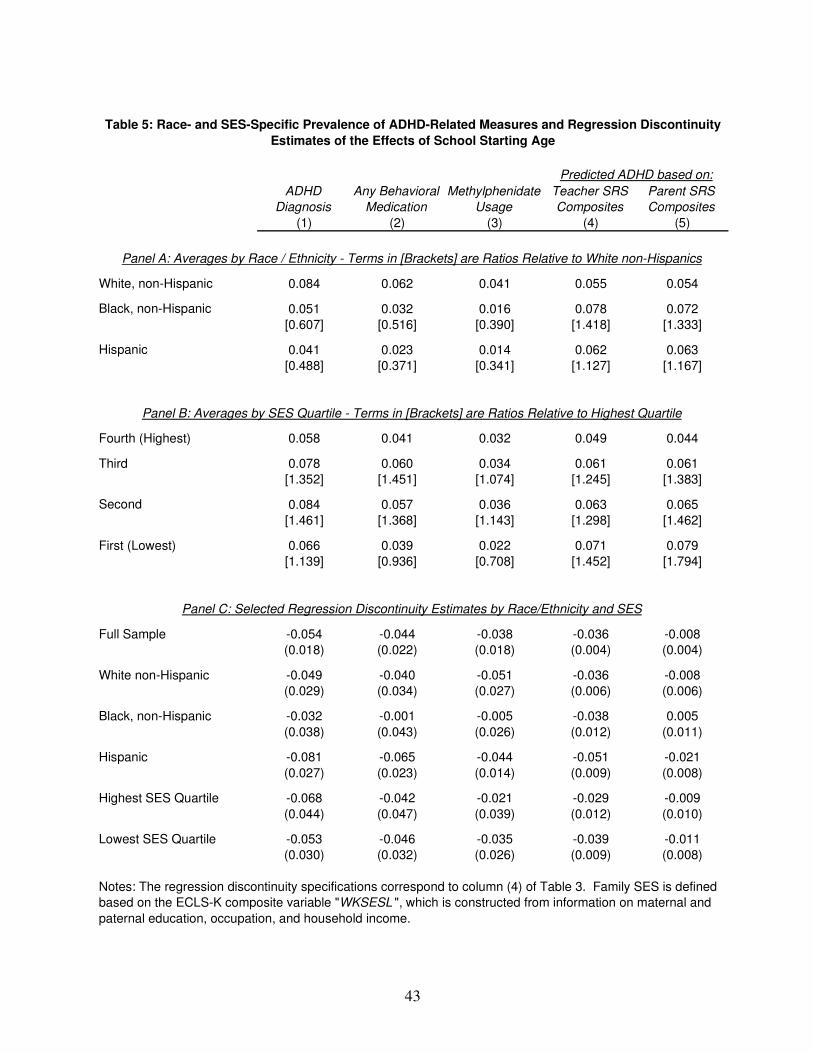
43
ADHD
Diagnosis
Any Behavioral
Medication
Methylphenidate
Usage
Teacher SRS
Composites
Parent SRS
Composites
(1) (2) (3) (4) (5)
White, non-Hispanic 0.084 0.062 0.041 0.055 0.054
Black, non-Hispanic 0.051 0.032 0.016 0.078 0.072
[0.607] [0.516] [0.390] [1.418] [1.333]
Hispanic 0.041 0.023 0.014 0.062 0.063
[0.488] [0.371] [0.341] [1.127] [1.167]
Fourth (Highest) 0.058 0.041 0.032 0.049 0.044
Third 0.078 0.060 0.034 0.061 0.061
[1.352] [1.451] [1.074] [1.245] [1.383]
Second 0.084 0.057 0.036 0.063 0.065
[1.461] [1.368] [1.143] [1.298] [1.462]
First (Lowest) 0.066 0.039 0.022 0.071 0.079
[1.139] [0.936] [0.708] [1.452] [1.794]
Full Sample -0.054 -0.044 -0.038 -0.036 -0.008
(0.018) (0.022) (0.018) (0.004) (0.004)
White non-Hispanic -0.049 -0.040 -0.051 -0.036 -0.008
(0.029) (0.034) (0.027) (0.006) (0.006)
Black, non-Hispanic -0.032 -0.001 -0.005 -0.038 0.005
(0.038) (0.043) (0.026) (0.012) (0.011)
Hispanic -0.081 -0.065 -0.044 -0.051 -0.021
(0.027) (0.023) (0.014) (0.009) (0.008)
Highest SES Quartile -0.068 -0.042 -0.021 -0.029 -0.009
(0.044) (0.047) (0.039) (0.012) (0.010)
Lowest SES Quartile -0.053 -0.046 -0.035 -0.039 -0.011
(0.030) (0.032) (0.026) (0.009) (0.008)
Panel C: Selected Regression Discontinuity Estimates by Race/Ethnicity and SES
Notes: The regression discontinuity specifications correspond to column (4) of Table 3. Family SES is defined
based on the ECLS-K composite variable "WKSESL ", which is constructed from information on maternal and
paternal education, occupation, and household income.
Table 5: Race- and SES-Specific Prevalence of ADHD-Related Measures and Regression Discontinuity
Estimates of the Effects of School Starting Age
Predicted ADHD based on:
Panel A: Averages by Race / Ethnicity - Terms in [Brackets] are Ratios Relative to White non-Hispanics
Panel B: Averages by SES Quartile - Terms in [Brackets] are Ratios Relative to Highest Quartile

44
Appendix A: Data Construction and Description
Binary measures of ADHD diagnosis, treatment, and diagnoses of non-ADHD health problems:
We construct the binary ADHD diagnosis measure based on parent responses regarding whether a child was ever diagnosed with an activity, learning, or behavioral problem. For each of the three relevant problems, the parent was only asked for a specific diagnosis if he or she responded affirmatively to three lead-in questions. For example, in creating the “activity problem” measure, parents are first asked, “Do you have any concerns about {CHILD}’s overall activity level?” If the answer is “Yes”, the parent is then asked, “Has {CHILD} ever been evaluated by a professional in response to {his/her} activity level?” If the answer to this second question is also “Yes”, the parent is then asked “Did you obtain a diagnosis of a problem from a professional?” Finally, if the parent again answers “Yes”, he or she is asked, “What was the diagnosis?” which corresponds to the NCES variable P1DGNACT in the fall 1998 survey. Similarly, the NCES variables P1DGNATT and P1DGNBEH contain specific diagnoses of learning or behavioral problems. We create a binary measure of ADHD diagnosis that equals 1 if a parent reported a diagnosis of ADD or ADHD based on any of these three variables in any wave of the survey, and 0 otherwise.
As described in the text, parents who reported in any survey that their child had been diagnosed with ADHD, ADD, or hyperactivity were asked in spring 2004 and in spring 2007 if the child was currently taking any medication intended to treat these disorders. The relevant NCES variable in the 2004 survey is P6MEDCNE, and follow-up questions ascertaining which medicines the child is taking are represented by the variables P6TKRTLN, P6TKADDR, P6TKDXDN, P6TKMTDT, P6TKCONC, and P6TKSOME.
Finally, binary measures of diagnoses of health problems other than ADHD are constructed similarly to the binary ADHD diagnosis variable. The relevant NCES variables are P1DIFFH3 for hearing problems, P1COORD for mobility problems, P1COMMU2 for speech problems, P5ASTHMA for asthma, and P1DGNATT and P1DGNBEH for non-ADHD learning problems. Teacher and parental Social Rating Scales:
As described in section III of the text, teachers and parents completed Social Rating Scale measures in the fall 1998, spring 1999, and spring 2000 survey waves. Respondents used four-point frequency scales to report how often a student demonstrates a particular behavior (such as getting into fights with peers), with a numerical value of 1 denoting “never”, 2 denoting “sometimes”, 3 “often”, and 4 “very often”. NCES aggregates the 24 teacher-reported scales into 5 composites: “approaches to learning” (measured by ECLS-K variable T1LEARN in the fall 1998 survey), “self-control” (T1CONTRO), “interpersonal skills” (T1INTERP), “externalizing problem behaviors” (T1EXTERN), and “internalizing problem behaviors” (T1INTERN). Similarly, the 22 parent-reported scales are aggregated into 5 composites corresponding to the NCES variables P1LEARN, P1CONTRO, P1SOCIAL, P1IMPULS, and P1SADLON, respectively.
Importantly, NCES does not release the individual scales, even in restricted-use versions of the data – only the 10 composite scales are available. All analyses in the paper use the fall 1998 composites, but models based on spring 1999 and spring 2000 composites generate similar conclusions. As described in the ECLS-K Base Year User’s Guide (NCES, 2001),

45
• T1LEARN measures six items that rate the child’s attentiveness, task persistence, eagerness to learn, learning independence, flexibility, and organization.
• T1CONTRO has four items that rate whether the child respects the property rights of others, controls his or her temper, accepts peer ideas for group activities, and responds appropriately to peer pressure.
• T1INTERP has five items that rate the child’s skill in forming and maintaining friendships, getting along with people who are different, comforting or helping other children, expressing feelings, ideas and opinions in positive ways, and showing sensitivity to the feelings of others.
• T1EXTERN includes five items that rate the frequency with which a child argues, fights, gets angry, acts impulsively, and disturbs ongoing activities.
• T1INTERN includes four items that rate the apparent presence of anxiety, loneliness, low self-esteem, and sadness.
• P1LEARN includes six items that rate the child’s attentiveness, task persistence, eagerness to learn, learning independence, flexibility, and organization.
• P1CONTRO has five items that rate the frequency with which a child fights, argues, throws tantrums, or gets angry.
• P1SOCIAL has three items that address children’s ease in joining in play, ability to make and keep friends, and positive interactions with peers.
• P1IMPULS has two items that ask about children’s impulsivity and activity level. • P1SADLON has four items that ask parents about children’s problems with being accepted
and liked by others, sadness, loneliness, and low self-esteem. Below we list current (DSM-IV) criteria for diagnosis of ADHD. Based on these criteria,
the SRS composites that most closely relate to ADHD diagnoses are T1LEARN, T1EXTERN, P1LEARN, and P1IMPULS. For example, T1LEARN overlaps with DSM-IV symptoms of inattention 1, 2, 5, 6, 7, and 8, while T1EXTERN overlaps with DSM-IV symptoms of hyperactivity-impulsivity 7, 8, and 9.
DSM-IV Criteria for ADHD (American Psychiatric Association, 2000):
To be diagnosed, a child’s symptoms must satisfy the criteria in either group A or B before age 7, and impairment must be present in two or more settings (such as at home and school).
A. Six or more of the following symptoms of inattention have been present for at least 6 months to a point that is inappropriate for developmental level:
1. Often does not give close attention to details or makes careless mistakes in schoolwork, work, or other activities.
2. Often has trouble keeping attention on tasks or play activities. 3. Often does not seem to listen when spoken to directly. 4. Often does not follow through on instructions and fails to finish schoolwork,
chores, or duties in the workplace (not due to oppositional behavior or failure to understand instructions).
5. Often has trouble organizing activities.

46
6. Often avoids, dislikes, or doesn't want to do things that take a lot of mental effort for a long period of time (such as schoolwork or homework).
7. Often loses things needed for tasks and activities (e.g. toys, school assignments, pencils, books, or tools).
8. Is often easily distracted. 9. Is often forgetful in daily activities.
B. Six or more of the following symptoms of hyperactivity-impulsivity have been present for at least 6 months to an extent that is disruptive and inappropriate for developmental level:
1. Often fidgets with hands or feet or squirms in seat when sitting still is expected. 2. Often gets up from seat when remaining in seat is expected. 3. Often excessively runs about or climbs when and where it is not appropriate
(adolescents or adults may feel very restless). 4. Often has trouble playing or doing leisure activities quietly. 5. Is often "on the go" or often acts as if "driven by a motor". 6. Often talks excessively. 7. Often blurts out answers before questions have been finished. 8. Often has trouble waiting one's turn. 9. Often interrupts or intrudes on others (e.g., butts into conversations or games).
To be diagnosed, a child must have been impaired by symptoms before age 7, and impairment from the symptoms must be present in two or more settings (such as at home and school).
Control Variables used in the Analyses:
Control variables in selected specifications include indicators for gender, race, ethnicity, family structure, the marital status of the child’s primary caregiver, Census region, urbanicity, parental education, log family income, and family size.
• The gender, race, and ethnicity variables include indicators for whether a respondent is female, Asian, Hispanic, black, Native American, multiracial, or has missing information on race.
• Family structure variables include indicators for whether the child’s mother and father both live with the child, the mother only, the father only, or if some other family member lives with the child. Indicators for the marital status of the child’s parents include married, separated, divorced, never married, and not reported.
• There are four indicators for Census region (Northeast, Midwest, South, and West), three for urbanicity of the child’s residence (urban, suburban, or rural), and one each for missing Census region and urbanicity, respectively.
• Maternal and paternal education levels are measured as continuous variables ranging from 8 to 18 years. Log family income is created using the midpoints of the ranges of the categorical family income variable provided by NCES. Family size is measured as a continuous variable. Parental education, family income, and family size are set equal to their respective sample means when missing, and new 0-1 indicators for missing values are created for each of the original variables.

47
State Cutoff Date State Cutoff Date
AL Sep. 1 MT Sep. 10
AK Aug. 15 NE Oct. 15
AZ Sep. 1 NV Sep. 30
AR Sep. 1 NH LEA
CA Dec. 2 NJ LEA
CO LEA NM Sep. 1
CT Jan. 1 NY LEA
DC Dec. 31 NC Oct. 15
DE Aug. 31 ND Aug. 31
FL Sep. 1 OH Sep. 30
GA Sep. 1 OK Sep. 1
HI Dec. 31 OR Sep. 1
ID Sep. 1 PA LEA
IL Sep. 1 RI Dec. 31
IN June 1 SC Sep. 1
IA Sep. 15 SD Sep. 1
KS Sep. 1 TN Sep. 30
KY Oct. 1 TX Sep. 1
LA Sep. 30 UT Sep. 2
ME Oct. 15 VT LEA
MD Dec. 31 VA Sep. 30
MA LEA WA Aug. 31
MI Dec. 1 WV Aug. 31
MN Sep. 1 WI Sep. 1
MS Sep. 1 WY Sep. 15
MO Aug. 1
Appendix Table 1: Kindergarten Eligibility Cutoff Dates in the 50 States and DC in 1998.
Note: Cutoff dates in place in 1998 were taken from the Education Commission of the States and state
statutes. An entry of "LEA" refers to states that leave Kindergarten entrance age cutoff policies to local
education authorities (typically school districts).