the inclusive wealth of nations 2018 - seea.un.org · proposal: well-being can be measured by...
TRANSCRIPT

The Inclusive Wealth of Nations 2018:Valuation methodology

I. Fundamentals
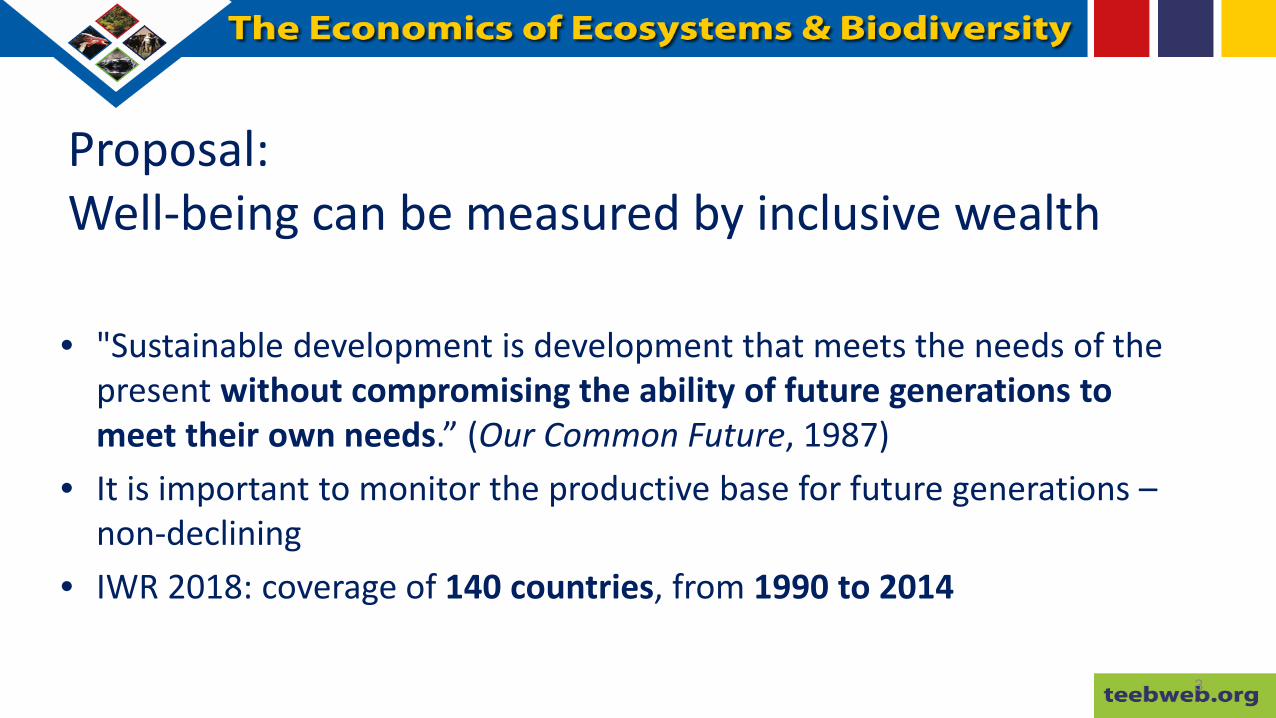
Proposal: Well-being can be measured by inclusive wealth
• "Sustainable development is development that meets the needs of the present without compromising the ability of future generations to meet their own needs.” (Our Common Future, 1987)
• It is important to monitor the productive base for future generations –non-declining
• IWR 2018: coverage of 140 countries, from 1990 to 2014
3

Components of Inclusive wealth 2018
5
Natural Capital Human Capital Produced Capital
Fossil Fuel Oil Natural gas Coal
Education Health
Equipment Machineries Roads others
Minerals Bauxite, Nickel, Copper, Phosphate, Gold, Silver, Iron, Tin, Lead and Zinc
Forest resources Timber Non-timber forest
Agricultural land Cropland Pastureland
Fishery
(1) Carbon damages (2) Oil capital gains (3) Total factor productivity
Befo
re A
djus
tmen
t Ad
just
men
t Fac
tors
IW

Components of Inclusive wealth 2018
6
Natural Capital Human Capital Produced Capital
Fossil Fuel Oil Natural gas Coal
Education Health
Equipment Machineries Roads others
Minerals Bauxite, Nickel, Copper, Phosphate, Gold, Silver, Iron, Tin, Lead and Zinc
Forest resources Timber Non-timber forest
Agricultural land Cropland Pastureland
Fishery
(1) Carbon damages (2) Oil capital gains (3) Total factor productivity
Befo
re A
djus
tmen
t Ad
just
men
t Fac
tors
IW
Natural capital - adjustments– Petrol-dependent countries
uniquely sensitive– Carbon footprint of one country
may harm capital stocks of another

II. Methodologies

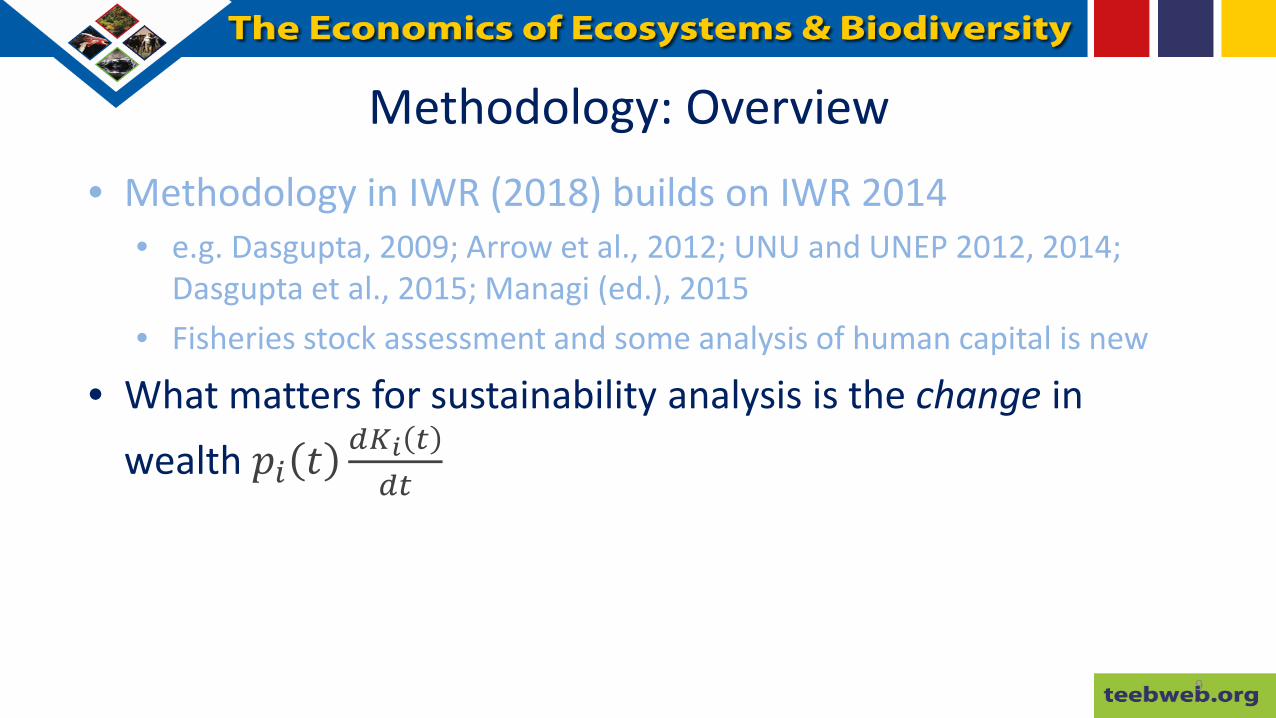
Methodology: Overview• Methodology in IWR (2018) builds on IWR 2014
• e.g. Dasgupta, 2009; Arrow et al., 2012; UNU and UNEP 2012, 2014; Dasgupta et al., 2015; Managi (ed.), 2015
• Fisheries stock assessment and some analysis of human capital is new
8
Methodology: Overview• Methodology in IWR (2018) builds on IWR 2014
• e.g. Dasgupta, 2009; Arrow et al., 2012; UNU and UNEP 2012, 2014; Dasgupta et al., 2015; Managi (ed.), 2015
• Fisheries stock assessment and some analysis of human capital is new
• What matters for sustainability analysis is the change in wealth 𝑝𝑝𝑖𝑖 𝑡𝑡
𝑑𝑑𝐾𝐾𝑖𝑖 𝑡𝑡𝑑𝑑𝑡𝑡
9

Methodology: Agricultural Land
10
StockCropland/pastureland area available for country 𝑖𝑖 in year 𝑗𝑗
Shadow pricesRental price/ha for country 𝑖𝑖 in year 𝑗𝑗: RPAij = 1
𝐴𝐴∑𝑘𝑘=1159 𝑅𝑅𝑖𝑖𝑘𝑘𝑃𝑃𝑖𝑖𝑖𝑖𝑘𝑘𝑄𝑄𝑖𝑖𝑖𝑖𝑘𝑘
NPV of rental price/ha: Wℎ𝑎𝑎𝑖𝑖𝑖𝑖 = ∑𝜏𝜏=𝑡𝑡∞ RPAij1+r 𝜏𝜏
and taking year average
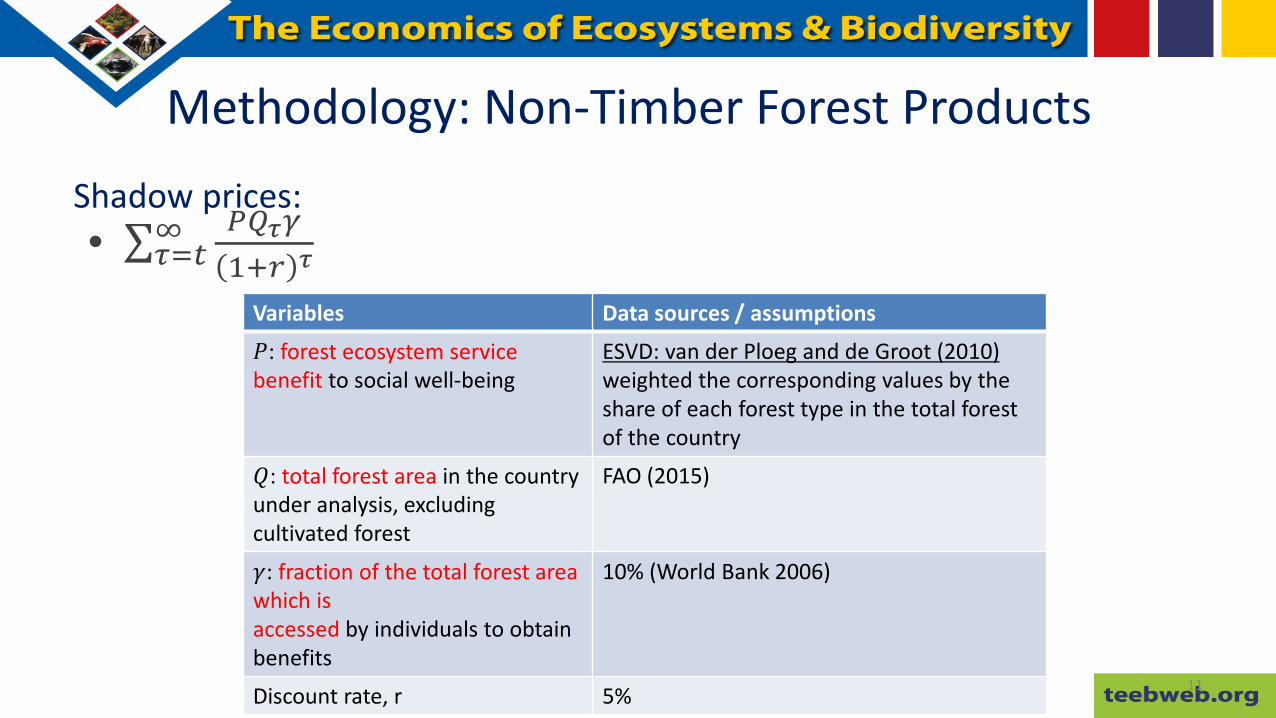
Methodology: Non-Timber Forest Products
• ∑𝜏𝜏=𝑡𝑡∞ 𝑃𝑃𝑄𝑄𝜏𝜏𝛾𝛾1+𝑟𝑟 𝜏𝜏
11
Shadow prices:
Variables Data sources / assumptions
𝑃𝑃: forest ecosystem service benefit to social well-being
ESVD: van der Ploeg and de Groot (2010)weighted the corresponding values by the share of each forest type in the total forest of the country
𝑄𝑄: total forest area in the country under analysis, excluding cultivated forest
FAO (2015)
𝛾𝛾: fraction of the total forest area which isaccessed by individuals to obtain benefits
10% (World Bank 2006)
Discount rate, r 5%

Methodology: Fisheries I• According to Froese et al. (2012) and Kleisner et al. (2013),
the status of fishery is determined by the following criteria:
12
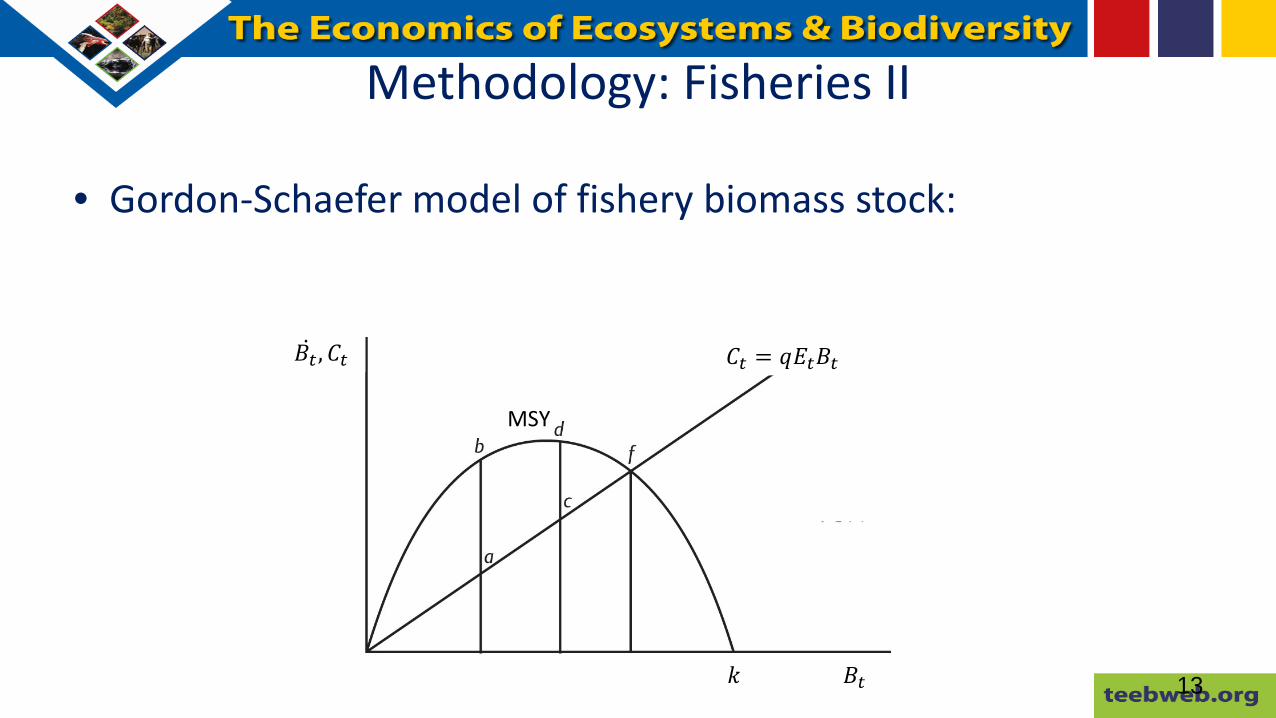
Methodology: Fisheries II
• Gordon-Schaefer model of fishery biomass stock:
13
𝐶𝐶𝑡𝑡 = 𝑞𝑞𝐸𝐸𝑡𝑡𝐵𝐵𝑡𝑡
𝐵𝐵𝑡𝑡
�̇�𝐵𝑡𝑡 ,𝐶𝐶𝑡𝑡
𝑘𝑘
MSY

Methodology: Fisheries III
• Stock: 𝐵𝐵𝑡𝑡• Shadow prices: 𝑃𝑃 ∗ 𝑅𝑅
14
Variables Data sources / assumptions
𝐶𝐶𝑡𝑡: catch of each country’s economic exclusive zone (EEZ) for the period of 1950-2010
seaaroundus.orgonly evaluate the stock that has a catch record for at least 20 years and which has a total catch in a given area of at least 1000 tons over
𝑃𝑃: Shadow prices Species-specific market prices, average for 1990-2014.
III. Results/Interpretation of results

Positive GDP growth, negative IW
16
AFG
BDIBEN
BGD
CAFCOD
GMB
HTI
KEN
KGZ
KHM
LBR
MLI
MMR
MOZ
MRT MWI
NER
NPL RWA
SLETGO
TJK
TZA
UGA
ZWE
ALB
ARM
BLZ
BOL
CIVCMRCOG
EGY
FJI
GHA
GTM
GUY
HND
IDN
IND
IRQ
LAOLKA
LSO
MAR
MDA
MNG
NGA
NICPAKPHL
PNG
PRYSDN
SEN
SLV
SWZ
SYR
UKR
VNM
YEM
ZMB
ARG
BGRBRA
BWA
CHL
CHN
COL
CRI
CUB
DOM
DZAECU
GAB
IRN
JAM
JOR
KAZLTU
LVA
MDV
MEX
MUSMYS
NAM
PAN
PER
ROU
RUS
SRB
THA
TUNTUR
URY
VEN ZAF
ARE
AUSAUT BEL
BHR BRB
CANCHECYP
CZEDEUDNK ESP
EST
FINFRAGBR
GRC HRVHUN
IRL
ISLISR
ITAJPN
KOR
KWTLUX
MLT
NLDNORNZL
POL
PRT
QAT
SAU
SGP
SVK
SVNSWE
TTO
USA
-4%
-2%
0%
2%
4%
6%
8%
10%
12%
14%
16%
-4% -3% -2% -1% 0% 1% 2% 3% 4% 5% 6%
GDP
per c
apita
IW per capita
Low Income
Lower Middle Income
Upper Middle Income
High Income
Figure: Growth rate in GDP per capita and growth rate in IW per capita, 1990-2014
17
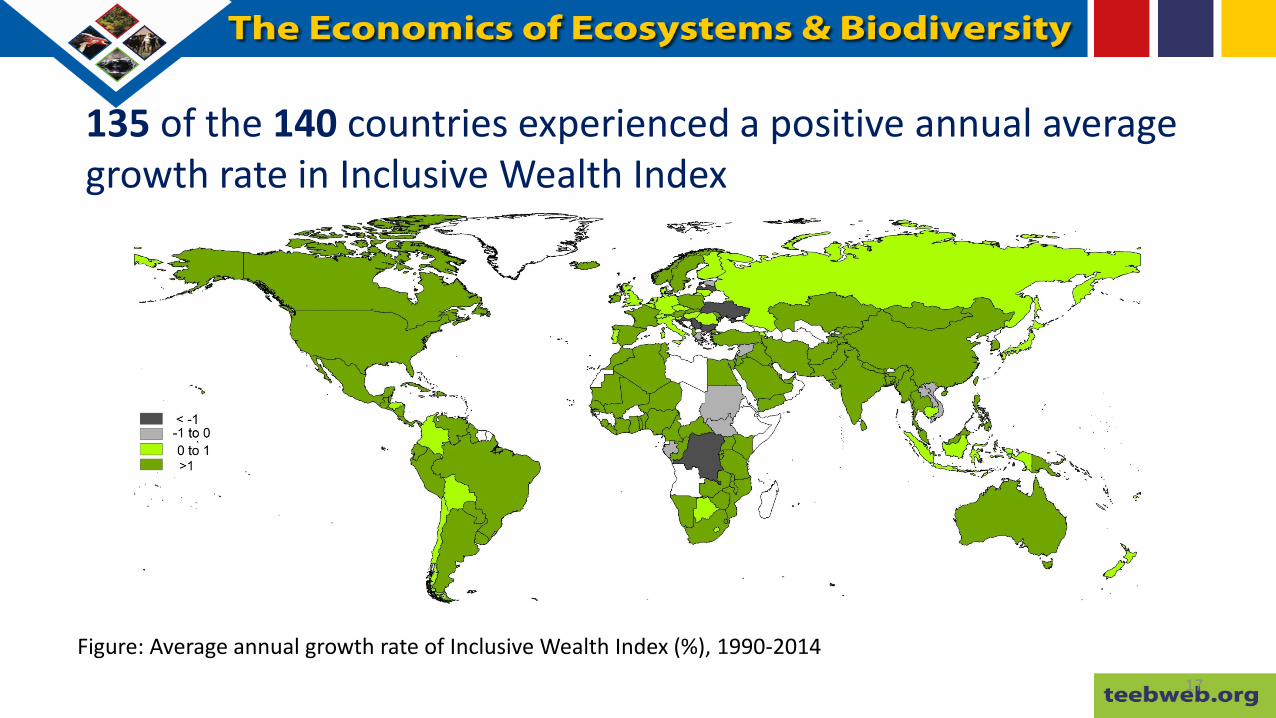
135 of the 140 countries experienced a positive annual average growth rate in Inclusive Wealth Index
Figure: Average annual growth rate of Inclusive Wealth Index (%), 1990-2014

18
-20%
0%
20%
40%
60%
80%
100%
120%
1992
1993
1994
1995
1996
1997
1998
1999
2000
2001
2002
2003
2004
2005
2006
2007
2008
2009
2010
2011
2012
2013
2014
Perc
enta
ge c
hang
e w
ith re
spec
t to
1992
Year
GDP
Produced Capital
Natural Capital
Human Capital
IWI

19
Human Capital
Produced Capital
Natural Capital
Africa 79% 7% 15%Eastern Africa 95% 4% 2%Middle Africa 49% 2% 48%Northern Africa 79% 12% 9%Southern Africa 76% 13% 11%Western Africa 94% 2% 4%Asia 56% 20% 24%Eastern Asia 45% 33% 22%South-Central Asia 73% 8% 19%South-Eastern Asia 55% 18% 27%Western Asia 50% 22% 27%Europe 51% 41% 9%Eastern Europe 66% 23% 11%Northern Europe 44% 42% 14%Southern Europe 52% 42% 7%Western Europe 43% 55% 3%Latin America and the Caribbean 46% 21% 33%Caribbean 59% 28% 13%Central America 49% 21% 31%South America 29% 15% 55%Northern America 31% 37% 31%Oceania 45% 18% 38%Australia/New Zealand 20% 22% 58%Melanesia 70% 13% 17%Total World Average 59% 21% 20%
Regional and sub-regional compositions (%) of wealth by capita from average 1990-2014
IV. Conclusions

1. Inclusive Wealth is a performance indicator that is complimentary to SEEA-EEA
1. Inclusive Wealth is a performance indicator that is complimentary to SEEA-EEA
2. Tracking changes in stocks of capital is critical w.r.t. environmental sustainability and the SDGs

1. Inclusive Wealth is a performance indicator that is complimentary to SEEA-EEA
2. Tracking changes in stocks of capital is critical w.r.t. environmental sustainability and the SDGs
3. The IW methodology (IWR, 2018) has iterated/improved since IWR (2014) and may evolve further
The headline messages are clear: globally, natural capital is being depleted and thus we are not
meeting the condition of strong sustainability Massive regional heterogeneity, e.g. in Africa 95% of the
composition of wealth from human capital versus 31% in Northern America
Notwithstanding the IW/GDP comparison, 135/140 countries experienced IW increase 1990-2014

Thanks!