the increased importance of earnings announcements...
TRANSCRIPT

The Increased Importance of Earnings Announcements after Regulation FD: Evidence from Revisions of
Analysts’ Forecasts and Pre-Announcements
Ron Lazer Stern School of Business
New York University 44 West 4th St. #10-184 New York, NY 10012
(212) 998 - 0036 [email protected]
Preliminary Draft – January 2004 Comments Welcome
Abstract
Regulation Fair Disclosure (Reg FD) was issued to prevent or mitigate the selective disclosure of material information to selected analysts and investors, beginning October 23, 2000. One expected effect of Reg FD is a reduction in private disclosure of material financial information to financial analysts before the earnings announcement. If analysts obtain less private information from management after Reg FD, they are more likely to depend on the subsequent public earnings disclosure in revising their forecasts. My results show a significant decrease in the time until analysts revise their forecasts after earnings announcements during the post-Reg FD period as compared to the period before Reg FD, and a significant increase in the absolute magnitude of these revisions. Also, forecast revisions prior to the earnings announcement in the post-Reg FD period, which are likely based on less private information conveyed by management to analysts, correspond less closely to the actual change in subsequent earnings than in the pre-Reg FD period. Finally, in the post-Reg FD period, I document an increase in the occurrence of voluntary disclosures issued by companies as pre-announcements – company disclosures during the reporting period, after controlling for changes in the economic environment between the pre- and post- Reg FD periods.

1
The Increased Importance of Earnings Announcements after Regulation FD: Evidence from Revisions of
Analysts’ Forecasts and Pre-Announcements
Regulation FD was issued to prevent or mitigate the widespread practice of
selective disclosure of material information by management to a restricted group of
analysts and influential investors. Its purpose was to level the playing field for all
market participants and prevent the loss of investor confidence in the integrity of
capital markets. The SEC was also concerned about the potential for management to
use material information as leverage on some analysts or investors, effectively
discouraging negative reports.1 The restrictions on this private channel became
effective October 23, 2000. After this date, financial analysts have less private
information provided to them by management, which is likely to cause changes in
their forecast revisions. Another expected effect is a shift in the content and
importance of companies’ announcements. Companies are expected to handle the
decrease in information conduits by finding alternative methods that are congruent
with the new rule. One such alternative could be additional public disclosures as pre-
announcements. Another could be enhanced disclosure during the earnings
announcements themselves. In this paper, I provide evidence for changes in attributes
of analyst forecasts and changes in corporate disclosures.
Assuming that companies behave according to the restrictions of Reg FD, that
analysts obtain less private information from management during the reporting period,
and that earnings are as informative post-Reg FD as before, I expect that the public
disclosure of earnings is likely to capture a larger component of the total information
1 http://www.sec.gov/rules/final/33-7881.htm.

2
that analysts use to forecast earnings for the next reporting period. Consequently,
analysts are expected to revise their forecasts closer after the earnings announcement
in the post-Reg FD period than before. Furthermore, the revisions after the disclosure
of earnings are expected to be larger in absolute magnitude during the post-Reg FD
period than before, because the actual earnings announcement provides a larger
amount of new information. Similarly, forecast revisions during the reporting period
are expected to be less consistent with the actual change in subsequent earnings
during the post-Reg FD period than before, because analysts are deprived of the
private information that management disclosed to them prior to Reg FD.
My results show a significant and overwhelming decrease in the time it takes
analysts to revise their forecasts immediately after the earnings announcement in the
post-Reg FD era. I also show that there is a significant increase in the magnitude of
forecast revisions issued immediately after earnings announcements during the post-
Reg FD period from the pre-Reg FD period. These results are consistent with the
increased role of earnings announcements in the later period. An analysis of forecast
revisions made during the reporting period reveals that in the post-Reg FD period
analysts made forecast revisions that are significantly less consistent with the actual
change in subsequent earnings than in the pre-Reg FD period. These results imply a
significant decrease in analysts’ private information.
To compensate for their inability to provide private information to selected
analysts and investors during the post-Reg FD period, companies may provide
additional public disclosures with and between earnings announcements. I examine
all public announcements made by a small sample of firms during the seven quarters
prior and post-Reg FD to assess changes in their disclosure behavior. This hand-
collected sample of forward-looking information and earnings pre-announcements

3
shows that, even after controlling for the deterioration in economic conditions during
the post-Reg FD period, companies made more frequent such disclosures.
The cumulative evidence in this study is generally consistent with Reg FD’s
living up to its objectives. The change in the information environment, designed to
curb selective disclosure practices and to “level the playing field,” seems to have had
significant real effects. Earnings announcements have reclaimed their informational
importance. Analysts’ behavior has changed, too, as seen in the reduced time taken to
issue revisions. Earnings announcements and other (voluntary) firm disclosures have
changed in character and content. Both include much more forward-looking
information post-Reg FD, to compensate for the sweeping restrictions imposed by the
rule.
This study contributes to the literature that examines the effects of Reg FD
along two major dimensions. First, it uses analyst forecast revisions to assess the level
of private information communicated to them by management, instead of employing
analyst forecast accuracy, dispersion, or stock market reactions to earnings
announcements. Second, I examine all public announcements made by a small sample
of firms to determine if there was an increase in forward looking information. Prior
studies have used samples of forward looking announcements, but not necessarily all
forward looking announcements made by those firms, and typically did not control for
the changes in the economic environment.
II. Prior Research:
Analysts’ Forecast Revisions
Analysts’ revisions have been of interest to current literature. Gleason and Lee
(2003) find that a substantial price adjustment occurs around forecast-revision dates.

4
Barron, Byard and Kim (2002) find that the commonality of information among
active analysts decreases around earnings announcements, and that the idiosyncratic
information contained in individual analysts' forecasts seems to increase immediately
after earnings announcements. Their results are more significant with the increase of
the number of forecast revisions. Zitzewitz (2002) examines the information content
of forecasts. He argues that Reg FD has been successful in reducing selective
disclosure of information about future earnings to individual analysts, without
reducing the total amount of information disclosed to the market. Mohanram and
Sunder (2001) explore the effects of Reg FD on the performance and behavior of
analysts, using forecast error and forecast dispersion. They find evidence consistent
with the objectives of Reg FD.
Voluntary Disclosure
With respect to voluntary disclosure, prior research has generally focused on
the motivation for companies’ pre-announcements, and on the market reaction to
these pre-announcements. Soffer et al. (2000) examine the factors influencing a firm’s
decision to voluntarily accelerate the release of earnings via a ”pre-announcement”.
They find that firms are more likely to pre-announce earnings if the consensus of
analysts’ forecasts is very different from actual subsequent earnings, if the dispersion
of these forecasts is high, and if the firm has negative news. Skinner (1994) argues
that managers pre-announce to prevent lawsuits caused by large stock price declines
at the bad earnings announcement, and to protect their reputation with analysts and
institutional investors by not delaying bad news. Using a random sample of 93
NASDAQ firms during 1981-90, he finds that earnings-related voluntary disclosure
occurs infrequently (on average, one disclosure for every ten quarterly earnings
announcements), and that good news disclosures tend to be point or range estimates of

5
annual earnings-per-share, whereas bad news disclosures tend to be qualitative
statements about the current quarter’s earnings. In his sample, quarterly earnings
announcements that convey large negative earnings surprises are preempted about
25% of the time by voluntary corporate disclosures, and other earnings
announcements are preempted less than 10% of the time.
Kasznik and Lev (1995) look at management’s discretionary disclosures for
firms that subsequently experience large earnings surprises. They find that less than
10% of their large-surprise firms publish quantitative earnings or sales forecasts (less
than 100 firms), and 50% provide no earnings guidance, although they subsequently
report very significant earnings surprises. Coller and Yohn (1997) use a sample of 278
quarterly earnings forecasts, including point estimates, range estimates, and upper and
lower bound estimates, to examine whether the decision to issue a management
earnings forecast is related to information asymmetry in the market for the firm’s
stock, and whether the forecasts reduce the information asymmetry. They find support
for the view that managers release forecasts to reduce information asymmetry.
Miller (2002) examines a sample of 80 companies experiencing an extended
period of seasonally adjusted earnings increases. Using 416 observations of forecasts
and earnings pre-announcements over a period of three years, he finds an increase in
disclosure during the period of increased earnings. The increase tends to be bundled
with earnings announcements, and the market responds positively to this disclosure.
Johnson, Kasznik and Nelson (2001) use 1135 forecasts between 1994 and 1996 for
about 600 firms in industries with high risk of litigation, to evaluate corporate
voluntary disclosure of forward-looking information under the Safe Harbor provision
of the Private Securities Litigation Reform Act of 1995. They find that managers

6
engage in more disclosure after the rule, and that the increase in disclosure is an
increasing function of the firms’ ex ante risk of litigation.
Market Reactions to Voluntary Earnings Preannouncements:
Heflin, Subramanyam and Zhang (2003) examine voluntary disclosure after
the implementation of Regulation FD and find (a) lower return volatility around
earnings announcements; (b) some improvement in the speed with which the price
before the earnings announcement converges to its post-announcement level; (c) no
reliable evidence of changes in various aspects of analysts’ forecast bias, accuracy,
and dispersion; and (d) an increase in the quantity of firms’ voluntary forward-looking
disclosures.
Skinner (1994) shows that there is a substantially stronger market reaction to
negative news guidance (-6.1%) than to positive news (2.5%). Kasznik and Lev
(1995) observe that the market-adjusted return in the five-day window around the
earnings (sales) forecast was about 5.4% for positive news and about 5.3% for
negative news. Furthermore, they show that for companies with negative disclosures,
the total market-adjusted return in the five-day window around the warning and the
five-day window around the subsequent earnings release was significantly more
negative than for companies that provided no warnings before announcing a
significant negative decline in earnings.
Soffer et al. (2000) find that size-adjusted returns in the three-day window
surrounding the earnings guidance disclosure is significantly associated with the
surprise in the announcement relative to analysts’ forecasts before the announcement,
and is about 6.95% stronger (more negative) for negative guidance. However, they
also show that negative guidance announcements tend to preempt the entire negative
news that are subsequently disclosed in the earnings release, but only about 50% of

7
the subsequent positive news are reported by companies providing positive guidance.
Moreover, they find that trading based on the fact that positive guidance is likely to be
followed by an even greater positive surprise subsequently can be a profitable
strategy, earning about 2.6% size-adjusted returns, or even 3.4% for companies in
industries with a high risk of litigation.
Feldman, Lazer and Livnat (2003) examine a large sample of earnings
guidance disclosures based on identification of these announcements using text-
mining techniques. Their results indicate that guidance provided with the disclosure of
earnings is not associated with significant market reactions, but guidance provided
between earnings releases is associated with significant negative reactions.
III. Hypothesis Development
I first investigate whether the information content of earnings announcements
has changed in the post-Reg FD period. To answer this question, I use analysts’
revisions as an indicator of the information environment available to analysts. The
elimination of a major information channel is bound to have substantial implications
for the timing and form in which information is disseminated and processed (Heflin et
al. 2003). For example, earnings announcements are expected to reclaim their
informational importance, as private channels have been restricted. Moreover,
companies eager to convey relevant information to market participants may bundle it
in those earnings announcement events (Bailey, Li, Mao and Zohng, 2003). Thus,
overall, the importance of earnings announcements as a major event for information
users should increase. Evidence of this importance can be seen in the behavior of
financial information users, namely analysts. The speed with which analysts issue
their forecast revisions after any disclosure event is a strong indication of the amount

8
of information contained in that disclosure, in relation to the total information
available to them. The change in the length of time analysts take to process and issue
their revisions after earnings announcements indicates the change in the relative
amount of new information contained in the announcements. Given the deterioration
in the private information management can convey to analysts post-Reg FD, I expect
to find an increase in the sense of urgency with which analysts issue their revisions,
lending support to the hypothesis that the information contained in earnings has
increased from the pre-Reg FD period. Therefore, I postulate the following hypothesis
(stated in the alternate form):
H1: Analysts’ revisions are issued much more quickly since Reg FD.
Before Reg FD, many firms communicated privately with analysts during the
quarter. These analysts revised their forecasts during the quarter based on the
information supplied privately, resulting in reasonably accurate forecasts for the
subsequent quarters. When earnings were subsequently announced, the new
information contained in the release was typically smaller relative to the information
available to the analyst before the announcement, requiring a smaller forecast
revision. Analysts now face a different information environment and are likely to
behave differently. Their forecasting ability during the quarter and prior to the
earnings announcement may be substantially affected, as the stream of private
information is more limited and sparse. Therefore, the earnings announcement is
expected to convey significant new information and to yield revisions of a higher
magnitude in the post-Reg FD period. Therefore, I postulate the following hypothesis
(stated in the alternate form):

9
H2: Analysts’ forecast revisions post-Reg FD are larger in magnitude than such
revision pre-Reg FD.
The decrease in available information due to Reg FD is bound to have
additional repercussions on analysts’ behavior. If analysts now have less access to
private information, this should be reflected in their forecast revisions during the
quarter and before the actual earnings announcement date, a period in which
management is unlikely to disclose private information to analysts. Thus, I look at
forecast revisions made during the period starting 10 days after the issuance of
earnings announcements and ending right before the following quarter’s earnings
announcements (approximately 80 days). Assuming that revisions in analysts’
forecast imply availability of new information, I expect the forecast revision to be less
consistent with the actual subsequent change in earnings during the poorer
information environment post-Reg FD. Specifically, the magnitude of revisions for
firms with actual subsequent negative (positive) earnings surprises should be less
negative (positive) in the post-Reg FD period than in the pre-Reg FD period.
Therefore, I postulate the following hypothesis (stated in the alternate form):
H3: Analysts’ forecast revisions are less consistent with the actual subsequent
changes in earnings during the post-Reg FD.
The third research question I consider is whether there has been a change in
firms’ disclosure behavior post-Reg FD. To answer this question I use a hand-

10
collected sample of companies that made voluntary disclosures of forward-looking
information, either as part of an earnings announcement or separately.
Post-Reg FD, firms have fewer channels through which they can communicate
with the public and analysts. I therefore expect to see an increase in permissible
communications, such as pre-announcements and other forward-looking disclosures.
Previous researchers have found a positive correlation between the magnitude of the
negative earnings or sales surprises and the tendency of firms to use voluntary
disclosure (Skinner 1994; Kasznik and Lev 1995). I collect a sample of companies
that made voluntary disclosures of forward-looking information, either as part of an
earnings announcement or separately, between 1999 and mid-2002. During this period
the economy experienced both high growth and a recession. Based on prior literature,
I expect more pre-announcements in the recession period due to a higher occurrence
of negative changes in earnings. To control for changes in the economic environment
between the pre-Reg FD period and the post-Reg FD period, I examine the frequency
of voluntary disclosures while controlling for the actual earnings surprise. I expect to
find a higher frequency of voluntary disclosures in the post-Reg FD period for the
same level of an earnings surprise. Therefore, I postulate the following hypothesis
(stated in the alternate form):
H4: The frequency of voluntary disclosures of forward-looking information is
higher post-Reg FD.
I also use the hand-collected sample of companies that made voluntary
disclosures of forward-looking information to test for analysts’ forecast revisions
made during the period prior to the preannouncement. I examine the period starting

11
10 days after the issuance of earnings announcements and ending right before the
following quarter’s earnings pre-announcement if it occurred prior to the end of the
quarter. Assuming that revisions in analysts’ forecasts imply the availability of new
information, I expect these revisions to be less consistent with the actual changes in
earnings implied by the preannouncement during the poorer information environment
post-Reg FD. Specifically, I expect the magnitude of revisions for firms with actual
negative (positive) earnings surprises to be less negative (positive) in the post-Reg FD
period than before it. By testing this with the sample of firms that voluntarily
disclosed forward-looking information, I can capture the portion of the sample most
eager to disclose information to market participants. These firms are arguably also
more likely to try to circumvent and test the limits of Regulation FD. Therefore, I
postulate the following hypothesis (stated in the alternate form):
H5: Analysts’ forecast revisions during the quarter but prior to the
preannouncement of earnings are less consistent with the implied change in
earnings due to the announcement post-Reg FD.
IV. Research Design and Discussion of Results
To assess how quickly analysts’ revisions are issued after earning
announcements, I use the IBES detailed and actual files for all firms traded in the US.
The sample period includes annual forecasts made between January 1998 and July
2003–approximately two and a half years pre- and post-Reg FD. For all the firms in
the IBES database, I identified a 120-day window (60 days before and 60 days after
an earnings announcement). To be included in the sample an analyst should have had

12
at least two EPS forecasts for the current year within the 120-day window–one
forecast before and one after the earning announcement.
I illustrate the construction of the variables using the following time frame:
60 days 60 days
Panel A of Table 1 reports the average number of days until the issuance of a
new annual forecast, following annual or quarterly earnings announcements. The
average number of days following earnings announcements is significantly shorter in
the post-Reg FD period. For example, the average number of days used by analysts to
update their annual EPS forecast went from 12.3 days in the pre-Reg FD period to 7.7
days in the post-Reg FD period. Thus, analysts react faster to earnings
announcements in the post-Reg FD period, implying an increase in the amount of
information conveyed in those announcements relative to available information prior
to the announcements. Forecast revisions following the announcement of previous
annual earnings results are slower than the revisions following quarterly earnings
announcements, but consistent with the decrease between the pre-Reg FD and the
post-Reg FD periods (there is a decrease of 5.6 days in the length of time analysts use
to revise their annual forecast following annual earnings announcements). The
difference between revisions following quarterly and annual results might be
explained by the greater amount of information conveyed in annual announcements.
T-60 To T+60
At least one
new forecast
for year 1 is announced
Earning
announcement
date for year 0 or
Q1/2/3 of year 1
results
At least one
new forecast
for year 1 is announced

13
Given the change in the economic environment between the pre- and post-Reg
FD periods, there is a need to control for differential levels of earnings surprises.
Panel B of Table 1 provides the difference in the average number of days until the
issuance of a forecast revision of the annual EPS, pre- and post-Reg FD, controlling
for the median forecast error in analysts’ forecasts for the current quarter. Median
forecast error is defined as the difference between the actual EPS (as reported by
IBES) and the median of all available forecasts (the last forecast of each analyst) 60
days before the earnings announcement, divided by the share price at the beginning of
the previous quarter. Post-Reg FD, there is a significant decrease in the average
number of days until the issuance of a new forecast for all levels of current-quarter
median error.
An additional way to control for both the change in the economic conditions
and the speed of forecast revisions is to control for the specific forecast error of each
analyst. Panel C of Table 1 presents the difference in the average number of days until
the issuance of a forecast revision of the annual EPS, pre- and post-Reg FD,
controlling for the specific forecast error in analysts’ forecasts for the current quarter.
The specific forecast error is defined as the difference between the actual EPS and the
last analyst forecast before the earnings announcement (less than 60 days before the
earnings announcement), divided by the share price at the beginning of the previous
quarter. As the panel shows, there is a significant decrease in the average number of
days for all levels of forecasts’ accuracy in the post-Reg FD period.
Further analysis of the average number of days until the issuance of forecast
revisions for the following quarter EPS provide similar results. The quarterly analysis
follows this timeline:

14
60 days 60 days
Figure 1 shows that the percentage of analyst revisions in quarterly forecasts
made one day after earnings announcement is higher in the post-Reg FD period than
before. Untabulated results similar to those in Table 1 also show that analyst forecast
revisions occur faster after Reg FD than before. Thus, the above results significantly
reject the null hypothesis corresponding to H1, indicating that during the post-Reg FD
period analysts revised their forecasts immediately after the earnings announcements
faster than in the pre-Reg FD period.
In Table 2, I analyze the size of the EPS forecast revisions. As mentioned
above, the information gap between analysts and firms that is decreased at the
earnings announcement event is expected to yield revisions of a higher magnitude in
the post-Reg FD period, because relatively more information is conveyed by the
earnings announcement post-Reg FD than before. The EPS forecast revision is
calculated as the difference between the first forecast following the earnings
announcement and the last forecast before that earnings announcement, divided by the
share price at the beginning of the quarter. Table 2 presents the average EPS forecast
revision, controlling for the median forecast error for the current quarter results (Panel
A), and for analysts’ specific forecast error (Panel B). The table shows that the
magnitude of forecast revisions post-Reg FD is significantly higher than in the pre-
Reg FD period. The positive difference holds for most levels of median or specific
forecast errors.
T-60 To T+60 T~+90
At least one new forecast
for quarter 1 is
announced
Earning announcement date
for quarter 0
results
At least one new forecast
for quarter 1 is
announced
Earning announcemen
t date for quarter 1
results

15
To further assess the difference in the magnitude of forecast revisions between
the pre- and post-Reg FD periods, I use the following multi-variable model, which
controls for the contemporaneous forecast error and the previous revision magnitude:
(1) ABS_Revt,i = a0 + a1 * ABS_FEt,i + a2 * ABS_Revt-1,i + a3 * Posti * ABS_FEt,i
+ a4 * Posti * ABS_Revt-1,i + ei
ABS_Rev – The absolute value of the revision of quarterly/annual analyst forecasts around the earnings announcement divided by the share price at the beginning of the quarter
ABS_FE – The absolute value of the difference between the actual quarterly EPS and the latest (specific) analyst forecasts divided by the share price at the beginning of the quarter
Post – A dummy variable indicating the period (1 for Post-Reg FD and 0 for Pre-Reg FD)
I expect to find a positive coefficient for the interaction between the period’s
dummy and the absolute value of the forecast error, indicating a bigger effect of
forecast errors in the post-Reg FD period. The absolute value of the previous quarter
analyst revision is introduced in order to control for autocorrelations in analysts’
forecast revisions.
Table 3 reports the estimation results for using analysts’ revisions of both
quarterly and annual forecasts. Consistent with my hypothesis, the coefficient on the
absolute forecast error (a3) post-Reg FD is positive and significant for two different
measures of forecast error. The first measure is the specific analyst forecast error,
which is the difference between the actual EPS and the specific analyst’s latest
forecast before the earnings announcement. This measure indicates the specific gap in
information between the analyst and the company. The second measure is the latest
analyst forecast error, which is the difference between the actual EPS and the latest
forecast before the earnings announcement. This measure indicates the overall gap
between the company and the capital market. Using the median forecast error, the

16
results (not reported) hold. Thus, the combined evidence in Tables 2 and 3 indicates
that the data reject the null hypothesis corresponding to H2, i.e., and that forecast
revisions immediately after earnings announcements are larger in magnitude after Reg
FD than before it, even after controlling for the forecast error and the previous analyst
revision.
To assess the relative amount of private information in analyst forecasts
during the reporting period, I compare whether the forecast revisions made during the
quarter are less consistent with the actual subsequent change in earnings during the
post-Reg FD period then before. This can be best illustrated with the following
timeline:
10 days ~80 days
By ten days after the quarter earnings announcement, most analysts have
already revise their forecast for current quarter EPS based on the information
provided in the earning announcement for the previous quarter. The forecast
revisions following those ten days are based on information available to analysts
during the remainder of the quarter. Companies may provide additional information,
and analysts gather new information on their own. This period, approximately 80 days
long, is a period with limited private communications between the company and
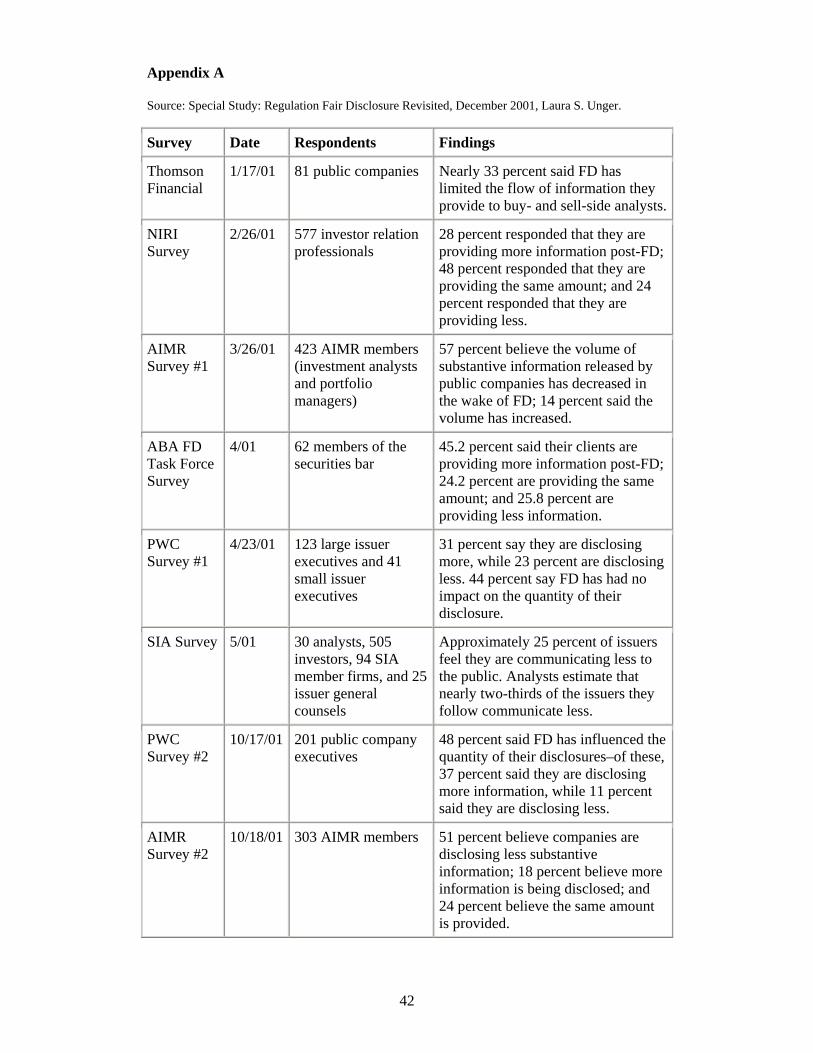
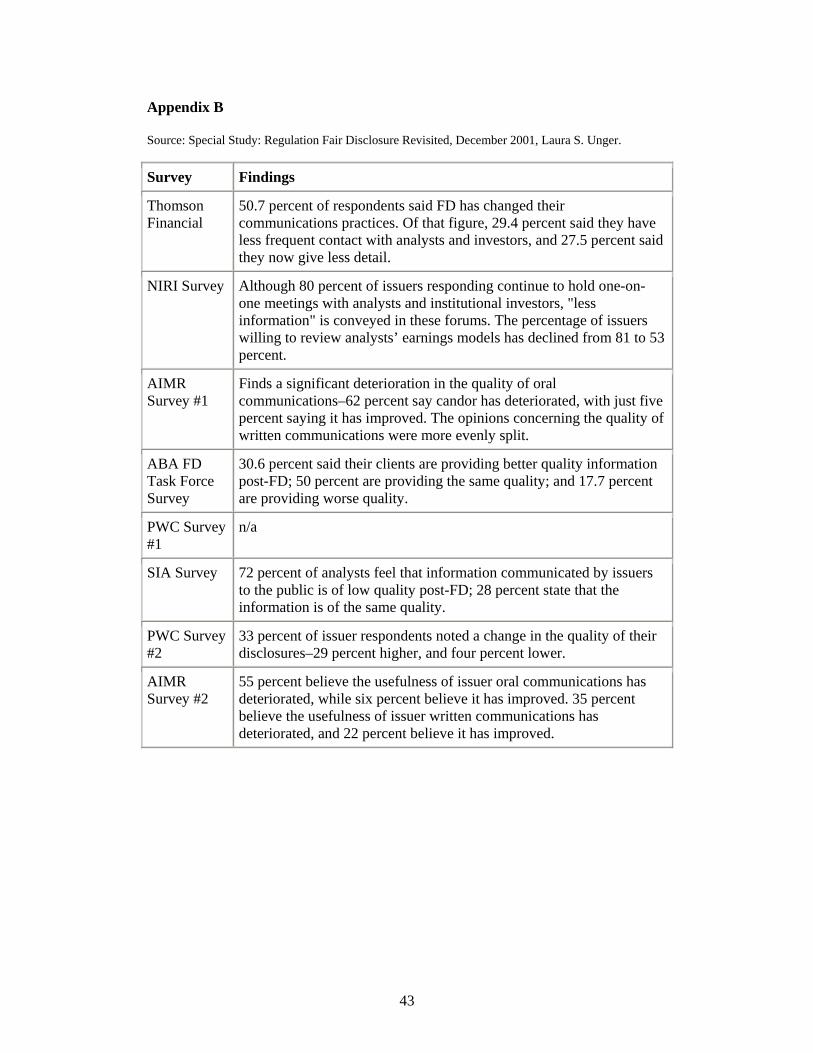
analysts post-Reg FD. Several surveys (Appendices A and B) show a decrease in the
amount of information available to analysts during the quarter after Reg FD. To assess
T0 T+10 T~+90
Earning announcement
date for quarter 0 results
Consensus analysts’ forecast based on quarter 0 results is available
At least one new forecast
for quarter 1 is
announced
Earning announcement
date for quarter 1 results

17
the impact of the change in private information available to analysts post-Reg FD, I
examine forecast revisions during the roughly 80-day period prior to the subsequent
earnings announcement. Table 4 reports the difference between the pre- and post-Reg
FD periods in forecast revisions during this period, controlling for the earnings
surprise in the subsequent quarter. EPS forecast revision is the difference between the
last forecast in the quarter and the forecast issued in the first ten days after the
previous quarter’s earnings announcements, scaled by the share price at the beginning
of the previous quarter. The EPS surprise is the actual (IBES) EPS minus actual
(IBES) EPS for the same quarter of the prior year, divided by the share price at the
beginning of the quarter.
In the pre-Reg FD period, negative (positive) earnings surprises are
accompanied by negative forecast (positive) revisions during the quarter, indicating
analysts’ ability to gather new information during the quarter which is consistent with
the actual subsequent earnings changes. In the post-Reg FD period, forecast revisions
are negative for both positive and negative surprises, indicating a lower ability to
gather information about companies’ performance during the quarter. For very
negative surprises, there are larger negative forecast revisions in the pre-Reg FD
period than in the post-Reg FD period, indicating better knowledge and information
regarding the negative surprise during the 80-day period prior to the subsequent
earnings announcement. For positive earnings surprises, the forecast revisions in the
pre-Reg FD period are in the right direction (positive); post-Reg FD, these revisions
are in the wrong direction (negative). Table 5 replicates the analysis for the revision in
next quarter analysts’ forecasts and provides similar results. Using a different
measure of earnings surprise based on analysts’ forecasts at the beginning of the
quarter generates similar results, indicating that analysts had a better ability to update

18
their forecasts during the quarter in the pre-Reg FD period. The combined evidence in
Tables 4 and 5 significantly rejects the null hypotheis corresponding to H3, showing
that analysts’ ability to revise their forecasts during the period in a manner that would
be consistent with the actual subsequent change in earnings deteriorated in the post-
Reg FD period from before.
To assess the changes in firms’ disclosure behavior in the post-Reg FD period,
I collected a sample of forward-looking voluntary disclosures provided by companies
during earnings announcements and between earnings announcements dates. For a
sample of 80 companies, during the period between 1999 and mid-2002, I examined
all press releases issued by the companies indicating present or future results. I
collected forward-looking information provided by companies in the form of
EPS/Earnings/Sales point estimates or ranges (some of the information in the press
releases, was given as percentage of changes and was transformed to point estimates
and ranges).
Table 6 reports the number of voluntary forward-looking disclosures provided
by the companies in the sample. The table shows the number of days with forward-
looking information that accompany earnings announcements, and the number of days
with forward-looking information during the quarter–between earnings
announcements. Some of the days include more than one item of forward-looking
information; for example, the company may provide new EPS estimates for both the
current quarter and the year. Panel C details the number of forward-looking
information items, separating them to annual and quarter financial results.
I examine the number of firm quarters with voluntary disclosures relative to
the total number of firm quarters in the period. I expect the percentage of firm
quarters with voluntary disclosure to be higher in the post-Reg FD period, consistent

19
with previous studies (Heflin et al., 2003). Previous studies that addressed the
question of change in voluntary disclosure did not control for the change in the
economic conditions between the pre- and the post-Reg FD periods. An economic
downturn can cause an increase in voluntary disclosures (Skinner 1994). To control
for economic changes, I examine the percentage of voluntary disclosures for different
levels of earnings surprises. An increase in the percentage of voluntary disclosures for
a given level of an earnings surprise indicates the impact of Reg FD, after controlling
for the economic conditions that caused the earnings surprise. Table 7 provides the
percentage of quarterly voluntary disclosures for four different levels of EPS
surprise. The EPS surprise is the change in EPS in the quarter relative to the
equivalent quarter in the previous year divided by that previous quarter’s price per
share. The proportion of negative surprises is higher in the post-Reg FD period
(consistent with the actual changes in economic conditions), but the percentage of
voluntary disclosures is higher for each level of EPS surprise. Panel B of Table 7
provides similar results with respect to sales surprises for the quarter. Table 8 reports
the percentage of annual voluntary disclosures for four different levels of EPS (sales)
surprises Panel A (B). The percentage of annual voluntary disclosures is higher in the
post-Reg FD period and is consistent with the quarterly findings. The combined
evidence in Tables 6-8 significantly rejects the null hypothesis corresponding to H4,
showing that companies attempted to compensate for their inability to communicate
with selected analysts and investors by issuing more public disclosures, even after
controlling for the deteriorating economic conditions after Reg FD became effective.

20
V. Summary and Conclusions
Reg FD is an important effort to curb the practice of private disclosure of
material information by management to selected analysts and investors. This
restriction of a substantial information channel can be expected to bring a shift in the
content and the importance of companies’ announcements. Financial analysts are
expected to have less private information available to them after Reg FD and to rely
more on public earnings announcements. Companies are expected to handle the
decrease in information conduits by finding alternative methods to disseminate
information. By examining the characteristics of revisions of analysts’ forecasts, I test
for an increase in the relative magnitude of new information conveyed by the
earnings announcements, as manifested by an increase (after Reg FD) in revisions
issued immediately after an earnings announcement. My results show a significant
decrease in the time until analysts revise their forecasts after earnings announcements.
I also find a significant increase in the magnitude of these revisions after earning
announcements. When controlling for the level of earnings surprise, I find analyst
revisions prior to the earnings announcement to be less consistent with the subsequent
actual change in earnings, in line with less private information available to analysts
during the quarter. I explore an increase in the occurrence of pre-announcements–
voluntary disclosures made during the reporting period. Further analysis shows a
clear increase in companies’ tendency to provide additional information and forecast
estimates, both in their earnings announcements and in their pre-announcements, in
the post-Reg FD period, consistent with the expected implications of Reg FD.

21
The combined evidence in this paper indicates that the data are consistent with
Regulation FD living up to regulators’ expectations. The change in the information
environment brought about by Regulation FD seems to have had significant real
effects in reducing selective disclosure practices and “leveling the playing field”. The
evidence on analyst forecast revisions indicates clearly that earnings announcements
have reclaimed at least some of their previous informational importance. Analysts’
behavior has changed, too, as seen in the reduced time taken to issue revisions, and
earnings announcements, and other voluntary firm disclosures have changed in
character and content. Both include much more forward-looking information post-Reg
FD, to compensate for the restrictions imposed by the rule.

22
References:
Ajinkya, B. and M. Gift. “Corporate Managers’ Earnings Forecasts and Symmetrical Adjustments of Market Expectations.” Journal of Accounting Research 22 (1984): 425-444.
Bailey W., H Li, C.X. Mao, and R. Zhong. “Regulation Fair Disclosure and Earnings
Information: Market, Analyst, and Corporate Responses”. The Journal of Finance, Volume 58 Issue 6 - December 2003
Barron, O. E., D. Byard and O. Kim, 2002, “Changes in Analysts’ information around
Earnings Announcements”. The Accounting Review, October 2002. Barron, O. E., and Pamela S. Stuerke, 1998, “Dispersion in analysts earnings forecasts
as a measure of uncertainty”, Journal of Accounting, Auditing, and Finance 18, 235-270.
Bushee, B., J. Dawn, A. Matsumoto, and G. S. Miller, 2002, “Managerial and investor
responses to disclosure regulation: The case of Reg FD and conference calls”, Working paper, University of Pennsylvania.
Coller, M. and T.L. Yohn. 1997. “Management forecasts and information asymmetry:
An examination of bid-ask spreads”. Journal of Accounting Research 35, 2 (1997).
Dontoh, A. “Voluntary Disclosure.” Journal of Accounting, Auditing & Finance; Fall
1989. Eleswarapu, V. R., R. Thompson, and K. Venkataraman, 2002, “Measuring the
fairness of Regulation Fair Disclosure through its impact on trading costs and information asymmetry”, Journal of Financial and Quantitative Analysis, forthcoming.
El-Gazzar, S. M., 1998, “Predisclosure information, firm capitalization, and security
price behavior around earnings announcements”, The Accounting Review 73, 119-129.
Feldman R., R. Lazer, and J. Livnat ,”Earnings Guidance after Regulation FD, Journal
of Investing”, Winter 2003. Foster, G. “Stock-Market Reaction to Estimates of Earnings-Per-Share by Company
Officials.” Journal of Accounting Research 11 (1973): 25-37. Gadarowski, C., and P. Sinha, 2002, “On efficacy of Regulation Fair Disclosure:
Theory and evidence”, Working paper, Cornell University. Gintschel, A., and S. Markov, 2002, “The effectiveness of Reg FD”, Working paper,
Emory University.

23
Gleason, C.A., and C.M.C. Lee. 2003. “Analyst forecast revisions and market price discovery”. The Accounting review 78, 1, (January): 193-225.
Heflin, F., K. R. Subrahmanyman, and Y. Zhang, 2003, “Regulation FD and the
financial information environment: Early evidence”, The Accounting Review 78, 1-37.
Irani, A., 2003, “The Effect of Regulation Fair Disclosure on the relevance of
conference calls to financial analysts”, Working paper, University of New Hampshire.
Irani, A., and I. Karamanou, 2002, “Regulation Fair Disclosure, analyst following,
and analyst forecast dispersion”, Accounting Horizons, forthcoming. Johnson, MF, R. Kasznik, and K.K. Nelson, “The impact of securities litigation
reform on the disclosure of forward-looking information by high technology firms” Journal of Accounting Research 39 (2) (2001): 297-327.
Kasznik, R., and B. Lev. “To Warn or Not to Warn: Management Disclosures in the
Face of an Earnings Surprise.” Accounting Review 70 (1995): 113-134. Kile, C., G. Pownall, and G. Waymire. “How Frequently Do Managers Disclose
Prospective Earnings Information?” The Journal of Financial Statement Analysis (1998).
Kim, O., and R. E. Verrecchia, 1994, “Market liquidity and volume around earnings
announcements”, Journal of Accounting and Economics 17, 41-67. Kim, O., and R. E. Verrecchia, 1997, “Pre-announcement and event period private
information”, Journal of Accounting and Economics 24, 395-419. Lev, B. and S. Penman. “Voluntary Forecast Disclosure, Nondisclosure, and Stock
Prices.” Journal of Accounting Research 28 (1990). Miller, G. S. “Earnings Performance and Discretionary Disclosure” Journal of
Accounting Research 40 (1) (2002): 173-204
Monhanram, P., and S. V. Sunder, 2001, “Has Regulation Fair Disclosure affected
financial analysts' ability to forecast earnings?” Working paper, New York University.
Securities and Exchange Commission. “Selective Disclosure and Insider Trading.”
17 CFR Parts 240, 243, and 249. Release Nos. 33-7881, 34-43154, IC-24599, File No. S7-31-99 RIN 3235-AH82
Skinner, D. “Earnings Disclosures and Stockholder Lawsuits.” Journal of Accounting
and Economics 23 (1997): 249-282.

24
Skinner, D. “Why Firms Voluntarily Disclose Bad News.” Journal of Accounting Research 32 (1994): 38-60.
Soffer, C.L., S.R. Thiagarajan and B.R. Walther. “Earnings Preannouncement
Strategies.” Review of Accounting Studies, 5 (2000): 5-26 Straser, V., 2002, “Regulation Fair Disclosure and information asymmetry”, Working
paper, University of Notre Dame. Sunder, S. V., 2002, “Investor access to conference call disclosures: Impact of
Regulation Fair Disclosure on information asymmetry”, Working paper, New York University.
Verrecchia, R.E., “Discretionary Ddisclosure and Information Quality.” Journal of
Accounting and Economics 12 (1990): 179-194. Zitzewitz, E., 2002, “Regulation Fair Disclosure and the private information of
analysts”, Working paper, Stanford University.

25
Table 1 – Number of Days to Revise This Year’s Annual EPS Forecast After Earnings Announcements Panel A – By QTR Post FD Pre FD Significance
Period
No. of Days Until
Revision No. of Obs.
No. of Days Until
Revision No. of Obs. Difference t-test Wilcoxon
Third Qtr Results 8.0 22560 11.0 19669 -3.0 <0.0001 <0.0001
Second Qtr Results 6.1 23374 11.0 23930 -5.0 <0.0001 <0.0001
First Qtr Results 7.7 25467 12.3 25053 -4.6 <0.0001 <0.0001
Previous Annual Results 10.0 21028 15.6 19274 -5.5 <0.0001 <0.0001
Total 7.9 92429 12.4 87926 -4.5 <0.0001 <0.0001 Panel B – By Size of Absolute Median Forecast Error Post FD Pre FD Significance
Absolute Value of Median FE
No. of Days Until
Revision No. of Obs.
No. of Days Until
Revision No. of Obs. Difference t-test Wilcoxon
1 – Low 8.4 19468 12.5 19317 -4.1 <0.0001 <0.0001
2 7.4 20262 11.0 18513 -3.6 <0.0001 <0.0001
3 6.7 21070 11.1 17720 -4.3 <0.0001 <0.0001
4 – High 7.1 21162 11.6 17621 -4.5 <0.0001 <0.0001
Total 7.4 81962 11.6 73171 -4.2 <0.0001 <0.0001 No. of Days Until Revision – the number of days from the earnings announcement and the first revision of the annual EPS forecast. Median Forecast Error – the difference between the actual quarterly EPS and the median analyst forecast prior to the earnings announcement, divided by the beginning of the quarter share price

26
Table 1 (Continued) – Number of Days to Revise This Year’s Annual EPS Forecast After Earnings Announcements Panel C – By Size of Absolute Specific Forecast Error Post FD Pre FD Significance
Absolute Value of Specific FE
No. of Days Until Revision
No. of Obs.
No. of Days Until Revision
No. of Obs. Difference t-test Wilcoxon
1 – Low 8.8 15465 12.0 14187 -3.2 <0.0001 <0.0001
2 6.7 16409 9.6 13245 -2.9 <0.0001 <0.0001
3 6.2 16596 9.6 13058 -3.4 <0.0001 <0.0001
4 – High 6.7 16958 10.5 12695 -3.9 <0.0001 <0.0001
Total 7.1 65428 10.5 53185 -3.4 <0.0001 <0.0001 No. of Days Until Revision – the number of days from the earnings announcement until the first revision of the annual EPS forecast Specific Forecast Error – the difference between the actual quarterly EPS and the latest specific analyst forecast prior to the earnings announcement, divided by the beginning
of the quarter share price

27
Table 2 – Current Year EPS Forecast Revision After Earnings Announcements Panel A – By Size of Absolute Median Forecast Error Post FD Pre FD Significance
Absolute Value of Median FE
EPS Forecast Revision No. of Obs.
EPS Forecast Revision No. of Obs. Difference t-test Wilcoxon
1 – Low 0.0081 19468 0.0056 19317 0.0026 0.0007 <0.0001
2 0.0039 20262 0.0035 18513 0.0004 <0.0001 <0.0001
3 0.0065 21070 0.0064 17720 0.0002 0.1591 <0.0001
4 – High 0.0322 21162 0.0310 17621 0.0012 0.5756 <0.0001
Total 0.0129 81962 0.0114 73171 0.0015 0.0084 <0.0001 EPS forecast revision – the difference between the first forecast following an earnings announcement and the last forecast prior to that earnings announcement, divided by
the beginning of the quarter share price Median Forecast Error – the difference between the actual quarterly EPS and the median analyst forecast prior to the earnings announcement, divided by the beginning of the
quarter share price

28
Table 2 (Continued) – Current Year EPS Forecast Revision After Earnings Announcements Panel B – By Size of Absolute Specific Forecast Error Post FD Pre FD Significance
Absolute Value of Specific FE
EPS Forecast Revision No. of Obs.
EPS Forecast Revision No. of Obs. Difference t-test Wilcoxon
1 – Low 0.0069 15465 0.0047 14187 0.0022 0.0013 <0.0001
2 0.0036 16409 0.0032 13245 0.0005 <0.0001 <0.0001
3 0.0062 16596 0.0058 13058 0.0003 0.0061 <0.0001
4 – High 0.0331 16958 0.0262 12695 0.0069 0.0006 <0.0001
Total 0.0127 65428 0.0097 53185 0.0030 <0.0001 <0.0001 EPS forecast revision – the difference between the first EPS forecast following an earnings announcement and the last forecast prior to that earnings announcement, divided
by the beginning of the quarter share price Specific Forecast Error – the difference between the actual quarterly EPS and the latest specific analyst forecast prior to the earnings announcement, divided by the beginning
of the quarter share price

29
Table 3 – Forecast Revision Regression Estimation Panel A – Revisions of Quarterly Earnings Forecasts Using Forecast Error from Last Forecast
ABS_Revt,i = a0 + a1 * ABS_FEt,i + a2 * ABS_Revt-1,i + a3 * Posti * ABS_FEt,i
+ a4 * Posti * ABS_Revt-1,i + ei
Variable Expected Sign Absolute value
of revision Absolute value
of revision Intercept ? 0.0015 0.0015 (0.0000) (0.0000)
ABS_FEt,i + 0.3757 0.3658 (0.0000) (0.0000)
ABS_Revt-1,i + 0.2902 0.3052 (0.0000) (0.0000)
Post * ABS_FEt,i + 0.0243 0.0412 (0.0459) (0.0001)
Post * ABS_Revt-1,i + 0.0268 (0.0067) Adjusted R2 0.24 0.24 N 34009 34009
ABS_Rev – The absolute value of the revision of quarterly analyst forecasts around the earnings announcement divided by the share price at the beginning of the quarter
ABS_FE – The absolute value of the difference between the actual quarterly EPS and the latest analyst forecasts divided by the share price at the beginning of the quarter
Post – A dummy variable indicating the period (1 for Post-Reg FD and 0 for Pre-Reg FD)

30
Table 3 (Continued) – Forecast Revision Regression Estimation Panel B – Revisions of Quarterly Earnings Forecasts Using Analysts' Specific Forecast Errors
ABS_Revt,i = a0 + a1 * ABS_FEt,i + a2 * ABS_Revt-1,i + a3 * Posti * ABS_FEt,i
+ a4 * Posti * ABS_Revt-1,i + ei
Variable Expected Sign
Absolute value of revision
Absolute value of revision
Intercept ? 0.0014 0.0014 (0.0000) (0.0000)
ABS_FEt,i + 0.4396 0.4212 (0.0000) (0.0000)
ABS_Revt-1,i + 0.2608 0.2877 (0.0000) (0.0000)
Post * ABS_FEt,i + 0.0083 0.0391 (0.5183) (0.0004)
Post * ABS_Revt-1,i + 0.0475 (0.0000) Adjusted R2 0.26 0.26 N 30640 30640
ABS_Rev – The absolute value of the revision of quarterly analyst forecasts around the earnings announcement divided by the share price at the beginning of the quarter
ABS_FE – The absolute value of the difference between the actual quarterly EPS and the latest specific analyst forecast divided by the share price at the beginning of the quarter
Post – A dummy variable indicating the period (1 for Post-Reg FD and 0 for Pre-Reg FD)

31
Table 3 (Continued) – Forecast Revision Regression Estimation Panel C – Revisions of Annual Earnings Forecasted Using Analysts’ Median Forecast Errors
ABS_Revt,i = a0 + a1 * ABS_FEt,i + a2 * ABS_Revt-1,i + a3 * Posti * ABS_FEt,i
+ a4 * Posti * ABS_Revt-1,i + ei
Variable Expected Sign Absolute value
of revision Absolute value
of revision Intercept ? 0.0017 0.0017 0.0014 0.0012
ABS_FEt,i + 1.2331 1.1843 0.0000 0.0000
ABS_Revt-1,i + 0.9033 1.1049 0.0000 0.0000
Post * ABS_FEt,i + 0.3641 0.4504 0.0001 0.0000
Post * ABS_Revt-1,i + 0.3650 0.0162 Adjusted R2 0.03 0.03 N 48696 48696
ABS_Rev – The absolute value of the revisions of analyst forecasts around the earnings announcement divided by the share price at the beginning of the quarter ABS_FE – The absolute value of the difference between actual EPS and median analyst forecasts divided by the share price at the beginning of the quarter
Post – A dummy variable indicating the period (1 for Post-Reg FD and 0 for Pre-Reg FD)

32
Table 3 (Continued) – Forecast Revision Regression Estimation Panel D – Revisions of Annual Earnings Forecasts Using Analysts' Specific Forecast Errors
ABS_Revt,i = a0 + a1 * ABS_FEt,i + a2 * ABS_Revt-1,i + a3 * Posti * ABS_FEt,i
+ a4 * Posti * ABS_Revt-1,i + ei
Variable Expected Sign Absolute value
of revision Absolute value
of revision Intercept ? 0.0017 0.0017 (0.0036) (0.0037)
ABS_FEt,i + 1.1182 1.1260 (0.0000) (0.0000)
ABS_Revt-1,i + 0.7473 0.7141 (0.0000) (0.0000)
Post * ABS_FEt,i + 0.8971 0.8841 (0.0000) (0.0000)
Post * ABS_Revt-1,i + -0.0604 (0.7146) Adjusted R2 0.04 0.04 N 42872 42872
ABS_Rev – The absolute value of the revision of analyst forecasts around the earnings announcement divided by the share price at the beginning of the quarter
ABS_FE – The absolute value of the difference between the actual quarterly EPS and latest specific analyst forecasts divided by the share price at the beginning of the quarter
Post – A dummy variable indicating the period (1 for Post-Reg FD and 0 for Pre-Reg FD)

33
Table 4 – Revision in Current Quarter Analyst Forecasts During the "Low Information Period" Post FD Pre FD Significance
EPS Surprise
EPS Forecast Revision N
EPS Forecast Revision N
Expected Sign of
DifferenceDifference (Post-Pre) t-test Wilcoxon
1 – Negative -0.0072 6053 -0.0099 2721 + 0.0027 <0.0001 <0.0001
2 -0.0033 5784 -0.0038 2984 + 0.0005 0.0001 <0.0001
3 -0.0019 5731 -0.0018 3054 ? -0.0001 0.0940 0.0001
4 -0.0009 4467 -0.0005 4307 ? -0.0004 <0.0001 <0.0001
5 -0.0008 5250 -0.0005 3522 - -0.0004 <0.0001 <0.0001
6 – Positive -0.0003 5798 0.0008 2977 - -0.0010 0.0712 <0.0001
Total -0.0025 33083 -0.0023 19565
Low Information Period – the period starting 10 days after the issuance of the earnings announcement and ending right before the following quarter’s earnings announcement (approximately 80 days).
EPS Surprise – the actual EPS random walk divided by the share price at the beginning of the quarter
EPS Forecast Revision – the difference between the latest analyst forecast for the current quarter and the analysts’ consensus from 10 days after the previous quarter’s earnings announcement, divided by the share price at the beginning of the quarter
N – the number of analyst forecast revisions
Significance – the significance level obtained in a t-test and two-sided Wilcoxon test that the difference is zero.

34
Table 5 – Revision in Next Quarter’s Analyst Forecasts During the "Low Information Period" Post FD Pre FD Significance
EPS surprise EPS forecast
revision N EPS forecast
revision N Expected Sign of
Difference Difference (Post-Pre) t-test Wilcoxon
1 – Negative -0.0110 8059 -0.0127 4233 + 0.0017 0.0001 <0.0001
2 -0.0035 7584 -0.0045 4698 + 0.0010 <0.0001 <0.0001
3 -0.0018 7362 -0.0020 4937 ? 0.0002 0.0083 0.0069
4 -0.0009 5709 -0.0005 6577 ? -0.0004 <0.0001 <0.0001
5 -0.0003 6758 -0.0003 5523 - 0.0000 0.4473 0.2127
6 – Positive -0.0031 43053 -0.0028 30682 - -0.0003 0.2808 <0.0001
Total -0.0025 33083 -0.0023 19565
Low Information Period – the period starting 10 days after the issuance of the earnings announcement and ending right before the following quarter’s earnings announcement (approximately 80 days). EPS Surprise – the actual EPS random walk divided by the share price at the beginning of the quarter EPS Forecast Revision – the difference between the latest analyst forecast for the next quarter and the analysts’ consensus from 10 days after the previous quarter’s earnings announcement, divided by the share price at the beginning of the quarter N – the number of analyst forecast revisions
Significance – the significance level obtained in a t-test and two-sided Wilcoxon test that the difference is zero.

35
Table 6 – Voluntary Disclosure Sample Panel A – Number of Firms with at Least One Voluntary Disclosure Pre-Regulation FD 15 Post-Regulation FD 72 Panel B – Number of Days with Voluntary Disclosure Period
Pre-FD Post-FD
Earnings Announcement Days 10 169
Other 37 195
Total 47 364 Panel C – Number of Voluntary Disclosure Items
Pre-FD
Annual Quarter Total
Earnings announcement days 51 49 100
Other 15 38 53
Total 66 87 153
Post-FD
Annual Quarter Total
Earnings announcement days 173 191 364
Other 164 179 343
Total 337 370 707

36
Table 7 – Frequency of Quarterly Voluntary Disclosure in Post- vs. Pre-Reg FD Periods Panel A – Control by Random Walk of EPS Surprise
Post-FD Pre-FD
EPS Surprise
Firm quarters with no voluntary disclosure
Firm quarters with voluntary disclosure
Total number of firm quarters
Percentage of firm quarters with voluntary disclosure
Firm quarters with no voluntary disclosure
Firm quarters with voluntary disclosure
Total number of firm quarters
Percentage of firm quarters with voluntary disclosure
Total number of firm quarters
Difference in percentage of voluntary disclosure
1 – Positive surprise 130 35 165 21.2% 106 7 113 6.2% 278 15.0%
2 77 17 94 18.1% 170 14 184 7.6% 278 10.5%
3 59 33 92 35.9% 181 6 187 3.2% 279 32.7%
4 – Negative surprise 141 66 207 31.9% 70 1 71 1.4% 278 30.5%
Total 407 151 558 27.1% 527 28 555 5.0% 1113 22.0% Notes: EPS surprise is the change in EPS in the quarter relative to the equivalent quarter in the previous year divided by that previous quarter’s price per shareTo be considered a "Firm quarter with voluntary disclosure," at least one disclosure is required The sample period is January 1999 to June 2002 Voluntary disclosure includes any forward-looking disclosure outside of an earnings announcement

37
Table 7 (continued – Frequency of Quarterly Voluntary Disclosure in Post- vs. Pre-Reg FD Periods Panel B – Control by Random Walk of Sales Surprise
Post-FD Pre-FD
Sales Surprise
Firm quarters with no voluntary disclosure
Firm quarters with voluntary disclosure
Total number of firms’' quarters
Percentage of firm quarters with voluntary disclosure
Firm quarters with no voluntary disclosure
Firm quarters with voluntary disclosure
Total number of firm quarters
Percentage of firm quarters with voluntary disclosure
Total number of firm quarters
Difference in percentage of voluntary disclosure
1 – Positive surprise 66 18 84 21.4% 155 5 160 3.1% 244 18.3%
2 90 22 112 19.6% 123 9 132 6.8% 244 12.8%
3 102 44 146 30.1% 92 4 96 4.2% 242 26.0%
4 – Negative surprise 120 62 182 34.1% 61 1 62 1.6% 244 32.5%
Total 378 146 524 27.9% 431 19 450 4.2% 974 23.6% Notes: Sales surprise is the change in sales in the quarter relative to the equivalent quarter in the previous year divided by that previous quarter’s sales To be considered a "Firm quarter with voluntary disclosure," at least one disclosure is required The sample period is January 1999 to June 2002 Voluntary disclosure includes any forward-looking disclosure outside of an earnings announcement

38
Table 8 – Frequency of Annual Voluntary Disclosure in Post- vs. Pre-Reg FD Periods Panel A – Control by Random Walk of EPS Surprise
Post-FD Pre-FD
EPS Surprise
Firm years with no voluntary disclosure
Firm years with voluntary disclosure
Total number of firm years
Percentage of firm years with voluntary disclosure
Firm years with no voluntary disclosure
Firm years with voluntary disclosure
Total number of firm years
Percentage of firm years with voluntary disclosure
Total number of firm years
Difference in percentage of voluntary disclosure
1 – Positive surprise 20 26 46 56.5% 25 8 33 24.2% 79 32.3%
2 9 20 29 69.0% 47 1 48 2.1% 77 66.9%
3 8 37 45 82.2% 30 2 32 6.3% 77 76.0%
4 – Negative surprise 29 38 67 56.7% 10 1 11 9.1% 78 47.6%
Total 66 121 187 64.7% 112 12 124 9.7% 311 55.0% Notes: EPS surprise is the change in the actual annual EPS relative to the previous year divided by the share price at the end of the previous year To be considered a "Firm year with voluntary disclosure," at least one disclosure is required The sample period is January 1999 to June 2002 Voluntary disclosure includes any forward-looking disclosure outside of an earnings announcement

39
Table 8 (continued) – Frequency of Annual Voluntary Disclosure in Post- vs. Pre-Reg FD Periods Panel B – Control by Sales Surprise
Post-FD Pre-FD
Sales Surprise
Firm years with no voluntary disclosure
Firm years with voluntary disclosure
Total number of firm years
Percentage of firm years with voluntary disclosure
Firm years with no voluntary disclosure
Firm years with voluntary disclosure
Total number of firm years
Percentage of firm years with voluntary disclosure
Total number of firm years
Difference in percentage of voluntary disclosure
1 – Positive surprise 10 14 24 58.3% 38 6 44 13.6% 68 44.7%
2 11 31 42 73.8% 23 2 25 8.0% 67 65.8%
3 12 35 47 74.5% 18 2 20 10.0% 67 64.5%
4 – Negative surprise 14 43 57 75.4% 8 1 9 11.1% 66 64.3%
Total 47 123 170 72.4% 87 11 98 11.2% 268 61.1% Notes: Sales surprise is the change in annual sales relative to the previous year divided by the previous year’s sales To be considered a "Firm year with voluntary disclosure," at least one disclosure is required The sample period is January 1999 to June 2002 Voluntary disclosure includes any forward-looking disclosure outside of an earnings announcement

40
Figure 1
Revisions in Quarterly Forecasts After a Quarterly Earnings Announcement
0%5%
10%15%20%25%30%35%40%45%
0 1 2 3 4 5 6 7-59
Days
% o
f Rev
isio
ns
Post Pre

41
Figures 2 & 3
Revisions in Annual Forecasts After a Quarterly Earnings Announcement
0%5%
10%15%20%25%30%35%40%45%
0 1 2 3 4 5 6 7-59
Days
% o
f Rev
isio
ns
PostPre
Revisions in Annual Forecasts After an Annual Earnings Announcement
0%
10%
20%
30%
40%
50%
60%
0 1 2 3 4 5 6 7-59
Days
% o
f Rev
isio
ns
PostPre
42
Appendix A
Source: Special Study: Regulation Fair Disclosure Revisited, December 2001, Laura S. Unger.
Survey Date Respondents Findings
Thomson Financial
1/17/01 81 public companies Nearly 33 percent said FD has limited the flow of information they provide to buy- and sell-side analysts.
NIRI Survey
2/26/01 577 investor relation professionals
28 percent responded that they are providing more information post-FD; 48 percent responded that they are providing the same amount; and 24 percent responded that they are providing less.
AIMR Survey #1
3/26/01 423 AIMR members (investment analysts and portfolio managers)
57 percent believe the volume of substantive information released by public companies has decreased in the wake of FD; 14 percent said the volume has increased.
ABA FD Task Force Survey
4/01 62 members of the securities bar
45.2 percent said their clients are providing more information post-FD; 24.2 percent are providing the same amount; and 25.8 percent are providing less information.
PWC Survey #1
4/23/01 123 large issuer executives and 41 small issuer executives
31 percent say they are disclosing more, while 23 percent are disclosing less. 44 percent say FD has had no impact on the quantity of their disclosure.
SIA Survey 5/01 30 analysts, 505 investors, 94 SIA member firms, and 25 issuer general counsels
Approximately 25 percent of issuers feel they are communicating less to the public. Analysts estimate that nearly two-thirds of the issuers they follow communicate less.
PWC Survey #2
10/17/01 201 public company executives
48 percent said FD has influenced the quantity of their disclosures–of these, 37 percent said they are disclosing more information, while 11 percent said they are disclosing less.
AIMR Survey #2
10/18/01 303 AIMR members 51 percent believe companies are disclosing less substantive information; 18 percent believe more information is being disclosed; and 24 percent believe the same amount is provided.
43
Appendix B
Source: Special Study: Regulation Fair Disclosure Revisited, December 2001, Laura S. Unger.
Survey Findings
Thomson Financial
50.7 percent of respondents said FD has changed their communications practices. Of that figure, 29.4 percent said they have less frequent contact with analysts and investors, and 27.5 percent said they now give less detail.
NIRI Survey Although 80 percent of issuers responding continue to hold one-on-one meetings with analysts and institutional investors, "less information" is conveyed in these forums. The percentage of issuers willing to review analysts’ earnings models has declined from 81 to 53 percent.
AIMR Survey #1
Finds a significant deterioration in the quality of oral communications–62 percent say candor has deteriorated, with just five percent saying it has improved. The opinions concerning the quality of written communications were more evenly split.
ABA FD Task Force Survey
30.6 percent said their clients are providing better quality information post-FD; 50 percent are providing the same quality; and 17.7 percent are providing worse quality.
PWC Survey #1
n/a
SIA Survey 72 percent of analysts feel that information communicated by issuers to the public is of low quality post-FD; 28 percent state that the information is of the same quality.
PWC Survey #2
33 percent of issuer respondents noted a change in the quality of their disclosures–29 percent higher, and four percent lower.
AIMR Survey #2
55 percent believe the usefulness of issuer oral communications has deteriorated, while six percent believe it has improved. 35 percent believe the usefulness of issuer written communications has deteriorated, and 22 percent believe it has improved.

44
Appendix C
Examples of differences in earnings guidance practices
Example 1:
On Oct. 17, 2000, Intel Corp. (“Intel”) announced record results for the third
quarter of 2000 and revised its outlook publication procedures in connection with the
adoption of Regulation FD. Intel said it would keep its Outlook forward-looking
statements and risk factors statements publicly available on its web site. Toward the
end of each fiscal quarter, it would have a “Quiet Period” when it would not update
Outlook, but before the start of the Quiet Period, the public could continue to rely on
the Outlook as reflecting Intel's most current expectations. The Quiet Period extends
to the day when Intel's next quarterly earnings release is published. Six months later,
on April 17, 2001, Intel announced: “Beginning this quarter (second quarter, 2001)
Intel will have a mid-quarter Business Update to the Outlook provided…”. Currently,
during Intel’s earnings quarterly press releases, Intel also announces the date for its
mid-quarter update. On July 17, 2001, Intel announced the results for the second
quarter of 2001 and its business outlook for the third quarter of 2001: “Revenue in
the third quarter of 2001 is expected to be between $6.2 billion and $6.8 billion.” In
addition, Intel announced that it planned “to provide a mid-quarter Business Update
to the Outlook provided below on Sept. 6”. On Sept. 6, 2001, Intel announced the
mid-quarter update, stating that it “expect[ed] revenue for the third quarter to be
within the previous expectation and slightly below the midpoint of the range provided
on July 17.” The release included updates regarding other expenses and capital
expenditures. Thus, Intel provides systematic forecasts with the earnings release, and
an update between earnings releases with a known date for the update.

45
Example 2:
On Oct. 29, 2001, FedEx Corp. (“FedEx”) updated its earnings outlook for
the second quarter, ending Nov. 30, 2001. In its press release, FedEx announced it
“expect[ed] to earn 40 cents to 45 cents a share excluding its slice of the aid package
and 61 cents to 66 cents a share including the $101 million in government
assistance.” On Dec. 19, 2001, FedEx reported the results for the second quarter
(ending Nov. 30, 2001). Earnings per share (not including the compensation from the
Air Transportation Safety and System Stabilization Act) were 57 cents per share. In its
press release, FedEx also included earnings forecasts for the third and fourth
quarters: “[W]e now expect earnings for the third quarter to be $0.25 to $0.35 per
diluted share, and earnings for the fourth quarter to be $0.70 to $0.80 per diluted
share”. The first announcement, on October 29, 2001, occurred between earnings
announcements and was intended to provide investors with a profit warning. The
second guidance coincided with the earnings announcement. Investors could not have
anticipated when the first announcement would be made, if at all.