the influence of brand extension toward purchase intention
TRANSCRIPT

The Influence of Brand Extension toward Purchase
Intention for Beauty Products
(“A Study Case of Pond’s in Jakarta”)
By
Grace Yulia Christina
ID No. 014201300213
A Skripsi presented to the
Faculty of Business President University
in partial fulfillment of the requirements for
Bachelor Degree in Management
December 2016

i

ii

iii

iv
ABSTRACT
The objective of this research is to analyze the influence of brand extension
toward purchase intention for Pond’s beauty products. Quantitative approach is
used in this research. Quantitative approach includes validity and reliability test,
weighted mean, the classic assumption test and multiple regression analysis to test
the hypothesis through T-test, F-test and coefficient of determination (R²). The
research is focused on consumer of Pond’s in Jakarta who currently using or ever
used Pond’s face wash and never use Pond’s beauty products. In this research,
data were collected through questionnaire to 125 respondents and additional 30
respondents for the pre-test using purposive sampling method. The result of the
analysis found that from the four dimensions of brand extension, perceived risk,
consumer perception fit, and consumer innovativeness has partial significant
influence toward purchase intention, but reputation has no partial significant
influence toward purchase intention. Then, through the F test, it can be concluded
that there is simultaneous significant influence of perceived risk, consumer
perception fit, reputation and consumer innovativeness toward purchase intention.
Keywords: Perceived Risk, Consumer Perception Fit, Reputation, Consumer
Innovativeness, Purchase Intention.

v
ACKNOWLEDGEMENT
The first and foremost, i would like to thank the Lord and Savior, Jesus Christ,
because of His love, i can finish this thesis on time. After three years of learning
at President University, now I've completed my undergraduate thesis and then
ready to graduate from President University. Time goes so fast. Through this
opportunity, i would like to express my sincere thanks to:
1. My parents, mommy and daddy for the support that never stops and i
couldn’t find any words than thank you so much for both of you. I’m so
glad to have both parents and best friends like you. Thank you so much for
everything.
2. My brother, thank you for your love and support during my thesis period.
3. My big families, thank you for always strengthen and convince me that i
can do it.
4. My thesis advisers, Mrs. Etty Susilowati and Mr. Purwanto. Thank you for
your guidance, patience, and kindness to help me to finish my thesis and
thanks for being my thesis advisor.
5. All respondents in Jakarta, thanks a lot for spending your time to fill the
questionnaire.
6. Mr. Orlando Santos, thank you so much for helping me to analyze the
result of my calculation. Thanks for your time and kindness.
7. Thank you for Della Effendie, Valien Purnama, Yenny Rahmawati, Bobby
Eka Putra, Rendy Dwi Halim, and Andre Herwin for always be there for
me and struggling with me for the past three years together in President
University. Thanks for always being my best friend in my ups and downs.
8. Thank you for Natalia Setiawan for being my two years roommate,
Tiffany Valerina for being my friends since the first day in PU.
9. My matriculation friends Wijaya and Tara Lorenzia
10. Thank you for IB, Accounting, IE, BA, IR, Marketing, and BF friends that
i can’t mentioned one by one. Thanks to fill my days for three years in PU.

vi
TABLE OF CONTENTS
PANEL OF EXAMINERS APPROVAL SHEET ........................................... i
THESIS ADVISER RECOMMENDATION LETTER .................................. ii
DECLARATION OF ORIGINALITY ............................................................ iii
ABSTRACT ..................................................................................................... iv
ACKNOWLEDGEMENT ............................................................................... v
TABLE OF CONTENTS ................................................................................. vi
LIST OF TABLES ........................................................................................... ix
LIST OF FIGURES ......................................................................................... x
CHAPTER I INTRODUCTION
1.1 Background .......................................................................................... 1
1.1.1 Topic of the Study ....................................................................... 1
1.1.2 Need of the Study ........................................................................ 5
1.1.3 Problem Identification ................................................................. 5
1.1.4 Research Questions ..................................................................... 6
1.1.5 Research Objectives .................................................................... 6
1.2 Significance of Study ........................................................................... 7
1.3 Scope and Limitations .......................................................................... 7
1.4 Organization of the Thesis ................................................................... 8
CHAPTER II LITERATURE REVIEW
2.1 Introduction ................................................................................................ 9
2.2 Dependent Variable .................................................................................... 9
2.2.1 Purchase Intention ....................................................................... 9
2.3 Independent Variable ................................................................................. 9
2.3.1 Brand Extension .......................................................................... 9
2.3.2 Perceived Risk ............................................................................. 10
2.3.3 Consumer Perception Fit ............................................................. 10
2.3.4 Reputation ................................................................................... 11

vii
2.3.5 Consumer Innovativeness ........................................................... 11
2.4 Research Gap ............................................................................................. 11
CHAPTER III METHODS
3.1 Introduction ................................................................................................ 13
3.2 Theoretical Framework .............................................................................. 13
3.3 Hypothesis .................................................................................................. 14
3.4 Operational Definitions of Variables ......................................................... 15
3.5 Instrument .................................................................................................. 16
3.5.1 Primary Data ............................................................................... 17
3.5.2 Secondary Data ........................................................................... 18
3.5.3 Questionnaire .............................................................................. 18
3.6 Sampling .................................................................................................... 21
3.6.1 Population ................................................................................... 22
3.6.2 Data Collection Method .............................................................. 22
3.6.3 Data Analysis .............................................................................. 23
3.6.4 Instrument Test............................................................................ 23
3.6.4.1Validity Test .................................................................. 23
3.6.4.2Reliability Test .............................................................. 25
3.6.5 Classical Assumption Testing ................................................................. 26
3.6.5.1Normality Test .......................................................................... 23
3.6.5.1Multicollinearity Test ................................................................ 23
3.6.5.1Heteroscedastcity Test .............................................................. 23
3.6.6 Testing of Hypothesis ............................................................................. 26
3.6.6.1T-Test ........................................................................................ 23
3.6.6.2F-Test ........................................................................................ 23
3.6.6.3Coefficient of Correlation and Determination .......................... 23
CHAPTER IV RESULT AND DISCUSSION
4.1 Descriptive Analysis .................................................................................. 28
4.1.1 Data Analysis .............................................................................. 28
4.1.2 Validity Test ................................................................................ 28
4.1.3 Reliability Test ............................................................................ 30

viii
4.1.4 Demographic Profile ................................................................... 32
4.2 Inferential Analysis .................................................................................... 40
4.2.1 Descriptive Analysis ................................................................... 40
4.2.2 Classical Assumption Testing ..................................................... 40
4.2.2.1 Normality Test ............................................................. 40
4.2.2.2 Multicollinearity Test ................................................... 42
4.2.2.3 Heteroscedastcity Test ................................................. 43
4.2.3 Testing of Hypothesis ................................................................. 43
4.2.3.1 T-Test ........................................................................... 43
4.2.3.2 F-test ............................................................................. 46
4.2.3.3Coefficient Correlation and Determination ................... 47
4.3 Interpretation of Results ............................................................................. 47
CHAPTER V CONCLUSION AND RECOMMENDATION
5.1 Hypothesis Answer .................................................................................... 51
5.2 Future Recommendation ............................................................................ 51
REFFERENCES .............................................................................................. 53
APPENDIX 1 – R-Table .................................................................................. 56
APPENDIX 2–T-Table .................................................................................... 58
APPENDIX 3 – F-Table .................................................................................. 61
APPENDIX 4 – Questionnaire ........................................................................ 63
APPENDIX 5 – Raw Data ............................................................................... 71

ix
LIST OF TABLES
Table 1.1: Percentage of Pond’s in Top Brand Award .................................... 3
Table 1.2: Percentage of Wardah in Top Brand Award ................................... 4
Table 1.3: Percentage of Garnier in Top Brand Award ................................... 4
Table 3.1: Interpretation of Correlation Scale.................................................. 24
Table 3.2: Cronbach’s Alpha Scale Interpretation ........................................... 25
Table 4.1: Validity Test.................................................................................... 29
Table 4.2: Cronbach’s Alpha of Perceived Risk .............................................. 30
Table 4.3: Cronbach’s Alpha of Consumer Perception Fit .............................. 30
Table 4.4: Cronbach’s Alpha of Reputation .................................................... 31
Table 4.5: Cronbach’s Alpha of Consumer Innovativeness ............................. 31
Table 4.6: Cronbach’s Alpha of Purchase Intention ........................................ 32
Table 4.7: Gender ............................................................................................. 33
Table 4.8: Age .................................................................................................. 34
Table 4.9: Education ........................................................................................ 35
Table 4.10: Occupation .................................................................................... 36
Table 4.11: Domicile ........................................................................................ 38
Table 4.12: Monthly Income ............................................................................ 39
Table 4.13: Descriptive Statistics ..................................................................... 40
Table 4.14: Multicollinearity Test: Coefficient ............................................... 42
Table 4.15:T-Test: Coefficient ......................................................................... 44
Table 4.16: F-Test: ANOVA............................................................................ 46
Table 4.17: Multiple Regression Analysis: Coefficient ................................... 47

x
LIST OF FIGURE
Figure 3.1: Theoretical Framework.................................................................. 13
Figure 3.2: Data Collection Method................................................................. 17
Figure 3.3: Validity Test Formula .................................................................... 24
Figure 4.1: Gender ........................................................................................... 32
Figure 4.2: Age ................................................................................................ 33
Figure 4.3: Education ....................................................................................... 35
Figure 4.4: Occupation ..................................................................................... 36
Figure 4.5: Domicile ........................................................................................ 37
Figure 4.6: Monthly Income ............................................................................ 39
Figure 4.7: Normality Test: Histogram ............................................................ 41
Figure 4.8: Normality Test: P-Plot ................................................................... 41
Figure 4.9: Heteroscedastcity Test: Scatterplot Graph .................................... 43
1
CHAPTER I
INTRODUCTION
1.1 Background
1.1.1 Topic of the Study
In globalization era, the business industry looks more advanced, it was due to the
influx of global effects that give a major influence on business development in the
world, Proven by increasing number of product types and brands that appear on
the market. All businesses in this era utilize advances in technology because
technology can simplify business processes that run as improve product quality,
create new innovations, or release new product. It is useful to meet consumer
needs and desires those are very dynamic and encourage consumers purchase
intention for product or service, but it can also be pushing a stricter level of
competition between companies. Many companies strive to be able to continue to
survive and trying to attract consumer and beat its competitors in many ways.
Companies should create something that might not be owned by other competitors
which is brand. Brand is a unique design, sign, symbol, words, or a combination
of these, employed in creating an image that identifies a product and differentiates
it from competitors. Brands can explain information to consumers such as the
quality of products or services.
According to Franchiseglobal (2015), growing business in Indonesia is beauty and
skincare businesses. Big companies in Indonesia are competing to create products
with brand that can be recognized easily and based on Euromonitor International’s
surveyin 2015, the value of Indonesia’s cosmetics export reached approximately
11 trillion rupiah. Euromonitor stated that developing countries contribute 51%
for global beauty industry, including Indonesia which has dynamic market in
Southeast Asia and in 2019 Indonesia estimated will be the major growth markets
for beauty industry. Companies compete to increase its sales, making its brand
popular for its consumers, and enhance purchase intention. Many strategies can be
done to achieve those goals, for example by doing brand extension. This strategy
also implemented by PT. Unilever Indonesia Tbk.

2
The brand extension strategy which is done by PT. Unilever Indonesia Tbk is a
strategy to introduce new product in different product category by using parent
brand that has first entered the market to boost sales by using parent brand
popularity. This strategy can be used to assist product marketing so that
consumers don’t feel unfamiliar with the new products appeared in the market.
Brand extension’s advantage is reducingmarketing cost, because capitalizing
brand strength that’s currently owned and require short time than building a new
brand.
In brand extension strategy, there are some factors that affect its success, namely
perceived risk, consumer perception fit, and consumer innovativeness. According
to previous research that has been done by Rahmadhany (2011), consumer
perception fit toward brand extension of a product with high similarity of category
with its parent brand have opportunities that are more easily accepted by the
consumer. In additionparent brand’s reputation also took part in the success of
brand extension strategy. Perceived risk about brand extension category and
consumer innovativeness also playsimportant roles in that success.
Schiffman & Kanuk (2004) also support this strategy which says that consumers
have better memory of the information they receive about new product if the
product carries the well-known brand. It can minimize the risk of failure of new
product. Implementation on strategy that’s runed by PT. Unilever Indonesia Tbk
makes them successfully mastered almost the entire category of products in the
market. PT. Unilever Indonesia Tbk. did brand extension strategy on Pond’s.
PT. Unilever Indonesia is a multinational company that produces products to
fulfill consumer needs, such as food, drink, cleanser, and body treatments.
Unilever excels with its flagship brands in a series of top brand that are favored in
the world like, Pepsodent, Pond’s, Lifebuoy, Dove, Clear, Rexona, Vaseline, and
others. There are more than 6.000 employees spread across the archipelago.
Unilever has six factories in Jababeka industrial area, Cikarang, Bekasi, and two
factories in Rungkut industrial area, Surabaya, East Java, and its head office in
Jakarta. Unilever’s products recorded scattered over hundreds of thousands of
stores throughout Indonesia.

3
The vision of Unilever is to become the first choice of consumer, customer, and
community and the mission are to be the first and best in its class to fulfill
consumer’s needs and aspirations, become a major partner for its customers,
consumers, and community, eliminate activities that is not valuable of all the
processes, become selected company for people with high performance, increase
profitable growth and provide rewards for employees and shareholders, and get an
honor because of high integrity, caring to society and environment.
Those vision and mission are proved by owning more than 400 trademarks with
14 brands where some of them have total sales for more than £1 billion. They won
various awards given by three different institutions through innovation and
sustainable programs undertaken by the company. Four awards were received by
Unilever from Finance Asia’s Best Companies Poll 2016, two awards from
Sustainable Business Awards Indonesia 2016 and two awards from Warta
Ekonomi. In addition, Forbes stated that PT. Unilever Indonesia Tbk also crowned
as one of the best company in 2016. It proves the popularity of Unilever’s
products among society.
Some companies that produce brand in similar categories are PT. Paragon
Technology and Innovation and PT. L’Oreal Indonesia. Those three companies
are competing among each other. Pond’s from Unilever, Wardah from Paragon,
and Garnier from L’Oreal. Based on data obtained from TOP Brand Award’s
survey, among these three companies, over five years, Pond’s produced by PT.
Unilever Tbk. is almost always holds the top position in beauty and skincare
products.
Table 1.1 Percentage of Pond’s in Top Brand Award
Source: www.topbrand-award.com

4
Table 1.2 Percentage of Wardah in Top Brand Award
Source: www.topbrand-award.com
Table 1.3 Percentage of Garnier in Top Brand Award
Source: www.topbrand-award.com
The boxes colored in yellow in Table 1.1, Table 1.2, and Table 1.3 show the
highest percentage in every categories and Pond’s is holding the highest
percentage for 5 types of categories and get second rank after Garnier for BB
cream product. Garnier occupies the second position, and the last is Wardah
where Wardah for 3 years doesn’t get a chance to be chosen as nomination of
TOP Brand Award in that category. In addition, according to TOP Brand Award’s
survey, Pond’s becomes No.1 brand in 5 categories in 5 years in a row. Pond’s
becomes market leader in its industry. Pond’s in Indonesia achieved the highest
sales for Unilever worldwide.
The research will be focused only on residents of Jakarta, because Jakarta is the
capital of Indonesia. Jakarta also serves as a center of business, politics, and
culture in Indonesia. Various large shopping centers, markets, and boutiques are
also widely available in Jakarta. According to Head of Research and Advisory
Cushman and Wakefield, Arief Rahardjo (2013), 3,920,618 square meters of area
in Jakarta have been covered by Mall, even according to the data offered by

5
Cushman and Wakefield, each year the number of Mall grow 3.9 percent. It
reflects the characteristic of residents of Jakarta which is consumerist.
1.1.2 Need of the Study
The significant reason for this study is to discuss about the influence of brand
extension dimensions which are Perceived Risk, Consumer Perception Fit,
Reputation, and Consumer Innovativeness toward Purchase Intention and examine
of what is the dominant variable that influence Indonesian consumer purchase
intention through those dimensions and analyzes their impact on enhancing
consumer purchase intention of Pond’s in Jakarta.
1.1.3 Problem Identification
PT. Unilever Indonesia Tbk is a company that produces soaps, detergents,
margarine, dairy products, beverages, and beauty products for over 82 years.
However, technology development’s increasing the number of competitors that
produce similar products with good quality, such as PT. Paragon Technology and
Innovation and PT. L’Oreal Indonesia. It’s proven in the Table 1.1, Table 1.2, and
Table 1.3 that Pond’s once in the lower position than Garnier. To handle these
issues, PT. Unilever Indonesia Tbk. should make innovations to enhance
consumer purchase intention for Pond’s and investigate the consumers mind about
things that can affect purchase intention. Brand extension is an example of
strategy that is done by PT. Unilever Indonesia Tbk.Based on previous research of
Rahmadhany (2011) there are four variable of brand extension that can influence
purchase intention which areperceived risk, consumer perception fit, reputation,
and consumer innovativeness. Perceived risk is risk that’s felt by consumer when
they want to buy a product, consumer perception fit is category compatibility of
parent brand and expansion products, reputation is popularity value that’s
obtained by parent brand, and consumer innovativeness is desire of consumers to
try new products.

6
1.1.4 Research Questions
Specifically, this study aims to answer the following question:
1. Is there partial significant influence of perceived risk toward purchase
intention?
2. Is there partial significant influence of consumer perception fit toward
purchase intention?
3. Is there partial significant influence of reputation toward purchase
intention?
4. Is there partial significant influence of consumer innovativeness toward
purchase intention?
5. Is there simultaneous significant influence of perceived risk, consumer
perception fit, reputation, and consumer innovativeness toward purchase
intention?
1.1.5 Research Objectives
Based on the preceding research questions, the research objectives of the study
can be translated as follows:
1. To determine significant influence of perceived risk toward purchase
intention.
2. To determine significant influence of consumer perception fit toward
purchase intention.
3. To determine significant influence of reputation toward purchase
intention.
4. To determine significant influence of consumer innovativeness toward
purchase intention.
5. To determine significant influence of perceived risk, consumer perception
fit, reputation, and consumer innovativeness toward purchase intention.

7
1.2 Significance of Study
Through this research hopefully could expand knowledge, information, and
suggestion for:
1. PT. Unilever Indonesia Tbk.: The output of the research would become
reference for the company to strengthen consumer purchase intention
through the strategy of brand extension.
2. Researcher: To analyze which dimensions that are the most influence on
consumer purchase intention out of four dimensions of brand extension
and gain more understanding on brand extension strategy and also its
influence on consumer purchase intention.
3. The Future Researcher: The output of the research would become a
baseline and additional knowledge to enhance the needs of people who
would do future research about Brand Extension and Purchase Intention.
4. The University: To increase the literatures and studies in the field of Brand
Extension (Perceived Risk, Consumer Perception Fit, Reputation, and
Consumer Innovativeness) and Purchase Decision.
1.3 Scope and Limitation
Scope
The study is conducted to “The Influence of Brand Extension toward Purchase
Intention for Beauty Products (A Study Case of Pond’s in Jakarta), where the
researcher will examine through four dimensions which are perceived risk,
consumer perception fit, reputation, and consumer innovativeness.
Limitation
This research will limit on Pond’s beauty products and only focusedon consumer
of Pond’s in Jakarta.

8
1.4 Organization of the Thesis
To facilitate the reader’s understanding and writing of this study, the researcher
divides this study into several chapters containing the following:
Chapter I – Introduction
The first chapter will discussed about background of problems, problem
identifications, research objectives about the influence of brand extension towards
consumer’s purchase intention for Pond’s beauty products based on four
dimensions which are perceived risk, consumer perception fit, reputation, and
consumer innovativeness. It will also discuss about significance of study,
limitation, and organization of thesis.
Chapter II – Literature Review
Chapter II contains some reviews of previous studies and the research gaps,
explanation using theory of each dimensions, the measurements that are used, and
the influence of independent variable (perceived risk, consumer perception fit,
reputation, and consumer innovativeness) towards dependent variable
(consumer’s purchase intention).
Chapter III – Methods
In this chapter, there will be the explanation of methods which are used to analyze
the influence of brand extension dimensions toward purchase intention, theoretical
framework, some hypothesis, variables indicators, and questionnaire.
Chapter IV – Result and Discussions
Chapter IV contains the descriptive analysis of demographic profiles, inferential
analysis which interprets statistical result and discussions by comparing to
previous result.
Chapter V – Conclusion and Recommendation
In the last chapter, there will be the answers for hypothesis and some
recommendations for future research.

9
CHAPTER II
LITERATURE REVIEW
2.1 Introduction
This chapter contains a text of a scholarly paper, which includes the current
knowledge including substantive findings, as well as theoretical and
methodological contributions that can support the four dimensions of brand
extension which are perceived risk, consumer perception fit, reputation, and
consumer innovativeness and its influence towards purchase intention.
2.2Dependent Variable
2.2.1 Purchase Intention
According to Schiffman& Kanuk (2009) purchase intention is considered as
measurement for consumer to buy certain products, where higher purchase
intention will impact on the possibility in purchase decision. Meanwhile, Assael
(1992) defines purchase intention as a behavior that appeared as response toward
the object, or purchase intention that shows the desire of consumer to make a
purchase. While according to Kotler and Keller (2009), in evaluation stage in
purchase decision process, consumers form intention in brand in a group of
options. Consumer also might form purchase intention to buy the most preferred
product.
2.3 Independent Variable
2.3.1 Brand Extension
Keller (2008) brand extension is product development method using an
established brand, so that companies don’t need to create a new brand for the
product. Usually when a company is doing brand extension, it involves the use of
parent brand name that has been steadily in its category as a tool to enter other
categories. Brand extension is a natural strategy for growing companies and tries
to exploits its assets. Brand extension can be done by either using the assets for

10
penetration on the new product category or give license to other products or
acquire a company that had a brand that can be used as a foundation for the
company.
Keller (2013) classifies the brand’s extension into two categories, namely, the first
is line extension which is a brand extension strategy offers a new taste, new
composition, new additions, and also offer different products in the same
category, the second is the category extension which is a brand extension strategy
to target new market segments by creating new product category that is different
from the existing product categories before. There is research that found some of
the dimensions that affect consumer attitudes towards brand extension. One of
consumer attitude towards brand is purchase intention. The dimensions are brand
reputation, consumer perception fit, perceived risk, and consumer innovativeness.
2.3.2 Perceived Risk
Perceived risk or perception risk is defined as consumer perceptions about
uncertainties and consequences – the negative consequences that may be received
during the purchase of products or services. Srivastava and Sharma (2011) declare
that perceived risk may affect consumer purchase intention. They stated that if
consumer’s perceived risk is low related to product category extension, it will be
more favorable toward brand extension. Perception risk becomes even higher
when (Assael, 1992):
1. Lack of information about the product
2. The product is a new product
3. The product has complex technology
4. Low consumer confidence in evaluating a brand
5. Products are important to consumers
2.3.3 Consumer Perception Fit
Consumer perception fit is the similarity that is felt by consumers toward products
with parent brand and its extension product. When the company launched new
product that is consistent with parent brand, consumer feels higher compatibility
between products that are associated with the brand and its extension. The higher

11
consumer perception fit between products expansions and parent brand will also
increase the purchase intention for its expansion.
2.3.4 Reputation
A positive brand reputation plays an important role in a business, because it can
help boost the consumer purchase intention, facilitate the entry of product in the
market, and facilitate new consumer interest. For consumers, brand reputation
provides important information. As in the situation when consumer is difficult to
evaluate a product, then consumers are likely to rely on information from
reputation owned by the brand (Gronhaug., et al, 2002). When the company
decided to launch new product with its expansion, then reputation of parent brand
becomes the background of consumers to assess the quality of these products.
Reputation dimensions can be seen from consumer confidence toward company
quality, marketing activities, and consumer trust towards the success of company.
Gatti et al. (2012) posited that reputation which is owned by the company has
significant effects toward purchase intention that is produced by the company. By
inference, the higher positive reputation of the company then the higher consumer
purchase intention for the products.
2.3.5 Consumer Innovativeness
Innovation is personality aspect associated with consumer acceptance to create
new ideas and desire to try brand new product. According to Kyung (2012)
consumer innovativeness can affect consumer purchase intention towards product
expansion of the product by a single company. Consumers, who possess
innovativeness personality, do more evaluation on brand extension’s products. In
addition, individual with high innovativeness is usually braver and has higher
intention to try new products than individual with low innovativeness.
2.4 Research Gap
Based on the previous research above, the research from Gunawan (2013) uses
similarity, reputation, perceived quality, and innovation as the independent

12
variables and brand image as dependent variable. The result is simultaneous
influence of characteristics of brand extension that includes similarity, reputation,
perceived quality, and innovation toward brand image and the most dominant
influence is similarity.Gjertsen (2015) uses 5 variables (perceived fit,
communication of explanatory links, consumer innovativeness, category
involvement, environmental consciousness) and perceived fit had a positive direct
effect on attitudes towards the extension, but no effects on purchase intentions and
consumer innovativeness was found to moderate the effect of perceived fit on
attitudes toward purchase intentions.
The gap between those two researchers and this research is the differences of
variables that are used to be analyze. In this research the researcher use similar
dependent variable (purchase intention) and independent variables (perceived risk,
consumer perception fit, reputation, consumer innovativeness) witha research
from Khairunnisak and Firman (2015) but with a different case study, because in
this research, the researcher focuses on Pond’s beauty products consumer in
Jakarta.

13
CHAPTER III
METHODS
3.1 Introduction
This chapter clearly defines the research methods used to conduct the study. The
researcher will explain the techniques and methods by which data was gathered
and analyzed are examined, research instruments, data sources, data collection
techniques, data presentation techniques and analytical techniques used are given..
The methodology used is quantitative methods and measures which emphasize
objective measurements and the statistical, mathematical, or numerical analysis of
data collected through polls, questionnaires, and surveys, or by manipulating pre-
existing statistical data using computational technique.
3.2 Theoretical Framework
Figure 3.1 Theoretical Framework
Source: David Aaker (2011)
Perceived Risk
(X1)
Reputation
(X3)
Consumer Perception Fit
(X2)
Consumer Innovativeness
(X4)
Purchase Intention
(Y)
H1
H5
H4
H3
H2

14
Figure 3.2.1 illustrates the process of Brand Extension dimensions which are
perceived risk (X1), consumer perception fit (X2), reputation (X3), and consumer
innovativeness (X4)influencepurchase intention (Y) for Pond’s beauty products
partially (H1,H2,H3,H4) and simultaneously (H5). Researcher uses five variables
which consist of four independent variables (X) that influence one dependent
variable (Y).
3.3 Hypothesis
Ho1 : There is no partial significant influence of perceived risk toward
purchase intention Pond’s beauty products.
Ha1 : There is partial significant influence of perceived risk toward purchase
intention Pond’s beauty products.
Ho2 : There is no partial significant influence of consumer perceptions fit
toward purchase intention Pond’s beauty products.
Ha2 : There is partial significant influence of consumer perceptions fit toward
purchase intention Pond’s beauty products.
Ho3 : There is no partial significant influence of reputation toward purchase
intention Pond’s beauty products.
Ha3 : There is partial significant influence of reputation toward purchase
intention Pond’s beauty products.
Ho4 : There is no partial significant influence of consumer innovativeness
toward purchase intention Pond’s beauty products.
Ha4 : There is partial significant influence of consumer innovativeness toward
purchase intention Pond’s beauty products.
Ho5 : There is no simultaneous significant influence of perceived risk,
consumer perception fit, reputation, and consumer innovativeness towards
purchase intention for Pond’s beauty products.

15
Ha5 : There is simultaneous significant influence of perceived risk, consumer
perception fit, reputation, and consumer innovativeness towards purchase
intention for Pond’s beauty products.
3.4 Operational Definitions of Variables
Variables Definition Indicators Measureme
nts
Perceived
Risk
Consumer's level of
uncertainty regarding the
outcome of a purchase
decision, specially in case
of high priced item.
(www.businessdictionary.c
om, 2016)
1. Definite
benefits
2. Confidence
3. Certainty
about the
result
4. Conviction
5. Safety
Likert Scale
Consumer
Perception
Fit
Similarities can be seen
from the products and its
parent brand and product
expansion based on
features, attribute, and
benefits. (Hem, Leslie, and
Iversen N.M, 2001)
1. Complement
2. Functionality
3. Product
category
4. Benefits
5. Quality
Likert Scale
Reputation A perceptual
representation of a
company’s past actions
and future prospects that
describe the firm’s appeal
to all of its key
constituents (Helm et al,
2011)
1. Good
reputation
2. Popularity
3. Good
reputation of
parent brand
4. Positive
influence of
parent brand
Likert Scale

16
5. Experience of
using parent
brand
products
Consumer
Innovativene
ss
Related to the acceptance
of consumers to new ideas
and desire to try new
products. (Cotte and
Wood, 2004)
1. Like to try
new products
2. Trendsetter
3. Curious
personality
4. Fascinated to
try expansion
product
5. New
experiences
Likert Scale
Purchase
Intention
A plan to purchase a
particular good or service
in the future
(www.businessdictionary.c
om, 2016)
1. Desire to
have products
2. Interested in
trying
3. Purchase
consideration
4. Interest in
looking for
information
5. Curiosity
about the
product
Likert Scale
3.5Instrument
Instrumentis the generic term that researchers use for a measurement device
(survey, test, questionnaire, etc.). To help distinguish between instrument and
instrumentation, consider that the instrument is the device andinstrumentation is

17
the course of actionor the process of developing, testing, and using the device
(researchrundowns.com, 2016).
Figure 3.2 Data Collection Method
Source : Nirwana (2014)
3.5.1 Primary Data
Primary data are information collected by a researcher specifically for a research
assignment. It generally takes thetime and allocate the resources required to gather
primary data only when a question, issue or problem presents itself that is
sufficientlyimportant or unique that it warrants the expenditure necessary to
gather the primary data.Primary data are original in nature and directly related to
the issue or problem and currentdata. Primary data are the data which the
researcher collects through various methods likeinterviews, surveys,
questionnaires etc.(shodhganga.inflibnet.ac.in, 2016).
Research
Data collection
Data selection
Survey Articles on Internet
Books and Journals Primary data

18
The primary data of this research is obtained from the questionnaire that is used
for survey. Questionnaire is a set of printed or written questions with a choice of
answers, devised for the purposes of a survey or statistical study. The
questionnaire will be spread to the number of samples that are decided by the
researcher.
3.5.2 Secondary Data
Secondary data are the data collected by a party not related to the research study
but collected these data for some other purpose and at different time in the past. If
the researcher uses these data then these become secondary data for the current
users. These may be available in written, typed or in electronic forms
(shodhganga.inflibnet.ac.in, 2016).
The secondary data in this research is the literature studies. A literature study is a
study in which you read selected text, such as a novel, short story, or poem and
basically write a paper about it. Sometimes it deals with only one piece of
literature but it can also deal with two or more (enotes.com, 2010).
3.5.3 Questionnaire
A questionnaire is a set of systematically structured questions used by a
researcher to get needed information from respondents. Questionnaires have been
termed differently, including surveys, schedules, indexes/indicators, profiles,
studies, opinion questionnaires, batteries, tests, checklists, scales, inventories,
forms, inter alia. (Ong'anya, 2009). In this research, the questionnaire consists of
three sections. In the first section, there is three screening questions about
respondent citizenship, experienced in using Pond’s face wash and whether
respondents ever using Pond’s beauty products or not. The second section is the
respondent profile. In the last section, there are filling instruction and statement of
perceived risk, consumer perception fit, reputation, consumer innovativeness, and
purchase intention. The questionnaire will be shown in Likert Scale format, so
there will be 5 options, number 1 for strongly disagree, 2 for disagree, 3 for
neutral, 4 for agree, and 5 for strongly agree. In order to decide whether it’s
1,2,3,4, or 5, the researcher make a scale to measure the feeling of respondents.

19
Scale of Agreement Meaning
0% - 20% Strongly Disagree
21% – 40% Disagree
41% - 60% Neutral
61 – 80% Agree
81% - 100% Strongly Agree
Perceived Risk
No. Statements 1 2 3 4 5
1. The use of “Pond’s” name on Pond’s beauty
products convince me about the benefits that
will be provided
2. The use of “Pond’s” name makes me
confident about the quality of Pond’s beauty
products
3. The use of “Pond’s” name on Pond’s beauty
products give certainty about the result that
will be obtained if using the products
4. The use of “Pond’s” name on Pond’s beauty
products convince me when i want to choose
the product in beauty product category
5. The use of “Pond’s” name on Pond’s beauty
product make me sure that this product is safe
to be used
Consumer Perception Fit
No. Statements 1 2 3 4 5
1. Pond’s face wash and Pond’s beauty products
can complement each other in their use
2. Pond’s face wash and Pond’s beauty product
have the same function which is beauty care

20
products for consumer
3. Pond’s face wash and Pond’s beauty products
are in the same product category which is
beauty care products
4. In my opinion, using “Pond’s” name on
Pond’s beauty products can provide benefits
as good as face wash product
5. Pond’s face wash and beauty product have the
same quality
Reputation
No. Statements 1 2 3 4 5
1. Pond’s face wash has good reputation
2. The high popularity of Pond’s face wash can
increase the popularity of Pond’s beauty
products
3. Pond’s face wash has a good reputation, so it
encourages me to choose Pond’s beauty
products
4. I think Pond’s face wash reputation can
provide positive influence on Pond’s beauty
products
5. Good reputation of Pond’s face wash makes
me confident on the quality of Pond’s beauty
products
Consumer Innovativeness
No. Statements 1 2 3 4 5
1. Pond’s brand extension from face wash
category to beauty product fit with my
personality who likes to try new products

21
2. Pond’s brand extension from face wash
category to beauty product fit with me who
love to be trendsetter
3. Pond’s brand extension from face wash
category to beauty product successfully made
me curious to try these products
4. Pond’s brand extension makes me fascinated
to try the expansion products
5. Pond’s beauty product fit with my personality
who likes to look for new experiences
Purchase Intention
No. Statements 1 2 3 4 5
1. I would like to have Pond’s beauty products
2. I am interested to try Pond’s beauty products
3. I am considering to buy Pond’s beauty
products
4. I am interested in finding information about
Pond’s beauty products
5. I would like to know more about Pond’s
beauty products
3.6 Sampling
Sample is some objects that are taken from the whole object under study and are
considered to represent the entire population. Sample selection technique in this
research is non-probability sampling. Non-probability sampling technique used is
purposive sampling method.Non-probability sampling is sampling technique by
not providing an equal opportunity for each element or member of the population
to be selected as sample, whereas purposive sampling is sampling technique that’s
selected carefully by choosing research object selectively and has specific

22
characteristics. The total population is unknown, so the researcher decided to use
Supranto (2001) theory to calculate the size of sample:
N = 5 x q
Where :
q : number of questions in questionnaire
Based on that formula, the researcher should spread the questionnaire with
minimum number of 125 respondents. In addition, according to Hair, et al (2010),
a good sample size is ranging 100-200. Questionnaires are distributed to residents
in Jakarta. The researcher will distribute the questionnaires twice. The first will be
only distributed to 30 respondents that will be used for pre-test and then proceed
to validity and reliability test, if those results indicated as valid and reliable, the
researcher will continue to distribute the questionnaires to 125 respondents for the
real test. The questionnaires are distributed to 5 areas of Jakarta which are North
Jakarta, South Jakarta, West Jakarta, East Jakarta, and Central Jakarta.
3.6.1 Population
Population is defined as entire data that becomes the center of attention of a
researcher in the specified scope and time. Population is associated with the data.
If every human being provides the data, the size or number of population will be
equal to the number of people. In addition, population is a group of individuals
with the different quality and character of which has been set by the researcher.
That characteristic or quality is called as variable. Population of this research is
the resident of Jakarta who have used Pond’s face wash and have never used
Pond’s beauty products.
3.6.2 Data Collection Method
In this study, the researcher uses the questionnaire method to collect the data.
Sugiyono (2008), “question form or questionnaire is a data collection method by
giving a set of questions or written statement to the respondent”. Questionnaire
used in this research is the kind of enclosed questionnaire, because respondents

23
only put the mark on one of the answers that are considered true. The researcher
spread 30 questionnaires to 30 respondents as the pre-test to analyze the validity
and reliability.
3.6.3 Data Analysis
After doing validity and reliability test for the pre-test, then the researcher
performs the actual deployment of questionnaires to 125 respondents in Jakarta.
Data that’s obtained serves as primary data and 125 respondents serve as the
sample size. The data results of questionnaires are analyzed by using two tools,
which are Microsoft Excel 2010 to input then calculate the data results of
questionnaires using formula and SPSS version 16.00 to analyze the data that’s
formed as numerical and statistical data
3.6.4 Instrument Test
The purpose of instrument test is to know that the instruments (questionnaires)
that has been prepared is proved well and worthy to be deployed, because the
good or bad of instrument will influence the level of accuracy of the data and
determine the quality of research results. Trials conducted namely validity and
reliability test.
3.6.4.1 Validity Test
The purpose of validity testing is to eliminate the proper question that will answer
the research objectives. Arikunto (2006) argues that an instrument is declared as
valid if it is able to measure what is desirable and may disclose the data of the
variables examined or if the r value is greater than r table value. Validity test
according to Arikunto (2006) is done using Pearson Product Moment Correlation
formula, as follows:

24
Figure 3.3 Validity Test Formula
Source : Arikunto (2006)
Where :
n : total respondents
X : score of item
Y : total score of item
In the validity test, Pearson Correlation will measure the level of validity. Pearson
Correlation coefficient measures the degree of liner relationship between two
variables. Most research will very rarely get a correlation of 0, -1 or 1. Result
would be somewhere in between. The closer to 1, the closer it gets to be perfect.
While negative and positive value indicates the direction of the relationship. The
direction of positive relationship indicates that there is a direct relationship or the
higher variable A that causes the increasing of variable B.
Scale Correlation
0 – 0.199 Very Weak
0.20 – 0.399 Weak
0.40 – 0.599 Moderate
0.60 – 0.799 Strong
0.80 – 1.0 Very Strong
Table 3.1 Interpretation of Correlation Scale
Source : Sugiyono (2007)

25
3.6.4.2 Reliability Test
After it’s declared as valid, the next step is measuring reliability. Reliability is
meant as a dependability consistency, which means that the figures resulting from
an indicator does not vary due to the characteristics of the research process itself.
Reliability test is done to find out the extent to which a measurement can provide
consistent result. The higher the reliability of measurement, increase the trust that
all indicators individually consistent in measurement. The researcher will use
Cronbach’s Alpha Coefficient as the measurement of reliability (internal
consistency), the equation is:
Where :
k : number of items
r : average correlation between any two items
α : reliability of the average or sum
A rule of thumb for interpreting alpha for Likert scale questions is:
Table 3.2 Cronbach’s Alpha Scale Interpretation
Source : www.statisticshowto.com

26
3.6.6 Classical Assumption Testing
3.6.6.1 Normality Test
Normality Test used to test the independent variable (X) and the dependent
variable (Y) on the resulting regression equation, whether normally distributed or
not distributed normally. Normality Tests performed using the test chart
Histogram and P-P plots to test the regression model residuals. If the histogram
shows distribution pattern that leads to the right and P-Plot shows the dots
followed and approached the diagonal line, it means the data is distributed
normally.
3.6.6.2 Multicollinearity Test
Multicollinearity refers to a situation where a number of independent variables in
a multiple regression model are closely correlated to one another.
(www.investopedia.com, 2016). Multicollinearity test aims to test whether the
regression model found a correlation between the independent variables.
Multicollinearity occurs when the VIF (Variance Inflation Factor) value is more
than 10 and tolerance values less than 0.1 (dawaisimfoni.wordpress.com, 2013).
3.6.6.3 Heteroscedastcity Test
Homoscedastcity means that the variance around the regression line is the same
for all values of the predictor variable (X), while Heteroscedastcity refers to the
circumstance in which the variability of a variable is unequal across the range of
values of a second variable that predicts it. Multiple regressions equation
considered as good equation if there is no heteroscedasticity.
3.6.7 Testing of Hypothesis
A hypothesis test is a statistical test that is used to determine whether there is
enough evidence in a sample of data to infer that a certain condition is true for the
entire population. The researcher uses multiple regressions to test the hypothesis.
3.6.7.1 T-Test
T-Test is a test for the partial regression coefficient which is intended to
determine how farthe influence ofone independent variable (perceived risk,

27
consumer perception fit, reputation and consumer innovativeness) individually
inexplainingthe dependentvariable(purchase intention).
3.6.7.2 F-Test
F-test is also known as ANOVA test which is a test to identify if there is the
simultaneous influence of all independent variables toward dependent variable or
not. The hypothesis will be tested in this test, whether it is accepted or rejected
with the following provisions, the null hypothesis Ho will be accepted if F value
is greater than 0.05 and Hawill be accepted if F value is less than 0.05. In
addition, if F value > F table, Howill be rejected, Ha will be accepted and vice
versa.
3.6.7.3 Coefficient of Correlation (R) and Coefficient of Determination (R2)
Correlation coefficients measure the strength of association between two
variables. The most common correlation coefficient, called the Pearson Product-
Moment Correlation Coefficient, measures the strength of the linear association
between variables.The coefficient of determination (denoted by R2) is a key
output of regression analysis. It is interpreted as the proportion of the variance in
the dependent variable that is predictable from the independent variable
(www.stattrek.com, 2016).

28
CHAPTER IV
RESULTS AND DISCUSSIONS
4.1 Descriptive Analysis
4.1.1 Data Analysis
This chapter describes the result of research and analysis which is the answer to
the problems that are written in the first chapter. It discusses all the result from all
findingsin the form of explanation, statistical analysis, figure, table, and graphic.
4.1.2 Validity Test
Validity is a measurement that will actually measure what will be measured, the
higher the validity, the closer it’s to its target, or increasingly shows what should
be measured. So, validity refers to the precision and accuracy in the process of
running measurement function. . The item (question) is considered as valid if r is
bigger than r-table, but if it’s lower the question will be considered as invalid and
it should be removed from the questionnaire. The researcher examined by using
pre-test sample to test the questionnaire before doing the real questionnaire
deployment with the sample (n) = 30 respondents with significance level (α) =
5%, and then put it on the Degrees of Freedom (df) formula:
Based on the table on Appendix 1, the value of r-table is 0.361. So, the item
should have r that’s greater than 0.361 to be valid. The result of pre-test validity is
shown in the table below.

29
Table 4.1 Validity Test
Source : Primary Data Calculation
Variables Items Pearson Correlations (r) rtable Remarks
Perceived Risk Q1 0.850 0.361 Valid
Q2 0.907 0.361 Valid
Q3 0.924 0.361 Valid
Q4 0.923 0.361 Valid
Q5 0.884 0.361 Valid
Consumer
Peception Fit
Q1 0.903 0.361 Valid
Q2 0.662 0.361 Valid
Q3 0..810 0.361 Valid
Q4 0.825 0.361 Valid
Q5 0.716 0.361 Valid
Reputation Q1 0.678 0.361 Valid
Q2 0.839 0.361 Valid
Q3 0.863 0.361 Valid
Q4 0.762 0.361 Valid
Q5 0.798 0.361 Valid
Consumer
Innovativeness
Q1 0.847 0.361 Valid
Q2 0.922 0.361 Valid
Q3 0.799 0.361 Valid
Q4 0.850 0.361 Valid
Q5 0.798 0.361 Valid
Purchase
Intention
Q1 0.749 0.361 Valid
Q2 0.889 0.361 Valid
Q3 0.592 0.361 Valid
Q4 0.848 0.361 Valid
Q5 0.760 0.361 Valid

30
Based on the table 4.1 above, all items are valid because r is always higher than r-
table. Therefore, the researcher decided to choose all the questions into the
questionnaire for real samples.
4.1.3 Reliability Test
Reliability test was conducted by using SPSS and arranged data from Microsoft
Excel to tabulate Cronbach’s Alpha of the research instruments. The results are as
followed.
A. Perceived Risk
Reliability Statistics
Cronbach's
Alpha N of Items
.819 5
Table 4.2 Cronbach’s Alpha of Perceived Risk
Source : Primary Data Calculation
Based on table 3.2 in chapter III the Cronbach’s Alpha of perceived risk variable
is in range 0.9 > α ≥ 0.8, means that the internal consistency is good.
B. Consumer Perception Fit
Reliability Statistics
Cronbach's
Alpha N of Items
.714 5
Table 4.3 Consumer Perception Fit’s Cronbach’s Alpha
Source : Primary Data Calculation

31
Based on table 3.2 in chapter III the Cronbach’s Alpha of consumer perception fit
variable is in range 0.8 > α ≥ 0.7, means that the internal consistency is
acceptable.
C. Reputation
Reliability Statistics
Cronbach's
Alpha N of Items
.742 5
Table 4.4 Cronbach’s Alpha of Reputation
Source : Primary Data Calculation
Based on table 3.2 in chapter III the Cronbach’s Alpha of reputation variable is in
range 0.8 > α ≥ 0.7, means that the internal consistency is acceptable.
D. Consumer Innovativeness
Reliability Statistics
Cronbach's
Alpha N of Items
.847 5
Table 4.5 Cronbach’s Alpha of Consumer Innovativeness
Source : Primary Data Calculation
Based on table 3.2 in chapter III the Cronbach’s Alpha of consumer
innovativeness variable is in range 0.9 > α ≥ 0.8, means that the internal
consistency is good.

32
E. Purchase Intention
Reliability Statistics
Cronbach's
Alpha N of Items
.806 5
Table 4.6 Cronbach’s Alpha of Purchase Intention
Source : Primary Data Calculation
Based on table 3.2 in chapter III the Cronbach’s Alpha of purchase intention
variable is in range 0.9 > α ≥ 0.8, means that the internal consistency is good.
4.1.4 Demographic Profile
A. Gender
Based on 125 respondents’ gender which is divided into male and female, the
result of the analysis is shown below:
Figure 4.1 Gender
Source : Primary Data Calculation

33
Table 4.7 Gender
Source : Primary Data Calculation
Table 4.7 and Figure 4.1 show the respondent profiles of gender in this research,
30 people (24%) were male respondents and 95 people (76%) were female
respondents. Therefore, the majority of Pond’s consumers are female and the
conclusion is Pond’s beauty products are more suitable for female than male.
B. Age Levels
Based on 125 respondents’age which isdivided into 7 categories, the result of the
analysis is shown below:
Figure 4.2 Age
Source : Primary Data Calculation
Gender
Frequency Percent Valid Percent
Cumulative
Percent
Valid Male 30 24.0 24.0 24.0
Female 95 76.0 76.0 100.0
Total 125 100.0 100.0

34
Age
Frequency Percent Valid Percent
Cumulative
Percent
Valid 16-25 106 84.8 84.8 84.8
26-35 13 10.4 10.4 95.2
36-45 4 3.2 3.2 98.4
> 45 2 1.6 1.6 100.0
Total 125 100.0 100.0
Table 4.8 Age
Source : Primary Data Calculation
As it is shown in Table 4.8 and Figure 4.2 about respondent profile of age in this
research, no one (0%) was under 16 years old, 106 people (84.8%) were between
16-25 years old; 13 people (10.4%) were between 26-35 years old; 4 people
(3.2%)werebetween 36-45 years old; and 2 persons (1.6%) were> 45 years old.
Based on the data above, the group age of 16-25 years old dominate the
respondent profile in this research. So, mostly consumers of Pond’s are 16-25
years old and the conclusion is Pond’s beauty products mostly used by teenager.
C. Education Levels
Based on 125 respondents’education which isdivided into 5 categories, the result
of the analysis is shown below:

35
Figure 4.3 Education
Source : Primary Data Calculation
Education
Frequency Percent Valid Percent
Cumulative
Percent
Valid Diploma 2 1.6 1.6 1.6
Bachelor 116 92.8 92.8 94.4
Master 7 5.6 5.6 100.0
Total 125 100.0 100.0
Table 4.9 Education
Source : Primary Data Calculation
Table 4.9 and Figure 4.3 show the respondent profiles of education background in
this research, no one (0%) came from senior high school education background, 2
respondents (1.6%) came from diploma education background, 116 respondents
(92.8%) came from bachelor education background, 7 respondents (5.6%) came
from master education background and no one (0%) came from doctorate

36
background. Thus, the most consumers of Pond’s came from bachelor education
background. So, the conclusion is Pond’s beauty productsmostly used by
consumer with high education.
D. Occupation
Based on 125 respondents’occupation which isdivided into 4 categories, the result
of the analysis is shown below:
Figure 4.4 Occupation
Source : Primary Data Calculation
Occupation
Frequency Percent Valid Percent
Cumulative
Percent
Valid Student 99 79.2 79.2 79.2
Employee 17 13.6 13.6 92.8
Entrepreneur 5 4.0 4.0 96.8
Others 4 3.2 3.2 100.0
Total 125 100.0 100.0
Table 4.10 Occupation
Source : Primary Data Calculation

37
As it is described in Table 4.10 and Figure 4.4 about respondent profiles of
occupation in this research, 99 respondents (79.2%) were student, 17 respondents
(13.6%) were employee, 5 respondents (4%) were entrepreneur, and 4 respondents
(4%) were others. Therefore, the majority Pond’s consumers’occupations
arestudent.
E. Domicile
Based on 125 respondents’domicile which isdivided into 5 areas, the result of the
analysis is shown below:
Figure 4.5 Domicile
Source : Primary Data Calculation

38
Domicile
Frequency Percent Valid Percent Cumulative Percent
Valid North Jakarta 22 17.6 17.6 17.6
South Jakarta 34 27.2 27.2 44.8
West Jakarta 31 24.8 24.8 69.6
East Jakarta 23 18.4 18.4 88.0
Central Jakarta 15 12.0 12.0 100.0
Total 125 100.0 100.0
Table 4.11 Domicile
Source : Primary Data Calculation
Based on Table 4.11 and Figure 4.5 about respondent profiles of domicile, 22
respondents (17.6%) were lived in North Jakarta, 34 respondents (27.2%) were
lived in South Jakarta, 31 respondents (24.8%) were lived in West Jakarta, 23
respondents (18.4%) were lived in East Jakarta, and 15 respondents (12%) were
lived in Central Jakarta. Therefore, the most dominant Pond’s consumers lived in
South Jakarta because South Jakarta is central business district of DKI Jakarta
with total population of 2.06 million people, so there are so many people or
workers that use Pond’s beauty products.
F. Monthly Income
Based on 125 respondents’ monthly income which isdivided into 4 categories, the
result of the analysis is shown below:

39
Figure 4.6 Monthly Income
Source : Primary Data Calculation
Income
Frequency Percent Valid Percent
Cumulative
Percent
Valid > Rp 500,001 - Rp 2,500,000 75 60.0 60.0 60.0
> Rp 2,500,001 - Rp
4,500,000 29 23.2 23.2 83.2
> Rp 4,500,001 21 16.8 16.8 100.0
Total 125 100.0 100.0
Table 4.12 Monthly Income
Source : Primary Data Calculation
As it is shown in Table 4.12 and Figure 4.6 about the respondent profiles of
monthly income, no respondents (0%) answered less or equal to Rp 500,000; 75
respondents (60%) have monthly income around Rp 500,001 – Rp 2,500,000; 29
respondents (23.2%) have monthly income around Rp 2,500,001 – Rp 4,500,000;
21 respondents (16.8%) have monthly income for more than or equal Rp

40
4,500,001. Therefore, Pond’s consumers are mostly have income ranging in Rp
500,001 – Rp 2,500,000. So, Pond’s beauty products are usedby upper-middle-
class workers.
4.2 Inferential Analysis
4.2.1 Descriptive Analysis
Descriptive Statistics
N Minimum Maximum Mean Std. Deviation
PRT 125 2.20 5.00 3.9008 .74385
CPT 125 2.20 5.00 4.0128 .70927
RET 125 2.20 5.00 4.0512 .79063
CIT 125 2.20 5.00 3.9728 .78302
PIT 125 2.20 5.00 3.9088 .79576
Valid N (listwise) 125
Table 4.13 Descriptive Statistics
Source : Primary Data Calculation
Table 4.13 shows the mean and standard deviation of perceived risk, consumer
perception fit, reputation, consumer innovativeness, and purchase intention
according to respondent responses on the questionnaire. Based on the table above,
the researcher can conclude that more or less all the respondents choose number 4
in each statement in the questionnaire, where number 4 means agree.
4.2.2 Classical Assumption Testing
4.2.2.1 Normality Test
Normality Tests performed using the test chartHistogram and P-P plots to test the
regression model residuals are shown in Figure 4.7 and Figure 4.8 following.

41
Figure 4.7Normality Test: Histogram
Source : Primary Data Calculation
Figure 4.8Normality Test: P-Plot
Source : Primary Data Calculation

42
Based on the output shown in both figures, it can be seen that the histogram
provides a distribution pattern that leads to the right which means the data is
distributed normally and then figure 4.8 shows that there are dots followed and
approached the diagonal line, so it can conclude that regression models fulfill the
assumption of normality.
4.2.2.2 Multicollinearity Test
Table 4.14Multicollinearity Test: Coefficient
Source : Primary Data Calculation
From the table 4.14 above, there are no VIF values more than 10 and no tolerance
value less than 0.1. It indicates that there is no multicollinearity and the researcher
can use the multiple regression models to analyze this study.
Coefficientsa
Model
Collinearity Statistics
Tolerance VIF
1 PRT .367 2.727
CPT .840 1.190
RET .781 1.281
CIT .365 2.740
a. Dependent Variable: PIT

43
4.2.2.3. Heteroscedastcity Test
Figure 4.9 Heteroscedastcity Test : Scatterplot Graph
Source : Primary Data Calculation
Heteroscedastcity test results shown on Figure 4.9 indicate that the points spread
randomly and do not form a clear pattern. The points also spread above and below
number 0 (zero) on the Y axis, it concludes that there is no heteroscedastcity. So,
this regression is feasible to be used in this study.
4.2.3 Testing of Hypothesis
A hypothesis test is a statistical test that is used to determine whether there is
enough evidence in a sample of data to infer that a certain condition is true for the
entire population. The researcher uses multiple regressions to test the hypothesis.
4.2.3.1 T-Test
T-test is a statistical technique used to show how far the partial influence of
independent variables (perceived risk, consumer perception fit, reputation, and
consumer innovativeness) toward dependent variable (purchase intention) based
on the existing data.

44
Coefficientsa
Model
Unstandardized Coefficients
Standardized
Coefficients
t Sig. B Std. Error Beta
1 (Constant) -.022 .258 -.085 .933
PRT .168 .078 .157 2.139 .034
CPT .110 .054 .098 2.015 .046
RET -.015 .051 -.015 -.291 .771
CIT .729 .075 .717 9.755 .000
a. Dependent Variable: PIT
Table 4.15 T-Test : Coefficient
Source : Primary Data Calculation
From the result in Table 4.15, if it’s written in the standardized form of the
equation, the regression is as follows:
Y = -0.022 + 0.168X1 + 0.110X2 + 0.729X4
Where,
Y = Purchase Intention
X1 = Perceived Risk
X2 = Consumer Perception Fit
X3 = Reputation
X4 = Consumer Innovativeness
Based on the equation above, it can be concluded as follow:
1. Perceived risk (X1) as the independent variable can predict purchase
intention (Y) as dependent variable with 0.168 regression coefficient. It
means for each unit increase in X1, there will be unit increasing in Y equal
to 0.168.
2. Consumer perception fit (X2) as the independent variable can predict
purchase intention (Y) as dependent variable with 0.110 regression
coefficients. It means for each unit increase in X2, there will be unit
increasing in Y equal to 0.110.

45
3. Consumer innovativeness (X4) as the independent variable can predict
purchase intention (Y) as dependent variable with 0.729 regression
coefficient. It means for each unit increase in X4, there will be unit
increasing in Y equal to 0.729. Consumer innovativeness is the dominant
variable because it has the highest beta (B) value with the value equal to
0.729.
A. Perceived Risk (X1)
The test using SPSS for variable X1 obtained the t value = 2.139 with
significance (sig.) value of 0.034. By using the 0.05 for α value, the
significance value is lower than 0.05 and the t value > t table (1.979) with
df = 124 which means that Ho is rejected and Ha is accepted. Thus, the
first hypothesis is accepted that there is significant influence of perceived
risk toward purchase intention for beauty products of Pond’s.
B. Consumer Perception Fit (X2)
The test using SPSS for variable X2 obtained the t value = 2.015 with
significance (sig.) value of 0.046. By using the 0.05 for α value, the
significance value is lower than 0.05 and the t value > t table (1.979) with
df = 124 which means that Ho is rejected and Ha is accepted. Thus, the
second hypothesis is accepted that there is significant influence of
consumer perception fit toward purchase intention for beauty products of
Pond’s.
C. Reputation (X3)
The test using SPSS for variable X3 obtained the t value = -0.291 with
significance (sig.) value of 0.771. By using the 0.05 for α value, the
significance value is greater than 0.05 and the t value < t table (1.979) with
df = 124 which means that Ho is accepted and Ha is rejected. Thus, the
third hypothesis is accepted that there is no significant influence of
reputation toward purchase intention for beauty products of Pond’s.

46
D. Consumer Innovativeness (X4)
The test using SPSS for variable X4 obtained the t value = 9.755 with
significance (sig.) value of 0.000. By using the 0.05 for α value, the
significance value is lower than 0.05 and the t value > t table (1.979) with
df = 124 which means that Ho is rejected and Ha is accepted. Thus, the
fourth hypothesis is accepted that there is significant influence of
consumer innovativeness toward purchase intention for beauty products of
Pond’s and the most dominant variable is consumer innovativeness with
the significant value of 0.000.
4.2.3.2 F-Test
ANOVAb
Model Sum of Squares df Mean Square F Sig.
1 Regression 59.927 4 14.982 96.690 .000a
Residual 18.593 120 .155
Total 78.520 124
a. Predictors: (Constant), CIT, CPT, RET, PRT
b. Dependent Variable: PIT
Table 4.16 F-Test: ANOVA
Source : Primary Data Calculation
From the result shown in Table 4.16, the F table value is found on the F table with
df1= 4 and df2 = 120, thus the F table value is 2.45. F value is 96.690 with
significance value of 0.000, it means F value > F table. If the F value is compared
with 0.05 of α value, the probability will be 0.000 < 0.05, so Ha5 is accepted and
Ho5 is rejected. It can be concluded that there is simultaneous significant
influence of perceived risk, consumer perception fit, reputation, and consumer
innovativeness toward purchase intention for beauty product of Pond’s.

47
4.2.3.3 Coefficient of Correlation (R) and Coefficient of Determination (R2)
Model Summaryb
Model R R Square
Adjusted R
Square
Std. Error of the
Estimate Durbin-Watson
1 .874a .763 .755 .39363 2.102
a. Predictors: (Constant), CIT, CPT, RET, PRT
b. Dependent Variable: PIT
Table 4.17 Multiple Regression Analysis : Coefficient
Source : Primary Data Calculation
Based on Table 4.17, the results can be seen that the adjusted R square is 0.755
(75.5%) which means there is 75.5% independent variables (Perceived Risk,
Consumer Perception Fit, Reputation and Consumer Innovativeness) that
simultaneously influence dependent purchase intention as dependent variable or
75.5% of purchase intention is explained by independent variables, and the rest
24.5% is influenced by other variables that are not examined in this research.In
addition, the value of coefficient correlation (R) is 0.874 or 87.4%, it indicates
that the degree of association between all of independent variables and dependent
variables is very strong as it already stated in Table 3.1 that if R value is between
0.80 – 1.0, it means very strong.
4.3 Interpretation of Results
This research discusses about the influence of brand extension toward purchase
intention for beauty product and a case study of Pond’s beauty products in Jakarta.
There are four dimensions of brand extension that work as independent variables
in this research which are perceived risk, consumer perception fit, reputation, and
consumer innovativeness. Then, there is one dependent variable which is purchase
intention. The purposes of this research are to find out if there is a partial

48
significant influence or simultaneous significant influence of brand extension
dimensions towards purchase intention.
This research focuses only on residents of Jakarta with the unknown total
population. The researcher decided to take 30 respondents to do pre-test to test the
validity and reliability of the questionnaire. The sample size is 125 with 0.05
significance value. So, the total questionnaires distributed are 155 questionnaires.
SPSS version 16.0 is used to analyze the data from questionnaires.
The researcher analyze the data by using classical assumption testing (normality
test, heteroscedastcity test, and multicollinearity test) and hypothesis testing
(coefficient of determination, F-test, and T-test). From the result of multiple
regression in Table 4.5, the adjusted R square is 0.755 (75.5%)which means the
independent variables influence dependent variable and 24.5% of purchase
intention is explained by other variables that are not examined in this
research.Moreover in F-Test, the F value is 96.690, it means F value (96.690) > F
table (2.45) with significance probability of 0.000, and if it’s compared with 0.05
of α-value, the probability will be 0.000 < 0.05. Both coefficient of determination
and F-test prove that there is simultaneous significant influence of perceived risk,
consumer perception fit, reputation, and consumer innovativeness toward
purchase intention for Pond’s beauty products.
A. Perceived Risk
When a well-known brand do the brand extension, then the brand can be a factor
to reduce perceived risk, that brand also can be a signal of quality of products and
increase the possibility of consumers to accept the expansion products. (Hem,
Leslie, and Iversen N.M, 2001)
The significant value of perceived risk is 0.034 which is lower than α-value 0.05
so there issignificant influence of perceived risk toward purchase intention (based
on Table 4.15). Perceived risk gives influence because Pond’s beauty products
provide a complete information in the products, the product is a new product, and
products are important to consumers as itsstated in chapter II.
This result is familiar with the research of Rahmadhany (2011) about the
influence of brand extension toward purchase intention (a study of pepsodent

49
mouthwash). It is stated that perceived risk has significant influence toward
purchase intention.
B. Consumer Perception Fit
The higher the similarity that’s felt by consumers between expansion products and
parent brand, the higher the purchase intention of the expansion products.
The significant value of consumer perception fit is 0.046 which is lower than α-
value 0.05 so there is significant influence of consumer perception fit toward
purchase intention (based on Table 4.15). Based on chapter II about consumer
perception fit, it gives influence because the consumer feels higher compatibility
between products that are associated with the brand and its extension.
This result is familiar with the research of Khairunnisak and Firman (2015) about
the influence of brand extension dimensions toward purchase intention of Asus (a
study of Asus smartphone for UNP students) which is stated that consumer
perception fit has significant influence toward purchase intention.
C. Reputation
Brand reputation is an award earned by a brand from a company because of the
excellences of the company, such as the ability possessed by the company, so that
the company will continue to be able to develop itself and create new things to
fulfill consumer needs (Herbig et al. 1994).
The significant value of reputation is 0.771 which is greater than α-value 0.05 so
there is no significant influence of reputation toward purchase intention (based on
Table 4.15). Based on theory in chapter II, reputation has no influence toward
purchase intention because consumer prefer to choose products with higher
positive reputation and high quality of products.
It indicates that reputation does not determine the existence of purchase intention
on the consumer. This also means that the Jakarta’s residents do not consider
reputation when they want to buy a product. There might be other factors that
influence consumer purchase intention in Jakarta that are not examined in this
research, such as price and quality. Therefore, the results of this research are not
accordance with the research of Rahmadhany (2011) about the influence of brand

50
extension toward purchase intention (a study of pepsodent mouthwash). It is
stated that reputation has significant influence toward purchase intention.
D. Consumer Innovativeness
High consumer innovativeness is usually braver and has the intention to try new
products (Hem, Leslie, and Iversen N.M, 2001).
The significant value of consumer innovativeness is 0.000 which is lower than α-
value 0.05 so there is significant influence of consumer innovativeness toward
purchase intention (based on Table 4.15). Consumer innovativeness gives
influence to purchase intention because innovation is personality aspect associated
with consumer acceptance of a new ideas and desire to try brand new product,
then consumer with higher innovativeness personality tend to do more evaluation
on brand extension’s products as its stated in chapter II.
This result is familiar with the research of Rahmadhany (2011) about the
influence of brand extension toward purchase intention (a study of pepsodent
mouthwash). It is stated that consumer innovativeness has significant influence
toward purchase intention.

51
CHAPTER V
CONCLUSION AND RECOMMENDATION
In the last chapter of this research, the researcher will discuss the conclusion and
future recommendation that’s developed from quantitative analysis about the
influence of brand extension toward purchase intention for beauty products, a case
study of Pond’s beauty products in Jakarta. The analysis is conducted to discover
the specific impact of perceived risk, consumer perception fit, reputation, and
consumer innovativeness toward purchase intention.
5.1 Conclusion
Based on research result and discussion, it can be conclude as follow:
1. There is partial influence of brand extension which is perceived risk
toward purchase intention.
2. There ispartial influence of brand extension which is consumer perception
fit toward purchase intention.
3. There is no partial influence of brand extension which is reputation toward
purchase intention.
4. There is partial influence of brand extension which is consumer innovation
toward purchase intention.
5. There is simultaneous influence of brand extension (perceived risk,
consumer perception fit, reputation, and consumer innovativeness) toward
purchase intention.
5.2Future Recommendation
Based on the conclusions obtained in this study, the recommendations proposed as
a complement to the results of the study as follows:
1. For PT. Unilever Indonesia Tbk.:
Brand extension strategy which has done by PT. Unilever Indonesia Tbk. has been
very good because of the compatibility of the parent brand and brand expansion,

52
but it’s better for the company to market Pond’s beauty products even more
through electronic media and print media. It’s a must because there have been
many competitors that have equivalent quality with Pond’s and they try to pursuit
the fame that’s owned by Pond’s. If PT. Unilever Indonesia Tbk. promotes their
products in a variety of media, the consumer will be easier to get information, thus
increasing consumer knowledge about Pond’s beauty products and will help
reduce the risk of insecurity of consumers about the results and benefits that
would be obtained if they consume the products and it will also increase
consumer’s purchase intention.
2. For future researcher:
Future researchers can develop this research by examining other factors that might
influence purchase intention, such as intelligence factor or planning, and choose
different object of study by selecting service industry. Future researchers can also
use other methods in researching consumer purchase intention, for example
through in-depth interviews and observations, so that the information obtained can
be varied.

53
REFERENCES
Books
Assael, Henry (1992). Consumer Behavior and Marketing Action 4th ed. Boston.
Hair, Joseph F., Black, William C., Babin Barry J., and Anderson, Rolph E.
(2010). Multivariate Data Analysis, 7th ed. Prentice Hall.
Kotler, P., K.. L. Keller. (2009). Marketing Management 13th ed. New Jersey
Prentice Hall.
Keller, K, L. (2013). Strategic Brand Management: Building, Measuring, and
Managing Brand Equity 4th ed. England: Pearson Education Limited.
Schiffman, Leon G, and Leslie Lazar Kanuk. (2004). Consumer Behavior 8th ed.
New Jersey: Prentice Hall, Inc.
Sugiyono (2008). Metode Penelitian Bisnis. Bandung: Alfabeta.
Suharsimi Arikunto (2006). Prosedur Penelitian. Jakarta Rineka Cipta
Internet Articles
Dedesuryadi.blogspot.co.id (2014) Unilever’s strategy, from
http://dedesuryadi.blogspot.co.id/2014/12/merek-senior-ponds-unilever-
indonesia.html
Enotes.com (2010) Literature Study, from
https://www.enotes.com/homework-help/what-definition-literature-study-
onowhat-definition-137087
Investopedia.com (2016) Variance Inflation Factor, from
http://www.investopedia.com/terms/v/variance-inflation-factor.asp
Ksenijastrnad.blogspot.co.id (2015) Sampling Theory, from
http://ksenijastrnad.blogspot.co.id/2015/12/definition-of-population-
sample-and.html
Nilaindrsr.blogspot.co.id (2014) Vision and Mission of Unilever, from
http://nilaindrsr.blogspot.co.id/2014/01/visi-misi-dan-action
ptunilever_9.html
Obrolanurban.com (2015) Development of Jakarta, from
http://obrolanurban.com/moratorium-pembangunan-mal-di-jakarta-jangan-
jadi-macan-ompong/
Statisticssolutions.com (2013) Heteroscedasticity Test, from
http://www.statisticssolutions.com/homoscedasticity/
Swa.co.id (2015) Euromonitor International’s Survey, from
http://swa.co.id/swa/business-strategy/wow-indonesia-pasar-pertumbuhan-
utama-industri-kecantikan-asean
Teorionline.net (2015) Sampling Theory, from
http://teorionline.net/populasi-dan-sampel/
Teorionline.wordpress.com (2011) Normality Test, from
https://teorionline.wordpress.com/2011/04/02/uji-normalitas/
Topbrand-award.com (2012)Top Brand Award, from
http://www.topbrand-award.com/top-brand-survey/survey-result/top-
brand-index-2012
Topbrand-award.com (2013) Top Brand Award, from

54
http://www.topbrand-award.com/top-brand-survey/survey-result/topbrand-
index-2013
Topbrand-award.com (2014) Top Brand Award, from
http://www.topbrand-award.com/top-brand
survey/surveyresult/top_brand_index_2014
Topbrand-award.com (2015) Top Brand Award, from
http://www.topbrand-award.com/top-brand-survey/survey-
result/top_brand_index_2015_fase_1
Topbrand-award.com (2016) Top Brand Award, from
http://www.topbrand-award.com/top-brand-survey/survey-
result/top_brand_index_2016_fase_2
Udemy.com (2014) Regression Analysis, from
https://blog.udemy.com/regression-analysis/
Unilever.co.id (2016) About Unilever, from
https://www.unilever.co.id/about/who-we-are/our-history/
Unilever.co.id (2016), Unilever’s Achievement, from
https://www.unilever.co.id/news/press-releases/2016/Unilever-Indonesia-
Raih-Beragam-Penghargaan-Melalui-Program-Berkelanjutan-dan-
Inovasinya.html
Thesis
Ferista, Y (2014). Pengaruh Resiko yang Dipersepsikan dan Kepuasan
Konsumen terhadap Minat Beli pada Konsumen Kaskus Website di
Universitas Negeri Yogyakarta.
Gjertsen, D (2015). Brand Extensions : Influences of Perceived Fit and
Communication of Explanatory Links, Is a hybrid extension of an
American pony car feasible ?
Gunawan, H (2013). Pengaruh Brand Extention (Perluasan Merek)
terhadap Citra Merek (Brand Image) pada Produk Pasta Gigi (Studi
Kasus pada Konsumen Pepsodent di Kota Yogyakarta).
Rahmadhany, S (2011). Pengaruh Perluasan Merek terhadap Minat Beli
Konsumen (Studi pada Pepsodent Mouthwash).
Sampitri, D (2011). Pengaruh Iklan Televisi dan Persepsi Merek
terhadap Minat Beli.
Swisstiani, F (2014). Pengaruh Persepsi Harga, Efektivitas Iklan Internet,
dan Promosi terhadap Minat Beli pada Zalora Online Store.
Wahyuni, H (2013). Pengaruh Iklan dan Harga terhadap Minat Beli pada PT.
Darussalam Berlian Motor Mitsubishi Banda Aceh.
Journals
Gatti, L. Caruana, A. Snehota, I. (2012). The Role of Corporate Social
Responsibility, Perceived Quality, and Corporate Reputation on Purchase
Intention: Implications for Brand Management. Journal of Brand
Management. 20(1). 65-67.
Hong, Z and Yi, L (2012). Research on The Influence of Perceived Risk in
Consumer Online Purchasing DecisionKyung, Seo-Bo (2012). The Impact
of Consumer Innovativeness, Attitude, and

55
Subjective Norm on Cosmetic Buying Behavior: Evidence from APU
Female Student. Journal of Marketing Reserach.
Khairunnisak, R., Firman (2015). Pengaruh Dimensi Perluasan Merek
terhadap Minat Beli Produk Perluasan Merek Asus (Studi pada
Smartphone Asus oleh Mahasiswa UNP). ISBN : 978-602-17129-5-5.
Srivastava, K, and Sharma, N. (2011). Exploring The Multidimensional Role of
Involvement and Perceived Risk in Brand Extension. International Journal
of Commerce and management. 21(4). 410-427.
Sanjaya, W, et al (2016). PengaruhKualitas Produk dan Reputasi Merek
terhadap Kepuasan dan Loyalitas Pelanggan Mie Instan Merek Indomie
di Kota Denpasar. ISSN : 2337-3067.

56
APPENDIX 1
R-Table
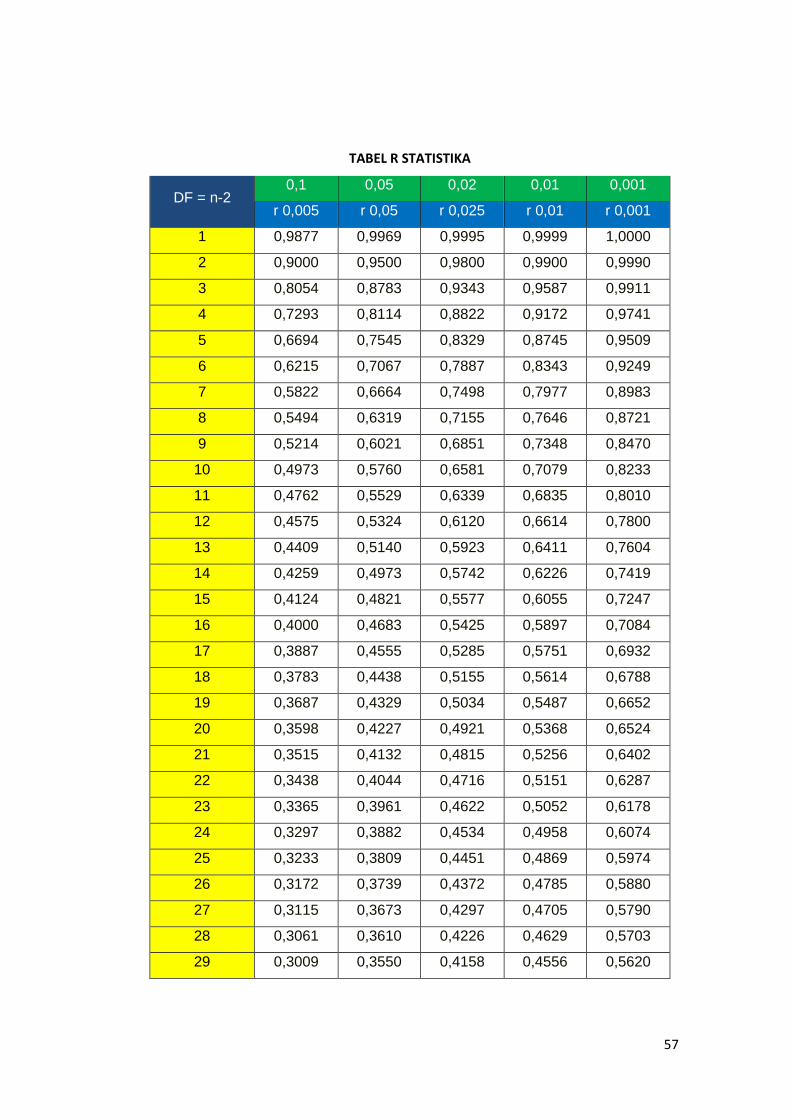
57
TABEL R STATISTIKA
DF = n-2 0,1 0,05 0,02 0,01 0,001
r 0,005 r 0,05 r 0,025 r 0,01 r 0,001
1 0,9877 0,9969 0,9995 0,9999 1,0000
2 0,9000 0,9500 0,9800 0,9900 0,9990
3 0,8054 0,8783 0,9343 0,9587 0,9911
4 0,7293 0,8114 0,8822 0,9172 0,9741
5 0,6694 0,7545 0,8329 0,8745 0,9509
6 0,6215 0,7067 0,7887 0,8343 0,9249
7 0,5822 0,6664 0,7498 0,7977 0,8983
8 0,5494 0,6319 0,7155 0,7646 0,8721
9 0,5214 0,6021 0,6851 0,7348 0,8470
10 0,4973 0,5760 0,6581 0,7079 0,8233
11 0,4762 0,5529 0,6339 0,6835 0,8010
12 0,4575 0,5324 0,6120 0,6614 0,7800
13 0,4409 0,5140 0,5923 0,6411 0,7604
14 0,4259 0,4973 0,5742 0,6226 0,7419
15 0,4124 0,4821 0,5577 0,6055 0,7247
16 0,4000 0,4683 0,5425 0,5897 0,7084
17 0,3887 0,4555 0,5285 0,5751 0,6932
18 0,3783 0,4438 0,5155 0,5614 0,6788
19 0,3687 0,4329 0,5034 0,5487 0,6652
20 0,3598 0,4227 0,4921 0,5368 0,6524
21 0,3515 0,4132 0,4815 0,5256 0,6402
22 0,3438 0,4044 0,4716 0,5151 0,6287
23 0,3365 0,3961 0,4622 0,5052 0,6178
24 0,3297 0,3882 0,4534 0,4958 0,6074
25 0,3233 0,3809 0,4451 0,4869 0,5974
26 0,3172 0,3739 0,4372 0,4785 0,5880
27 0,3115 0,3673 0,4297 0,4705 0,5790
28 0,3061 0,3610 0,4226 0,4629 0,5703
29 0,3009 0,3550 0,4158 0,4556 0,5620

58
APPENDIX 2
T-TABLE

59

60

61
APPENDIX 3
F TABLE

62

63
APPENDIX 4
QUESTIONNAIRE

64
“The Influence of Brand Extension toward Beauty Products”
(A Case Study of Pond’s in Jakarta)
Introduction to Questionnaire
Dear Respondents,
My name is Grace Yulia Christina, a last semester student majoring in
International Business Management of President University. It will be very
helpful for my research if you are willing to spare some of your times to fill up
this questionnaire. Thank you for taking the time to participate in data collection
for my thesis research about purchase intention. This survey will only take
approximately 5 minutes. All information given is confidential and will be strictly
used for academic purposes only.
Nama saya Grace Yulia Christina, mahasiswa semester akhir jurusan Manajemen
Bisnis Internasional di President University. Penelitian saya akan sangat terbantu
jika anda rela meluangkan waktu untuk mengisi kuesioner ini. Terimakasih karena
anda telah meluangkan waktu dan ikut berpartisipasi dalam pengumpulan data
untuk penelitian thesis saya tentang minat beli. Survei ini akan menghabiskan
waktu kira-kira 5 menit. Semua informasi yang diberikan adalah rahasia dan akan
benar-benar digunakan hanya untuk tujuan akademik.

65
SECTION I
--------------------------------------------------------------------------------
Name (Optional)
Do you live in Jakarta? (Apakah
kamu tinggal di Jakarta?”
a. Yes
b. No (If no, don’t continue to the
next question)
Have you ever been or currently
using Pond's face wash? (Apakah
kamu pernah atau sedang
menggunakan sabun cuci muka
Pond's?
a. Yes
b. No (If no, don’t continue to the
next question)
Do you ever use Pond's beauty
products? (Apakah kamu pernah
menggunakan produk kecantikan
Pond’s?)
a. Yes (If yes, don’t continue to the
next question)
b. No
Section II
--------------------------------------------------------------------------------
Respondent Profile
Gender a.Male (Laki-laki)
b. Female (Perempuan)
Age a. < 16 years old
b. 16 – 25 years old
c. 26 – 35 years old
d. 36 – 45 years old
e. > 45 years old
Education a. Senior High School (SMA)
b. Diploma (D3)

66
c. Bachelor (S1)
d. Master (S2)
e. Doctorate (S3)
Occupation a. Student (Siswa/Mahasiswa)
b. Employee (Karyawan)
c. Entrepreneur (Wirausaha)
d. Others (Yang lainnya)
Domicile a. North Jakarta (Jakarta Utara)
b. South Jakarta (Jakarta Selatan)
c. West Jakarta (Jakarta Barat)
d. East Jakarta (Jakarta Timur)
e. Central Jakarta (Jakarta Pusat)
Monthly Income a. ≤ Rp 500,000
b. ≥ Rp 500,001 - Rp 2,500,000
c. ≥ Rp 2,500,001 - Rp 4,500,000
d. ≥ Rp 4,500,001
Section III
--------------------------------------------------------------------------------
Filling Instructions
In this section, please choose the right statement based on your opinion. There
will be five options: (Pada bagian ini, pilihlah jawaban yang benar sesuai dengan
pendapat anda, akan tersedia lima pilihan)
1 : Strongly Disagree (Sangat Tidak Setuju)
2 : Disagree (Tidak Setuju)
3 : Neutral (Netral)
4 : Agree (Setuju)
5 : Strongly Agree (Sangat Setuju)
--------------------------------------------------------------------------------
A. Perceived Risk 1 2 3 4 5

67
The use of “Pond’s” name on Pond’s beauty products
convince me about the benefits that will be provided.
(Penggunaan nama "Pond's" pada produk kecantikan
Pond's meyakinkan saya tentang manfaat yang diberikan)
The use of “Pond’s” name makes me confident about the
quality of Pond’s beauty products.
(Penggunaan nama "Pond's" membuat saya percaya pada
kualitas dari produk kecantikan Pond's)
The use of “Pond’s” name on Pond’s beauty products
give certainty about the result that will be obtained if
using the products.
(Penggunaan nama Pond's pada produk kecantikan Pond's
memberikan kepastian tentang hasil yang akan diberikan)
The use of “Pond’s” name on Pond’s beauty products
convinces me when i want to choose the product in
beauty product category.
(Penggunaan nama "Pond's" pada produk kecantikan
Pond's meyakinkan saya ketika saya ingin memilih
produk di kategori produk kecantikan)
The use of “Pond’s” name on Pond’s beauty product
makes me sure that this product is safe to be used.
(Penggunaan nama "Pond's" pada produk kecantikan
Pond's membuat saya yakin bahwa produk tersebut aman
digunakan)
B. Consumer Perception Fit 1 2 3 4 5
Pond’s face wash and Pond’s beauty products can
complement each other in their use.
(Pond’s face wash serta produk kecantikan Pond’s dapat
saling melengkapi dalam penggunaannya)
Pond’s face wash and Pond’s beauty product have the

68
same function which is beauty care products for
consumer.
(Produk Pond’s face wash dan produk kecantikan Pond’s
memiliki kesamaan fungsi sebagai produk perawatan dan
kecantikan bagi penggunanya)
Pond’s face wash and Pond’s beauty products are in the
same product category which is beauty care products.
(Pond’s face wash dan produk kecantikan Pond’s berada
pada kategori produk yang sama yaitu produk perawatan
kecantikan)
In my opinion, using “Pond’s” name on Pond’s beauty
products can provide benefits as good as face wash
product.
(Menurut saya dengan menggunakan merek "Pond’s",
maka produk kecantikan Pond’s dapat memberikan
manfaat sebaik produk face wash)
Pond’s face wash and beauty product have the same
quality.
Pond's face wash dan produk kecantikannya memiliki
kualitas yang sama)
C. Reputation 1 2 3 4 5
Pond’s face wash has good reputation.
(Pond's face wash memiliki reputasi yang baik)
The high popularity of Pond’s face wash can increase the
popularity of Pond’s beauty products.
(Tingginya popularitas Pond’s face wash dapat
meningkatkan popularitas produk kecantikan Pond’s)
Pond’s face wash has a good reputation, so it encourages
me to choose Pond’s beauty products.
(Pond’s face wash memiliki reputasi yang baik, sehingga

69
mendorong saya memilih produk kecantikan Pond’s)
I think Pond’s face wash reputation can provide positive
influence on Pond’s beauty products.
(Menurut saya reputasi Pond’s face wash dapat
memberikan pengaruh yang positif pada produk
kecantikan Pond’s)
Good reputation of Pond’s face wash makes me confident
on the quality of Pond’s beauty products.
(Reputasi Pond's face wash yang baik membuat saya
yakin dengan kualitas produk kecantikan Pond's)
D. Consumer Innovativeness 1 2 3 4 5
Pond’s brand extension from face wash category to beauty
product fit with my personality who likes to try new
products.
(Perluasan yang dilakukan produk Pond’s dari kategori
face wash ke beauty product sesuai dengan kepribadian
saya yang suka mencoba produk baru)
Pond’s brand extension from face wash category to beauty
product fit with me who love to be trendsetter.
(Perluasan yang dilakukan produk Pond’s dari kategori
face wash ke beauty product sesuai dengan saya yang
senang menjadi trendsetter)
Pond’s brand extension from face wash category to beauty
product successfully made me curious to try these
products.
(Perluasan yang dilakukan produk Pond’s dari kategori
face wash ke beauty product berhasil membuat saya
penasaran untuk mencoba produk tersebut)
Pond’s brand extension makes me fascinated to try the
expansion products.

70
(Perluasan merek Pond's membuat saya tertarik untuk
mencoba produknya produk hasil perluasannya)
Pond’s beauty product fit with my personality who likes
to look for new experiences.
(Produk kecantikan Pond's sesuai dengan kepribadian
saya yang suka mencari pengalaman baru)
E. Purchase Intention 1 2 3 4 5
I would like to have Pond’s beauty products.
(Saya ingin memiliki produk kecantikan Pond’s)
I am interested to try Pond’s beauty products.
(Saya tertarik untuk mencoba produk kecantikan Pond’s)
I am considering to buy Pond’s beauty products.
(Saya mempertimbangkan untuk membeli produk
kecantikan Pond’s)
I am interested in finding information about Pond’s
beauty products.
(Saya tertarik untuk mencari informasi tentang produk
kecantikan Pond’s)
I would like to know more about Pond’s beauty products.
(Saya ingin mengetahui lebih banyak tentang produk
kecantikan Pond’s)
--------------------------------------------------------------------------------
THE END
Thank you so much ! ☺
71
APPENDIX 5
RAW DATA

72
PR1 PR2 PR3 PR4 PR5 PRT CP1 CP2 CP3 CP4 CP5 CPT
5 4 5 4 5 4.6 1 2 5 2 1 2.2
5 5 5 5 4 4.8 2 2 3 2 2 2.2
2 4 4 1 3 2.8 2 2 4 2 2 2.4
2 5 2 3 2 2.8 2 3 4 2 2 2.6
3 3 3 3 3 3 4 2 3 2 2 2.6
5 5 5 5 4 4.8 2 2 2 5 2 2.6
1 5 3 2 1 2.4 2 4 4 2 2 2.8
3 1 2 3 2 2.2 3 2 3 3 3 2.8
2 1 5 5 2 3 1 2 3 4 5 3
3 3 3 3 3 3 3 3 3 3 3 3
3 3 3 3 3 3 3 3 3 3 3 3
4 3 3 3 3 3.2 5 5 5 5 5 5
1 2 3 4 5 3 5 4 3 2 1 3
4 3 4 5 4 4 2 5 4 2 2 3
4 3 4 5 4 4 2 5 4 2 2 3
5 2 5 4 1 3.4 2 5 2 4 2 3
3 3 3 3 3 3 4 4 3 2 3 3.2
4 3 4 4 4 3.8 4 2 4 3 3 3.2
2 2 2 4 4 2.8 2 2 4 4 4 3.2
3 4 4 3 3 3.4 2 4 3 2 5 3.2
4 5 4 5 4 4.4 2 2 5 4 3 3.2
3 3 4 3 3 3.2 4 4 4 2 3 3.4
4 3 3 2 3 3 4 3 4 3 3 3.4
4 4 3 4 3 3.6 3 4 4 3 3 3.4
4 4 4 4 4 4 3 2 5 2 5 3.4
5 4 5 4 5 4.6 1 5 4 2 5 3.4
4 4 4 4 5 4.2 4 2 2 5 4 3.4
5 5 4 4 5 4.6 4 4 4 4 1 3.4
2 4 4 4 2 3.2 4 4 4 2 4 3.6
3 2 2 3 4 2.8 4 4 5 2 3 3.6
4 2 4 1 1 2.4 4 3 4 4 3 3.6
4 3 3 4 4 3.6 3 4 4 3 4 3.6
4 5 4 4 5 4.4 4 4 4 4 2 3.6
3 3 2 3 3 2.8 4 4 4 3 3 3.6
2 2 2 4 4 2.8 4 4 4 2 4 3.6
4 5 5 4 3 4.2 5 5 5 5 5 5
5 5 4 5 5 4.8 4 3 4 3 4 3.6
5 5 5 5 5 5 4 4 4 2 4 3.6
4 5 4 4 5 4.4 5 4 5 3 1 3.6
2 4 2 2 2 2.4 2 5 5 2 5 3.8
2 3 2 2 3 2.4 4 4 4 3 4 3.8
2 3 2 2 3 2.4 4 4 4 3 4 3.8
2 5 1 2 5 3.4 3 4 5 3 4 3.8
4 3 3 4 5 3.8 3 4 4 4 4 3.8
4 4 4 4 4 4 4 4 4 3 4 3.8
4 4 4 4 2 3.6 5 5 3 2 4 3.8

73
4 3 5 4 5 4.2 2 4 3 5 5 3.8
4 4 5 5 4 4.4 4 5 3 2 5 3.8
4 4 3 4 4 3.8 4 4 4 3 4 3.8
4 4 2 2 2 2.8 4 4 4 4 4 4
3 4 4 4 4 3.8 4 5 5 2 4 4
2 4 5 2 2 3 5 2 4 5 4 4
3 3 3 3 3 3 5 3 4 5 3 4
4 4 4 4 4 4 4 4 4 4 4 4
2 2 5 2 2 2.6 4 4 4 4 4 4
4 5 4 5 4 4.4 5 4 5 2 4 4
4 5 5 4 5 4.6 5 4 4 2 5 4
3 3 3 3 3 3 4 4 4 4 4 4
4 4 4 4 4 4 5 4 4 5 2 4
3 2 3 3 3 2.8 4 4 4 4 4 4
3 3 3 4 4 3.4 4 4 4 4 4 4
4 4 4 4 4 4 5 5 5 5 5 5
4 4 4 4 4 4 4 4 4 4 4 4
4 4 4 4 5 4.2 4 4 4 4 4 4
3 3 3 4 3 3.2 4 4 4 4 4 4
4 4 4 4 4 4 4 4 4 4 4 4
4 4 4 4 4 4 4 4 4 4 4 4
4 4 4 5 5 4.4 4 5 5 2 5 4.2
4 4 4 4 5 4.2 4 5 4 4 4 4.2
4 4 4 5 2 3.8 5 2 5 5 4 4.2
5 5 5 5 5 5 4 4 4 5 4 4.2
5 4 4 2 5 4 4 4 4 5 4 4.2
4 4 4 5 4 4.2 5 5 5 5 5 5
5 4 4 5 5 4.6 5 4 4 4 4 4.2
4 4 5 4 5 4.4 4 5 4 4 4 4.2
5 4 5 4 4 4.4 5 4 4 4 4 4.2
5 4 4 5 4 4.4 4 5 5 2 5 3.2
4 4 4 4 4 4 5 5 1 5 4 3
4 4 5 4 5 4.4 5 5 3 3 5 4.2
4 4 4 4 4 4 4 4 5 5 4 4.4
5 5 5 5 4 4.8 5 4 5 4 4 4.4
5 5 5 5 5 5 5 5 4 5 5 4.8
4 4 4 4 5 4.2 5 5 5 4 5 4.8
4 4 4 4 4 4 5 4 5 5 5 4.8
4 4 4 4 4 4 4 4 5 4 5 4.4
4 4 4 4 4 4 4 5 4 5 4 4.4
4 4 4 4 4 4 4 4 5 5 4 4.4
4 5 4 4 4 4.2 5 4 4 5 4 4.4
5 5 5 5 4 4.8 5 5 2 5 5 4.4
2 5 5 4 4 4 5 2 5 5 5 4.4
4 5 2 4 2 3.4 5 4 5 4 4 4.4
5 4 4 5 4 4.4 5 4 4 5 4 4.4
4 4 4 5 4 4.2 4 4 5 4 5 4.4

74
5 5 5 5 5 5 4 4 4 5 5 4.4
1 2 5 2 4 2.8 4 4 5 5 5 4.6
4 4 4 4 4 4 4 5 4 5 5 4.6
5 5 4 5 4 4.6 5 5 5 4 4 4.6
4 4 4 5 4 4.2 5 5 4 4 5 4.6
5 5 5 5 5 5 4 4 5 5 5 4.6
4 5 4 5 4 4.4 5 4 4 5 5 4.6
5 2 4 2 2 3 5 4 5 4 5 4.6
4 4 4 4 4 4 5 4 4 5 5 4.6
4 4 3 4 3 3.6 5 5 5 3 5 4.6
5 4 4 5 4 4.4 5 4 5 4 5 4.6
4 4 4 5 5 4.4 5 4 5 5 4 4.6
5 5 4 4 5 4.6 4 5 4 5 5 4.6
5 4 5 5 5 4.8 5 5 5 3 5 4.6
4 5 5 5 5 4.8 5 5 5 4 5 4.8
4 4 4 5 5 4.4 5 5 5 4 5 4.8
5 5 5 4 4 4.6 4 5 5 5 5 4.8
5 5 5 5 4 4.8 5 5 5 5 4 4.8
5 5 5 5 5 5 5 4 5 5 5 4.8
4 4 4 4 4 4 5 5 5 5 5 5
3 3 3 3 3 3 5 5 5 5 5 5
5 5 5 5 5 5 5 5 5 5 5 5
4 4 4 4 4 4 5 5 5 5 5 5
4 4 4 4 3 3.8 5 5 5 5 5 5
5 5 5 5 5 5 5 5 3 1 5 3.6
4 4 4 5 5 4.4 5 5 5 5 5 5
3 4 4 3 4 3.6 5 5 5 5 5 5
5 5 4 4 4 4.4 5 5 5 5 5 5
4 5 4 5 5 4.6 5 5 5 5 5 5
5 4 5 5 5 4.8 5 5 5 5 5 5
5 5 5 5 5 5 5 5 5 5 5 5
5 5 4 4 5 4.6 5 5 5 5 5 5
RE1 RE2 RE3 RE4 RE5 RET CI1 CI2 CI3 CI4 CI5 CIT
4 5 4 5 4 4.4 4 5 4 5 5 4.6
4 5 4 5 5 4.6 5 5 5 4 5 4.8
4 2 1 2 3 2.4 4 2 2 4 4 3.2
3 3 2 2 2 2.4 2 5 2 2 2 2.6
2 3 2 5 2 2.8 2 3 2 4 1 2.4
5 5 4 5 4 4.6 5 5 4 5 5 4.8
3 4 2 2 2 2.6 2 1 4 3 1 2.2
3 3 3 3 3 3 3 3 3 3 3 3
4 1 2 2 2 2.2 2 4 4 5 2 3.4
3 2 1 3 3 2.4 3 3 3 3 3 3
3 3 1 2 3 2.4 3 3 3 3 3 3
4 4 3 4 3 3.6 3 3 3 3 3 3

75
2 3 4 5 4 3.6 4 4 4 4 4 4
4 4 3 4 5 4 3 4 5 4 5 4.2
4 4 3 4 5 4 3 4 5 4 5 4.2
5 5 4 5 4 4.6 5 4 5 4 5 4.6
4 2 1 2 4 2.6 3 4 2 4 3 3.2
3 4 3 3 4 3.4 2 4 4 4 4 3.6
4 4 4 4 4 4 4 4 4 4 4 4
5 4 5 3 4 4.2 4 5 4 3 4 4
4 5 4 5 4 4.4 5 4 5 4 5 4.6
4 4 1 3 2 2.8 2 3 3 2 2 2.4
4 4 3 3 3 3.4 4 3 4 2 3 3.2
3 4 4 4 3 3.6 3 3 3 3 2 2.8
4 5 4 5 5 4.6 2 5 5 4 5 4.2
5 4 5 4 5 4.6 5 4 5 4 5 4.6
5 5 4 4 5 4.6 5 4 5 4 5 4.6
5 5 5 5 5 5 5 5 5 4 5 4.8
4 2 2 4 2 2.8 2 2 3 2 2 2.2
4 3 2 3 3 3 1 1 3 3 3 2.2
5 5 2 2 3 3.4 4 2 2 3 2 2.6
4 3 4 3 3 3.4 3 5 4 4 3 3.8
4 4 2 4 4 3.6 2 4 2 4 4 3.2
4 5 3 4 4 4 3 3 2 2 2 2.4
5 5 5 5 5 5 4 2 4 4 2 3.2
5 5 5 5 5 5 4 3 4 4 4 3.8
4 5 2 5 5 4.2 5 4 5 4 5 4.6
5 4 5 5 5 4.8 5 5 5 5 5 5
5 5 5 5 5 5 4 5 4 5 5 4.6
5 2 2 2 2 2.6 5 5 2 2 1 3
4 4 2 4 2 3.2 2 2 2 4 2 2.4
4 4 2 4 2 3.2 2 2 5 2 2 2.6
4 4 2 4 3 3.4 3 3 3 3 3 3
5 1 4 5 4 3.8 3 4 4 3 4 3.6
4 4 4 3 4 3.8 4 4 4 4 4 4
1 4 5 4 5 3.8 4 5 5 4 5 4.6
4 5 4 4 4 4.2 5 5 5 4 4 4.6
5 5 4 4 5 4.6 5 4 5 5 4 4.6
5 5 5 5 5 5 4 2 4 4 4 3.6
4 2 2 4 2 2.8 2 2 3 2 2 2.2
3 2 2 4 3 2.8 1 3 4 2 2 2.4
2 2 5 2 4 3 2 2 4 2 5 3
5 5 5 5 5 5 3 3 3 3 3 3
1 4 4 2 4 3 4 4 4 4 4 4
2 4 2 4 4 3.2 2 2 3 4 2 2.6
5 5 5 5 5 5 5 5 5 4 1 4
5 2 2 4 4 3.4 5 5 4 5 4 4.6
3 4 3 4 4 3.6 4 4 3 3 3 3.4
4 4 3 4 4 3.8 5 4 4 4 4 4.2

76
4 4 2 5 5 4 3 3 5 3 3 3.4
4 4 4 4 4 4 4 4 5 5 4 4.4
4 5 4 4 4 4.2 3 3 4 4 4 3.6
5 4 4 4 4 4.2 4 4 4 4 4 4
5 4 5 4 5 4.6 4 4 4 5 4 4.2
5 5 5 5 4 4.8 4 4 5 5 4 4.4
5 5 5 5 5 5 4 4 4 4 4 4
5 5 5 5 5 5 4 4 5 5 4 4.4
5 5 5 5 5 5 5 4 5 5 5 4.8
5 4 4 2 5 4 4 4 4 4 4 4
2 5 3 5 5 4 5 2 4 5 5 4.2
5 4 5 4 2 4 5 5 4 4 5 4.6
5 5 5 5 5 5 4 5 4 4 5 4.4
5 5 5 5 5 5 4 4 5 5 4 4.4
4 4 4 4 5 4.2 5 4 5 4 4 4.4
5 5 5 5 5 5 5 4 4 4 5 4.4
5 5 5 5 5 5 5 4 4 4 4 4.2
5 5 5 5 5 5 5 4 4 5 5 4.6
5 5 5 5 5 5 5 5 5 5 5 5
5 5 5 5 5 5 5 5 5 5 5 5
4 4 3 2 4 3.4 4 4 4 4 4 4
5 5 5 5 5 5 5 5 5 4 5 4.8
5 4 1 4 5 3.8 5 4 5 2 1 3.4
4 4 5 3 3 3.8 5 4 5 4 5 4.6
5 4 1 4 5 3.8 4 4 5 5 5 4.6
5 5 5 5 5 5 4 4 4 4 4 4
5 5 5 5 5 5 5 4 4 4 4 4.2
5 4 4 4 5 4.4 4 4 4 5 3 4
4 5 4 5 4 4.4 4 4 5 4 4 4.2
5 2 5 5 5 4.4 5 5 5 5 4 4.8
5 5 5 2 5 4.4 5 5 5 5 5 5
5 5 4 5 4 4.6 4 5 4 5 4 4.4
5 4 5 5 5 4.8 5 3 3 4 4 3.8
5 5 5 5 5 5 4 4 5 5 4 4.4
5 5 5 5 5 5 5 5 4 5 5 4.8
4 4 3 2 3 3.2 4 4 4 4 4 4
4 2 2 4 4 3.2 4 4 4 4 4 4
5 1 1 4 5 3.2 5 5 5 5 5 5
4 1 2 5 5 3.4 5 5 5 4 5 4.8
4 5 5 2 1 3.4 4 5 5 5 5 4.8
5 5 5 5 5 5 5 5 5 5 4 4.8
5 4 5 4 2 4 1 2 2 4 4 2.6
4 4 4 4 4 4 4 4 4 4 4 4
3 5 5 5 3 4.2 5 4 5 5 4 4.6
5 4 4 5 5 4.6 4 5 5 4 5 4.6
5 5 5 5 5 5 4 4 5 5 4 4.4
5 5 5 5 5 5 4 5 5 5 4 4.6

77
5 5 5 5 5 5 5 5 5 4 5 4.8
5 3 1 1 5 3 5 4 5 5 4 4.6
4 4 1 4 3 3.2 5 4 3 4 4 4
4 5 2 5 5 4.2 5 5 5 5 5 5
4 5 4 5 4 4.4 4 4 4 5 5 4.4
5 5 5 5 5 5 5 5 5 5 5 5
4 4 1 1 4 2.8 4 4 4 4 4 4
5 5 5 5 5 5 3 4 5 3 4 3.8
1 2 5 5 4 3.4 4 4 4 4 4 4
4 5 2 2 5 3.6 4 4 4 4 4 4
5 4 4 4 4 4.2 4 5 4 4 4 4.2
4 5 4 3 5 4.2 5 5 5 4 5 4.8
5 4 5 4 4 4.4 5 4 4 5 4 4.4
5 4 5 4 5 4.6 4 5 3 3 4 3.8
5 5 5 4 4 4.6 4 4 4 4 4 4
5 5 5 5 4 4.8 5 5 4 4 4 4.4
5 5 4 5 5 4.8 5 5 4 5 5 4.8
5 5 5 4 5 4.8 5 5 5 5 5 5
5 5 5 5 5 5 4 4 4 4 4 4
PI1 PI2 PI3 PI4 PI5 PIT
4 5 4 2 5 4
5 4 5 4 2 4
2 2 4 4 4 3.2
2 3 2 2 2 2.2
4 4 4 4 2 3.6
5 4 4 5 2 4
2 2 2 3 4 2.6
3 3 3 3 3 3
1 1 5 5 2 2.8
2 3 2 2 2 2.2
3 3 3 3 3 3
3 3 3 3 3 3
4 4 4 4 1 3.4
3 4 5 5 4 4.2
3 4 5 5 4 4.2
5 5 4 5 5 4.8
3 2 4 3 2 2.8
4 4 4 4 4 4
4 4 2 4 4 3.6
5 4 3 5 4 4.2
4 5 4 5 4 4.4
2 3 2 5 1 2.6
2 2 3 4 3 2.8
2 3 3 3 4 3
5 5 5 5 4 4.8

78
4 5 4 5 4 4.4
4 4 4 4 5 4.2
4 5 4 4 5 4.4
4 4 4 2 4 3.6
3 2 3 2 3 2.6
4 3 3 2 1 2.6
5 3 4 3 4 3.8
2 4 4 4 4 3.6
1 2 3 3 3 2.4
2 2 2 2 4 2.4
4 4 5 4 4 4.2
5 4 5 5 5 4.8
5 5 2 5 5 4.4
4 5 5 4 5 4.6
1 2 5 2 1 2.2
2 2 4 2 2 2.4
2 2 4 2 2 2.4
3 3 4 2 2 2.8
3 3 4 4 4 3.6
4 4 4 4 4 4
5 4 5 5 5 4.8
2 2 5 4 3 3.2
5 5 5 5 4 4.8
4 4 2 5 4 3.8
2 3 2 3 2 2.4
1 5 5 3 1 3
2 2 2 5 5 3.2
3 3 3 3 3 3
4 4 4 4 4 4
2 2 4 2 2 2.4
5 4 5 1 1 3.2
4 5 4 5 5 4.6
3 3 3 3 3 3
2 4 4 4 4 3.6
3 3 3 3 3 3
4 4 4 4 5 4.2
4 4 4 4 4 4
3 4 5 2 2 3.2
4 5 4 4 4 4.2
4 5 5 4 4 4.4
4 4 3 4 4 3.8
5 5 5 5 5 5
5 5 5 4 5 4.8
4 4 4 4 4 4
5 4 4 2 4 3.8
4 5 4 4 5 4.4
5 5 4 5 4 4.6

79
5 4 5 4 4 4.4
4 4 5 5 5 4.6
4 5 4 4 5 4.4
5 4 4 4 4 4.2
4 4 5 2 4 3.8
5 5 5 5 5 5
5 4 4 5 5 4.6
4 4 4 4 4 4
5 5 4 5 5 4.8
1 5 4 2 5 3.4
4 5 4 5 5 4.6
4 5 5 4 5 4.6
4 4 4 4 4 4
3 4 5 4 3 3.8
4 4 4 4 4 4
4 5 5 4 4 4.4
5 5 4 5 5 4.8
5 5 5 5 4 4.8
4 5 3 4 5 4.2
4 5 4 4 4 4.2
4 4 4 5 4 4.2
5 5 5 4 5 4.8
4 4 4 4 4 4
4 4 4 4 4 4
5 5 5 5 5 5
5 5 5 4 5 4.8
5 4 5 5 4 4.6
4 5 5 5 4 4.6
1 2 5 4 1 2.6
4 4 4 4 4 4
4 4 3 5 5 4.2
5 5 5 4 4 4.6
5 5 5 4 5 4.8
4 5 5 5 4 4.6
4 5 5 5 5 4.8
5 5 5 4 4 4.6
4 5 5 4 4 4.4
5 5 5 5 5 5
4 5 4 4 4 4.2
5 5 5 5 5 5
4 4 4 4 4 4
5 4 3 4 3 3.8
4 4 4 4 4 4
5 5 5 5 5 5
4 4 4 4 4 4
5 5 5 4 5 4.8
4 4 5 4 4 4.2

80
3 5 4 4 5 4.2
1 4 4 1 3 2.4
4 5 4 5 5 4.6
4 5 5 5 4 4.6
5 5 5 4 5 4.8
5 4 5 4 5 4.6