the influence of brand image, perceived price, …
TRANSCRIPT

THE INFLUENCE OF BRAND IMAGE,
PERCEIVED PRICE, PERCEIVED QUALITY, AND PERCEIVED VALUE
ON THE PURCHASE INTENTION IN THE FAST-FASHION INDUSTRY
(A Case Study of ZARA Fashion Product in Vietnam)
By
Ho Hoang Hiep ID
no. 014201400141
A Skripsi presented to the
Faculty of Business President University in partial
fulfillment of the requirements for Bachelor Degree
in Management
June 2018
ii i
iii
iv
ABSTRACT
The purpose of this research is to determine the influence of Brand Image, Perceived
Price, Perceived Quality and Perceived Value on consumer Purchase Intention of Zara
in Viet Nam. The research was conducted to identify whether all variables being
covered will have the influence on consumer purchase intention. Therefore, this
research aims to find out whether the following variables like Brand Image, Perceived
Price, Perceived Quality and Perceived Value could be the determinants of the
Customer Purchase Intention. This research focuses on Ho Chi Minh area considering
Zara mainly operates in, and also this city is the biggest city and has the most potential
customers. The researcher distributed questionnaires using the quantitative method and
spread it to 150 respondents who know Zara and have previous experience of Zara's
products. The researcher only focuses on teenage and young adult which is widely
recognized as the next consumer powerhouse. With data processing using SPSS 23.0,
the results revealed that the specific Brand Image, Perceived Price and Perceived
Product have a significant influence towards consumer purchase intention to buy Zara
products. Meanwhile, Perceived Value has no significant influence towards consumer
purchase intention to buy Zara products. Predictive ability of four variables on
consumer Purchase Intention towards Zara in Vietnam in this study was 70.1% while
the remaining 29.9% were affected by other factors not included in the research model
being studied. Overall, the research had achieved the objectives of the research as well
as brings recommendations to the managers of Zara Vietnam.
Keywords: Brand Image, Perceived Price, Perceived Quality, Perceived Value,
Purchase intention.
v
ACKNOWLEDGEMENT
Through this opportunity, I would like to thank to my Buddha who always gave me
blessing and strength to finish this thesis. Also, I would like to express my gratitude to
the people who always give their best support to me.
I would like to show my appreciation to my advisors – Mr. Hanif Adinugroho
Widyanto, S.E., M.M. and Mr. Sonny V. Sutedjo, SE., MM., who always listened to
me and gave me so many advices when I had trouble in my thesis. They always spend
their time to guide me to do the thesis step by step, share ideas and information to
support my topic in particular, my thesis in general. Thank you for everything Sir!
Huge thank should be delivered to my beloved family, to my father Ho Hoang Phung
and my mother Nguyen Thi Duong. Thank for their listening, understanding, and
sharing, encouraging and financial supporting. Thanks to them I can have motivation
to do the best this thesis. I really love them!
Specially thank to my closet cousin Phan Ho Tan Phat, who supported, encouraged,
helped and advised me too much during my thesis making and also in my life. Now,
we are far away from each other, but I hope we can gather as soon as we could. Thank
Cikarang, June 4th, 2018
Ho Hoang Hiep
vi
TABLE OF CONTENTS
PANEL OF EXAMINERS ............................................................................................. i
DECLARATION OF ORIGINALITY ........................................................................ iii
ABSTRACT ................................................................................................................. iv
ACKNOWLEDGEMENT ............................................................................................. v
TABLE OF CONTENTS ............................................................................................. vi
CHAPTER I ................................................................................................................... 1
INTRODUCTION ......................................................................................................... 1
1.1 Background .......................................................................................................... 1
1.2. Research Problem ................................................................................................ 6
1.3 Research Questions .............................................................................................. 6
1.4 Research Objectives ............................................................................................. 7
1.5 Research Benefits ................................................................................................. 7
1.5.1 For Management of Zara Vietnam ................................................................ 7
1.5.2 For future researchers ....................................................................................8
1.6 Limitation .............................................................................................................8
1.7 Thesis Organization .............................................................................................8
CHAPTER 2 .................................................................................................................. 9
LITERATURE REVIEW .............................................................................................. 9
2.1 Introduction ..........................................................................................................9
2.2 Brand image ....................................................................................................... 10
2.2.1 Relationship between Brand Image and Purchase Intention ....................... 11
2.3 Perceived price ............................................................................................... 12
2.3.1 Relationship between Perceived Price and Purchase Intention ................... 13
vii
2.4 Perceived quality ................................................................................................ 13
2.4.1 Relationship between Perceived Quality and Purchase Intention ............... 15
2.5 Perceived value 15
2.5.1 Relationship between Perceived Value and Purchase Intention .................. 16
2.7 Previous Research .............................................................................................. 17
2.8 Research Gap ...................................................................................................... 20
CHAPTER III .............................................................................................................. 21
RESEARCH METHODOLOGY ................................................................................ 21
3.1 Research Framework .......................................................................................... 21
3.2 Hypotheses ......................................................................................................... 21
3.3 Operational Definitions ...................................................................................... 22
3.4 Research instrument ........................................................................................... 25
3.4.1 Data collection ............................................................................................. 25
3.4.2 Design of questionnaire ............................................................................... 25
3.5 Sampling design ................................................................................................. 26
3.5.1 Population .................................................................................................... 26
3.5.2 Sampling method ......................................................................................... 26
3.5.3 Distribution of questionnaire ....................................................................... 27
3.5.4 Margin of Error ........................................................................................... 27
3.6 Data Analysis ..................................................................................................... 27
3.6.1 Reliability Test ............................................................................................ 27
3.6.2 Validity Test ................................................................................................ 28
3.7. Classical Assumption Testing ........................................................................... 30
3.7.1 Normality Test ............................................................................................. 30
3.7.2 Multicollinearity Test .................................................................................. 30

viii
3.7.3 Heteroscedasticity test: ................................................................................ 31
3.7.4 Autocorrelation test ..................................................................................... 31
3.7.5. Descriptive Testing ..................................................................................... 31
3.7.6 Multiple Regression Analysis...................................................................... 33
3.7.7 Testing the Hypothesis ................................................................................ 33
CHAPTER 4 ................................................................................................................ 36
RESEARCH RESULT AND DISCUSSIONS ............................................................ 36
4.1. Descriptive Analysis ......................................................................................... 36
4.1.1. Gender ........................................................................................................ 36
4.1.5 Income or Allowance per month ................................................................. 38
4.1.4. Descriptive Statistical Analysis of Variables ............................................. 39
4.2 Result of Validity and Reliability Testing .......................................................... 40
4.2.1 Result of Validity Testing ........................................................................... 40
4.2.2. Result of Reliability Testing ....................................................................... 43
4.2.3. Classical Assumption ................................................................................. 44
4.2.4 Hypothesis Testing ...................................................................................... 49
4.3 Discussions and Interpretation of Result ............................................................ 51
4.3.1 Influence of Brand Image on Purchase Intention ........................................ 52
4.3.2 Influence of Perceived Price on Purchase Intention .................................... 52
4.3.3 Influence of Perceived Quality on Purchase Intention ................................ 53
4.3.4 Influence of Perceived Value on Purchase Intention .................................. 53
4.3.5 Brand Image, Perceived Price, Perceived Quality, and Perceived Value
toward Purchase Intention .................................................................................... 54
ix
CHAPTER V ............................................................................................................... 54
CONCLUSION AND RECOMMENDATION ........................................................... 54
5.1 Conclusion .......................................................................................................... 54
5.2 Future Recommendations ................................................................................... 55
5.2.1 For Management of Zara Vietnam .............................................................. 55
5.2.3 For future researchers .................................................................................. 55
REFERENCES ............................................................................................................ 56
APPENDICES ............................................................................................................. 66
x
LIST OF TABLES
TABLE 3. 1 OPERATIONAL DEFINITIONS ............................................................ 17
TABLE 3. 2 LIKERT SCALE ..................................................................................... 21
TABLE 3. 3 CRONBACH’S ALPHA INTERNAL CONSISTENCY ........................ 23
TABLE 3. 4 CORRELATION COEFFICIENT RANGE STRENGTH TABLE .......24
TABLE 4. 1 DESCRIPTIVE STATISTICS RESULT ................................................. 38
TABLE 4. 2 CORRELATIONS TABLE ..................................................................... 39
TABLE 4. 3 BRAND IMAGE – VALIDITY RESULT ..............................................40
TABLE 4. 4 PERCEIVED PRICE – VALIDITY RESULT ........................................ 40
TABLE 4. 5 PERCEIVED PRICE – VALIDITY RESULT ........................................ 41
TABLE 4. 6 PERCEIVED VALUE – VALIDITY RESULT ...................................... 41
TABLE 4. 7 PURCHASE INTENTION – VALIDITY RESULT ............................... 42
TABLE 4. 8 RELIABILITY RESULT ......................................................................... 42
TABLE 4. 9 MULTICOLLINEARITY ........................................................................ 45
TABLE 4. 10 MULTIPLE REGRESSION TEST RESULT ....................................... 47
TABLE 4. 11 ANOVA TABLE, F-TEST SIGNIFICANCE RESULT ........................ 49
TABLE 4. 12 COEFFICIENT DETERMINATION (R2) RESULT ........................... 50
xi
LIST OF FIGURES
Figure 1. 1 Market Demand Of Clothing In Vietnam (2011 – 2018) ............................ 3
Figure 1. 2 Zara's Sales Decreases ................................................................................. 4
Figure 1. 3 Zara first shop in Vietnam 2016 .................................................................. 5
Figure 3. 1 Theoretical Framework. ............................................................................ 16
Figure 4. 1 Gender Of Respondents ............................................................................. 39
Figure 4. 2 Age Of Respondents .................................................................................. 40
Figure 4. 3 Education Level Of Respondents .............................................................. 41
Figure 4. 4 Income Or Allowance Per Month Of Respondents ................................... 42
Figure 4. 5 Histogram ...................................................................................................50
Figure 4. 6 Normal P-Plot Regression Standardized Residual .................................... 51
1
CHAPTER I
1.1 Background
INTRODUCTION
Fashion is an extensive topic, which can be used to sell products from several
categories. Hence, the term beyond the apparel industry reaches also accessories,
cosmetics, shoes and furnishing (Romeo, et al., 2013). The meaning of fashion depends
on the concept, and it can form different types of signs in the minds of the people
(Lerkpollakarn, 2012).
The term of fashion should not be confused with the definition of style that can exist
outside of the fashion season. Today consumers can browse different styles, for
example, on the internet, but what is the fashion depends on the attitudes and
perceptions of consumers. Fashion highlights are currently shown in street view to
convey status or success (Lerkpollakarn, 2012). Despite the breadth of the term
fashion, this study focuses on the customer's intention to buy because it is the primary
product categories of the company Zara case. After all, the clothes represent a lot of
issues to dominate the fashion industry in general (Clamp, 2015).
According to Jackson and Shaw (2015), fashion industry includes unique design as
well as the production of goods such as textiles, clothing, fur products, jewelry, and
other accessories. Fashion linking elements of modern technology, strategic branding
and successful business model. Unstable in the preferences of consumers, arising from
uncontrollable factors, is also familiar to the industry (Lerkpollakarn, 2012). These
factors include the weather, the influence of the pioneers of fashion and fads develop
quickly through the media (Jackson & Shaw, 2015) In other words, the behavior and
the expectations of consumers are difficult to predict, and this poses challenges for
fashion retailers. Therefore, the success of a fashion designer depends on the creativity
and innovation (European Commission, 2015). The fashion industry is highly
competitive and visual features are essential factors in the retail fashion (Lea-
Greenwood, 2015).
2
Most fashion products are using only a piece of the fashion industry can be described
as disposable (Lerkpollakarn, 2012).Rapid changes are specific to the fashion industry,
and therefore the success and failure are often associated with the flexibility of the
organization. Short life cycle, high volatility, low predictability and high impulse
purchase are factors typical in the industry (Romeo, et al., 2013). Rhythm season
throughout the year is an expectation (Malen, 2012) and the seasonal sales vary
between countries depending on the needs of consumers (Lerkpollakarn, 2010).
Typically, the season is divided into autumn/winter and spring/summer, which could
be problematic for the designer from their cash flow is not stable throughout the year
(Malen, 2012).
To prove the weight of industry fashion maintained in the field today, in 2015, the
clothing world and textile industry reached nearly $ 3,470 trillion, and regional
women's wear is expected to pass $ 621 billion in 2019. In just one year, the US spent
$ 280 billion in consumer fashion (Fashion Industry statistics, 2015). The massive
dollar shows how big the role of the fashion industry plays in the consumption patterns
of people worldwide.
According to Fletcher (2008), Fast fashion is a business model is rapidly taking over
the industry. Fast fashion company focused on creating a significant amount of
inventory as quickly and cheaply as possible; products are sold at low prices with
inventory turnover quickly. Styles are based on fads and the latest trends, and
companies rely on anchoring trend to ensure that consumers are not interested in the
"completely disposable" quality (Fletcher, 2008).
Fast fashion works on a product sales cycle much faster than with traditional models,
including the collection each year 2-4. Instead of providing new products every 3-4
months, the fashion company quickly provide new products every 2-4 weeks. These
products must be current with the popular trend, so the process moves from design to
store shelves is shortened considerably (Fletcher, et al., 2010).

3
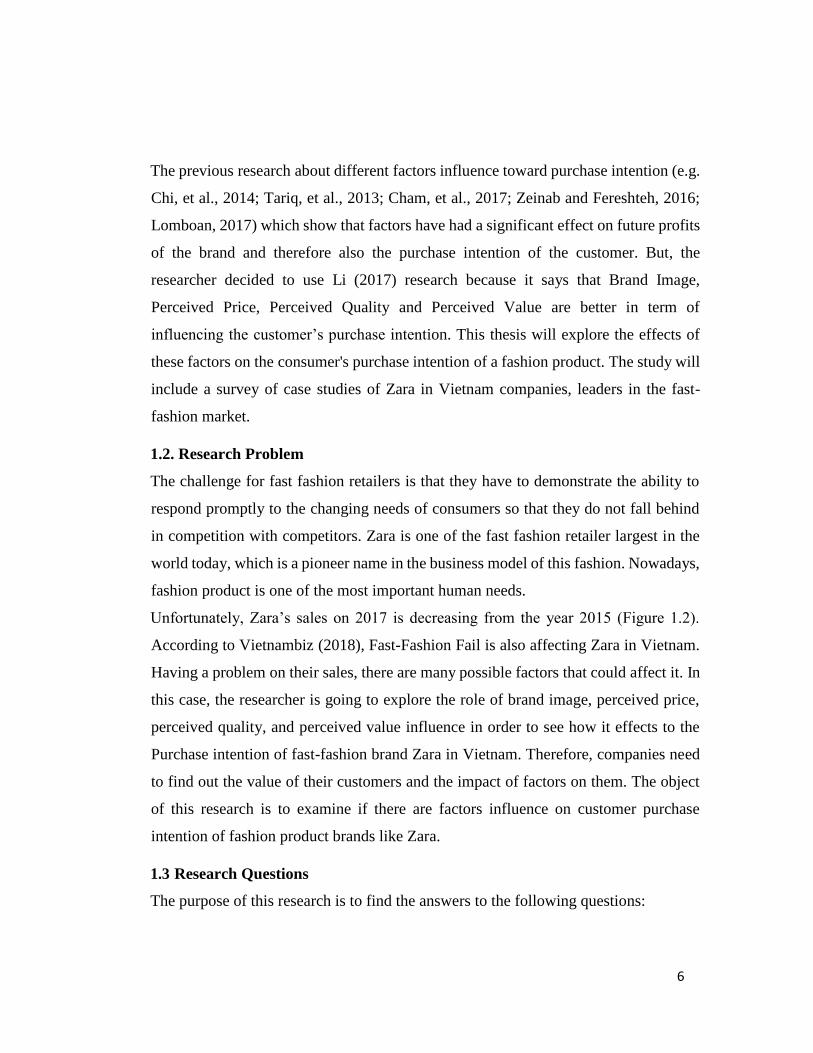
According to The Statistics Portal (2018), the number of clothing demand in Vietnam
keep increasing from 2014-2018 (Figure 1.1).
Figure 1. 1 Market demand of clothing in Vietnam (2011 – 2018)
Source: The Statistics Portal (2018)
According to Figure 1.1, Vietnam is in the golden age of clothing industry. On average,
Vietnamese spend VNĐ100 trillion (US$4.05 billion) on clothing every year (Ly,
2017).
Vietnam is an attractive market for production and business of textile and garment
enterprises abroad. Vietnam has the third largest number of people with a passion for
branded clothes in the world after China and India. Therefore, Fast fashion brands such
as Zara, H & M, Topshop, Uniqlo, are trying to take over the fashion market in Vietnam
(Ly, 2017) .
An excellent case study of a fast fashion company that is Zara in Vietnam, Spain
retailers, which offers new products for middle-class customers. Zara changes the
collection every two weeks. Although Zara producing collections mainly in Spain, its
price is low. Zara's secret of success is in the process rather than in their products. Zara
produces small sets of clothing to minimize risk (Malen, 2013) and close to allow fast-

4
moving source (Bruce & Daly, 2014). A change in the industry is the increasing
number of old dealers selling fashion products are used. The second side has become
popular as recycling and green values another uptrend. (Okonkwo, 2010)
The e-commerce boom making fashion items become cheaper, faster changes and
strong impact on the trading company as Inditex (the owner of Zara, Pull&Bear, etc.).
Recognizing this, this company who owns the Zara brand has invested heavily in the
online business, opened fewer stores but with larger, more luxurious. However, experts
say that each is not enough to prevent the momentum of sales decline in the coming
time.
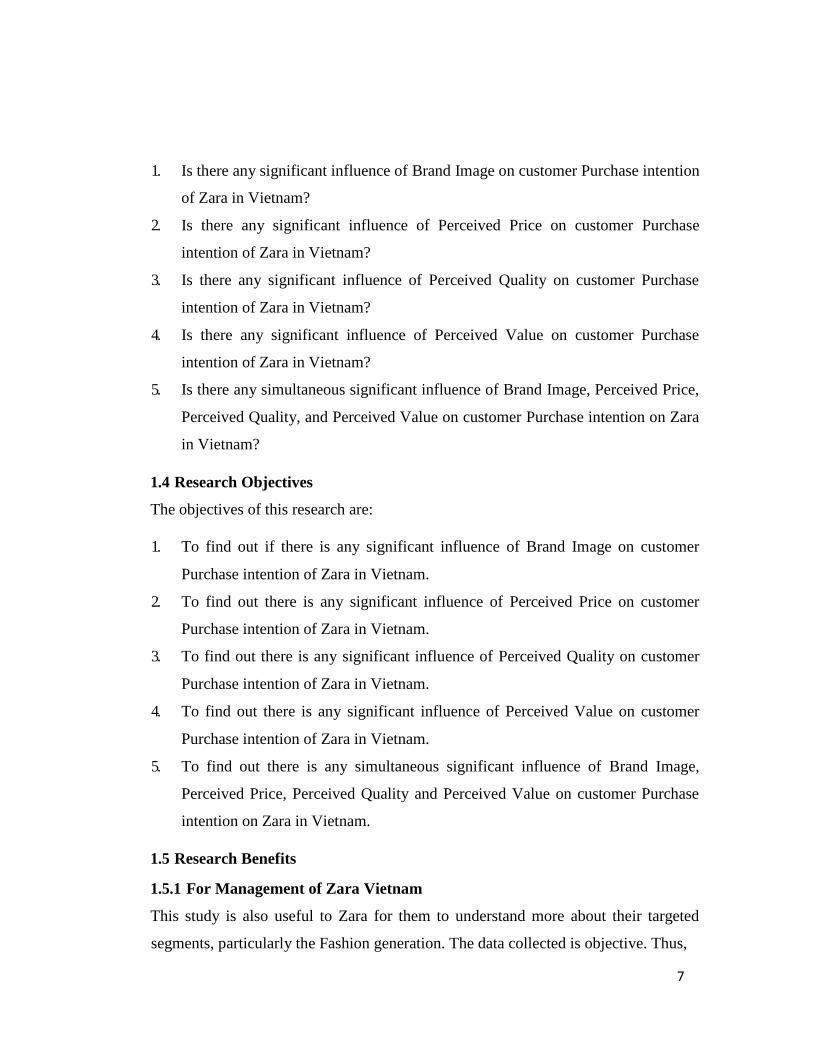
Figure 1. 2 Zara's sales decreases
Source: The Bloomberg (2017)
According to Bloomberg (2017), the strongest decrease in the company's quarterly
sales for at least a decade, sending shares down as much as 16 per cent, the most in
17 years. ZARA's gross margin narrowed to 56.3% in January 2018 due to the adverse
impact of the currency exchange rate. Similar revenue increased 5% in the second half,
the slowest in the past three years (Vietnambiz, 2018).
5
Even though the demand of fashion product is increasing yearly (Figure 1.1), Zara’s
sales still decreased from 2015 to 2017 (Figure 1.2). This raises the concern to find out
what factors influencing purchase intention of the customers in this market.
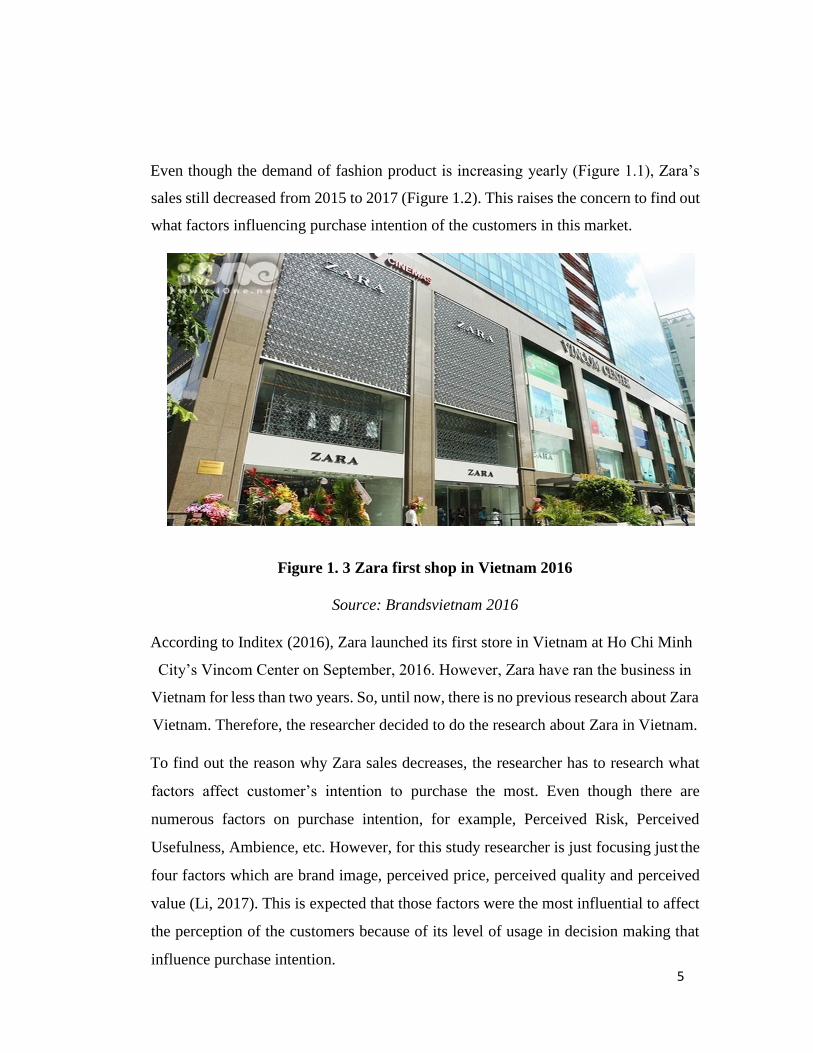
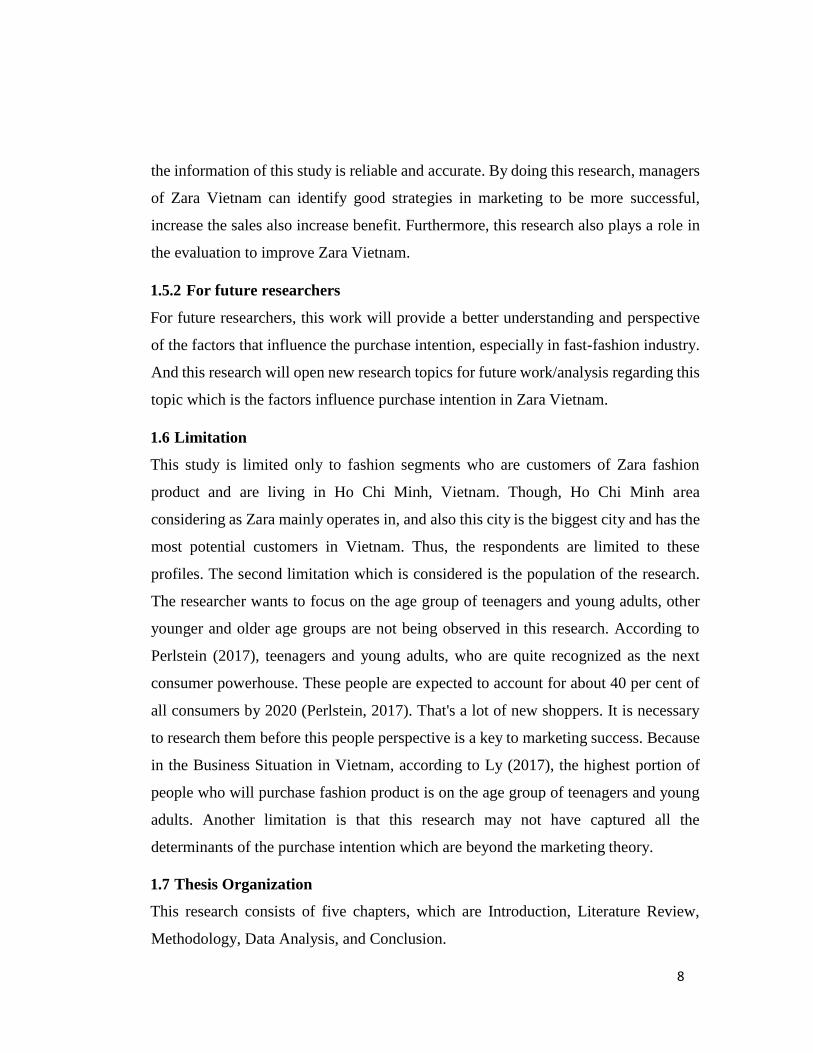
Figure 1. 3 Zara first shop in Vietnam 2016
Source: Brandsvietnam 2016
According to Inditex (2016), Zara launched its first store in Vietnam at Ho Chi Minh
City’s Vincom Center on September, 2016. However, Zara have ran the business in
Vietnam for less than two years. So, until now, there is no previous research about Zara
Vietnam. Therefore, the researcher decided to do the research about Zara in Vietnam.
To find out the reason why Zara sales decreases, the researcher has to research what
factors affect customer’s intention to purchase the most. Even though there are
numerous factors on purchase intention, for example, Perceived Risk, Perceived
Usefulness, Ambience, etc. However, for this study researcher is just focusing just the
four factors which are brand image, perceived price, perceived quality and perceived
value (Li, 2017). This is expected that those factors were the most influential to affect
the perception of the customers because of its level of usage in decision making that
influence purchase intention.
6
The previous research about different factors influence toward purchase intention (e.g.
Chi, et al., 2014; Tariq, et al., 2013; Cham, et al., 2017; Zeinab and Fereshteh, 2016;
Lomboan, 2017) which show that factors have had a significant effect on future profits
of the brand and therefore also the purchase intention of the customer. But, the
researcher decided to use Li (2017) research because it says that Brand Image,
Perceived Price, Perceived Quality and Perceived Value are better in term of
influencing the customer’s purchase intention. This thesis will explore the effects of
these factors on the consumer's purchase intention of a fashion product. The study will
include a survey of case studies of Zara in Vietnam companies, leaders in the fast-
fashion market.
1.2. Research Problem
The challenge for fast fashion retailers is that they have to demonstrate the ability to
respond promptly to the changing needs of consumers so that they do not fall behind
in competition with competitors. Zara is one of the fast fashion retailer largest in the
world today, which is a pioneer name in the business model of this fashion. Nowadays,
fashion product is one of the most important human needs.
Unfortunately, Zara’s sales on 2017 is decreasing from the year 2015 (Figure 1.2).
According to Vietnambiz (2018), Fast-Fashion Fail is also affecting Zara in Vietnam.
Having a problem on their sales, there are many possible factors that could affect it. In
this case, the researcher is going to explore the role of brand image, perceived price,
perceived quality, and perceived value influence in order to see how it effects to the
Purchase intention of fast-fashion brand Zara in Vietnam. Therefore, companies need
to find out the value of their customers and the impact of factors on them. The object
of this research is to examine if there are factors influence on customer purchase
intention of fashion product brands like Zara.
1.3 Research Questions
The purpose of this research is to find the answers to the following questions:
7
1. Is there any significant influence of Brand Image on customer Purchase intention
of Zara in Vietnam?
2. Is there any significant influence of Perceived Price on customer Purchase
intention of Zara in Vietnam?
3. Is there any significant influence of Perceived Quality on customer Purchase
intention of Zara in Vietnam?
4. Is there any significant influence of Perceived Value on customer Purchase
intention of Zara in Vietnam?
5. Is there any simultaneous significant influence of Brand Image, Perceived Price,
Perceived Quality, and Perceived Value on customer Purchase intention on Zara
in Vietnam?
1.4 Research Objectives
The objectives of this research are:
1. To find out if there is any significant influence of Brand Image on customer
Purchase intention of Zara in Vietnam.
2. To find out there is any significant influence of Perceived Price on customer
Purchase intention of Zara in Vietnam.
3. To find out there is any significant influence of Perceived Quality on customer
Purchase intention of Zara in Vietnam.
4. To find out there is any significant influence of Perceived Value on customer
Purchase intention of Zara in Vietnam.
5. To find out there is any simultaneous significant influence of Brand Image,
Perceived Price, Perceived Quality and Perceived Value on customer Purchase
intention on Zara in Vietnam.
1.5 Research Benefits
1.5.1 For Management of Zara Vietnam
This study is also useful to Zara for them to understand more about their targeted
segments, particularly the Fashion generation. The data collected is objective. Thus,
8
the information of this study is reliable and accurate. By doing this research, managers
of Zara Vietnam can identify good strategies in marketing to be more successful,
increase the sales also increase benefit. Furthermore, this research also plays a role in
the evaluation to improve Zara Vietnam.
1.5.2 For future researchers
For future researchers, this work will provide a better understanding and perspective
of the factors that influence the purchase intention, especially in fast-fashion industry.
And this research will open new research topics for future work/analysis regarding this
topic which is the factors influence purchase intention in Zara Vietnam.
1.6 Limitation
This study is limited only to fashion segments who are customers of Zara fashion
product and are living in Ho Chi Minh, Vietnam. Though, Ho Chi Minh area
considering as Zara mainly operates in, and also this city is the biggest city and has the
most potential customers in Vietnam. Thus, the respondents are limited to these
profiles. The second limitation which is considered is the population of the research.
The researcher wants to focus on the age group of teenagers and young adults, other
younger and older age groups are not being observed in this research. According to
Perlstein (2017), teenagers and young adults, who are quite recognized as the next
consumer powerhouse. These people are expected to account for about 40 per cent of
all consumers by 2020 (Perlstein, 2017). That's a lot of new shoppers. It is necessary
to research them before this people perspective is a key to marketing success. Because
in the Business Situation in Vietnam, according to Ly (2017), the highest portion of
people who will purchase fashion product is on the age group of teenagers and young
adults. Another limitation is that this research may not have captured all the
determinants of the purchase intention which are beyond the marketing theory.
1.7 Thesis Organization
This research consists of five chapters, which are Introduction, Literature Review,
Methodology, Data Analysis, and Conclusion.
9
Chapter 1 provides the overview of the entire research study which contains research
background and need for education, followed by problem statement, research
questions, and objectives, the significance of the study, limitation and thesis
organization. Chapter 2 is the review of the literature on each variable and research
gap. Chapter 3 consist of research framework, hypotheses, operational definitions,
research design and sampling plan. Chapter 4 consist of descriptive analysis and
inferential analysis. And the last is Chapter 5, which consist of the conclusion of the
research.
CHAPTER 2 LITERATURE
REVIEW
2.1 Introduction
The purpose of the literature review is to assess existing document and explain the
concepts related to this thesis. The topic has been reviewed and analyzed in a limited

10
number of academic sources. The following will describe the activities of factors
marketing and their influence, purchase intent, and the conceptual framework showing
the relationship between the structures.
Basically, “literature review of a research” is the process of search and analysis
information (information, data, concepts, doctrines, theories, results, conclusions)
related to the research topics to provide extensive insight that previous researchers
mentioned, and moreover, knowing what tasks will be carried out. In this study,
literature review discussed Brand Image, Perceived Price, Perceived Quality and
Perceived Value and how they can influence the Purchase Intention on Zara’s customer
in Vietnam.
2.2 Brand image
According to (Foster, 2016), consumers are buying brands by different motives. One
of the most important factors is associated with a brand, known as brand image (Tariq,
et al., 2013). Brand image is defined as subjective, but consumer awareness argument
or emotion related to specific brands (Cham, et al., 2017). Therefore, the brand image
is everything consumers associate with a brand (Shirin & Kambiz, 2011).
Brand image determines the company's opinion position (Abhigyan, 2014). The image
is the result of the work experience, the value of the consumer, and all the external
factors that affect the performance of specific companies (Warat, 2014). Trends never
become obsolete (Ana & Juracy, 2015). However, the brand image holds different
meaning since it was introduced. Different researchers have different definitions of the
brand image depends on the time, place, and person (Yeh & Chi, 2009). Brand image
determines consumer perceptions that leave some memories in the minds of consumers
(Yu, et al., 2013). Different consumers can easily recognize companies with strong
brands, so it plays an important role in the market concerned trade (Sandeep &
Prasanna, 2016). Kotler and Keller (2006) said that company with strong brand image
and provide an identity for the product, and consumers hold different views and

11
understanding of the product based on the brand image. Demand for similar products
can vary because of the brand image in the market (Lee‐Young Min, 2008).
According to Diamantopoulos (2011), brand image determines the position of the
company in the market, and for that company needs an effective strategic plan.
Companies should focus on the needs of consumers and the desire for better brand
positioning in the market (Nikolaos, et al., 2015). The image that defines a company
promises made to consumers related to the service, price, and quality attributes. Brands
with strong visuals can help in convincing consumers to buy the company's brand
(Diamantopoulos, 2011). For example, Zara is concerned about making money, they
facilitate their consumers by bringing about rapid change in products regarding design,
color, quality and service. Arslan (2014) told that Brand image depends upon the actual
image of the firm in consumers’ mind. A unique set of association in the mind of
consumers communicates expectations. Image creation is considered essential for
customer attraction and retention (Arslan, 2014).
2.2.1 Relationship between Brand Image and Purchase Intention
A consumer purchase intention most often depends on brand image rather than physical
characteristics of brand (Graeff, 1997). Murphy describes the life cycle of brand. He
says there are three stages of brand cycle. The last or the third stage of brand cycle is
image building stage. Here the image of brand builds (Dennis, et al.,
2004). Consumers have evoked set of brands, while choosing a brand the image help
consumer in purchase intention. Image of a brand differentiate the brands from
competitor’s brands (Arslan, 2014).
Wang and et al., (2015) told in his research that consumers are demanding expensive
brands due to change in purchase behavior as well as due to their increased purchasing
power. Brand with strong image has higher purchase intention (Garretson & Clow,
1999). Many consumers mean that the company succeeds in gaining product benefits
(Mehmood & Shafiq, 2015). The brand image helps consumers determine the purchase
12
process whether the brand was created for him/her. It will often influence the purchase
intention of the consumer and other brand aspects (Kotler & Keller, 2006).
According to Hsieh and Setiono (2004) successful brand image enables consumers to
identify the satisfaction of a brand, compare the difference between the brands from its
competitors and increases the chances for consumers to repurchase the brand. This
means that nowadays people expect the product with a perfect brand image so it can
influence them to repurchase the brand (Tee, et al., 2015). Also, when they have
positive feelings of satisfaction, it can guide them to have an intention to purchase, and
it can also guide them to be the first brand that they choose when they want to purchase
the next time (Tee & Chan, 2013). For example, is when consumer purchase television
with Sony, then they have a positive feeling of satisfaction. It will guide them to
purchase another product created by Sony for next purchasing. This is the positive
impact that brand image will make customer has purchase intention habit (Tee, et al.,
2015).
2.3 Perceived price
According to Ana and Juracy (2015), Price is a very sensitive variable in marketing
that affects both sales and profits and is also evident in the fashion sector. Price is the
sacrifice needed to buy or acquire products, and also a monetary sacrifice is necessary
to make a purchase, although this sacrifice is the currency (Joo & Sun, 2015).
From the perspective of consumers, the price includes a specific range of the price that
consumers are willing to pay, falls between a lower standard (e.g., for reasons of
quality) and a higher threshold (e.g., poor value for money), and that there is a certain
flexibility in the price range (Warat, 2014). Consequently, the influence of perceived
price on buying intention is not surprising, especially in emerging markets, where
prices may play an important role (Sharon & Zuraidah, 2014). Consumers in emerging
markets are price conscious, and cost-benefit analysis plays an important role
(Abhigyan, 2014).
13
In some studies, the perceived price is integrated instead of the actual price (Kashyap
& Bojanic, 2000). Links cognitive price for 'reasonable' price, rather than the actual
price accurately, and grasp the extent to which consumers perceive the price as is
consistent with the product or value for money, can differences between consumers
(Justin & Natalia, 2014). Perceived price is a structure located between perceived value
and actual value (Oosthuizen, et al., 2015).
2.3.1 Relationship between Perceived Price and Purchase Intention
According to Setiawan and Achyar (2012), Price plays an important role in valuation
judgment and determining whether to buy or not. Therefore, Perceived price is also
likely to have a direct effect on purchase intentions.
Purchase intention is usually affected by perceived price and value for money
(Nikolaos, et al., 2015). Many studies have highlighted the importance of perceived
price in the process of decision-making, is considered one of the factors deciding the
most important consumer with consumers purchase intention (Justin & Stephen, 2015).
This study will incorporate perceived price, which linked more to the reasonableness
of the price (Le & Tuan, 2013). And will match the price in a way that perceived price
affect significantly purchase intention fast fashion brands, and that the positive
perception positively influence purchase intention (Zeinab & Fereshteh, 2016).
2.4 Perceived quality
According to Yee and San (2011), Perceived quality is one of the most critical factors
is the basis for the success of the current manufacturers. In the fashion industry, the
perceived quality of an object is determined by how the production and assembly
tolerances and the impact of the image quality of an object (Gopal, 2015). Research on
Perceived Quality is a growing field between manufacturers and to compensate the
drive for production efficiency and cost compared to the demand to produce the highest
quality products (Grunerta, et al., 2010). Design quality delivery of products from the
earliest stage, reacting to ideas styles quickly and apply the initial studies of material
14
rather than trying to design it while avoiding the challenges later (Hazlin & Nurazariah,
2016).
Perceived quality becomes "estimates made by the consumer based on the entire
facility as well as the external dimension of the product or service" (Grunerta, et al.,
2010).
Perceived quality may be defined as the subjective reaction to some apparent
characteristics of a product (Smith, 2010). It should be considered in perception and
expectations of consumers based on their assessment of the properties of the product
(Lomboan, 2017). Perceived quality is the consumer's assessment of the superiority or
excellence of a product (Steenkamp & de Jong, 2011). However, a significant point to
focus on is the quality feel is certainly different from the objectivity, quality products
based on quality and production (Li, 2017). Instead, perceived quality is a more
abstract concept which refers to the perception of the customer first (Joo & Sun, 2015).
Therefore, we always see as the perceived quality of the product images in the minds
of consumers (Zeinab & Fereshteh, 2016). Perceived quality is the consumer's
assessment of the superiority or excellence of a product (Verleye, 2015).
Perceived quality is a critical element for consumer decision making; consequently,
consumers will compare the quality of alternatives with regard to price within a
category (Jin & Kang, 2011). In consumer mind, quality is very important thing for
them. Before they make a decision to purchase, they will evaluate the quality of the
product first (Tee, et al., 2015). Then they will think about the price of the product. If
they think the product quality is make sense with the price, and then they will make
decision to purchase (Tee, et al., 2015). But some of consumer will compare two
products with same type (Hazlin & Nurazariah, 2016). For example, is when consumer
purchase shirt, then they will find another shirt and compare it. After all, they will
choose the shirt based on the quality and price as well (Tee, et al., 2015).
15
2.4.1 Relationship between Perceived Quality and Purchase Intention
Perceived quality is found to affect purchase intentions in different contexts and
between different types of products (Joseph, et al., 2000). For example, (Hazlin &
Nurazariah, 2016) see the perceived quality is an important driving force of intent to
buy for foreign goods in emerging markets. Perceived quality has a positive impact
and significant purchase intent for the fashion industry (Gopal, 2015).
Perceived quality directly influences purchasing intention (Yeh & Chi, 2009), and
states where consumers can buy a fashion product when they perceive that the fashion
product brand provides the right quality or features (Sandeep & Prasanna, 2016). Refer
to the study of Tee and Chan (2013), Perceived Quality has huge impact on the market
and for consumer as well. The reason behind the Perceived Quality is made consumer
has felt the product has good quality and also to build purchase intention among
consumers (Li, 2017).
2.5 Perceived value
Customer perceived value is defined as the overall consumer rating in the utility of a
product based on the perception of what is being received and what is given (Zeithaml,
1988).
According to Kuo and Chia (2018), people value events based on their value system.
Perceived value refers to the perception of the buyer in the utility provided by a given
product (Kuo, 2013; Hsi & Kuo, 2010). Perceived value can be enhanced by increasing
the benefits provided or reduce the sacrifice necessary (Zeinab & Fereshteh, 2016).
Joffre and Jillian (2000) used the logic model to analyze the influence of customer
perceived value on purchase intention of consumers in the industry of retail and found
that customers value different perceptions have different buying behavior. In fact,
many researchers considered the value perceived an important factor for companies
marketing (Shu & Pascale, 2006; Joseph, et al., 2000; Minna, 2005). That is because
the perceived value may be a difference and competitiveness for a company (Korda &
Snoj, 2007).
16
2.5.1 Relationship between Perceived Value and Purchase Intention
Perceived value has been argued to be the most important indicator to forecast purchase
intentions and has been viewed as one of the most important measures for gaining a
competitive advantage (Zeithaml, 1988). According to Wang (2016), Perceived value
represent a trade-off between the perceived quality or benefits in the product relative
to the perceived sacrifice by paying the price. It plays an important role in purchase or
consumption decisions. Many scholars have considered that perceived value is relevant
to the emotional responses and consumption experiences of consumers, which can
further influence the consumer’s purchase intention (Wang, et al., 2015). When other
things remain unchanged, perceived value has a positive impact on purchase intention
(Chen, 2012; Wu, et al., 2014; Yee and San, 2011).
2.6 Purchase Intention
Purchase intention is an implied promise to one's self to repurchase the product
whenever a subsequent trip to the market is made (Tariq, et al., 2013). It has vital
importance because the company wants to increase sales of specific products with the
aim to maximize their profit. Intent to buy depict impressive customer retention (Kuo,
2013). There are specific functions of the brand, which has a significant influence on
the intention to purchase of the customer such as the brand image and product quality
(Haryo & Budhi, 2015).
Li (2017) suggested that purchase intention is closely related to actual buying behavior;
This means purchase intention can judge how likely a consumer has purchased a
product. Consumers tend to buy specific brands because they feel the brand offers good
quality and good performance (Le & Tuan, 2013). Research on the relationship
between the means of the variable purchase intent and actual purchase behavior and
found that the purchase intent and actual purchase behavior closely related (Voona, et
al., 2011). Purchase intention may be the possibility that consumers can buy a good
one; in general, purchase intention is widely used in assessing the effectiveness of
future consumption of consumer (Hu & Shiau, 2015).
17
According to Zeinab and Fereshteh (2016), consumers are facing with many situations
that can make them abandon the purchase at any time; once purchase decision has been
made, all kinds of situations potentially arise and hinder the buying behavior of
consumers (Blackwell, et al., 2001). Based on theory, purchase intention in this study
is to explore the ability of consumers to purchase Zara products fast fashion.
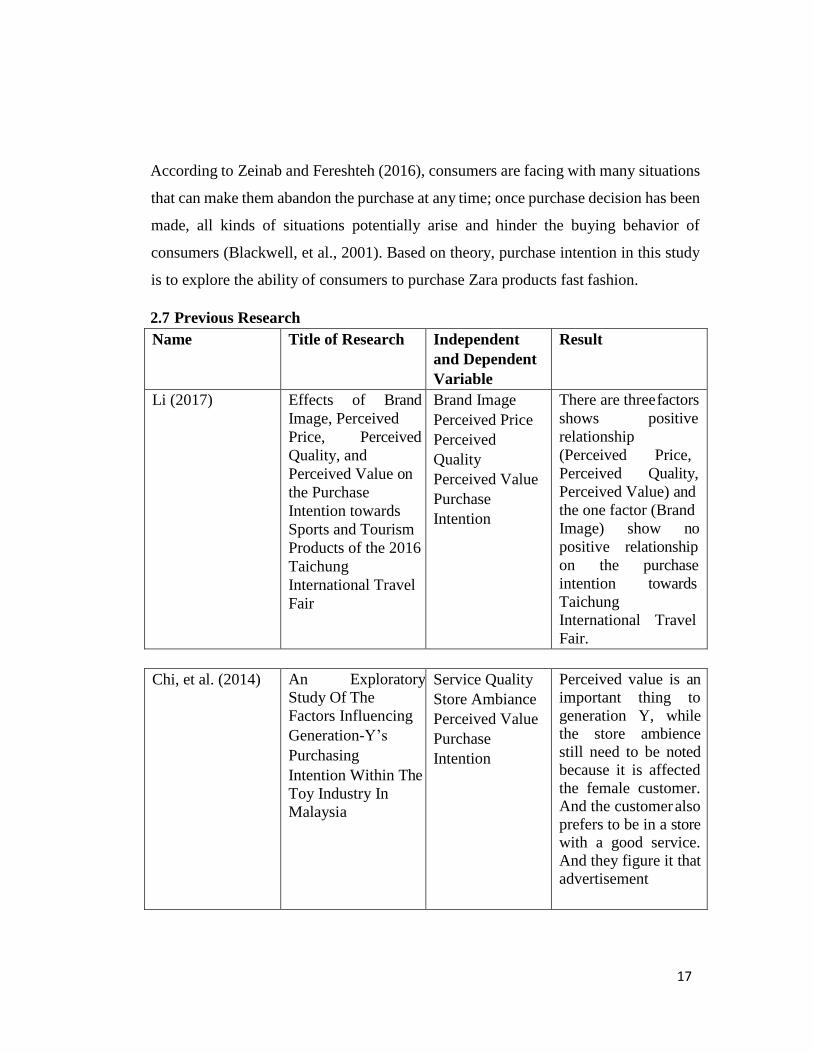
2.7 Previous Research
Name Title of Research Independent
and Dependent
Variable
Result
Li (2017) Effects of Brand
Image, Perceived
Price, Perceived
Quality, and
Perceived Value on
the Purchase
Intention towards
Sports and Tourism
Products of the 2016
Taichung
International Travel
Fair
Brand Image
Perceived Price
Perceived
Quality
Perceived Value
Purchase
Intention
There are three factors
shows positive
relationship
(Perceived Price,
Perceived Quality,
Perceived Value) and
the one factor (Brand
Image) show no
positive relationship
on the purchase
intention towards
Taichung
International Travel
Fair.
Chi, et al. (2014) An Exploratory
Study Of The
Factors Influencing
Generation-Y’s
Purchasing
Intention Within The
Toy Industry In
Malaysia
Service Quality
Store Ambiance
Perceived Value
Purchase
Intention
Perceived value is an
important thing to
generation Y, while the store ambience
still need to be noted because it is affected
the female customer. And the customer also
prefers to be in a store with a good service.
And they figure it that
advertisement
18
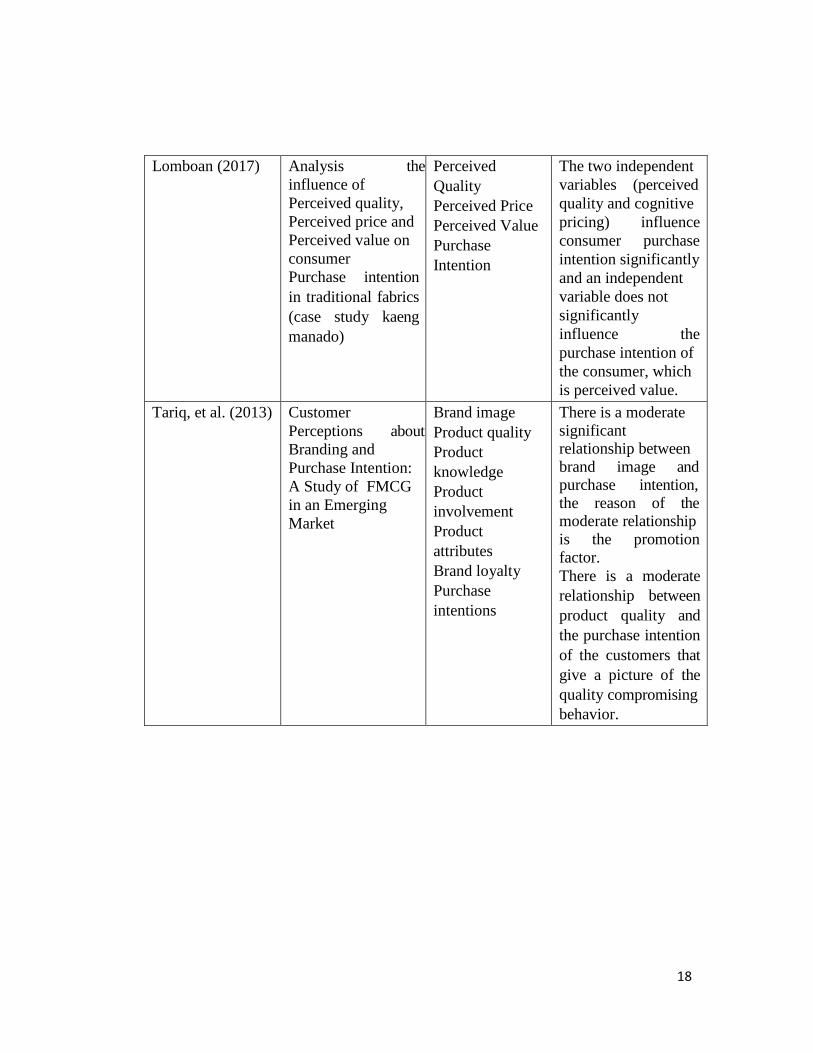
Lomboan (2017) Analysis the
influence of
Perceived quality,
Perceived price and
Perceived value on
consumer
Purchase intention
in traditional fabrics
(case study kaeng
manado)
Perceived
Quality
Perceived Price
Perceived Value
Purchase
Intention
The two independent
variables (perceived
quality and cognitive
pricing) influence
consumer purchase
intention significantly
and an independent
variable does not
significantly
influence the
purchase intention of
the consumer, which
is perceived value.
Tariq, et al. (2013) Customer
Perceptions about
Branding and
Purchase Intention:
A Study of FMCG
in an Emerging
Market
Brand image
Product quality
Product
knowledge
Product
involvement
Product
attributes
Brand loyalty
Purchase
intentions
There is a moderate
significant relationship between
brand image and purchase intention,
the reason of the moderate relationship
is the promotion
factor.
There is a moderate
relationship between
product quality and
the purchase intention
of the customers that
give a picture of the
quality compromising
behavior.
19
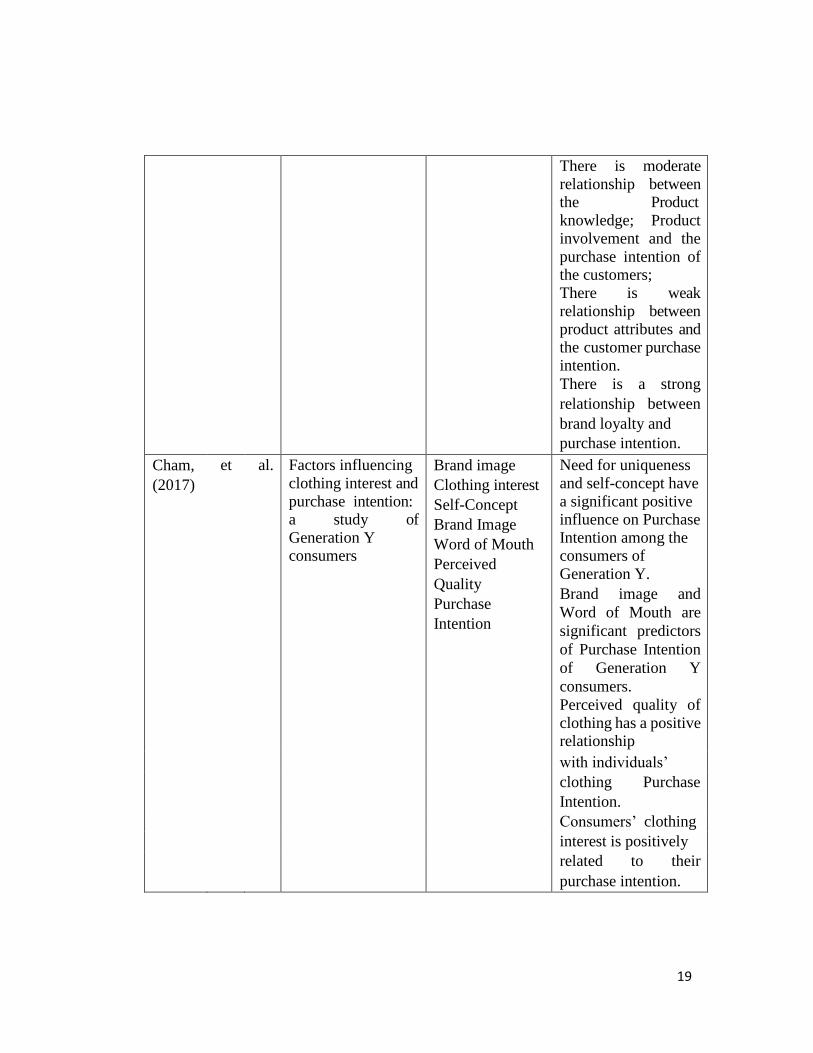
There is moderate
relationship between the Product
knowledge; Product
involvement and the
purchase intention of the customers;
There is weak
relationship between product attributes and
the customer purchase intention.
There is a strong
relationship between
brand loyalty and
purchase intention.
Cham,
(2017)
et al. Factors influencing
clothing interest and
purchase intention: a study of
Generation Y consumers
Brand image
Clothing interest
Self-Concept
Brand Image
Word of Mouth
Perceived
Quality
Purchase
Intention
Need for uniqueness
and self-concept have
a significant positive influence on Purchase
Intention among the consumers of
Generation Y.
Brand image and
Word of Mouth are
significant predictors
of Purchase Intention
of Generation Y
consumers.
Perceived quality of
clothing has a positive relationship
with individuals’
clothing Purchase
Intention.
Consumers’ clothing
interest is positively
related to their
purchase intention.
20
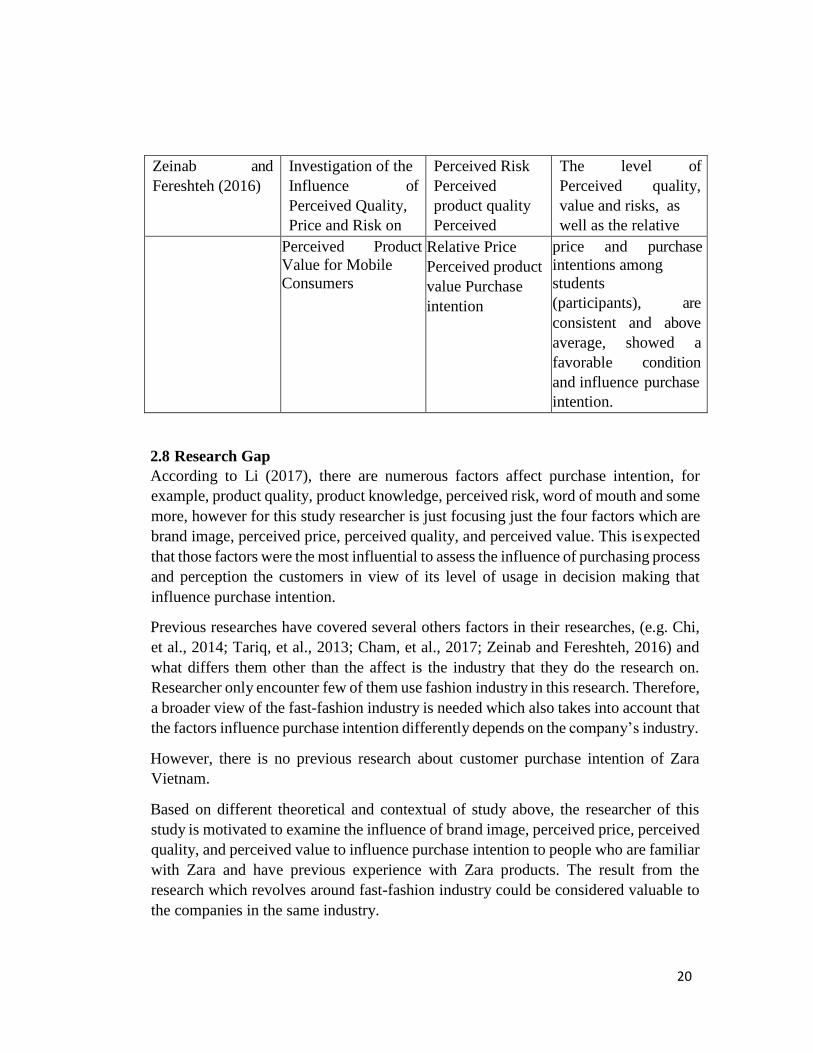
Zeinab and
Fereshteh (2016)
Investigation of the
Influence of
Perceived Quality,
Price and Risk on
Perceived Risk
Perceived
product quality
Perceived
The level of
Perceived quality,
value and risks, as
well as the relative
Perceived Product
Value for Mobile
Consumers
Relative Price
Perceived product
value Purchase
intention
price and purchase
intentions among
students
(participants), are
consistent and above
average, showed a
favorable condition
and influence purchase
intention.
2.8 Research Gap
According to Li (2017), there are numerous factors affect purchase intention, for
example, product quality, product knowledge, perceived risk, word of mouth and some
more, however for this study researcher is just focusing just the four factors which are
brand image, perceived price, perceived quality, and perceived value. This is expected
that those factors were the most influential to assess the influence of purchasing process
and perception the customers in view of its level of usage in decision making that
influence purchase intention.
Previous researches have covered several others factors in their researches, (e.g. Chi,
et al., 2014; Tariq, et al., 2013; Cham, et al., 2017; Zeinab and Fereshteh, 2016) and
what differs them other than the affect is the industry that they do the research on.
Researcher only encounter few of them use fashion industry in this research. Therefore,
a broader view of the fast-fashion industry is needed which also takes into account that
the factors influence purchase intention differently depends on the company’s industry.
However, there is no previous research about customer purchase intention of Zara
Vietnam.
Based on different theoretical and contextual of study above, the researcher of this
study is motivated to examine the influence of brand image, perceived price, perceived
quality, and perceived value to influence purchase intention to people who are familiar
with Zara and have previous experience with Zara products. The result from the
research which revolves around fast-fashion industry could be considered valuable to
the companies in the same industry.
21
CHAPTER III
RESEARCH METHODOLOGY
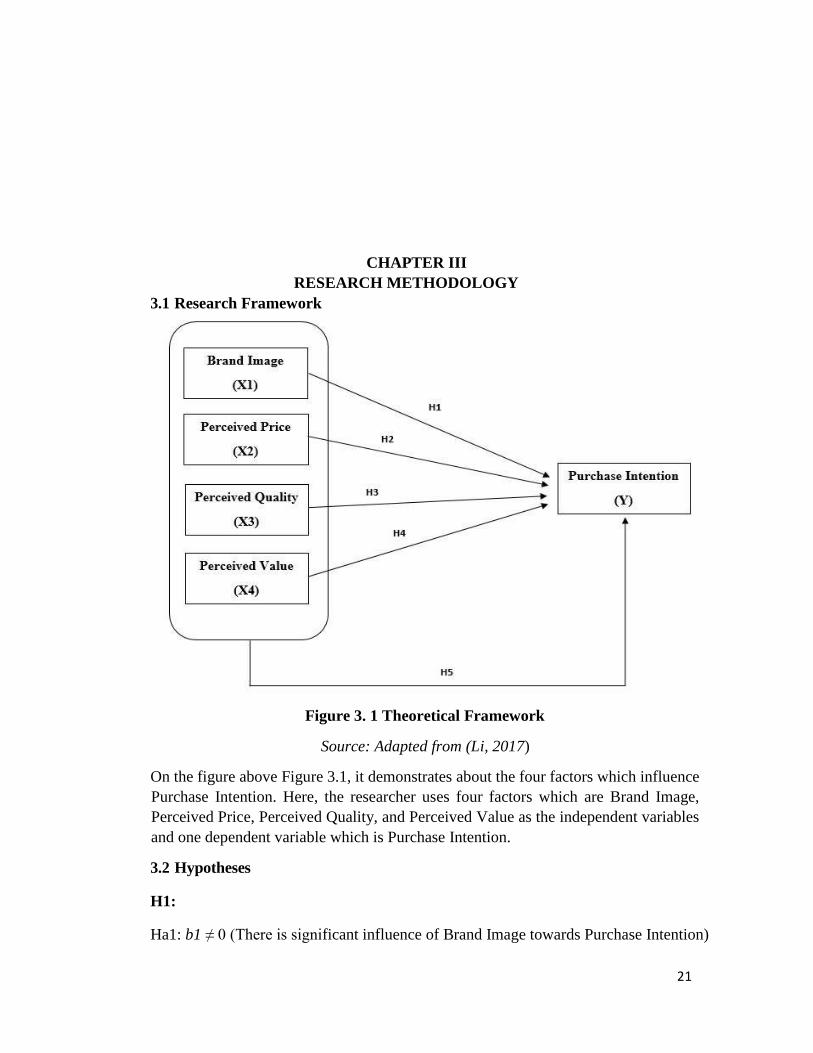
3.1 Research Framework
Figure 3. 1 Theoretical Framework
Source: Adapted from (Li, 2017)
On the figure above Figure 3.1, it demonstrates about the four factors which influence
Purchase Intention. Here, the researcher uses four factors which are Brand Image,
Perceived Price, Perceived Quality, and Perceived Value as the independent variables
and one dependent variable which is Purchase Intention.
3.2 Hypotheses
H1:
Ha1: b1 ≠ 0 (There is significant influence of Brand Image towards Purchase Intention)
22
H01: b1 = 0 (There is no significant influence of Brand Image towards Purchase
Intention) H2:
Ha2: b2 ≠ 0 (There is significant influence of Perceived Price towards Purchase
Intention)
H02: b2 = 0 (There is no significant influence of Perceived Price towards Purchase
Intention) H3:
Ha3: b3 ≠ 0 (There is significant influence of Perceived Quality towards Purchase
Intention)
H03: b3 = 0 (There is no significant influence of Perceived Quality towards
Purchase Intention) H4:
Ha4: b4 ≠ 0 (There is significant influence of Perceived Value towards Purchase
Intention)
H04: b4 = 0 (There is no significant influence of Perceived Value towards
Purchase Intention) H5:
Ha5: b5 ≠ 0 (There is significant influence of Brand Image, Perceived Price, Perceived
Quality, and Perceived Value towards Purchase Intention)
H05: b5 = 0 (There is no significant influence of Brand Image, Perceived Price,
Perceived Quality, and Perceived Value towards Purchase Intention)
3.3 Operational Definitions
Table 3. 1 Operational Definitions
Variable Definition Indicators Questions/Statements
23
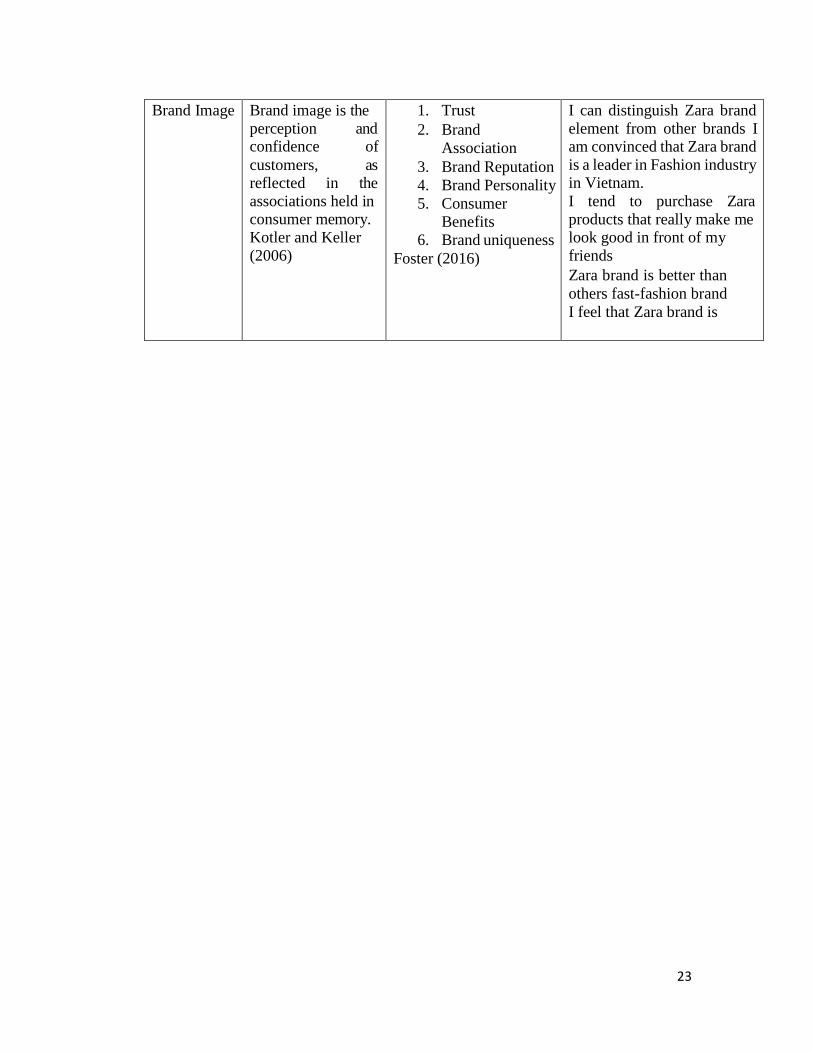
Brand Image Brand image is the
perception and confidence of
customers, as reflected in the
associations held in consumer memory.
Kotler and Keller
(2006)
1. Trust
2. Brand
Association
3. Brand Reputation
4. Brand Personality
5. Consumer
Benefits
6. Brand uniqueness
Foster (2016)
I can distinguish Zara brand
element from other brands I am convinced that Zara brand
is a leader in Fashion industry in Vietnam.
I tend to purchase Zara
products that really make me look good in front of my
friends
Zara brand is better than
others fast-fashion brand
I feel that Zara brand is
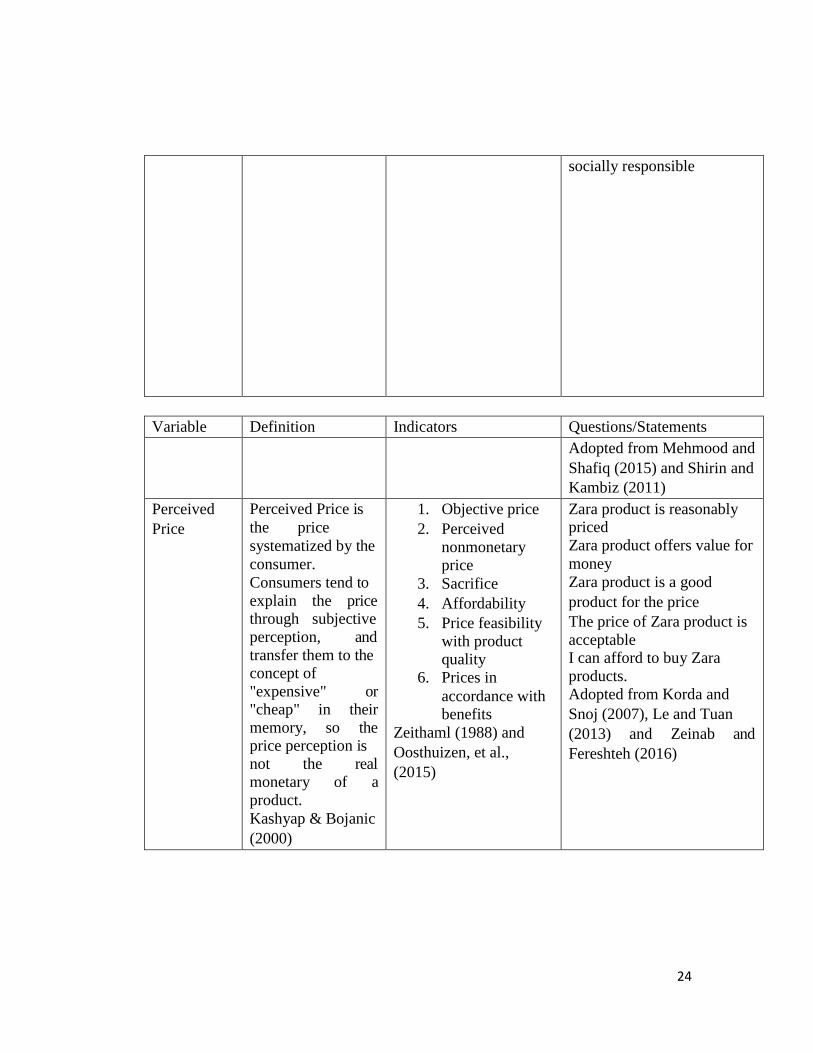
24
socially responsible
Variable Definition Indicators Questions/Statements
Adopted from Mehmood and
Shafiq (2015) and Shirin and
Kambiz (2011)
Perceived
Price
Perceived Price is
the price
systematized by the
consumer.
Consumers tend to
explain the price through subjective
perception, and
transfer them to the concept of
"expensive" or "cheap" in their
memory, so the price perception is
not the real monetary of a
product.
Kashyap & Bojanic
(2000)
1. Objective price
2. Perceived
nonmonetary price
3. Sacrifice
4. Affordability
5. Price feasibility
with product quality
6. Prices in
accordance with benefits
Zeithaml (1988) and
Oosthuizen, et al.,
(2015)
Zara product is reasonably priced
Zara product offers value for
money
Zara product is a good
product for the price
The price of Zara product is
acceptable I can afford to buy Zara
products.
Adopted from Korda and
Snoj (2007), Le and Tuan
(2013) and Zeinab and
Fereshteh (2016)
25
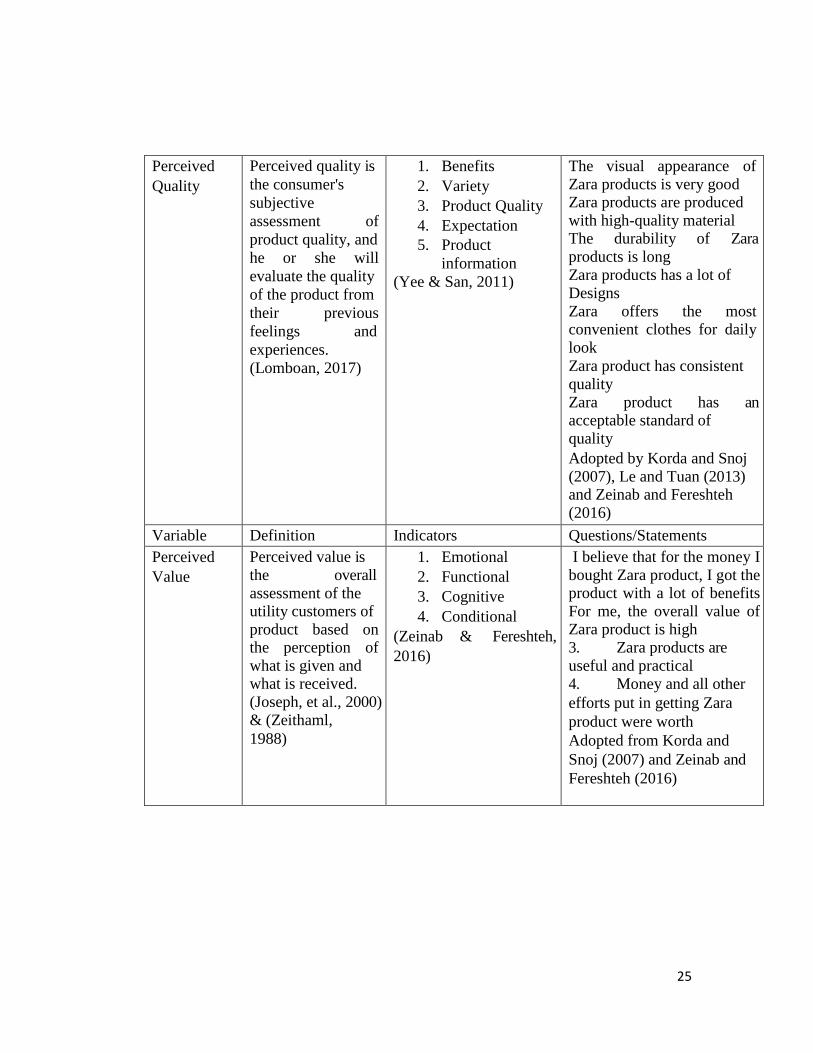
Perceived
Quality
Perceived quality is
the consumer's
subjective
assessment of
product quality, and
he or she will
evaluate the quality
of the product from
their previous
feelings and
experiences.
(Lomboan, 2017)
1. Benefits
2. Variety
3. Product Quality
4. Expectation
5. Product
information
(Yee & San, 2011)
The visual appearance of
Zara products is very good Zara products are produced
with high-quality material The durability of Zara
products is long
Zara products has a lot of
Designs
Zara offers the most convenient clothes for daily
look
Zara product has consistent
quality
Zara product has an acceptable standard of
quality
Adopted by Korda and Snoj
(2007), Le and Tuan (2013) and Zeinab and Fereshteh
(2016)
Variable Definition Indicators Questions/Statements
Perceived
Value
Perceived value is
the overall
assessment of the utility customers of
product based on the perception of
what is given and what is received.
(Joseph, et al., 2000)
& (Zeithaml,
1988)
1. Emotional
2. Functional
3. Cognitive
4. Conditional
(Zeinab & Fereshteh,
2016)
I believe that for the money I
bought Zara product, I got the product with a lot of benefits
For me, the overall value of Zara product is high
3. Zara products are
useful and practical
4. Money and all other
efforts put in getting Zara
product were worth
Adopted from Korda and
Snoj (2007) and Zeinab and
Fereshteh (2016)
26
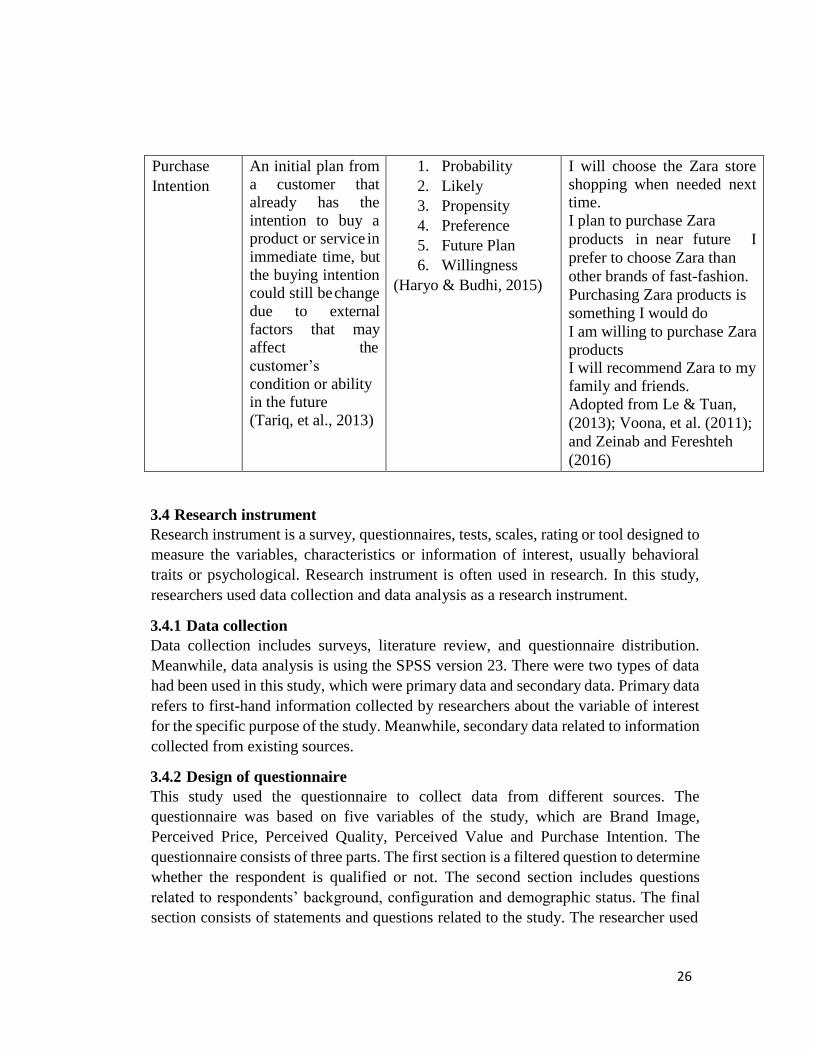
Purchase
Intention
An initial plan from
a customer that already has the
intention to buy a product or service in
immediate time, but
the buying intention could still be change
due to external factors that may
affect the
customer’s
condition or ability in the future
(Tariq, et al., 2013)
1. Probability
2. Likely
3. Propensity
4. Preference
5. Future Plan
6. Willingness
(Haryo & Budhi, 2015)
I will choose the Zara store
shopping when needed next time.
I plan to purchase Zara
products in near future I
prefer to choose Zara than
other brands of fast-fashion.
Purchasing Zara products is
something I would do
I am willing to purchase Zara
products I will recommend Zara to my
family and friends.
Adopted from Le & Tuan,
(2013); Voona, et al. (2011);
and Zeinab and Fereshteh
(2016)
3.4 Research instrument
Research instrument is a survey, questionnaires, tests, scales, rating or tool designed to
measure the variables, characteristics or information of interest, usually behavioral
traits or psychological. Research instrument is often used in research. In this study,
researchers used data collection and data analysis as a research instrument.
3.4.1 Data collection
Data collection includes surveys, literature review, and questionnaire distribution.
Meanwhile, data analysis is using the SPSS version 23. There were two types of data
had been used in this study, which were primary data and secondary data. Primary data
refers to first-hand information collected by researchers about the variable of interest
for the specific purpose of the study. Meanwhile, secondary data related to information
collected from existing sources.
3.4.2 Design of questionnaire
This study used the questionnaire to collect data from different sources. The
questionnaire was based on five variables of the study, which are Brand Image,
Perceived Price, Perceived Quality, Perceived Value and Purchase Intention. The
questionnaire consists of three parts. The first section is a filtered question to determine
whether the respondent is qualified or not. The second section includes questions
related to respondents’ background, configuration and demographic status. The final
section consists of statements and questions related to the study. The researcher used

27
rating questions that determined by (Lewis, et al., 2009) as the questions that are often
used to collect optional data.
In this study, researchers used the most frequently used methodology to construct a
summated assessment scale, the Likert scale. The researchers decided to use the
fivepoint rating scale is numbered from 1 to 5. Assessment Scale summated include
statements expressed favorable attitudes and detrimental to the object of interest.
The respondents were asked to provide their opinions on how far they agree or disagree
that each statement based on their scores. Likert scale is easy and fast to build, more
reliable and can also provide a large volume of data than any other method (Hair, et
al., 2007).
The questionnaire was formed by Microsoft Word 2010 and Google Drive application
with scale style of question. The Likert–style rating scale questionnaire uses 5-point
rating scale and to answer the questions, respondents only have to choose one of the
checkboxes. The point rating scale is explained as follows: Table 3. 2 Likert Scale
Respons
e
Categor
y
Strongl
y
Disagre
e
Disagree
Neutral
Agree
Strongl
y Agree
Rating Scale
1
2
3
4
5
3.5 Sampling design
3.5.1 Population
The population is all elements, individuals and units that meet the selection criteria for
a studied group (Cooper & Schindler, 2011). Population refers to the general group of
people, events or things attractive that researcher wants to investigate (Sekaran &
Bougie, 2010). In this study, the study population focused Zara's customers who are
living in Vietnam. The population is unknown.
3.5.2 Sampling method
Part of a population selected for the study is called a sample (Sekaran & Bougie, 2010).
The sample of this research will be used to investigate the research problems. In this
study, the researcher used non-probability sampling, purposive sampling in particular.
the researcher used (Supranto, 2007) theory that said the size of the sample can be
determined by calculating with below formula:

28
Formula 3. 1 Sample size for unknown population
N = 5 x Q (Source:
Supranto, 2007) Where:
N: Total Sample
Q: Number of Questions in Questionnaire
By that formula, the number of respondent in this research is 135 because there are 27
questions (5 x 27 = 135). The number of 135 is very applicable according to (Sekaran
& Bougie, 2010) which stated that the Sample size should be one in 30-500 elements.
Questionnaires then are distributed online to Zara customers who are living in Viet
Nam.
However, the researcher collected 150 respondents to ensure the data would be more
accurate.
3.5.3 Distribution of questionnaire
In collecting data from respondents, the researcher used a questionnaire online and
distributed to respondents through via social media and then ask them to spread to
others until collected complete enough 135 respondents. The researchers did not use
questionnaires printed because there is physical distance in distributing the
questionnaire.
3.5.4 Margin of Error
The researcher uses margin of error 0.05 for this research. It means that the means level
of error 5% with 95% confidence level.
3.6 Data Analysis
To examine the data in this study, two statistical programs were used. First is Microsoft
Excel, this program is set to tabulate the data collected from the questionnaire. It
simplifies the researchers to analyze the data. The second program used is the
Statistical Package for Social Sciences (SPSS). SPSS is a frequent use by quantitative
researchers to analyze data from distributed questionnaires. The use of SPSS in this
study was used to analyze reliability, validity, weighted mean, factorial analysis,
classic hypothesis, and multiple linear regression analysis.
3.6.1 Reliability Test
Reliability is the degree of accuracy or precision of the measurements made by a
research tool which in this study was a questionnaire (Kumar, 2014). Therefore, the
reliability test is used to show how far the measurement results are relatively
appropriate if the measurement is re-performed for two or more times. For this study,
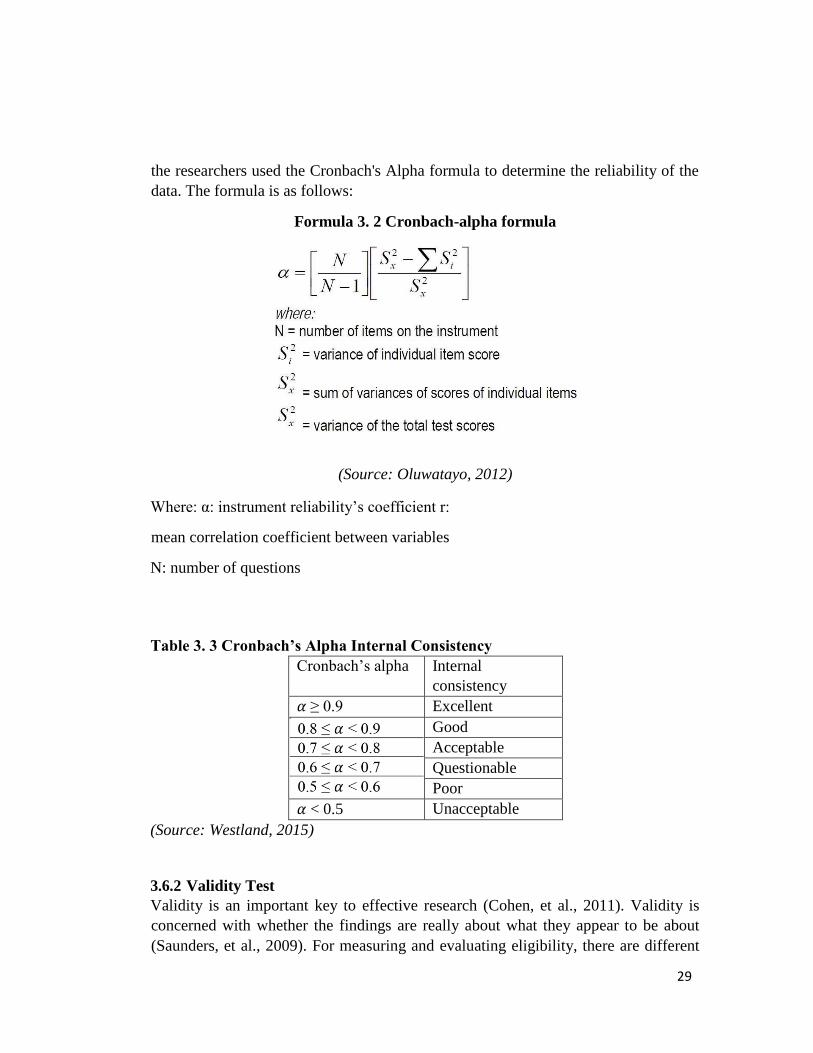
29
the researchers used the Cronbach's Alpha formula to determine the reliability of the
data. The formula is as follows:
Formula 3. 2 Cronbach-alpha formula
(Source: Oluwatayo, 2012)
Where: α: instrument reliability’s coefficient r:
mean correlation coefficient between variables
N: number of questions
Table 3. 3 Cronbach’s Alpha Internal Consistency
Cronbach’s alpha Internal
consistency
𝛼 ≥ 0.9 Excellent
Good
Acceptable
Questionable
Poor
𝛼 < 0.5 Unacceptable
(Source: Westland, 2015)
3.6.2 Validity Test
Validity is an important key to effective research (Cohen, et al., 2011). Validity is
concerned with whether the findings are really about what they appear to be about
(Saunders, et al., 2009). For measuring and evaluating eligibility, there are different

30
methods. The method of Correlations, Pearson Product-Moment Correlations, is
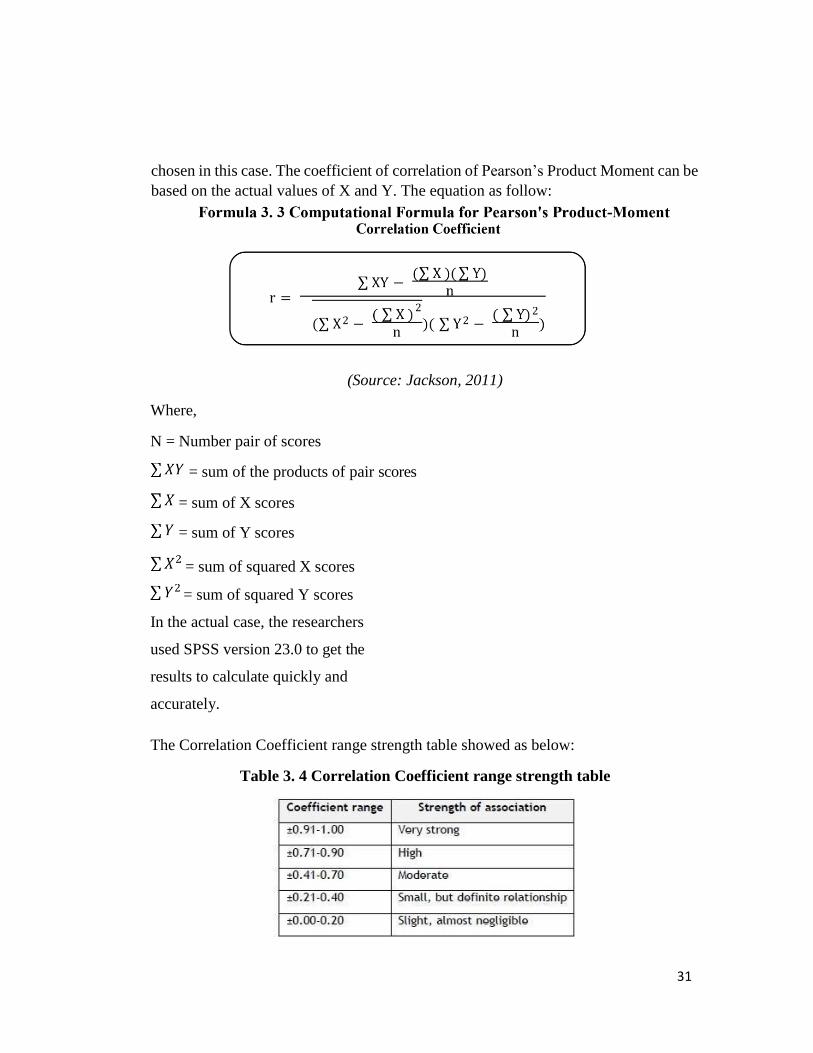
31
chosen in this case. The coefficient of correlation of Pearson’s Product Moment can be
based on the actual values of X and Y. The equation as follow:
(Source: Jackson, 2011)
Where,
N = Number pair of scores
= sum of the products of pair scores
= sum of X scores
= sum of Y scores
= sum of squared X scores
= sum of squared Y scores
In the actual case, the researchers
used SPSS version 23.0 to get the
results to calculate quickly and
accurately.
The Correlation Coefficient range strength table showed as below:
Table 3. 4 Correlation Coefficient range strength table

32
(Source: Mahlangu & Kruger, 2015)
3.7. Classical Assumption Testing
Classical Assumption Testing is needed in a study, and the statistical requirements
must be met in multivariate regression analysis. The Classical Assumption Testing is
used to use multiple regression models, and in Classical Assumption Testing, there are
some specific tests such as normality testing, multicollinearity testing,
heteroscedasticity testing, and autocorrelation test must be performed.
3.7.1 Normality Test
It is assumed in multiple regression that surplus (predicted minus observed values) are
normally distributed. Although most of the tests are quite powerful for this hypothesis
with violations, it is always a good idea to review the distribution of the major variables
of interest. This test can be done by creating the graph as well as conspiracy to balance
normal ability, to check the distribution of the residual value (Levine, et al., 2009).
The normality test can also be performed using the statistical package SPSS and can
be seen in the graph of Normal Probability Plot (NPP) which is a graphics device to
study the shape of the probability density function (PDF). NPP is used to assess how
the experimental data approximation distribution specific theory (Levine, et al., 2009).
In this case the distribution of the linear relationship, the data can also be plotted on a
probability scale by plotting the cumulative probability distribution of the data by
probability assumptions based on our expected.
3.7.2 Multicollinearity Test
Multicollinearity is a correlation between the independent variables that make it
difficult to make inferences about the individual regression coefficients and their
personal effects on the dependent variable. Another reason to avoid independent
variables correlated as they can result in mistakes in the tests the hypothesis for the
individual independent variables. In fact, it is almost impossible to choose the
independent variables that are completely unrelated or irrelevant to some degree
(Marchal, et al., 2012).
If multicollinearity is presented in a multiple regression model, the model is still good
to predict, but the interpretation of the individual coefficient is invalid. There are many
methods to detect the presence of multicollinearity, in this study, the researchers want
to do a test on the turn with a measure of inflation factor variance (VIF) (Marchal, et
al., 2012).
Formula 3. 4 Variance Inflation Factor model
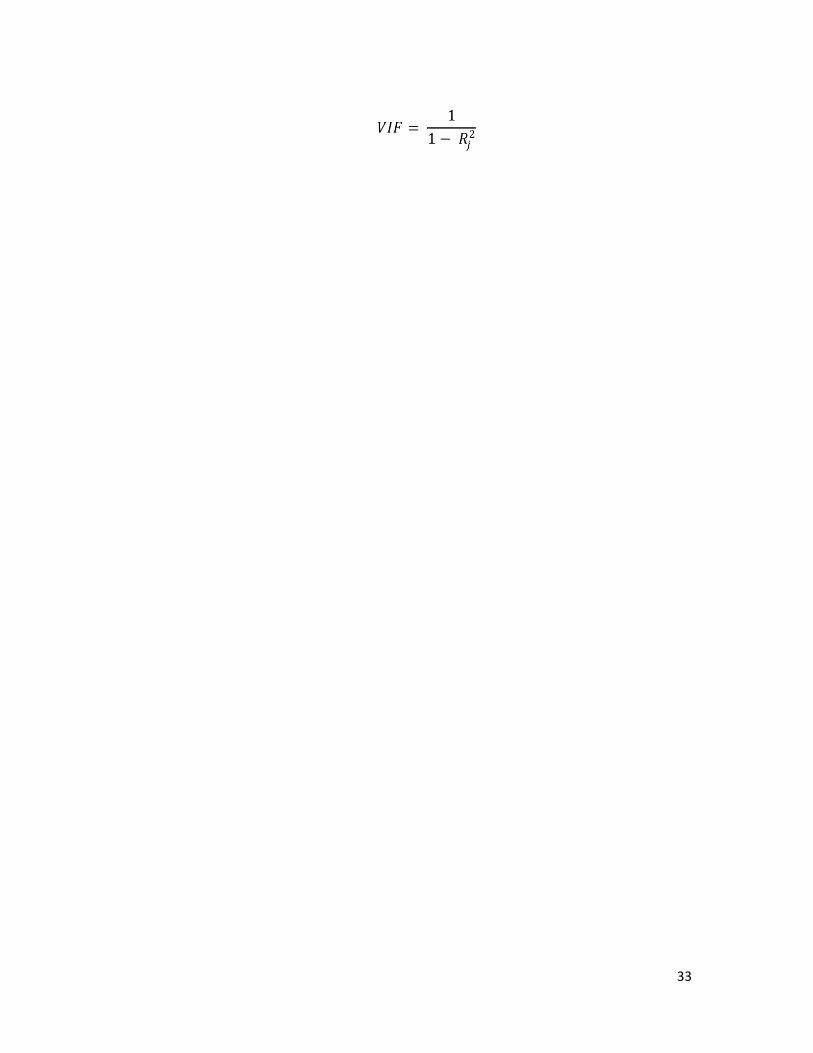
33
34
Source: Marchal, et al. (2012)
Where
𝑅𝑗2= the coefficient of determination 𝑉𝑉𝐼𝐼𝐹𝐹
= the Variance Inflation Factor
3.7.3 Heteroscedasticity test:
Heteroscedasticity test is a test to determine whether or not the regression models differ
in the wrong from another event (Marchal, et al., 2012). This test is to see whether
there is inequality of the variance of the residuals of the observations to other
observations. Detect the scatter plot can do random variable. A good model is obtained
without the special pattern on the graph, such as gathering in the middle or narrow.
3.7.4 Autocorrelation test
Autocorrelation is the correlation (relationship) between the members of an observed
time series (as in the time series data) or space (as in the cross-sectional data). Since
the basic assumptions of the regression model are the independence of errors, a good
regression model is one in which no correlation problem. A value of 2 or nearly 2
indicates that no superlative autocorrelation. An acceptable range is 1.50 to 2.50. If
autocorrelation occurs in the regression model, the sample will not show the wrong
people (Marchal, et al., 2012). The standard error becomes too wide confidence
intervals will be larger. As a consequence, the results of regression models t- test and
F - test can give inaccurate results that cannot be used to predict the value of the
variable depends on the particular independent variable (Levine, et al., 2009).
3.7.5. Descriptive Testing
Murray and Andrea (2009) explained that the descriptive statistics is the number of
procedures or graphical techniques used to organize and describe the characteristics or
elements of a specific form. The statistics can also be used to describe the
characteristics of a particular group or illustrate trends, (Gill & Leon, 2010). Level
measurement is the mechanism by which a variable is recorded. There is three
commonly used measure of the broad levels, which are: negligible; order, and
continuity (Interval / Ratio) (Murray & Andrea, 2009).The degree of insignificance (or
classification) of measurement is the point of the case/participant in the broad category.
Order the measure is the point of those involved in research into the types of
hierarchical order. Continuous level data often directly measured with infinite ladder
where the increments in the range are equidistant (Murray & Andrea, 2009).
3.7.5.1. Mean
The mean similar to an arithmetic mean (the most common type of average); where
instead of each data point contributes equally to the average level, in the end, some
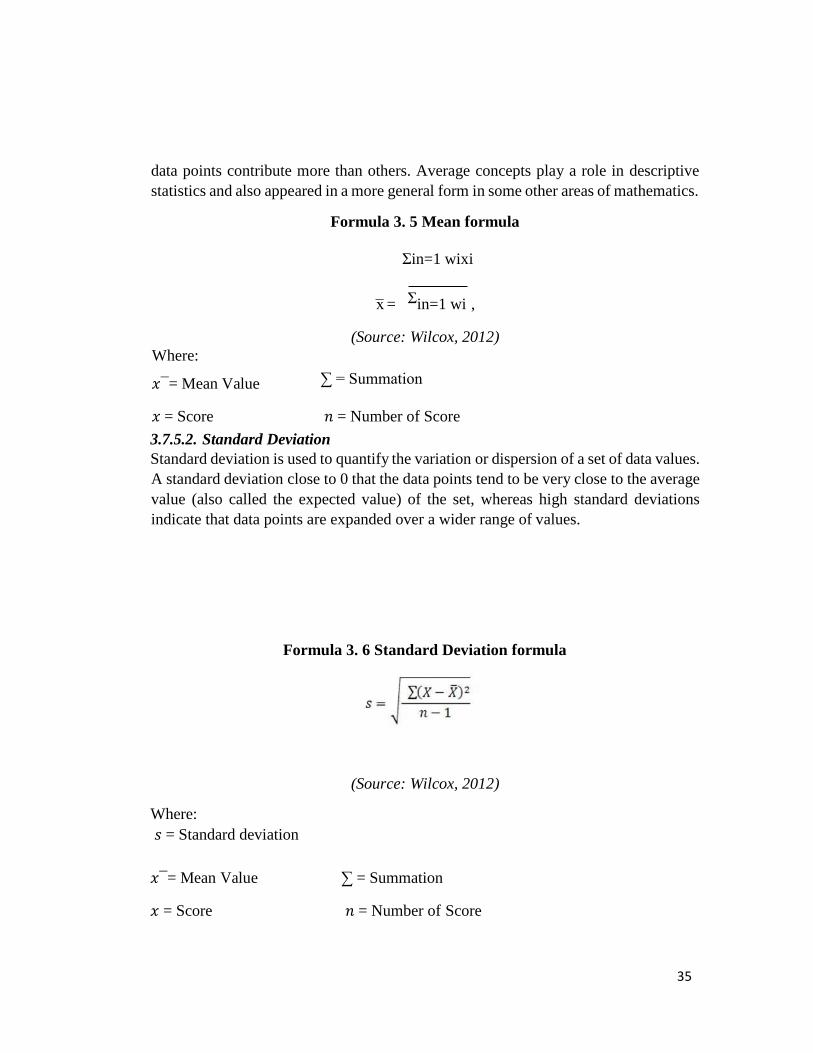
35
data points contribute more than others. Average concepts play a role in descriptive
statistics and also appeared in a more general form in some other areas of mathematics.
Formula 3. 5 Mean formula
Σin=1 wixi
x̅ = Σin=1 wi ,
(Source: Wilcox, 2012)
Where:
𝑥 ̅ = Mean Value ∑ = Summation
𝑥 = Score 𝑛 = Number of Score
3.7.5.2. Standard Deviation
Standard deviation is used to quantify the variation or dispersion of a set of data values.
A standard deviation close to 0 that the data points tend to be very close to the average
value (also called the expected value) of the set, whereas high standard deviations
indicate that data points are expanded over a wider range of values.
Formula 3. 6 Standard Deviation formula
(Source: Wilcox, 2012)
Where:
𝑠 = Standard deviation
𝑥 ̅ = Mean Value ∑ = Summation
𝑥 = Score 𝑛 = Number of Score

36
3.7.6 Multiple Regression Analysis
According to the book Basic Business Statistics (Mark L. Bereson, David M. Levine
& Timothy C. Krehbiel, 2009), multiple regression model was used to estimate or
predict the value of the variable Y, which counted math using some X affects Y
regression analysis was shown to distinguish between dependent and independent
variables, and in the extent to which dependent variable is explained or influenced by
independent variables. Results of regression analysis will be used to accept or reject
the hypothesis as to observe whether there is any influence or not between dependent
and independent variables.
The Multiple Regression Model used in this research:
Formula 3. 7 Multiple Linear Regression Model
y = 𝒃𝟎 + 𝒃𝟏𝒙𝟏 + 𝒃𝟐𝒙𝟐 + 𝒃𝟑𝒙𝟑 + 𝒃𝟒𝒙𝟒 + 𝒆
(Source: Mark L. Bereson, David M. Levine & Timothy C. Krehbiel, 2009)
Where:
y = Customer Behavioral Intention (Dependent variable)
𝑏0 = A constant, the value of Y when all X values are zero
𝑏1- 𝑏5 = Regression Coefficient
𝑥1 = Brand Image (Independent variable)
𝑥2 = Perceived Price (Independent variable)
𝑥3 = Perceived Quality (Independent variable)
𝑥4 = Perceived Value (Independent variable)
𝑒 = Random error
3.7.7 Testing the Hypothesis
3.7.7.1 Testing the Model for Significance
To determine if there is a linear relationship between X and Y, a statistical test (FTest
and T-Test) is done. The hypothesis is that there is no linear relationship between two
variables (e.g., β = 0), and the replace hypothesis is that there is a linear relationship
(e.g., β ≠ 0). If the null hypothesis can be rejected, then we have proved that a direct
relationship does not exist.
37
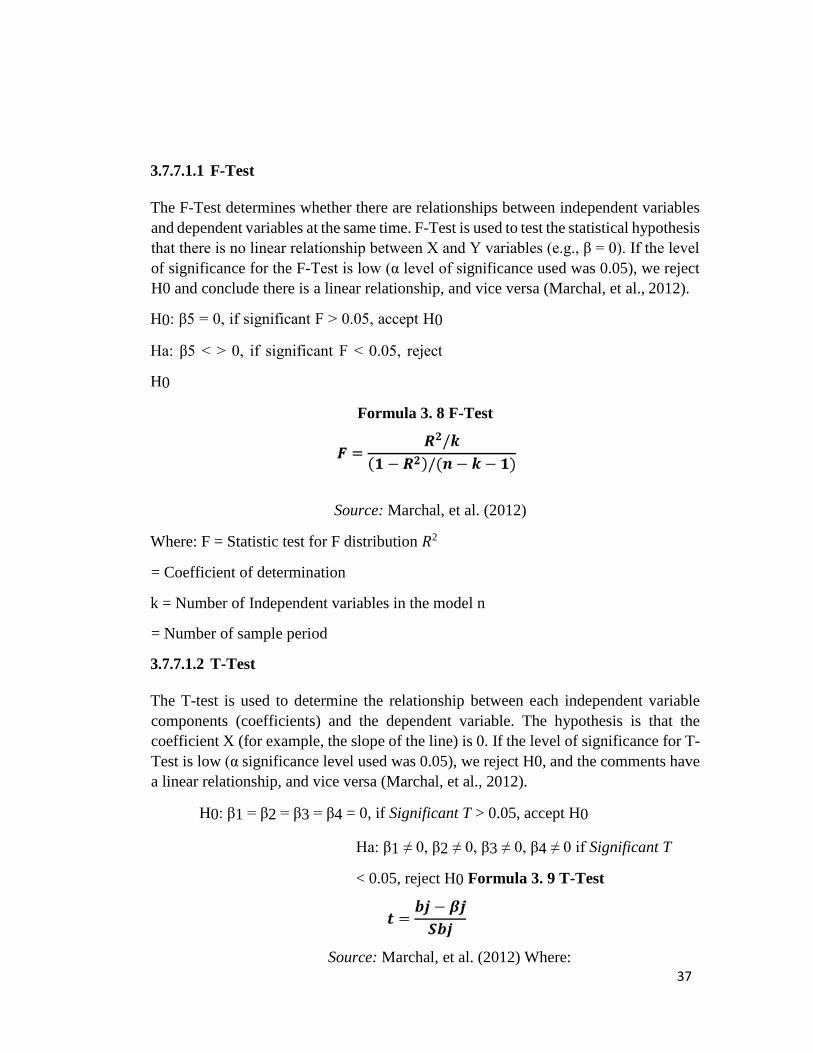
3.7.7.1.1 F-Test
The F-Test determines whether there are relationships between independent variables
and dependent variables at the same time. F-Test is used to test the statistical hypothesis
that there is no linear relationship between X and Y variables (e.g., β = 0). If the level
of significance for the F-Test is low (α level of significance used was 0.05), we reject
H0 and conclude there is a linear relationship, and vice versa (Marchal, et al., 2012).
H0: β5 = 0, if significant F > 0.05, accept H0
Ha: β5 < > 0, if significant F < 0.05, reject
H0
Formula 3. 8 F-Test
Source: Marchal, et al. (2012)
Where: F = Statistic test for F distribution 𝑅2
= Coefficient of determination
k = Number of Independent variables in the model n
= Number of sample period
3.7.7.1.2 T-Test
The T-test is used to determine the relationship between each independent variable
components (coefficients) and the dependent variable. The hypothesis is that the
coefficient X (for example, the slope of the line) is 0. If the level of significance for T-
Test is low (α significance level used was 0.05), we reject H0, and the comments have
a linear relationship, and vice versa (Marchal, et al., 2012).
H0: β1 = β2 = β3 = β4 = 0, if Significant T > 0.05, accept H0
Ha: β1 ≠ 0, β2 ≠ 0, β3 ≠ 0, β4 ≠ 0 if Significant T
< 0.05, reject H0 Formula 3. 9 T-Test
Source: Marchal, et al. (2012) Where:
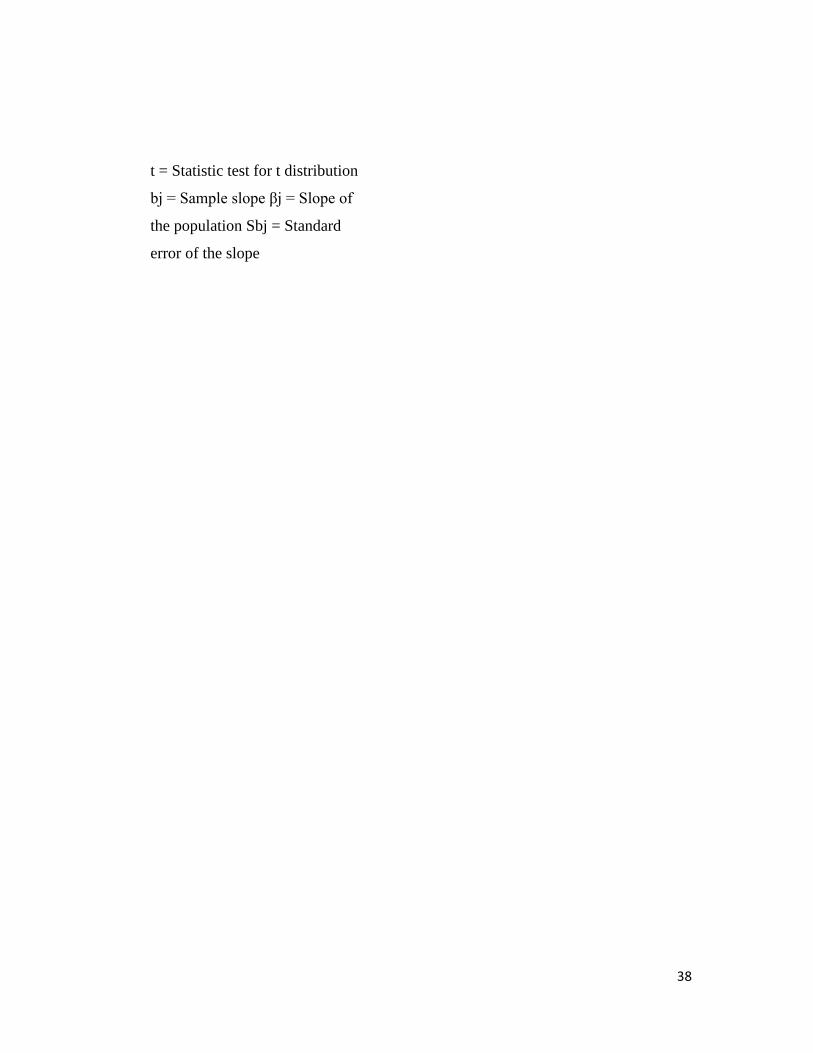
38
t = Statistic test for t distribution
bj = Sample slope βj = Slope of
the population Sbj = Standard
error of the slope
39
CHAPTER 4
RESEARCH RESULT AND DISCUSSIONS
4.1. Descriptive Analysis
4.1.1. Gender
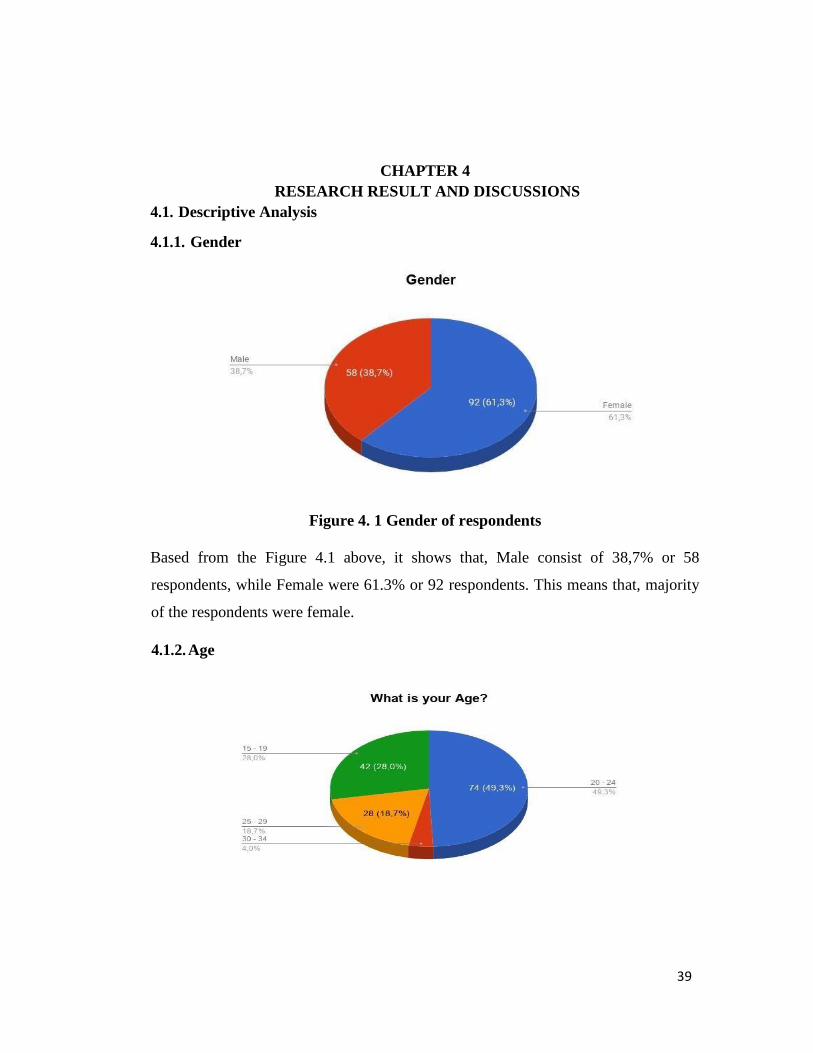
Figure 4. 1 Gender of respondents
Based from the Figure 4.1 above, it shows that, Male consist of 38,7% or 58
respondents, while Female were 61.3% or 92 respondents. This means that, majority
of the respondents were female.
4.1.2. Age
40
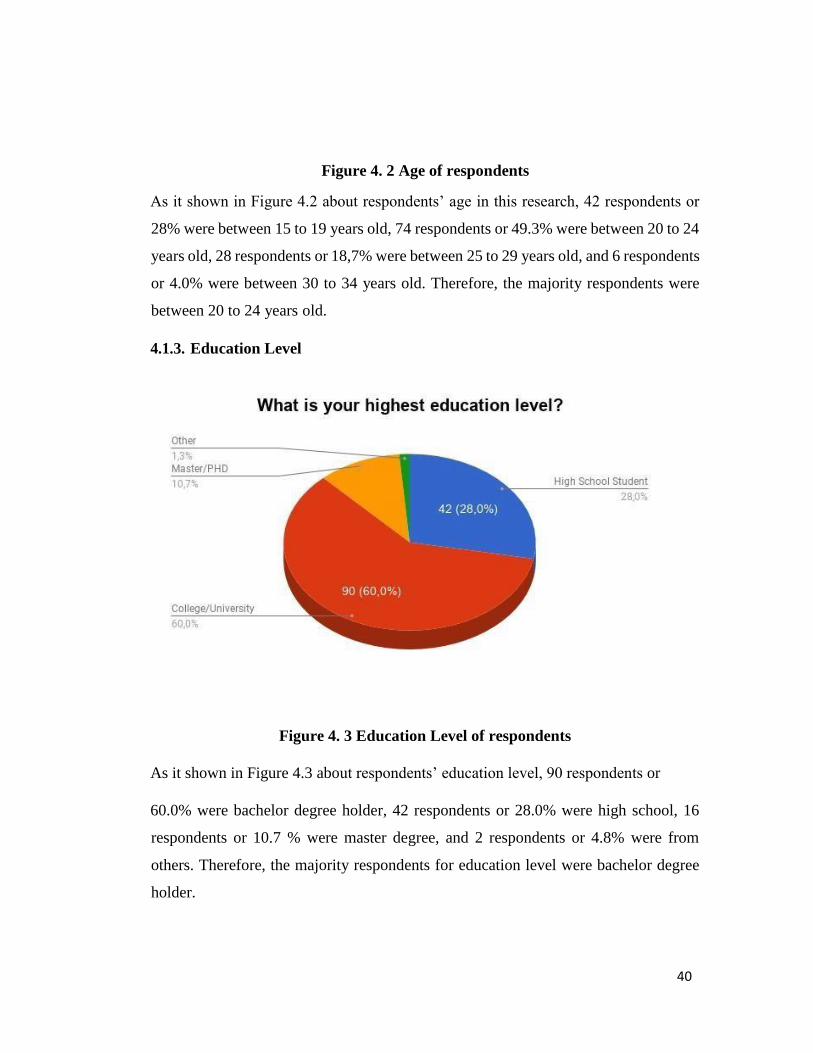
Figure 4. 2 Age of respondents
As it shown in Figure 4.2 about respondents’ age in this research, 42 respondents or
28% were between 15 to 19 years old, 74 respondents or 49.3% were between 20 to 24
years old, 28 respondents or 18,7% were between 25 to 29 years old, and 6 respondents
or 4.0% were between 30 to 34 years old. Therefore, the majority respondents were
between 20 to 24 years old.
4.1.3. Education Level
Figure 4. 3 Education Level of respondents
As it shown in Figure 4.3 about respondents’ education level, 90 respondents or
60.0% were bachelor degree holder, 42 respondents or 28.0% were high school, 16
respondents or 10.7 % were master degree, and 2 respondents or 4.8% were from
others. Therefore, the majority respondents for education level were bachelor degree
holder.
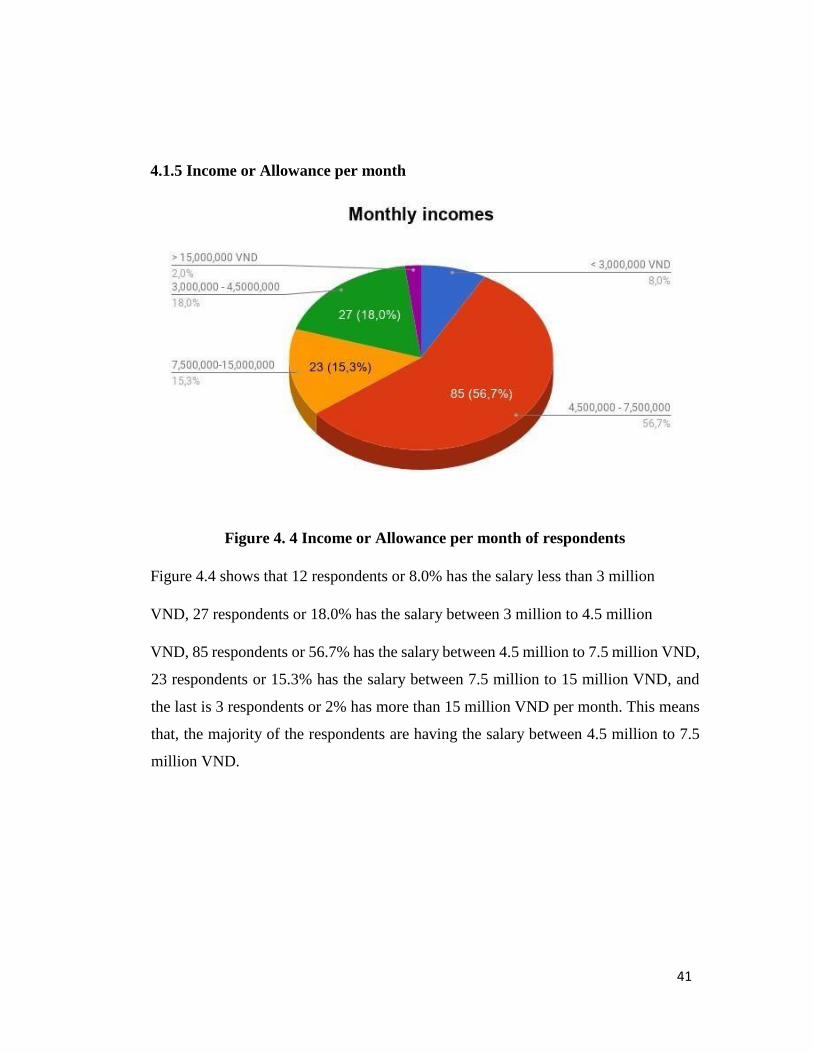
41
4.1.5 Income or Allowance per month
Figure 4. 4 Income or Allowance per month of respondents
Figure 4.4 shows that 12 respondents or 8.0% has the salary less than 3 million
VND, 27 respondents or 18.0% has the salary between 3 million to 4.5 million
VND, 85 respondents or 56.7% has the salary between 4.5 million to 7.5 million VND,
23 respondents or 15.3% has the salary between 7.5 million to 15 million VND, and
the last is 3 respondents or 2% has more than 15 million VND per month. This means
that, the majority of the respondents are having the salary between 4.5 million to 7.5
million VND.
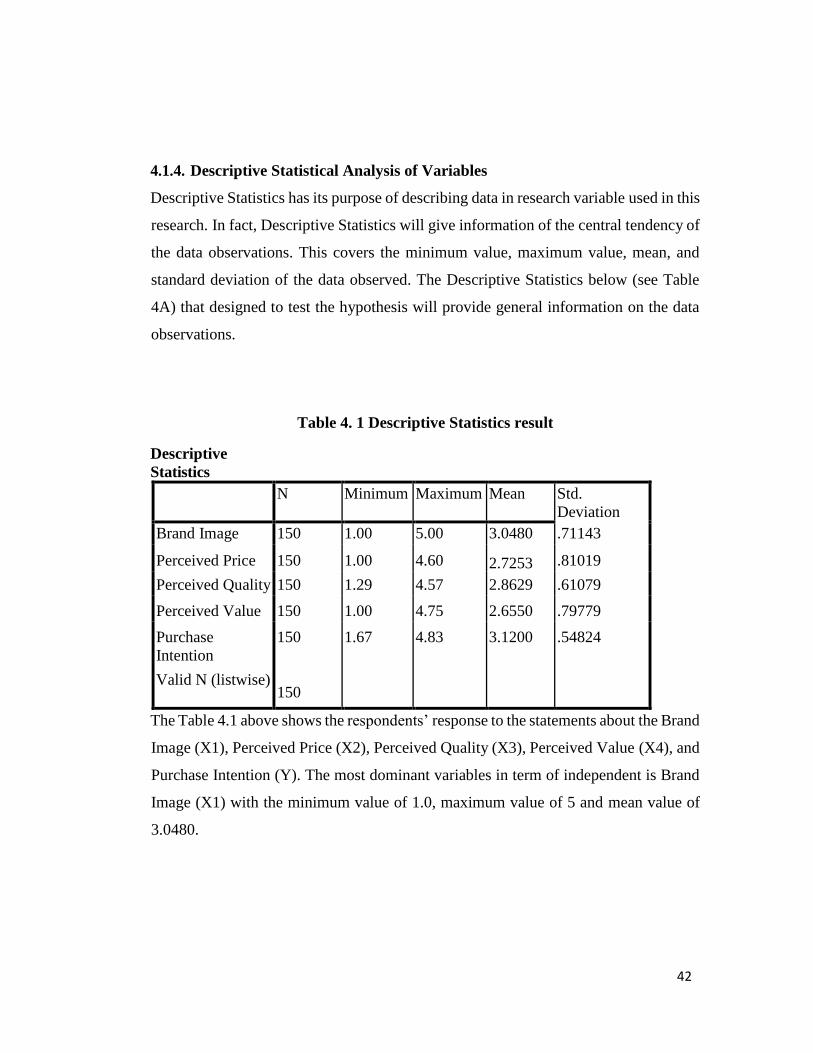
42
4.1.4. Descriptive Statistical Analysis of Variables
Descriptive Statistics has its purpose of describing data in research variable used in this
research. In fact, Descriptive Statistics will give information of the central tendency of
the data observations. This covers the minimum value, maximum value, mean, and
standard deviation of the data observed. The Descriptive Statistics below (see Table
4A) that designed to test the hypothesis will provide general information on the data
observations.
Descriptive
Statistics
Table 4. 1 Descriptive Statistics result
N Minimum Maximum Mean Std.
Deviation
Brand Image 150 1.00 5.00 3.0480
2.7253
.71143
Perceived Price 150 1.00 4.60 .81019
Perceived Quality 150 1.29 4.57 2.8629 .61079
Perceived Value 150 1.00 4.75 2.6550 .79779
Purchase
Intention
150 1.67 4.83 3.1200 .54824
Valid N (listwise)
150
The Table 4.1 above shows the respondents’ response to the statements about the Brand
Image (X1), Perceived Price (X2), Perceived Quality (X3), Perceived Value (X4), and
Purchase Intention (Y). The most dominant variables in term of independent is Brand
Image (X1) with the minimum value of 1.0, maximum value of 5 and mean value of
3.0480.
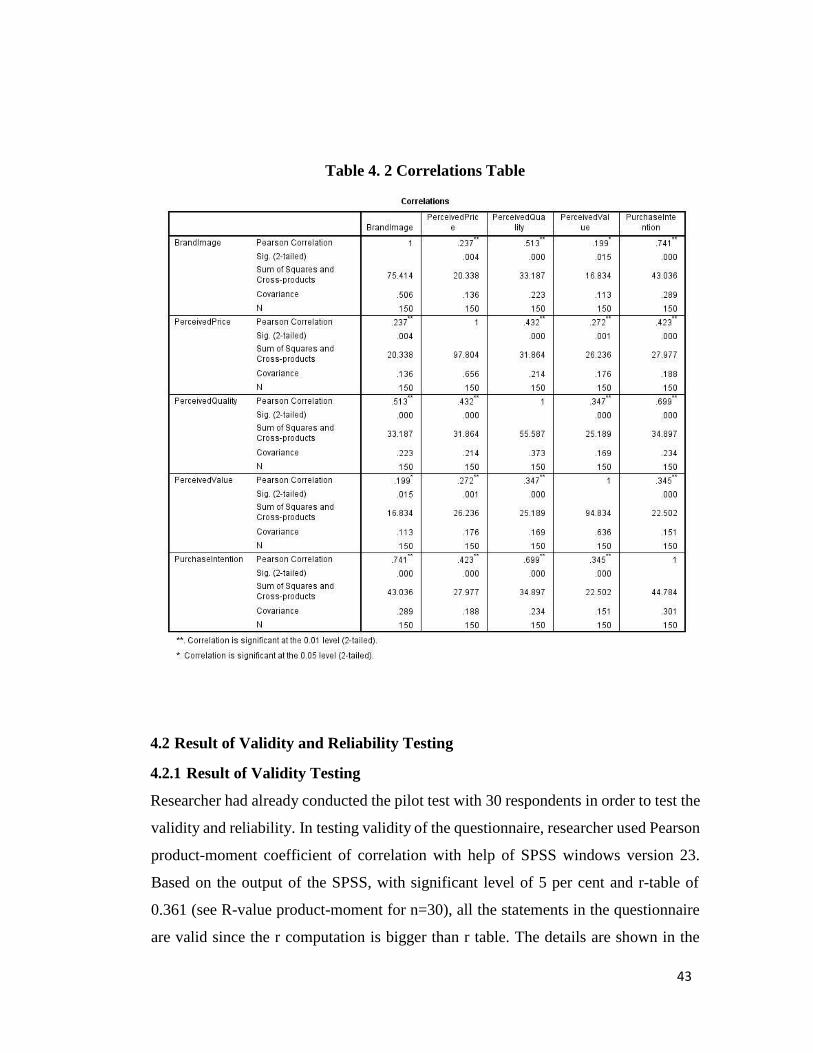
43
Table 4. 2 Correlations Table
4.2 Result of Validity and Reliability Testing
4.2.1 Result of Validity Testing
Researcher had already conducted the pilot test with 30 respondents in order to test the
validity and reliability. In testing validity of the questionnaire, researcher used Pearson
product-moment coefficient of correlation with help of SPSS windows version 23.
Based on the output of the SPSS, with significant level of 5 per cent and r-table of
0.361 (see R-value product-moment for n=30), all the statements in the questionnaire
are valid since the r computation is bigger than r table. The details are shown in the

44
figures and tables below.
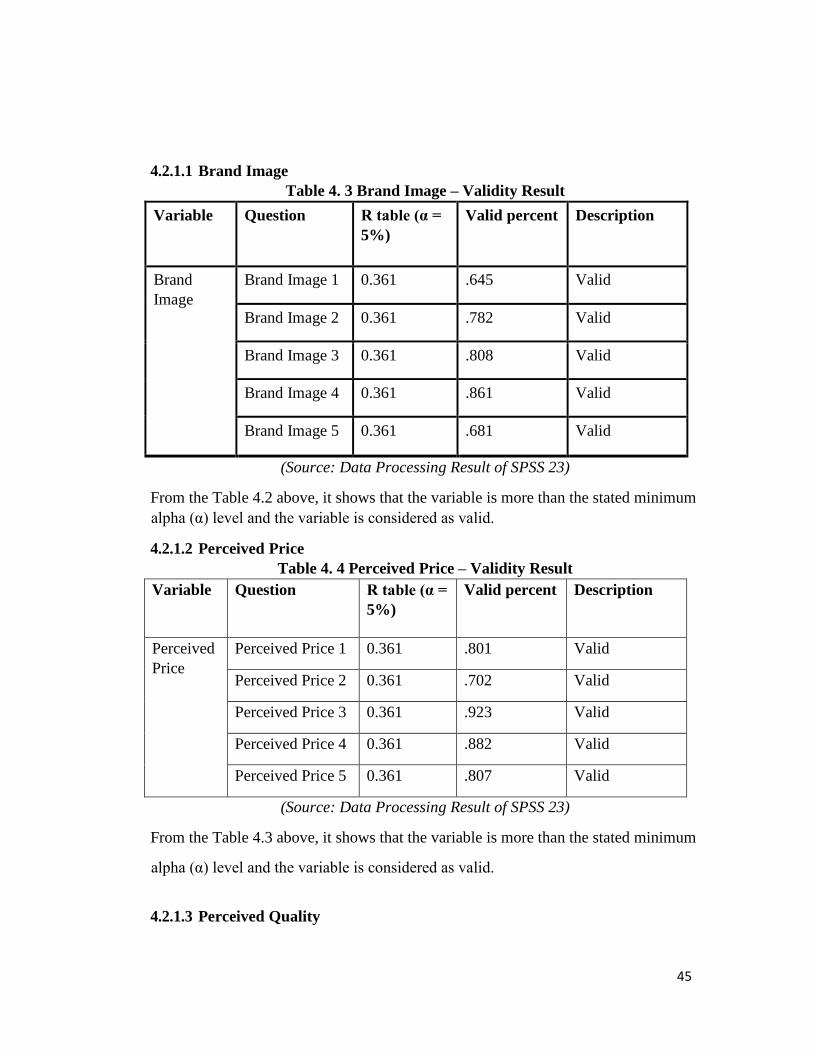
45
4.2.1.1 Brand Image
Table 4. 3 Brand Image – Validity Result
Variable Question R table (α =
5%)
Valid percent Description
Brand
Image
Brand Image 1 0.361 .645 Valid
Brand Image 2 0.361 .782 Valid
Brand Image 3 0.361 .808 Valid
Brand Image 4 0.361 .861 Valid
Brand Image 5 0.361 .681 Valid
(Source: Data Processing Result of SPSS 23)
From the Table 4.2 above, it shows that the variable is more than the stated minimum
alpha (α) level and the variable is considered as valid.
4.2.1.2 Perceived Price
Table 4. 4 Perceived Price – Validity Result
Variable Question R table (α =
5%)
Valid percent Description
Perceived
Price
Perceived Price 1 0.361 .801 Valid
Perceived Price 2 0.361 .702 Valid
Perceived Price 3 0.361 .923 Valid
Perceived Price 4 0.361 .882 Valid
Perceived Price 5 0.361 .807 Valid
(Source: Data Processing Result of SPSS 23)
From the Table 4.3 above, it shows that the variable is more than the stated minimum
alpha (α) level and the variable is considered as valid.
4.2.1.3 Perceived Quality
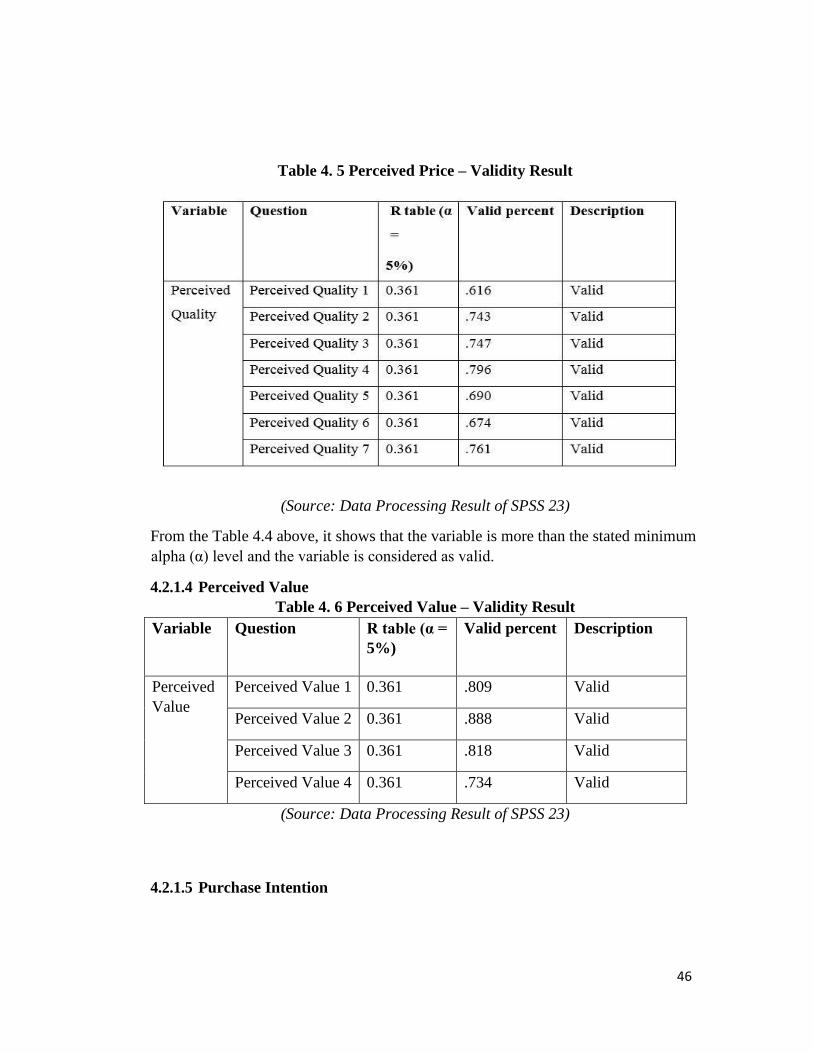
46
Table 4. 5 Perceived Price – Validity Result
(Source: Data Processing Result of SPSS 23)
From the Table 4.4 above, it shows that the variable is more than the stated minimum
alpha (α) level and the variable is considered as valid.
4.2.1.4 Perceived Value
Table 4. 6 Perceived Value – Validity Result
Variable Question R table (α =
5%)
Valid percent Description
Perceived
Value
Perceived Value 1 0.361 .809 Valid
Perceived Value 2 0.361 .888 Valid
Perceived Value 3 0.361 .818 Valid
Perceived Value 4 0.361 .734 Valid
(Source: Data Processing Result of SPSS 23)
4.2.1.5 Purchase Intention

47
Table 4. 7 Purchase Intention – Validity Result
Variable Question R table (α
=
5%)
Valid percent Description
Purchase
Intention
Purchase Intention 1 0.361 .730 Valid
Purchase Intention 2 0.361 .778 Valid
Purchase Intention 3 0.361 .419 Valid
Purchase Intention 4 0.361 .543 Valid
Purchase Intention 5 0.361 .594 Valid
Purchase Intention 6 0.361 .599 Valid
(Source: Data Processing Result of SPSS 23)
Since all of the statements are valid, it is going to be used for the further analysis in
this research.
4.2.2. Result of Reliability Testing
Reliability testing used to measure the reliability of the instrument to use in collecting
the data. Researcher used Cronbach’s Alpha to test the reliability of the data with help
of SPSS windows version 23.
Table 4. 8 Reliability Result
Variable N of items Cronbach's Alpha Description
Brand Image (X1) 6 .795 α > 0.60 → RELIABLE
Perceived Price
(X2)
6 .812 α > 0.60 → RELIABLE
Perceived Quality
(X3)
8 .777 α > 0.60 → RELIABLE
Perceived Value
(X4)
5 .818 α > 0.60 → RELIABLE
Purchase Intention
(Y)
7 .746 α > 0.60 → RELIABLE
(Source: Data Processing Result of SPSS 23)
All the variables have the Cronbach’s Alpha computation are greater than Cronbach’s
Alpha standard of 0.6, hence they were all reliable.

48
4.2.3. Classical Assumption
This research is going to use multiple regression in analyzing data, so firstly it has to
do classic assumption testing, where in this case, researcher is using three kinds of
assumption as follows:
4.2.3.1. Normality Test
For this test, a good regression model has the normality distribution among
independent variables and dependent variable. In doing normality test, there are two
ways used in this research: Histogram and Normal P-Plot Regression Standardized
Residual.
Figure 4. 5 Histogram
(Source: Data Processing Result of SPSS 23)
Based on the histogram above, the curve shows that the data has spread to all normal
curve area and the curve skews in the center of the histogram. By looking at this
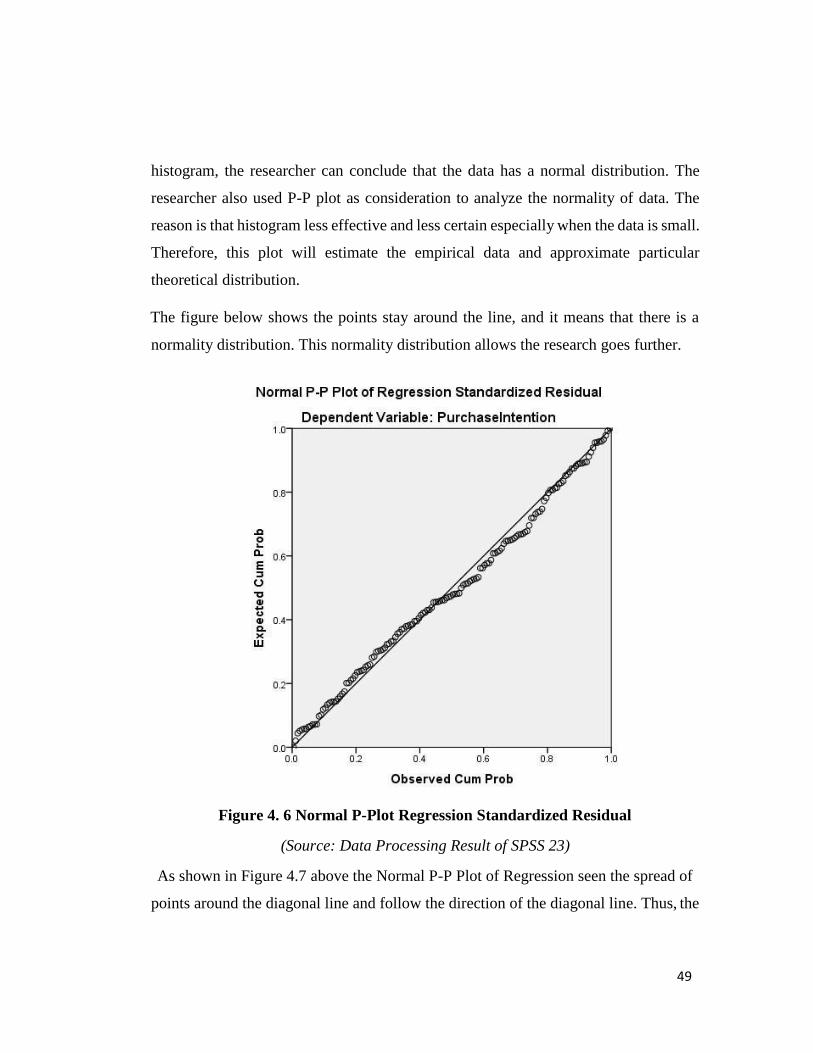
49
histogram, the researcher can conclude that the data has a normal distribution. The
researcher also used P-P plot as consideration to analyze the normality of data. The
reason is that histogram less effective and less certain especially when the data is small.
Therefore, this plot will estimate the empirical data and approximate particular
theoretical distribution.
The figure below shows the points stay around the line, and it means that there is a
normality distribution. This normality distribution allows the research goes further.
Figure 4. 6 Normal P-Plot Regression Standardized Residual
(Source: Data Processing Result of SPSS 23)
As shown in Figure 4.7 above the Normal P-P Plot of Regression seen the spread of
points around the diagonal line and follow the direction of the diagonal line. Thus, the
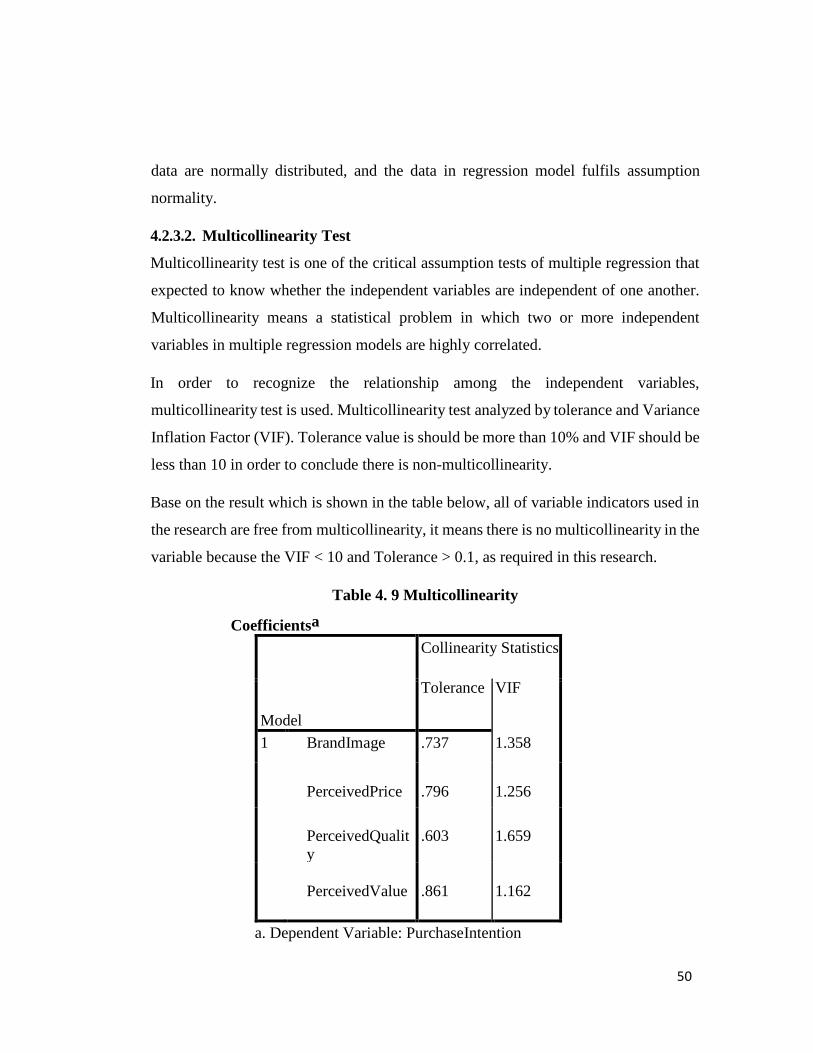
50
data are normally distributed, and the data in regression model fulfils assumption
normality.
4.2.3.2. Multicollinearity Test
Multicollinearity test is one of the critical assumption tests of multiple regression that
expected to know whether the independent variables are independent of one another.
Multicollinearity means a statistical problem in which two or more independent
variables in multiple regression models are highly correlated.
In order to recognize the relationship among the independent variables,
multicollinearity test is used. Multicollinearity test analyzed by tolerance and Variance
Inflation Factor (VIF). Tolerance value is should be more than 10% and VIF should be
less than 10 in order to conclude there is non-multicollinearity.
Base on the result which is shown in the table below, all of variable indicators used in
the research are free from multicollinearity, it means there is no multicollinearity in the
variable because the VIF < 10 and Tolerance > 0.1, as required in this research.
Coefficientsa
Table 4. 9 Multicollinearity
Model
Collinearity Statistics
Tolerance VIF
1 BrandImage .737 1.358
PerceivedPrice
.796
1.256
PerceivedQualit
y
.603
1.659
PerceivedValue
.861
1.162
a. Dependent Variable: PurchaseIntention
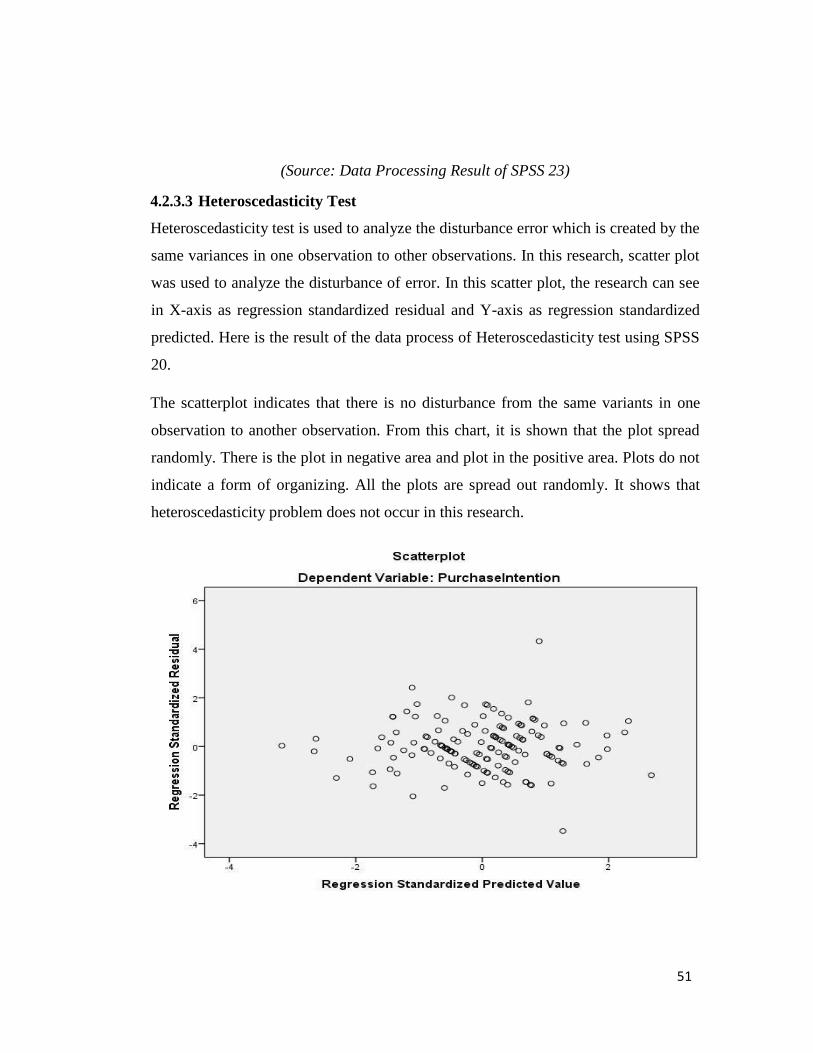
51
(Source: Data Processing Result of SPSS 23)
4.2.3.3 Heteroscedasticity Test
Heteroscedasticity test is used to analyze the disturbance error which is created by the
same variances in one observation to other observations. In this research, scatter plot
was used to analyze the disturbance of error. In this scatter plot, the research can see
in X-axis as regression standardized residual and Y-axis as regression standardized
predicted. Here is the result of the data process of Heteroscedasticity test using SPSS
20.
The scatterplot indicates that there is no disturbance from the same variants in one
observation to another observation. From this chart, it is shown that the plot spread
randomly. There is the plot in negative area and plot in the positive area. Plots do not
indicate a form of organizing. All the plots are spread out randomly. It shows that
heteroscedasticity problem does not occur in this research.
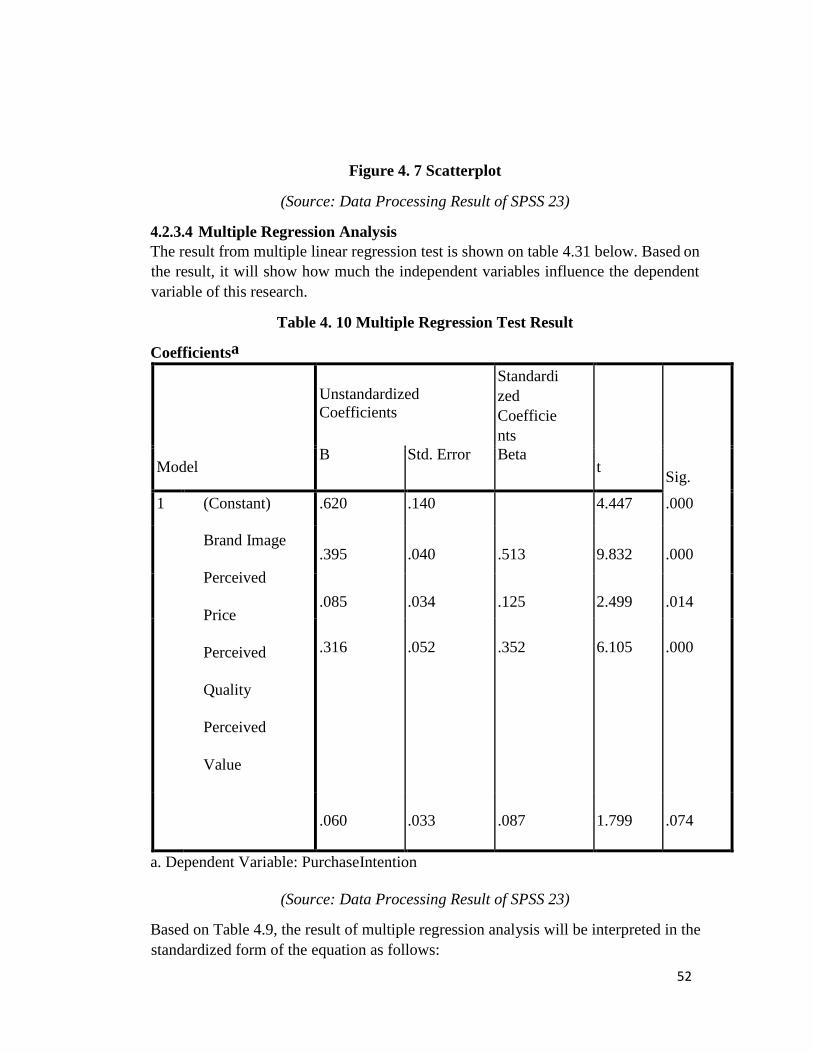
52
Figure 4. 7 Scatterplot
(Source: Data Processing Result of SPSS 23)
4.2.3.4 Multiple Regression Analysis
The result from multiple linear regression test is shown on table 4.31 below. Based on
the result, it will show how much the independent variables influence the dependent
variable of this research.
Table 4. 10 Multiple Regression Test Result
Coefficientsa
Model
Unstandardized
Coefficients
Standardi
zed
Coefficie
nts
t
B Std. Error Beta
Sig.
1 (Constant)
Brand Image
Perceived
Price
Perceived
Quality
Perceived
Value
.620 .140 4.447 .000
.395
.040
.513
9.832
.000
.085
.034
.125
2.499
.014
.316
.052
.352
6.105
.000
.060
.033
.087
1.799
.074
a. Dependent Variable: PurchaseIntention
(Source: Data Processing Result of SPSS 23)
Based on Table 4.9, the result of multiple regression analysis will be interpreted in the
standardized form of the equation as follows:
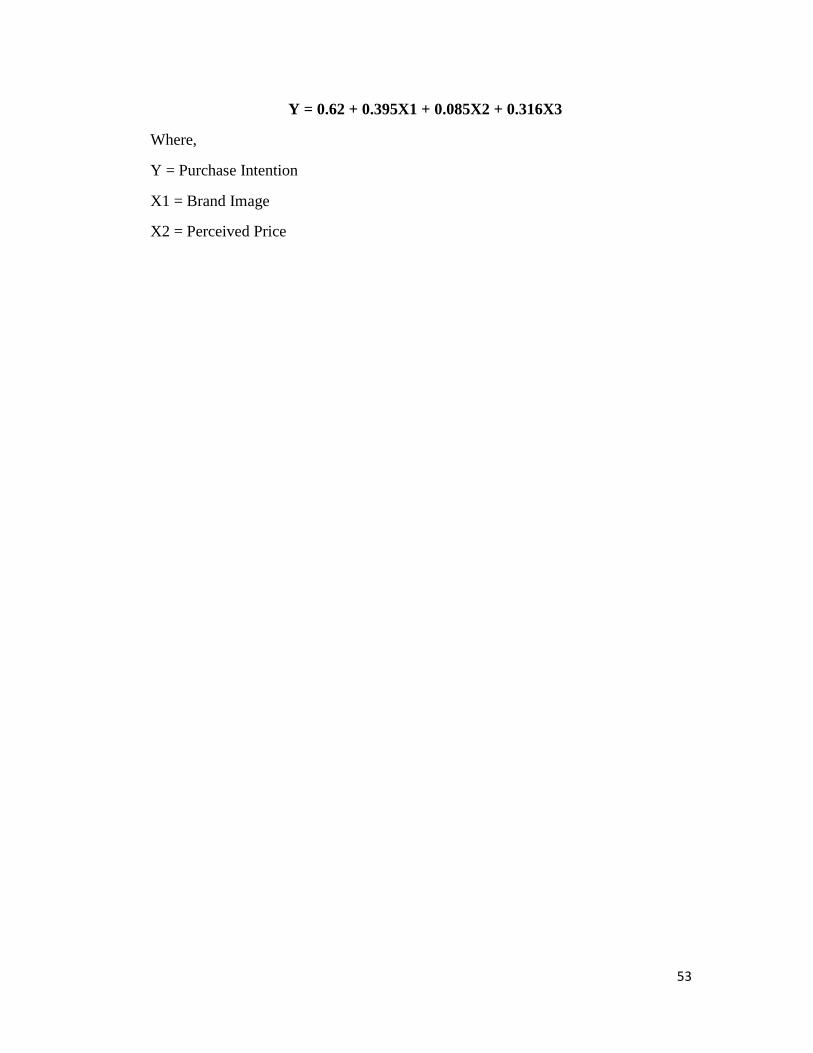
53
Y = 0.62 + 0.395X1 + 0.085X2 + 0.316X3
Where,
Y = Purchase Intention
X1 = Brand Image
X2 = Perceived Price

54
X3 = Perceived Quality
Based on the equation above, the result from multiple regression analysis test can be
summarized as follows:
1. The B coefficient of Brand Image shows a positive figure of 0.395 mean if there
is the one-point increase in Brand Image while all other independent variables
constant, it will lead to increase of the Purchase Intention by 39.5%. Otherwise, if there
is the one-point decrease in Brand Image while all another independent variable is
constant, it will lead to decrease of the purchase intention by 39.5%.
2. The B coefficient of Perceived Price shows a positive figure of 0.085 mean if
there is one-point increase in Perceived Price while all other independent variables
constant, it will lead to increase of the purchase intention by 8.5%. Otherwise, if there
is the one-point decrease in Perceived Price while all another independent variable is
constant, it will lead to decrease of the purchase intention by 8.5%.
3. The B coefficient of Perceived Quality shows a positive figure of 0.316 mean
if there is the one-point increase in Perceived Quality while all other independent
variables constant, it will lead to increase of the purchase intention by 31.6%.
Otherwise, if there is the one-point decrease in Perceived Quality while all another
independent variable is constant, it will lead to decrease of the purchase intention by
31.6%.
4.2.4 Hypothesis Testing
Hypothesis Testing consists of T-Test, F-Test, and Adjusted R square.
4.2.4.1 T-Test Significance
According to Table 4.32 above, the researcher indicates that three independent
variables are significant. Here is the final hypothesis result:
Brand Image (X1)
Ha1: There is a significant influence of Brand Image towards Purchase Intention
H01: There is no significant influence of Brand Image towards Purchase
Intention
The significant value of Brand Image is .000 which is lower than α (0.05). Therefore,
the variable does have significant influence on Purchase Intention. Meaning, Ha1 is
accepted, and H01 is rejected.
Perceived Price (X2)
Ha2: There is a significant influence of Perceived Price towards Purchase Intention

55
H02: There is no significant influence of Perceived Price towards Purchase Intention
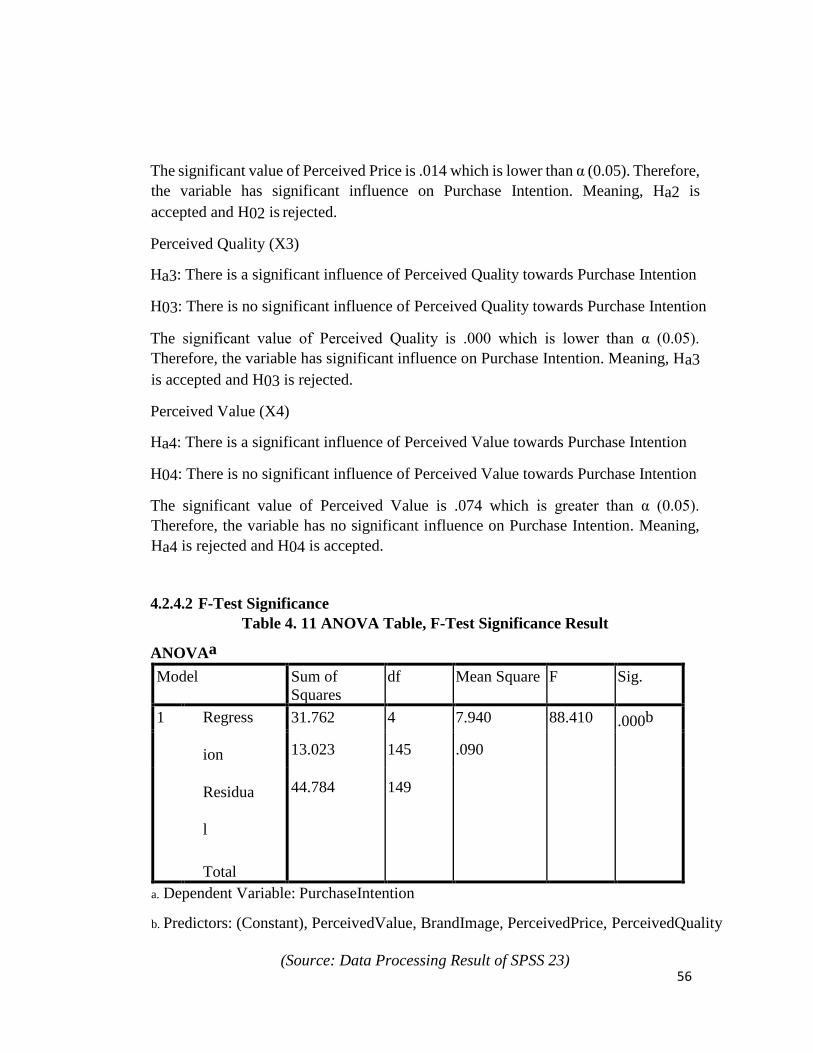
56
The significant value of Perceived Price is .014 which is lower than α (0.05). Therefore,
the variable has significant influence on Purchase Intention. Meaning, Ha2 is
accepted and H02 is rejected.
Perceived Quality (X3)
Ha3: There is a significant influence of Perceived Quality towards Purchase Intention
H03: There is no significant influence of Perceived Quality towards Purchase Intention
The significant value of Perceived Quality is .000 which is lower than α (0.05).
Therefore, the variable has significant influence on Purchase Intention. Meaning, Ha3
is accepted and H03 is rejected.
Perceived Value (X4)
Ha4: There is a significant influence of Perceived Value towards Purchase Intention
H04: There is no significant influence of Perceived Value towards Purchase Intention
The significant value of Perceived Value is .074 which is greater than α (0.05).
Therefore, the variable has no significant influence on Purchase Intention. Meaning,
Ha4 is rejected and H04 is accepted.
4.2.4.2 F-Test Significance
Table 4. 11 ANOVA Table, F-Test Significance Result
ANOVAa
Model Sum of
Squares
df Mean Square F Sig.
1 Regress
ion
Residua
l
Total
31.762 4 7.940 88.410 .000b
13.023 145 .090
44.784 149
a. Dependent Variable: PurchaseIntention
b. Predictors: (Constant), PerceivedValue, BrandImage, PerceivedPrice, PerceivedQuality
(Source: Data Processing Result of SPSS 23)

57
Based on the table 4.11 above, the result of F-test is shown accurately. All of the
independent variables used in this research are simultaneously significant towards

58
Purchase Intention. It is described by the level of significance that clocks in at 0.000
which is lower than the α (0.05), with F value calculated at 88.410. Thus, Ha5 is
accepted and H05 is rejected.
H05: There is no significant influence of Brand Image, Perceived Price, Perceived
Quality, and Perceived Value towards Purchase Intention
Ha5: There is a significant influence of Brand Image, Perceived Price, Perceived
Quality, and Perceived Value towards Purchase Intention
4.2.4.3 Adjusted R Square
Table 4. 12 Coefficient Determination (R2) Result
Model Summaryb
Model
R
R Square
Adjust
ed R
Square
Std. Error
of the
Estimate
Durbin-
Watson
1 .842a .709 .701 .29969 1.709
a. Predictors: (Constant), PerceivedValue, BrandImage, PerceivedPrice, PerceivedQuality
b. Dependent Variable: PurchaseIntention
(Source: Data Processing Result of SPSS 23)
The number of Adjusted R-Square was essentially to measure how far the model's
ability to explain variation in the dependent variable. In this research, Adjusted R
Square is 0.701, which means 70.1% that the dependent variable Purchase Intention is
influenced by the combination of independent variables which are Brand Image,
Perceived Price, Perceived Quality and Perceived Value. The rest which is 29.9%
(100% - 70.1%) will be explained by other factors which were not be associated with
this study. For the result, Adjusted R-Square is high and can be acceptable.
4.3 Discussions and Interpretation of Result
The researcher conducted a study about the influence of factors on customer purchase
intention with a study case of Zara customers Vietnam. Independent variables that were
used in this study are Brand Image (BI), Perceived Price (PP), Perceived Quality (PQ),
59
and Perceived Value (PV), while the dependent variable is Purchase Intention (PI). The
60
primary target of this research is to find out whether BI, PP, PQ, and PV have a
significant influence on PI or not.
Population in this research are millennials who are Zara's customers living in Vietnam.
The population is unknown. With the margin of error of 5% (0.05) and the significance
level of 95%, the total sample of this research is 150 respondents, and 30 respondents
have taken for the pre-test. The analysis used in this research is the classical assumption
(normality test, heteroscedasticity test, multicollinearity test, and autocorrelation test)
and hypothesis testing (T-test, F-test and Coefficient of Determination).
From the result of the regression model, Table 4.12 shows that the adjusted R-square
is 0.701 or 70.1%. It means, 70.1% of PI is explained by the independent variables (BI,
PP, PQ, and PV) of this research, whereas the rest 29.9% is explained by other factors
which are not excluded from the study. For F-test, the data analysis shows that F-
calculated is approximately 88.410 with significant value is 0.000. And compare to
0.05 of p-value, the number of probability is 0.000 < 0.05. So, it means that there is a
significant simultaneous influence of independent variables (BI, PP, PQ, and PV) on
the dependent variable (PI).
4.3.1 Influence of Brand Image on Purchase Intention
Based on the hypothesis of H1 it is shown that Brand Image has a significant influence
towards the Purchase Intention of Zara Vietnam's customers. Brand Image has T-Test
result of 9.832 with the significant value of 0.000 which is lower than α (0.05).
Therefore, Ha1 is accepted, which means there is a significant influence of brand
image towards purchase intention. The result of multiple linear regression also shows
a positive B coefficient of .395. It implies Brand Image is positive and have a
significant factor that can increase purchase intention by 39.5%.
In the same line with the previous researches by Li, (2017), Cham, et al. (2017) and
Tariq, et al. (2013), which stated that Brand Image has a strong positive correlation
purchase intention significantly. The researcher also noted a favorable image of the
clothing in the minds of consumers would develop interests and their purchase
intentions. The brand image gives the consumer an overall awareness of the product,
and it affects the purchase intention concerning recognition.
4.3.2 Influence of Perceived Price on Purchase Intention
Based on the hypothesis of H2 it is shown that Perceived Price has a significant
influence towards the Purchase Intention of Zara Vietnam's customers. Perceived Price
has T-Test result of 2.499 with the significant value of 0.014 which is lower than α
(0.05). Therefore, Ha2 is accepted, which means there is a significant influence of
Perceived Price towards purchase intention. The result of multiple linear regression

61
also shows a positive B coefficient of 0.085. It implies Perceived Price is positive and
have a significant factor that can increase purchase intention by 8.5%.
In the same line with the previous researches by Li (2017) and Lomboan (2017) , which
stated that Perceived Price does affect purchase intention significantly. Particularly in
Vietnam, there are many domestic fast-fashion brands, but customers are still buying
Zara for quality is given and brand-conscious awareness that commensurate with the
price that is perceived to be worth.
4.3.3 Influence of Perceived Quality on Purchase Intention
Based on the hypothesis of H3 it is shown that Perceived Quality has a significant
influence towards the Purchase Intention of Zara Vietnam's customers. Perceived
Quality has T-Test result of 6.105 with the significant value of 0.000 which is lower
than α (0.05). Therefore, Ha3 is accepted, which means there is a significant
influence of Perceived Quality towards purchase intention. The result of multiple
linear regression also shows a positive B coefficient of 0.316. It implies Perceived
Quality is positive and have a significant factor that can increase purchase intention
by 31.6%.
This result is linked with the result from previous researches by Lomboan (2017) and
Cham, et al. (2017), which said perceived quality becomes one of determining whether
consumers will buy a product. In choosing a quality product will be taken into
consideration when consumers will decide whether it is appropriate and responsive to
what consumers need or not, so today was a lot of enterprises are beginning to develop
products with better quality than other similar products to produce quality products for
customers feel good. Besides that, there are a lot of domestic fast-fashion brands with
the good quality; some brands maybe have the better quality than Zara. But the
customers are still referring Zara. Because in their opinion, the famous brand obviously
will have the better quality than other competitors.
4.3.4 Influence of Perceived Value on Purchase Intention
Based on the hypothesis of H4 it is shown that Perceived Value has a significant
influence towards the Purchase Intention of Zara Vietnam's customers. However,
Perceived Value has T-Test result of 1.799 with the significant value of 0.074 which
is greater than α (0.05). Therefore, H04 is accepted, which means there is no
significant influence of Perceived Value towards purchase intention.
In the same line with the previous research by Lomboan (2017), which is also a study
about clothing. Consumers will use subjective perceptions and cognitive values to
evaluate a product/service during their purchase. People perceive value by various
ways and in various dimensions. For example, some people tend to perceive value in a
rational manner while there are people perceive it emotionally as well. The study also
62
emphasizes that there are crucial needs for further understanding of how the perceived
value should be measured.
4.3.5 Brand Image, Perceived Price, Perceived Quality, and Perceived Value
toward Purchase Intention
Based on the hypothesis of H5 it is shown that Brand Image, Perceived Price, Perceived
Quality, and Perceived Value have a significant influence towards the Purchase
Intention of Zara Vietnam's customers. BI, PP, PQ and PV have the significant value
of 0.000 which is lower than α (0.05). Therefore, Ha5 is accepted, which means there
is a significant influence of Brand Image, Perceived Price, Perceived Quality, and
Perceived Value towards Purchase Intention.
CHAPTER V CONCLUSION
AND RECOMMENDATION
5.1 Conclusion
This result is done to investigate the significant influence of the five factors that
influence Customer Purchase Intention, the Case study of Zara Vietnam. There were
five independent variables analyzed in this study, and these were Brand Image,
Perceived Price, Perceived Quality, Perceived Value. The following were the
conclusion of the study based on the results:
1. Brand Image has a significant influence on Purchase Intention. Thus,
researcher rejects the Null Hypothesis (H01) and accepts the alternate hypothesis
(Ha1) which states there is a significant influence of Brand Image (X1) on Purchase
Intention (Y).
2. Perceived Price has a significant influence on Purchase Intention. Thus,
researcher rejects the Null Hypothesis (H02) and accepts the alternate hypothesis
(Ha2) which states there is a significant influence of Perceived Price (X2) on
Purchase Intention (Y).
3. Perceived Quality has a significant influence on Purchase Intention. Thus,
researcher rejects the Null Hypothesis (H03) and accepts the alternate hypothesis
(Ha3) which states there is a significant influence of Perceived Quality (X3) on
Purchase Intention (Y).
4. Perceived Value has no significant influence on Purchase Intention. Thus,
researcher accepts the Null Hypothesis (H04) and rejects the alternate hypothesis
(Ha4)
63
which states there is a significant influence of Perceived Value (X4) on Purchase
Intention (Y).
5. Researcher rejects the Null Hypothesis (H05) and accepts the alternate
hypothesis (Ha5) which states there is a simultaneously significance influence of
Brand Image, Perceived Price, Perceived Quality, and Perceived Value towards
Purchase Intention.
5.2 Future Recommendations
5.2.1 For Management of Zara Vietnam
There is no doubt that the fashion industry is developing in a dynamic environment.
Fast-fashion is a global phenomenon with many international brands performing fast
fashion system. Identify the factors that affect the purchase intention will be a
significant advantage for apparel manufacturers and retailers, and especially for Zara
Vietnam.
The results from this study can be seen from the analysis in the previous chapter. Data
analysis shows that brand image, perceived price and perceived quality have a
significant influence on the intention to buy for those who know the brand and have an
experience of purchasing Zara products. The details that we can conclude is by seeing
the result of the multiple regression analysis that shows Brand Image and Perceived
Quality are positive and have a significant factor that can increase purchase intention
by 39.5% and 31.6%. Zara can use this information as a reference to improve their
sales by improving brand awareness and product quality. It is looked like there is no
great advertising campaign from Zara Vietnam. Thus, marketers should create the ads
shows that Zara products have the best quality and the strongest brand awareness in
the fast-fashion industry in Vietnam.
5.2.3 For future researchers
As per the result of this study, it shows that there were variables that were not that
significant on customer purchase intention towards Zara Vietnam, thus, the future
researcher should also consider other variables regarding the topic, so the combined
result will be more specific. Researchers have to specify the measure of perceived
value for making clear the conceptualization and also dimensions to get the better result
from respondents. The researcher recommends to the future researcher for the same
study to choose different location aside from Ho Chi Minh in order to expand its
coverage and scope of the study. Also, it is recommended for the future researcher who
will conduct similar study to use different methods of spreading the questionnaire not
only through online method but also actually visiting malls or shopping centers where
Zara are actually located. In this case, the researcher can directly ask the respondents
and filtered questions can be asked directly and may lead to a more interesting results
64
compared to the previous study. A similar study that covers marketing mix variables
and other factors related to general economic condition may also be used since these
are not covered by this study.
Books
REFERENCES
Blackwell, R. D., Engel, J. F. & Miniard, P. W., 2001. Consumer Behavior. 9th ed.
s.l.:South-Western, Mason, OH.
Hair, F. J. J., Celsi, M., Bush, R. P. & Ortinau, D. J., 2007. Essentials of Marketing
Research. 3rd ed.
Kotler, P. & Keller, K. L., 2006. Marketing management. 12th ed. New Jersey :
Pearson Education
Lea-Greenwood, G., 2015. Fashion Marketing Communications. 1st ed.
Lewis, P., Saunders, M. & Thornhill, A., 2009. Research methods for business
students. 5th ed. UK: Prentice Hall: British Library Cataloguing-
inPublication Data.
Malhotra, N. K. & Peterson, M., 2010. Basic Marketing Research: A decision making
approach. 6th ed. New Jersey: USA: Prentice Hall..
65
Saunders, M., Lewis, P. & Thornhill, A., 2009. Research Methods for Busines Students.
Harlow: Pearson Education Limited. .
Westland, J. C., 2015. Structural equation models: From paths to networks. 1st ed.
Cooper, D. & Schindler, P., 2011. Business Research Method. New York::
McGrawHill Education.
Cohen, L., Manion, L. & Morrison, K., 2011. Research Methods in Education. 6th ed.
Oxon: Routledge.
Cooper, D. & Schindler, P., 2011. Business Research Method. New York::
McGrawHill Education.
Fletcher, K., 2008. Sustainable Fashion and Textiles: Design Journeys.
Kumar, R., 2014. Research Methodology: A Step-by-step guide for beginners. London:
Sage publications Ltd: 3rd ed.
Levine, D. M., Berenson, M. L. & Krehbiel, T. C. B. B., 2009. Basic Business Statistic:
Concepts and Applications. New Jersey: Pearson Prentice Hall.
Marchal, W., Lind, D. & Wathen, S., 2012. Basic Statistics for Business and
Economics.. .:McGraw-Hill Education..
Saunders, M., Lewis, P. & Thornhill, A., 2009. Research Methods for Busines Students.
Harlow: Pearson Education Limited. .
Sekaran, U. & Bougie, R., 2010. Research Methods for Business: A Skill:7th ed.
Journals
Abhigyan, S., 2014. Brand love in emerging market: a qualitative investigation.
Qualitative Market Research: An International Journal, 17(4), pp. 481-494.
66
Ana, M. P. & Juracy, P. G., 2015. Retail evolution model in. International Journal of
Retail & Distribution Management, 45(4), pp. 242 - 260.
Annika, R. & Christian, G., 1996. The value concept and relationship. European
Journal of Marketing, 4(4) , pp. 19-30.
Arslan, M., 2014. Impact of Brand Image and Service Quality on Consumer Purchase
Intention: A Study of Retail Store in Pakistan. Research on Humanities and
Social Sciences, 4(22), pp. 2224-5766.
Cham, T. H., Ng, C. K. Y., Lim, Y. M. & Cheng, B. L., 2017. Factors influencing
clothing interest and purchase intention: a study of Generation Y consumers.
The International Review of Retail, Distribution and Consumer Research,
11(5) , pp. 174-189.
Chen, Y. S. &. C. C. H., 2012. Enhance green purchase intentions: The roles of green
perceived value,green perceived risk, and green trust. Management
Decision, 12(6), pp. 502-520.
Chi, A. Y. Y., CHEE, C. M., CHENG, C. F. & VON, T. Y., 2014. FACTORS
INFLUENCING GENERATION Y‘S ONLINE PURCHASE INTENTION
IN BOOK INDUSTRY. Academy of World Business, Marketing and
Management Development Conference Proceedings, 6(1), pp. 176-188.
Ching, Y.-H., Wang, Y.-S. & Yieh, K., 2016. Predicting smartphone brand loyalty:
Consumer value and consumer-brand identification
perspectives. International Journal of Information Management, 5(9,)
pp. 245-257.
Cho, E. & Fiore, A. M., 2015. Conceptualization of a holistic brand image measure for
fashion-related brands. Journal of Consumer Marketing, 2(16), pp. 255265.
67
Clamp, B., 2015. The Fashion Industry and Advertising: The Positive and Negative
Aspects Associated with Using Children as Models. Effects of Advertising on
Positive and Negative, 1(9), pp. 6-16.
Dennis, C. et al., 2004. Measuring image: shopping centre case studies. The
International Review of Retail, Distribution and Consumer Research, 12(4),
pp. 355-373.
Diamantopoulos, A., 2011. The relationship between country of origin image and
brand image as drivers of purchase intentions. A test of alternative
perspectives. International Marketing, 28(5), pp. 508-524.
Fletcher, J. M., Stuebing, K. K. & Hughes, L. C., 2010. Decisions, IQ Scores Should
Be Corrected for the Flynn Effect in High-Stakes. Journal of
Psychoeducational Assessment, 5(28), p. 469–473.
Foster, B., 2016. Impact of Brand Image on Purchasing Decision on Mineral Water
Product “Amidis” (Case Study on Bintang Trading Company). American
Research Journal of Humanities and Social Sciences, 2(1), pp. 1-11.
Garretson, J. A. & Clow, K. E., 1999. The influence of coupon face value on service
quality expectations, risk perceptions and purchase intentions in the dental
industry. Journal of Services Marketing, 13(1), pp. 59-72.
Gill, M. & Leon, J., 2010. An introduction to descriptive statistics: A review and
practical guide. Radiography, 16(4), pp. e1-e7.
Gopal, D., 2015. Linkages between self-congruity, brand familiarity, perceived quality
and purchase intention: A study of fashion retail brands. Journal of Fashion
Marketing and Management, 6(3), pp. 188-204.
Graeff, T. R., 1997. Consumption situations and the effects of brand image on
consumers' brand. Psychology & Marketing, 14(1), pp. 49-70.
68
Grunerta, K. G., Bech-Larsen, T. & Jensen, L. B., 2010. Three issues in consumer
quality perception and acceptance. International Dairy Journal, 10(8), pp.
575-584.
Haryo, P. B. & Budhi, H., 2015. Factors Affecting Purchase Intention of Online
Shopping in Zalora Indonesia. British Journal of Economics, Management &
Trade, 9(1), pp. 1-12.
Hazlin, N. A. N. & Nurazariah, A., 2016. Perceived Quality and Emotional Value that
Influence Consumer's Purchase Intention towards American and Local
Products. Procedia Economics and Finance, 8(5), pp. 639-643.
Hsieh, M. H. & Setiono, R., 2004. Product-, corporate-, and country-image. Journal of
the, 5(3), pp. 251-270.
Hsi, L.-P. & Kuo, H.-L., 2010. The influence of extro/introversion on the intention to
pay for social networking sites. Information & Management, 1(13),pp.
150157.
Hu, K.-L. & Shiau, R.-J., 2015. AN EMPIRICAL STUDY OF PURCHASE
INTENTION ON FAST FASHION GOODS IN TAIWAN. The
International Journal of Organizational Innovation, 8(19), pp. 126-144.
Jin, B. & Kang, J. H., 2011. Purchase Intention of Chinese Consumers toward a US
Apparel Brand: A Test of A Composite Behavior Intention Model. Journal
of Consumer Marketing, 9(3), pp. 187-199.
Joffre, S. & Jillian, S. C., 2000. Perceived value and its impact on choice behavior in a
retail setting. Journal of Retailing and Consumer Services, 5(1), pp. 77-
88.
Joo, L. H. & Sun, Y. Z., 2015. Consumers’ perceptions of organic food attributes and
cognitive and affective attitudes as determinants of their purchase intentions
toward organic food. Food Quality and Preference, 39(1), pp. 259-267.

69
Joseph, J. C. J., Michael, B. K. & Tomas, H., 2000. Assessing the effects of quality,
value, and customer satisfaction on consumer behavioral intentions in service
environments. Journal of Retailing , 9(7), pp. 193-218.
Justin, B. & Natalia, Z., 2014. Beyond private label panache: The effect of store image
and perceived price on brand prestige. Journal of Consumer Marketing,
5(12), pp. 301-311.
Justin, B. & Stephen, C., 2015. The development of a consumer value proposition of
private label brands and the application thereof in a South African retail
context. Journal of Retailing and Consumer Services, 9(6), pp. 22-35.
Kashyap, R. & Bojanic, D. C., 2000. A Structural Analysis of Value, Quality, and Price
Perceptions of Business and Leisure Travelers. Journal of Travel Research,
39(1), pp. 45-51.
Korda, P. A. & Snoj, B., 2007. Direct and indirect effects of perceived price on
perceived value of mobile. Economics and Business, Marketing, 9(10), pp.
967-989..
Lee‐Young Min, Y. K. L. P. D. K. J. F., 2008. Factors affecting Mexican college
students' purchase intention toward a US apparel brand. Journal of Fashion
Marketing and Management, 12(3), pp. 294-307.
Le, H. N. & Tuan, N. V., 2013. National identity and the perceived values of foreign
products with local brands: The case of local wine in Vietnam. Journal of
marketing and logistic, 25(5), pp. 765-783.
Lerkpollakarn, A., 2012. A Study of Thai Consumers behavior towards fashion
Clothing. Silpakorn University International. College, 1(5), pp. 15-30.
Li, C.-P., 2017. Effects of Brand Image, Perceived Price, Perceived Quality, and
Perceived Value on the Purchase Intention towards Sports and Tourism
70
Products of the 2016 Taichung International Travel Fair. The Journal of
International Management Studies, 12(2), pp. 97-107.
Lomboan, L. K., 2017. Analysis the influence of Perceived quality, Perceived price
and Perceived value on consumer Purchase intention in traditional fabrics
(case study kaeng manado). Journal of Scientific Period Efficiency, 17(2), pp.
100-112.
Ly, T., 2017. Fashion industry faces threat of takeover by foreign brands. Fashion
journal, 1(5), pp. 20-29.
Mahlangu, B. & Kruger, L., 2015. The impact of the maintenance management system:
A case study of the PetroSA GTL refinery. vol26 (3), p. 166-180.
Malen, B., 2012. The Persistent Problems and Confounding Challenges of Educator
Incentives. The Case of TIF in Prince George’s County, Maryland, 26(6), pp.
892-933.
Malen, W., 2013. Fashion designers as business: London. Journal of Fashion
Marketing and Management, 12(3), pp. 398-414.
Mehmood, W. & Shafiq, O., 2015. Impact of Customer Satisfaction, Service Quality,
Brand Image. Journal of Marketing and Consumer Research, 5(6), pp.
174186.
Murray, F. J. & Andrea, P. M., 2009. Understanding descriptive statistics. Australian
Critical Care, 22(2), p. 93–97.
Nikolaos, K., Panagiotis, T. & Lambros, S., 2015. Identifying Drivers of Purchase
Intention for Private Label Brands. Preliminary Evidence from Greek
Consumers. Procedia - Social and Behavioral Sciences, 1(12), p. 522 – 528.
Oosthuizen, D., Spowart, J. & Meyer-Heydenrych, C. D., 2015. The relationship
between perceived price and consumers’ purchase intentions of private label
wine brands. African Journal of Hospitality, Tourism and Leisure, 4(2), pp.
71
1-17.
Perlstein, J., 2017. Opinion: Gen-Zers fragment and focus their social media time.
Engaging Generation Z: Marketing to a New Brand of Consumer, 1(15), pp.
56-89.
Romeo, B., Rinaldi, R., Rossi, M. & Terz, S., 2013. New Product Development in the
Fashion Industry: An Empirical Investigation of Italian Firms. International
Journal of Engineering Business Management, 5(1), pp. 1-9.
Sandeep, M. K. & Prasanna, D. K., 2016. Impact of Brand Equity on Customers
Purchase Decision Making while Choosing Branded over Unbranded
Apparel in Andhra Pradesh. International Journal of Applied Engineering
Research, 6(39), pp. 5202-5209.
Setiawan, R. & Achyar, A., 2012. Effects of Perceived Trust and Perceived Price on
Customers’ Intention to Buy in Online Store in Indonesia. ASEAN
MARKETING JOURNAL, Volume 4(1), pp. 26-36.
Sharon, L. & Zuraidah, S., 2014. Consumer Purchase Intention toward Products Made
in Malaysia vs. Made in China: A Conceptual Paper. Procedia - Social and
Behavioral Sciences, 8(2), pp. 37-45.
Shirin, K. & Kambiz, H. H., 2011. The Effect of the Country-of-Origin Image, Product
Knowledge. Chinese Business Review, 5(24), pp. 601-615.
Smith, J. R., 2010. he role of behavioral, normative, and control beliefs in the
consumption of Australian products and services by Chinese consumers.
Australasian Marketing Journal, 3(11), pp. 206-213.
Steenkamp, J.-B. & de Jong, M., 2011. A Global Investigation into the Constellation
of Consumer Attitudes Toward Global and Local Products. Journal of
Marketing, 74(6), pp. 18- 40.
72
Supranto, J., 2007. Teknik Sampling Untuk Survey dan Eksperimen. Teknik Sampling
Untuk Survey , 1(19), pp. 90-113.
Tariq, M. I., Nawaz, M. R., Nawaz, M. M. & But, H. A., 2013. Customer Perceptions
about Branding and Purchase Intention:. Journal of Basic and Applied, 3(2),
pp. 340-347.
Tee, P. & Chan, B., 2013. Malaysian young consumer preferences in choosing
international fashion brand. Journal of Human and Social Science Research,
2(6), pp. 31-38.
Tee, P. K., Gharleghi, B., Chan, B. & Samadi, B., 2015. Purchase Intention of
International Branded Clothes Fashion among Younger’s in Jakarta.
International Journal of Business and Social Research, 6(2), pp. 8-17.
Verleye, K., 2015. The co-creation experience from the customer perspective : an
experiment in designing compelling environments. Journal of Service
Management , 26(2), pp. 50-60.
Voona, J. P., Ngui, K. S. & Agrawal, A., 2011. Determinants of willingness to purchase
organic food: An exploratory study using structural equation modeling.
International Food and Agribusiness Management Review, 14(2), pp. 103-
120.
Wang, F., Zhang, H., Zang, H. & Ouyang, M., 2015. Purchasing pirated software: an
initial examination of Chinese consumers. Journal of Consumer Marketing,
5(10), pp. 340-351.
Warat, W., 2014. Global vs. Local Brands: How Home Country Bias and Price
Differences Impact Brand Evaluations. International Marketing Review,
31(2), pp. 102-128.

73
Wu, L. Y., Chen, K. Y., Chen, P. Y. & Cheng, S. L., 2014. Perceived value, transaction
cost, and repurchase intention in online shopping: A relational exchange
perspective. Journal of Business Research, 1(67), pp. 2768-2776..
Yee, C. J. & San, N. C., 2011. Consumers’Perceived Quality, Perceived Value and
Perceived Risk Towards Purchase Decision on Automobile. American
Journal of Economics and Business Administration, 3(1), pp. 47-57.
Yeh, H. R. & Chi, H., 2009. The Impact of Brand Awareness on Consumer Purchase
Intention: The Mediating Effect of Perceived Quality and Brand Loyalty.
Journal of International Management Studies, 11(6), pp. 135-144.
Yu, C.-C., Lin, P.-J. & Chen, C.-S., 2013. How brand image, country of origin, and
self-congruity influence Internet users’ purchase intention. Social Behavior
and Personality: An international journal,, 41(4), pp. 599-612.
Zeinab, P. & Fereshteh, L., 2016. Investigation of the Influence of Perceived Quality,
Price and Risk on Perceived Product Value for Mobile Consumers. Asian
Social Science, 12(1), pp. 103-116.
Zeithaml, V. A., 1988. Consumer Perceptions of Price, Quality, and Value: A
MeansEnd Model and Synthesis of Evidence. Journal of Marketing, 52(3),
pp. 2-
22.
Websites
Vietnambiz, 2018. [Online] https://vietnambiz.vn/sau-hm-den-luot-zara-e-am-
48467.html
74
Bloomberg, 2017. [Online] https://www.bloomberg.com/news/articles/2017-12-
15/fast-fashion-fail-isactually-a-problem-for-zara Brandsvietnam, 2016. [Online]
http://www.brandsvietnam.com/10494-Ai-dua-Zara-ve-Viet-Nam
Appendix A – Questionnaire
APPENDICES
QUESTIONNAIRE
Dear Respondents, Greetings!
I am Ho Hoang Hiep, the student of President University, Indonesia with a
concentration of Marketing – Management. I am requesting for your help to fill in this
questionnaire regarding Zara brand, in this research entitled “THE INFLUENCING
OF BRAND IMAGE, PERCEIVED PRICE, PERCEIVED QUALITY, AND
PERCEIVED VALUE ON THE PURCHASE INTENTION TOWARDS FAST-
FASHION INDUSTRY. A case study of Fashion Product of ZARA in Vietnam.”
This undergraduate thesis is a final requirement for finishing my bachelor degree in
Management.
Should you have any comments or question, you are welcome to contact me by email:
[email protected] Part I. Filtering Questions:
Have you purchased product from Zara?
Yes (Please continue the questionnaire)
No (You may stop to fill questionnaire)
Part II. Demographic Profiles
Gender
Male
Age
Female

75
15 - 19 20 - 24
Education
25 - 29 30 - 34
High School Student College/University
Master/PHD Other
Occupation
Student Employees
Professional House wife
Others
Monthly incomes
< 3,000,000 VND 3,000,000 - 4,5000,000 VND
4,500,000 - 7,500,000 VND 7,500,000 – 15,000,000 VND
> 15,000,000 VND
Part III. Please fill in the statement below with ( ) SD = 1) Strongly Disagree, 2) D
= Disagree, 3) N = Neutral, 4) A = Agree, 5) SA = Strongly Agree.
Brand Image SD D N A SA
1 I can distinguish Zara brand element from other brands
2 I am convinced that Zara brand is a leader in Fashion industry in
Vietnam.
3 I tend to purchase Zara products that really make me look good in front
of my friends
4 Zara brand is better than others fast-fashion brand
5 I feel that Zara brand is socially responsible
Perceived Price
SD D N A SA
1 Zara product is reasonably priced
2 Zara product offers value for money
3 Zara product is a good product for the price
4 The price of Zara product is acceptable
5 I can afford to buy Zara products.
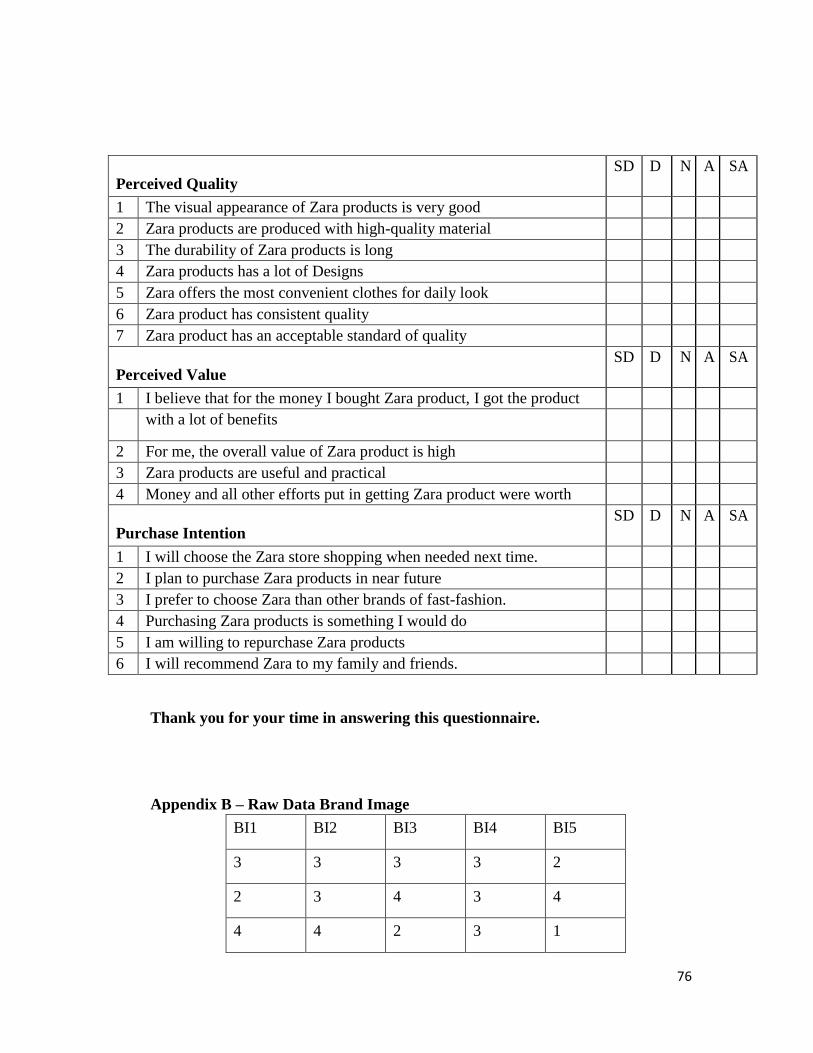
76
Perceived Quality
SD D N A SA
1 The visual appearance of Zara products is very good
2 Zara products are produced with high-quality material
3 The durability of Zara products is long
4 Zara products has a lot of Designs
5 Zara offers the most convenient clothes for daily look
6 Zara product has consistent quality
7 Zara product has an acceptable standard of quality
Perceived Value
SD D N A SA
1 I believe that for the money I bought Zara product, I got the product
with a lot of benefits
2 For me, the overall value of Zara product is high
3 Zara products are useful and practical
4 Money and all other efforts put in getting Zara product were worth
Purchase Intention
SD D N A SA
1 I will choose the Zara store shopping when needed next time.
2 I plan to purchase Zara products in near future
3 I prefer to choose Zara than other brands of fast-fashion.
4 Purchasing Zara products is something I would do
5 I am willing to repurchase Zara products
6 I will recommend Zara to my family and friends.
Thank you for your time in answering this questionnaire.
Appendix B – Raw Data Brand Image
BI1 BI2 BI3 BI4 BI5
3 3 3 3 2
2 3 4 3 4
4 4 2 3 1
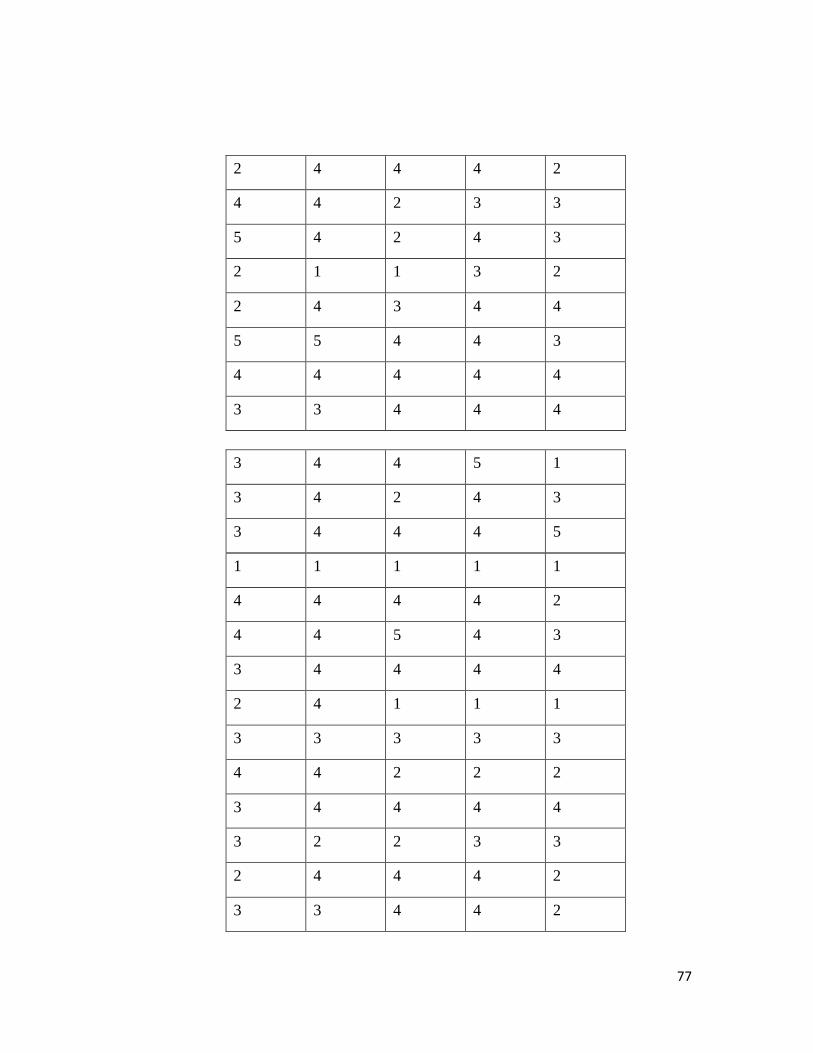
77
2 4 4 4 2
4 4 2 3 3
5 4 2 4 3
2 1 1 3 2
2 4 3 4 4
5 5 4 4 3
4 4 4 4 4
3 3 4 4 4
3 4 4 5 1
3 4 2 4 3
3 4 4 4 5
1 1 1 1 1
4 4 4 4 2
4 4 5 4 3
3 4 4 4 4
2 4 1 1 1
3 3 3 3 3
4 4 2 2 2
3 4 4 4 4
3 2 2 3 3
2 4 4 4 2
3 3 4 4 2
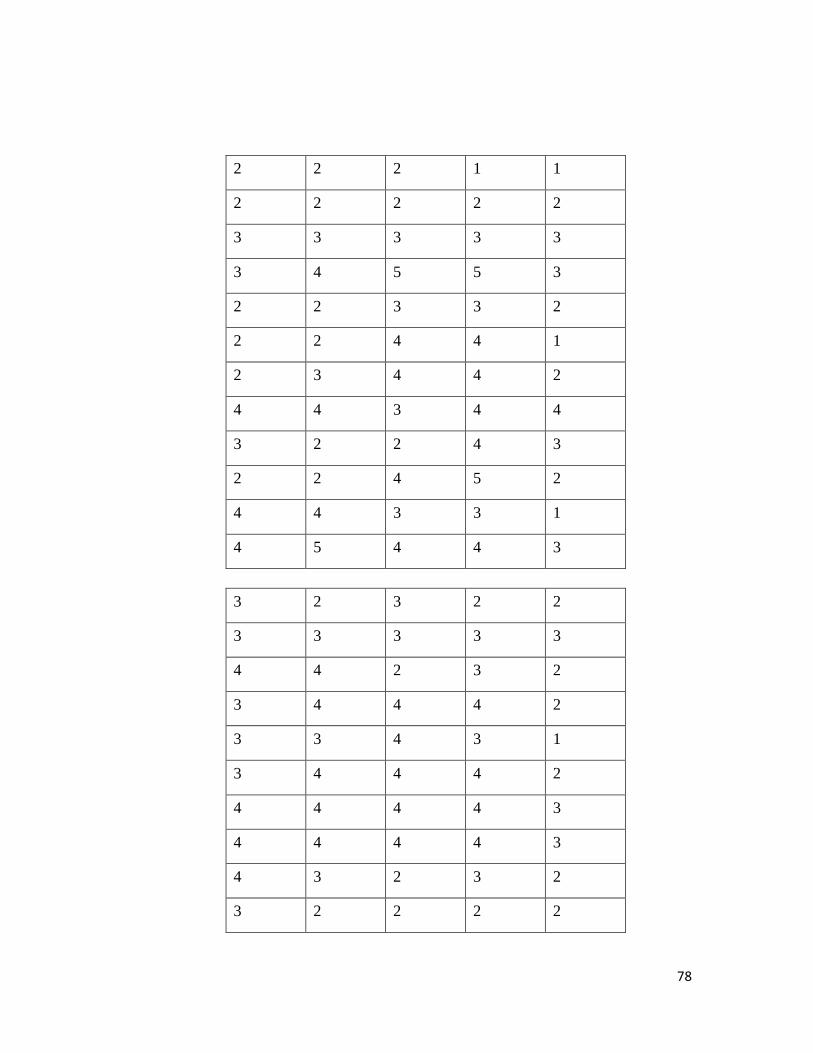
78
2 2 2 1 1
2 2 2 2 2
3 3 3 3 3
3 4 5 5 3
2 2 3 3 2
2 2 4 4 1
2 3 4 4 2
4 4 3 4 4
3 2 2 4 3
2 2 4 5 2
4 4 3 3 1
4 5 4 4 3
3 2 3 2 2
3 3 3 3 3
4 4 2 3 2
3 4 4 4 2
3 3 4 3 1
3 4 4 4 2
4 4 4 4 3
4 4 4 4 3
4 3 2 3 2
3 2 2 2 2
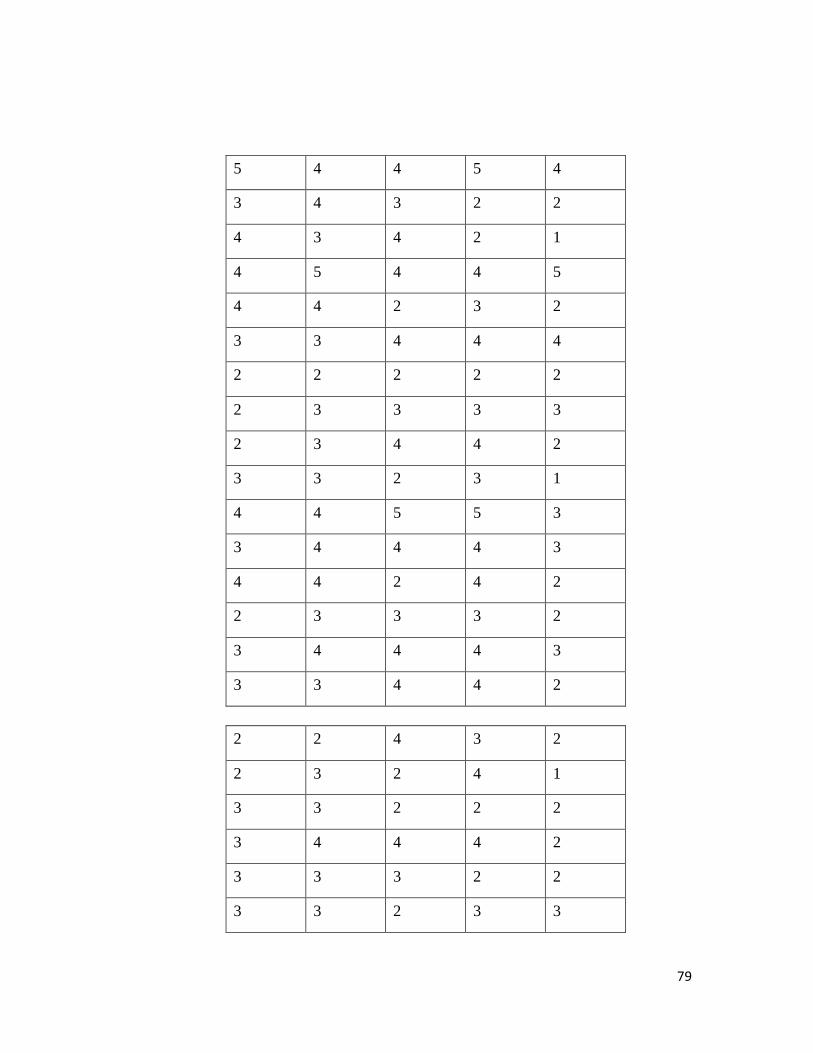
79
5 4 4 5 4
3 4 3 2 2
4 3 4 2 1
4 5 4 4 5
4 4 2 3 2
3 3 4 4 4
2 2 2 2 2
2 3 3 3 3
2 3 4 4 2
3 3 2 3 1
4 4 5 5 3
3 4 4 4 3
4 4 2 4 2
2 3 3 3 2
3 4 4 4 3
3 3 4 4 2
2 2 4 3 2
2 3 2 4 1
3 3 2 2 2
3 4 4 4 2
3 3 3 2 2
3 3 2 3 3

80
3 3 3 2 2
3 3 2 2 3
2 3 3 4 2
2 4 3 3 5
1 1 1 1 1
2 3 2 3 1
3 4 3 2 3
2 2 3 2 3
3 3 3 2 3
2 4 4 4 3
3 3 2 3 2
2 3 4 4 3
3 4 3 3 2
2 2 5 5 3
3 3 4 4 3
3 4 4 4 3
3 3 3 3 4
3 3 4 4 3
4 5 3 4 3
3 3 3 3 1
3 3 3 3 3
3 4 4 4 2
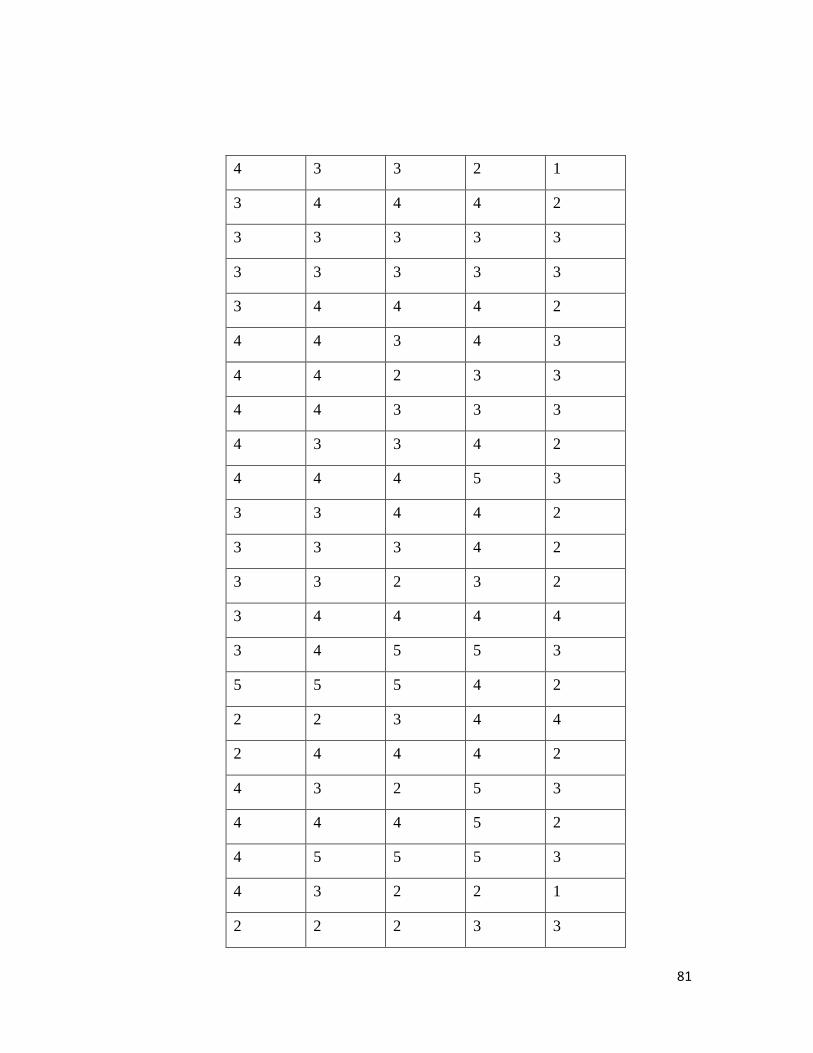
81
4 3 3 2 1
3 4 4 4 2
3 3 3 3 3
3 3 3 3 3
3 4 4 4 2
4 4 3 4 3
4 4 2 3 3
4 4 3 3 3
4 3 3 4 2
4 4 4 5 3
3 3 4 4 2
3 3 3 4 2
3 3 2 3 2
3 4 4 4 4
3 4 5 5 3
5 5 5 4 2
2 2 3 4 4
2 4 4 4 2
4 3 2 5 3
4 4 4 5 2
4 5 5 5 3
4 3 2 2 1
2 2 2 3 3

82
2 3 3 3 4
3 3 4 4 3
2 3 3 3 4
1 5 3 3 4
4 4 3 3 4
1 2 2 2 3
1 2 2 3 3
2 2 3 3 3
3 3 3 3 3
1 2 3 4 4
4 2 2 1 3
3 3 4 4 3
2 2 2 3 3
3 3 4 3 3
2 2 3 4 4
3 2 4 3 3
4 4 5 5 3
4 4 4 4 4
3 3 3 3 3
5 5 5 5 5
3 3 3 4 4
2 3 4 5 5
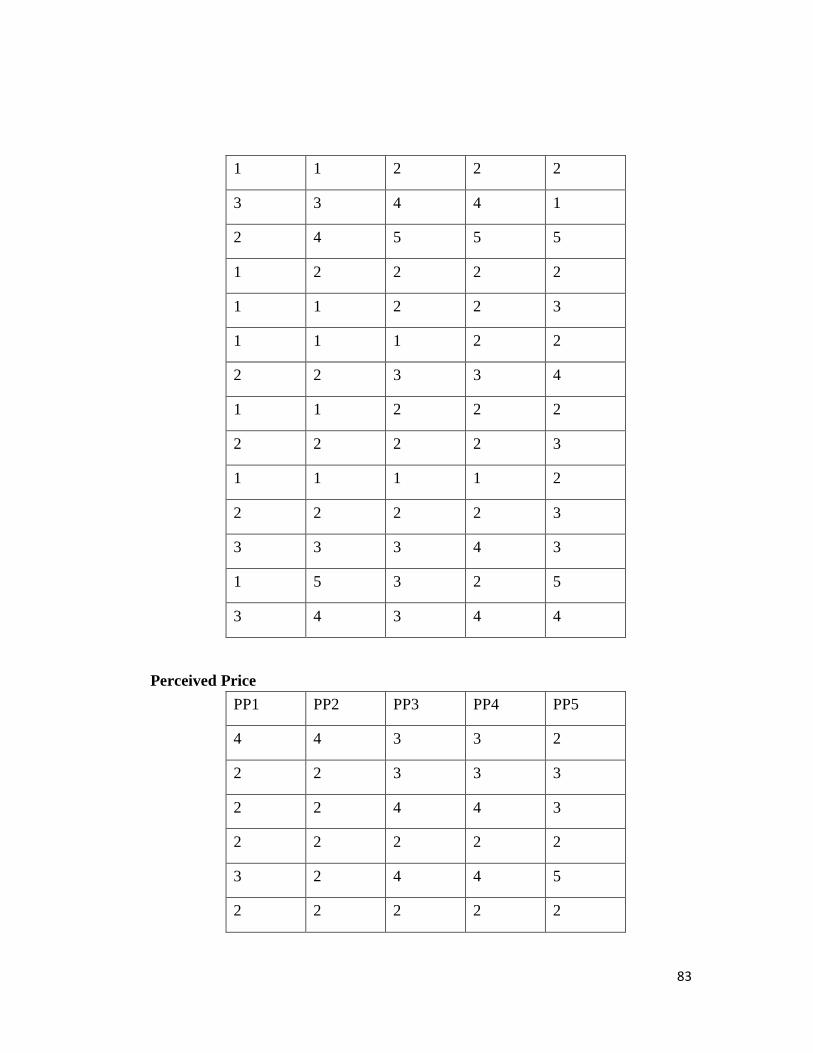
83
1 1 2 2 2
3 3 4 4 1
2 4 5 5 5
1 2 2 2 2
1 1 2 2 3
1 1 1 2 2
2 2 3 3 4
1 1 2 2 2
2 2 2 2 3
1 1 1 1 2
2 2 2 2 3
3 3 3 4 3
1 5 3 2 5
3 4 3 4 4
Perceived Price
PP1 PP2 PP3 PP4 PP5
4 4 3 3 2
2 2 3 3 3
2 2 4 4 3
2 2 2 2 2
3 2 4 4 5
2 2 2 2 2
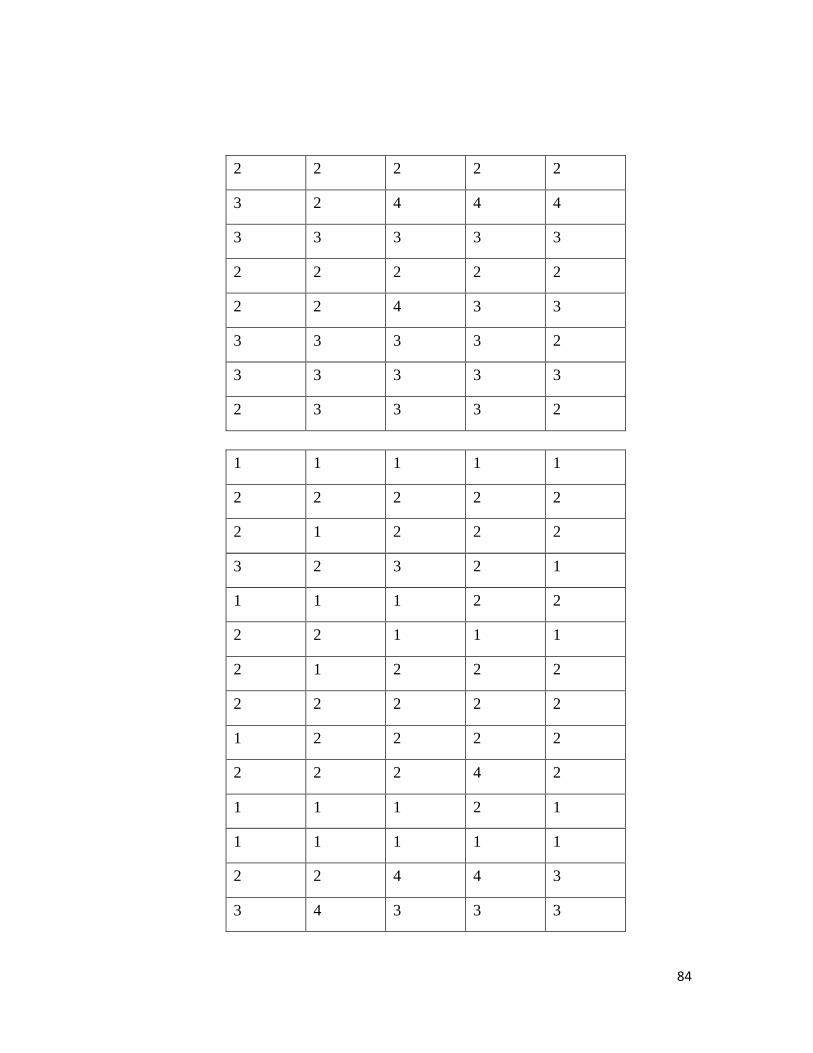
84
2 2 2 2 2
3 2 4 4 4
3 3 3 3 3
2 2 2 2 2
2 2 4 3 3
3 3 3 3 2
3 3 3 3 3
2 3 3 3 2
1 1 1 1 1
2 2 2 2 2
2 1 2 2 2
3 2 3 2 1
1 1 1 2 2
2 2 1 1 1
2 1 2 2 2
2 2 2 2 2
1 2 2 2 2
2 2 2 4 2
1 1 1 2 1
1 1 1 1 1
2 2 4 4 3
3 4 3 3 3

85
2 2 3 3 3
3 4 3 3 2
1 5 4 4 1
1 1 1 1 1
4 4 5 5 4
2 1 3 3 1
2 2 4 4 3
2 3 2 2 2
3 4 2 2 3
1 3 3 5 3
3 2 3 3 3
2 2 4 3 4
4 2 4 4 4
1 1 2 3 2
2 2 3 3 2
2 2 2 4 3
3 3 3 3 3
3 2 5 4 4
3 3 4 4 3
4 3 4 3 4
5 4 3 3 2
3 3 1 1 3
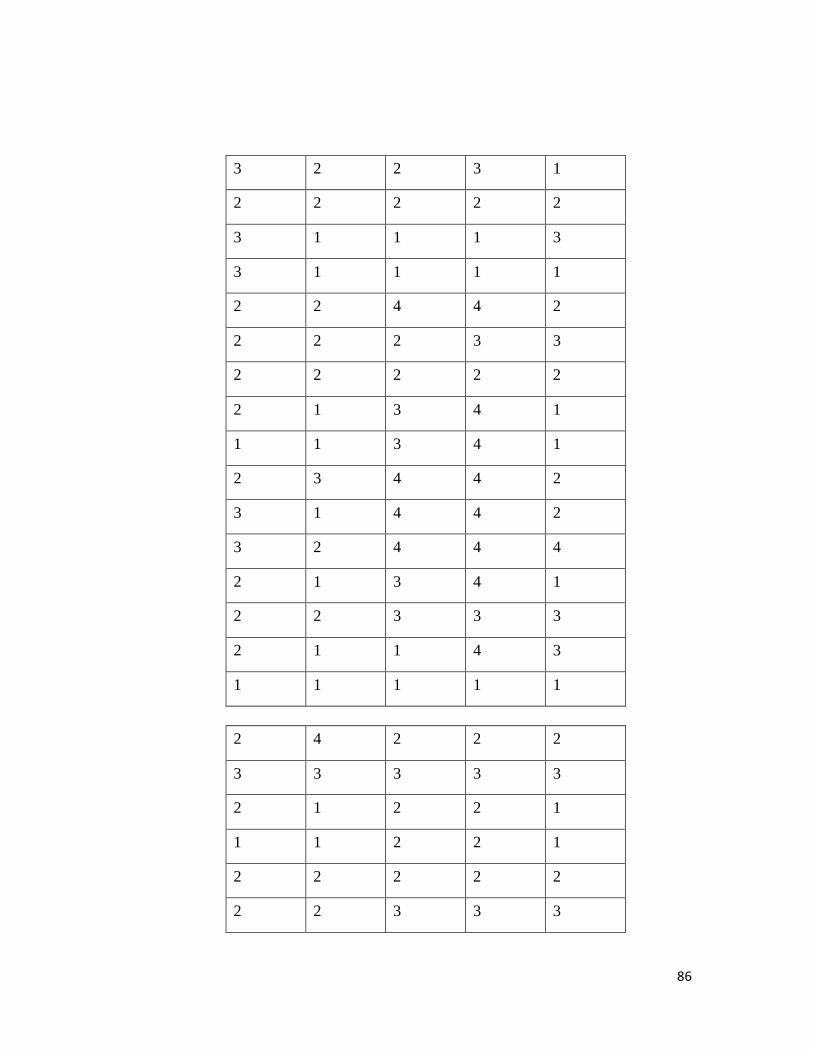
86
3 2 2 3 1
2 2 2 2 2
3 1 1 1 3
3 1 1 1 1
2 2 4 4 2
2 2 2 3 3
2 2 2 2 2
2 1 3 4 1
1 1 3 4 1
2 3 4 4 2
3 1 4 4 2
3 2 4 4 4
2 1 3 4 1
2 2 3 3 3
2 1 1 4 3
1 1 1 1 1
2 4 2 2 2
3 3 3 3 3
2 1 2 2 1
1 1 2 2 1
2 2 2 2 2
2 2 3 3 3
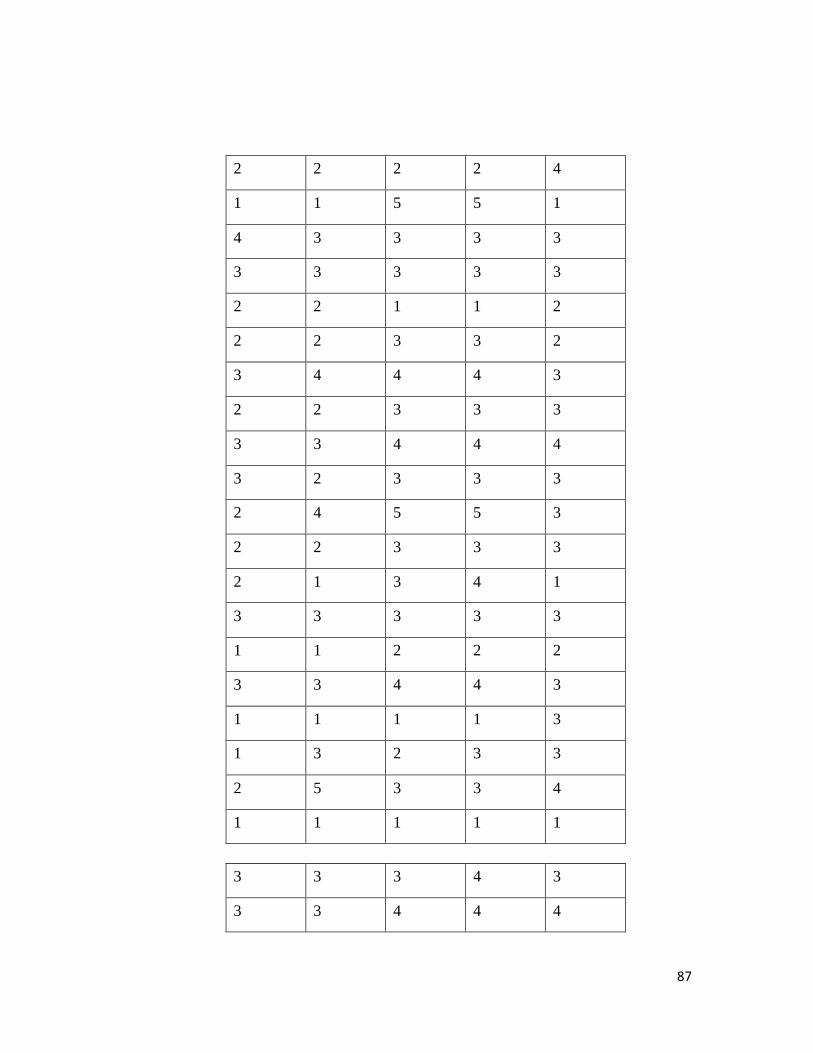
87
2 2 2 2 4
1 1 5 5 1
4 3 3 3 3
3 3 3 3 3
2 2 1 1 2
2 2 3 3 2
3 4 4 4 3
2 2 3 3 3
3 3 4 4 4
3 2 3 3 3
2 4 5 5 3
2 2 3 3 3
2 1 3 4 1
3 3 3 3 3
1 1 2 2 2
3 3 4 4 3
1 1 1 1 3
1 3 2 3 3
2 5 3 3 4
1 1 1 1 1
3 3 3 4 3
3 3 4 4 4
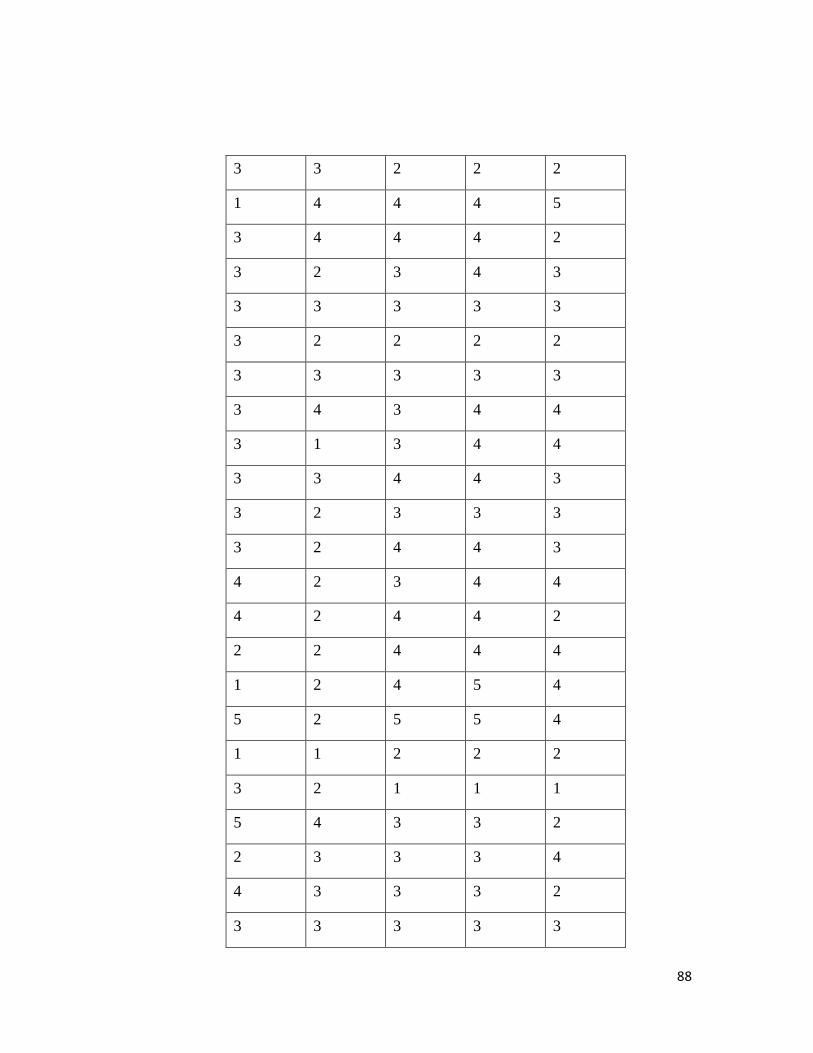
88
3 3 2 2 2
1 4 4 4 5
3 4 4 4 2
3 2 3 4 3
3 3 3 3 3
3 2 2 2 2
3 3 3 3 3
3 4 3 4 4
3 1 3 4 4
3 3 4 4 3
3 2 3 3 3
3 2 4 4 3
4 2 3 4 4
4 2 4 4 2
2 2 4 4 4
1 2 4 5 4
5 2 5 5 4
1 1 2 2 2
3 2 1 1 1
5 4 3 3 2
2 3 3 3 4
4 3 3 3 2
3 3 3 3 3
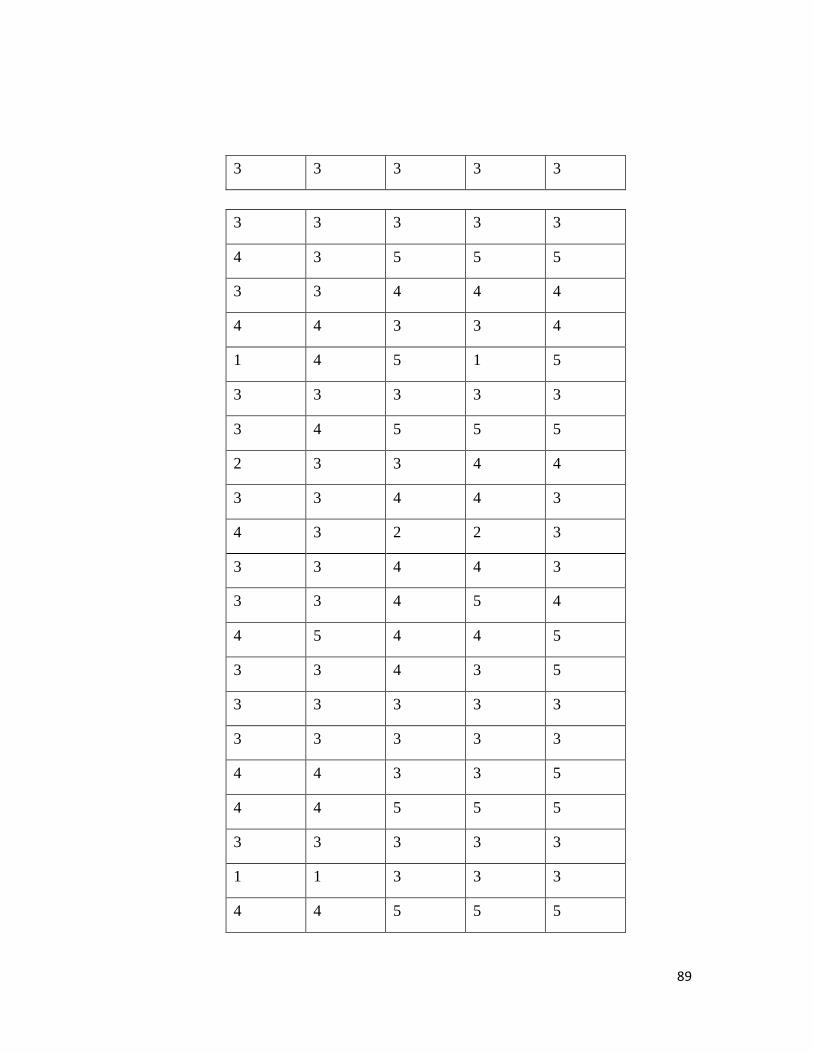
89
3 3 3 3 3
3 3 3 3 3
4 3 5 5 5
3 3 4 4 4
4 4 3 3 4
1 4 5 1 5
3 3 3 3 3
3 4 5 5 5
2 3 3 4 4
3 3 4 4 3
4 3 2 2 3
3 3 4 4 3
3 3 4 5 4
4 5 4 4 5
3 3 4 3 5
3 3 3 3 3
3 3 3 3 3
4 4 3 3 5
4 4 5 5 5
3 3 3 3 3
1 1 3 3 3
4 4 5 5 5
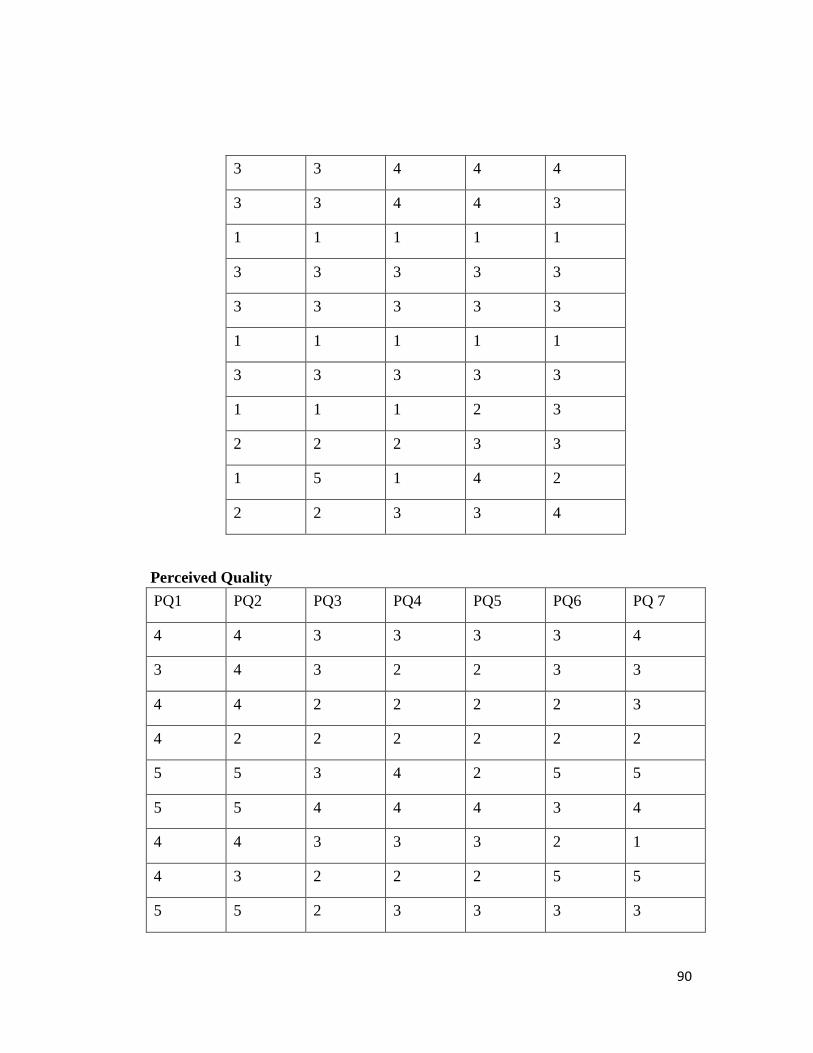
90
3 3 4 4 4
3 3 4 4 3
1 1 1 1 1
3 3 3 3 3
3 3 3 3 3
1 1 1 1 1
3 3 3 3 3
1 1 1 2 3
2 2 2 3 3
1 5 1 4 2
2 2 3 3 4
Perceived Quality
PQ1 PQ2 PQ3 PQ4 PQ5 PQ6 PQ 7
4 4 3 3 3 3 4
3 4 3 2 2 3 3
4 4 2 2 2 2 3
4 2 2 2 2 2 2
5 5 3 4 2 5 5
5 5 4 4 4 3 4
4 4 3 3 3 2 1
4 3 2 2 2 5 5
5 5 2 3 3 3 3

91
4 3 2 4 2 2 4
5 5 2 3 3 2 2
2 2 2 2 2 2 1
4 4 3 3 3 2 3
4 4 3 3 2 2 2
3 3 1 1 1 1 1
4 4 2 2 2 3 3
4 4 2 1 1 2 2
4 4 3 3 3 3 3
4 3 2 1 2 4 1
3 4 4 4 1 4 3
4 4 2 2 2 1 2
5 4 2 2 2 2 4
4 4 3 2 2 1 3
2 4 2 2 2 2 2
5 3 1 2 1 1 2
2 2 1 1 1 1 1
4 4 3 3 3 4 2
4 4 4 3 3 3 3
4 4 3 4 3 3 3
4 3 2 3 2 2 2
4 4 1 2 1 3 1
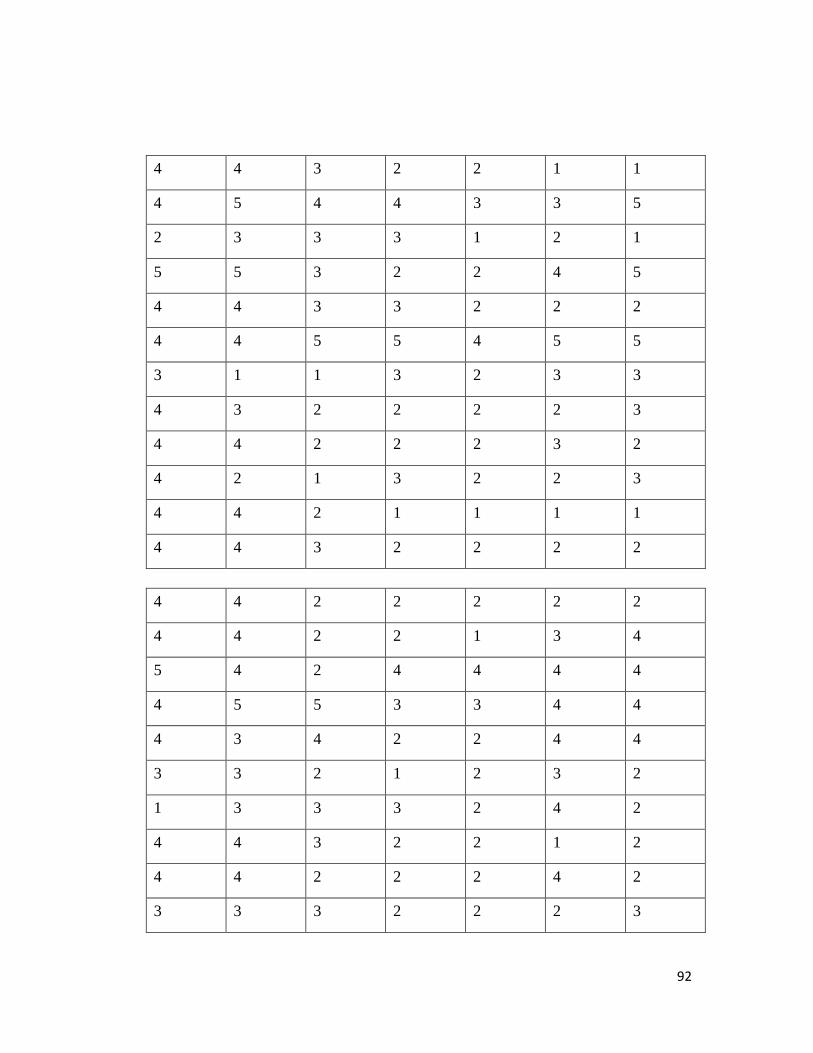
92
4 4 3 2 2 1 1
4 5 4 4 3 3 5
2 3 3 3 1 2 1
5 5 3 2 2 4 5
4 4 3 3 2 2 2
4 4 5 5 4 5 5
3 1 1 3 2 3 3
4 3 2 2 2 2 3
4 4 2 2 2 3 2
4 2 1 3 2 2 3
4 4 2 1 1 1 1
4 4 3 2 2 2 2
4 4 2 2 2 2 2
4 4 2 2 1 3 4
5 4 2 4 4 4 4
4 5 5 3 3 4 4
4 3 4 2 2 4 4
3 3 2 1 2 3 2
1 3 3 3 2 4 2
4 4 3 2 2 1 2
4 4 2 2 2 4 2
3 3 3 2 2 2 3
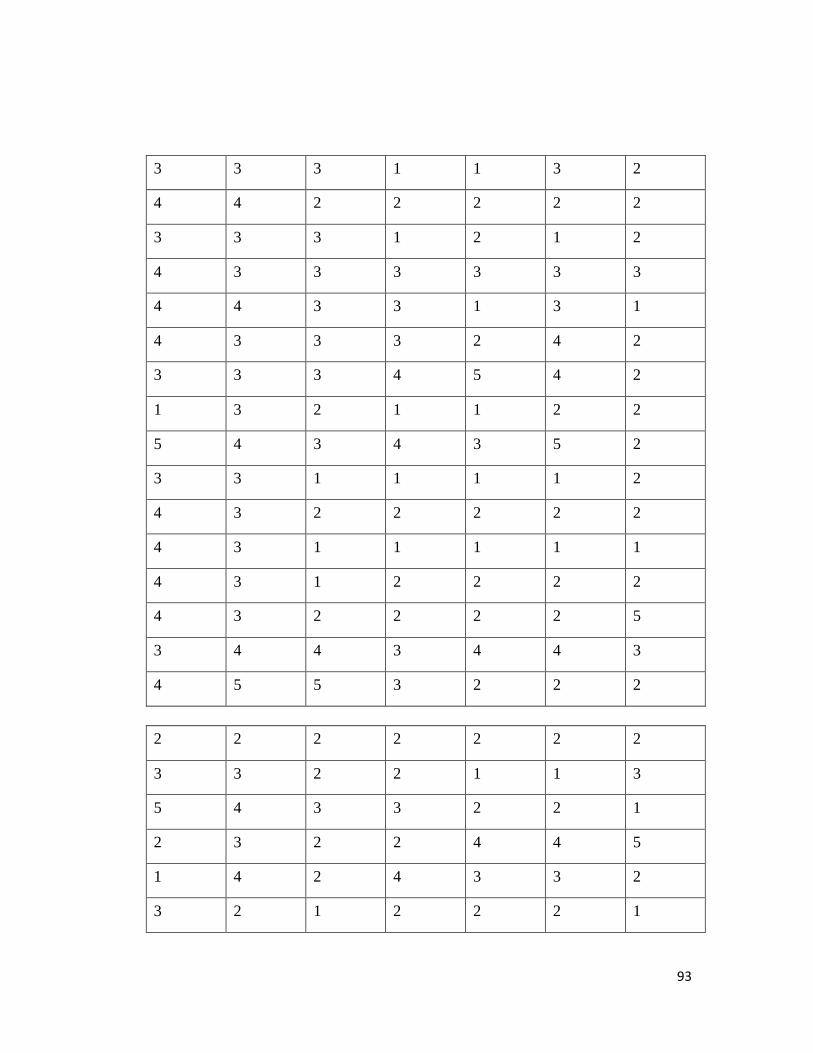
93
3 3 3 1 1 3 2
4 4 2 2 2 2 2
3 3 3 1 2 1 2
4 3 3 3 3 3 3
4 4 3 3 1 3 1
4 3 3 3 2 4 2
3 3 3 4 5 4 2
1 3 2 1 1 2 2
5 4 3 4 3 5 2
3 3 1 1 1 1 2
4 3 2 2 2 2 2
4 3 1 1 1 1 1
4 3 1 2 2 2 2
4 3 2 2 2 2 5
3 4 4 3 4 4 3
4 5 5 3 2 2 2
2 2 2 2 2 2 2
3 3 2 2 1 1 3
5 4 3 3 2 2 1
2 3 2 2 4 4 5
1 4 2 4 3 3 2
3 2 1 2 2 2 1
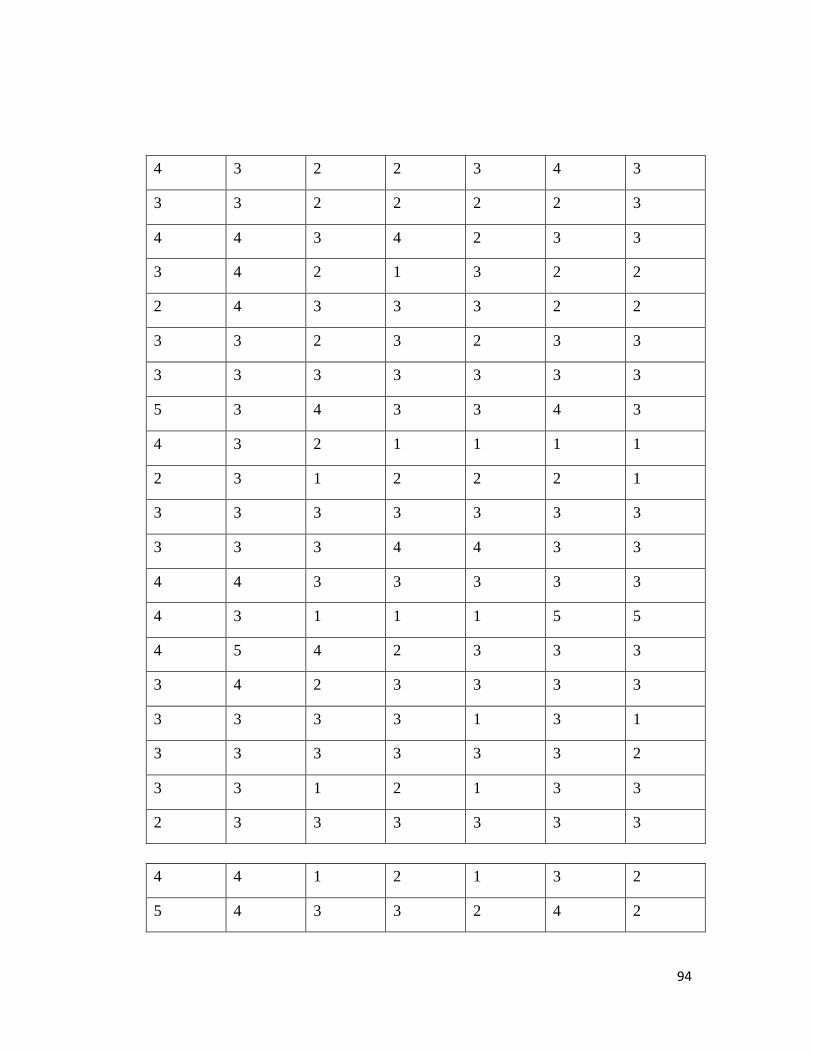
94
4 3 2 2 3 4 3
3 3 2 2 2 2 3
4 4 3 4 2 3 3
3 4 2 1 3 2 2
2 4 3 3 3 2 2
3 3 2 3 2 3 3
3 3 3 3 3 3 3
5 3 4 3 3 4 3
4 3 2 1 1 1 1
2 3 1 2 2 2 1
3 3 3 3 3 3 3
3 3 3 4 4 3 3
4 4 3 3 3 3 3
4 3 1 1 1 5 5
4 5 4 2 3 3 3
3 4 2 3 3 3 3
3 3 3 3 1 3 1
3 3 3 3 3 3 2
3 3 1 2 1 3 3
2 3 3 3 3 3 3
4 4 1 2 1 3 2
5 4 3 3 2 4 2
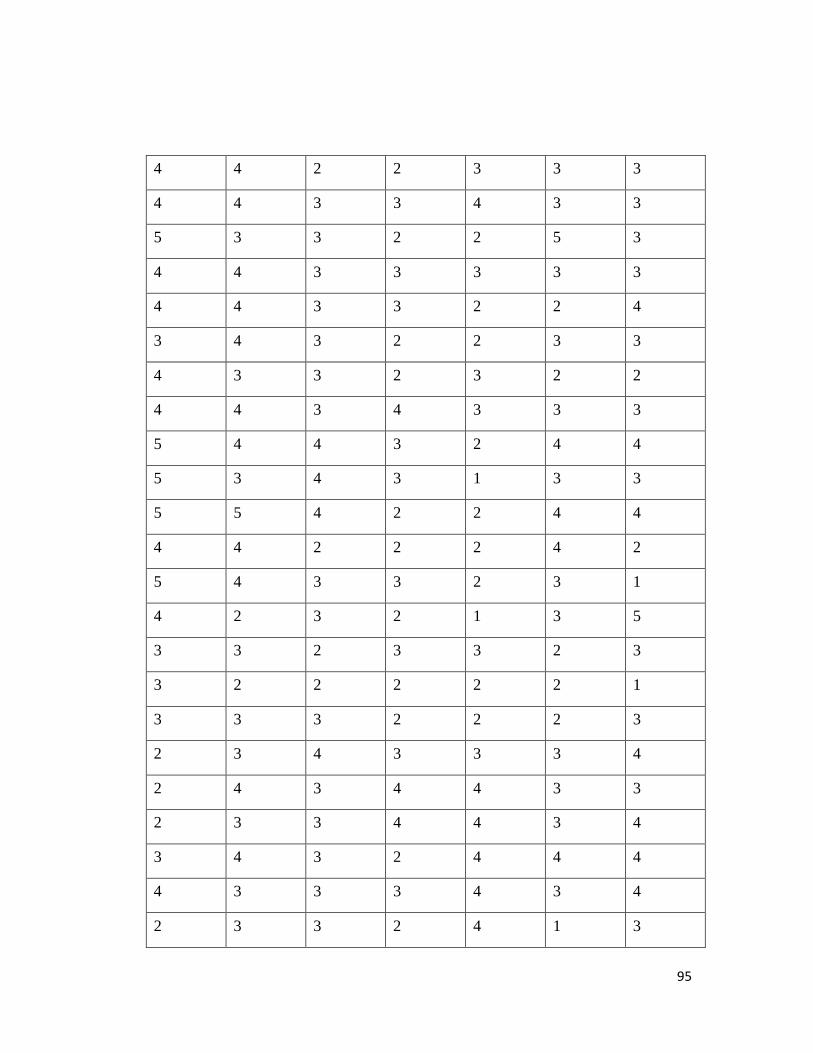
95
4 4 2 2 3 3 3
4 4 3 3 4 3 3
5 3 3 2 2 5 3
4 4 3 3 3 3 3
4 4 3 3 2 2 4
3 4 3 2 2 3 3
4 3 3 2 3 2 2
4 4 3 4 3 3 3
5 4 4 3 2 4 4
5 3 4 3 1 3 3
5 5 4 2 2 4 4
4 4 2 2 2 4 2
5 4 3 3 2 3 1
4 2 3 2 1 3 5
3 3 2 3 3 2 3
3 2 2 2 2 2 1
3 3 3 2 2 2 3
2 3 4 3 3 3 4
2 4 3 4 4 3 3
2 3 3 4 4 3 4
3 4 3 2 4 4 4
4 3 3 3 4 3 4
2 3 3 2 4 1 3
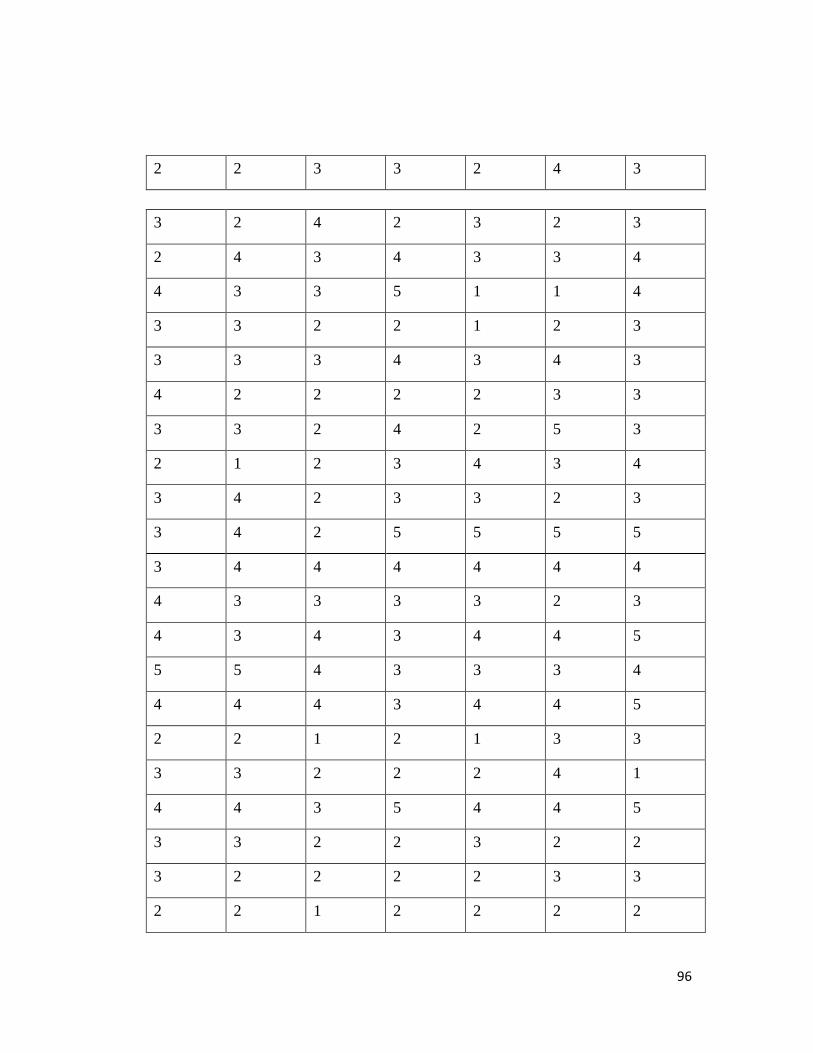
96
2 2 3 3 2 4 3
3 2 4 2 3 2 3
2 4 3 4 3 3 4
4 3 3 5 1 1 4
3 3 2 2 1 2 3
3 3 3 4 3 4 3
4 2 2 2 2 3 3
3 3 2 4 2 5 3
2 1 2 3 4 3 4
3 4 2 3 3 2 3
3 4 2 5 5 5 5
3 4 4 4 4 4 4
4 3 3 3 3 2 3
4 3 4 3 4 4 5
5 5 4 3 3 3 4
4 4 4 3 4 4 5
2 2 1 2 1 3 3
3 3 2 2 2 4 1
4 4 3 5 4 4 5
3 3 2 2 3 2 2
3 2 2 2 2 3 3
2 2 1 2 2 2 2

97
3 3 3 2 2 3 4
3 3 2 2 2 3 2
2 3 3 2 3 2 3
1 1 1 2 2 2 2
3 4 3 2 1 1 3
2 3 3 3 3 3 3
3 3 3 3 3 3 4
2 3 3 4 4 4 4
Perceived Value
PV1 PV2 PV3 PV4
2 4 3 3
2 3 2 3
3 4 2 2
2 2 2 2
3 4 3 2
3 3 2 3
3 3 3 2
3 4 2 2
1 1 2 2
2 2 2 2
2 3 2 1
1 1 1 1
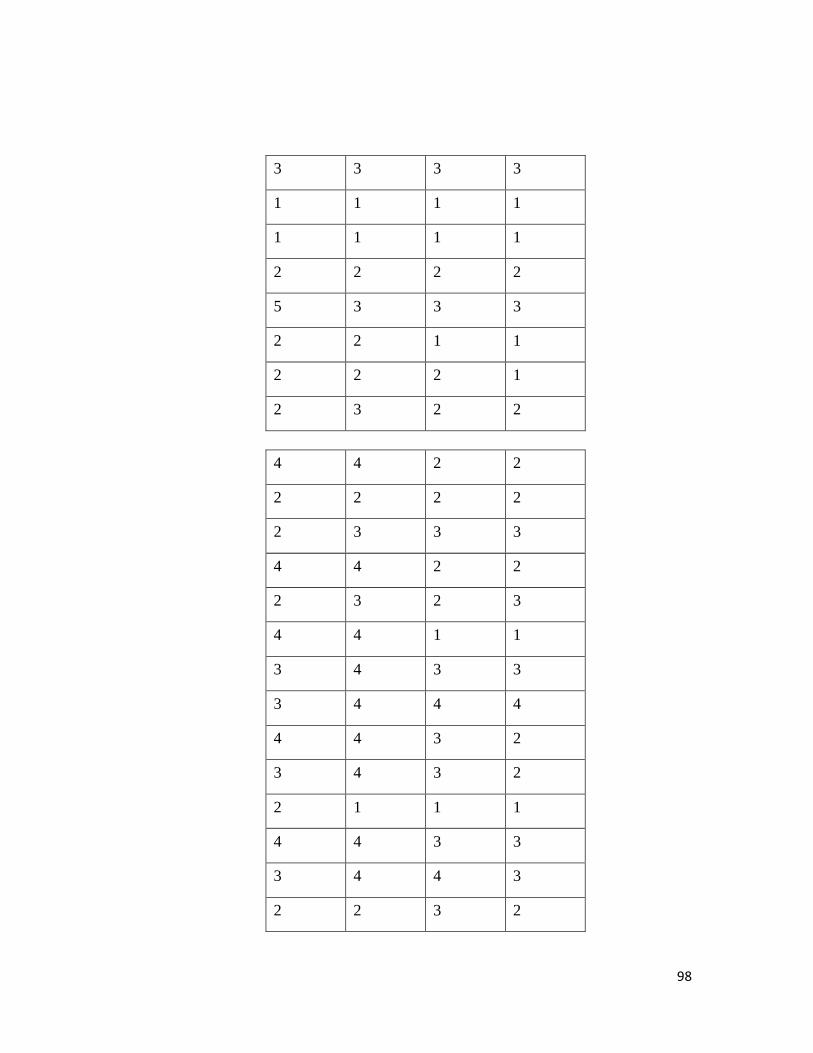
98
3 3 3 3
1 1 1 1
1 1 1 1
2 2 2 2
5 3 3 3
2 2 1 1
2 2 2 1
2 3 2 2
4 4 2 2
2 2 2 2
2 3 3 3
4 4 2 2
2 3 2 3
4 4 1 1
3 4 3 3
3 4 4 4
4 4 3 2
3 4 3 2
2 1 1 1
4 4 3 3
3 4 4 3
2 2 3 2
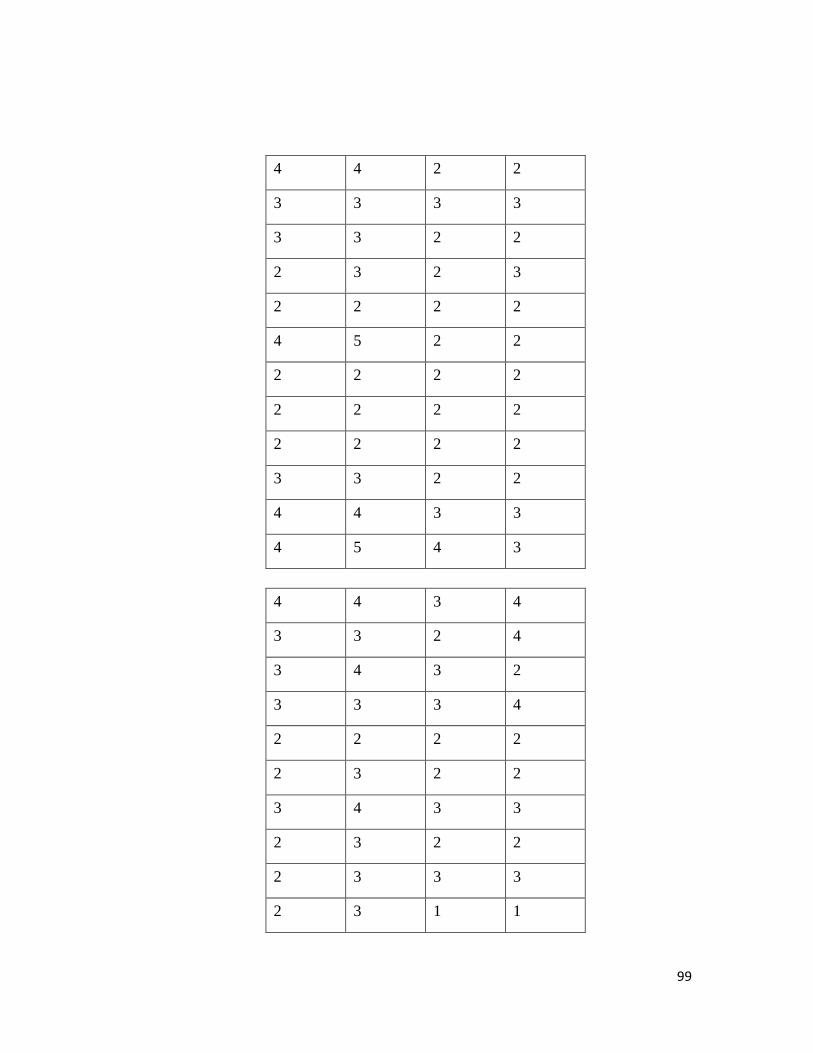
99
4 4 2 2
3 3 3 3
3 3 2 2
2 3 2 3
2 2 2 2
4 5 2 2
2 2 2 2
2 2 2 2
2 2 2 2
3 3 2 2
4 4 3 3
4 5 4 3
4 4 3 4
3 3 2 4
3 4 3 2
3 3 3 4
2 2 2 2
2 3 2 2
3 4 3 3
2 3 2 2
2 3 3 3
2 3 1 1
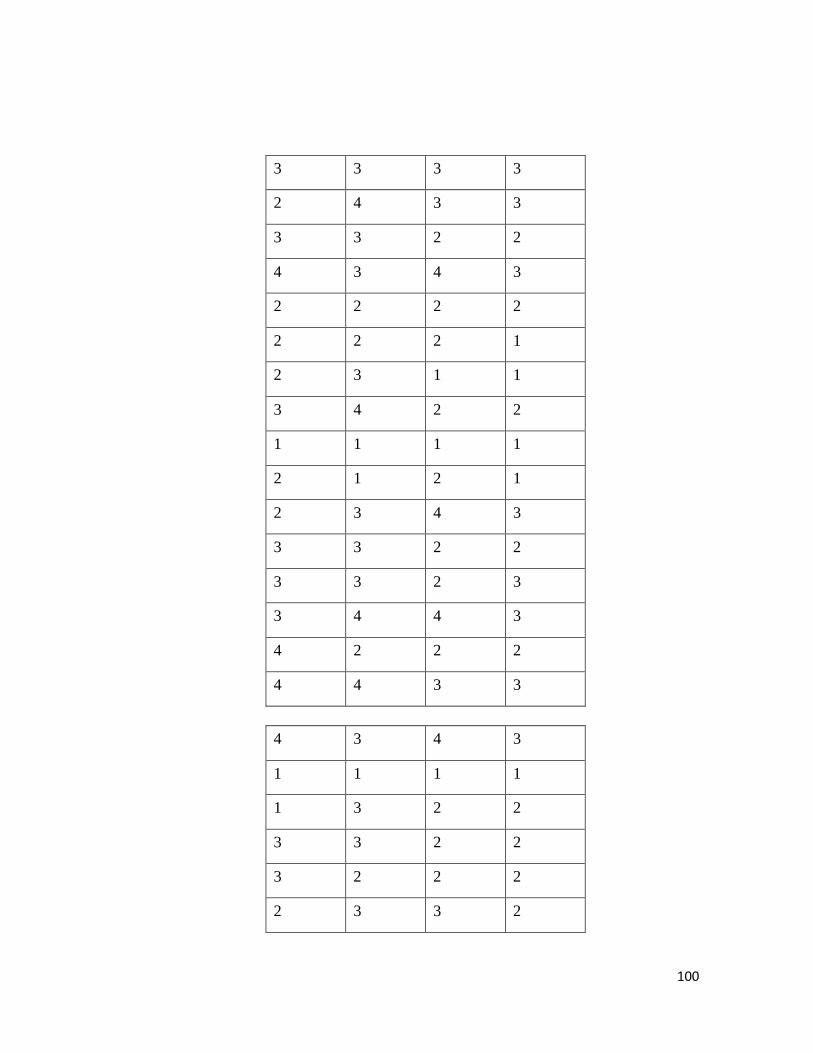
100
3 3 3 3
2 4 3 3
3 3 2 2
4 3 4 3
2 2 2 2
2 2 2 1
2 3 1 1
3 4 2 2
1 1 1 1
2 1 2 1
2 3 4 3
3 3 2 2
3 3 2 3
3 4 4 3
4 2 2 2
4 4 3 3
4 3 4 3
1 1 1 1
1 3 2 2
3 3 2 2
3 2 2 2
2 3 3 2
101
3 2 3 3
2 2 3 3
2 4 2 3
2 3 2 2
2 3 2 1
2 2 2 2
1 2 2 2
4 3 3 4
3 4 4 3
3 3 3 3
3 3 3 3
3 3 3 3
1 2 3 2
2 2 2 2
2 3 3 4
3 3 3 3
1 2 3 3
4 4 5 3
2 4 3 3
3 3 3 3
3 3 3 3
3 2 1 1
102
3 3 3 3
3 2 2 3
2 2 2 2
3 4 3 3
3 3 3 3
2 3 3 3
2 4 3 1
4 2 2 2
4 4 2 2
2 1 2 2
1 2 1 2
4 4 4 4
2 2 2 3
3 4 2 4
1 2 3 4
1 3 2 4
3 3 4 4
3 3 4 3
3 3 4 4
2 2 3 3
3 3 4 4
1 1 1 2
1 2 3 3
103
2 2 3 3
3 3 3 3
4 4 4 5
2 2 2 1
3 1 2 1
3 3 3 3
1 1 3 3
3 4 5 3
3 2 4 1
3 3 4 2
5 5 5 4
4 4 3 3
4 4 4 5
3 3 3 3
5 5 4 4
3 3 3 3
2 3 4 5
1 1 2 3
1 1 1 1
4 4 5 5
3 3 4 5
1 1 1 1
104
4 4 3 3
1 1 1 1
1 2 3 4
5 1 4 4
3 4 3 4
Purchase Intention
PI1 PI2 PI3 PI4 PI5 PI6
4 4 3 3 4 4
3 3 2 2 4 3
2 3 3 3 2 4
4 3 3 4 4 3
5 5 3 3 3 3
4 3 3 3 4 5
3 3 2 3 4 3
5 5 3 3 4 4
2 1 5 3 4 1
3 2 4 4 3 2
5 3 4 2 3 4
4 3 2 3 4 3
4 4 3 3 3 3
4 4 3 3 4 4
2 1 2 2 2 1
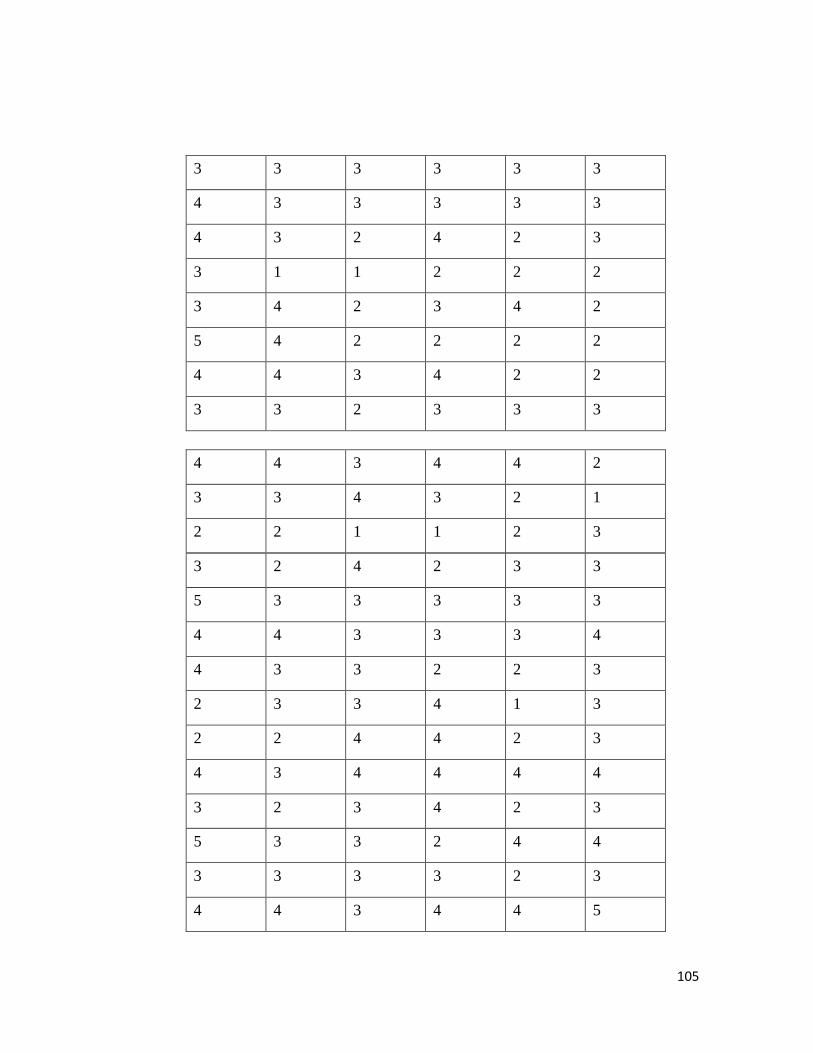
105
3 3 3 3 3 3
4 3 3 3 3 3
4 3 2 4 2 3
3 1 1 2 2 2
3 4 2 3 4 2
5 4 2 2 2 2
4 4 3 4 2 2
3 3 2 3 3 3
4 4 3 4 4 2
3 3 4 3 2 1
2 2 1 1 2 3
3 2 4 2 3 3
5 3 3 3 3 3
4 4 3 3 3 4
4 3 3 2 2 3
2 3 3 4 1 3
2 2 4 4 2 3
4 3 4 4 4 4
3 2 3 4 2 3
5 3 3 2 4 4
3 3 3 3 2 3
4 4 3 4 4 5
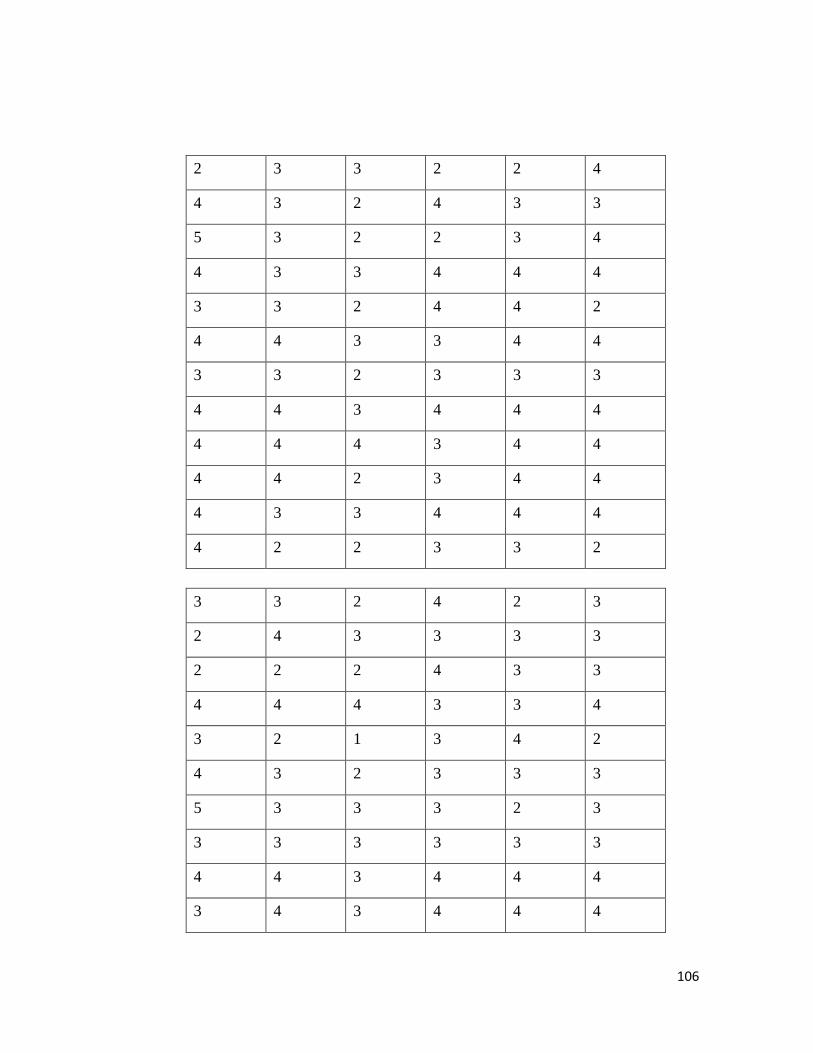
106
2 3 3 2 2 4
4 3 2 4 3 3
5 3 2 2 3 4
4 3 3 4 4 4
3 3 2 4 4 2
4 4 3 3 4 4
3 3 2 3 3 3
4 4 3 4 4 4
4 4 4 3 4 4
4 4 2 3 4 4
4 3 3 4 4 4
4 2 2 3 3 2
3 3 2 4 2 3
2 4 3 3 3 3
2 2 2 4 3 3
4 4 4 3 3 4
3 2 1 3 4 2
4 3 2 3 3 3
5 3 3 3 2 3
3 3 3 3 3 3
4 4 3 4 4 4
3 4 3 4 4 4
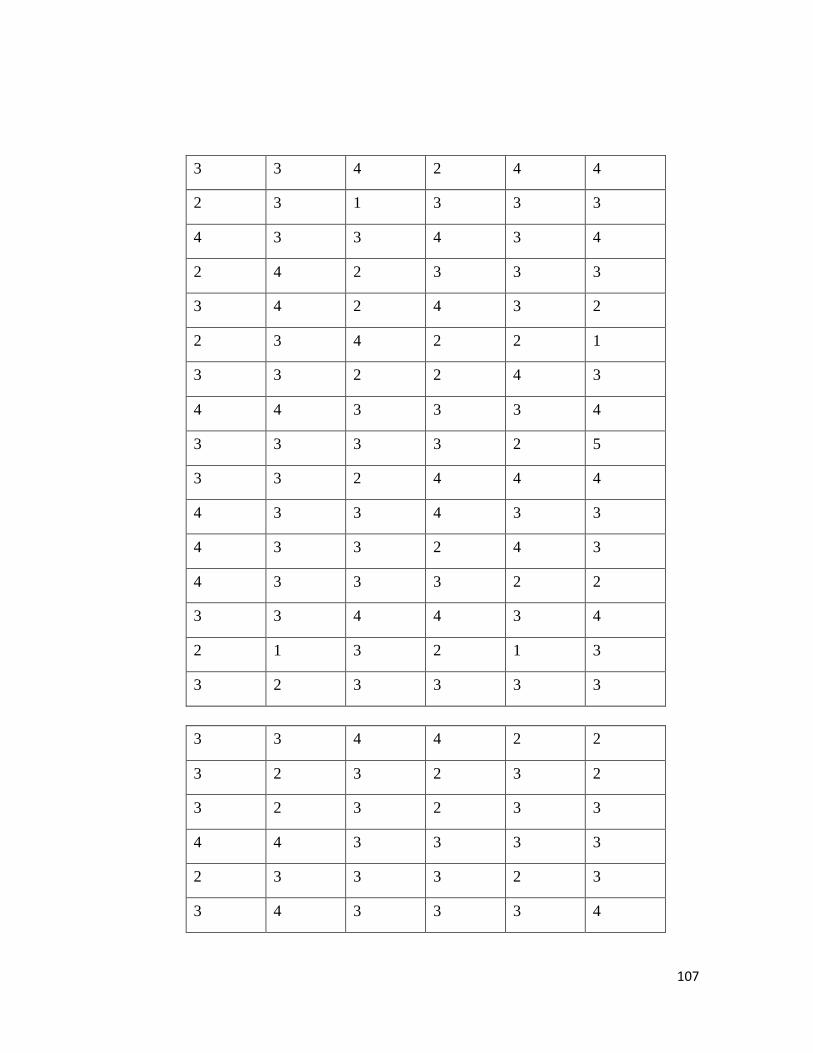
107
3 3 4 2 4 4
2 3 1 3 3 3
4 3 3 4 3 4
2 4 2 3 3 3
3 4 2 4 3 2
2 3 4 2 2 1
3 3 2 2 4 3
4 4 3 3 3 4
3 3 3 3 2 5
3 3 2 4 4 4
4 3 3 4 3 3
4 3 3 2 4 3
4 3 3 3 2 2
3 3 4 4 3 4
2 1 3 2 1 3
3 2 3 3 3 3
3 3 4 4 2 2
3 2 3 2 3 2
3 2 3 2 3 3
4 4 3 3 3 3
2 3 3 3 2 3
3 4 3 3 3 4
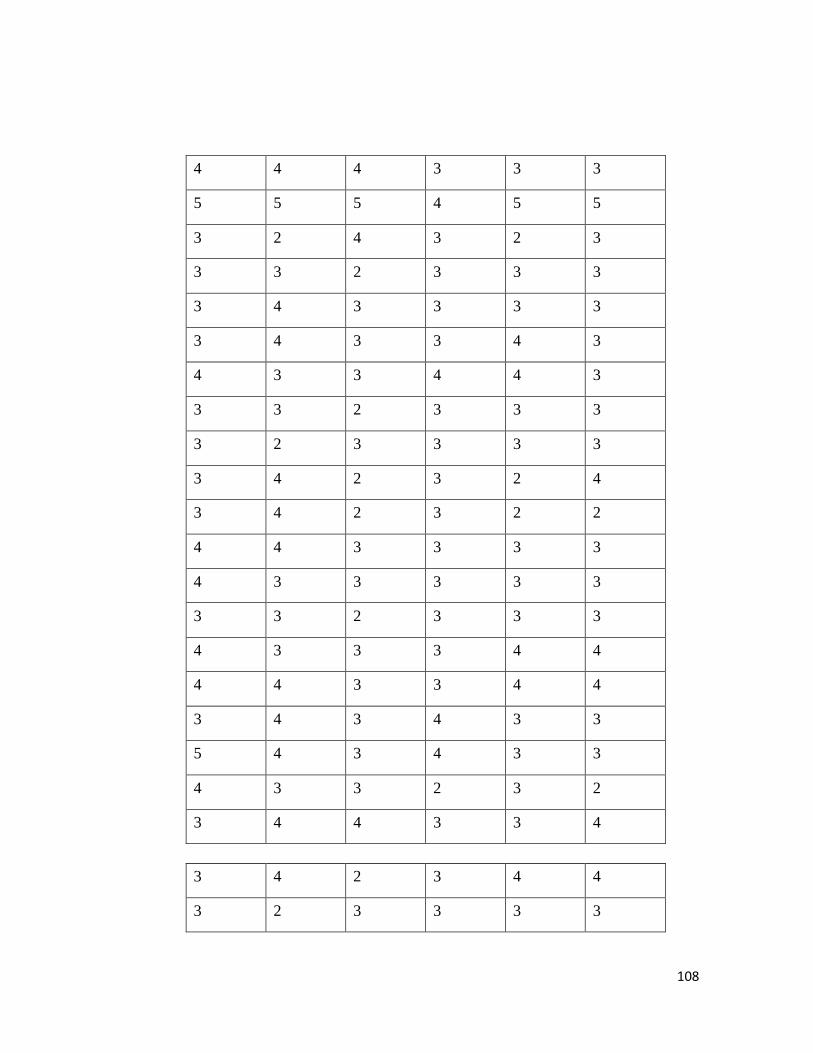
108
4 4 4 3 3 3
5 5 5 4 5 5
3 2 4 3 2 3
3 3 2 3 3 3
3 4 3 3 3 3
3 4 3 3 4 3
4 3 3 4 4 3
3 3 2 3 3 3
3 2 3 3 3 3
3 4 2 3 2 4
3 4 2 3 2 2
4 4 3 3 3 3
4 3 3 3 3 3
3 3 2 3 3 3
4 3 3 3 4 4
4 4 3 3 4 4
3 4 3 4 3 3
5 4 3 4 3 3
4 3 3 2 3 2
3 4 4 3 3 4
3 4 2 3 4 4
3 2 3 3 3 3
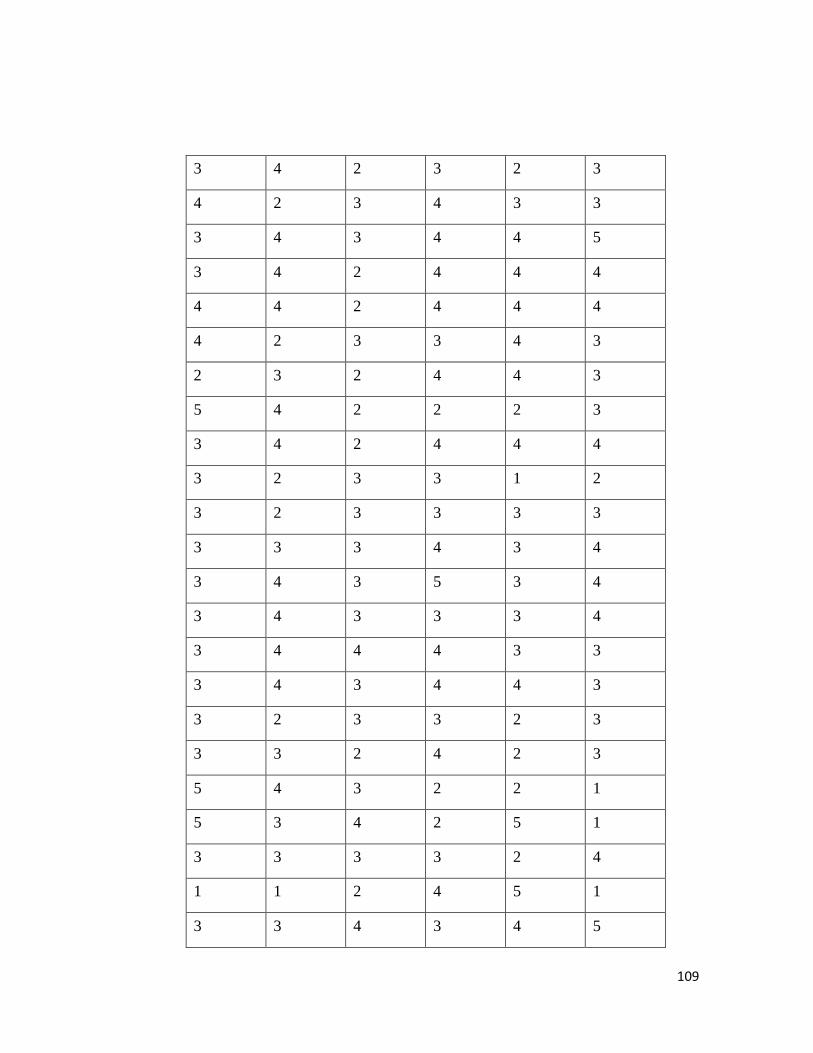
109
3 4 2 3 2 3
4 2 3 4 3 3
3 4 3 4 4 5
3 4 2 4 4 4
4 4 2 4 4 4
4 2 3 3 4 3
2 3 2 4 4 3
5 4 2 2 2 3
3 4 2 4 4 4
3 2 3 3 1 2
3 2 3 3 3 3
3 3 3 4 3 4
3 4 3 5 3 4
3 4 3 3 3 4
3 4 4 4 3 3
3 4 3 4 4 3
3 2 3 3 2 3
3 3 2 4 2 3
5 4 3 2 2 1
5 3 4 2 5 1
3 3 3 3 2 4
1 1 2 4 5 1
3 3 4 3 4 5

110
3 3 4 1 4 2
3 4 4 4 2 3
3 2 4 2 3 3
3 3 3 3 3 3
4 4 4 5 5 5
4 4 5 3 4 5
1 2 3 4 5 4
3 5 5 5 3 3
4 4 5 5 3 3
4 4 4 5 4 4
3 2 1 1 2 3
2 2 3 3 4 3
4 4 5 4 5 4
1 2 3 2 3 1
1 4 3 4 2 2
1 1 2 2 3 3
2 3 3 3 2 4
1 2 3 2 3 2
2 2 3 3 2 1
1 1 2 2 1 3
2 2 4 3 2 2
3 3 4 4 3 3
2 4 1 5 2 4
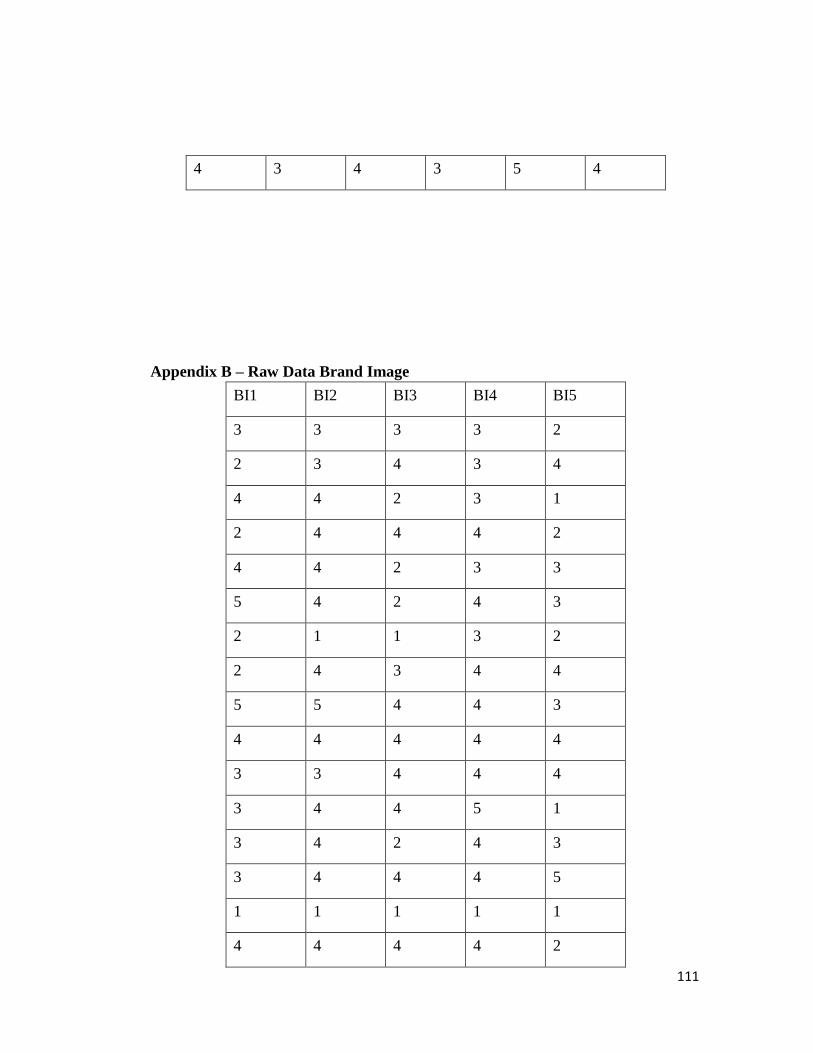
111
4 3 4 3 5 4
Appendix B – Raw Data Brand Image
BI1 BI2 BI3 BI4 BI5
3 3 3 3 2
2 3 4 3 4
4 4 2 3 1
2 4 4 4 2
4 4 2 3 3
5 4 2 4 3
2 1 1 3 2
2 4 3 4 4
5 5 4 4 3
4 4 4 4 4
3 3 4 4 4
3 4 4 5 1
3 4 2 4 3
3 4 4 4 5
1 1 1 1 1
4 4 4 4 2
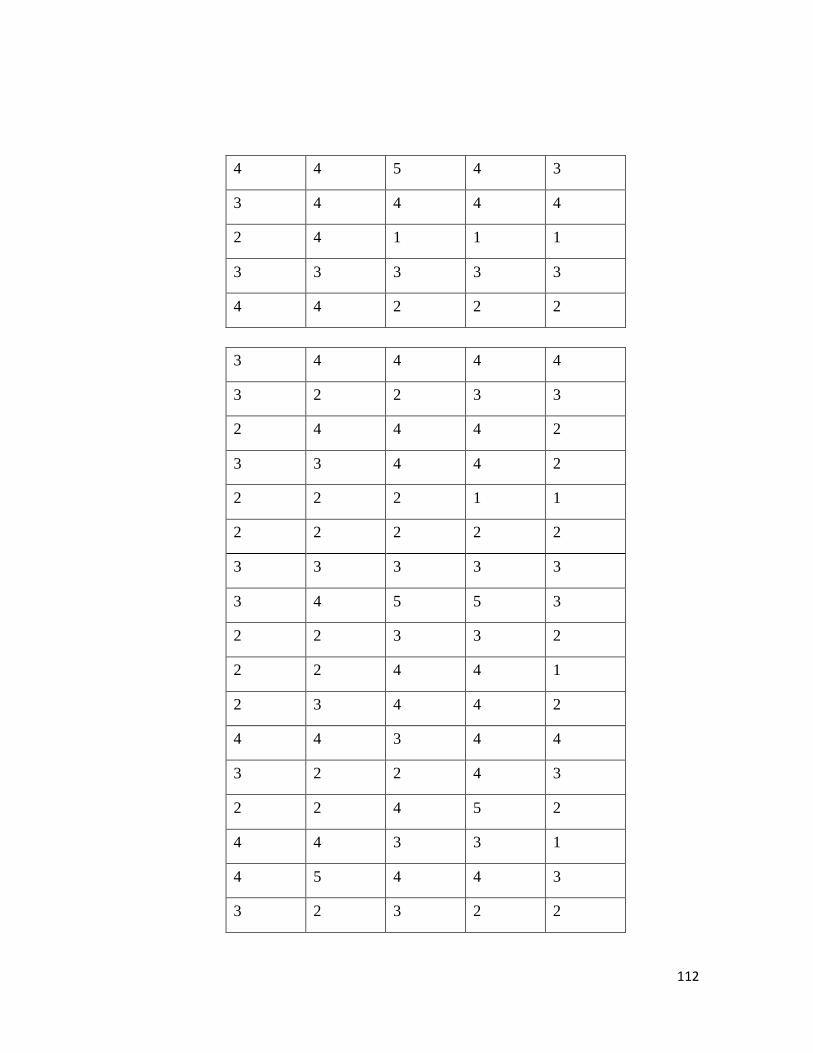
112
4 4 5 4 3
3 4 4 4 4
2 4 1 1 1
3 3 3 3 3
4 4 2 2 2
3 4 4 4 4
3 2 2 3 3
2 4 4 4 2
3 3 4 4 2
2 2 2 1 1
2 2 2 2 2
3 3 3 3 3
3 4 5 5 3
2 2 3 3 2
2 2 4 4 1
2 3 4 4 2
4 4 3 4 4
3 2 2 4 3
2 2 4 5 2
4 4 3 3 1
4 5 4 4 3
3 2 3 2 2
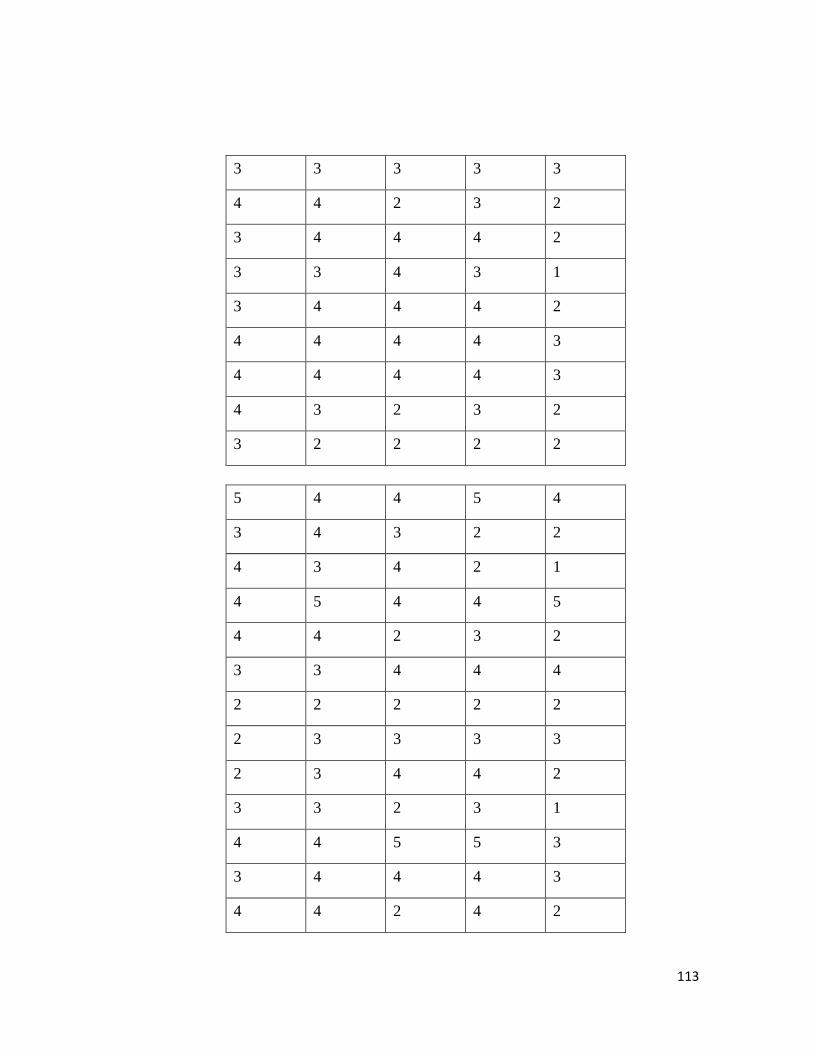
113
3 3 3 3 3
4 4 2 3 2
3 4 4 4 2
3 3 4 3 1
3 4 4 4 2
4 4 4 4 3
4 4 4 4 3
4 3 2 3 2
3 2 2 2 2
5 4 4 5 4
3 4 3 2 2
4 3 4 2 1
4 5 4 4 5
4 4 2 3 2
3 3 4 4 4
2 2 2 2 2
2 3 3 3 3
2 3 4 4 2
3 3 2 3 1
4 4 5 5 3
3 4 4 4 3
4 4 2 4 2
114
2 3 3 3 2
3 4 4 4 3
3 3 4 4 2
2 2 4 3 2
2 3 2 4 1
3 3 2 2 2
3 4 4 4 2
3 3 3 2 2
3 3 2 3 3
3 3 3 2 2
3 3 2 2 3
2 3 3 4 2
2 4 3 3 5
1 1 1 1 1
2 3 2 3 1
3 4 3 2 3
2 2 3 2 3
3 3 3 2 3
2 4 4 4 3
3 3 2 3 2
2 3 4 4 3
3 4 3 3 2
115
2 2 5 5 3
3 3 4 4 3
3 4 4 4 3
3 3 3 3 4
3 3 4 4 3
4 5 3 4 3
3 3 3 3 1
3 3 3 3 3
3 4 4 4 2
4 3 3 2 1
3 4 4 4 2
3 3 3 3 3
3 3 3 3 3
3 4 4 4 2
4 4 3 4 3
4 4 2 3 3
4 4 3 3 3
4 3 3 4 2
4 4 4 5 3
3 3 4 4 2
3 3 3 4 2
3 3 2 3 2
116
3 4 4 4 4
3 4 5 5 3
5 5 5 4 2
2 2 3 4 4
2 4 4 4 2
4 3 2 5 3
4 4 4 5 2
4 5 5 5 3
4 3 2 2 1
2 2 2 3 3
2 3 3 3 4
3 3 4 4 3
2 3 3 3 4
1 5 3 3 4
4 4 3 3 4
1 2 2 2 3
1 2 2 3 3
2 2 3 3 3
3 3 3 3 3
1 2 3 4 4
4 2 2 1 3
3 3 4 4 3
2 2 2 3 3
117
3 3 4 3 3
2 2 3 4 4
3 2 4 3 3
4 4 5 5 3
4 4 4 4 4
3 3 3 3 3
5 5 5 5 5
3 3 3 4 4
2 3 4 5 5
1 1 2 2 2
3 3 4 4 1
2 4 5 5 5
1 2 2 2 2
1 1 2 2 3
1 1 1 2 2
2 2 3 3 4
1 1 2 2 2
2 2 2 2 3
1 1 1 1 2
2 2 2 2 3
3 3 3 4 3
1 5 3 2 5
3 4 3 4 4
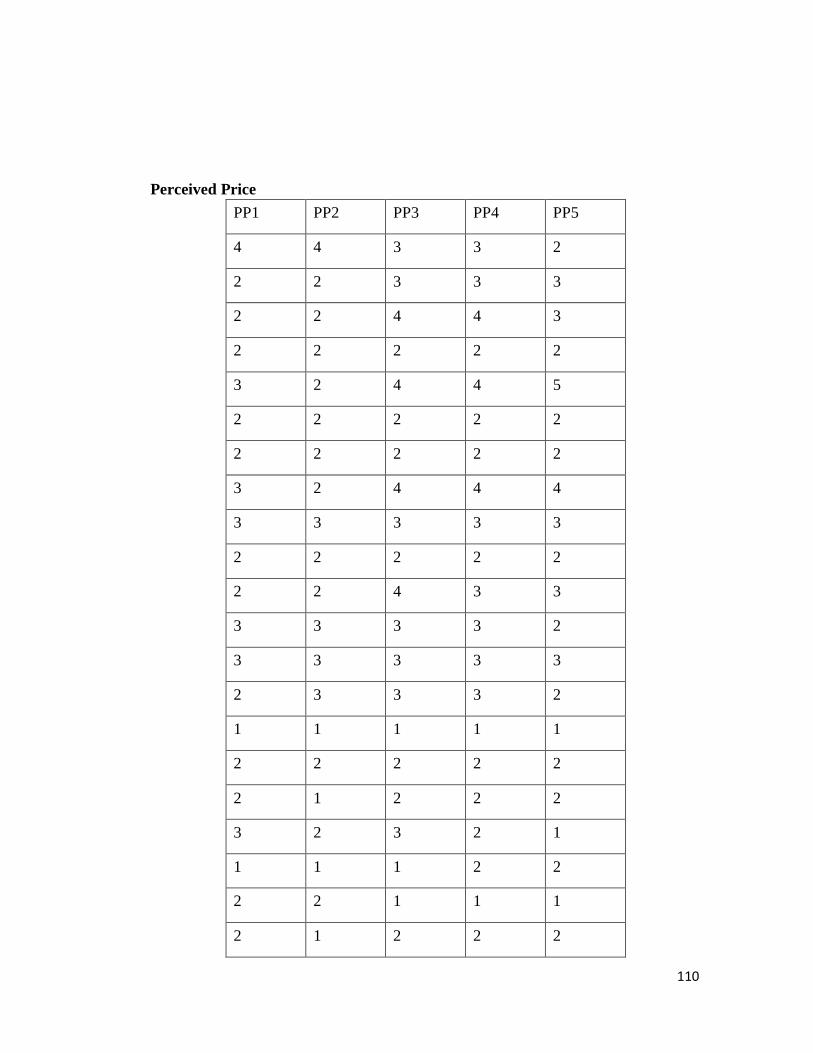
110
Perceived Price
PP1 PP2 PP3 PP4 PP5
4 4 3 3 2
2 2 3 3 3
2 2 4 4 3
2 2 2 2 2
3 2 4 4 5
2 2 2 2 2
2 2 2 2 2
3 2 4 4 4
3 3 3 3 3
2 2 2 2 2
2 2 4 3 3
3 3 3 3 2
3 3 3 3 3
2 3 3 3 2
1 1 1 1 1
2 2 2 2 2
2 1 2 2 2
3 2 3 2 1
1 1 1 2 2
2 2 1 1 1
2 1 2 2 2
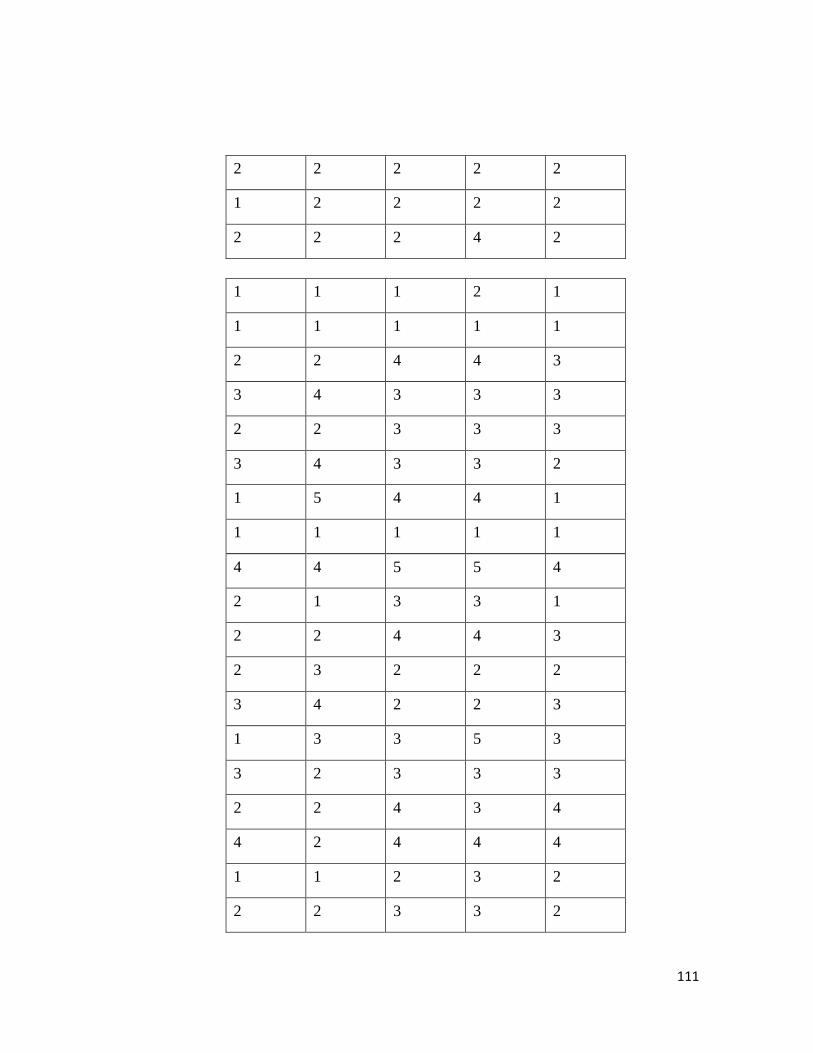
111
2 2 2 2 2
1 2 2 2 2
2 2 2 4 2
1 1 1 2 1
1 1 1 1 1
2 2 4 4 3
3 4 3 3 3
2 2 3 3 3
3 4 3 3 2
1 5 4 4 1
1 1 1 1 1
4 4 5 5 4
2 1 3 3 1
2 2 4 4 3
2 3 2 2 2
3 4 2 2 3
1 3 3 5 3
3 2 3 3 3
2 2 4 3 4
4 2 4 4 4
1 1 2 3 2
2 2 3 3 2
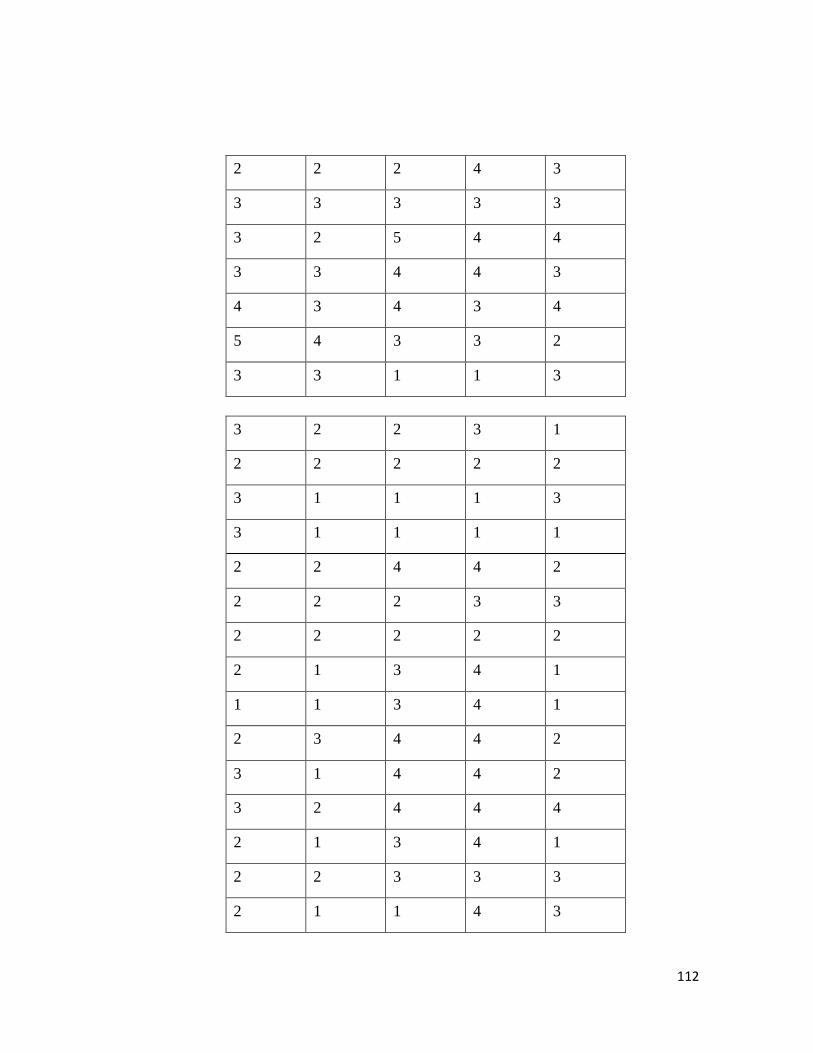
112
2 2 2 4 3
3 3 3 3 3
3 2 5 4 4
3 3 4 4 3
4 3 4 3 4
5 4 3 3 2
3 3 1 1 3
3 2 2 3 1
2 2 2 2 2
3 1 1 1 3
3 1 1 1 1
2 2 4 4 2
2 2 2 3 3
2 2 2 2 2
2 1 3 4 1
1 1 3 4 1
2 3 4 4 2
3 1 4 4 2
3 2 4 4 4
2 1 3 4 1
2 2 3 3 3
2 1 1 4 3
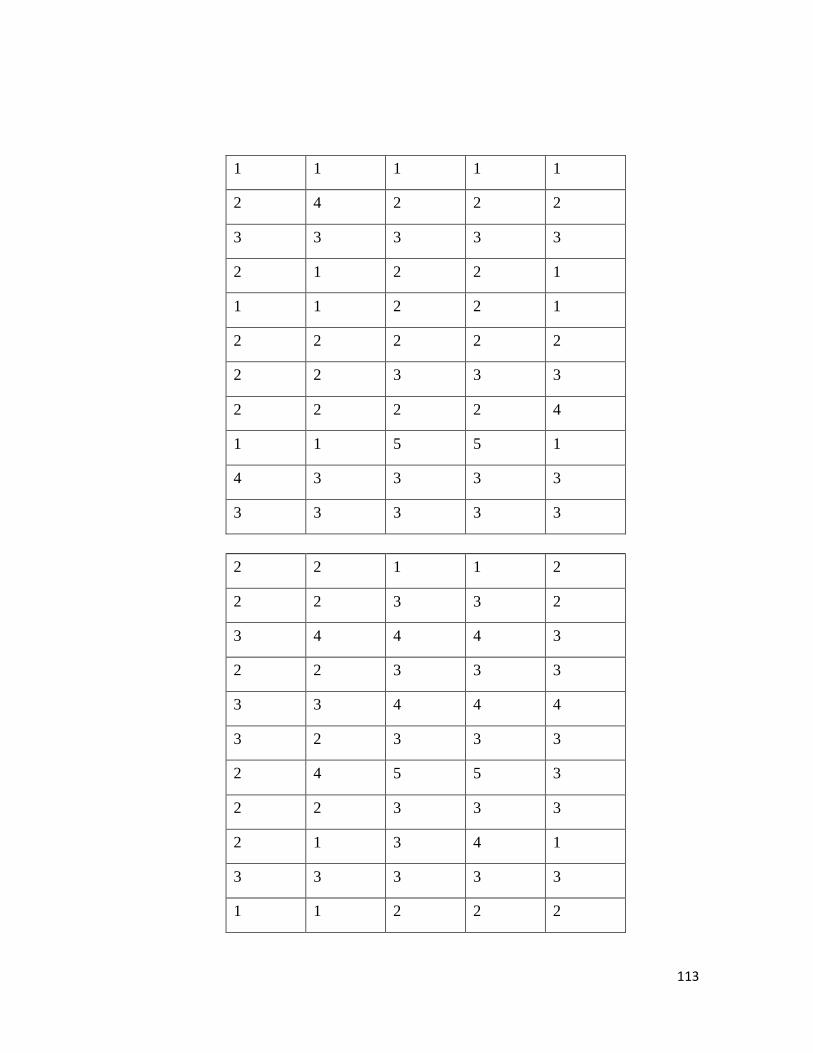
113
1 1 1 1 1
2 4 2 2 2
3 3 3 3 3
2 1 2 2 1
1 1 2 2 1
2 2 2 2 2
2 2 3 3 3
2 2 2 2 4
1 1 5 5 1
4 3 3 3 3
3 3 3 3 3
2 2 1 1 2
2 2 3 3 2
3 4 4 4 3
2 2 3 3 3
3 3 4 4 4
3 2 3 3 3
2 4 5 5 3
2 2 3 3 3
2 1 3 4 1
3 3 3 3 3
1 1 2 2 2

114
3 3 4 4 3
1 1 1 1 3
1 3 2 3 3
2 5 3 3 4
1 1 1 1 1
3 3 3 4 3
3 3 4 4 4
3 3 2 2 2
1 4 4 4 5
3 4 4 4 2
3 2 3 4 3
3 3 3 3 3
3 2 2 2 2
3 3 3 3 3
3 4 3 4 4
3 1 3 4 4
3 3 4 4 3
3 2 3 3 3
3 2 4 4 3
4 2 3 4 4
4 2 4 4 2
2 2 4 4 4
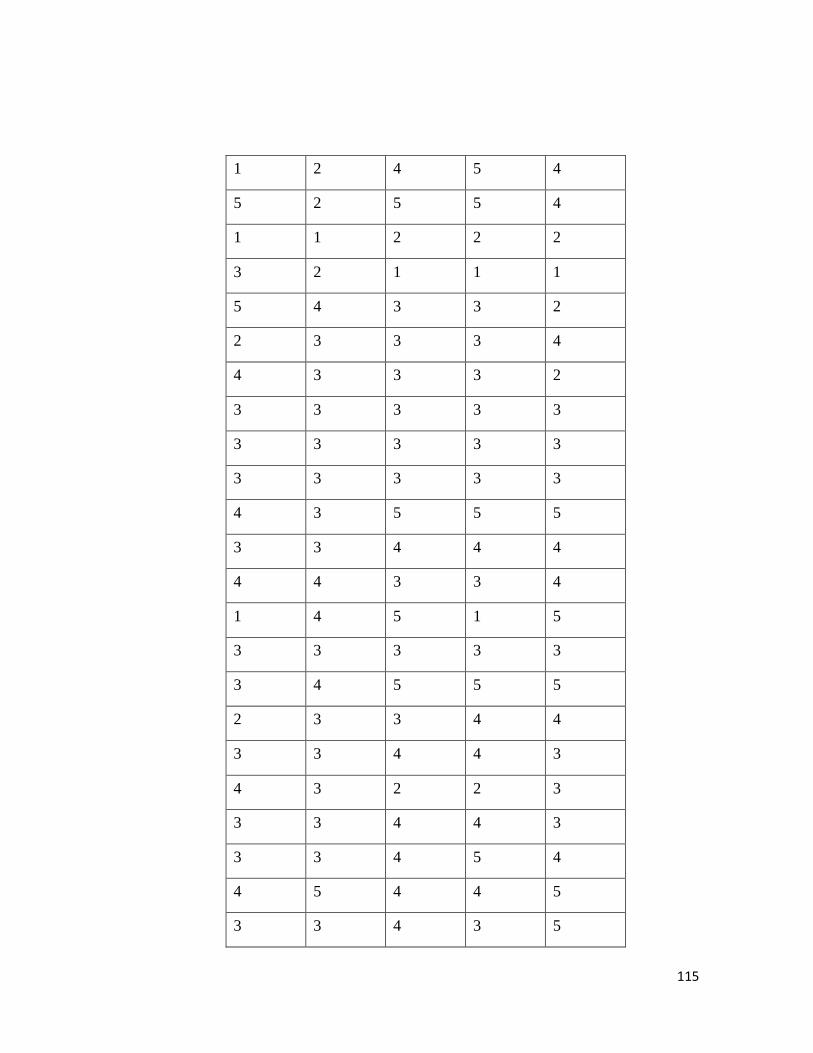
115
1 2 4 5 4
5 2 5 5 4
1 1 2 2 2
3 2 1 1 1
5 4 3 3 2
2 3 3 3 4
4 3 3 3 2
3 3 3 3 3
3 3 3 3 3
3 3 3 3 3
4 3 5 5 5
3 3 4 4 4
4 4 3 3 4
1 4 5 1 5
3 3 3 3 3
3 4 5 5 5
2 3 3 4 4
3 3 4 4 3
4 3 2 2 3
3 3 4 4 3
3 3 4 5 4
4 5 4 4 5
3 3 4 3 5
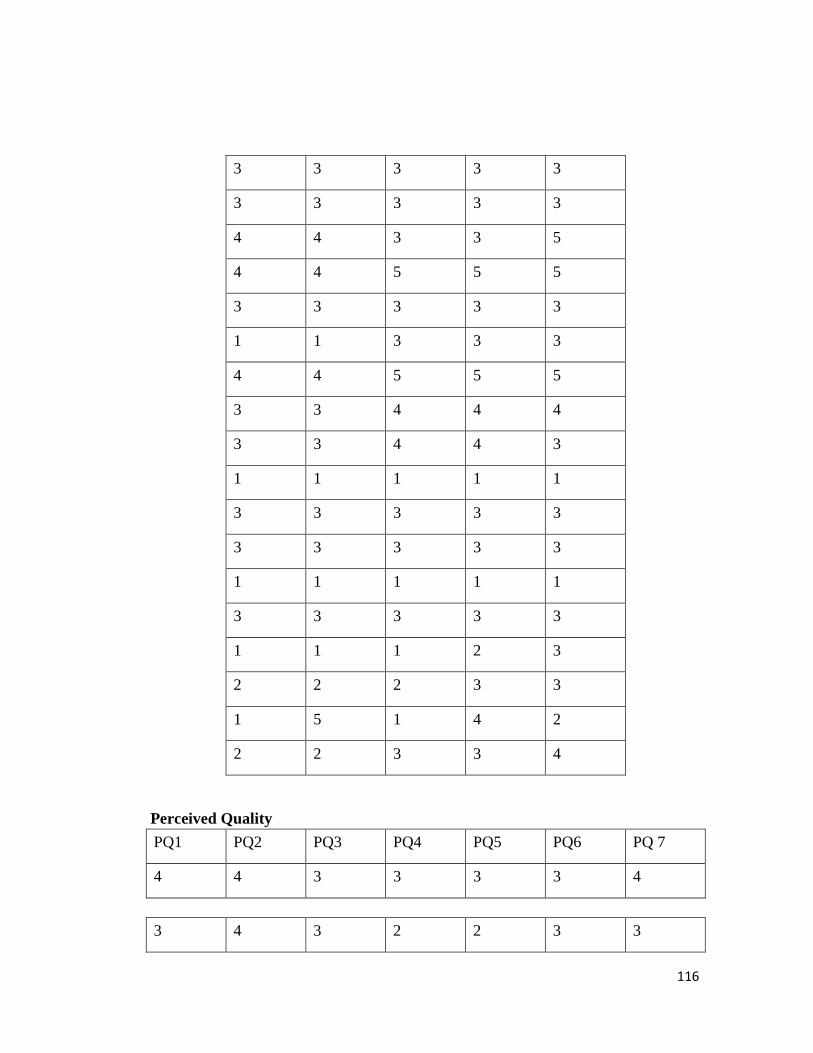
116
3 3 3 3 3
3 3 3 3 3
4 4 3 3 5
4 4 5 5 5
3 3 3 3 3
1 1 3 3 3
4 4 5 5 5
3 3 4 4 4
3 3 4 4 3
1 1 1 1 1
3 3 3 3 3
3 3 3 3 3
1 1 1 1 1
3 3 3 3 3
1 1 1 2 3
2 2 2 3 3
1 5 1 4 2
2 2 3 3 4
Perceived Quality
PQ1 PQ2 PQ3 PQ4 PQ5 PQ6 PQ 7
4 4 3 3 3 3 4
3 4 3 2 2 3 3

117
4 4 2 2 2 2 3
4 2 2 2 2 2 2
5 5 3 4 2 5 5
5 5 4 4 4 3 4
4 4 3 3 3 2 1
4 3 2 2 2 5 5
5 5 2 3 3 3 3
4 3 2 4 2 2 4
5 5 2 3 3 2 2
2 2 2 2 2 2 1
4 4 3 3 3 2 3
4 4 3 3 2 2 2
3 3 1 1 1 1 1
4 4 2 2 2 3 3
4 4 2 1 1 2 2
4 4 3 3 3 3 3
4 3 2 1 2 4 1
3 4 4 4 1 4 3
4 4 2 2 2 1 2
5 4 2 2 2 2 4
4 4 3 2 2 1 3
2 4 2 2 2 2 2
5 3 1 2 1 1 2
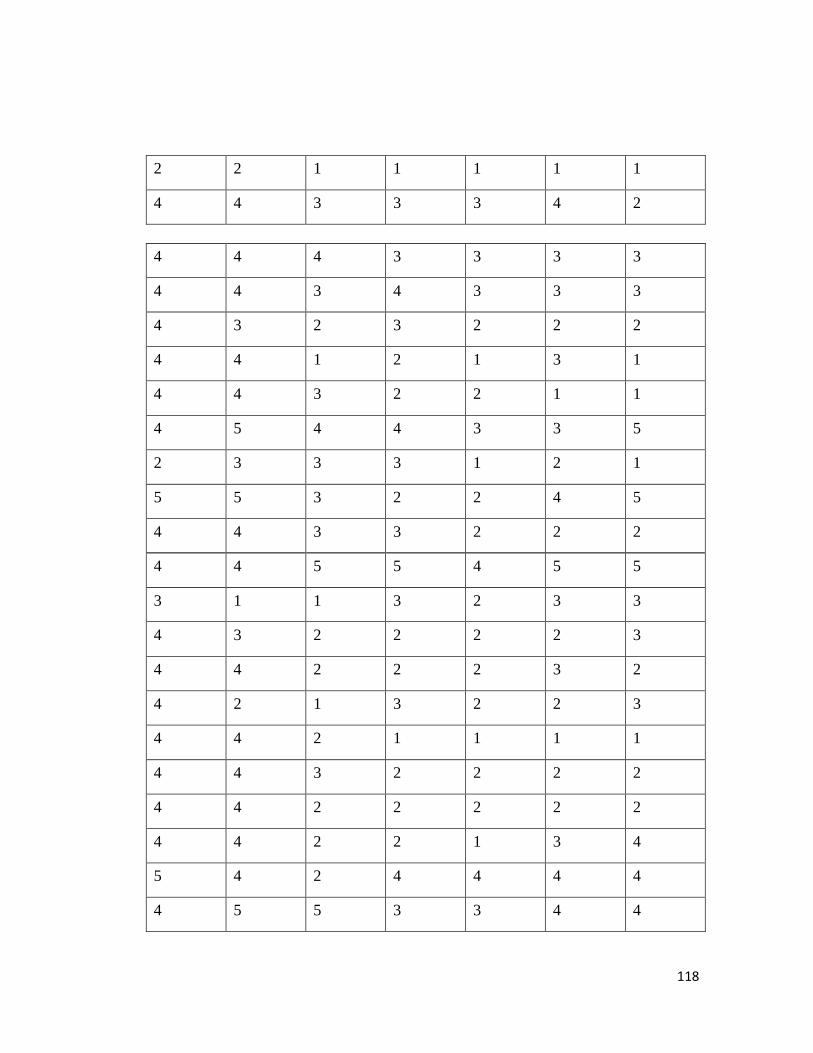
118
2 2 1 1 1 1 1
4 4 3 3 3 4 2
4 4 4 3 3 3 3
4 4 3 4 3 3 3
4 3 2 3 2 2 2
4 4 1 2 1 3 1
4 4 3 2 2 1 1
4 5 4 4 3 3 5
2 3 3 3 1 2 1
5 5 3 2 2 4 5
4 4 3 3 2 2 2
4 4 5 5 4 5 5
3 1 1 3 2 3 3
4 3 2 2 2 2 3
4 4 2 2 2 3 2
4 2 1 3 2 2 3
4 4 2 1 1 1 1
4 4 3 2 2 2 2
4 4 2 2 2 2 2
4 4 2 2 1 3 4
5 4 2 4 4 4 4
4 5 5 3 3 4 4
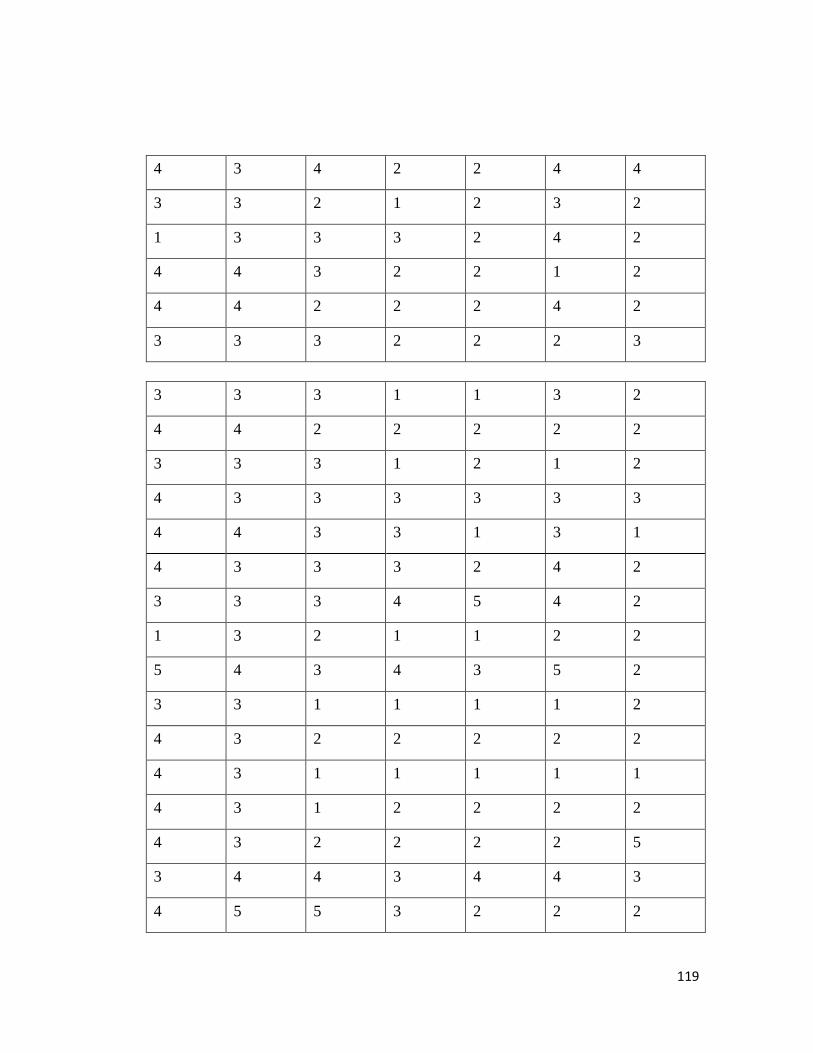
119
4 3 4 2 2 4 4
3 3 2 1 2 3 2
1 3 3 3 2 4 2
4 4 3 2 2 1 2
4 4 2 2 2 4 2
3 3 3 2 2 2 3
3 3 3 1 1 3 2
4 4 2 2 2 2 2
3 3 3 1 2 1 2
4 3 3 3 3 3 3
4 4 3 3 1 3 1
4 3 3 3 2 4 2
3 3 3 4 5 4 2
1 3 2 1 1 2 2
5 4 3 4 3 5 2
3 3 1 1 1 1 2
4 3 2 2 2 2 2
4 3 1 1 1 1 1
4 3 1 2 2 2 2
4 3 2 2 2 2 5
3 4 4 3 4 4 3
4 5 5 3 2 2 2
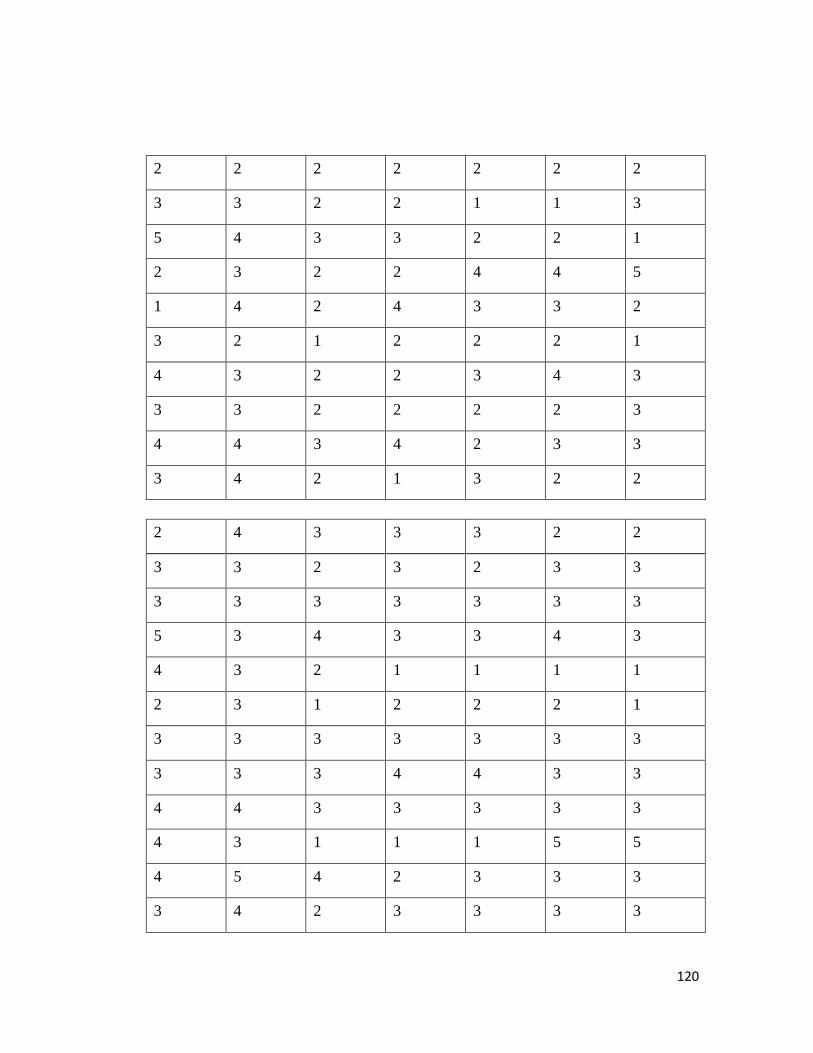
120
2 2 2 2 2 2 2
3 3 2 2 1 1 3
5 4 3 3 2 2 1
2 3 2 2 4 4 5
1 4 2 4 3 3 2
3 2 1 2 2 2 1
4 3 2 2 3 4 3
3 3 2 2 2 2 3
4 4 3 4 2 3 3
3 4 2 1 3 2 2
2 4 3 3 3 2 2
3 3 2 3 2 3 3
3 3 3 3 3 3 3
5 3 4 3 3 4 3
4 3 2 1 1 1 1
2 3 1 2 2 2 1
3 3 3 3 3 3 3
3 3 3 4 4 3 3
4 4 3 3 3 3 3
4 3 1 1 1 5 5
4 5 4 2 3 3 3
3 4 2 3 3 3 3

121
3 3 3 3 1 3 1
3 3 3 3 3 3 2
3 3 1 2 1 3 3
2 3 3 3 3 3 3
4 4 1 2 1 3 2
5 4 3 3 2 4 2
4 4 2 2 3 3 3
4 4 3 3 4 3 3
5 3 3 2 2 5 3
4 4 3 3 3 3 3
4 4 3 3 2 2 4
3 4 3 2 2 3 3
4 3 3 2 3 2 2
4 4 3 4 3 3 3
5 4 4 3 2 4 4
5 3 4 3 1 3 3
5 5 4 2 2 4 4
4 4 2 2 2 4 2
5 4 3 3 2 3 1
4 2 3 2 1 3 5
3 3 2 3 3 2 3
3 2 2 2 2 2 1
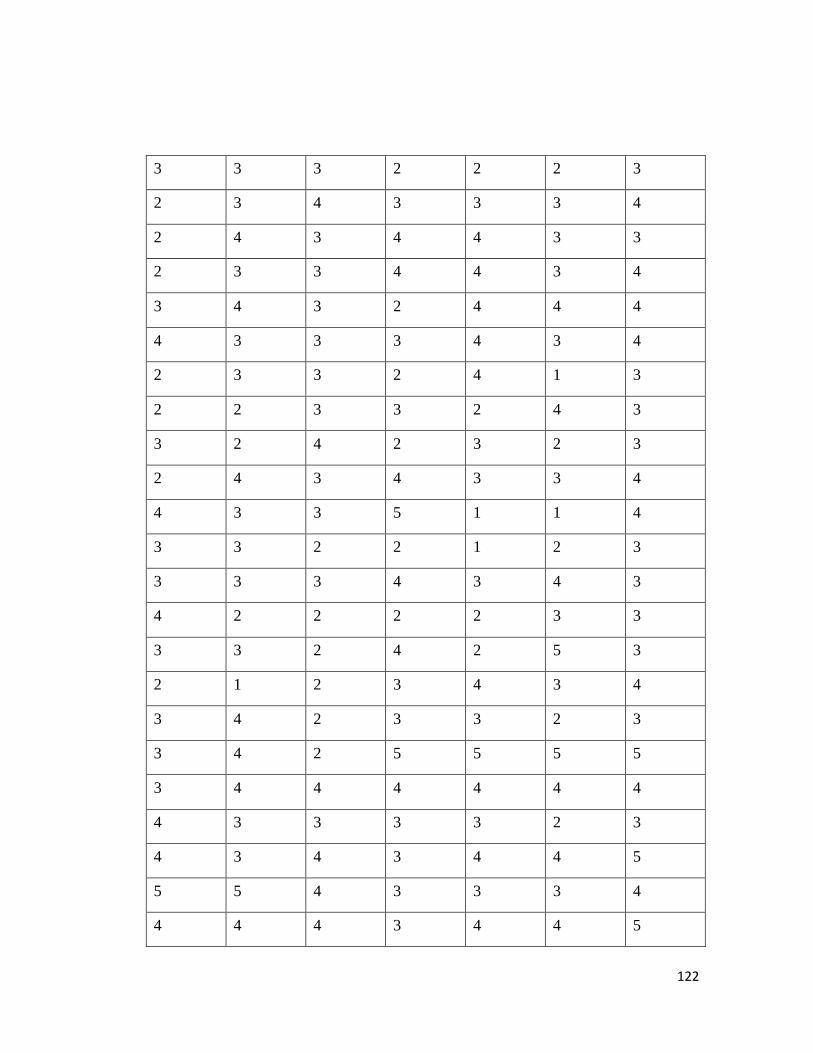
122
3 3 3 2 2 2 3
2 3 4 3 3 3 4
2 4 3 4 4 3 3
2 3 3 4 4 3 4
3 4 3 2 4 4 4
4 3 3 3 4 3 4
2 3 3 2 4 1 3
2 2 3 3 2 4 3
3 2 4 2 3 2 3
2 4 3 4 3 3 4
4 3 3 5 1 1 4
3 3 2 2 1 2 3
3 3 3 4 3 4 3
4 2 2 2 2 3 3
3 3 2 4 2 5 3
2 1 2 3 4 3 4
3 4 2 3 3 2 3
3 4 2 5 5 5 5
3 4 4 4 4 4 4
4 3 3 3 3 2 3
4 3 4 3 4 4 5
5 5 4 3 3 3 4
4 4 4 3 4 4 5
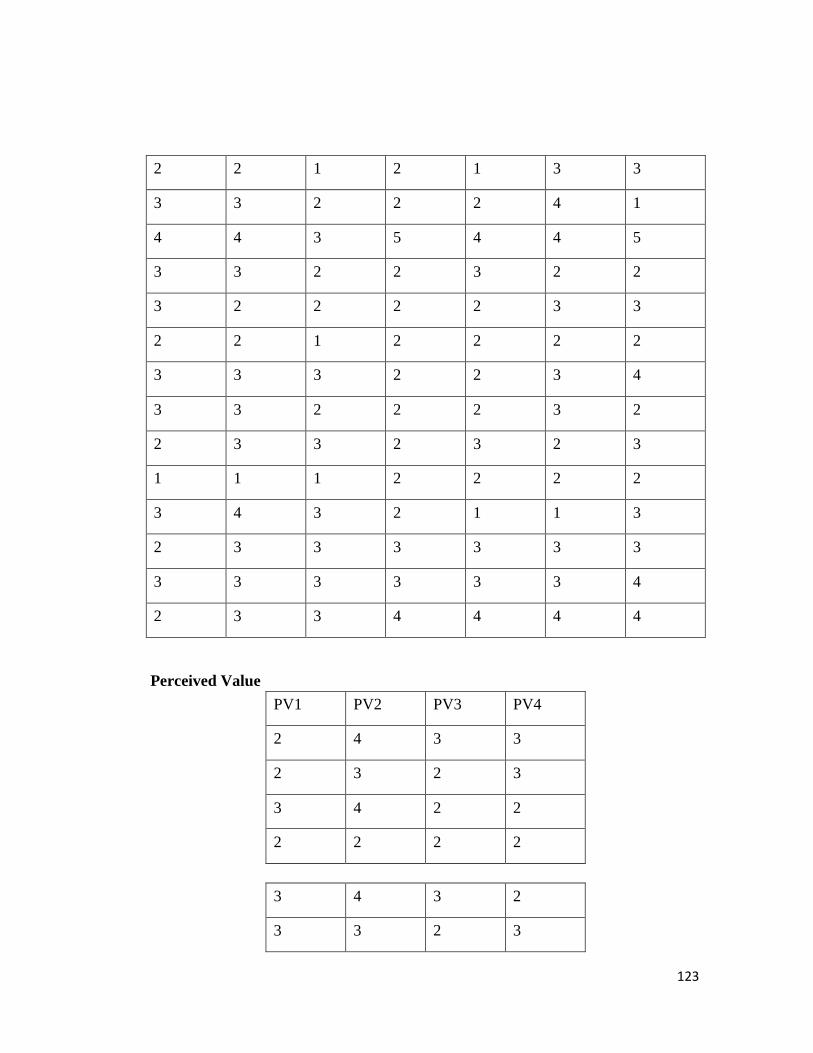
123
2 2 1 2 1 3 3
3 3 2 2 2 4 1
4 4 3 5 4 4 5
3 3 2 2 3 2 2
3 2 2 2 2 3 3
2 2 1 2 2 2 2
3 3 3 2 2 3 4
3 3 2 2 2 3 2
2 3 3 2 3 2 3
1 1 1 2 2 2 2
3 4 3 2 1 1 3
2 3 3 3 3 3 3
3 3 3 3 3 3 4
2 3 3 4 4 4 4
Perceived Value
PV1 PV2 PV3 PV4
2 4 3 3
2 3 2 3
3 4 2 2
2 2 2 2
3 4 3 2
3 3 2 3
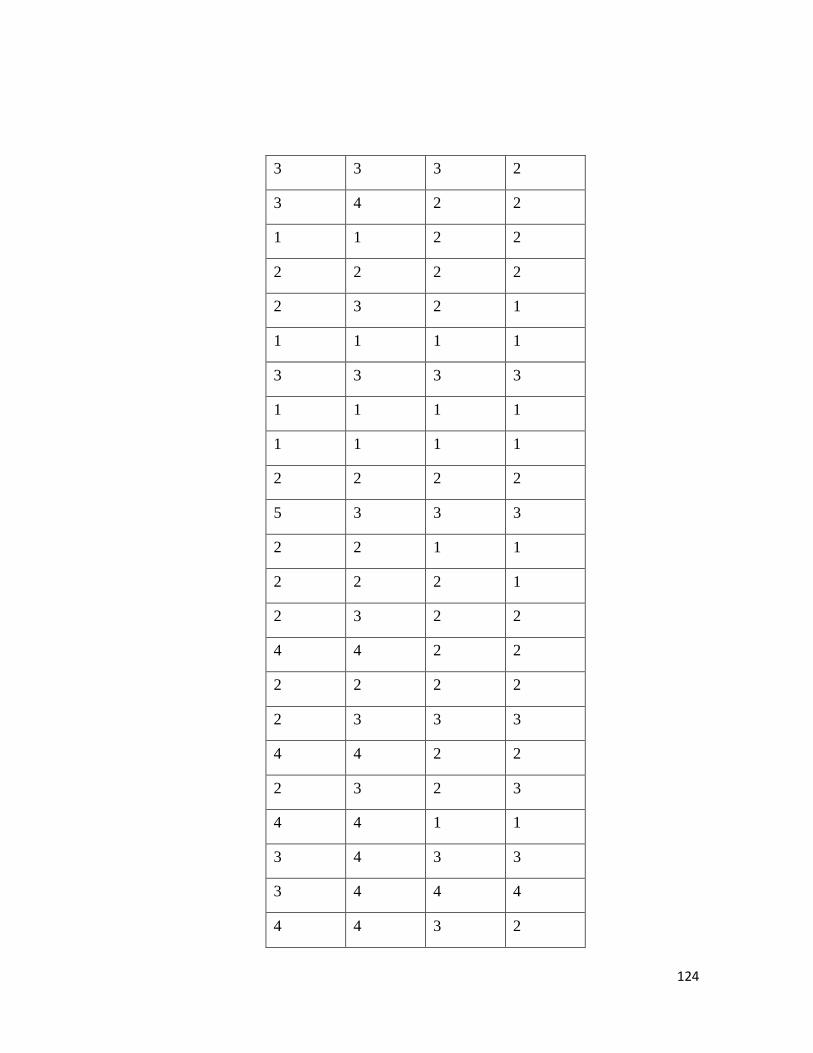
124
3 3 3 2
3 4 2 2
1 1 2 2
2 2 2 2
2 3 2 1
1 1 1 1
3 3 3 3
1 1 1 1
1 1 1 1
2 2 2 2
5 3 3 3
2 2 1 1
2 2 2 1
2 3 2 2
4 4 2 2
2 2 2 2
2 3 3 3
4 4 2 2
2 3 2 3
4 4 1 1
3 4 3 3
3 4 4 4
4 4 3 2

125
3 4 3 2
2 1 1 1
4 4 3 3
3 4 4 3
2 2 3 2
4 4 2 2
3 3 3 3
3 3 2 2
2 3 2 3
2 2 2 2
4 5 2 2
2 2 2 2
2 2 2 2
2 2 2 2
3 3 2 2
4 4 3 3
4 5 4 3
4 4 3 4
3 3 2 4
3 4 3 2
3 3 3 4
2 2 2 2

126
2 3 2 2
3 4 3 3
2 3 2 2
2 3 3 3
2 3 1 1
3 3 3 3
2 4 3 3
3 3 2 2
4 3 4 3
2 2 2 2
2 2 2 1
2 3 1 1
3 4 2 2
1 1 1 1
2 1 2 1
2 3 4 3
3 3 2 2
3 3 2 3
3 4 4 3
4 2 2 2
4 4 3 3
4 3 4 3
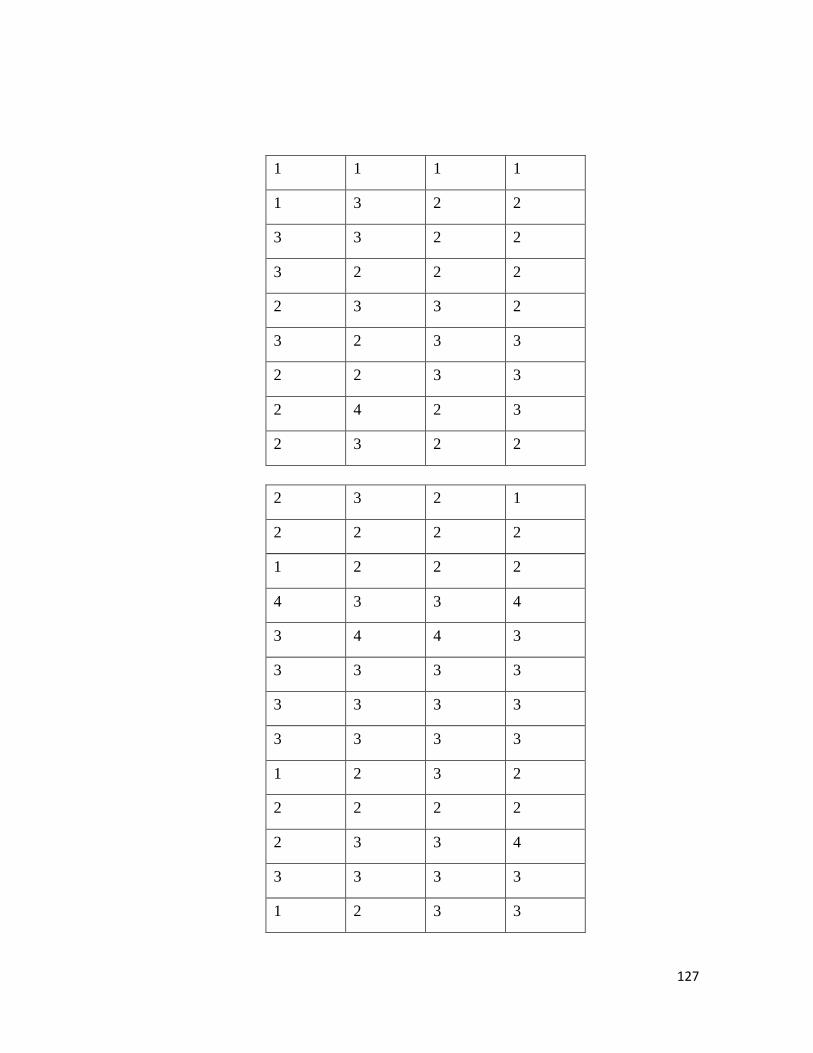
127
1 1 1 1
1 3 2 2
3 3 2 2
3 2 2 2
2 3 3 2
3 2 3 3
2 2 3 3
2 4 2 3
2 3 2 2
2 3 2 1
2 2 2 2
1 2 2 2
4 3 3 4
3 4 4 3
3 3 3 3
3 3 3 3
3 3 3 3
1 2 3 2
2 2 2 2
2 3 3 4
3 3 3 3
1 2 3 3
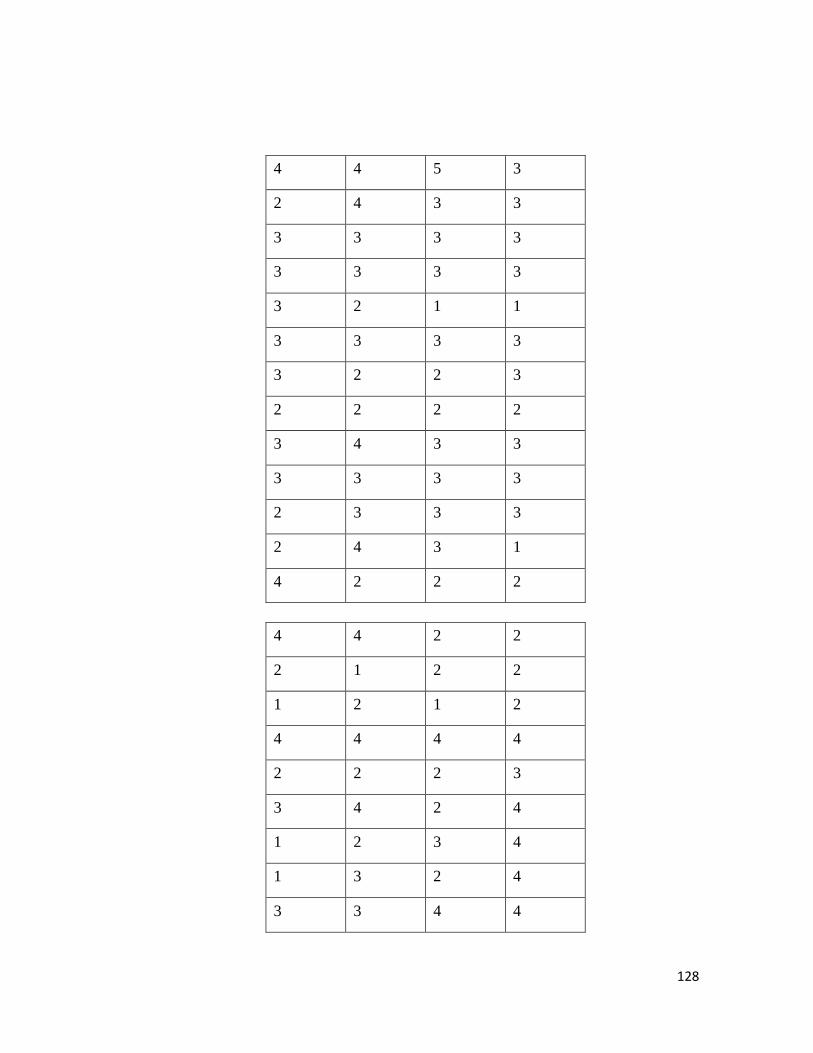
128
4 4 5 3
2 4 3 3
3 3 3 3
3 3 3 3
3 2 1 1
3 3 3 3
3 2 2 3
2 2 2 2
3 4 3 3
3 3 3 3
2 3 3 3
2 4 3 1
4 2 2 2
4 4 2 2
2 1 2 2
1 2 1 2
4 4 4 4
2 2 2 3
3 4 2 4
1 2 3 4
1 3 2 4
3 3 4 4
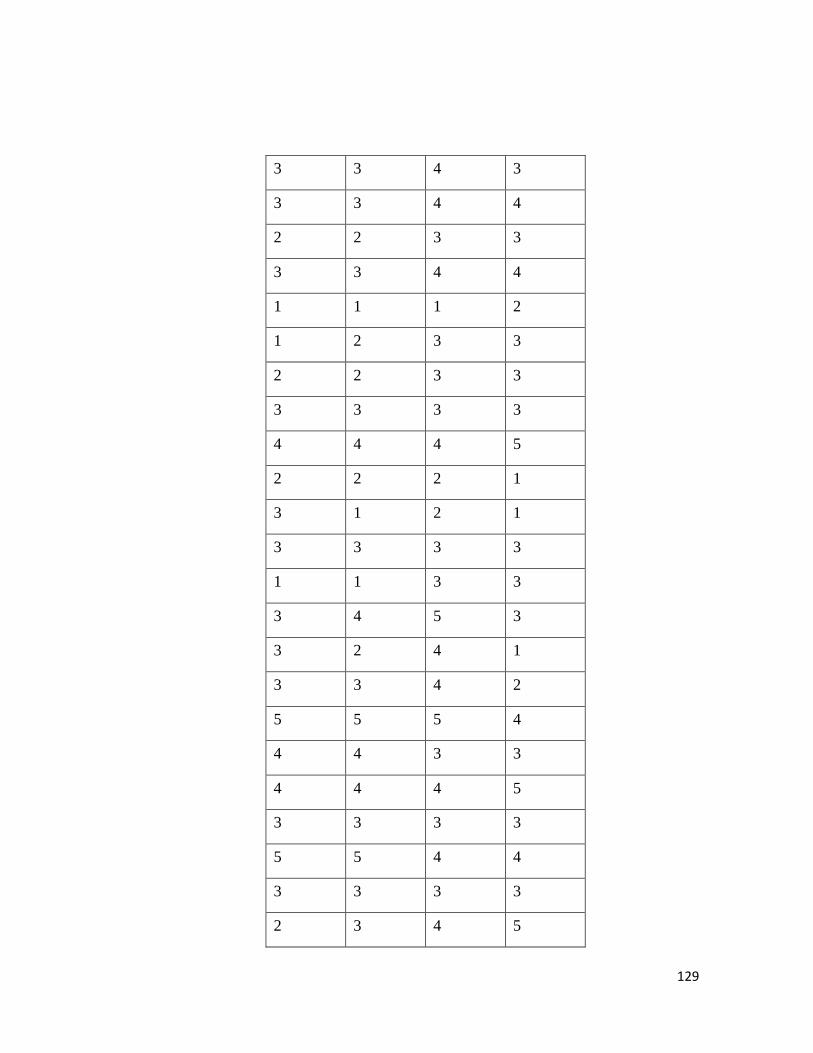
129
3 3 4 3
3 3 4 4
2 2 3 3
3 3 4 4
1 1 1 2
1 2 3 3
2 2 3 3
3 3 3 3
4 4 4 5
2 2 2 1
3 1 2 1
3 3 3 3
1 1 3 3
3 4 5 3
3 2 4 1
3 3 4 2
5 5 5 4
4 4 3 3
4 4 4 5
3 3 3 3
5 5 4 4
3 3 3 3
2 3 4 5
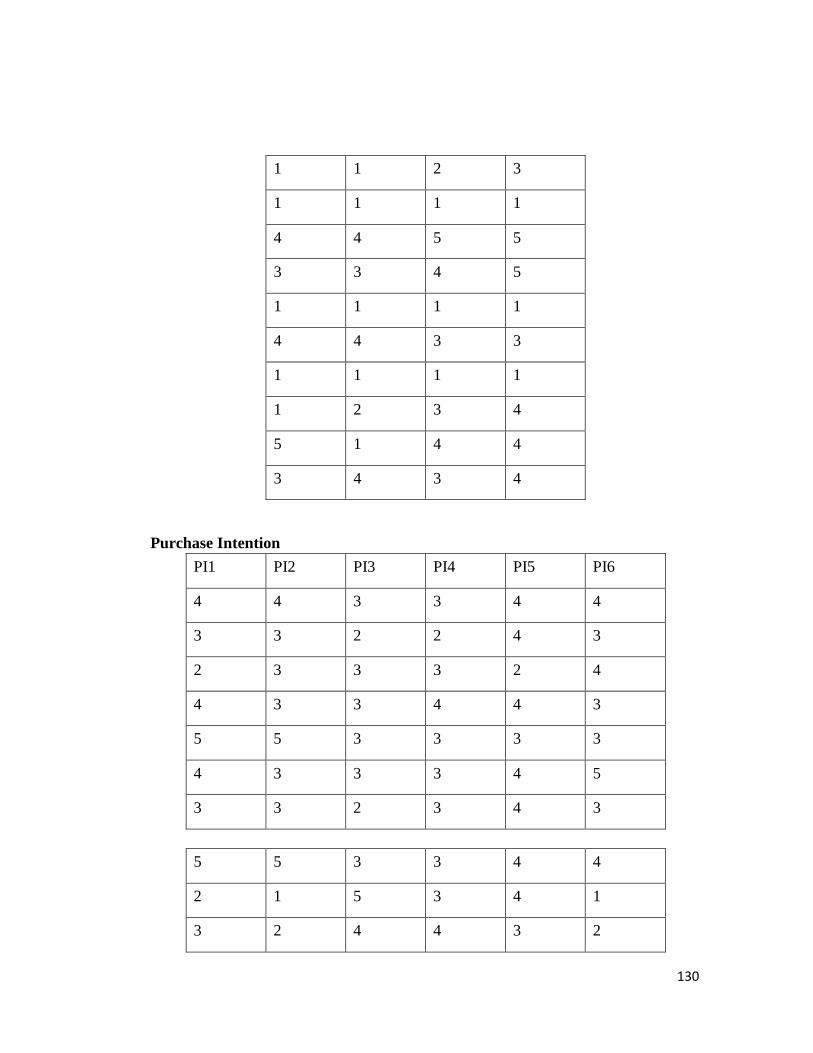
130
1 1 2 3
1 1 1 1
4 4 5 5
3 3 4 5
1 1 1 1
4 4 3 3
1 1 1 1
1 2 3 4
5 1 4 4
3 4 3 4
Purchase Intention
PI1 PI2 PI3 PI4 PI5 PI6
4 4 3 3 4 4
3 3 2 2 4 3
2 3 3 3 2 4
4 3 3 4 4 3
5 5 3 3 3 3
4 3 3 3 4 5
3 3 2 3 4 3
5 5 3 3 4 4
2 1 5 3 4 1
3 2 4 4 3 2
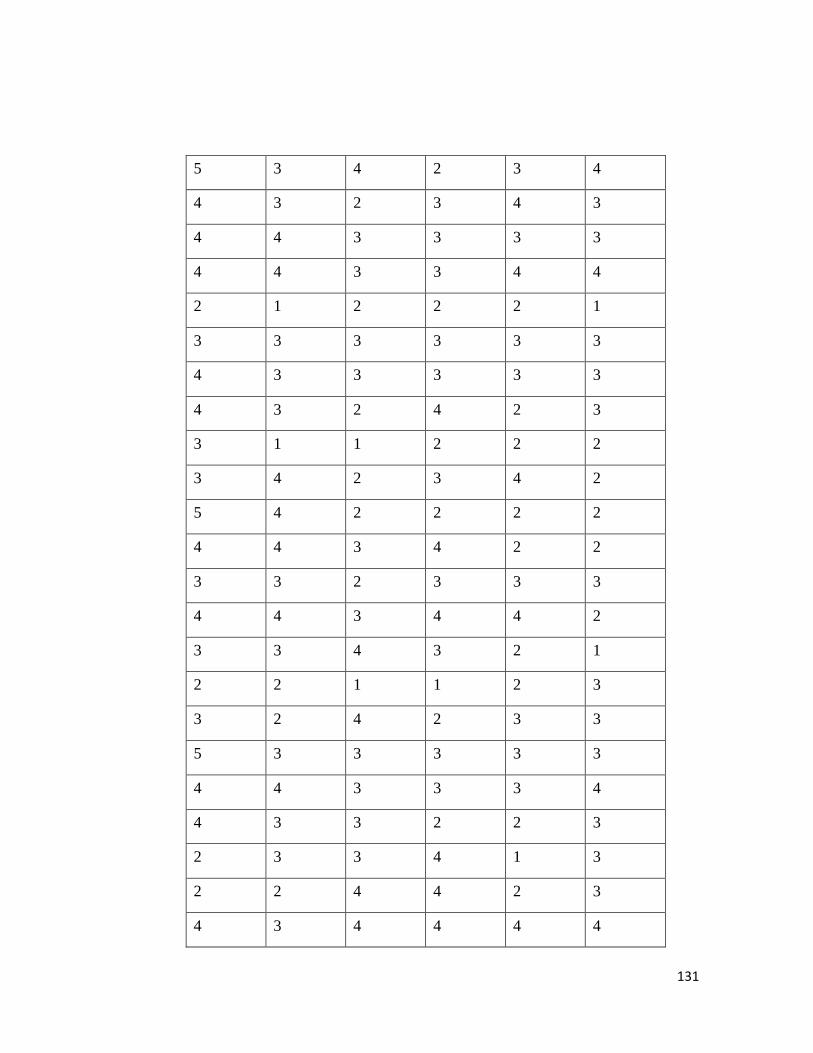
131
5 3 4 2 3 4
4 3 2 3 4 3
4 4 3 3 3 3
4 4 3 3 4 4
2 1 2 2 2 1
3 3 3 3 3 3
4 3 3 3 3 3
4 3 2 4 2 3
3 1 1 2 2 2
3 4 2 3 4 2
5 4 2 2 2 2
4 4 3 4 2 2
3 3 2 3 3 3
4 4 3 4 4 2
3 3 4 3 2 1
2 2 1 1 2 3
3 2 4 2 3 3
5 3 3 3 3 3
4 4 3 3 3 4
4 3 3 2 2 3
2 3 3 4 1 3
2 2 4 4 2 3
4 3 4 4 4 4

132
3 2 3 4 2 3
5 3 3 2 4 4
3 3 3 3 2 3
4 4 3 4 4 5
2 3 3 2 2 4
4 3 2 4 3 3
5 3 2 2 3 4
4 3 3 4 4 4
3 3 2 4 4 2
4 4 3 3 4 4
3 3 2 3 3 3
4 4 3 4 4 4
4 4 4 3 4 4
4 4 2 3 4 4
4 3 3 4 4 4
4 2 2 3 3 2
3 3 2 4 2 3
2 4 3 3 3 3
2 2 2 4 3 3
4 4 4 3 3 4
3 2 1 3 4 2
4 3 2 3 3 3

133
5 3 3 3 2 3
3 3 3 3 3 3
4 4 3 4 4 4
3 4 3 4 4 4
3 3 4 2 4 4
2 3 1 3 3 3
4 3 3 4 3 4
2 4 2 3 3 3
3 4 2 4 3 2
2 3 4 2 2 1
3 3 2 2 4 3
4 4 3 3 3 4
3 3 3 3 2 5
3 3 2 4 4 4
4 3 3 4 3 3
4 3 3 2 4 3
4 3 3 3 2 2
3 3 4 4 3 4
2 1 3 2 1 3
3 2 3 3 3 3
3 3 4 4 2 2
3 2 3 2 3 2

134
3 2 3 2 3 3
4 4 3 3 3 3
2 3 3 3 2 3
3 4 3 3 3 4
4 4 4 3 3 3
5 5 5 4 5 5
3 2 4 3 2 3
3 3 2 3 3 3
3 4 3 3 3 3
3 4 3 3 4 3
4 3 3 4 4 3
3 3 2 3 3 3
3 2 3 3 3 3
3 4 2 3 2 4
3 4 2 3 2 2
4 4 3 3 3 3
4 3 3 3 3 3
3 3 2 3 3 3
4 3 3 3 4 4
4 4 3 3 4 4
3 4 3 4 3 3
5 4 3 4 3 3

135
4 3 3 2 3 2
3 4 4 3 3 4
3 4 2 3 4 4
3 2 3 3 3 3
3 4 2 3 2 3
4 2 3 4 3 3
3 4 3 4 4 5
3 4 2 4 4 4
4 4 2 4 4 4
4 2 3 3 4 3
2 3 2 4 4 3
5 4 2 2 2 3
3 4 2 4 4 4
3 2 3 3 1 2
3 2 3 3 3 3
3 3 3 4 3 4
3 4 3 5 3 4
3 4 3 3 3 4
3 4 4 4 3 3
3 4 3 4 4 3
3 2 3 3 2 3
3 3 2 4 2 3
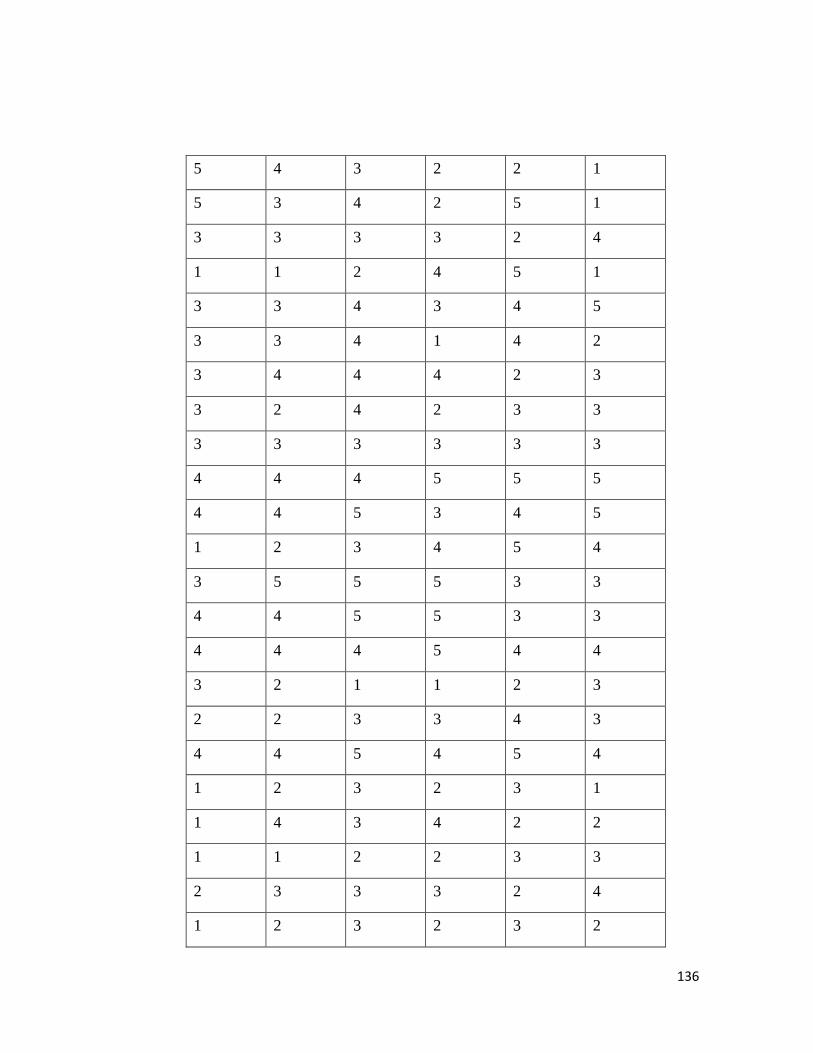
136
5 4 3 2 2 1
5 3 4 2 5 1
3 3 3 3 2 4
1 1 2 4 5 1
3 3 4 3 4 5
3 3 4 1 4 2
3 4 4 4 2 3
3 2 4 2 3 3
3 3 3 3 3 3
4 4 4 5 5 5
4 4 5 3 4 5
1 2 3 4 5 4
3 5 5 5 3 3
4 4 5 5 3 3
4 4 4 5 4 4
3 2 1 1 2 3
2 2 3 3 4 3
4 4 5 4 5 4
1 2 3 2 3 1
1 4 3 4 2 2
1 1 2 2 3 3
2 3 3 3 2 4
1 2 3 2 3 2
137
2 2 3 3 2 1
1 1 2 2 1 3
2 2 4 3 2 2
3 3 4 4 3 3
2 4 1 5 2 4
4 3 4 3 5 4
Appendix C – Pre-Test
BI Reliability Testing
Reliability Statistics
Cronbach's
Alpha
N of Items
.795 6
PP Reliability Testing
Reliability Statistics
Cronbach's
Alpha
N of Items
.812 6
PQ Reliability Testing
Reliability Statistics
Cronbach's
Alpha
N of Items
.777 8
PV Reliability Testing
Reliability Statistics
138
Cronbach's
Alpha
N of Items
.818 5
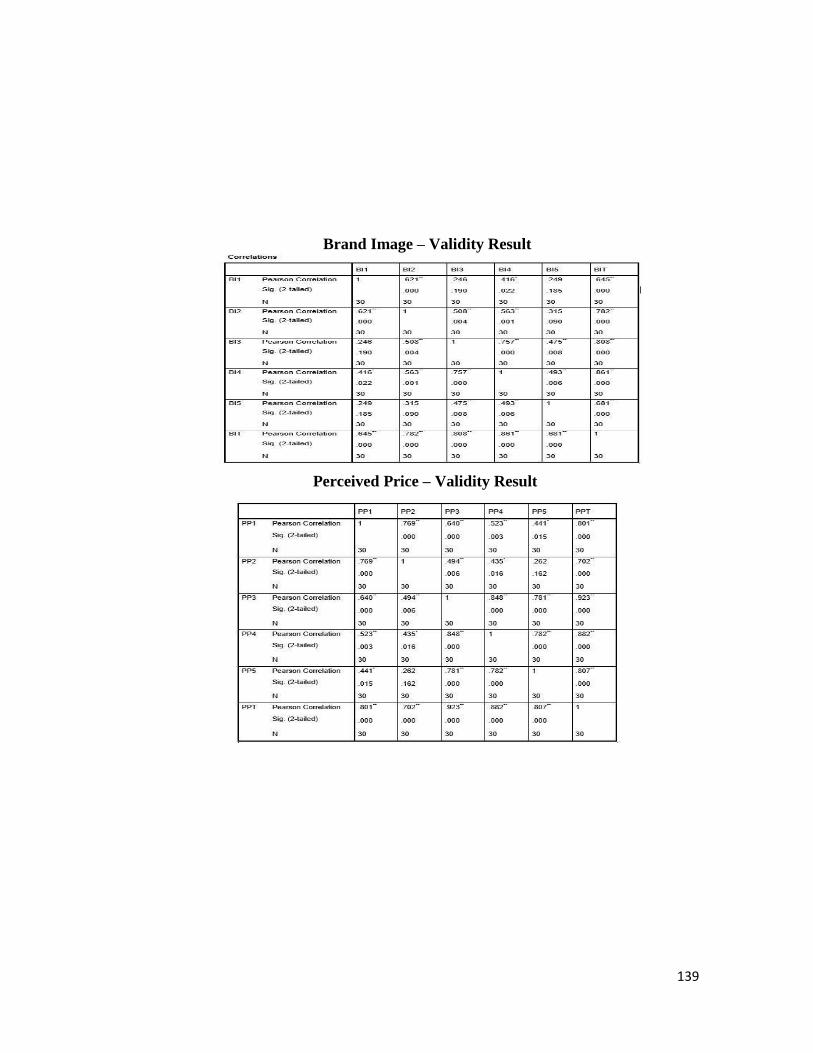
139
Brand Image – Validity Result
Perceived Price – Validity Result
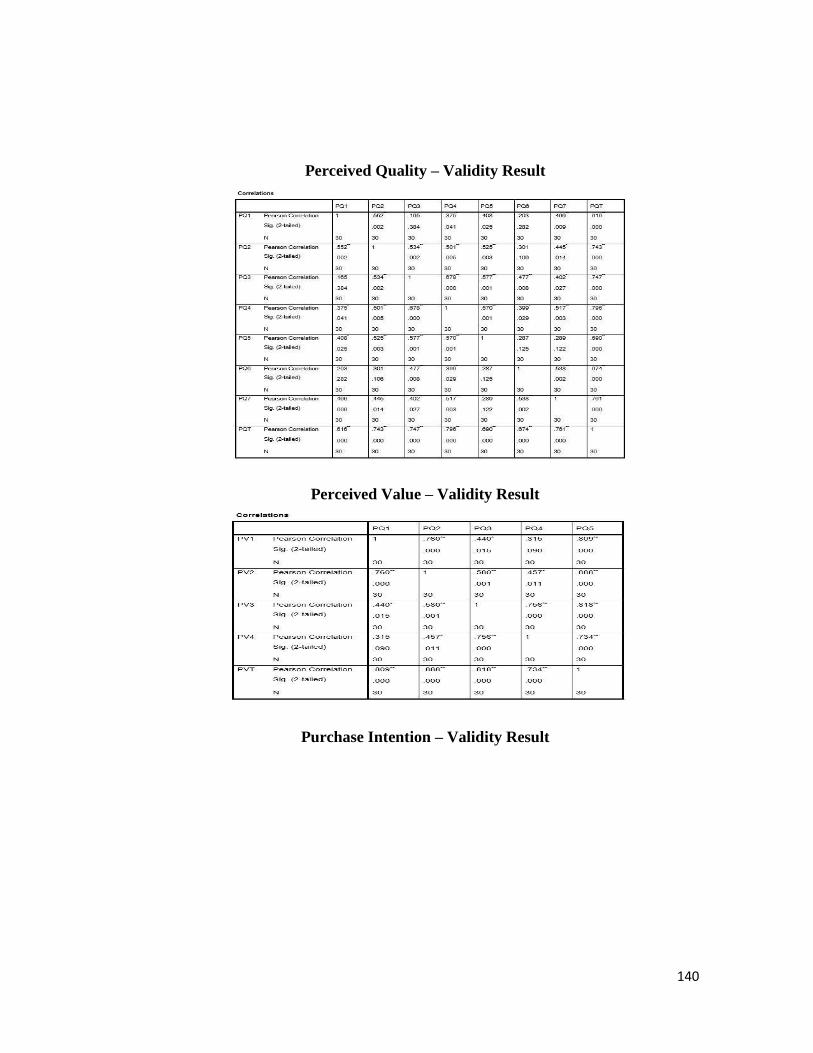
140
Perceived Quality – Validity Result
Perceived Value – Validity Result
Purchase Intention – Validity Result
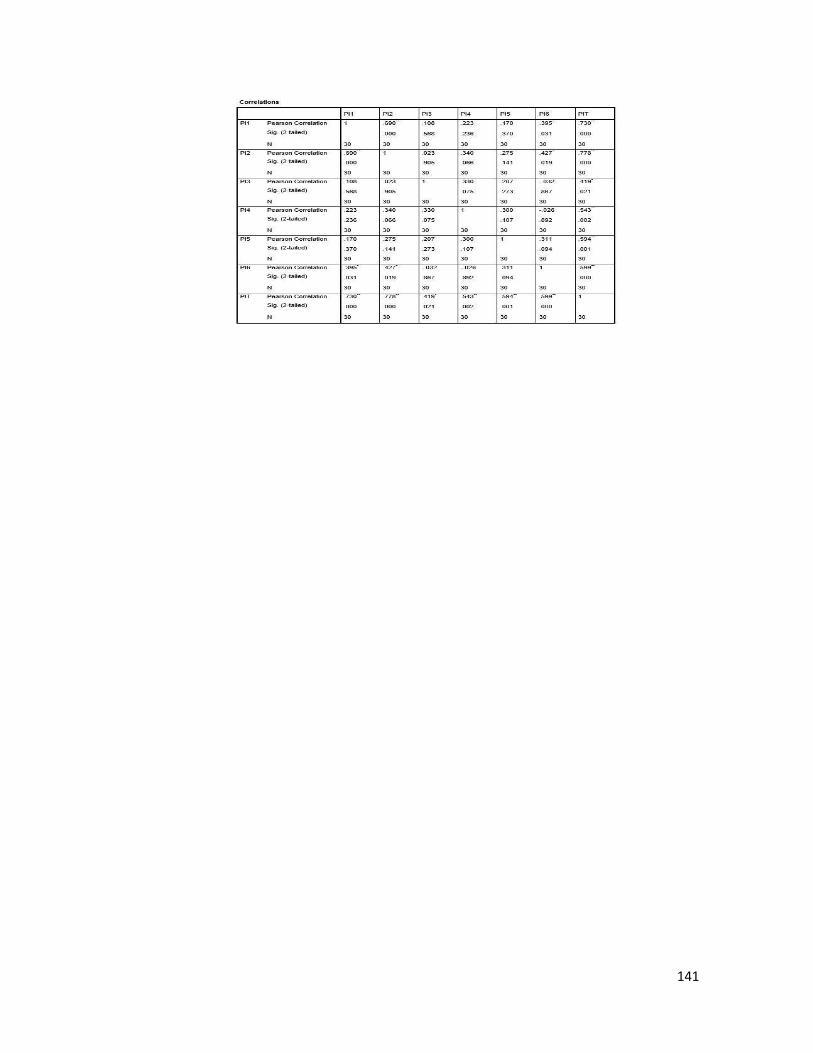
141