the influence of brand loyalty, awareness, and …
TRANSCRIPT

i
THE INFLUENCE OF BRAND LOYALTY,
AWARENESS, AND ASSOCIATION TOWARD
CONSUMER BUYING DECISION OF MIZONE
(A Case Study of President University)
By
Felicia
ID No. 014201000029
A skripsi presented to the
Faculty of Business President University
in fulfillment of the requirement for
Bachelor Degree in Economics Major of Management
February 2014

i
SKRIPSI ADVISOR
RECOMMENDATION LETTER
This skripsi, entitled “THE INFLUENCE OF BRAND LOYALTY,
AWARENESS, AND ASSOCIATION TOWARD CONSUMER
BUYING DECISION OF MIZONE” prepared and submitted by
Felicia in partial fulfillment of the requirements for the degree of
Bachelor in the Faculty of Business has been reviewed and found to
have satisfied the requirements for a skripsi fit to be examined. I
therefore recommend this skripsi for Oral Defense.
Cikarang, Indonesia, January 23, 2014
Acknowledged by, Recommended by,
Vinsensius Jajat Kristanto, SE., MM., MBA. Purwanto, ST, MM
Head of Management Study Program Skripsi Advisor

ii
DECLARATION OF ORIGINALITY
I declare that this skripsi, entitled “THE INFLUENCE OF BRAND
LOYALTY, AWARENESS, AND ASSOCIATION TOWARD
CONSUMER BUYING DECISION OF MIZONE” is, to the best
of my knowledge and belief, an original piece of work that has not
been submitted, either in whole or in part, to another university to
obtain a degree.
Cikarang, Indonesia, January 23, 2014
Felicia

iii
PANEL OF EXAMINERS
APPROVAL SHEET
The Panel of Examiners declare that the Skripsi, entitled “THE
INFLUENCE OF BRAND LOYALTY, AWARENESS, AND
ASSOCIATION TOWARD CONSUMER BUYING DECISION
OF MIZONE” that was submitted by Felicia, majoring in
Management from the Faculty of Business, was assessed and approved
to have passed the Oral Examination on February 10, 2014.
Chair – Panel of Examiners
Dra. Genoveva, MM
Examiner I
T. Manivasugen, M.B.A., D.I.S.M.
Examiner II
Purwanto. ST., MM

iv
ABSTRACT
This study is conducted to find the relationship between brand equity aspects,
especially brand loyalty, brand awareness, and brand association toward consumer
buying decision of Mizone. Mizone is a product that competes in isotonic drink
market. Mizone is a national product originally made in Indonesia. However,
Mizone isn’t the number one isotonic drink in Indonesia, although it is a national
product. Based on the top brand index 2013, Mizone scored 39.5%, number two
after Pocari Sweat. There are lots of competitors from outside the country that
enter isotonic drink market in Indonesia.
Researching based on the brand equity factor of the product indicated which
factor that affects consumer buying behavior. The result shows that brand
association has the biggest effect on Mizone consumer buying decision, which is
0.643, compared to brand loyalty (0.186) and brand awareness (0.171). Therefore,
the researcher suggests that PT. Tirta Investama which produces Mizone, can
improve their branding aspects especially the brand association aspect.
Keywords: brand equity, brand loyalty, brand awareness, brand association,
buying decision

v
ACKNOWLEDGEMENT
First and foremost, the researcher would like to express the greatest gratitude to
her Lord Jesus Christ, whose blessings had helped the researcher to complete this
skripsi. Moreover, I would like to thank V. Jajat kristanto, SE. MM., MBA;
Purwanto, ST, MM; and Sonny Sutedjo S.E., M.M as my advisors for they
have provided me with guidance and assistances. Without them, this research
would not reach its completion.
To my parents Nasrul Saleh and Fonnywati Iskandar, and my sister Silvia Saleh
whose support were very valuable for the researcher to keep continue doing the
skripsi.
To my best friends – Andrie Satya, Beatrice Etania Ribkah, Vina Agustiana,
Wilson Sutarlim, Leon Marcello, Fredi, Maria Amanda, Cakra Suganda, and
Andika Nugraha whose endless support helped the researcher to always be in high
spirit to do the skripsi.
Also to my classmates which is Marketing 2010, thank you for the great time that
we’ve shared together. It is a very valuable memory to the researcher.
In the end, researcher realizes that nothing is perfect, so does the skripsi.
Therefore, researcher accepts any suggestion or recommendation, so researcher
has better understanding about the study.
Cikarang, January 23, 2014
Felicia
vi
TABLE OF CONTENT
ABSTRACT ........................................................................................................... iv
ACKNOWLEDGMENT .......................................................................................... v
TABLE OF CONTENT ......................................................................................... vi
LIST OF TABLES ................................................................................................. ix
LIST OF FIGURES ................................................................................................. x
CHAPTER I: INTRODUCTION ............................................................................. 1
1.1.Background of Study ...................................................................................... 1
1.2.Problem Identification .................................................................................... 5
1.3.Statement of Problem ..................................................................................... 5
1.4.Research Objective ......................................................................................... 6
1.5.Research Limitation ........................................................................................ 6
1.6. Definition of Terms ....................................................................................... 7
1.7. Significance of the Study ............................................................................... 8
1.8. Benefits of the Study ..................................................................................... 9
CHAPTER II: LITERATURE REVIEW .............................................................. 10
2.1. Theoretical Review ...................................................................................... 10
2.1.1. Marketing .............................................................................................. 10
2.1.2. Brand..................................................................................................... 12
2.1.3. Brand Equity ......................................................................................... 15
2.1.3.1. Brand Loyalty................................................................................ 18
2.1.3.2. Brand Awareness .......................................................................... 21
2.1.3.3. Brand Association ......................................................................... 24
2.1.3.4. Perceived Quality .......................................................................... 26

vii
2.1.3.5. Other Proprietary Asset ................................................................. 28
2.1.4. Consumer Buying Behavior ................................................................. 28
2.2. Previous Research ....................................................................................... 34
2.3. Theoretical Framework ............................................................................... 36
2.4. Hypotheses .................................................................................................. 36
CHAPTER III: METHODOLOGY ....................................................................... 37
3.1. Research Method ......................................................................................... 37
3.2. Research Design .......................................................................................... 38
3.3. Research Instrument .................................................................................... 39
3.3.1. Data Collection ..................................................................................... 39
3.3.2. Data Collection Technique ................................................................... 40
3.3.3. Measurement Scale and Data Analysis................................................. 41
3.3.3.1. Measurement Scale ....................................................................... 41
3.3.3.2. Data Analysis ................................................................................ 42
3.4. Validity and Reliability ............................................................................... 42
3.4.1. Validity Test ......................................................................................... 42
3.4.2. Reliability Test...................................................................................... 43
3.5. Sampling Design ......................................................................................... 44
3.4.1. Sampling Technique ............................................................................. 44
3.5.1. Sampling Size ....................................................................................... 45
3.6. Statistical Tools ........................................................................................... 46
3.6.1. Multiple Regression .............................................................................. 46
3.6.2. Correlation Test .................................................................................... 47
3.6.3. Normality Test ...................................................................................... 47
3.6.4. Multicollinearity Test ........................................................................... 48
3.6.5. Heterokedasticity Test .......................................................................... 48

viii
3.6.6. F Test .................................................................................................... 48
3.6.7. T Test .................................................................................................... 49
3.7. Limitation of the Research .......................................................................... 50
CHAPTER IV: ANALYSIS AND INTERPRETATION ...................................... 51
4.1. Company Profile .......................................................................................... 51
4.2. Data Analysis ............................................................................................... 53
4.2.1. Respondent Profile................................................................................ 53
4.2.2. Validity Test ......................................................................................... 54
4.2.3. Reliability Test...................................................................................... 55
4.2.4. Correlation Test .................................................................................... 56
4.2.5. Multiple Regression .............................................................................. 56
4.2.6. Normality Test ...................................................................................... 57
4.2.7. Heterokedasticity Test .......................................................................... 58
4.2.8. Multicollinearity Test ........................................................................... 59
4.2.9. F Test .................................................................................................... 59
4.2.10. T Test .................................................................................................. 60
4.2.11. Multiple Regression Model ................................................................ 61
4.3. Interpretation Result .................................................................................... 63
CHAPTER V: CONCLUSION AND RECOMMENDATION ............................. 65
5.1. Conclusion ................................................................................................... 65
5.2. Recommendation ......................................................................................... 66
REFERENCES ....................................................................................................... 68
APPENDICES ....................................................................................................... 72
APPENDIX I .......................................................................................................... 73
APPENDIX II ........................................................................................................ 76
APPENDIX III ....................................................................................................... 79

ix
LIST OF TABLES
Table 1.1 Top Brand Index ...................................................................................... 3
Table 2.1 Brand Equity Studies ............................................................................. 16
Table 2.2 Brand Equity Past Research ................................................................... 34
Table 3.1 Likert Scale ............................................................................................ 42
Table 3.2 Interpretation Coefficient R ................................................................... 47
Table 4.1 Table Respondent Profile Based On Gender ......................................... 53
Table 4.2 Validity Test Result ............................................................................... 54
Table 4.3 Reliability Test Result ............................................................................ 55
Table 4.4 Correlations ............................................................................................ 56
Table 4.5 Multicollinearity Result ......................................................................... 59
Table 4.6 ANOVA ................................................................................................. 60
Table 4.7 Coefficients ............................................................................................ 60
Table 4.8 Model Summary ..................................................................................... 62
Table 4.9 R Value .................................................................................................. 62
Table 4.10 Significance and Beta Coefficients ...................................................... 63

x
LIST OF FIGURES
Figure 2.1 Brand Equity Aspects ........................................................................... 18
Figure 2.2 Brand Loyalty Level Pyramid .............................................................. 19
Figure 2.3 Brand Awareness Level Pyramid ......................................................... 23
Figure 2.4 Factors Influence Consumer Behavior ................................................. 29
Figure 2.5 Maeslow’s Hierarchy of Needs ............................................................ 31
Figure 2.6 Consumer Buying Decision Steps ........................................................ 32
Figure 2.7 Theoretical Framework ......................................................................... 36
Figure 4.1 Mizone .................................................................................................. 52
Figure 4.2 Demographic Views (Gender) .............................................................. 53
Figure 4.3 Histogram ............................................................................................. 57
Figure 4.4 P-P Plot ................................................................................................. 57
Figure 4.5 Scatterplot ............................................................................................. 58

1
CHAPTER I
INTRODUCTION
1.1. Background of Study
Water is unique molecule that exists in nature and it is available in three forms:
solid, liquid, and gas. Humans’ earth is covered with 75% of water. It is a very
important molecule for humans to live in the earth. Human body contains from
55% to 78% of water, depends on the body size. It is a very essential thing for
humans to perform their activities. Without water, humans can’t live or survive.
Water is used to drink, transportation, chemical uses, fire extinction, and perform
daily activities like washing or cleaning. The importance of water is:
1. Maintain people health
2. Keep the bloodstream liquid enough to flow in the blood vessels
3. Eliminate the result of metabolism (for example: urea)
4. Regulate body temperature through sweating
5. Carry the nutrients and oxygen to cells.
Based on British Dietetic Association, people are recommended to drink
minimum 1.8 liters of water everyday (8 glasses of water) to balance the fluid in
their body. People who have low water content in their body can suffer
dehydration. Dehydration occurs when people only drink little water, so the water
content in their body is very low. Other causes are they vomit, increased sweating
because of the hot weather, etc. Some symptoms of dehydration are headaches,
weakness, tiredness, confusion, lethargy, etc. For people who have dehydration,
they have to drink water to increase the amount of fluid in their body. If
dehydration isn’t countered fast, urination can stop, kidney fails, so the body can’t
remove toxic waste. Moreover, in the extreme cases, dehydration can also result
in death. This shows that water is very important for humans to live healthy.

2
Besides for human healthiness, water also plays important part in businesses.
First, water is important for human to live healthy, so they can do their activities
(include working) and perform well in their activities. Second, no water means no
business. Water is a requisite resource for business. Without regular or continuous
access to clean water, businesses either have to raise prices, shut down or both.
Industries that rely on water for operations or manufacturing are the most
vulnerable and most at risk. Throughout the world, water scarcity, water quality,
climate change, rapid industrialization, deforestation, unsustainable agricultural
practices and fast growing populations are putting pressure on companies to
understand how water issues can destabilize, radically alter, or halt business
performance.
Nowadays, people expand their business in more than one industry and many
people build a company in beverage industry. This industry can be classified
again into companies that produce drinking water, packaged water, soda, fruit-
flavored water, and also isotonic water. Moreover, there are many companies in
the world that produce sport water which contain isotonic, such as: Accelerade,
Aquarius, Coconut Water, Gatorade, Lucozade Sport, Pocari Sweat, Powerade,
etc. These sport water become popular in the world and people not only drink
pure water, but also buy and consume sport drinks as well. Sport drinks are
beverages to help active people replace water, electrolytes, and energy in their
body.
In Indonesia itself, there are some companies that produce isotonic drinks, such
as: Pocari Sweat, Mizone, Vitazone, X-ion, Powerade, and Fatigon Hydro. These
isotonic drinks become popular in Indonesia and many people consume them.
They also can buy it in Supermarket because these products are distributed to
many places in Indonesia, so people can buy it easily. Popular companies that
produce isotonic drinks are PT. Aqua Golden Mississippi (produces Mizone), PT.
Amerta Indah Otsuka (produces Pocari Sweat), PT. Mayora Indah (produces
Vitazone), Dankos Laboratories (produces X-ion), PT. Coca Cola Amatil
(produces Powerade), and PT. Kalbe Farma (produces Fatigon Hydro).

3
PT. Aqua Golden Mississippi is built in 1973 by Tirto Utomo and it is a pioneer
of packaged drinking water in Indonesia. In 1998, Aqua (under PT. Tirta
Investama) joined Danone Group. PT. Tirta Investama is the market leader of
packaged drinking water. The company then tried to enter isotonic drink business
by launching Mizone on September 27, 2005. At that time, Mizone competed with
Pocari Sweat and Powerade Isotonik in which both are originally from foreign
company. Mizone is an isotonic drink which contains ion with function to fill
people’s body fluid. After Mizone, there was several local competitors show up
like Vitazone, X-ion, Prosweat, etc.
Mizone is produced under big company which is the producer of pioneered
drinking water, Aqua. However, based on top brand index 2013 in Indonesia, the
top brand index of Mizone is below Pocari Sweat. Top brand index is an indicator
to know how strength the brand is. It is formulated based on 3 variables: mind
share, market share, and commitment share. Mind share indicated a brand’s
strength inside the minds of the consumers of the respective product category.
Market share is a brand’s strength in a certain market in terms of consumers’
actual buying behavior. Commitment share means a brand’s strength in
encouraging consumers to buy that brand in the future. The top brand index for
isotonic drink can be seen in table below:
Table 1.1 Top Brand Index
NO BRAND TBI
1. Pocari Sweat 52.5%
2. Mizone 39.5%
3. Vitazone 2.8%
4. Fatigon Hydro 2.3%
Source: Top Brand Index Survey (2013)
From the table of top brand index that is made by Frontier Consulting Group
above, it shows that isotonic drink market is dominated by Pocari Sweat (under
PT. Amerta Indah Otsuka, subsidiary from Japan) by 52.5%. Then it is followed
4
by Mizone (39.5%), Vitazone (2.8%), and Fatigon Hydro (2.3%). It means that
the brand Pocari Sweat is preferred by more consumers in Indonesia. The brand is
remembered in people’s mind (mind share). Then, people also buy this product
more than they buy Mizone (market share). Moreover, people also satisfied with
the product and buy it again in the future (commitment share).
In the other hand, Mizone is a product that also accepted by Indonesia people. In
order to compete with Pocari Sweat which comes first in Indonesia, PT. Tirta
Investama produces Mizone, an isotonic drink with lower price, higher quantity,
and available in several flavors. These are the strength of Mizone, compared to
Pocari Sweat which is only available in one flavor and higher price. However,
Pocari Sweat is the first well-known isotonic drink in Indonesia, so Mizone has to
improve its product and strengthen the brand in order to become number one in
isotonic drink segment in Indonesia.
Based on previous research done by Shalina (Shalina, 2008), people tend to have
a better image of Pocari Sweat rather than Mizone. The association that Mizone
wants to put in customers’ mind is an isotonic drink to replace body fluid.
However, it is shown that people see Mizone as an isotonic drink with many
flavors and produced by a reputable company.
The researcher chooses this topic because isotonic drink is a product which now
can be easily bought everywhere. Mizone is a popular isotonic drink, yet it isn’t
the winner in the market because of Pocari Sweat. Mizone also has a very good
advertising and marketing campaign. The recent marketing activity of Mizone is
its interactive website (www.mizone.co.id). The website is very creative and show
that Mizone is a right product for people who tired or feeling “K.O” (knocked
down, tired, no energy left). Mizone also has TV ads with similar message which
is drink Mizone to bring back your energy.
Although Mizone product is cheaper than Pocari Sweat, has higher quantity that
Pocari Sweat, and has interesting website and TV ads; Mizone top brand index is
still below Pocari Sweat. This shows that brand is very important and strong
positive brand will give huge benefit to the product. People will buy product that

5
they know, they like, and they enjoy. Therefore, the researcher is interested to do
a research about the influence of brand loyalty, brand awareness, and brand
association toward consumer buying decision of Mizone product in Indonesia.
1.2. Problem Identification
Nowadays, many companies in Indonesia compete with each other to become the
number one company based on the specific category, include isotonic drink
industry. However, competing with other company isn’t an easy task. PT. Tirta
Investama with its Mizone must focus on the product strength to create
competitive advantage that is different from other companies with their isotonic
drink product, in order to gain more customers and keep loyal customers.
Moreover, the company also has to analyze who are its competitors and how to
defeat them, how to make Mizone become number one of isotonic product against
its main competitor which is Pocari Sweat. Based on top-brand index (TBI) result
in 2010, Mizone TBI is 32.4% and Pocari Sweat is 59.4%. In 2011, Mizone TBI is
42.7% while Pocari Sweat TBI is 48.8%. Moreover, in 2013, Mizone TBI (39.5%)
is still below Pocari Sweat (52.5%). Therefore, Mizone must know what customer
think about the brand. By knowing it, Mizone can take decisive and immediate
action to improve the product, brand, and take right steps to defeat its main
competitor, Pocari Sweat, under PT. Amerta Indah Otsuka.
1.3. Statement of Problem
Generally, this research is about finding out what is consumer buying decision of
Mizone product based on their loyalty, awareness, and their association about the
brand. People buy a product because they know and aware about the brand, also
they satisfied with the product. They buy the product because they have their own
perception and association about it. However, there are some people who know
nothing about the brand. They try the product and then they like it. People will
have new perception and association about the brand after they try it. There are
6
many aspects that affect people to buy a specific product. In this research, the
researcher analyzes the brand loyalty, brand awareness, and brand association
aspects that encourage people to make decision and then buy the product.
Researcher has constructed and designed following research questions:
1. Does brand loyalty influence consumer buying decision of Mizone?
2. Does brand awareness influence consumer buying decision of Mizone?
3. Does brand association influence consumer buying decision of Mizone?
4. Does brand loyalty, brand awareness, and brand association influence
consumer buying decision of Mizone?
1.4. Research Objective
The main objective of the research is:
1. To analyze influence between brand loyalty toward consumer buying
decision of Mizone.
2. To analyze influence between brand awareness toward consumer buying
decision of Mizone.
3. To analyze influence between brand association toward consumer buying
decision of Mizone.
4. To analyze influence between brand loyalty, brand awareness, and brand
association toward consumer buying decision of Mizone.
1.5. Research Limitation
Scope of the study is to analyze brand loyalty, brand awareness, and brand
association of Mizone that makes people buy the product (consumer buying
decision). To guide this research, researcher uses quantitative method to analyze
the consumer buying decision of Mizone product. Researcher prefers to use this
study because it is the most well-known study for quantitative research
methodology.

7
A limitation of this study is to college students (age 18-21 years old), who study
in President University in Cikarang, and has consumed Mizone. Because of
limited time and budget, the number of sample that researcher take is 100 people.
This study is also dedicated to students who need to know about brand equity of
FMCG product.
1.6. Definition of Terms
Brand: A sign in the form of image, name, word, letter, figure, colors
arrangement, or combination of these elements that have differentiation and are
used in trading goods or services.
Brand equity: The difference between the value of the brand to the consumer and
the value of the product without that branding.
Brand loyalty: The situation in which a consumer generally buys the same
manufacturer-originated product or service repeatedly over time rather than
buying from multiple suppliers within the category.
Brand awareness: The ability for customers to remember a particular brand or
advertising spontaneously or after they are stimulated with key words related to
the brand.
Brand association: Everything that is related to memory about a brand, attribute
that is available in that brand itself.
Customer: Customer is the recipient of a good, service, product, or idea, obtained
from a seller, vendor, or supplier for a monetary or other valuable consideration
(Kendall, 2007).
Consumer buying decision: Steps that consumers go through before they buy a
product or service and their behavior after they buy the product or service.
Isotonic: Isotonic has equal water to the cell, so both the cell and solution have
the same water concentration all the time.

8
1.7. Significance of the Study
This study is important because brand is one of the most important assets of a
company. A brand itself can worth dozens of company’s book value. Brand is an
interface between the company and its customers, a description of product or
service that the company offers. If people don’t know about your brand, it means
that the company is in danger because there will be only few people who
recognize or aware about the brand and buy the product or service it offers. If
people have a negative perception and association about a specific brand, the
brand also in danger because people won’t buy the product because of the
negative effect it causes in the mind of customers, yet they won’t become loyal
customers to the company. Therefore, by analyzing the brand performance, the
company can evaluate and determine smart planning and strategy to develop the
product, so the product’s brand will be recognized by people and they also keep
buy the product because they trust the brand.
This study is important for academic teachers/lecturers because this research will
show the importance of brand of a product to the company who produces it. By
understanding this, the lecturers can teach their student that branding is a
common, yet very important thing of marketing aspect in a company about the
product or service that the company offers to the customers. Moreover, lecturers
can also teach their students real example of a successful brand that focus on
analyzing its brand aspect and gain many customers because of the positive image
and perception of the brand.
This study is also important for student because they can learn a lot about
branding. By learning about brand loyalty, brand awareness, and brand
association of a product, they can understand that brand is a very important aspect
that they must consider in a product. They can also learn how people buy the
product because of the brand, what decision that it takes for people to finally buy
and consume the product. Brand worth million dollar in a business. Brand itself
can make people to buy and consume the product or to not use the product. Strong

9
brand is a very good asset for the company and a step to gain many customers to
buy the product.
A product has its own brand in which the brand loyalty, brand awareness, and
brand association analysis will be different from one product to other products.
Generally, by knowing the brand loyalty, brand awareness, and brand association
of Mizone, researcher can analyze what is the influence of these aspects to buying
decision of people who consume it. Thus, researcher makes a research that
involves people who consume Mizone product. This study hopefully will be
useful for future President University students in order to gain knowledge about
brand equity and as for researcher, understanding the branding concept especially
brand loyalty, brand awareness, and brand association will help her to increase her
knowledge in the field of marketing.
1.8. Benefits of the Study
The benefit of the study is to increase the analytical thinking of the researcher.
This research is also beneficial for readers because they can learn a lot from this
research. They can study about what is the meaning of brand loyalty, brand
awareness, and brand association and how to analyze a product based on its brand.
Moreover, they can also read the result of this research and take a conclusion
about this study.

10
CHAPTER II
LITERATURE REVIEW
2.1. Theoretical Review
2.1.1. Marketing
There are many successful companies compete with each other to become the
best. In order to success, those companies heavily focus on one same thing, which
is marketing. Marketing is a front action to gain customers. To be profitable
companies, they must make people purchase their product or service, become
their customers. The heart of business success lies in its marketing. Without
marketing, companies can offer their best product or service, but no potential
customers will know, realize, or buy what the companies produce. Therefore,
marketing is very important and all businesses or companies need to do marketing
activities.
Some experts have their own definition of marketing. These are several definition
of marketing based on them:
According to Dr. Philip Kotler (2012):
“Marketing is the science and art of exploring, creating, and delivering
value to satisfy the needs of a target market at a profit. Marketing identifies
unfulfilled needs and desires. It defines, measures, and quantifies the size of the
identified market and the profit potential. It pinpoints which segments the
company is capable of serving best and it designs and promotes the appropriate
products and services”.
According to Keller (2012):
“Marketing is about identifying and meeting human and social needs, one
of the shortest good definitions of marketing is meeting needs profitably”.

11
According to the American Marketing Association (July 2013):
“Marketing is the activity, set of institutions, and processes for creating,
communicating, delivering, and exchanging offerings that have value for
customers, clients, partners, and society at large”.
According to the Chartered Institute of Marketing (2009):
“Marketing is the management process responsible for identifying,
anticipating and satisfying customer requirements profitably. In essence, the
marketing function is the study of market forces and factors and the development
of a company’s position to optimize its benefit from them.”
Based on these definitions above, the researcher can conclude that marketing is an
activity of delivering value to customers by fulfilling their needs or wants and
satisfy customers. By doing that, the company can get another value in exchange,
which is profit. People decide to buy a product or service because they realize that
they need it or they want it, and it creates a demand. Kotler & Armstrong (2012)
defines them as: “Needs is states of felt deprivation which includes basic physical
needs for food, clothing, warmth, and safety; social needs for belonging and
affection; and individual needs for knowledge and self-expression. In the other
hand, wants are the form of human needs take as they are shaped by culture and
individual personality. Wants also shaped by one’s society and are described in
terms of objects that will satisfy needs. Moreover, demands is wants for specific
products that are backed by an ability and willingness to buy them. Wants become
demand when supported by purchasing power.”
Generally, marketing is a heart of a business. Marketing is an activity with aim to
fulfill customers’ needs and wants, thus create demand for a company and the
company gain profit by serving them. By understanding customers’ needs and
wants, a company can serve them by giving value to customers, create good
relationship with customers in whom it is very beneficial for the company, and
satisfy them. In the end, the company will get profit from customers and it is the
value for the company.

12
2.1.2. Brand
High competition in market today makes people as customers are overwhelmed
with so many brands that are offered to them. As of example, if people want to
buy soft drink, there are many choices of soft drink brand: Coca-cola, Pepsi,
Fanta, Sprite, Mirinda, F&N, etc. With so many choices of brand when customers
want to buy a specific product, many of them will choose the most familiar brand
or the brand which has positive contribute for them. This shows that branding is
very important. Although branding doesn’t directly contribute to profit (unlike
sales), branding is very important to maintain the company for long term period.
According to the American Marketing Association, a brand is a “name, term, sign,
symbol, or design, or a combination of them intended to identify the goods and
services of one seller or group of sellers and to differentiate them from those of
competition.” The key to creating a brand is to choose product attributes that
identify the product and differentiate it from other products. Brand elements are
different components of a brand which identify and differentiate it. Brand
elements include: logo, symbol, name, design of the package, and other attributes
related to the brand (Kotler et al., 2009).
Based on Indonesian regulation (UU Merek No.15 Pasal 1 Ayat 1), a brand is a
sign in the form of image, name, word, letter, figure, colors arrangement, or
combination of these elements that have differentiation and are used in trading
goods or services.
“Merek adalah tanda yang berupa gambar, nama, kata, huruf-huruf, angka-
angka, susunan warna, atau kombinasi dari unsur-unsur tersebut yang memiliki
daya pembeda dan digunakan dalam kegiatan perdagangan barang atau jasa.”
(Soekarnoputri, 2001).
Based on Freddy Rangkuti (2004), good characteristics in a brand are:
1. A brand name must indicate the benefit and quality of the product.
2. A brand name must be easy to say, recognize, and remember.
3. A brand name must be specific, so it’s easy to differentiate.
13
4. A brand name must be registered legally.
A brand is a complex symbol and it can convey up to 6 levels of meanings (Kotler
et al., 2011), such as:
1. Attributes:
A brand obviously brings number of attributes into a mind. For example:
in automotive industry, Mercedes Benz brings to mind attributes like
expensive, well-built, high prestige, durable, and fast. Thus, the marketer
can advertise the car by using one or more of these attributes. This is the
base for the company to position itself and to project another attribute.
2. Benefits:
People don’t buy attributes, they buy benefits. Based on Hyman, Kopf,
and Lee (2010), marketers often translate product attributes into buying
benefits. Attributes are translated into functional and emotional benefits.
For example: one of Mercedes Benz attributes is high prestige. This
attribute may translate into emotional benefit “the car helps me to feel very
admired and important.”
3. Values:
A brand convey to marketers or producer’s values , hence in the entire
marketing process, the view of the brand serves as instrument for
attracting buyers that identify with marketers’ values. For example: the
brand Mercedes Benz can be viewed as fast, high performance, and
prestige. Therefore, marketers can attract group of people who search for
these values in a car.
4. Culture:
A brand represents a specific culture. Mercedes Benz is a brand that
represents German culture: efficient and organized.

14
5. Personality:
A brand can project a personality. For example: the oldest manufacturer of
knitting and craft yarn in United States is “Lion Brand Yarn” with logo a
picture of lion. It represents strong personality (a yarn which is strong and
not easily broken).
6. User:
A brand shows type of customer who buy and use the product. For
example: Mercedes Benz is associated with rich and high class people.
Brand is very important and valuable to marketers. The benefit of brand for the
company (as seller) and customers are:
For the company/manufacturer/seller (Kotler et al, 2011):
1. A brand makes it easy for seller to process the delivery order and track
problems.
2. A brand name or brand mark provides legal protection and unique
characteristic that is different with other products.
3. A brand gives opportunity for seller to attract loyal customers. Loyalty of
a specific brand gives benefit for the company.
4. A brand helps the company to make market segmentation.
5. A strong brand helps create corporate image, make it easier for company
to launch a new brand that is acceptable by both distributors and
customers.
For customers:
1. Easier in identifying needed or wanted product.
2. Time and energy saving through repeat purchase and loyalty to a specific
brand.
3. Give guarantee for consumers that they can get same product with same
quality although they buy it in different places.

15
4. Satisfaction is created through familiarity and intimacy with specific brand
that has been consumed before.
5. Satisfaction is related to the brand logo and how the company
communicates it.
The other reason of importance of brands is it can reduce the risk in product
decision making. There are several risks in product decision, such as:
1. Functional risk: the product doesn’t perform like user’s expectations.
2. Physical risk: the product poses threat to the physical healthiness of the
user.
3. Financial risk: the product is not worth compared to the price the user
must pay.
4. Social risk: the product results in embarrassment from others.
5. Psychological risk: the product affects user’s mentality.
6. Time risk: the product failure results in an opportunity cost of finding
another satisfactory product.
To avoid or minimize the risk, consumers prefer buy products with well-known
brands or brands in which the consumers have good past experience about them
(Keller, 2012). In the end, brand is a valuable asset for a company for a long run.
2.1.3. Brand Equity
Brand equity is a phrase used in marketing industry that describes the value of
having a well-known brand name. Brand equity is very important to be considered
by companies because by having good and clear brand equity, companies know
what to do, what to create in their product and advertisement to attract target
customers. These are several meanings of brand equity by experts, such as:
According to Josh McQueen:
“Brand equity is the difference between the value of the brand to the
consumer and the value of the product without that branding. It is the differential
effect that brand knowledge has on consumer response to the marketing of that

16
brand. A brand with positive brand equity results in consumers less sensitive to
increase of the price, being more accepting the extension of a new brand, and
willing to seek the brand in another distribution channel. On the other hand,
negative brand equity results consumers react less favorably to marketing activity
of the brand.”
According to Aaker:
“Brand equity is a set of asset and liabilities linked to a brand’s name and
symbol that adds to the value provided by a product or service to a firm or firm’s
customers.”
According to Yoo and Donthu:
“Brand equity is consumer’s different response between a focal brand and
an unbranded product when both have the same level of the marketing stimuli and
product attributes.”
Some studies of brand equity based on marketing experts (Taleghani, 2011) can
be seen in the table below:
Table 2.1 Brand Equity Studies
Author Dimensions of Brand
Equity
Related Findings
Keller (1993) Brand awareness, brand
image
Customer-based brand
equity occurs when
consumer is familiar with
the brand and hold strong
and unique brand
association in their
memory.
Cobb-Walgren, Ruble, Perceived quality, brand Brand with greater

17
and Donthu (1995) awareness, brand
associations, advertising
awareness
advertising budget
yielded substantially
higher level of brand
equity. In turn, brand with
higher equity generated
greater preference and
purchase intentions.
Aaker (1996) Brand loyalty, perceived
quality, brand awareness,
brand association
Four dimensions of brand
equity represent customer
perception and can be
applied across markets.
Berry (2000) Brand awareness, brand
meaning
Positive service brand
equity emerges from the
synergy of brand
awareness and brand
meaning.
Source: Adjusted by Researcher (2014)
Based on those definitions above, brand equity is a valuable asset for company
that has specific stimuli to customers. Aaker divide brand equity into 5 aspects.
Aaker’s brand equity model is:

18
Figure 2.1 Brand Equity Aspects
Source: Strategic Management: Building, Measuring, and Managing Brand Equity (2008)
2.1.3.1. Brand Loyalty
Brand loyalty is the extent of faithfulness of consumers to a particular brand. It is
usually expressed through repeat purchases of a specific brand, instead of trying
another brand. The meaning of brand loyalty by some experts, such as:
According to American Marketing Association:
“Brand loyalty is the situation in which a consumer generally buys the
same manufacturer-originated product or service repeatedly over time rather
than buying from multiple suppliers within the category; or the degree to which a
consumer consistently purchases the same brand within a product class.”

19
According to Aaker:
“Brand loyalty reflects how likely a customer will be to switch to another
brand, especially when that brand makes a change in price, product features,
communication, or distribution programs.”
Brand loyalty represents the core of brand equity. However, brand loyalty can’t be
analyzed without considering its relationship to other dimensions of brand equity
like brand awareness, brand association, perceived quality, and other proprietary
asset.
Generally, brand loyalty is consumers’ preference when they buy a particular
brand in a product category. Loyalty occurs because consumers perceive that the
brand is good, offers features that they want, quality with price at the right time.
This perception will become foundation for a new buying behavior. Basically,
consumers will make trial purchase of a specific product brand and until they feel
satisfied with a specific brand, they tend to form habits and continue buying the
same brand.
David Aaker defines brand loyalty into 5 levels, ranging from not loyal to very
loyal. The Aaker’s brand loyalty pyramid is:
Figure 2.2 Brand Loyalty Level Pyramid
Source: Strategic Management: Building, Measuring, and Managing Brand Equity (2008)

20
1. Switchers:
Switchers are people who aren’t loyal to specific brands and are
completely indifferent to brands. Each brand is perceived to be adequate if
the price is acceptable for them. They tend to buy a brand in sale or they
happen to stumble upon. As marketers, the most effective to target these
consumers by focusing on raise name awareness because it is possible that
these consumers will move up the pyramid.
2. Habitual buyer:
On this level, consumers buy a brand out of habit. They are reasonably
satisfied with the brand, at least they aren’t felt dissatisfied about the
brand. However, if they find better product with another brand or they find
it hard to buy they usual brand, they will be likely to switch to another
brand.
3. Satisfied buyer:
Those are buyers who satisfied with a specific brand due to switching cost
(loss of time, money, or other advantage if they switch brand). In order to
make these buyers to switch brand, competitors must create incentive and
offer larger benefit that can cover the switching cost.
4. Likes the brand:
Consumers on this level are satisfied with the brand. They don’t only
satisfied because of rational benefits (price, time, quality) only, but also
because of emotional benefits (have emotional attachment to the brand
because of good experience with the brand). The consumers can also be
called true brand enthusiasts.
5. Committed buyer:
Committed buyers are consumers who are proud of having or using the
brand because it gives them both emotional benefit and functional benefit.
It also represents their personality as well. Committed buyers also
recommend the brand to other people.

21
In David Aaker’s Brand Equity Model, people who are loyal to a brand are
expressed in the following factors (Eurib, 2009), such as:
1. Reduced marketing costs: hanging on loyal customers is cheaper than
potential new customers.
2. Trade leverage: loyal customers represent a stable source of revenue for
the distributive trade.
3. Attracting new customers: current loyal customers can boost name
awareness and bring new customers.
4. Time to respond to competitive threats: loyal customers aren’t quick in
switching brands, so it gives company more time to respond the
competition.
Based on Giddens (2010), brand loyalists have following mindset:
1. “I am committed to this brand.”
2. “I am willing to pay a higher price for this brand over other brands.”
3. “I will recommend this brand to others.”
This shows that people who are brand loyalist are very valuable for companies
because they are willing to pay higher price and also committed to the brand.
They also will recommend the brand to other people which means the company
can get more customers and gain higher profit.
2.1.3.2. Brand Awareness
The other aspect of brand equity is brand awareness. Awareness is a key
determinant identified in almost all brand equity models. Some definitions of
brand awareness by some experts are (Fayrene et al., 2009):
According to Keller:
“Awareness is the customers’ ability to recall and recognize the brand as
reflected by their ability to identify the brand under different conditions and to
link the brand name, logo, symbol, and so forth to certain associations in memory.

22
Brand awareness is related to the strength of the brand node or trace in memory,
as reflected by consumers’ ability to identify the brand under different
conditions.”
According to Aaker:
“Brand awareness is the extent to which a brand is known among the
public.”
According to Rangkuti (Rangkuti, 2004):
“Brand awareness is the ability for customers to remember a particular
brand or advertising spontaneously or after they are stimulated with key words
related to the brand.”
According to Temporal (2010):
“An enormous amount of brand awareness can get the consumers
interested.”
Brand awareness is the ability of customers to recognize, recall, or identify a
specific brand. If customers are aware with particular brand, they can easily
remember the brand or whenever they see or hear things that related to the brand,
they can easily recognize the brand.
Keller defines brand awareness as customers’ ability to recall and recognize a
specific brand (Djakeli et al., 2011):
“Brand recognition is the ability of consumer to recognize prior
knowledge of brand when they are asked questions about that brand or when they
are shown that specific brand; the consumers can clearly differentiate the brand
as having being earlier noticed or heard.”
“Brand recall is the potential of customer to recover a brand from his
memory when given the product class/category, needs satisfied by that category
or buying scenario as a signal. In other words, it refers that consumers should

23
correctly recover brand from the memory when given a clue or he can recall the
specific brand when the product category is mentioned.”
Brand awareness can play an important role in consumer decision making, such
as:
1. By affecting inclusion in consideration set.
2. By affecting likelihood of choice in low involvement settings (due to lack
consumer motivation and ability).
3. By affecting creation of brand associations and brand image.
However, Aaker identifies higher level of awareness beside recognition and recall
(Shimp, 2010). The level of awareness is:
Figure 2.3 Brand Awareness Level Pyramid
Source: Advertising Promotion and Other Aspects of Integrated Marketing Communications
1. Unaware of brand: brand awareness is not existed in this level.
2. Brand recognition: it is an aided brand recall. Brand recognition is crucial
to the point of purchase decision.

24
3. Brand recall: it is when customers are asked to list the brand in a certain
product category.
4. Top of mind: the highest level of brand awareness in which customers
name the one most salient brand in a product category.
Brand awareness is the extent to which a brand is known among the public and it
is expressed with following factors (Eurib, 2009):
1. Anchor to which associations can be attached.
2. Familiarity and liking: consumers with positive attitude towards a brand
will talk about it more and spread brand awareness.
3. Commitment of the brand.
4. Brand to be considered during purchasing process.
Brand awareness can be created into the mind of people by focusing on several
things (Durianto et al., 2004), such as:
1. The message should be unique, different, and easily memorable. The
message can also use jingle or slogan to be easily remembered by people.
2. Repetition of the message to create reminders in the mind of people.
3. Extend the brand, so people will remember more brands.
4. Increase the promotion of the brand.
5. Become a sponsor of an event that brings many people (viewers).
2.1.3.3. Brand Association
Brand association is the thoughts that are linked to the brand in the consumer
memory. A set of associations may represent the underlying value of the brand.
Based on some experts, brand association is:
According to Rangkuti (2004):
“Brand association is everything that is related to memory about a brand.
This association is an attribute that is available in that brand itself and it has a
level of strength. Linkage to the brand will be higher if the customers have many

25
experiences with the brand. Various associations that are remembered by people
can be assembled to form an impression of brand image.”
According to Durianto (2004):
“Brand association is all impression that comes to mind related with their
memory about a brand. A strong brand will get prominent position in competition
if it is supported by many strong associations. Various brand association that is
integrated, the stronger the brand image that is owned by the brand.”
In short, brand association is associations triggered by a brand that has several
functions (Eurib, 2009), such as:
1. Help process or retrieve information: the extent to which a brand name is
able to ‘retrieve’ associations from consumers’ brain (example:
information from TV advertising).
2. Differentiation: association contributes to brand differentiation among
competitors.
3. Buying process: brand association plays a role in buying process (the
greater this extent, the higher the total brand equity).
4. Create positive attitude/feeling: brand association can create positive
attitude/feeling that is felt by customers. Past experience about the brand
can create positive attitude, which later create good association between
the customer and that brand.
5. Basis for extensions: the greater the number of brand extension in the
market, the greater the opportunity to add brand association.
Based on Aaker, there are several attributes of brand association (Durianto, 2004),
such as:
1. Perceived value:
One of brand identity role is to create value proposition that is related to
functional benefit which is the basic of brand in almost every product
class. If a brand doesn’t have value, it will be easy to be beaten by

26
competitors. Brand value can be measured by proofing that the value is
worth with how much the consumers pay for the product. There are 5
boosters that create perceived value which is related to customer
satisfaction, such as:
a. Product quality dimension: Product quality is the first customer
satisfaction.
b. Price dimension: For price sensitive consumers, they feel satisfied
if they buy product which is value for money.
c. Service quality dimension: Human factor gives the biggest
contribution in service quality. Thus, service quality is relatively
harder to be measured compared to product quality.
d. Emotional dimension: It contains aesthetic, brand personality, and
self expressive value.
e. Easiness dimension: Customers will feel more satisfied if they can
use the product easily, comfortably, and efficiently.
2. Brand personality:
Personality relates the emotional bond of a brand with the benefit of the
brand itself as the basis for brand differentiation and customer
relationship.
3. Organization association:
Organization association will be an important factor if the brand is similar
with other brand attributes, or if corporate brand is involved in the
organization.
2.1.3.4. Perceived Quality
Customers always have their own perception about the quality of a specific brand.
Based on some experts, there are definitions of perceived quality:

27
According to Keller (2008):
“Perceived quality is customers’ perception of the overall quality or
superiority of a product or service compared to alternatives and with respect to
its intended purpose.”
According to Aaker:
“Perceived quality is the consumers’ perception about the entire quality
about a product or service that is same with what they expect it to be. It is defined
as consumers’ judgment about a product’s overall excellence or superiority.”
Perceived quality create several values, such as (Eurib, 2009):
1. Reason to buy:
The quality offered by the product or brand is a reason to buy it.
Information, money, and time limitation make ones purchasing decision is
highly related to their perception of the brand quality in their mind, so the
purchasing decision only based on perceived quality of a brand that they
are going to buy.
2. Differentiation or position:
The other value is level of differentiation or position in relation to
competing brands, whether the brand is highly optimum, valuable, or
economical; whether the brand is the best in its segment or just relatively
competitive compared to other brands.
3. A price premium:
As the product becomes more complex to assess and status is at play,
consumers tend to take price as a quality indicator. One of the advantages
of quality perception is it gives more room to decide premium price.
Premium price will increase the profit and people see that as high quality
product or brand.

28
4. Channel member interest:
Distributors will be motivated to distribute a brand with high perceived
quality. It will give them more profit compared to a brand with lower
perceived quality.
5. Brand extensions:
A product with strong perceived quality can be used to introduce a new
product category (brand extension) because the successful chance will be
higher rather than a brand with lower perceived quality. This can tell
consumers the brand stands for a certain quality guarantee that is
applicable on a wide scale.
2.1.3.5. Other Proprietary Asset
Basically, a brand is an asset. Examples of other proprietary asset here are patents,
intellectual property rights, and relations with trade partners. The more proprietary
rights a brand has accumulated, the greater the brand’s competitive edge in those
fields (Eurib, 2009).
2.1.4. Consumer Buying Behavior
Realize it or not, people as customers create a specific behavior when they buy
product or service, they have pattern when they buy a product or service.
According to Kotler and Armstrong (2012), consumer buying behavior is the
buying behavior of final consumers – individuals and households that buy goods
or services for personal consumption. Moreover, consumer behavior is centralized
to how individuals make decision to utilize their own available resources (time,
money, effort) to buy a product or service to be consumed by them (Shiffman et
al., 2009)
Consumer behavior is affected by several factors including attitude toward a
certain product, service, or brand. Consumers evaluate products based on their
important features. Furthermore, products presented by competitors under other

29
brands are different in terms of these features. This creates different attitudes
toward different brands in consumers. It is quite critical to have knowledge over
individual attitudes in order to predict or direct consumer behavior in markets.
Finally, in some stage following buying a product, customer starts evaluating
goods and their efficiencies based on his/her expectations. A satisfied customer
will send a positive feedback on product/service and recommend it to friends or
family members. Satisfied customers will buy other products/services from the
same company in an ongoing trend and may even pay extra amounts to obtain
their preferred products (Namin et al., 2012).
There are several factors that influence consumer behavior (Kotler et al., 2010):
Figure 2.4 Factors Influence Consumer Behavior
Source: Principle of Marketing (2010)
1. Cultural:
a. Culture is the learned values, perceptions, wants, and behavior
from family and other important institutions.
b. Subcultures are groups of people within a culture with shared value
systems based on common life experiences and situations.
c. Social classes are society’s relatively permanent and ordered
divisions whose members share similar values, interests, and
behaviors and are measured by a combination of occupation,
income, education, wealth, and other variables.

30
2. Social:
a. Reference groups are groups that form a comparison or reference
in forming attitudes or behavior.
b. Family is the most important consumer-buying organization in
society.
c. The groups, family, clubs, and organizations that a person belongs
to define his/her social role and status.
3. Personal:
a. Age and life-cycle stage: People buy different goods or services in
their lifetime. Their needs and wants about specific good or service
related to their age. What their need or want will be different when
they still kids and when they are adults.
b. Occupation and economic situation affect the goods and services
bought by consumers: personal income that can be expended,
savings, and their behavior about expend the money or debt.
c. Lifestyle is a person’s pattern of living as expressed in his or her
psychographics, pattern of acting and interacting in the
environment.
d. Personality and self-concept refer to the unique psychological
characteristics that lead to consistent and lasting responses to the
consumer’s environment.
4. Psychological:
a. A motive is a need that is sufficiently pressing to direct the person
to seek satisfaction.
Maeslow’s hierarchy of needs shows 5 levels of human needs:

31
Figure 2.5 Maeslow’s Hierarchy of Needs
Source: Principle of Marketing (2010)
b. Perception is the process by which people select, organize, and
interpret information to form a meaningful picture of the world
from three perceptual processes:
1) Selective attention is the tendency for people to screen out
most of the information to which they are exposed.
2) Selective distortion is the tendency for people to interpret
information in a way that will support what they already
believe.
3) Selective retention is the tendency to remember good points
made about a brand they favor and forget good points about
competing brands.
c. Learning is the change in an individual’s behavior arising from
experience.
d. Belief is a descriptive thought that a person has about something
based on knowledge, opinion, and faith. Attitudes describe a

32
person’s relatively consistent evaluations, feelings, and tendencies
toward an object or idea.
In consumer buying decision, there are 5 steps that consumers go through (Kotler
et al., 2012). Marketers need to focus on entire process rather than purchase
decision only. The consumer buying decision steps are:
Figure 2.6 Consumer Buying Decision Steps
Source: Marketing Management (Kotler et al., 2009)
1. Need recognition:
The first step of buyer decision process that occurs when buyer recognizes
a problem or need triggered by internal stimuli (human basic need,
example: hunger or thirst) or external stimuli (example: a person talk
about cars with his friend and it might get him thinking on buying a new
car).
2. Information search:
An interested consumer may or may not search for information before they
buy a product or service. If consumer’s drive is strong and satisfying
product is near at hand, he is likely to buy it then. If not, he will search for
information first related to the need. For example: a person who wants to
buy a car will search information about type of cars, price, and other
information that he needs; pay more attention to car ads; come to car
exhibition, etc.
A consumer can get information from several sources like:
a. Personal sources: family and friends.
b. Commercial sources: advertising, internet.

33
c. Public sources: mass media, consumer organizations.
d. Experiential sources: handling, examining, using the product.
3. Evaluation of alternatives:
How the consumer uses and processes information to evaluate alternative
brands in the choice set.
4. Purchase decision:
The act by the consumer to buy the most preferred brand. The purchase
decision can be affected by attitudes of others (example: if someone
closest to a person advice that he should buy low price car, he most
probably will buy that car) or an unexpected situational factors (for
example: a person already know what car he wants to buy based on his
actual budget, but suddenly another car brand has a great discount and he
probably think again of what brand he should buy).
5. Post-purchase behavior:
The stage which consumers take further action after purchase based on
their satisfaction or dissatisfaction that the consumers fell with a purchase.
In post-purchase behavior, there is a relationship between consumer’s
expectation and product’s perceived performance. The larger the gap
between expectation and performance, the greater the consumer’s
dissatisfaction is. Moreover, customer satisfaction is very important for
companies because it is a key to building profitable relationships with
consumers, to keeping and growing consumers, and reaping their customer
lifetime value.
In the end, understanding consumer buying decision is very important because by
knowing what steps that consumers go through and analyzing what are their
behaviors, companies can create things that are needed to stimulate them to buy
the product or service.

34
2.2. Previous Research
There are several researches about the correlation and influence of brand equity
aspects to consumer buying decision, such as:
Table 2.2 Brand Equity Past Research
No Author Year Source Construct Findings
1. Darma
Kusuma
Moh. Zen
2012 Analysis
influence of
brand equity to
consumer
buying
decision of
isotonic drink
Pocari Sweat
Brand
awareness,
brand
association,
perceived
quality,
consumer
buying
decision
All aspects of
brand equity
(brand awareness,
brand association,
and perceived
quality) have
influence
significantly to
buying decision
of Pocari Sweat.
2. Yusuf
Kurniawan
2010 Analysis
influence of
brand equity to
buying
decision: case
study of
isotonic drink
Fatigon Hydro
in Purwokerto
Brand
loyalty,
brand
awareness,
perceived
quality,
brand
association,
consumer
buying
decision
All aspects of
brand equity have
significant
influence to
consumer buying
decision of
Fatigon Hydro
product.

35
No Author Year Source Construct Findings
3. Silvia Ika
Cahyani
2012 Effect of brand
equity to
customer
buying
decision of
isotonic drink
Pocari Sweat
in Surabaya
Brand
equity,
consumer
buying
decision
Brand equity has
positive impact to
consumer buying
decision of Pocari
Sweat isotonic
drink in Surabaya.
4. Hamza Salim
Khraim
2011 International
Journal of
Marketing
Studies (Vol.3,
Issue 2)
Brand
Loyalty,
Consumer
Buying
Behavior
Brand loyalty has
a significant
correlation in
consumer buying
decision, but it’s
not easy to
maintain
consumer loyalty
of a specific
product because
many forces
drawing them
away (high
competition).
5. Elif Akagün
Ergin,
Handan
Özdemir,
Bülent
Özsaçmacı
2006 International
Business &
Economics
Research
Journal (Vol.5,
No.8)
Brand
association
There is a
correlation
between brand
association and
decision buying
process.
Consumers who
mostly develop

36
successful brand
association, have
significant place
for brands in
memory.
Source: Adjusted by Researcher (2014)
2.3. Theoretical Framework
The theoretical framework for this research is as below:
Figure 2.7 Theoretical Framework
Source: Adapted from Wahyu (2012)
2.4. Hypotheses
The hypotheses for this research are:
H01: There is influence of brand loyalty toward consumer buying decision.
H02: There is influence of brand awareness toward consumer buying decision.
H03: There is influence of brand association toward consumer buying decision.
H04: There is influence of brand loyalty, brand awareness, and brand association
toward consumer buying decision.
Brand Loyalty (X1)
Brand Awareness (X2) Consumer
Buying
Decision (Y) Brand Association (X3)
H01
H02
H03
H04

37
CHAPTER III
METHODOLOGY
This chapter analyzes the research methodology that is used in this research which
involves several objectives, such as: research design, population and sampling
design, data analysis tools, questionnaire, validation and reliability process, and
data preparation.
3.1. Research Method
In making a research, there are two methods that differentiate one with another.
Those methods are quantitative method and qualitative method. Those methods
have their own characteristic that differentiates between one another. Each method
also has its own strength and weakness.
Quantitative method focuses on numbers or quantities. Quantitative studies have
results that are based on numerical analysis and statistic. It is ideal to have large
number of participant for this study because this gives analysis more statistical
power. Based on Render, Stair, JR, and Mich. Hanna (2008), quantitative analysis
is the scientific approach to managerial decision making. Whim, emotions, and
guesswork are not part of the quantitative analysis approach.
In the other hand, qualitative research studies focuses on differences in quality,
rather than in quantity. Results are in words or pictures rather than numbers. It
usually has fewer participants than quantitative studies because the depth of the
data collection doesn’t allow for large number of participants. According to
Denzin and Lincoln (2011), qualitative research involves an interpretive and
naturalistic approach, which means that qualitative research study things in their
natural settings, attempting to make sense of or to interpret phenomena in terms of
the meanings people bring to them.
38
A particular strength of quantitative research is that statistical analysis allows for
generalization to others. A goal of quantitative research is to choose a sample that
closely resembles the population. Qualitative research does not seek to choose
samples that are representative of populations.
However, qualitative data does provide a depth and richness of data not possible
with quantitative data. Although there are fewer participants, the researchers
generally know more details about each participant. Quantitative researchers
collect data on more participants, so it is not possible to have the depth and
breadth of knowledge about each. On this research, researcher uses quantitative
method to conduct this study.
3.2. Research Design
Research design is a framework or blueprint for conducting the marketing
research project. It specifies the details of the procedures necessary for obtaining
the information needed to structure and solve marketing research problems
(Malhotra, 2010).
Descriptive research design is a scientific method which involves observing and
describing the behavior of a subject without influencing it in any way. It is used to
obtain information concerning the current status of the phenomena to describe
“what exists” with respects to variables or conditions in a situation. The method
involves range from the survey which describes the status quo, the correlation
study which investigates the relationship between variables, to developmental
studies which seek to determine changes over time. Descriptive research is a type
of conclusive research that has as its major objective the description of something,
usually market characteristics or functions (Malhotra, 2010). In short, descriptive
research design is research design in which the major emphasis is on determining
the frequency with which something occurs or the extent to which two variables
covary.

39
Cross-sectional design is a type of research design involving the collection of
information from any given sample of population elements only once (Malhotra,
2010). On this research, researcher uses descriptive research design with cross-
sectional design as time horizon.
3.3. Research Instrument
3.3.1. Data Collection
On this research, researcher uses two sources to gain information, which are
primary data and secondary data. Primary data is main data that researcher needs
to conduct the study. Researcher gains the data by doing survey and distributing
questionnaires to third parties. On the other hand, secondary data is the data that
have been already collected by and readily available from other sources which are
cheaper and easier to be obtained. Moreover, according to Maholtra, secondary
data is data collected for some purpose other than the problem at hand. The major
advantages of using secondary data in market research are time and cost savings.
1. Primary Data:
Researcher gains primary data by doing a survey to sample of population.
Researcher makes a questionnaire that consist questions about studied
topic and distributes them to third parties that are qualified and fulfill the
requirement that the researcher set to conduct this study.
The questionnaires that the researcher spread to the participant consist of
two parts, such as:
a. Demography: This is about the profile of respondent. The purpose
is for researcher to know the demographic profile of the sample.
For this study, the first part of the questionnaire consists of gender
(male and female).

40
b. Second part is about statements that represent brand loyalty, brand
awareness, brand association, and consumer buying decision. The
questionnaires are made online, and then distributed to qualified
respondents which are President University students. On the
second part of the questionnaire, it contains 22 questions under 4
variables (brand loyalty, brand awareness, brand association, and
consumer buying decision).
2. Secondary Data:
Researcher also gains secondary data through several sources or media,
such as: internet, journals, e-journal, and books that are related to this
study.
3.3.2. Data Collection Technique
In order to gain data needed to do the research, researcher uses some methods or
techniques to get the data, such as:
1. Survey (questionnaire):
Survey method is a structured questionnaire given to a sample of a
population and designed to elicit specific information from
respondents. In structured data collection, a formal questionnaire is
prepared that presents questions in a prearranged order (Malhotra,
2010). Questionnaire itself is a set of questions given to a sample of
people. The purpose is to gather information about the people’s
attitudes, thoughts, behaviors, and so forth. It is one of the most
common and popular tools to gather data from a large number of
people (Lanthier, 2002). The researcher will use a survey method in
structured questionnaire in order to get more information for the
research purpose.

41
2. Library Research:
Library research is one of the quickest and least costly ways to
discover hypotheses. Library research is a study in which the
researcher searches, analyzes, makes interpretation, and generalizes
fact that is got from textbooks, journals, or magazine. Furthermore,
researcher also searches data from the internet to support the fact.
3.3.3. Measurement Scale and Data Analysis
3.3.3.1. Measurement Scale
Itemized rating scale is a measurement scale having numbers or brief descriptions
associated with each category, in which the categories are ordered in terms of
scale position and the respondents are required to select the specified category that
best describes the object being rated. Measurement scale that researcher uses is
Likert Scale. Likert Scale is an ordered, one-dimensional scale from which
respondents choose one option that best aligns with their view that is developed
by Rensis Likert. The data from Likert scale are primarily interval. Interval scale
is a scale in which the numbers are used to rate objects such that numerically
equal distances on the scale represent equal distances in the characteristic being
measured. Likert scale is also and possesses scale characteristic, such as:
1. Description: the unique labels or descriptors that are used to designate
each value of the scale.
2. Order: the relative sizes or positions of the descriptors.
3. Distance: the characteristic in which absolute differences between scale
descriptors are known and may be expressed in units (Malhotra, 2010).
In this research, data is interpreted using five-Likert Scale. Based on Sugiyono
(2009) the relative grading system for each dimension is:

42
Table 3.1 Likert Scale
Statement Score
Strongly Agree 5
Agree 4
Neither Agree Nor Disagree (Neutral) 3
Disagree 2
Strongly Disagree 1
Source: Metode Penelitian Bisnis (Sugiyono, 2009)
3.3.3.2. Data Analysis
To do this analysis, SPSS 16.0 (Statistical Package for Social Science version 16)
for Windows is used. SPSS 16.0 is used by the researcher to process the raw data
from the questionnaires and to find out whether the data is valid or not (validity
and reliability test), and also to find out the result by processing multiple
regression.
3.4. Validity and Reliability
3.4.1. Validity Test
Validity is the extent to which differences in observed scale scores reflect true
differences among objects on the characteristic being measured, rather than
systematic or random errors (Malhotra, 2010). The validity test helps the
researcher to ensure that the questions in the questionnaire are valid and able to be
measured. The purpose is to test how well the instrument measures particular
concept that would like to be measured (Sekaran, 2003).
To test the validity, the researcher uses Pearson Product Moment correlation
formula as below:

43
Source: Berenson, Levine, Timothy (2011)
Where:
n = the number of paired observations
Σ X = the X variable summed
Σ Y = the Y variable summed
Σ X2 = the X variable squared and the squares summed
(Σ X) 2 = the X variable summed and the sum squared
Σ Y2 = the Y variable squared and the squared summed
(Σ Y) 2 = the Y variable summed and the sum squared
Σ XY = the sum of the product of X and Y
Minimum standard in order to fulfill validity test is if r = 0.3, in which if r < 0.3 it
is considered invalid. The researcher uses 0.05 for significance level in this
validity test.
3.4.2. Reliability Test
Reliability is the extent to which a scale produces consistent results if repeated
measurements are made on the characteristic (Malhotra, 2010). Reliability is
index numbers that show the consistency of a measuring device to measure the
same indication. Each measuring device should have the ability to produce
consistent measurement result.
The researcher uses Cronbach’s alpha measurement to test the reliability.
Cronbach’s alpha (coefficient alpha) is a measure of internal consistency
reliability that is the average of all possible split-half coefficients resulting from
different splitting of the scale items. This coefficient varies from 0 to 1, and a
value of 0.6 or less generally indicates unsatisfactory internal consistency

44
reliability (Malhotra, 2010). Therefore, it is considered reliable if Cronbach’s
alpha exceeds 0.6.
3.5. Sampling Design
3.5.1. Sampling Technique
Population is about people, and the dwellings, locations and environment that
people live in which can be defined in many ways, for example: by age, ethnicity,
or location. Based on Joan Joseph Castillo (2009), a research population is
generally a large collection of individuals or objects that is the main focus of a
scientific query and it is for the benefit of the population that researches are done.
Sample is a subgroup of the elements of the population selected for participation
in the study (Malhotra, 2010). Sampling is the process of selecting unit (e.g:
people, organization) from a population of interest so that by studying the sample
we may fairly generalize our results back to the population from which they were
chosen. Based on Martyn Shuttleworth (2009), the advantages of sampling are:
1. It involves a smaller amount of subjects, which reduces investment in time
and money.
2. Sampling can actually be more accurate than studying an entire
population, because it affords researchers a lot more control over the
subjects. Large studies can bury interesting correlations amongst the
‘noise.'
3. Statistical manipulations are much easier with smaller data sets, and it is
easier to avoid human error when inputting and analyzing the data.
Non-probability sampling represents a group of sampling technique that helps
researchers to select unit from a population that they are interested in studying. It
relies on the personal judgment of the researcher rather than chance to select
sample elements. Subjects in a non-probability sample are usually selected on the
basis of their accessibility or by the purposive personal judgment of the

45
researcher. In non-probability sampling, there is an assumption that there is an
even distribution of characteristics within the population.
Convenience sampling is a non-probability sampling technique where subjects are
selected because of their convenient accessibility and proximity to the researcher.
The subjects are selected just because they are easiest to recruit for the study in
the area. Researcher uses convenience non-probability sampling to get sample for
the research.
3.5.2. Sampling Size
Sample is parts of total and characteristic that is owned by population. In short,
sample represents population. To know how many sample that is needed for
researcher to gain data, researcher uses formula by Ariestonandri:
Where:
n = total sample
p = estimated population proportion (if it’s unknown, p = 0.5)
q = (1-p)
Za = confidence interval
e = error sampling
Confidence interval that researcher uses is 95% or α = 0.05, so Za = 1.96 and
estimation of error is 5%. Therefore, the sample size is:

46
n ≥ 0.5 x 0.5 (1.96 / 0.1)2
n ≥ 96.04 ≈ 97
The minimum sample that the researcher must take is 97 respondents. However,
researcher distributes questionnaire to 100 people as sample.
3.6. Statistical Tools
3.6.1. Multiple Regression
Multiple regression is a statistical technique that simultaneously develops a
mathematical relationship between two or more independent variables and an
interval-scaled dependent variable (Malhotra, 2010). Multiple regression is a
practical extension of simple regression in which it allows user to build a model
with several independent variables (Stair, JR, and Hanna; 2009). The form of
multiple regression model is as below:
Y = β0 + β1X1 + β2X2 + β3X3 + ε
Where:
Y = consumer buying decision
β0 = Y intercept
β1 – β3 = regression coefficient of brand loyalty, brand awareness, and brand
association

47
X1 = brand loyalty
X2 = brand awareness
X3 = brand association
ε = error
To see the correlation between dependent and independent variable in this
research, there are 3 requirements that have to be fulfilled to pass the regression
model. Those are normality test, multicollinearity test, and heteroskedasticity test.
3.6.2. Correlation Test
Correlation test is a test to know whether there is a significant relationship
between each independent variable to dependent variable. Researcher uses
Pearson Product Moment Correlation Test (r). It is significant if the Sig. result is
less than 0.05 (Sig. < 0.05). The interpretation of coefficient r is shown below:
Table 3.2 Interpretation Coefficient R
Coefficient Interval (r) Relationship Level
0.8 -1.00 Very strong
0.6 – 0.799 Strong
0.4 – 0.599 Moderately strong
0.2 – 0.399 Low
0.00 – 0.199 Very low
Source: Metode Penelitian Bisnis (Sugiyono, 2009)
3.6.3. Normality Test
Normality test is a test of whether independent variable and dependent variable
are normally distributed or not. A regression is good if the independent and
dependent variable are distributed close to normal. There is a specific plot and

48
statistic that can be used to test the normality, which is by using normal
probability plot. If data is normally distributed, the dots of the plot should be on a
straight line. To detect the normality, it can be seen if the dots spread around the
diagonal line and follow the diagonal line (straight line). If the dots spread away
or not follow the diagonal line, it means it is not normally distributed (Gazhali,
2009). Graphical method is also can be used to see whether the data is normal
distribution or not. If the shape of histogram is in bell shape, it means the data is
normally distributed. In this research, researcher uses both normal probability plot
(P-P plot) and histogram to show the data is normally distributed or not.
3.6.3. Multicollinearity Test
Multicollinearity is a state of very high intercorrelations among independent
variables (Malhotra, 2010). The purpose of multicollinearity test is to show
whether there is a strong correlation between independent variables. If the
multicollinearity is high (VIF > 10), it means there is a strong correlation between
independent variables and one of the variables should be discard from multiple
regression model.
3.6.4. Heteroskedasticity Test
Heteroskedasticity refers to unequal variance in the regression errors. The purpose
is to know whether the data is normal distribution or not and whether variance
terms of errors are difference across observations. The heteroskedasticity test can
be seen from residual plot. If the plots are distributed randomly without
systematic pattern, then the data is passed the heteroskedasticity test.
3.6.5. F Test
To know whether there is a significant relationship between dependent and
independent variable, F-test is used. Moreover, F-test is also can be used to see
whether the regression model that is used right or not.

49
Where
F = statistic test for F distribution
R2 = coefficient of determination
n = number of total sample
k = number of independent variable in the model
Hypothesis:
1. H0: β1 = β2 = β3 = 0 if significant F ≥ 0.05, accept H0
2. Ha: at least there is one β ≠ 0 if significant F < 0.05, reject H0
Researcher uses 0.05 as level of significance.
3.6.6. T Test
T test is a test with purpose to determine the influence of each independent
variable toward dependent variable.
Hypothesis:
1. H01: β1 = 0 if significant T ≥ 0.05, accept H0
2. Ha1: β1 ≠ 0 if significant T < 0.05, reject H0
3. H02: β2 = 0 if significant T ≥ 0.05, accept H0
4. Ha2: β2 ≠ 0 if significant T < 0.05, reject H0
5. H03: β3 = 0 if significant T ≥ 0.05, accept H0
6. Ha3: β3 ≠ 0 if significant T < 0.05, reject H0
On this research, researcher uses 0.05 as level of significance (α = 0.05).

50
3.7. Limitation of the Research
Due to tight schedule (time), budget, and other reason; the researcher has several
limitations, such as:
1. The population that the researcher chooses is President University students
with Indonesian nation, despite of any gender and batch.
2. The questionnaires are distributed to students who have consumed Mizone
isotonic drink.

51
CHAPTER IV
ANALYSIS AND INTERPRETATION
This chapter discuss about all important information and findings that researcher
got from this study, as well as brief company profile. The findings will be divided
into two main issues. The first part is about the demographic profile of the sample
(or respondent profile) and it will be shown in the form of diagrams and graphs. In
the second part of the research, researcher will give the result of data processing
and data analysis from SPSS 16.0.
4.1. Company Profile
PT. Aqua Golden Mississippi was built in 1973 by Tirto Utomo, as the pioneer of
packaged mineral water in Indonesia. On 1998, AQUA (under PT. Tirta
Investama) joined with DANONE Group, which is one of the biggest packaged
mineral water in the world. The company has 4 values, such as:
1. Humanity: consists of share, responsibility, and appreciation to others.
Share means honest with ourselves and others, create dialog, openness,
and teamwork. Responsibility means paying attention to human and
product safety carefully, as well to nature and society. Appreciation to
others means sensitive to cultural differences, treat people with same
respect, and help develop business partners.
2. Proximity: consists of accessible, credibility, and empathy. Accessible
means the management style is easy to access and flexible. Credibility
means honest to self and responsible of all taken action. Empathy means
dealing with consumers and suppliers in a genuine way and create good
relationship with them.
3. Openness: consists of curiosity, agility, and dialogue. Curiosity means
aware of what is done now and actively make future plan, open to new
ideas. Agility means symbolizes spirit and energy, quickly react to various
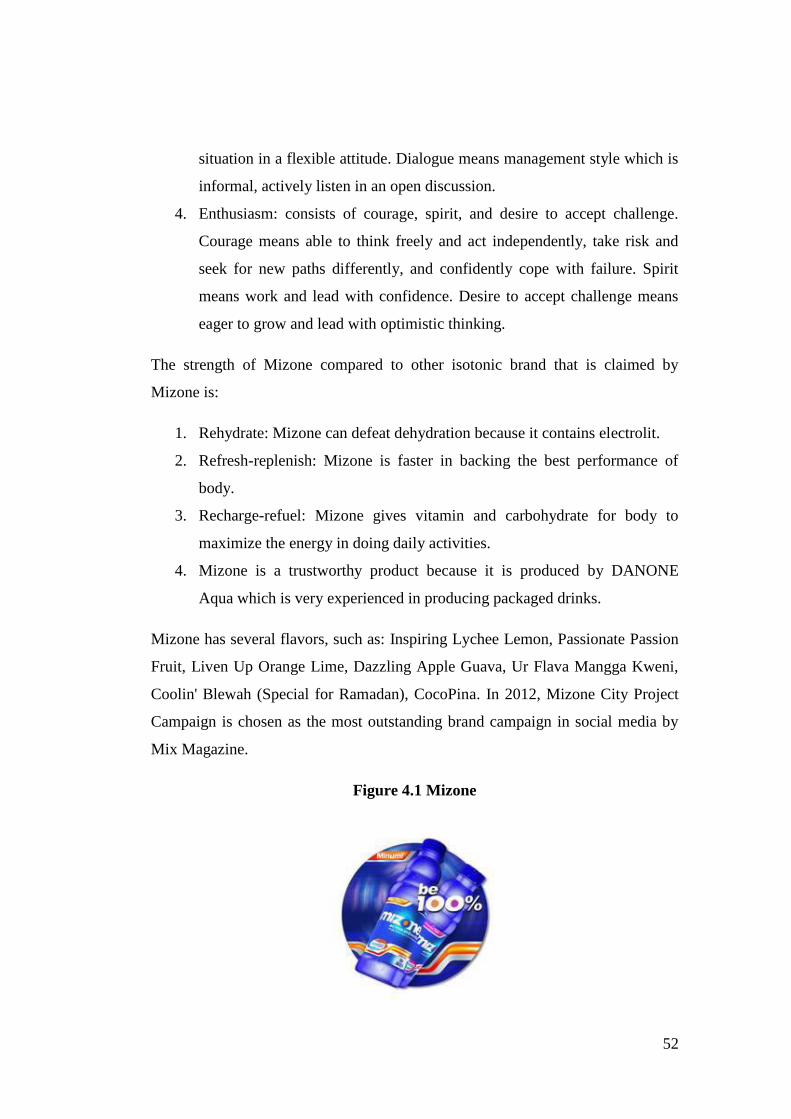
52
situation in a flexible attitude. Dialogue means management style which is
informal, actively listen in an open discussion.
4. Enthusiasm: consists of courage, spirit, and desire to accept challenge.
Courage means able to think freely and act independently, take risk and
seek for new paths differently, and confidently cope with failure. Spirit
means work and lead with confidence. Desire to accept challenge means
eager to grow and lead with optimistic thinking.
The strength of Mizone compared to other isotonic brand that is claimed by
Mizone is:
1. Rehydrate: Mizone can defeat dehydration because it contains electrolit.
2. Refresh-replenish: Mizone is faster in backing the best performance of
body.
3. Recharge-refuel: Mizone gives vitamin and carbohydrate for body to
maximize the energy in doing daily activities.
4. Mizone is a trustworthy product because it is produced by DANONE
Aqua which is very experienced in producing packaged drinks.
Mizone has several flavors, such as: Inspiring Lychee Lemon, Passionate Passion
Fruit, Liven Up Orange Lime, Dazzling Apple Guava, Ur Flava Mangga Kweni,
Coolin' Blewah (Special for Ramadan), CocoPina. In 2012, Mizone City Project
Campaign is chosen as the most outstanding brand campaign in social media by
Mix Magazine.
Figure 4.1 Mizone
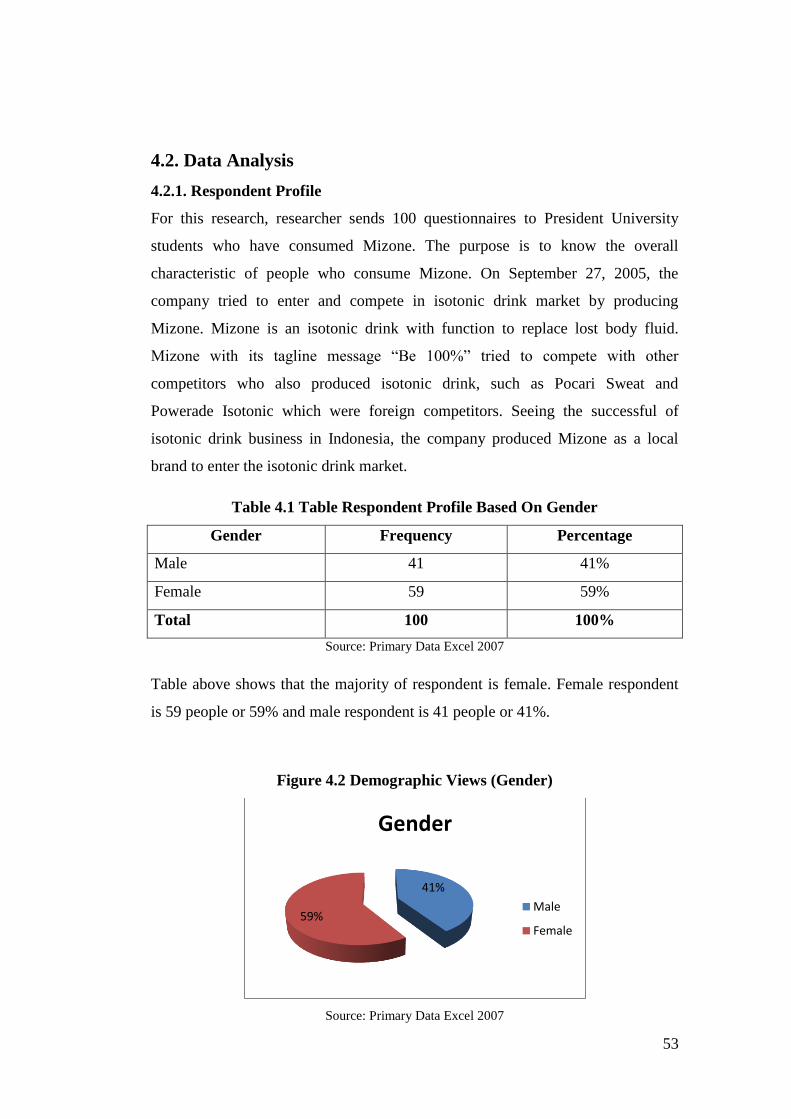
53
4.2. Data Analysis
4.2.1. Respondent Profile
For this research, researcher sends 100 questionnaires to President University
students who have consumed Mizone. The purpose is to know the overall
characteristic of people who consume Mizone. On September 27, 2005, the
company tried to enter and compete in isotonic drink market by producing
Mizone. Mizone is an isotonic drink with function to replace lost body fluid.
Mizone with its tagline message “Be 100%” tried to compete with other
competitors who also produced isotonic drink, such as Pocari Sweat and
Powerade Isotonic which were foreign competitors. Seeing the successful of
isotonic drink business in Indonesia, the company produced Mizone as a local
brand to enter the isotonic drink market.
Table 4.1 Table Respondent Profile Based On Gender
Gender Frequency Percentage
Male 41 41%
Female 59 59%
Total 100 100%
Source: Primary Data Excel 2007
Table above shows that the majority of respondent is female. Female respondent
is 59 people or 59% and male respondent is 41 people or 41%.
Figure 4.2 Demographic Views (Gender)
Source: Primary Data Excel 2007
41%
59%
Gender
Male
Female

54
4.2.2. Validity Test
On this research, researcher does a validity test by taking 30 samples from total
100 respondents and researcher uses SPSS 16.0 to compute the result. This
validity test use confidence level 95% with df=n-3. From the r-table, researcher
gets 0.367 as r-table value.
The criteria in validity test are:
1. If r compute < r table, the question is invalid.
2. If r compute (negative) < r table, the question is also invalid.
3. If r compute > r table, then the question is valid.
The result of validity test for this research can be seen in table below:
Table 4.2 Validity Test Result
Variable Question
Number
Corrected-
Item Total
Correlation
(R compute)
R table Pass
Brand
Loyalty (X1)
1 0.664 0.367 Valid
2 0.406 0.367 Valid
3 0.708 0.367 Valid
4 0.854 0.367 Valid
5 0.837 0.367 Valid
Brand
Awareness
(X2)
6 0.845 0.367 Valid
7 0.733 0.367 Valid
8 0.440 0.367 Valid
9 0.914 0.367 Valid
10 0.709 0.367 Valid
Brand
Association
11 0.749 0.367 Valid
12 0.598 0.367 Valid

55
(X3) 13 0.732 0.367 Valid
14 0.736 0.367 Valid
15 0.694 0.367 Valid
Consumer
Buying
Decision (Y)
16 0.896 0.367 Valid
17 0.472 0.367 Valid
18 0.416 0.367 Valid
19 0.849 0.367 Valid
20 0.767 0.367 Valid
21 0.703 0.367 Valid
22 0.573 0.367 Valid
Source: Primary Data SPSS 16.0
In the Table 4.1 above shows that 22 questions under both independent variable
(brand loyalty, brand awareness, and brand association) and dependent variable
(consumer buying decision) are valid because r > 0.361. All questions are valid
and fulfill the requirement. There is no question which r value < 0.361. All results
now can be used to next analysis.
4.2.3. Reliability Test
Researcher uses Cronbach’s Alpha to do reliability test on SPSS 16.0. According
to Malhotra (2010), if Cronbach’s Alpha is less than 0.6 means it is not reliable.
The result for reliability test for this research is:
Table 4.3 Reliability Test Result
Variable Cronbach’s Alpha N of items Reliability
Brand Loyalty 0.867 5 Reliable
Brand Awareness 0.870 5 Reliable
Brand Association 0.860 5 Reliable
Consumer Buying Decision 0.843 7 Reliable
Source: Primary Data SPSS 16.0

56
Table 4.2 shows that the the value of Cronbach’s Alpha is 0.957 which is larger
than 0.6. It means that all the questions under both independent variable and
dependent variable in this study are very reliable.
4.2.4. Correlation Test
The purpose to conduct correlation test is to know whether there is strong
correlation between independent and dependent variable. This test is also
significant if Sig. result is below than 0.05.
Table 4.4 Correlations
From the result above, it is shown that the correlation of brand loyalty to
consumer buying decision is strong (0.700), the correlation of brand awareness to
consumer buying decision is 0.757 which is also strong, and the correlation of
brand association toward consumer buying decision is very strong, which is 0.870.
The figure above shows that there is strong correlation between independent
variable toward dependent variable and they are significant.
4.2.5. Multiple Regression
To use multiple regression, the data must be eligible and there are some
requirements that must be fulfilled, such as:
1. The data must be normally distributed (using Normality Test).

57
2. No heterokedasticity (using using Heterokedasticity Test).
3. No multicollinearity (using Multicollinearity Test).
4.2.6. Normality Test
Normality test is a must for every research that uses multiple regression as the
statistical tool. The purpose of normality test is to know whether samples that
researcher took come from population with normal distribution. To test the
normality of the data, researcher uses both histogram and P-P plot.
Figure 4.3 Histogram
Figure 4.4 P-P Plot

58
Normality test is conducted in order to test whether the data is normally
distributed or not. If data is normal distributed, the histogram must be in bell
shape and the dots on the plot should spread close to or around the straight
diagonal line.
From Figure 4.3, it shows that the data is normally distributed as the line on
histogram depicts in form of bell shape. Moreover, in the Figure 4.4, the dots
lining along the diagonal line from bottom left to upper right and the dots spread
close to the line. Both figures show that the data is normally distributed and fulfill
the criteria or requirement of normality test.
4.2.7. Heterokedasticity Test
The purpose of heteroskedasticity is to know whether the data is normal
distribution or not and whether variance terms of errors are difference across
observations. The heteroskedasticity test can be seen from residual plot. To pass
the heterokedasticity test, the distribution of residual value toward predicted value
must be spread randomly without making a specific pattern (example: sinus
pattern, decreasing-then-increasing pattern).
Figure 4.5 Scatterplot

59
The picture above shows that the scatterplot dots spread randomly without making
any particular pattern. It means that there is no heterokedasticity and the
requirement of no heterokedasticity is fulfilled.
4.2.8. Multicollinearity Test
The purpose of multicollinearity test is to show whether there is a strong
correlation between independent variables. Multicollinearity is considered high if
the Variance Inflation Factor (VIF) value is larger than 10. It means that there is a
strong correlation between independent variables and one of the variables should
be discard from multiple regression model.
Table 4.5 Multicollinearity Result
Variable VIF
Brand Loyalty 2.644
Brand Awareness 3.232
Brand Association 1.900
Source: Primary Data SPSS 16.0
From the table above, it shows that the requirement of no multicollinearity is
fulfilled because all independent variables (brand loyalty, brand awareness, and
brand association) have VIF value less than 10. Thus, no need to discard these
variables and these can be included in multiple regression model.
4.2.9. F Test
F test is used to know whether there is a significant relationship between
dependent and independent variable.

60
Table 4.6 ANOVA
The requirement value of significance that has to be achieved in this test is less
than 0.05. In the ANOVA table above, it shows that the significance value is
0.000, less than 0.05. This result shows that all independent variables which are
brand loyalty, brand awareness, and brand association has a significant influence
toward consumer buying decision. Therefore, in this research, researcher accepts
the Ha and rejects the H0.
4.2.10. T Test
T test is a test with purpose to determine the relationship of each independent
variable toward dependent variable.
Table 4.7 Coefficients
The table above shows the result of significance value of each independent
variable to consumer buying decision as dependent variable:

61
1. Brand loyalty has significance value of 0.01 which is less than 0.05. It
means that brand loyalty is significance and has influence toward Mizone
consumer buying decision.
2. Brand awareness has significance value of 0.03 which is less than 0.05. It
means that brand awareness is significance and has influence toward
Mizone consumer buying decision.
3. Brand association has significance value of 0.00 which is less than 0.05. It
means that brand association is significance and has influence toward
Mizone consumer buying decision
4. Overall, all independent variables (brand loyalty, brand awareness, and
brand association) significant to consumer buying decision, so researcher
rejects H0 and accepts Ha.
As for beta of standardized coefficients, it shows that brand association has the
biggest result (0.624), followed by brand loyalty (0.174), and the last is brand
awareness (0.154). Brand association magnitude is 3.45 times bigger than brand
loyalty and 3.76 bigger than brand awareness. It means that it is recommended to
fix or increase and focus on brand association first rather than other aspects
because it has the highest magnitude. Researcher uses beta to explain the result of
the sample.
4.2.11. Multiple Regression Model
This measurement is used to examine whether the model is able to help predict the
consumer buying decision of Mizone based on brand equity aspects (brand
loyalty, brand awareness, and brand association).

62
Table 4.8 Model Summary
In the table above, the value of R is the coefficient of correlation. The guidance of
correlation coefficient based on Sugiyono (2009) is:
Table 4.9 R Value
R Value Correlation
0.00 – 0.199 Very Low
0.2 – 0.399 Low
0.4 – 0.599 Medium
0.6 – 0.799 Strong
0.8 – 1.000 Very Strong
Source: Metode Penelitian Bisnis (Sugiyono, 2009)
The R value is 0.905 which means there is very strong correlation between
independent variables and dependent variable. Moreover, the value of adjusted R
square shows how large independent variables affect dependent variable. The
adjusted R square in the table above is 0.814, means that the contribution of
independent variables to dependent variable simultaneously is quite high, which is
81.4%. In short, brand loyalty, brand awareness, and brand association affect only
81.4% on Mizone consumer buying behavior. The rest 18.6% is explained and
contributed by another factor or variable which not discussed in this research.
Researcher uses multiple regression because there is more than one independent
variables that are used for this study. From the test before, it shows that all
independent variables are significant (see table below):

63
Table 4.10 Significance and Beta Coefficients
Independent
Variable
Sig. Value Pass Beta
Brand Loyalty 0.01 Significance 0.174
Brand Awareness 0.03 Significance 0.154
Brand Association 0.00 Significance 0.624
Source: Primary Data SPSS 16.0
Thus, the multiple regression model for this study is:
Y = 0.177 + 0.174 X1 + 0.154 X2 + 0.624 X3 + ε
Where:
Y = Consumer Buying Decision
X1 = Brand Loyalty
X2 = Brand Awareness
X3 = Brand Association
ε = Random Error Term
4.3. Interpretation Result
Based on statistical test for this study by using SPSS 16.0, it is shown that
“consumer buying decision” variable can be explained by “brand loyalty”
variable, “brand awareness” variable, and “brand association” variable. Other
result findings are:
1. According to T test and F test result, variable brand loyalty, brand
awareness, and brand association has influence and significant toward
Mizone consumer buying behavior. All significance result of brand
loyalty, brand awareness, and brand association are below 0.05, means that
all independent variable of brand equity that the researcher uses has impact

64
to President University students buying decision of Mizone. Based on
previous research (refer to table 2.2), it shows that brand loyalty, brand
awareness, and brand association do have impact or influence consumer
buying decision. Therefore, it shows that President University students
realize and consider that brand equity aspect have impact on them that
makes them buy the product.
2. The independent variable that affect Mizone consumer buying decision the
most is brand association. It can be seen from beta of standardized
coefficient, in which brand association has the highest beta (0.643)
compared to brand loyalty (0.186) and brand awareness (0.171). Based on
statement above, researcher tries to relate it with the questionnaire result
which is about brand loyalty, brand awareness, brand association, and
President University buying decision of Mizone isotonic drink. It shows
that President University student buy Mizone because the price is worth
with the quality and it can replace their body fluid. Moreover, Mizone has
several flavors that consumer can choose based on their taste preferences.
3. As for brand awareness and brand association, President University
students can recognize Mizone brand and there is no difficulties in
imagining the brand. Moreover, they also aware about the brand and they
buy it because it is a familiar and well-known brand. Based on President
University students, Mizone has a unique brand compared to other brand
and some think that Mizone is a right product that is consumed by people
who care about healthiness.
To conclude, there is a significant influence between aspects of brand equity,
especially brand loyalty, brand awareness, and brand association toward buying
behavior of President University students to the product Mizone. The influence of
these brand equity aspects make people to buy the product because they know,
aware, and like the brand.

65
CHAPTER V
CONCLUSION AND RECOMMENDATION
5.1. Conclusion
The objective to be identified in this study is the influence of brand loyalty, brand
awareness, and brand association toward Mizone consumer buying decision.
Based on the results of data analysis, the researcher concludes as follows:
1. According to F test result, it shows that brand loyalty has significance
influence toward Mizone consumer buying decision. It can be proven
based on the ANOVA table (Table 4.6) that the significance of F is 0.00
and it’s lower than 0.05. Moreover, based on T test result, it shows that the
significance value of brand loyalty is 0.01, which is lower than 0.05 means
it is accepted. Moreover, from the primary data (questionnaire), it shows
that President University students still buy Mizone although their friends
or family suggest that it’s not good and they will choose Mizone to replace
their body fluid.
2. Brand awareness has significance influence toward Mizone consumer
buying decision. It can be seen from F test result, the significance of F is
0.00 and it’s lower than 0.05. Moreover, based on T test result, it shows
that the significance value of brand awareness is 0.03, which is lower than
0.05 means it is accepted. As from the primary data (questionnaire), it
shows that President University students aware of this brand. They buy
Mizone because it is a familiar brand and they can recognize Mizone
among other competitors’ brand.
66
3. Based on both F test and T test result, it shows that brand association has
significance influence toward Mizone consumer buying decision. It can be
proven based on the ANOVA table (Table 4.6) that the significance of F is
0.00 and it’s lower than 0.05. In the other hand, T test result shows that the
significance value of brand association is 0.00, which is lower than 0.05
means it is accepted. Moreover, from the primary data (questionnaire), it
shows that President University students have association with Mizone
brand. They think Mizone is a unique brand of isotonic drink product and
they also like Mizone brand image.
4. In short, all independent variables (brand loyalty, brand awareness, and
brand association) have influence toward Mizone consumer buying
decision. This result is supported by previous research done by Kusuma
(2012) and Yusuf (2010) that brand equity aspects, namely: brand loyalty,
brand awareness, and brand association have significant influence toward
consumer buying decision of isotonic drink product.
5.2. Recommendation
Based on the data analysis of this study, the researcher would like to contribute by
providing recommendations for the following parties:
1. For PT. Tirta Investama (Mizone):
Research indicated that among aspects of brand equity that the researcher
used for this research (brand loyalty, brand awareness, and brand
association), brand association is the most influencing toward consumer
buying decision. Therefore, the company can make advertising or event
for consumers with specific theme to create stimuli in the mind of
consumer for deeper and clear association.

67
2. For future researchers:
As for future researchers who have similar interest in brand equity analysis
of FMCG product, the researcher suggest to delve further into the brand
loyalty and brand awareness aspect, as well as other brand equity aspect
that the researcher doesn’t use for this study which is perceived quality and
other proprietary asset. Therefore, it might lead to better way of
understanding the consumer buying decision based on all aspect of brand
equity.

68
REFERENCES
Books:
Barry Render, Ralph M. Stair, Michael E. Hanna, T.N. Badri. (2008). Quantitative
Analysis for Management 10th edition. Pearson Education.
Berenson, Levine, Timothy. (2011). Basic Business Statistics: Concept and
Applications. New Jersey: Pearson Prentice Hall.
Darmadi Durianto, Sugiarto, Tony Sitinjak. (2011). Strategi Menaklukkan Pasar
Melalui Riset Ekuitas dan Perilaku Merek. PT. Gramedia Pustaka Utama.
Durianto. (2004). Brand Equity Ten: Strategi Memimpin Pasar.
Ghozali, I. (2011). Aplikasi Analisis Multivariate Dengan Program SPSS.
Keller, K. L. (2012). Strategic Brand Management: Building, Measuring, and
Managing Brand Equity, 4th Edition. Prentice Hall.
Kendall, S. D. Customer Service from the Customer's Perspective. John Wiley &
Sons.
Kotler, P. (2005). Faqs On Marketing. Singapore: Marshal Cavendish Business.
Leon G. Schiffman, Leslie Lazar Kanuk. (2009). Consumer Behavior 10th
Edition. Prentice Hall.
Malhotra, N. K. (2010). marketing Research An Applied Orientation 6th Edition.
New Jersey: Pearson Education.
Norman K. Denzin, Yvonna S. Lincoln. (2011). The SAGE Handbook of
Qualitative Research. SAGE Publications, Inc.
Philip Kotler, Gary Armstrong. (2012). Principe of Marketing 14th Edition.
Pearson Education Limited.

69
Philip Kotler, Kevin Lane Keller. (2009). Marketing Management 13th Edition.
Pearson Prentice Hall.
Rangkuti, F. (2004). The Power of Brand. PT. Gramedia Pustaka Utama.
Sekaran, U. (2003). Research Methods For Business: A Skill Building Approach
4th Edition. John Wiley & Sons Inc.
Shimp, T. A. (2010). Advertising, Promotion, and Other Aspects of Integrated
Marketing Communication. Cengage Learning.
Sugiyono. (2009). Metode Penelitian Bisnis. Alfabeta.
Sugiyono. (2009). Metode Penelitian Pendidikan: Pendekatan Kuantitatif,
Kualitatif dan R&D. Alfabeta.
Temporal, P. (2010). Advanced Brand Management. Singapore: John Wiley &
Sons.
Journal:
Ioan, M. O. AN ANALYSIS OF THE BRAND LOYALTY BASED CONSUMER
TYPOLOGY. Romania.
Management, E. I. (2009). Retrieved January 10, 2014, from
http://www.eurib.org/fileadmin/user_upload/Documenten/PDF/Merkmeer
waarde_ENGELS/s_-_Brand_equity_model_by_Aaker_EN_.pdf
Marketing, T. C. (2009). Retrieved January 10, 2014, from Marketing and the 7
P's: http://www.cim.co.uk/files/7ps.pdf
Mohamad Taleghani, Meysam Almasi . (2011). Evaluate the Factors Affecting
Brand Equity from the Perspective of Customers Using Aaker's Model.
Iran.
Moisescu, O. I. A Conceptual Analysis of Brand Loyalty As Core Dimension of

70
Brand Equity.
Namin Tajzadeh, Rahmani Vahid. (2012). The Role of Attitudes and Decision
Making on Product Choice: Case Study: Cellular Phones. International
Business Research , 132-146.
P. K. A. Ladipo, T. O. Olufayo, Omoera, C. I. (2012). The Multi-Dimensional
Application/Use of Branding in the Universe of Marketers. International
Journal of Academic Research in Business and Social Sciences , 8.
Wahyu, D. (2012). Pengaruh kesadaran merek, asosiasi merek, dan loyalitas
merek terhadap keputusan pembelian handphone blackberry.
Zen, D. K. (2012, September 3). Analisis Pengaruh Ekuitas Merek Terhadap
Keputusan Pembelian Konsumen Minuman Isotonik Pocari Sweat. 102.
Website:
Association, A. M. (2004, October). Definition of Marketing. Retrieved January
10, 2014, from American Marketing Association:
http://www.marketingpower.com/AboutAMA/Pages/DefinitionofMarketin
g.aspx
Basyuni, M. M. (2001, August 1). Retrieved January 10, 2014, from UNDANG-
UNDANG REPUBLIK INDONESIA TENTANG MEREK:
http://www.dgip.go.id/images/adelch-images/pdf-
files/uu_pp/uu_no_15_th_2001.pdf
Chieng Fayrene Y.L., Goi Chai Lee. (2011, January). Retrieved January 10, 2014,
from CUSTOMER-BASED BRAND EQUITY: A LITERATURE
REVIEW : http://www.researchersworld.com/vol2/PAPER_04.pdf
Group, F. C. (2013). Top Brand Survey. Retrieved November 3, 2013, from Top
Brand: http://www.topbrand-award.com/top-brand-survey/survey-
result/top-brand-index-2013/

71
Lanthier, E. (2002, March 29). Retrieved December 10, 2013, from
Questionnaire:
http://www.nvcc.edu/home/elanthier/methods/questionnaire.htm
Nancy Giddens, Amanda Hofmann, Connie Hardy. (2010, August). Brand
Loyalty. Retrieved January 10, 2014, from Ag Decision Maker:
http://www.extension.iastate.edu/agdm/wholefarm/pdf/c5-54.pdf
Roa, D. V. (2013, February 22). No Water, No Business: The Importance of Water
Stewardship. Retrieved November 20, 2013, from Blue Tech Research:
http://www.bluetechresearch.com/no-water-no-business-the-importance-
of-water-stewardship/
University, D. (2013, July). Water - a vital nutrient. Retrieved November 20,
2013, from Better Health Channel:
http://www.betterhealth.vic.gov.au/bhcv2/bhcarticles.nsf/pages/Water_a_v
ital_nutrient

72
APPENDICES
73
APPENDIX I
Questionnaire
Responden Yth.
Nama saya Felicia, mahasiswi semester akhir jurusan Marketing dari President
University yang sedang melakukan penelitian tentang "Pengaruh dari loyalitas
merek, kesadaran merek, dan asosiasi merek terhadap keputusan pembelian
konsumen akan produk Mizone" (The influence between brand loyalty, brand
awareness, and brand association toward consumer buying decision of Mizone).
Saya mengharapkan kerjasama responden dalam penelitian ini sehingga penelitian
ini dapat berlangsung dengan baik. Semua informasi yang saya terima dari hasil
kuesioner ini bersifat rahasia dan untuk kepentingan akademis. Atas perhatian dan
kerjasamanya, saya ucapkan terima kasih.
Felicia
Gender:
Male
Female
Statement:
1: Strongly Disagree
2: Disagree
3: Neutral
4: Agree

74
5: Strongly Agree
No Statements 1 2 3 4 5
BRAND LOYALTY
1. I still buy Mizone although my friends or
family suggest its not good
2. Mizone is my 1st choice when I buy isotonic
drink
3. I buy Mizone regularly
4. I always buy Mizone instead of other brand
because the price is worth with its quality
5. If I want to replace my lost body fluid, I'll
choose Mizone
BRAND AWARENESS
6. When I want isotonic drink, I think about
Mizone automatically
7. I buy Mizone because it is familiar & well-
known brand
8. Some characteristic of Mizone come to my
mind quickly
9. I can recognize Mizone among competing
brands
10. I have difficulty imagining Mizone in my
mind
BRAND ASSOCIATION

75
11. Mizone has a unique brand image compare to
competing brands
12. Mizone is consumed by people who care
about healthiness
13. I respect and admire people who drink
Mizone
14. I like the brand image of Mizone
15. I believe and trust the Mizone brand
CONSUMER BUYING DECISION
16. I buy Mizone to fulfill my need of isotonic
product
17. I buy Mizone after I see the advertising
through TV, internet, magazine, or billboard
18. Before I buy Mizone, I search for information
about the product first
19. I always compare Mizone with other isotonic
drink brand
20. I will buy Mizone rather than other isotonic
drink brand
21. I will purchase Mizone again if I am out of
stock
22. I recommend Mizone to other people

76
APPENDIX II
Raw Data Material
1 2 3 4 5 6 7 8 9 10 11 12 13 14 15 16 17 18 19 20 21 22
1 3 3 3 3 3 2 2 3 3 4 2 2 4 2 3 3 1 3 4 3 3 4
2 4 4 4 4 5 4 5 4 5 5 4 5 5 5 4 4 4 4 5 5 5 5
3 3 2 2 3 3 4 3 3 4 3 4 4 3 3 2 4 2 1 3 3 3 2
4 3 4 5 4 4 1 2 5 5 4 4 4 4 3 2 3 1 4 2 4 5 4
5 4 4 3 4 4 2 2 3 4 4 3 4 3 3 2 3 2 3 3 4 5 4
6 5 5 3 3 3 3 3 4 4 4 4 4 4 4 4 4 4 3 4 4 4 4
7 5 5 5 5 5 1 3 3 5 5 1 3 3 3 3 1 1 5 1 5 5 5
8 3 2 1 3 2 1 1 4 2 4 3 4 4 5 3 3 2 3 2 2 3 3
9 3 4 3 4 4 2 2 3 4 4 4 4 3 4 3 4 2 2 5 5 5 5
10 3 3 4 3 3 1 2 4 2 4 4 3 3 3 4 4 2 4 2 3 3 2
11 3 3 3 2 2 2 2 5 2 4 2 4 4 3 4 2 2 5 3 3 5 4
12 5 4 3 4 4 3 3 3 4 5 4 4 5 4 4 4 4 5 3 4 5 4
13 5 4 4 4 4 4 4 4 4 4 4 3 3 3 4 4 4 4 4 4 4 4
14 3 3 2 3 3 2 2 4 3 4 3 3 5 3 4 2 1 5 2 2 5 3
15 3 4 5 2 4 2 3 3 3 4 5 5 4 4 4 5 4 5 4 5 4 4
16 5 5 5 5 5 3 3 5 4 5 5 5 5 5 4 5 3 5 5 5 5 5
17 3 1 2 2 2 2 3 3 2 3 3 3 3 2 2 2 4 4 2 2 3 4
18 2 3 3 3 3 1 1 1 1 4 2 3 4 3 3 3 1 4 2 2 3 3
19 5 5 4 4 4 3 4 4 5 4 4 3 3 3 4 4 3 5 3 4 4 4
20 5 5 4 5 5 3 3 4 5 4 1 3 4 5 3 3 1 2 2 5 4 2
21 5 4 4 3 3 4 5 4 5 4 3 3 3 3 4 3 3 4 3 4 5 4
22 4 3 3 3 2 2 2 3 4 3 3 3 4 3 2 3 2 5 3 3 3 3
23 5 4 3 4 4 3 4 3 5 4 4 3 4 2 3 3 4 5 3 4 5 4
24 5 5 5 5 5 3 3 4 5 3 4 4 3 4 4 4 3 4 3 4 5 5
25 4 5 4 5 4 2 2 4 4 2 4 3 3 3 4 4 5 5 3 4 4 4
26 4 4 2 3 5 1 2 2 2 5 2 2 4 2 2 3 2 2 3 5 5 2
27 4 4 3 4 5 5 5 5 5 5 5 5 5 5 3 5 5 3 5 5 5 5
28 5 5 3 5 5 1 3 5 5 5 5 5 5 5 5 5 2 4 4 5 5 5
29 5 4 4 4 4 2 3 4 5 5 4 4 5 3 2 4 2 5 3 5 5 4
30 3 4 3 4 5 2 4 4 5 4 4 4 5 4 4 4 4 5 4 5 3 3
31 5 4 4 4 4 4 5 5 4 5 1 5 5 4 5 5 3 5 5 5 5 4
32 5 5 5 5 2 5 5 5 5 5 1 4 5 2 2 2 2 4 2 5 5 5
33 4 3 3 5 2 1 2 2 2 5 3 5 5 5 3 4 3 5 3 5 4 4
34 5 2 3 3 2 2 2 2 3 4 3 3 3 3 3 3 2 4 3 4 4 3
35 5 4 3 4 4 2 2 4 4 4 3 4 5 3 4 3 3 5 3 3 4 4
36 4 4 3 4 4 2 2 4 4 4 2 4 4 4 4 4 2 4 3 4 4 3
37 5 5 5 5 5 3 4 5 5 5 5 5 3 3 5 5 5 3 3 5 5 3
38 3 1 4 3 1 1 4 3 3 2 2 1 2 2 1 2 3 2 3 1 4 2

77
39 3 2 3 2 2 2 2 2 2 2 3 2 3 2 2 2 2 2 2 2 2 2
40 4 4 4 4 4 3 4 3 3 4 4 4 3 3 3 4 3 4 4 4 4 4
41 4 4 2 4 3 2 3 4 4 5 3 3 3 3 4 4 2 4 2 4 3 3
42 5 5 5 5 5 4 3 5 5 5 4 4 4 4 5 5 3 4 4 4 4 4
43 4 4 4 4 4 4 4 4 4 4 4 4 4 4 4 4 4 4 4 4 4 4
44 4 4 4 4 4 4 4 4 4 4 4 4 4 4 4 4 4 4 4 4 4 4
45 2 1 1 1 1 1 1 1 1 1 1 1 1 1 1 1 1 3 1 1 1 1
46 4 4 4 4 4 3 3 3 4 4 4 4 4 4 3 4 4 4 4 4 4 5
47 4 5 5 4 4 2 4 4 4 1 3 4 4 3 4 4 4 1 4 4 4 4
48 5 3 5 3 3 3 3 3 3 3 3 3 3 3 3 3 3 3 3 3 3 3
49 4 4 4 3 3 3 3 3 4 4 3 3 3 3 3 3 3 4 3 4 4 3
50 5 2 3 4 4 1 1 2 4 4 3 2 3 2 2 3 1 5 3 3 3 2
51 4 3 3 3 3 2 3 2 4 3 3 3 4 3 3 4 3 3 3 4 4 4
52 4 4 3 4 5 2 2 3 3 5 3 3 5 3 2 4 2 4 3 4 3 4
53 4 4 4 5 5 4 5 5 4 4 5 4 5 4 4 4 4 3 4 4 4 4
54 3 2 3 3 3 2 3 3 3 3 3 3 5 3 4 3 3 3 3 3 4 5
55 3 2 3 3 3 2 3 3 3 3 3 3 5 3 4 3 3 3 3 3 4 5
56 4 3 4 5 3 2 4 3 4 3 3 3 3 3 3 3 3 3 3 4 4 3
57 5 5 5 5 5 4 4 4 5 5 4 4 5 5 4 3 3 4 4 5 5 5
58 4 2 3 4 2 4 4 4 4 4 4 4 4 4 4 4 4 3 4 4 4 4
59 5 5 5 5 5 5 5 5 5 4 4 4 4 5 5 5 4 4 4 5 5 4
60 5 5 5 5 5 5 5 5 5 5 4 4 5 5 5 5 5 5 5 5 5 5
61 5 5 5 5 5 5 5 5 5 5 5 5 5 5 5 5 1 5 5 5 5 5
62 5 5 5 5 5 3 5 5 4 3 1 1 1 1 1 1 1 1 1 1 1 1
63 3 2 3 3 4 1 3 4 4 5 3 3 3 3 4 3 2 4 3 2 4 3
64 5 4 4 5 5 4 4 4 5 5 5 5 3 5 4 5 4 3 3 5 5 5
65 5 5 3 5 5 3 3 5 5 5 5 5 5 5 3 5 5 5 5 5 5 5
66 5 5 5 5 5 5 5 5 5 5 5 5 5 5 5 5 5 3 5 5 5 5
67 5 5 5 5 5 5 5 5 5 5 4 3 4 4 5 5 5 5 5 5 5 5
68 5 5 5 5 5 5 5 5 5 5 5 5 4 5 5 5 5 4 5 5 5 5
69 5 5 3 4 5 3 4 5 5 4 4 3 4 4 4 4 3 4 3 5 5 4
70 5 5 5 5 5 3 3 5 5 5 2 5 5 4 5 4 4 5 4 5 5 5
71 2 2 2 2 2 2 2 2 2 2 3 3 3 3 2 2 3 2 3 2 2 2
72 5 4 5 5 5 5 2 1 5 3 4 3 5 4 5 4 5 5 4 4 4 3
73 5 5 3 3 3 2 2 3 3 3 3 3 3 3 3 3 2 3 2 3 3 3
74 2 3 3 4 3 1 2 4 3 4 3 3 5 2 4 2 5 5 2 3 2 3
75 4 4 4 4 4 2 2 4 4 3 3 4 3 4 3 4 1 5 3 4 4 3
76 3 3 3 2 2 2 2 3 3 3 2 2 3 2 2 2 2 1 3 2 3 2
77 5 3 4 4 3 1 2 3 4 4 2 2 3 3 3 4 1 4 3 4 3 5
78 5 5 5 5 5 5 5 3 5 5 5 5 5 5 4 5 4 5 5 5 5 5
79 4 4 2 2 2 1 2 1 2 2 2 2 4 2 1 2 2 4 2 4 2 4
80 4 3 4 4 3 2 2 2 4 2 2 4 3 4 4 3 2 4 2 4 4 3
81 3 4 4 3 3 2 2 3 3 4 3 3 3 2 4 3 2 4 3 4 4 3
82 4 2 3 4 5 2 3 2 5 4 5 5 5 3 5 5 3 1 3 5 5 5
83 4 4 3 4 4 3 3 3 4 4 4 4 4 4 3 4 3 4 3 4 4 4
84 3 3 3 4 4 2 3 4 4 3 4 4 3 3 3 4 3 4 3 4 3 3
85 3 4 2 2 3 2 4 3 4 3 2 3 3 2 4 2 3 4 3 4 4 3
86 4 4 3 3 3 1 3 3 3 3 1 2 3 1 3 1 1 2 3 4 3 3
87 2 4 1 2 2 1 1 4 2 2 2 2 3 2 3 1 1 5 1 1 5 1

78
88 5 5 5 5 5 5 5 5 5 5 5 3 5 3 5 5 3 5 5 5 5 3
89 3 3 3 3 2 2 3 4 3 5 3 3 3 3 4 3 4 3 2 2 3 2
90 5 5 3 5 5 3 4 3 4 3 5 4 3 4 3 4 3 5 4 3 4 4
91 5 5 5 5 5 3 5 5 5 5 3 3 5 5 3 5 2 3 5 5 5 3
92 4 3 3 3 3 2 3 3 3 2 3 3 3 3 3 3 3 4 2 3 3 2
93 5 4 2 4 4 2 2 4 4 4 4 3 4 3 4 4 2 4 3 4 4 4
94 5 4 5 4 4 4 4 4 5 5 4 4 4 4 5 4 2 3 5 4 4 5
95 4 5 5 5 4 5 5 5 5 4 5 5 5 4 5 5 5 5 5 5 5 4
96 5 3 2 4 5 2 2 4 4 5 4 5 5 5 4 4 2 4 3 4 5 4
97 5 3 4 4 4 4 5 5 5 5 5 5 5 5 5 5 4 5 5 5 5 5
98 5 4 3 3 3 3 3 3 4 4 3 5 3 4 3 3 3 3 4 4 4 4
99 2 4 3 3 3 1 3 3 2 3 2 3 2 3 3 2 2 2 2 2 3 1
100 5 5 5 5 5 5 5 5 5 5 3 3 5 5 5 5 5 5 5 5 5 3

79
APPENDIX III
Reliability Test
Brand Loyalty (X1):
Brand Awareness (X2):
Brand Association (X3):

80
Consumer Buying Decision (Y):
Validity Test

81
Correlation Test
Multiple Regression
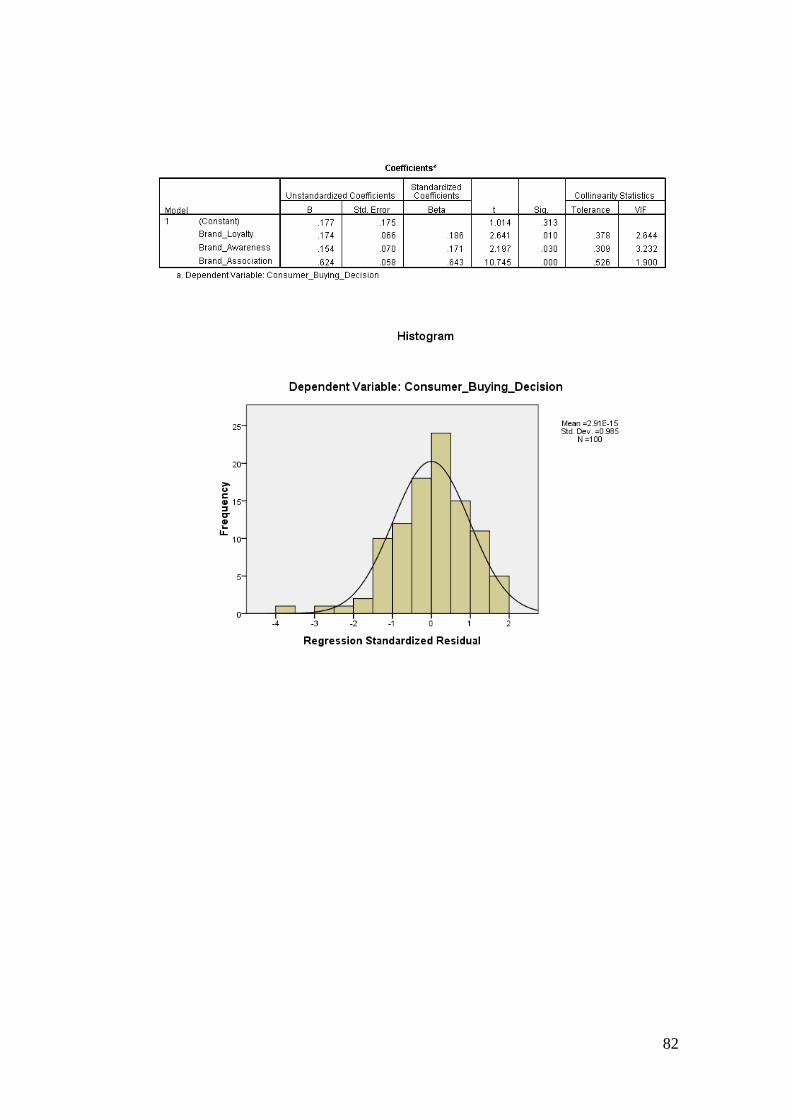
82

83