the influence of carboxylic acid in packaging...
TRANSCRIPT

1/1/2016
The Influence of Carboxylic Acid in Packaging Materials CENTRE FOR ANALYSIS AND SYNTHESIS | FACULTY OF
ENGINEERING | LUND UNIVERSITY
JONAS MATTISSON | MASTER OF SCIENCE THESIS
Supervisors:
Åsa Olsson, Tetra Pak & Dr. Baozhong Zhang, Lund University
Examiner:
Prof. Patric Jannasch, Lund University

Page 1 of 65

Page 2 of 65
The Influence of Carboxylic Acid in
Packaging Materials
Master of Science Thesis
Centre for analysis and synthesis
Faculty of Engineering
Lund University
Jonas Mattisson
2016
Supervisors:
Åsa Olsson, Tetra Pak
Dr. Baozhong Zhang, Lund University
Examiner:
Prof. Patric Jannasch, Lund University

Page 3 of 65
Abstract
Tetra Pak delivers food packing services world-wide and uses multilayer packaging materials to protect the food product from being affected by the environment. Loss of adhesion between the polymer and the aluminium layer in Tetra Paks packaging materials has proven to be a serious problem casing the package to lose its integrity and the food product to spoil. The problem is relatively unstudied but has shown to be connected to fatty and acidic products indicating a connection to the presence of carboxylic acids.
This master thesis was conducted to identify the core mechanism of the delamination phenomenon and to create a base from which further studies can be conducted. Two basic hypothesis were provided by Tetra Pak for further study and evaluation. One is connected to the surface chemistry of the interface and the other is connected to changes in the mechanical properties of the polymers at the interface.
A literature study was conducted and the work was delimited to the most basic carboxylic acid; acetic acid as well as the most commonly used polymer; low density polyethylene. The study indicated a connection between the presence of water and the delamination phenomena in agreement with the aluminium-water system.
Three experiments where performed using two similar packaging materials produced at different times. These were exposed to food simulants containing different amounts of water to study the impact this would have on the delamination. The different experiments were then analysed using various methods to determine the mode of failure and connect these to the hypothesis.
Results from peel testing showed a greater, or at least faster, loss in adhesion for the packaging materials that were exposed to food stimulants with high concentration of water. The FTIR measurements revealed interesting results for the simulant with average concentration of water showing a thin layer of polymer on the al surface at the highest peel force. This correlates with the hypothesis that the mechanics of the polymer would have changed. The FTIR measurements at the lowest peel force for the simulant with highest concentration of water however showed lower amounts of LDPE, supporting the theory that the delamination is due to surface chemistry. The FTIR findings were further supported by microscopic surface studies which showed a clearer fracture surface with less LDPE for the delaminated samples.
The conclusion of this thesis shows that the setup used behaves according to the mechanism of the Al-water system which was strongly indicated by the formation of hydrogen gas and the lacking amount of polymer on the aluminium surface. The Al-water system in turn correlates with the hypothesis provided by Tetra Pak that the delamination phenomenon is due to surface chemistry.
Page 4 of 65
Sammanfattning
Tetra Pak levererar matförpackningstjänster över hela världen och använder flerskikts-förpackningsmaterial för att skydda livsmedelsprodukten från att påverkas av den omgivande miljön. Förlust av vidhäftning mellan polymer och aluminiumskiktet i Tetra Paks förpackningsmaterial har visat sig vara ett allvarligt problem som får förpackningen att förlora sin integritet och livsmedelsprodukten att förstöras. Problemet är relativt ostuderat men har visats vara kopplat till feta och sura produkter vilket i sig indikerar en koppling till närvaron av karboxylsyror.
Detta examensarbete genomfördes för att identifiera huvudmekanismen av delamineringsfenomenet för att skapa en grund för fortsatta studier. Två bashypoteser tillhandahölls av Tetra Pak för vidare studier och utvärdering. En är knuten till ytkemin av gränssnittet (”aluminium-vattensystemet”), och en är kopplad till förändringar i de mekaniska egenskaperna hos polymererna vid gränsytan.
En litteraturstudie genomfördes och arbetet avgränsades till den mest grundläggande karboxylsyran, ättiksyra, liksom den vanligaste polymeren, lågdensitetspolyeten. Studierna indikerade ett samband mellan närvaron av vatten och delamineringsfenomenet i överensstämmelse med aluminium-vattensystemet.
Tre experiment utfördes med hjälp av två liknande förpackningsmaterial som producerats vid olika tidpunkter. Dessa utsattes för livsmedelssimulanter som innehöll olika mängder vatten för att studera hur detta skulle påverka delamineringen. De olika experimenten analyserades sedan med hjälp av olika metoder för att bestämma brottsorsaken och koppla dessa till hypotesen.
Resultat från dragprov (peel test) visade en större eller åtminstone snabbare förlust i vidhäftning för förpackningsmaterial som exponerats för livsmedelssimulant med hög koncentration av vatten. Mätningarna med FTIR visade intressanta resultat för simulanten med mellankoncentrationen av vatten som visade ett tunt skikt av polymer på aluminiumytan vid den högsta avdragningskraften. Detta korrelerar med hypotesen att de mekaniska egenskaperna i polymeren skulle ha förändrats. FTIR-mätningar vid den lägsta avdragningskraften för simulanten med högsta koncentrationen av vatten visade emellertid lägre mängder av LDPE vilket stöder teorin att delamineringen beror på ytkemi. Resultaten från FTIR analysen får ytterligare stöd av mikroskoperingsstudien som visade en tydligare brottyta med mindre LDPE för delaminerade prover.
Slutsatsen i examensarbetet visar att den använda materialuppställningen beter sig enligt mekanismen för aluminium-vattensystemet, som starkt påvisas av bildning av vätgas och avsaknaden av polymer på aluminiumytan. Aluminium-vattensystemet i sin tur korrelerar med hypotesen som tillhandahålls av Tetra Pak att delamineringsfenoment beror på ytkemi.

Page 5 of 65
Acknowledgement I would hereby like to express my gratitude to all the people that have been involved and helped me while conducting this master thesis, especially to Åsa Olsson for her great guidance as a supervisor. Further more I like to thank my family, relatives and beloved Stina for standing by my side and believing in me through my studies. Finally I would like to dedicate this thesis to my grandparents who taught me the importance of knowledge and education.

Page 6 of 65
THE INFLUENCE OF CARBOXYLIC ACID IN PACKAGING MATERIALS .................... 2
1 BACKGROUND .............................................................................................. 8
1.1 The Problem ............................................................................................... 9
1.2 Objectives .................................................................................................. 9
1.3 Delimitations .............................................................................................. 9
2 LITERATURE STUDY .................................................................................... 9
2.1 Packaging Materials .................................................................................. 9
2.1.1 Polyethylene (PE) ................................................................................. 9
2.1.2 LDPE Adhesion and Adhesives .......................................................... 10
2.1.3 Aluminum Foil ..................................................................................... 11
2.2 Adhesion Mechanism .............................................................................. 12
2.2.1 Adsorption Mechanism ....................................................................... 12
2.2.2 Diffusion Mechanism .......................................................................... 12
2.2.3 Mechanical Interlocking Mechanism ................................................... 13
2.2.4 Electrostatic Mechanism ..................................................................... 13
2.3 Modes of Failure ...................................................................................... 13
2.4 Food Products ......................................................................................... 14
2.4.1 Fatty Acids .......................................................................................... 14
2.4.2 Free Fatty Acids ................................................................................. 14
2.4.3 Carboxylic Acids ................................................................................. 14
2.5 Penetration of the Polymer ..................................................................... 15
2.5.1 Sorption and Solubility ........................................................................ 15
2.5.2 Diffusion ............................................................................................. 17
2.5.3 Permeation ......................................................................................... 18
2.6 Delamination ............................................................................................ 18
2.7 Testing Methods ...................................................................................... 19
2.7.1 Peel Test/Tensile Testing ................................................................... 19
2.7.2 Fourier Transform Infrared Spectroscopy (FTIR) ................................ 20
2.7.3 Scanning Electron Microscopy (SEM) ................................................ 20
2.7.4 LeakDetective ..................................................................................... 20
2.7.5 Differential Scanning Calorimetry (DSC) ............................................ 20

Page 7 of 65
2.7.6 Dynamic Mechanical Analysis (DMA) ................................................. 21
3 MATERIALS AND METHODS ...................................................................... 21
3.1 Materials ................................................................................................... 21
3.1.1 Food Simulants................................................................................... 21
3.1.2 Packaging Materials ........................................................................... 22
3.2 Method ...................................................................................................... 23
3.2.1 Pre Experiment ................................................................................... 23
3.2.2 Main Experiment ................................................................................. 23
3.2.3 Plasticizing Experiment ...................................................................... 24
4 RESULTS AND DISCUSSION ..................................................................... 26
4.1 Pre-Experiment ........................................................................................ 26
4.1.1 Peel Test ............................................................................................ 26
4.1.2 FTIR Measurements ........................................................................... 27
4.1.3 Mode of Failure Study ........................................................................ 28
4.2 Pre-Experiment Conclusion .................................................................... 30
4.3 Main Experiment ...................................................................................... 31
4.3.1 Hydrogen Gas Testing ........................................................................ 31
4.3.2 Peel Test ............................................................................................ 32
4.3.3 FTIR Measurements ........................................................................... 34
4.3.4 Mode of Failure Study ........................................................................ 34
4.4 Main Experiment Conclusion ................................................................. 39
4.5 Plasticizing Effect Experiment ............................................................... 40
4.6 Plasticizing Effect Experiment Conclusion ........................................... 40
4.7 Final Conclusion ...................................................................................... 41
5 ENCLOSURES ............................................................................................. 41
6 REFERENCES .............................................................................................. 41

Page 8 of 65
1 Background
This work was performed in co-operation with Tetra Pak Innovation – Base Materials and Packaging Material Design, and the Centre for analysis and synthesis at Lund University to determine the mechanism of the delamination phenomena.
Tetra Pak delivers food packing services world-wide and uses multilayer packaging materials to protect the food product from being affected by the environment [1].
The packaging material is constructed of the following layers, starting from the outside according to Figure 1.
1. Outer coating protecting from humidity.
2. The printing describing and identifying
the product.
3. Paper board with one smooth printing
side and one strengthening side.
4. Lamination, enabling the adhesion
between the paper board and the
aluminum.
5. Aluminum layer which protects against
oxygen and light.
6. Internal coating one, which offers
adhesion between the aluminum layer
and the inner polymer.
7. Internal coating two, which offers
tightening against the product and enables the sealing of the package [2].
The process of production can be divided into three phases converting the paperboard into packaging material. First the design is printed on the paperboard, which then continues through the creasing tools. The creasing tools create the creases used to fold the packaging material as well as the holes or other opening perforations. Second is the lamination step where first the roll is flame treated where dust is burnt away before the plastic layer is added by extrusion coating. Finally the roll enters the slitter where it is slit into reels and defects are removed [2].
The environmental impact on packaging materials has been well studied as well as the packaging materials impact on the product, while the influence of the product on the packaging materials is much less studied. Interactions from the food on the packaging material can affect the barrier performance and the adhesion between layers, resulting in decreased packaging integrity [3].
Figure 1: Construction of the 7 layer
packaging material.

Page 9 of 65
1.1 The Problem
Carboxylic acids, present in food products, have been shown to affect the adhesion between the polymer and aluminum foil. Some carboxylic acids have shown to be able to penetrate the polymer and cause delamination at the polymer-aluminum interface [3][4][5]. Two possible hypotheses have been presented:
1. The carboxylic acid will replace the polymer molecule at the interface active sites
and cause delamination of the interface.
2. The carboxylic acid plasticises the polymer at the interface and cause
delamination by having the adhered polymer molecule detached from the
polymer matrix.
1.2 Objectives
The main focus in this project was to determine which (if any) of the hypotheses that is correct, or if both are valid. Further, a study was conducted to investigate the correlation between the mechanical properties of the polymer and the carboxylic acid structure as a function of time and end concentration.
1.3 Delimitations
Due to the lack of research in this area this study aimed at developing the fundamentals that futher work can be based on. The study was mainly focused on the polymer; low density Polyethylene (LDPE), the adhesive co-polymer; Ethylene-acrylic acid (EAA) and the basic carboxylic acid; acetic acid.
2 Literature Study
2.1 Packaging Materials
The packaging material in this thesis is defined as the three inner layers closest to the product, shown in Figure 2. These are the polymer closest to the product followed by an adhesive layer to improve the adhesion to the Al-foil which is the outer layer in this set up.
2.1.1 Polyethylene (PE)
PE is a polymer produced by the polymerization of the monomer ethylene, shown in Figure 3 [6]. Depending on the chain structure (branching and length) which affects the density, PE is categorized into high-density (HD(PE)) with densities ranging at 0.945-0.96 g cm-3 [7], low-density (LD(PE)) with densities ranging at 0.15-0.94 g cm-3 [7] and
Figure 2: The three layers
closest to the food product
defined as the packaging
material.

Page 10 of 65
linear low-density (LLD(PE)) or very LDPE (VLDPE) ranging from 0.900-0.935 g cm-3
[6][7][8].
All PEs are semi-crystalline [6][7] having amorphous bulk areas where the polymer chains can move and create voids in between them as well as crystalline areas with dense structures which are impregnable [10]. They are also thermoplastics, melting at high temperatures, and most of them are branched, making them flexible and resulting in a decreasing density and melting temperature with increased degree of branching [7].
The PE layer provides good chemical stability, and its mechanical properties depend on molecular weight and degree of chain branching. LDPE is tough and highly elastic, possess good resistance to cold and water vapour and is easily heat sealed. The barrier properties and crystallinity increases with increased density which in turn increases its strength, stiffness and hardness but cause a decrease in toughness and resistance to impact, stress, cracking, cold and decrease the transparency [6][7].
2.1.1.1 Low-density Polyethylene (LDPE)
A LDPE with a density of 0.92 g cm-3 has a number average molecular weight in the span of 10 000<Mn<40 000 [7]. The crystalline melting temperature (Tc) is typically 108°C [7], the rubber plateau stretches from 80 to 130°C and the glass transition state (Tg) is in the region of -80 to -30°C [7]. LDPEs low density results in low barrier properties towards fats, aromas and gases [7].
Low molecular weight materials with similar solubility parameters will cause swelling, especially in low density polymers [7]. Structural changes due to oxidation may occur at 50°C [7].
PEs chemical stability is unaffected by mineral acids and alkanes. PE is oxidized by nitric acid and halogens will react with PE through substitution mechanisms[7].
2.1.2 LDPE Adhesion and Adhesives
The adhesion of pure LDPE to the aluminum foil is improved by thermal oxidation in the extrusion station increasing the precens of polar groups to the polymer surface [5][7].
The oxidised polyethylene surface contains mainly hydroxyl (R-O-H), carbonyl (R-(C=O)-H) and carboxylic acid (R−C(O)OH) groups, whereas ester groups are rather rare. This greatly increases the adhesion to other materials since the carbonyl and ester oxide acts as Lewis bases and the hydroxyl groups as Lewis acids [5].
To further improve the polymers adhesion to the aluminum foil, co-polymerisation of the polymer and groups with acid or acidic functionality can be used. Vinyl acetate (VA), Ethylene-acrylic acid (EAA) and ethylene-methacrylic acid (EMAA) are some of the most commonly used, where the latter two being the most common for adhesion to aluminum [5][7].
The co-polymer also shows an increased resistance to cold, higher transparency as well as heat sealability and seal strength [5][7].
Figure 3: The
monomer ethylene.

Page 11 of 65
The adhesion is further increased by ozone treatment in the lamination station which reduce the surface crystallinity, breaks C-C and C-H bonds and increases the number of polar groups on both sides of the polymer melts [5].
2.1.2.1 Ethylene Acrylic Acid (EAA) Co-Polymer.
It is possible to add acrylic acid or methacrylic acid to the polymerisation reaction of the ethylene monomers as shown in Figure 4. This adds polar functionality, decreases the melting point and crystallinity, all without affecting the thermal stability [5].
The adhesive has the same chemical interactions with the Al-foil as the oxidised polyethylene surface but with a higher quantity of carboxylic acid groups providing the strongest bonds to the Al-foil. The high content of carboxylic acids can also make them form dimers as shown in Figure 5 These can donate electrons to the Al, further improving the bond [5].
2.1.3 Aluminum Foil
The Al-foil is usually 6-9 µm thick and provides an oxygen, light and odour barrier as well as conductivity which enables sealing by induction heating (IH) [2].
Al will, when in contact with oxygen, immediately form an aluminum oxide layer (Al-O-Al-O) dominating the surface, but also hydroxyl groups may occur and can be increased by plasma treatment. The aluminum in the aluminum oxide can accept electrons acting as a Lewis acid as well as the hydroxyl groups. At the same time the oxide in the Al oxide can donate electrons acting as a Lewis base, making the Al-oxide surfaces amphoteric with both basic and acidic sites, se Figure 6 [5].
Figure 4: LDPE
based acid co-
polymer EAA
Figure 5: Bonding mechanism of
an acid co-polymer forming a
dimer with the aluminum.

Page 12 of 65
Figure 6: Acid-base interactions between LDPE and the Al-foil due to the amphoteric
surface.
2.2 Adhesion Mechanism
Adhesion can be described as the interaction between two different materials across an interface. The interactions can consist of either physical or chemical bonds (or both). There is no universal mechanism of adhesion. Instead different mechanisms represent different applications/phenomena. Adhesion due to chemical bonding is described by the adsorption mechanism and is the most widely accepted theory of adhesion. Physical interactions can be described by either the diffusion mechanism, the mechanical interlocking mechanism or the electrostatic mechanism and have varying impact on different systems [4][11][12].
2.2.1 Adsorption Mechanism
The adsorption mechanism explains the adhesion that takes place at a well defined interface betwean two materials in direct contact with each other. The reach of the chemical interactions is very short. This makes contact and wettability of the materials very important [4][11][12].
The interactions are classified as Lifshitz-van der Waals including the purely physical London (dispersion), Keesom (polar) and Debye (induced polar) interactions, with interaction energies of approximately 0.1 to 10 kJ/mol. Polar forces from the bulk are considered to be self-cancelling and viewed as small. In addition to the Lifshitz-van der Waals interactions, Lewis acid-base sites may be present and give rise to acid-base complexes including hydrogen bonds, with interaction energies of approximately 10 to 25 kJ/mol. Nevertheless, Lifshitz-van der Waals interactions are proven to in large amounts add up to a great collective force, although having lower interaction energies [12].
2.2.2 Diffusion Mechanism
This model originates from solubility on a molecular level. Different types of molecules have different affinities to each other. Allowing materials to dissolve and diffuse into a substrate material creates a diffusion interphase or interdiffusion layer [11][12].

Page 13 of 65
For polymers of mutual compatibility, and with similar solubility parameters, the diffusion mechanism is the prime mechanism of adhesion and interdiffusion. The interdiffusional layers can reach thicknesses up to 10 µm. However, polymeric adhesives normally have limited compatibility with substrate molecules, which leads to very thin interdiffusion layers of about 0.5 to 10 nm [11].
2.2.3 Mechanical Interlocking Mechanism
This theory is based on the adhesion occurring due to surface irregularities in the interlocking materials. Rough and porous materials hold cavities where the adhesive can penetrate and form hooks upon solidification, resulting in high joint strength even without intermolecular forces [11][12].
Although interlocking is poorly adapted to smooth metallic surfaces, roughness may increase the energy dissipation in the adhesive during joint failure as well as the contact area, increasing the amount of intermolecular forces [12].
2.2.4 Electrostatic Mechanism
Materials with different electronegativity may give rise to electrostatic forces at the interface, created by the transfer of electrons between the two different energy levels of the materials. This results in the two surfaces being attached as a result of the opposite charges [11][12]. This theory is mainly applicable to systems that are ionized [4].
2.3 Modes of Failure
The construction of the multi-layer packaging material gives way for a number of possible adhesion failures, and to be able to determine the weakest link of the material these have to be defined and explained. Note that these definitions are based on an ideal fracture and the true results will differ [12].
Cohesive failure in the LDPE (Figure 7) indicates the LDPE-LDPE interactions to be the weakest, resulting in fracture in the LDPE thus leaving residues of LDPE on the adhesive
[12].
Apparent adhesive failure at the LDPE/adhesive interface (Figure 8) indicates the LDPE-adehsive interactions to be the weakest, resulting in a clean fracture in the LDPE-EAA interface thus leaving small to no residues of the adhesive on the LDPE [12].
Cohesive failure in the adhesive (Figure 9) indicates the adehesive-adehsive interactions to be the weakest, resulting in a fracture in the adhesive interphase thus
Figure 7:
Cohesive
failure in
LDPE.
Figure 8:
Apparent
adhesive
failure at the
LDPE/adhesiv
e interface.
Figure 9:
Cohesive
failure in the
adhesive.
Figure 10:
Apparent
adhesive
failure at the
adhesive/Al
interface.
Page 14 of 65
leaving residues of the adhesive on the LDPE as well as on the Al-foil [12].
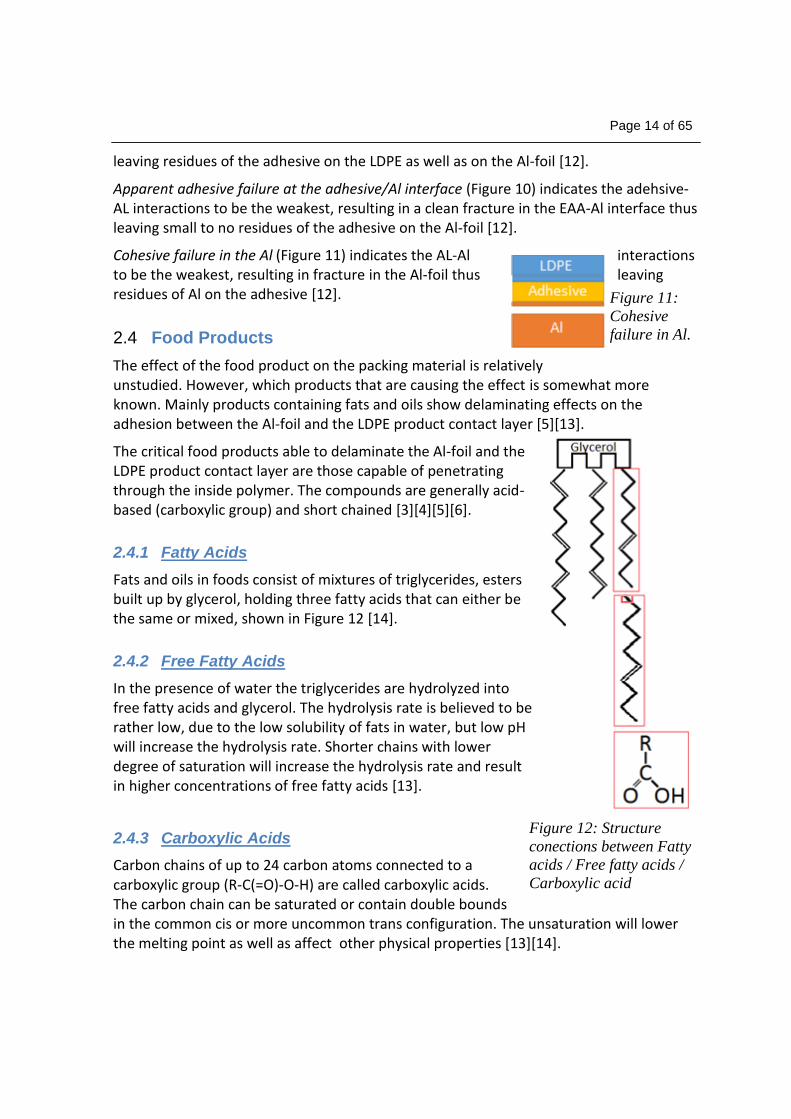
Apparent adhesive failure at the adhesive/Al interface (Figure 10) indicates the adehsive-AL interactions to be the weakest, resulting in a clean fracture in the EAA-Al interface thus leaving small to no residues of the adhesive on the Al-foil [12].
Cohesive failure in the Al (Figure 11) indicates the AL-Al interactions to be the weakest, resulting in fracture in the Al-foil thus leaving residues of Al on the adhesive [12].
2.4 Food Products
The effect of the food product on the packing material is relatively unstudied. However, which products that are causing the effect is somewhat more known. Mainly products containing fats and oils show delaminating effects on the adhesion between the Al-foil and the LDPE product contact layer [5][13].
The critical food products able to delaminate the Al-foil and the LDPE product contact layer are those capable of penetrating through the inside polymer. The compounds are generally acid-based (carboxylic group) and short chained [3][4][5][6].
2.4.1 Fatty Acids
Fats and oils in foods consist of mixtures of triglycerides, esters built up by glycerol, holding three fatty acids that can either be the same or mixed, shown in Figure 12 [14].
2.4.2 Free Fatty Acids
In the presence of water the triglycerides are hydrolyzed into free fatty acids and glycerol. The hydrolysis rate is believed to be rather low, due to the low solubility of fats in water, but low pH will increase the hydrolysis rate. Shorter chains with lower degree of saturation will increase the hydrolysis rate and result in higher concentrations of free fatty acids [13].
2.4.3 Carboxylic Acids
Carbon chains of up to 24 carbon atoms connected to a carboxylic group (R-C(=O)-O-H) are called carboxylic acids. The carbon chain can be saturated or contain double bounds in the common cis or more uncommon trans configuration. The unsaturation will lower the melting point as well as affect other physical properties [13][14].
Figure 12: Structure
conections between Fatty
acids / Free fatty acids /
Carboxylic acid
Figure 11:
Cohesive
failure in Al.
Page 15 of 65
2.5 Penetration of the Polymer
The way a molecule penetrates a polymer is highly dependent on the barrier properties which makes it case-specific. It depends on polymer properties such as density, solubility, morphology, cross-linking and film thickness as well as on the nature of penetrate solubility, concentrations and partial pressure of gases. A molecule is said to penetrate a polymer in a three-step mechanism [9]:
1. Adsorption: the solution or sorption of the penetrate onto the surface of the
polymer
2. Diffusion: migration of the penetrate through the polymer
3. Desorption: desorption of the penetrate on the opposite side of the polymer film
The first and third step is mainly driven by the solubility of the penetrant in the polymer. The second step depends on two factors; the morphology of the penetrating molecule compared to the free space of the polymer and secondly the mobility of said molecule [4].
2.5.1 Sorption and Solubility
Sorption is the mass transport from in this case the food product in to the packaging material and includes both adsorption at the surface of the polymer as well as the dissolution of the component in the polymer matrix.
There are three types of sorptions classified on the basis of the relative interaction strength between the polymer and penetrate molecules (polymer/penetrate), and the interaction between the molecules in the polymer themselves (polymer/polymer), as well as the interactions in the penetrate molecules themselves (penetrate/penetrate) [4].
2.5.1.1 Henry´s law sorption
This type of sorption occurs when the polymer/polymer interactions are strongest in comparison to polymer/penetrate and penetrate/penetrate. This refers to ideal or diluted solutions that follows Henry’s Law (Eq. 1). The solubility coefficient, S, is independent of concentration at a fixed temperature [4].
pSC (Eq. 1)
where C is the concentration and p is pressure.
This type of sorption is normally observed for sorption of inert gases in rubbery polymers and gives a linear sorption isotherm [4].
2.5.1.2 Langmuir-type Sorption
This sorption mechanism is based on that the penetrate is filling and accumulating in the microvoids at the polymer surface. When all the microvoids are filled, small amounts of the penetrant will start to dissolve into the polymer. This type of sorption occurs mainly
Page 16 of 65
when most part of the sorption occurs at low pressure and is common for gases or vapours penetrating polymers with porous fillers [4].
2.5.1.3 Dual-mode Sorption
This sorption is a combination of the two mentioned cases. A part of the penetrate is dissolved according to Henry´s Law, and diffusing according to the gradient. The remaining part fills the fixed number of microvoids in the polymer and follows the Langmuir type sorption. It is used for the penetration of gases such as hydrocarbon vapours in glassy polymers [4].
2.5.1.4 Factors Affecting Sorption.
As mentioned, adsorption, solution and desorption of the penetrate in the polymer mainly depends on the solubility. The amount of penetrants that can be dissolved is determined by the polarity of the penetrate and the polymer. Polar penetrants dissolve in polar polymers, where the interactions can be due to hydrogen bonds or be of ionic character. Non-polar penetrants dissolve in non-polar polymers where interactions are mainly van der Waals forces which will increase with the number of molecular interactions and thus the solubility increases with increased chain length and penetrantsize [1].
In addition to this, sorption is temperature dependent and in correlation with Henry´s law sorption follows the Van´t Hoff-Arrhenius equation presented as Eq. 2 [4][9].
)(
0)( RT
HS
eSTS
(Eq. 2)
where ΔHS is molar heat of sorption, R is the universal gas constant, T the temperature and S is the amount of gas per unit volume of polymer in equilibrium with a unit partial pressure according to Henry’s law: C=Sp where C is the concentration and p is pressure [4][9].
Furthermore, solubility is dependent of the free space of the polymer which is generated by the movements of the polymer chain. Thereby, properties that decreases the mobility of the chains such as crystallinity and cross-linking also decreases the solubility [4][9].
2.5.1.5 Sorption Kinetics
The mass transport of the penetrant into the polymer may affect the morphology of the polymer, depending on the relative mobility of the penetrant and the polymer segments according to equation 3:
n
E
t ktM
M (Eq. 3)
where Mt is the mass sorbed at time t, ME is the mass sorbed at equilibrium, k is a constant and n varies with mode of sorption. The variable n will define the behaviour of the sorption [4].

Page 17 of 65
n=1/2 indicates Fickian sorption meaning that Fickian diffusion is obeyed and the polymer chains mobility is much greater than the penetrants rate of diffusion making the sorption independent of swelling [4].
n=1 indicates Case sorption. The diffusion is much faster than segment mobility and sorption will be sorption kinetics dependent. This is common when the penetrant is an organic liquid. If the sorptive power of the polymer is high in comparison to that of the penetrate it will cause the penetrant to accumulate in the polymer causing it to swell [4][9].
1/2<n<1 indecates Non-Fickian sorption. Permeant mobility and polymer relaxation rates are similar and sorptional equilibrium is quickly established making the penetration mainly diffusion dependent [4][9].
2.5.2 Diffusion
The concentration gradient is the driving force of the diffusion, causing molecules to diffuse from high to low concentration. The diffusion rate of transfer per unit area is defined by Fick´s first law (Eq. 4) and proportional to the concentration.
dx
dCDF (Eq. 4)
F is the flux or rate of transfer, D is the diffusion coefficient, C is the concentration of the penetrant, and x the length in which the transport occurs. If diffusion is considered to only occur in one direction, and the diffusion coefficient is considered constant, Fick´s second law of diffusion can be derived (Eq. 5):
2
2
dx
CdD
dt
dC (Eq.5)
where dC/dt is the variation of the concentration in time and D is the diffusion coefficient. For water and organic vapours D is considered concentration dependent [4][9].
2.5.2.1 Factors Affecting Diffusion.
The theory often used to describe diffusion in polymers is called the hole theory and advocates that the penetrate moves in the void between the moving polymer chains. According to the theory the diffusion rate decreases with increasing degree of crystallinity, crosslinking and molecular orientation of the polymer. This is due to that crystalline regions do not hold any voids and is therefore impervious. The diffusion of the molecule depends mainly on two factors, first the size and shape of the penetrating molecule in comparison to the free space of the polymer, and second the mobility of said molecule in the polymer network. Small linear molecules have a higher rate of diffusion than large, spherical ones with bulky side chains [4][9].
Also the diffusion rate is temperature dependent and follows the Van´t Hoff-Arrhenius equation (Eq. 6) [4][9].

Page 18 of 65
)(
0)( RT
Ed
eDTD
(Eq. 6)
where Ed is molar heat of sorption, D is the diffusion coefficient, R is the universal gas constant and T the temperature [4][9]. Increase in temperature will increase the mobility of the polymer chains thus opening up more voids between them more frequently and allowing the penetrate a faster passage through.
2.5.3 Permeation
To handle various initial and boundary conditions the product of the diffusion and solubility coefficients is defined as the permeation coefficient (Eq. 7):
SDP (Eq. 7)
where S is the solubility coefficient which represents the dissolution and is a measure of the amount a given polymer can absorb, D is the diffusion coefficient which represents the movement of the penetrate inside the polymer and is a measure of how fast the penetrate moves into the polymer and P is the permeability coefficient which is the permeation of penetrate molecules through the polymer [4][9].
Since both the solubility and the diffusion are temperature dependent according to the Van´t Hoff-Arrhenius equation so is the permeability (Eq. 8):
)(
0)( RT
HS
eSTS
(Eq. 2)
)(
0)( RT
Ed
eDTD
(Eq. 6)
)(
0)( RT
Ep
ePTP
(Eq. 8)
where ΔHS is the molar heat of sorption, Ed is the activation energy of diffusion, Ep is the apparent activation energy of permeation, R is the universal gas constant and T the temperature. S is the amount of gas per unit volume of polymer in equilibrium with a unit partial pressure according to Henrys law: C=Sp were C is the concentration and p is the pressure [4][9].
2.6 Delamination
Despite delamination being a great problem in the packaging industry, few studies has been performed to explain the mechanism behind the phenomena.
The only mechanism for delamination found in the area was presented by Grimur Olafsson in 1995 [4] and uses the system of LDPE and 3% acetic acid.
It is generally agreed that only molecules able to penetrate the polymer may cause delamination. Olafsson concludes that the absorption of the polar acetic acid and water should be low in the nonpolar polymer. The diffusion through the polymer should be
Page 19 of 65
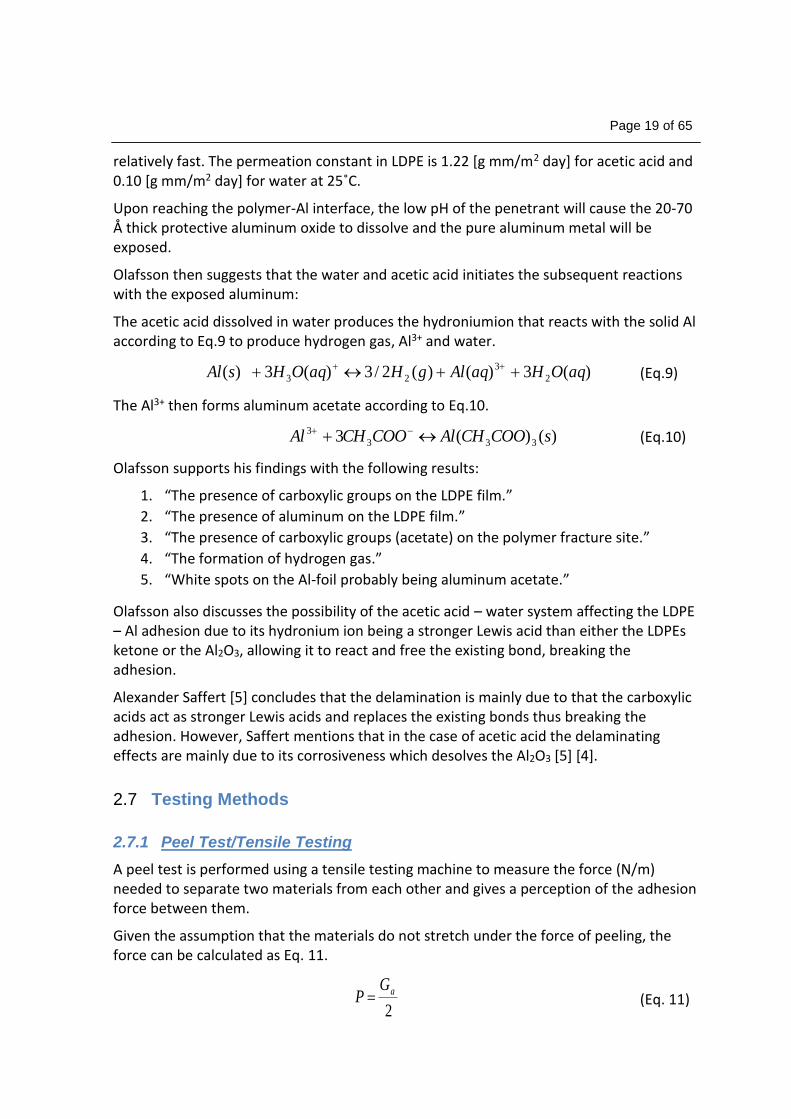
relatively fast. The permeation constant in LDPE is 1.22 [g mm/m2 day] for acetic acid and 0.10 [g mm/m2 day] for water at 25˚C.
Upon reaching the polymer-Al interface, the low pH of the penetrant will cause the 20-70 Å thick protective aluminum oxide to dissolve and the pure aluminum metal will be exposed.
Olafsson then suggests that the water and acetic acid initiates the subsequent reactions with the exposed aluminum:
The acetic acid dissolved in water produces the hydroniumion that reacts with the solid Al according to Eq.9 to produce hydrogen gas, Al3+ and water.
)(3)()(2/3)(3)( 2
3
23 aqOHaqAlgHaqOHsAl (Eq.9)
The Al3+ then forms aluminum acetate according to Eq.10.
)()(3 333
3 sCOOCHAlCOOCHAl (Eq.10)
Olafsson supports his findings with the following results:
1. “The presence of carboxylic groups on the LDPE film.”
2. “The presence of aluminum on the LDPE film.”
3. “The presence of carboxylic groups (acetate) on the polymer fracture site.”
4. “The formation of hydrogen gas.”
5. “White spots on the Al-foil probably being aluminum acetate.”
Olafsson also discusses the possibility of the acetic acid – water system affecting the LDPE – Al adhesion due to its hydronium ion being a stronger Lewis acid than either the LDPEs ketone or the Al2O3, allowing it to react and free the existing bond, breaking the adhesion.
Alexander Saffert [5] concludes that the delamination is mainly due to that the carboxylic acids act as stronger Lewis acids and replaces the existing bonds thus breaking the adhesion. However, Saffert mentions that in the case of acetic acid the delaminating effects are mainly due to its corrosiveness which desolves the Al2O3 [5] [4].
2.7 Testing Methods
2.7.1 Peel Test/Tensile Testing
A peel test is performed using a tensile testing machine to measure the force (N/m) needed to separate two materials from each other and gives a perception of the adhesion force between them.
Given the assumption that the materials do not stretch under the force of peeling, the force can be calculated as Eq. 11.
2
aGP (Eq. 11)

Page 20 of 65
where Ga denotes the work of detachment per unit area of interface
To conduct a measurement using an Instron 5565, the sample is first partially peeled, separating the polymer from the Al-foil. The Al-foil and packaging is then inserted into a fixed grip and the polymer into a grip connected to a crosshead. After the application of the sample the measurement is started and the crosshead is driven in the tensile direction causing the polymer to peel of the Al-foil. The force required to peel the polymer is monitored by the loading weighing system providing the measurement of the force.
2.7.2 Fourier Transform Infrared Spectroscopy (FTIR)
FTIR is used to obtain an infrared spectrum of the adsorption from the sample. This spectrum can later be analysed to determine the surface composition of the sample such as functional groups and their environment.
The sample is placed in contact with a crystal with high reflective index. An infrared beam of multiple frequencies of light is fired at the sample. The different frequencies corresponds to different chemical bonds in the functional groups and will be absorbed as vibration energy by these bonds. The amount of absorbed light at different frequencies is measured to obtain the spectra and the groups can be identified.
2.7.2.1 Attenuated Total Reflection (ATR)
ATR is used for FTIR analysis on soft samples with relatively low reflex index and is considered a powerful tool for the characterizing of the a couple of microns of analysis depth of polymers.
2.7.3 Scanning Electron Microscopy (SEM)
SEM is used to obtain high resolution (20-25 Å) images of the fracture surface topography. These can be studied to determine the origin of the failure as well as the mode of failure.
The sample is scanned with a focused beam of electrons that interacts with the surfaces atoms in the sample, causing secondary electrons to be emitted by the atoms excited state and measured by the equipment.
2.7.4 LeakDetective
LeakDetective is used to detect gas leakes in systems by mesuring changes in heat transfer capacity and is also able to identify the precent of gases in the system.
2.7.5 Differential Scanning Calorimetry (DSC)
DSC is used to measure multiple polymer characteristics such as crystallinity and its distribution, melt temperature and its intervals, cross linking and Tg, which all affect the behavior of the polymer.

Page 21 of 65
The crystallinity is calculated according to equation 12:
%100*0
m
CCm
CH
HHx
(Eq. 12)
where ΔHm is the enthalpy of fusion during melting, ΔHcc is the heat released during cold crystallization and ΔHm
0 is the heat of melting for 100% crystalline polymer.
The amount of absorbed food simulant by the polymer is calculated by comparing the specific heat capacity of the reference and the samples according to equation 13.
𝐶𝑝𝑠𝑎𝑚𝑝𝑙𝑒 ∗ 𝑚𝑠𝑎𝑚𝑝𝑙𝑒 = 𝐶𝑝𝑝𝑜𝑙𝑦𝑚𝑒𝑟 ∗ 𝑚𝑝𝑜𝑙𝑦𝑚𝑒𝑟 + 𝐶𝑝𝑠𝑖𝑚𝑢𝑙𝑎𝑛𝑡 ∗ 𝑚𝑠𝑖𝑚𝑢𝑙𝑎𝑛𝑡 (Eq. 13)
A pan containing the polymer and an empty reference pan is placed in a heating block. The heating block measures individually the energy needed to heat each pan at the same rate, detecting phase changes as a local change in energy need.
2.7.6 Dynamic Mechanical Analysis (DMA)
Viscoelastic properties (eg. stiffness) are analyzed and the phase transitions values Tm and Tg can be obtained using this technique.
The stress and strain acquired from the analysis is described by equation 14 and 15:
𝜎∗ = 𝜎0exp(𝑖𝜔𝑡) (Eq. 14)
𝜀∗ = 𝜀0exp(𝑖𝜔𝑡) (Eq. 15)
where σ0 is the maximum strain and ε0 the maximum stress. The time dependence generates the following equation.
𝜎∗ = 𝜀∗𝐸∗(𝜔) (Eq. 16)
𝐸∗(𝜔) = 𝐸,(𝜔) + 𝑖𝐸,,(𝜔) (Eq. 17)
where E’(ω) is the storage modulus representing the stored energy in the material and is the real part in phase with strain. E’’(ω) is the loss modulus representing the energy dissipated by the material and is the component that is 90⁰ out of phase with the strain.
3 Materials and Methods
3.1 Materials
3.1.1 Food Simulants
The test solutions were prepared using acetic acid (>99.8% from SIGMA-ALDRICH), ethanol (a) (95% named “FINSPRIT 95% EA50” from Kemetyl AB), ethanol (b) (95% with 20 g MEK named “Etanol 95% Denaturerad med 20 g MEK” from Solveco) and distilled water.

Page 22 of 65
Table 1: Composition of the Food simulants used in the experiments presented in vol%.
Sample Acetic acid Water Ethanol
Simulant1
(Water)
3%
97%
0
Simulant2
(Mix(a))
3%
51%
46%(a)
Simulant3
(Mix(b))
3%
22%
75.0%(b)
Simulant4
(Ethanol(a))
3%
4.85%
92.15%(a)
Simulant5
(Ethanol(b))
3%
4.85%
92.15%(b)
Simulant6
Pure Water
0 100%
0
Simulant7
Pure Mix(b)
0 25%
75.0%(b)
Simulant8
Pure Ethanol(b)
0 5% 95%(b)
3.1.2 Packaging Materials
The three packaging materials were provided by Tetra Pak.
1. The “Pre Experiment” packaging material consisted of 19 gsm LDPE, 6 gsm
adhesive and Al foil with a thickness of 6.3 µm. Layers of paper/cardboard with
creases were included to protect the sample material.
2. The “Main Experiment” packaging material consisted of 19 gsm LDPE, 6 gsm EAA-
copolymer as adhesive and Al foil with a thickness of 6.3 µm. A layer of
paper/cardboard was included to protect the sample material. The production
speed was approximately 200 m/min.
3. The “Plasticizing Experiment” material consisted of 19 gsm LDPE, 6 gsm EAA-
copolymer as adhesive on a biaxially oriented PET film placed as a partition from
the Al foil and remaining material. The production speed was approximately 75
m/min.

Page 23 of 65
3.2 Method
3.2.1 Pre Experiment
The Pre Experiment was conducted to study the long exposure time and examine the behaviour of the experiment to identify possible problems so as to be able to solve these before the Main Experiment.
3.2.1.1 Test Setup
The “Pre Experiment” packaging material was cut into sheets, approximately 20*30 cm, and folded into envelopes (20*15 cm). The longitudinal side was heat sealed (sealing temperature 270 ⁰C, sealing time 5 s, cooling time 5 s) and the two remaining sides were IH-sealed.
Before sealing the final side, ca 150 ml of food product (using either Simulant1, Simulant2 or Simulant4) was poured into each envelope, and was evenly pressured so that a small amount of the food product spilled out upon sealing, minimising the amount of air in the envelope and increasing the contact between the simulant and the material.
The filled envelopes were stored in a draw bench at room temperature.
3.2.1.2 Delamination Testing
Peel testing was performed on each sample to determine the degree of delamination. About 16 strips (1.5*10 cm) were taken from each sample and tested using a constant peeling speed of 200mm/min at an 180 degree angle. It was assumed that the effect of the food product could continue until the peel test was performed, thus the peel test marked the end of the reaction time.
3.2.1.3 FTIR Measurements
FTIR scanning was performed to determine the surface composition. The LDPE side was scanned 5 times and the Al side 32 times for better resolution.
3.2.1.4 Module of Failure Study
A small quantity of the testing strips were examined using an optical microscope to examine and determine the mode of failure.
3.2.2 Main Experiment
The main experiment was conducted to determine the probability of the Al-water system delaminating according to hypothesis 1. The experiment was conducted to obtain a clearer view of the delamination with more frekvent test points. The following outcomes were anticipated and were to be investigated:
Loss of adhesion due to delamination (3-4 days).
Changes in the mode of failure.
Presence of participating elements on both sides of the fracture site.
Page 24 of 65
The recovery of adhesion due to salt formation.
Formation of hydrogen gas.
3.2.2.1 Test Setup
The “Main Experiment” packaging material was cut into sheets, approximately 20*30 cm, and folded into envelopes (20*15 cm). The longitudinal side was heat sealed (sealing temperature 270 ⁰C, sealing time 5 s, cooling time 5 s) and the two remaining sides were IH-sealed.
Before sealing the final side, ca 150 ml of food product (using either Simulant1, Simulant3 or Simulant5) was poured into each envelope and two metal plates were used to evenly pressure the envelopes so that a small amount of the food product spilled out upon sealing, minimising the amount of air in the envelope and increasing the contact between the simulant and the material.
The envelopes were later stored in a draw bench at room temperature.
3.2.2.2 Hydrogen Gas Testing
Prior to opening the final envelopes, a gas sample was taken by puncturing the envelope and inserting the LeakDetecktive to detect the precense of Hydrogen. The samples were tested to determine if formation of hydrogen gas had occurred.
3.2.2.3 Delamination Testing
Peel testing was conducted on each sample to determine the degree of delamination. A total of 10 strips (1.5*15 cm) were taken from each sample and tested using a constant peeling speed of 200mm/min at an 180 degree angle. The peel test marked the end of the reaction time.
3.2.2.4 FTIR Measurements
Some of the strips obtained during the peel testing were scanned with FTIR. The LDPE side was scanned 5 times and the Al side 32 times for better resolution.
3.2.2.5 Mode of Failure Study
Some of the testing strips were examined using an optical microscope to examine and determine the mode of failure.
A small quantity of the Al strips were studied using SEM to further examine and determine the module of failure as well as provide additional clarity into the composition of the fractured surface.
3.2.3 Plasticizing Experiment
This experiment was conducted to determine the amount of food simulant absorbed into the packaging material and its plasticizing effect as a function of time. Results are

Page 25 of 65
believed to show if this phenomena may cause delamination or to what degree it contributes to it.
3.2.3.1 Preparation of Packaging Material
Samples for the DSC were prepared by cutting the “Plasticizing Experiment” material into 1.5 cm strips and remove the polyester film.
Samples for the DMA were prepared by placing the “Plasticizing Experiment” material into plastic folders for easy handling. Samples were then stamped into (6.3*80 mm) strips using a DMA Q800 Stanspress from Elastocon.
3.2.3.2 Test Setup
The LDPE strips were separated from the remains of the plastic folder and placed into test tubes. The test tubes were then filled to between 66 and 75% with food simulant (using either Simulant1, Simulant3, Simulant5, Simulant6, Simulant7 or Simulant8) and sealed with a cork.
Four reference tubes were also prepared; one containing only packaging material and one of each containing Simulant1, Simulant3 and Simulant5, with no packaging material. All tubes were then put into a test tube rack and stored in a draw bench.
3.2.3.3 Sorption of Acetic Acid Testing
The amount of absorbed acetic acid was measured using DSC according to testing parameters in appendix 1 Testing Parameters and calculated according to equations 13 in section “2.12 Differential scanning calometry (DSC)”. Each sample point was tested once.
3.2.3.4 Polymer Plasticizing Testing
Changes in the module and viscoelastic properties were tested using DMA according to testing parameters in appendix 1 Testing Parameters. Sampling was conducted when the DSC results indicated that the LDPE strips were saturated, this to represent the maximal degree of plasticification possible.
Each sample point was tested so that three measurements did not differ more than 5% from each other.
3.2.3.5 Tensile Testing
To obtain data comparable to the Main test and study the extension of the plasticized packaging material, tensile testing was conducted on the unused samples using the Instron with the same parameters as in the peel testing.

Page 26 of 65
4 RESULTS AND DISCUSSION
4.1 Pre-Experiment
The samples from the pre-experiment were studied using peel test to determine the peel strength, which correlates with the delamination. The samples were then scanned on both sides using FTIR to determine the surface groups and the presence of residues from the opposite layer. Finally the aluminum strips’ cross sections were studied using microscopy to further validate the mode of failure.
4.1.1 Peel Test
The result from the pre-experiment’s peel testing is presented in Figure 13. The samples showed small changes during the first week, followed by drastic changes in Simulant 1 and 2. Simulant 4 showed an unexpected increase in peel strength throughout the experiment. Further, the results indicate that the ETOH has some effect on the polymer by increasing its elasticity and being able to absorb to the sample in such a degree in the first 24h that visible effects is noted at the first measuring point.
Figure 13: Results from the peel testing of the pre-experiment for all three stimulants with
standard deviation as error bars.
4.1.1.1 Simulant 1
This simulant which contained 3% acetic acid in water prove to have the greatest delaminating effect. The peel force was unaffected the first week and decreased rapidly over the weekend to the second week. The peel force continued to slowly decrease until levelling out at week five to six.
4.1.1.2 Simulant 2
This simulant which contained 3% acetic acid in 50% ETOH showed some unexpected results. The polymer layer of the packaging material continued to become “stiffer” over
0
50
100
150
200
250
300
1 2 3 4 7 14 21 28 35 44
Mea
n L
oad
(N
/m)
Days
Simulant 1(Acetic acid)
Simulant 2 (Acetic 50% ETOH)
Simulant 4 (Acetic 95% ETOH)
Ref

Page 27 of 65
the first week being harder and harder to peel. At the beginning of week two the samples were no longer possible to pre peel to place in the tensile tester without breaking the films making it imposible to messure. After five weeks, the samples behaved just like the samples from simulant 1, showing no extra stiffness and were peeling of easily.
4.1.1.3 Simulant 4
This simulant which contained 3% acetic acid in 95% ETOH, showed a more elastic nature already on the first day. No major changes in its behaviour relating to stiffness were noticed but the results showed a slow but steady increase in peel force, however much lower than for the other simulants.
4.1.2 FTIR Measurements
The results obtained by the FTIR Nicolet 6700 study were evaluated using the Omic spectra program function “analyzing tool” to identify the different peaks and comparing the different results.
4.1.2.1 FTIR Analysis
This part was conducted for both the pre experiment and the main experiment simultaneously and the findings were used for both experiments.
The details of the analysis and findings are presented in appendix 2. Mainly a short explanation of the results are presented below.
4.1.2.2 Simulant 1
The samples taken on day 1, 4, 21 and 44 were scanned on both surfaces and compared.
The results form the LDPE surface shows a decreasing presence of aliphatic hydrocarbons over time as well as a distinct formation of aliphatic carboxylic acid salts from day 21 and forth.
The results form the aluminium surface showed a decreasing presence of aliphatic hydrocarbons. Day 21 and forth show distinct formation of aliphatic carboxylic acid salts and no pressens of aliphatic hydrocarbons.
4.1.2.3 Simulant 2
The samples taken during day 1, 4 and 44 were scanned on both surfaces and compared. The sample from day 21 was not included due to the failed peel test.
The results form the LDPE surface showes a aliphatic carboxylic acids peak believed to indicate the presence of EAA disappearing at day 4. A formation of aliphatic carboxylic acid salts can be seen on day 44.
The results form the aluminium surface indicates a LDPE/EAA layer on the Al day 4. The sample from day 44 show formation of aliphatic carboxylic acid salts.

Page 28 of 65
4.1.2.4 Simulant 4
The samples taken during day 1, 4, 21 and 44 were scanned on both surfaces and compared.
The results form the LDPE surface show no changes on the LDPE surface.
The results form the aluminium surface show a small increase in the aliphatic hydrocarbons over time, indicating an increasing amount of LDPE at the surface.
4.1.3 Mode of Failure Study
Some physical changes to the fracture site visible to the naked eye, and microscopic studies of key samples, provided further knowledge about the mode of failure.
The reference strip was studied both before and after peeling usinga a BX51 Olympus, shown in Figure 14 and 15. This was done to obtain a clear point of reference for the studies of experimental samples.
When compairing the two references, the different layers of the polymer can be determined; the paper board as a thick mass followed by the colourful laminate layer. The aluminum layer appears as a thin black band. The adhesive is darker and thinner than the internal coating LDPE that follows it.
Unfortunately, since the images were only intended to demonstrate the difference between the various fracture site the scale bar has been lost during the process and can not be restored. As a size indication the aluminium is known to be 6-9 µm thick.
Figure 14: Microscopic picture of the reference packaging material’s cross section before
peeling.The scale bar has been lost, but as an indication of size, the aluminium foil is
known to be 6-9µm thick.

Page 29 of 65
Figure 15: Microscopic picture of the reference packaging material’s cross section after
peeling.The scale bar has been lost, but as an indication of size, the aluminium foil is
known to be 6-9µm thick.
4.1.3.1 Simulant 1
Samples from day 44 directly showed slight cloudiness in the polymer and a thin white powder layer on the Al surface, believed to be salt.
Microscopic studies, presented in Figure 16, show a dark layer sometimes thicker than the adhesive covering most of the Al surface. The layer is believed to be salt and is formed at the Al surface indicating an Apparent adhesive failure at the adhesive/Al interface.
Figure 16: Cross section of a peeled strip from the pre-experiment simulant 1 showing the
Al surface after 44 days.The scale bar has been lost, but as an indication of size, the
aluminium foil is known to be 6-9µm thick.
4.1.3.2 Simulant 2
Samples from day 44 directly showed slight cloudiness in the polymer and a thin white powder layer on the Al surface, believed to be salt.
Microscopic studies, presented in Figure 17, show a dark thin layer covering larger parts of the Al surface. The layer is believed to be salt and is formed at the Al surface indicating an Apparent adhesive failure at the adhesive/Al interface.
Page 30 of 65
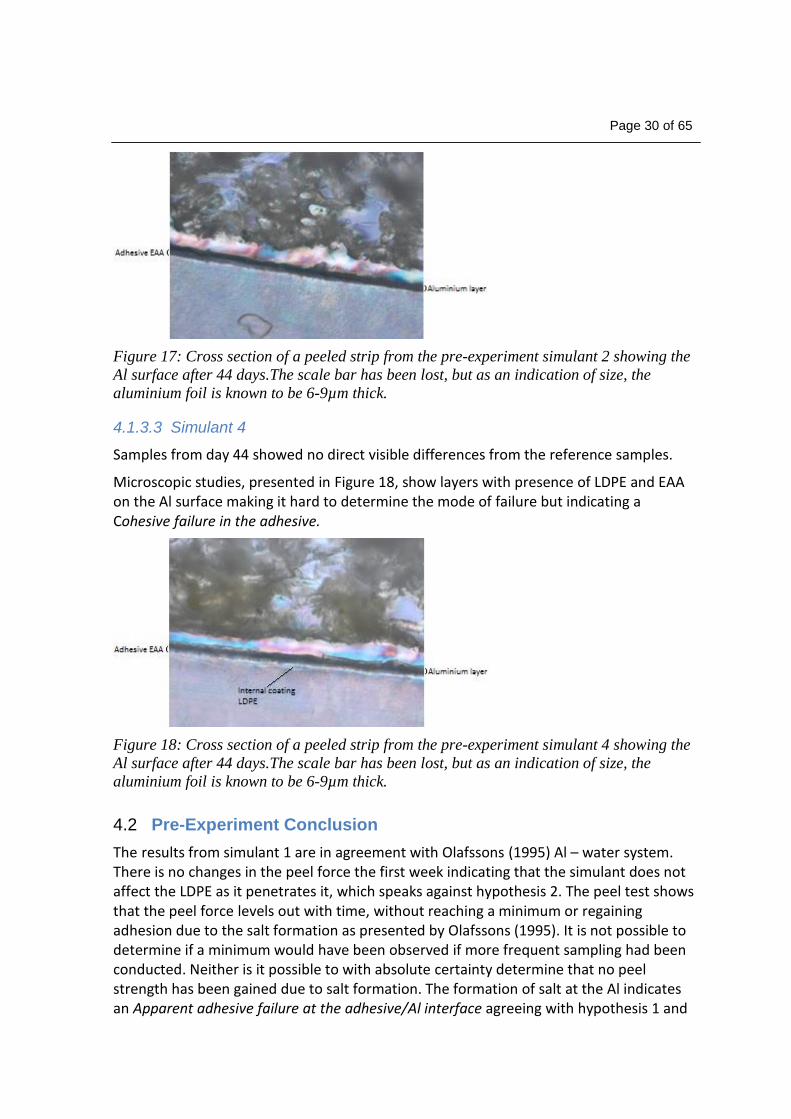
Figure 17: Cross section of a peeled strip from the pre-experiment simulant 2 showing the
Al surface after 44 days.The scale bar has been lost, but as an indication of size, the
aluminium foil is known to be 6-9µm thick.
4.1.3.3 Simulant 4
Samples from day 44 showed no direct visible differences from the reference samples.
Microscopic studies, presented in Figure 18, show layers with presence of LDPE and EAA on the Al surface making it hard to determine the mode of failure but indicating a Cohesive failure in the adhesive.
Figure 18: Cross section of a peeled strip from the pre-experiment simulant 4 showing the
Al surface after 44 days.The scale bar has been lost, but as an indication of size, the
aluminium foil is known to be 6-9µm thick.
4.2 Pre-Experiment Conclusion
The results from simulant 1 are in agreement with Olafssons (1995) Al – water system. There is no changes in the peel force the first week indicating that the simulant does not affect the LDPE as it penetrates it, which speaks against hypothesis 2. The peel test shows that the peel force levels out with time, without reaching a minimum or regaining adhesion due to the salt formation as presented by Olafssons (1995). It is not possible to determine if a minimum would have been observed if more frequent sampling had been conducted. Neither is it possible to with absolute certainty determine that no peel strength has been gained due to salt formation. The formation of salt at the Al indicates an Apparent adhesive failure at the adhesive/Al interface agreeing with hypothesis 1 and

Page 31 of 65
is further supported by the microscopic study. It is however worth to notice that the FTIR measurements show salt formation already on day 21 while the peel result show the lowest value first at day 35, which means that the adhesion continues to decrease even though the salt is present.
The results from simulant 2 show changes the first 24 hours and a continuous increase in peel force the first week indicating that the simulant affects the LDPE as it penetrates it which to some degree agrees with hypothesis 2. The FTIR measurement of the LDPE from day 4 lack a peak corresponding to aliphatic carboxylic acids. According to the literature, carboxylic acids are present in the EAA adhesive, thus, the result indicates an Apparent adhesive failure at the LDPE/adhesive interface. This is further supported by the scan of the Aluminum surface showing clear peaks for the co-polymer. This would further indicate hypothesis 2 to be correct though the peel test does not indicate any loss of adhesion but rather the opposite. As the samples became possible to peel again towards the end of the experiment the results correlates with those of simulant 1 and agree with Olafssons (1995) Al – water system and hypothesis 1.
The results from simulant 4 show changes the first 24 hours but no significant changes the first week. Throughout the rest of the experiment there was a slow increase in peel force. This makes it hard to determine if the system is unchanged which would support the claim of Olafssons (1995) Al – water system, indicating that the presence of water is necessary for the delamination or if the system will have the same behavior as simulant 2 but slower.
4.3 Main Experiment
The samples from the main experiment were studied using peel test to determine the peel strength which correlates with the delamination. The samples were then scanned on both sides using FTIR to determine the surface groups and the presence of residues from the opposite layers. Finally the Al strips cross sections were studied using microscopy to further validate the mode of failure. The final samples were also tested for gas formation using a Leakdetective from Restek Corporation.
4.3.1 Hydrogen Gas Testing
Due to technical problems with the GC which were to be used to analyse the gas formation in the last envelopes containing simulant 1, an alternative method were used. A Leakdetective from Restek Corporation was used to examine the posible formation of hydrogen gas. The Leakdetective uses the same technique as a GC, detecting difference in the thermal conductivity to identify different detectable gases H2, He, N2 or Argon-Methane. The mesurments were conducted by piercing the envelope with a needle and then place the sensor at the puncture.
The result were shown by lights on the display, red lights indicating H2 or He whereas green lights indicates N2 or Argon-Methane.

Page 32 of 65
The Leakdetective were tested on an opened N2 valve prior to testing and showed the right result.
4.3.1.1 Hydrogen Gas Testing Results
The result, as shown in Figure 19, show all red lights flashing indicating a high presence of H2 or He and since there is no He in the sample it can be determined that the gas is H2.
Figure 19: The Leakdetective from Restek Corporation showing a full scale detection of
H2 or He when measuring on the simulant 1 sample from day 36 of the main experiment.
4.3.2 Peel Test
The result from the main experiment’s peel testing is presented in Figure 20. Simulant 1 showed an unexpected increase in peel force the first week followed by a decrease the second week ending in delamination. Some of the peel force was then regained during the remaining experiment time. Stimulant 2 showed a slow increase until sampling was no longer possible. Simulant 3 showed no significant difference throughout the experiment.

Page 33 of 65
Figure 20: Results from the peel testing of the main experiment for all three stimulants.
4.3.2.1 Simulant 1
This simulant which contained 3% acetic acid in water showed a slight increase in peel force reaching its top of 247 N/m on the 4 day of the first week. The first three days of the second week the peel force decreased slowly before dropping drastically on the 10 day and reaching its lowest value of 35 N/m on the 11 day. During the following two weeks some of the peel force was regained before reaching a steady value of approximately 85 N/m.
4.3.2.2 Simulant 3
This simulant which contained 3% acetic acid in 75% ETOH had the lowest starting value of 168 N/m. The peel force slowly continued to increase as the polymer layer of the packaging material proceeded to become “stiffer” until it after day 14 no longer was possible to prepare without braking, thereby reaching its highest measurable value of 233 N/m.
Handling the samples it showed a more rubbery behaviour and the polymer could be stretched further without breaking than the sample from simulant 1 already on the first day just as for the other ETOH based simulants but became stiffer over time.
4.3.2.3 Simulant 5
This simulant which contained 3% acetic acid in 95% ETOH showed a more rubbery behaviour from the first day just as for the other ETOH based simulants. No significant changes in its behaviour relating to stiffness or peel force were observed throughout the experiment.
0
50
100
150
200
250
300
1 2 3 4 7 8 9 10 11 14 17 21 24 28 31 36
Mea
n L
oad
(N
/m)
Days
Simulant 1 (Acetic acid)
Simulant 3 (Acetic 75% ETOH)
Simulant 5 (Acetic 95% ETOH)
Ref

Page 34 of 65
4.3.3 FTIR Measurements
The results obtained by the FTIR Nicolet 6700 study were evaluated using the Omic spectra program function “analyzing tool” to identify the different peaks and comparing the different results.
The details of the analysis and findings are presented in appendix 3. Mainly a short explanation of the results are presented below.
4.3.3.1 Simulant 1
The samples taken during day 1, 4, 10, 21 and 36 were scanned on both surfaces and compared.
The results form the LDPE surface showed a slight decrease in absorbance over time as well as a formation of aliphatic carboxylic acid salts from day 10 and forth.
The results form aluminum surface showed an increase in absorbance over time as well as a clear formation of aliphatic carboxylic acid salts from day 10 and forth.
4.3.3.2 Simulant 3
The samples taken day 1, 4, 10 and 21 were scanned on both sides and compared, the sample from day 36 were not included due to the failed peel test.
The results form the LDPE surface shows an aliphatic carboxylic acids peak believed to indicate the presence of EAA disappearing at day 21. There is no formation of aliphatic carboxylic acid salts.
The results form the aluminum surface indicates a LDPE/EAA layer on the Al day 21. There is no formation of aliphatic carboxylic acid salts.
4.3.3.3 Simulant 5
The samples taken on day 1, 4, 10, 21 and 36 were scanned on both surfaces and compared.
The results form the LDPE Surface show no changes on the LDPE surface.
The results form the aluminum surface show no changes on the Al surface.
4.3.4 Mode of Failure Study
Some physical changes to the fracture site visible to the naked eye and microscopic studies of key samples provided further knowledge into the mode of failure.

Page 35 of 65
Unfortunately, since the images were only intended to demonstrate the difference between the various fracture site the scale bar has been lost during the process and can not be restored. As a size indication the aluminium is known to be 6-9 µm thick.
Also due to time constraints the analysis using SEM was cancelled.
4.3.4.1 Simulant 1
Samples from day 1 showed no direct visible differences from the reference samples (day 0).
Microscopic study, presented in Figure 21, show patches with presence of both LDPE and EAA on the Al surface making it hard to determine the mode of failure but indicating an Cohesive failure in the LDPE, but also areas with clean Al are visible.
Figure 21: Cross section of a peeled strip from the Main experiment simulant 1 showing
the Al surface after 1 days.The scale bar has been lost, but as an indication of size, the
aluminium foil is known to be 6-9µm thick.
Samples from day 4 had the highest peel force and showed ruptures in the polymer as it was peeled leaving directly visible patches of polymer on the Al surface.
Microscopic study, presented in Figure 22, show large areas with presence of EAA on the Al surface indicating an Apparent adhesive failure at the LDPE/adhesive interface.

Page 36 of 65
Figure 22: Cross section of a peeled strip from the Main experiment simulant 1 showing
the Al surface after 4 days.The scale bar has been lost, but as an indication of size, the
aluminium foil is known to be 6-9µm thick.
Samples from day 11 hade the lowest peel force and showed no direct visible differences from the reference samples.
Microscopic study, presented in Figure 23, show areas of clean Al as well as areas with presence of EAA on the Al surface indicating an Apparent adhesive failure at the adhesive/Al interface.
Figure 23: Cross section of a peeled strip from the Main experiment simulant 1 showing
the Al surface after 11 days.The scale bar has been lost, but as an indication of size, the
aluminium foil is known to be 6-9µm thick.
Samples from day 28 showed directly visible cloudiness in the polymer and a white powder layer on the Al surface believed to be salt.
Microscopic study, presented in Figure 24, show a dark layer, often thicker than the adhesive, covering most of the Al surface. The layer is believed to be salt and is formed at the Al surface indicating an Apparent adhesive failure at the adhesive/Al interface.

Page 37 of 65
Figure 24: Cross section of a peeled strip from the Main experiment simulant 1 showing
the Al surface after 28 days.The scale bar has been lost, but as an indication of size, the
aluminium foil is known to be 6-9µm thick.
4.3.4.2 Simulant 3
Samples from day 1 showed no direct visible differences from the reference samples.
Microscopic study, presented in Figure 25, showed patches with presence of both LDPE and EAA on the Al surface indicating a Cohesive failure in the adhesive, but also areas with clean Al were visible.
Figure 25: Cross section of a peeled strip from the Main experiment simulant 3 showing
the Al surface after 1 days.The scale bar has been lost, but as an indication of size, the
aluminium foil is known to be 6-9µm thick.
Samples from day 14 had the highest measurable peel force and showed ruptures in the polymer as it peeled leaving directly visible patches of polymer on the Al surface.
Microscopic study, presented in Figure 26, show a thin layer of EAA on the Al surface indicating an Apparent adhesive failure at the LDPE/adhesive interface.

Page 38 of 65
Figure 26: Cross section of a peeled strip from the Main experiment simulant 3 showing
the Al surface after 14 days.The scale bar has been lost, but as an indication of size, the
aluminium foil is known to be 6-9µm thick.
4.3.4.3 Simulant 5
Samples from day 1 showed no direct visible differences from the reference samples.
Microscopic study, presented in Figure 27, show patches with presence of both LDPE and EAA on the Al surface indicating an Cohesive failure in the adhesive.
Figure 27: Cross section of a peeled strip from the Main experiment simulant 5 showing
the Al surface after 1 days.The scale bar has been lost, but as an indication of size, the
aluminium foil is known to be 6-9µm thick.
Samples from day 36 showed no direct visible differences from the reference samples.
Microscopic study, presented in Figure 28, show layers with presence of EAA on the Al surface indicating an Cohesive failure in the adhesive but also patches with LDPE as well as patches of clean Al are visible.
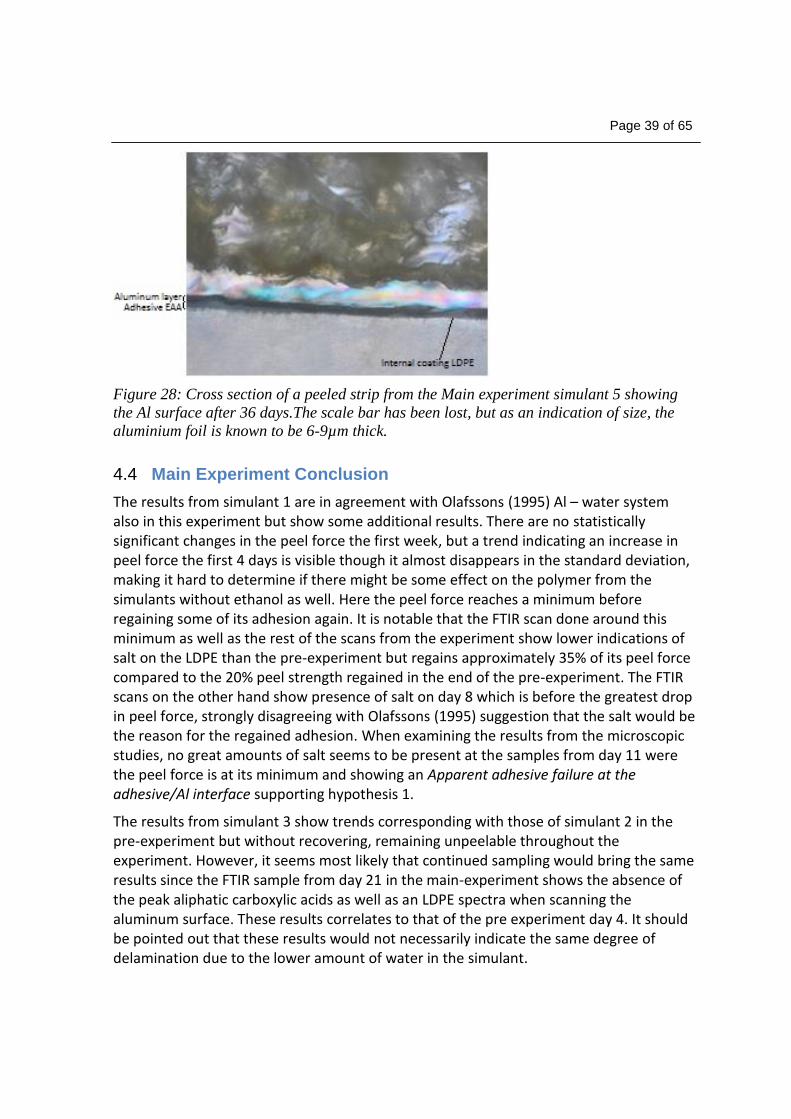
Page 39 of 65
Figure 28: Cross section of a peeled strip from the Main experiment simulant 5 showing
the Al surface after 36 days.The scale bar has been lost, but as an indication of size, the
aluminium foil is known to be 6-9µm thick.
4.4 Main Experiment Conclusion
The results from simulant 1 are in agreement with Olafssons (1995) Al – water system also in this experiment but show some additional results. There are no statistically significant changes in the peel force the first week, but a trend indicating an increase in peel force the first 4 days is visible though it almost disappears in the standard deviation, making it hard to determine if there might be some effect on the polymer from the simulants without ethanol as well. Here the peel force reaches a minimum before regaining some of its adhesion again. It is notable that the FTIR scan done around this minimum as well as the rest of the scans from the experiment show lower indications of salt on the LDPE than the pre-experiment but regains approximately 35% of its peel force compared to the 20% peel strength regained in the end of the pre-experiment. The FTIR scans on the other hand show presence of salt on day 8 which is before the greatest drop in peel force, strongly disagreeing with Olafssons (1995) suggestion that the salt would be the reason for the regained adhesion. When examining the results from the microscopic studies, no great amounts of salt seems to be present at the samples from day 11 were the peel force is at its minimum and showing an Apparent adhesive failure at the adhesive/Al interface supporting hypothesis 1.
The results from simulant 3 show trends corresponding with those of simulant 2 in the pre-experiment but without recovering, remaining unpeelable throughout the experiment. However, it seems most likely that continued sampling would bring the same results since the FTIR sample from day 21 in the main-experiment shows the absence of the peak aliphatic carboxylic acids as well as an LDPE spectra when scanning the aluminum surface. These results correlates to that of the pre experiment day 4. It should be pointed out that these results would not necessarily indicate the same degree of delamination due to the lower amount of water in the simulant.

Page 40 of 65
The results from simulant 5 show the same changes the first 24 hours but then show no significant changes from any of the tests throughout the remaining time of the experiment.
4.5 Plasticizing Effect Experiment
The method to determine the amount of absorbed simulant in the polymer failed. The plasticizing testing showed small changes but not large enough to be considered significant.
4.5.1.1 Sorption of Acetic Acid Testing
The testing failed due to the precision of the DSC Q 200 not being fine enough to measure the small changes caused by the simulant sorbed into the LDPE, this validation is presented in appendix 3.
4.5.1.2 Polymer Plasticizing Testing
Due to the failed sorption testing the DMA testing were conducted after 4 weeks when the peel tests show that delamination surely should have occurred and the polymer should have been plasticized if this was the case.
The analysis of the report retrieved from the DMA testing is presented in Appendix 3 and show no significant difference.
4.6 Plasticizing Effect Experiment Conclusion
The results from the experiment indicated no significant changes in the polymer due to the simulant that would cause the delamination. This result, though not wanted, is consistent with the literature found.
The penetration occurs in the three steps: Adsorption to the polymer surface which is dependent on the polarity of the polymer and the penetrate. In this case the polymer LDPE is nonpolar while the acetic acid as well as the two solvents water and ETOH are all highly polar (ETOH being slightly less polar than water) causing the simulants solubility in the LDPE to be low.
Diffusion through the polymer is driven by the concentration gradient which due to low sorbtion should be low, but the morphology of the polymer and penetrate also influence the rate. The permeation constant [g mm/m2 day] for acetic acid in LDPE is 1.22 and for water 0.10. Since ETOH is similar to water in terms of solvability its permeation constant should be in the same area.
Desorption of the penetrate exiting the polymer at the LDPE - Al interface should be the reverse to the sorption and therefore in this case rather fast.
This penetration behavior indicates that no accumulation of the simulants should occur in the LDPE, and no large concentration gradients should build up. The small amounts of acetic acid, water and ethanol should have limited effect on the polymer.

Page 41 of 65
A carboxylic acid of a more nonpolar nature will be sorbed to a greater degree than acetic acid. Longer carbon chains with branches will have a low rate of diffusion through the polymer, causing accumulation of acid, which in turn causes swelling in agreement with Case sorption described in section 2.5.1.5 Sorption Kinetics.
4.7 Final Conclusion
Based on results obtained from the three experiments in this thesis the following conclusions can be made:
The delamination of the system with the polymer LDPE and the acetic acid is best
described by hypothesis 1 presented in the background chap 1.1 and described in
section 2.6 Delamination as the Al-water mechanism first presented by Olafssons
(1995).
It not possible to determine if acetic acid causes the delamination mainly by
replacing the Lewis acid sites or if the delamination is mainly due to the dissolving
of the aluminum oxide and the reactions caused by the Al-water mechanism.
Neither is it possible to determine if the ratio between the two mechanisms would
be the same for another carboxylic acid.
The plasticizing effect experiment shows no plasticizing effect. This does not,
however, correlate with the results from the ETOH based simulants elastic
behavior during the peel tests.
The delamination of the system with the polymer LDPE and a carboxylic acid of a
more nonpolar nature may agree more with hypothesis 1.
5 Enclosures
1 Testing parameters
2 FTIR Analysis of Pre Experiment
3 FTIR Analysis of Main experiment
4 Plasticizing Effect Experiment
6 References
[1] Tetra Pak Facts & Figure s (Tetrapak utbildningsmaterial)
[2] PM basics (Tetrapak utbildningsmaterial)
[3] Pieper, G. and Petersen, K. (1995). Free Fatty Acids from Orange Juice Absorption into Laminated Cartons and their Effects on Adhesion. Journal of Food and Science, vol. 60, no. 5, pp. 1088-1091.

Page 42 of 65
[4] Ólafsson, G. (1995). Effect of Carboxylic Acids on the Adhesion between Polyethylene Film and Aluminium Foil in Laminated Packaging Material, Lund University, Lund
[5] Saffert, A., Thomas, K., Andersson, T., Berlin, M., Flemmer Karlsson, K., Pisciotti, F., Bertilsson, L., Bergonzini, A. and Hansson, K. (2013). Development report No. 28231: Adhesion mechanism in foil and non-foil based multilayer packaging materials and possible interaction with food components. TetraPak
[6] Gårdebjer, S. (2013) Mass-Transport through Interfaces, Department for Chemical and Biological Engineering, Pharmceutical Technology, Chalmers University of Technology.
[7] Piringer, O. G. and Baner, A. L. (2008). Plastic Packaging, Interactions with Food and Pharmaceuticals. Second, Completely Revised Edition. WILEY-VCH Verlag GmbH & Co. KGaA, Weinheim. ISBN: 978-3-527-31455-3.
[8] Fried, Joel R. Polymer Science & Technology. 2nd ed. Upper Sadle River : Prentice Hall, 2009. pp. 355-358. 0-130018168-4.
[9] D. Feldman 2001; Polymer Barrier Films; Journal of Polymers and the Environment, Vol. 9, No. 2, April 2001 (q 2002)
[10] R.R Deschmukh, A. R, Shetty. Surface Characterization of Polyethylene Films Modified by Gaseous Plasma. Department of Applied Physics, Institute of Chemical Technology . Mumbai : Wiley InterScience, 2006.
[11] Mark, Bikales, Overberger, Menges, Encyclopedia of polymer science and engineering, Volume 1, John Wiley & Sons, Inc, 1985
[12] JOHN C. BERG, Semi-empirical strategies for predicting adhesion. Department of Chemical Engineering. University ofWashington. Seattle. WA 98105-1750. USA D.A. Dillard and A.V. Pocius, Alphonsus V. The Mechanics of Adhesion
[13]Lidefelt, J.O., (2002). Handbook Vegetable Oils and Fats, Karlshamn AB, Karlshamn
[14] Ellervik, U. and Sterner, O. (2007). Organisk kemi, 2:a uppl., Studentlitteratur, ISBN: 978-91-44-03721-9

Page 43 of 65
Appendix 1 Testing parameters
7 Differential Scanning Calorimetry Parameters
Cycle 1: Equilibrate at 0ºC Cycle 2: Ramp 10ºC/minute to 160.00ºC Isothermal for 10 minutes Cycle 3: Ramp -10ºC/minute to 0ºC Cycle 4: Ramp 10ºC/minutes to 160ºC
8 DMA – Analysys Parameters
Instrument: DMA Q 800 Method(s): Temperature ramp from 5 °C to 35 °C, 3 °C/min, amplitude 50 µm, frequency 1 Hz.
Author(s): Ida Svendsen

Page 44 of 65
Appendix 2 FTIR Analysis of Pre Experiment
The results obtained by the FTIR Nicolet 6700 study were evaluated using the Omic spectra program function “analyzing tool” to identify the different peaks and comparing the different results.
9 FTIR Analysis
This part was conducted for both the pre experiment and the main experiment simultaneously and the findings were used for both experiments.
All samples were scanned and analyzed to obtain all possible peak identifications. Due to uncertainties in the software, the separate spectrums were also individually studied and compared manually to determine the precense of concealed groups and trends that the software missed.
9.1 LDPE Surface
Using the program’s analyzing tool to interpret the obtained FTIR spectra the recurrent presence of the following groups were observed:
The presence of aliphatic carboxylic acids are detected by peaks in the wavenumbers 2500-3300 cm-1, 1675-1750 cm-1, 1200-1300 cm-1 and 900-975 cm-1 shown in Figure 1a.
The presence of aliphatic hydrocarbons are detected by peaks in the wavenumbers 2825-2975 cm-1, 1425-1475 cm-1, 1350-1400 cm-1 and 700-750 cm-1 shown in Figure 1a.
Figure 29a: Interpretation of the LDPE surface of the reference sample.
The presence of aliphatic carboxylic acid salts are detected by peaks in the wavenumbers 1550-1575 cm-1 and 1425-1450 cm-1 shown in Figure 2a.

Page 45 of 65
Figure 30a: Interpretation of the LDPE surface of the 10 sample simulant 1.
9.2 Aluminum Surface
Due to the low absorbance when scanning the Al side, only one match was found when using the program’s analyzing tool to interpret the obtained FTIR spectra, see Figure 3a.
Aliphatic hydrocarbons are detected by peaks in the wavenumbers 2825-2975 cm-1, 1425-1475 cm-1, 1350-1400 cm-1 and 700-750 cm-1.
Figure 31a:Interpretation of the Al surface of the reference sample.
9.2.1 Reference
The LDPE side of the reference show good results, shown in Figure 4a (top), with the presence of aliphatic hydrocarbons peaks in the wavenumbers 2825-2975 cm-1, 1425-1475 cm-1 and 700-750 cm-1 and the presence of aliphatic carboxylic acids as a peak at wavenumbers 1675-1750 cm-1 indicating the presence of EAA.
The Al show results corresponding to a surface with high reflection index, resulting in low absorbance, an unsteady base line and a higher amount of background noise. The result shows a small indication of the presence of aliphatic hydrocarbons peaks in the wavenumbers 2825-2975 cm-1 representing small amounts of LDPE on the Al surface, see
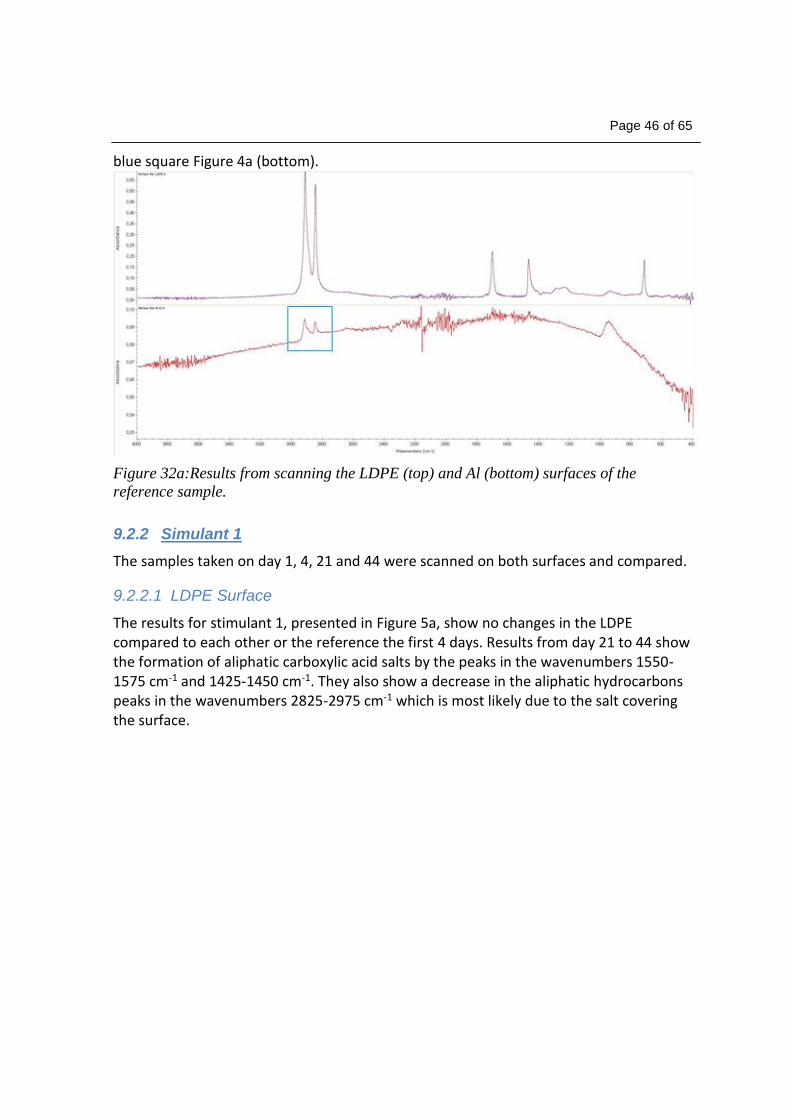
Page 46 of 65
blue square Figure 4a (bottom).
Figure 32a:Results from scanning the LDPE (top) and Al (bottom) surfaces of the
reference sample.
9.2.2 Simulant 1
The samples taken on day 1, 4, 21 and 44 were scanned on both surfaces and compared.
9.2.2.1 LDPE Surface
The results for stimulant 1, presented in Figure 5a, show no changes in the LDPE compared to each other or the reference the first 4 days. Results from day 21 to 44 show the formation of aliphatic carboxylic acid salts by the peaks in the wavenumbers 1550-1575 cm-1 and 1425-1450 cm-1. They also show a decrease in the aliphatic hydrocarbons peaks in the wavenumbers 2825-2975 cm-1 which is most likely due to the salt covering the surface.

Page 47 of 65
Figure 33a:Results from scanning the LDPE surface of samples from simulant 1 day 1, 4,
21 and 44 from top to bottom.
9.2.2.2 Aluminum Surface
The results for stimulant 1, presented in Figure 6a, show small changes in the Al compared to each other or the reference as the aliphatic hydrocarbons peaks in the wavenumbers 2825-2975 cm-1 seem to decrease the first 4 days. Results from day 21 to 44 show the formation of aliphatic carboxylic acid salts by the peaks in the wavenumbers 1550-1575 cm-1 and 1425-1450 cm-1. They also show no aliphatic hydrocarbons peaks, however it cannot be determined if this is due to continued decrease or due to the salt covering the surface.
Figure 34a:Results from scanning the Al surface of samples from simulant 1 day 1,4,21
and 44 from top to bottom.

Page 48 of 65
9.2.3 Simulant 2
The samples taken during day 1, 4 and 44 were scanned on both surfaces and compared. The sample from day 21 was not included due to the failed peel test.
9.2.3.1 LDPE Surface
The results for stimulant 2, presented in Figure 7a, show no changes in the LDPE compared to each other or the reference the first day. Results from day 4 lack the presence of the aliphatic carboxylic acids peak at wavenumbers 1675-1750 cm-1 that is believed to indicate the presence of EAA. It also shows an increased absorbance of the remaining peaks. Day 44 show a small formation of aliphatic carboxylic acid salts by the peaks in the wavenumbers 1550-1575 cm-1 and 1425-1450 cm-1 and a small decrease in the aliphatic hydrocarbons peaks in the wavenumbers 2825-2975 cm-1, which is most likely due to the salt.
Figure 35a:Results from scanning the LDPE surface of samples from simulant 2 day 1, 4
and 44 from top to bottom.
9.2.3.2 Aluminum Surface
The results for stimulant 2, presented in Figure 8a, show no significant changes after the first day in the Al compared to the reference. Results from day 4 show the presence of aliphatic hydrocarbons peaks in the wavenumbers 2825-2975 cm-1, 1425-1475 cm-1 and 700-750 cm-1 and the presence of aliphatic carboxylic acids as a peak at wavenumbers 1675-1750 cm-1 which corresponds to the LDPE spectra with EAA. Day 44 show the formation of aliphatic carboxylic acid salts by the peaks in the wavenumbers 1550-1575 cm-1 and 1425-1450 cm-1, they also show no aliphatic hydrocarbons peaks.
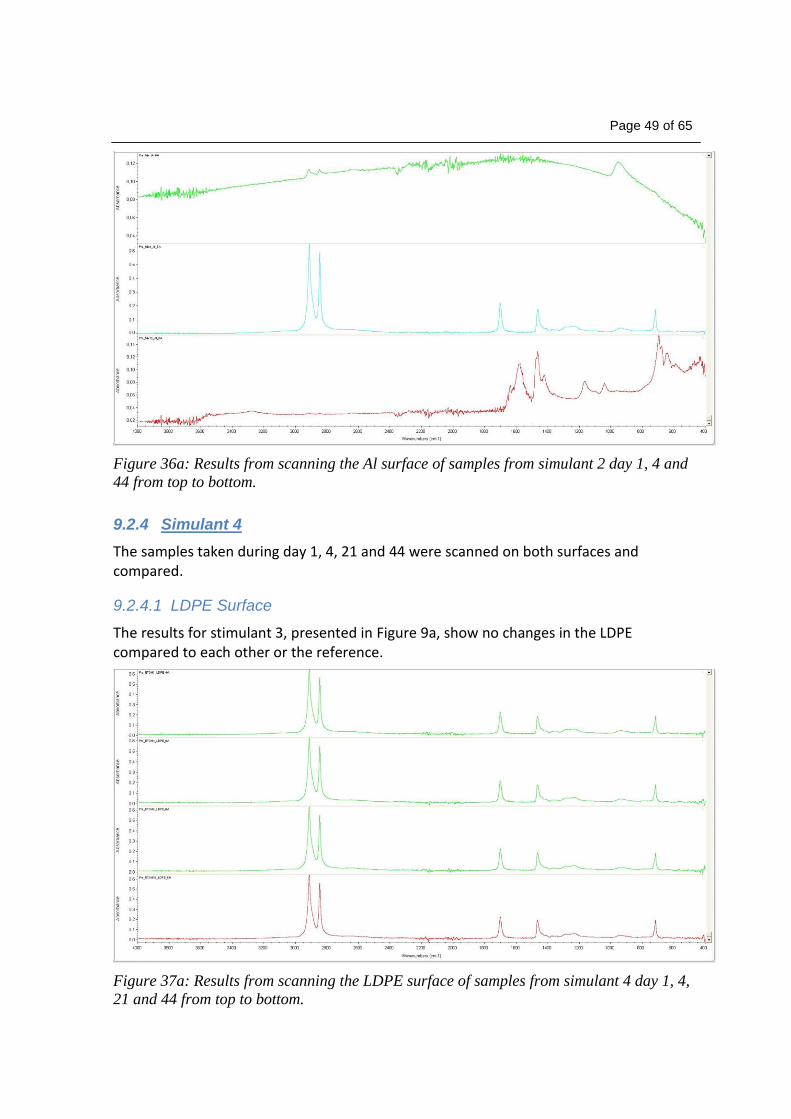
Page 49 of 65
Figure 36a: Results from scanning the Al surface of samples from simulant 2 day 1, 4 and
44 from top to bottom.
9.2.4 Simulant 4
The samples taken during day 1, 4, 21 and 44 were scanned on both surfaces and compared.
9.2.4.1 LDPE Surface
The results for stimulant 3, presented in Figure 9a, show no changes in the LDPE compared to each other or the reference.
Figure 37a: Results from scanning the LDPE surface of samples from simulant 4 day 1, 4,
21 and 44 from top to bottom.
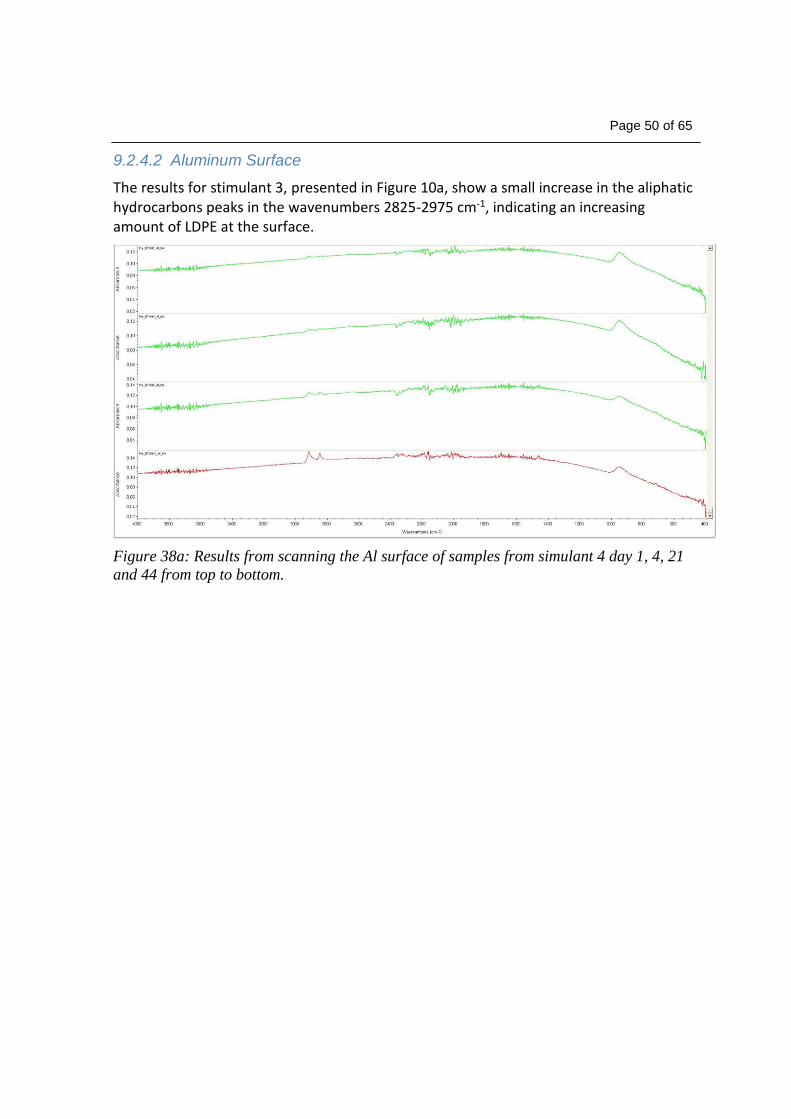
Page 50 of 65
9.2.4.2 Aluminum Surface
The results for stimulant 3, presented in Figure 10a, show a small increase in the aliphatic hydrocarbons peaks in the wavenumbers 2825-2975 cm-1, indicating an increasing amount of LDPE at the surface.
Figure 38a: Results from scanning the Al surface of samples from simulant 4 day 1, 4, 21
and 44 from top to bottom.

Page 51 of 65
Appendix 3 FTIR Analysis of Main experiment
The results obtained by the FTIR Nicolet 6700 study were evaluated using the Omic spectra program function “analyzing tool” to identify the different peaks and comparing the different results.
10 FTIR Analysis
This part was conducted for both the pre experiment and the main experiment simultaneously and the findings were used for both experiments.
All samples were scanned and analyzed to obtain all possible peak identifications. Due to uncertainties in the software, the separate spectrums were also individually studied and compared manually to determine the precense of concealed groups and trends that the software missed.
10.1 LDPE Surface
Using the program’s analyzing tool to interpret the obtained FTIR spectra the recurrent presence of the following groups were observed:
The presence of aliphatic carboxylic acids are detected by peaks in the wavenumbers 2500-3300 cm-1, 1675-1750 cm-1, 1200-1300 cm-1 and 900-975 cm-1 shown in Figure 1a.
The presence of aliphatic hydrocarbons are detected by peaks in the wavenumbers 2825-2975 cm-1, 1425-1475 cm-1, 1350-1400 cm-1 and 700-750 cm-1 shown in Figure 1a.
Figure 39a:Interpretation of the LDPE surface of the reference sample.
The presence of aliphatic carboxylic acid salts are detected by peaks in the wavenumbers 1550-1575 cm-1 and 1425-1450 cm-1 shown in Figure 2a.

Page 52 of 65
Figure 40a: Interpretation of the LDPE surface of the 10 sample simulant 1.
10.2 Aluminum Surface
Due to the low absorbance when scanning the Al side, only one match was found when using the program’s analyzing tool to interpret the obtained FTIR spectra, see Figure 3a.
Aliphatic hydrocarbons are detected by peaks in the wavenumbers 2825-2975 cm-1, 1425-1475 cm-1, 1350-1400 cm-1 and 700-750 cm-1.
Figure 41a: Interpretation of the Al surface of the reference sample.
10.2.1 Reference
The LDPE side of the reference show good results, shown in Figure 4a (top), with the presence of aliphatic hydrocarbons peaks in the wavenumbers 2825-2975 cm-1, 1425-1475 cm-1 and 700-750 cm-1 and the presence of aliphatic carboxylic acids as a peak at wavenumbers 1675-1750 cm-1 indicating the presence of EAA.
The Al show results corresponding to a surface with high reflection index, resulting in low absorbance, an unsteady base line and a higher amount of background noise. The result shows a small indication of the presence of aliphatic hydrocarbons peaks in the wavenumbers 2825-2975 cm-1 representing small amounts of LDPE on the Al surface, see

Page 53 of 65
blue square Figure 4a (bottom).
Figure 42a: Results from scanning the LDPE (top) and Al (bottom) surfaces of the
reference sample.
10.2.2 Simulant 1
The samples taken during day 1, 4, 10, 21 and 36 were scanned on both surfaces and compared.
10.2.2.1 LDPE Surface
The results for stimulant 1, presented in Figure 5a, show no changes in the LDPE compared to each other or the reference the first 4 days. Results from day 10 show a slight decrease in absorbance as well as the formation of a peak in the wavenumbers 1550-1600 cm-1 unanalysable with the software but corresponding with the aliphatic carboxylic acid salts peak wavenumbers 1550-1575 cm-1. Also, the slight formation of a tail on the aliphatic hydrocarbons peak in the wavenumbers 1425-1475 cm-1 can be observed which could be the aliphatic carboxylic acid salts peak of wavenumbers 1425-1450 cm-1. Results from day 21-36 show further decrease in the absorbance and increasing aliphatic carboxylic acid salt formation.

Page 54 of 65
Figure 5a: Results from scanning the LDPE surface of samples from simulant 1 day 1, 4,
8, 12 and 16 from top to bottom.
10.2.2.2 Aluminum Surface
The results for stimulant 1, presented in Figure 6a, show no aliphatic hydrocarbons peaks in the wavenumbers 2825-2975 cm-1 indicating lower traces of LDPE on the Al surface than on that of the reference. Results from the remaining days show an increasing formation of aliphatic carboxylic acid salts by the peaks in the wavenumbers 1550-1575 cm-1 and 1425-1450 cm-1. Also, neither of them show any aliphatic hydrocarbons peaks.
Figure 6a: Results from scanning the Al surface of samples from simulant 1 day 1, 4, 8, 12
and 16 from top to bottom.

Page 55 of 65
10.2.2.3 Simulant 3
The samples taken day 1, 4, 10 and 21 were scanned on both sides and compared, the sample from day 36 were not included due to the failed peel test.
10.2.2.4 LDPE Surface
The results for stimulant 3, presented in Figure 7a, show no changes in the LDPE compared to each other or the reference during the first 10 days. Results from day 21 lack the presence of the aliphatic carboxylic acids peak at wavenumbers 1675-1750 cm-1 that is believed to indicate the presence of EAA. The absorbance is unchanged throughout the samples.
Figure 7a: Results from scanning the LDPE surface of samples from simulant 3 day 1, 4,
10 and 21 from top to bottom.
10.2.2.5 Aluminum Surface
The results for stimulant 3, presented in Figure 8a, show no changes in the LDPE compared to each other or the reference the first eight days. Results from day 21 show the presence of aliphatic hydrocarbons peaks in the wavenumbers 2825-2975 cm-1, 1425-1475 cm-1 and 700-750 cm-1 and the presence of aliphatic carboxylic acids as a peak at wavenumbers 1675-1750 cm-1 which corresponds to the LDPE spectra with EAA. There is also a great increase in absorbance day 21 indicating higher amounts of polymer on the surface resulting in a less reflective surface.

Page 56 of 65
Figure 8a: Results from scanning the Al surface of samples from simulant 3 day 1, 4, 8 and
12 from top to bottom.
10.2.2.6 Simulant 5
The samples taken on day 1, 4, 10, 21 and 36 were scanned on both surfaces and compared.
10.2.2.7 LDPE Surface
The results for stimulant 5, presented in Figure 9a, show no changes in the LDPE compared to each other or the reference.
Figure 9a: Results from scanning the LDPE surface of samples from simulant 5 day 1, 4,
10, 21 and 36 from top to bottom.

Page 57 of 65
10.2.2.8 Aluminum Surface
The results for stimulant 5, presented in Figure 10a, show no significant change compared to each other while they all lack the aliphatic hydrocarbons peaks in the wavenumbers 2825-2975 cm-1 which is present in the reference.
Figure 10a: Results from scanning the Al surface of samples from simulant 5 day 1, 4, 10,
21 and 36 from top to bottom.

Page 58 of 65
Appendix 4 Plasticizing Effect Experiment
The method to determine the amount of absorbed simulant in the polymer failed. The plasticizing testing showed small changes but not large enough to be considered significant.
11 Sorption of Acetic Acid Testing
The testing failed due to the precision of the DSC Q 200 not being fine enough to measure the small changes caused by the simulant sorbed into the LDPE, this validation is presented below.
11.1 Procidure validating the results from the ”Sorption of Acetic acid testing”
This part was done to evaluate the results from the DSC-analys. This was concluded by calculating the standard deviation in cycle 2 of the reference simulants at 0˚C, presented in table 1a, and comparing them to the test simulants results at 0˚C in table 2a.
Table 2a: The Heat Flow need per gram sample to increase the sample temperature 1˚C at
0˚C during cycle 2 and the calculated standardiviation for each Simulant reference.
Day LDPE Reference
(W/g)
Simulant 1 Reference
(W/g)
Simulant 3 Reference
(W/g)
Simulant 5 Reference
(W/g)
1 -0,3042 -0,1237 0,09227 0,1267
4 -0,2506 0,1219 0,1215 0,1631
8 -0,2524 0,1219 0,02411 0,006642
11 -0,2537
Significant difference
0,026014 0,141797 0,049975 0,081872
Table 3a: The Heat Flow need per gram sample to increase the sample temperature 1˚C at
0˚C during cycle 2 and the calculated standardiviation for each Simulant.
Day LDPE Reference
(W/g)
Simulant 1
(W/g)
Simulant 3
(W/g)
Simulant 5
(W/g)
1 -0,3042 -0,27 -0,2628 -0,105
4 -0,2506 -0,1493 -0,2251 -0,09454

Page 59 of 65
8 -0,2524 -0,2486 -0,07114 -0,1396
11 -0,2537 -0,236 -0,2181
Significant difference
0,026014 0,045907
0,073102
0,019256
As an additional control of the test, the fourth cycles were compared as these should be the same for all the samples due to the liquid evaporating in cycle 2 and that the polymer memory should have been removed in cycle 4. This failed as well.
Table 4a: The Heat Flow need per gram sample to increase the sample temperature 1˚C at
0˚C during cycle 4 and the calculated standardiviation fore each Simulant.
Day LDPE Reference
(W/g)
Simulant 1
(W/g)
Simulant 3
(W/g)
Simulant 5
(W/g)
1 -0,01128 -0,02517 -0,01197 0,001741
4 -0,00367 -0,00662 -0,01117 0,0173
8 -0,00029 -0,00625 0,02216 0,01437
11 -0,00089 0,000706 0,001136
Significant difference
0,004374 0,009598
0,013788
0,006751
11.2 Simulant 1
By a quick examination of the results from cycle 2 for stimulant 1 presented in Figure 1a it can be determined that the results show no trends.

Page 60 of 65
Figure 43a: Results from the DSC tests on simulant 1.
11.3 Simulant 3
By a quick examination of the results from cycle 2 for stimulant 3 presented in Figure 2a it can be determined that the results show no trends.
Figure 44a: Results from the DSC tests on simulant 3.
-1
-0.8
-0.6
-0.4
-0.2
0
0.2-2
5
-13 -1 11
23
35
47
59
71
83
95
10
7
11
9
13
1
14
3
15
5
16
7
Cykel 2 Day1
Cykel 2 Day4
Cykel 2 Day8
Cykel 2 Day11
-1
-0.8
-0.6
-0.4
-0.2
0
0.2
0.4
-25
-13 -1 11
23
35
47
59
71
83
95
10
7
11
9
13
1
14
3
15
5
16
7
Cykel 2 Day1
Cykel 2 Day4
Cykel 2 Day8
Cykel 2 Day11

Page 61 of 65
11.4 Simulant 5
By a quick examination of the results from cycle 2 for stimulant 3 presented in Figure 5a it can be determined that the results show no trends.
Figure 45a: Results from the DSC tests on simulant 5.
12 Polymer Plasticizing Testing
Due to the failed sorption testing the DMA testing were conducted after 4 weeks when the peel tests show that delamination surely should have occurred and the polymer should have been plasticized if this was the case.
The report retrieved from the DMA testing showed that a visual difference could be observed between the samples in Storage modulus, loss modulus and tan delta presented in the Figure s 4a, 5a and 6a below. However no significant difference could be stated.
-0.8
-0.6
-0.4
-0.2
0
0.2
0.4
-25
-13 -1 11
23
35
47
59
71
83
95
10
7
11
9
13
1
14
3
15
5
16
7
Cykel 2 Day1
Cykel 2 Day4
Cykel 2 Day8

Page 62 of 65
Figure 46a: Storage modulus for the samples. 2 replicates are shown per sample.
l
l
l
l
l
l
l
l
l
l
l
l
p
p
p
p
p
p
p
p
p
p
p
p
p
l
l
l
l
l
l
l
l
l
l
l
l
l
£
£
£
£
£
£
£
£
£
£
£
£
ª
ª
ª
ª
ª
ª
ª
ª
ª
ª
ª
ª
ª
ª
£
£
£
£
£
£
£
£
£
£
£
£
ª
ª
ª
ª
ª
ª
ª
ª
ª
ª
ª
ª
ª
ª
p
p
p
p
p
p
p
p
p
p
p
p
p
100
200
300
400
500
600
Sto
rag
e M
od
ulu
s (
MP
a)
5 10 15 20 25 30 35
Temperature (°C)
l ethanolp water£ referenceª mix
Universal V4.5A TA Instruments

Page 63 of 65
Figure 47a: Loss modulus for the samples. 2 replicates are shown per sample.
l
l
l
l
l
l
l
l
l
l
l
l
p
p
p
p
p
p
p
p
p
p
p
p
p
l
l
l
l
l
l
l
l
l
l
l
l
l
£
£
£
£
£
£
£
£
£
£
£
£
ª
ª
ª
ª
ª
ª
ª
ª
ª
ª
ª
ª
ªª
£
£
£
£
£
£
£
£
£
£
£
£
ª
ª
ª
ª
ª
ª
ª
ª
ª
ª
ª
ª
ªª
p
p
p
p
p
p
p
p
p
p
p
p
p
0
20
40
60
Lo
ss M
odu
lus (
MP
a)
5 10 15 20 25 30 35
Temperature (°C)
l ethanolp water£ referenceª mix
Universal V4.5A TA Instruments

Page 64 of 65
Figure 48a: Tan delta for the samples. 2 replicates are shown per sample.
12.1 Tensile Testing
There were not enough material left to perform credible tensile testing.
13 Plasticizing Effect Experiment Conclusion
The results from the experiment indicated no significant changes in the polymer due to the simulant that would cause the delamination. This result, though not wanted, is consistent with the literature found.
The penetration occurs in the three steps: Adsorption to the polymer surface which is dependent on the polarity of the polymer and the penetrate. In this case the polymer LDPE is nonpolar while the acetic acid as well as the two solvents water and ETOH are all highly polar (ETOH being slightly less polar than water) causing the simulants solubility in the LDPE to be low.
Diffusion through the polymer is driven by the concentration gradient which due to low sorbtion should be low, but the morphology of the polymer and penetrate also influence the rate. The permeation constant [g mm/m2 day] for acetic acid in LDPE is 1.22 and for
l
l
l
l
l
l
l
l
l
l
l
l
p
p
p
p
p
p
p
p
p
p
p
p
p
l
l
l
l
l
l
l
l
l
l
l
l
l
£
£
£
£
£
£
£
£
£
£
£
£
ªª
ª
ª
ª
ª
ª
ª
ª
ª
ª
ª
ªª
£
£
£
£
£
£
£
£
£
£
£
£
ª
ª
ª
ª
ª
ª
ª
ª
ª
ª
ª
ª
ª
ª
p
p
p
p
p
p
p
p
p
p
p
p
p
0.04
0.06
0.08
0.10
0.12
Ta
n D
elta
5 10 15 20 25 30 35
Temperature (°C)
l ethanolp water£ referenceª mix
Universal V4.5A TA Instruments

Page 65 of 65
water 0.10. Since ETOH is similar to water in terms of solvability its permeation constant should be in the same area.
Desorption of the penetrate exiting the polymer at the LDPE - Al interface should be the reverse to the sorption and therefore in this case rather fast.
This penetration behavior indicates that no accumulation of the simulants should occur in the LDPE, and no large concentration gradients should build up. The small amounts of acetic acid, water and ethanol should have limited effect on the polymer.
A carboxylic acid of a more nonpolar nature will be sorbed to a greater degree than acetic acid. Longer carbon chains with branches will have a low rate of diffusion through the polymer, causing accumulation of acid, which in turn causes swelling in agreement with Case sorption described in section 2.5.1.5 Sorption Kinetics.