the influence of categories on perception: explaining the
TRANSCRIPT

The Influence of Categories on Perception: Explaining the PerceptualMagnet Effect as Optimal Statistical Inference
Naomi H. FeldmanBrown University
Thomas L. GriffithsUniversity of California, Berkeley
James L. MorganBrown University
A variety of studies have demonstrated that organizing stimuli into categories can affect the way thestimuli are perceived. We explore the influence of categories on perception through one such phenom-enon, the perceptual magnet effect, in which discriminability between vowels is reduced near prototyp-ical vowel sounds. We present a Bayesian model to explain why this reduced discriminability mightoccur: It arises as a consequence of optimally solving the statistical problem of perception in noise. Inthe optimal solution to this problem, listeners’ perception is biased toward phonetic category meansbecause they use knowledge of these categories to guide their inferences about speakers’ targetproductions. Simulations show that model predictions closely correspond to previously published humandata, and novel experimental results provide evidence for the predicted link between perceptual warpingand noise. The model unifies several previous accounts of the perceptual magnet effect and provides aframework for exploring categorical effects in other domains.
Keywords: perceptual magnet effect, categorical perception, speech perception, Bayesian inference,rational analysis
The influence of categories on perception is well known indomains ranging from speech sounds to artificial categories ofobjects. Liberman, Harris, Hoffman, and Griffith (1957) first de-scribed categorical perception of speech sounds, noting that lis-teners’ perception conforms to relatively sharp identificationboundaries between categories of stop consonants and thatwhereas between-category discrimination of these sounds is nearlyperfect, within-category discrimination is little better than chance.Similar patterns have been observed in the perception of colors(Davidoff, Davies, & Roberson, 1999), facial expressions (Etcoff& Magee, 1992), and familiar faces (Beale & Keil, 1995), as well
as the representation of objects belonging to artificial categoriesthat are learned over the course of an experiment (Goldstone,1994; Goldstone, Lippa, & Shiffrin, 2001). All of these categoricaleffects are characterized by better discrimination of between-category contrasts than within-category contrasts, although themagnitude of the effect varies between domains.
In this article, we develop a computational model of the influ-ence of categories on perception through a detailed investigation ofone such phenomenon, the perceptual magnet effect (Kuhl, 1991),which has been described primarily in vowels. The perceptualmagnet effect involves reduced discriminability of speech soundsnear phonetic category prototypes. For several reasons, speechsounds, particularly vowels, provide an excellent starting point forassessing a model of the influence of categories on perception.Vowels are naturally occurring, highly familiar stimuli that alllisteners have categorized. As discussed later, a precise two-dimensional psychophysical map of vowel space can be provided,and using well-established techniques, discrimination of pairs ofspeech sounds can be systematically investigated under well-defined conditions so that perceptual maps of vowel space can beconstructed. By comparing perceptual and psychophysical maps,we can measure the extent and nature of perceptual warping andassess such warping with respect to known categories. In addition,the perceptual magnet effect shows several qualitative similaritiesto categorical effects in perceptual domains outside of language, asvowel perception is continuous rather than sharply categorical(Fry, Abramson, Eimas, & Liberman, 1962) and the degree ofcategory influence can vary substantially across testing conditions(Gerrits & Schouten, 2004). Finally, the perceptual magnet effecthas been the object of extensive empirical and computational
Naomi H. Feldman and James L. Morgan, Department of Cognitive andLinguistic Sciences, Brown University; Thomas L. Griffiths, Departmentof Psychology, University of California, Berkeley.
This research was supported by Brown University First-Year and BrainScience Program Fellowships, National Science Foundation—IntegrativeGraduate Education and Research Traineeship Grant 9870676, NationalScience Foundation Grant 0631518, and National Institutes of Health GrantHD032005. We thank Megan Blossom, Glenda Molina, Emily Myers, LoriRolfe, and Katherine White for help in setting up and running the exper-iment; Laurie Heller and Tom Wickens for discussions on data analysis;and Sheila Blumstein for valuable comments on a previous version of thisarticle.
Portions of this work were presented at the Mathematics and PhonologySymposium (MathPhon I), the 29th Annual Conference of the CognitiveScience Society, and the 2007 Northeast Computational Phonology Work-shop.
Correspondence concerning this article should be addressed to Naomi H.Feldman, Department of Cognitive and Linguistic Sciences, Brown Univer-sity, Box 1978, Providence, RI 02912. E-mail: [email protected]
Psychological Review © 2009 American Psychological Association2009, Vol. 116, No. 4, 752–782 0033-295X/09/$12.00 DOI: 10.1037/a0017196
752

research (e.g., Grieser & Kuhl, 1989; Guenther & Gjaja, 1996;Iverson & Kuhl, 1995; Kuhl, 1991; Lacerda, 1995). This previousresearch has produced a large body of data, which can be used toprovide a quantitative evaluation of our approach, as well asseveral alternative explanations against which our account can becompared.
We take a novel approach to modeling the perceptual magneteffect, complementary to previous models that have explored howthe effect might be algorithmically and neurally implemented. Inthe tradition of rational analysis proposed by Marr (1982) and J. R.Anderson (1990), we consider the abstract computational problemposed by speech perception and show that the perceptual magneteffect emerges as part of the optimal solution to this problem.Specifically, we assume that listeners are optimally solving theproblem of perceiving speech sounds in the presence of noise. Inthis analysis, the listener’s goal is to ascertain category member-ship but also to extract phonetic detail in order to reconstructcoarticulatory and nonlinguistic information. This is a difficultproblem for listeners because they cannot hear the speaker’s targetproduction directly. Instead, they hear speech sounds that aresimilar to the speaker’s target production but that have been alteredthrough articulatory, acoustic, and perceptual noise. We formalizethis problem using Bayesian statistics and show that the optimalsolution to this problem produces the perceptual magnet effect.
The resulting rational model formalizes ideas that have beenproposed in previous explanations of the perceptual magnet effectbut goes beyond these previous proposals to explain why the effectshould result from optimal behavior. It also serves as a basis forfurther empirical research, making predictions about the types ofvariability that should be seen in the perceptual magnet effect andin other categorical effects more generally. Several of these pre-dictions are in line with previous literature, and one additionalprediction is borne out in our own experimental data. Our modelparallels models that have been used to describe categorical effectsin other areas of cognition (Huttenlocher, Hedges, & Vevea, 2000;Kording & Wolpert, 2004; Roberson, Damjanovic, & Pilling,2007), suggesting that its principles are broadly applicable to theseareas as well.
The article is organized as follows. We begin with an overviewof categorical effects across several domains and then focus moreclosely on evidence for the perceptual magnet effect and explana-tions that have been proposed to account for this evidence. Theensuing section gives an intuitive overview of our model, followedby a more formal introduction to its mathematics. We presentsimulations comparing the model to published empirical data andgenerating novel empirical predictions. An experiment is presentedto test the predicted effects of speech signal noise. Finally, wediscuss this model in relation to previous models, revisit its as-sumptions, and suggest directions for future research.
Categorical Effects
Categorical effects are widespread in cognition and perception(Harnad, 1987), and these effects show qualitative similaritiesacross domains. This section provides an overview of basic find-ings and key issues concerning categorical effects in the perceptionof speech sounds, colors, faces, and artificial laboratory stimuli.
Speech Sounds
The classic demonstration of categorical perception comes froma study by Liberman et al. (1957), who measured subjects’ per-ception of a synthetic speech sound continuum that ranged from /b/to /d/ to /g/, spanning three phonetic categories. Results showedsharp transitions between the three categories in an identificationtask and corresponding peaks in discrimination at category bound-aries, indicating that subjects were discriminating stimuli primarilyon the basis of their category membership. The authors comparedthe data to a model in which listeners extracted only categoryinformation, and no acoustic information, when perceiving aspeech sound. Subject performance exceeded that of the modelconsistently but only by a small percentage: Discrimination waslittle better than could be obtained through identification alone.Liberman and colleagues later replicated these results using thevoicing dimension in stop consonant perception, with both word-initial and word-medial cues causing discrimination peaks at theidentification boundaries (Liberman, Harris, Kinney, & Lane,1961; Liberman, Harris, Eimas, Lisker, & Bastian, 1961). Otherclasses of consonants such as fricatives (Fujisaki & Kawashima,1969), liquids (Miyawaki et al., 1975), and nasals (J. L. Miller &Eimas, 1977) show evidence of categorical perception as well. Inall of these studies, listeners show some discrimination of within-category contrasts, and this within-category discrimination is es-pecially evident when more sensitive measures, such as reactiontimes, are used (e.g., Pisoni & Tash, 1974). Nevertheless, within-category discrimination is consistently poorer than between-category discrimination across a wide variety of consonant con-trasts.
A good deal of research has investigated the degree to whichcategorical perception of consonants results from innate biasesor arises through category learning. Evidence supports a role forboth factors. Studies with young infants show that discrimina-tion peaks are present in the first few months of life (Eimas,Siqueland, Jusczyk, & Vigorito, 1971; Eimas, 1974, 1975),suggesting a role for innate biases. These early patterns may betied to general patterns of auditory sensitivity, as nonhumananimals show discrimination peaks at category boundariesalong the dimensions of voicing (Kuhl, 1981; Kuhl & Padden,1982) and place (Kuhl & Padden, 1983; Morse & Snowdon,1975), and humans show similar boundaries in some nonspeechstimuli (J. D. Miller, Wier, Pastore, Kelly, & Dooling, 1976;Pisoni, 1977). Studies have also shown cross-linguistic differ-ences in perception, which indicate that perceptual patterns areinfluenced by phonetic category learning (Abramson & Lisker,1970; Miyawaki et al., 1975). The interaction between thesetwo factors remains a subject of current investigation (e.g.,Holt, Lotto, & Diehl, 2004).
The role of phonetic categories in vowel perception is morecontroversial: vowel perception is continuous rather than strictlycategorical, without obvious discrimination peaks near categoryboundaries (Fry et al., 1962). However, there has been someevidence for category boundary effects (Beddor & Strange, 1982)as well as reduced discriminability of vowels specifically near thecenters of phonetic categories (Kuhl, 1991), and we return to thisdebate in more detail in the next section.
753INFLUENCE OF CATEGORIES ON PERCEPTION

Colors
Researchers have argued that color categories are organizedaround universal focal colors (Berlin & Kay, 1969; Rosch Heider,1972; Rosch Heider & Oliver, 1972), and these universal tenden-cies have been supported through more recent statistical modelingresults (Kay & Regier, 2007; Regier, Kay, & Khetarpal, 2007).However, color terms show substantial cross-linguistic variation(Berlin & Kay, 1969), and this has led researchers to questionwhether color categories influence color perception. Experimentshave revealed discrimination peaks corresponding to language-specific category boundaries for speakers of English, Russian,Berinmo, and Himba, and perceivers whose native language doesnot contain a corresponding category boundary have failed to showthese discrimination peaks (Davidoff et al., 1999; Roberson, Dav-idoff, Davies, & Shapiro, 2005; Roberson, Davies, & Davidoff,2000; Winawer et al., 2007). These results indicate that colorcategories do influence performance in color discrimination tasks.
More recent research in this domain has asked whether thesecategorical effects are purely perceptual or whether they are me-diated by the active use of linguistic codes in perceptual tasks.Roberson and Davidoff (2000) demonstrated that linguistic inter-ference tasks can eliminate categorical effects in color perception(see also Kay & Kempton, 1984). Investigations have shownactivation of the same neural areas in naming tasks as in discrim-ination tasks (Tan et al., 2008) as well as left-lateralization ofcategorical color perception in adults (Gilbert, Regier, Kay, &Ivry, 2006). These results suggest a direct role for linguistic codesin discrimination performance, indicating that categorical effectsin color perception are mediated largely by language. Neverthe-less, categorical effects may play a large role in everyday colorperception. Linguistic codes appear to be used in a wide variety ofperceptual tasks, including those that do not require memoryencoding (Witthoft et al., 2003), and verbal interference tasks failto completely wipe out verbal coding when the type of interferenceis unpredictable (Pilling, Wiggett, Ozgen, & Davies, 2003).
Faces
Categorical effects in face perception were first shown for facialexpressions of emotion in stimuli constructed from line drawings(Etcoff & Magee, 1992) and photograph-quality stimuli (Calder,Young, Perrett, Etcoff, & Rowland, 1996; de Gelder, Teunisse, &Benson, 1997; Young et al., 1997 ). Stimuli for these experimentswere drawn from morphed continua in which the endpoints wereprototypical facial expressions (e.g., happiness, fear, anger). Withfew exceptions, results showed discrimination peaks at the samelocations as identification boundaries between these prototypicalexpressions. Evidence for categorical effects has been found inseven-month-old infants (Kotsoni, de Haan, & Johnson, 2001),nine-year-old children (de Gelder et al., 1997), and older individ-uals (Kiffel, Campanella, & Bruyer, 2005), indicating that cate-gory structure is similar across different age ranges. However,these categories can be affected by early experience as well. Pollakand Kistler (2002) presented data from abused children showingthat their category boundaries in continua ranging from fearful toangry and from sad to angry were shifted such that they interpreteda large portion of these continua as angry; discrimination peakswere shifted together with these identification boundaries.
In addition to categorical perception of facial expressions, dis-crimination patterns show evidence of categorical perception offacial identity, where each category corresponds to a differentidentity. Beale and Keil (1995) found discrimination peaks alongmorphed continua between faces of famous individuals, and theseresults have been replicated with several different stimulus con-tinua constructed from familiar faces (Angeli, Davidoff, & Valen-tine, 2008; Campanella, Hanoteau, Seron, Joassin, & Bruyer,2003; Rotshtein, Henson, Treves, Driver, & Dolan, 2005). Thecategorical effects are stronger for familiar faces than for unfamil-iar faces (Angeli et al., 2008; Beale & Keil, 1995), but categoricaleffects have been demonstrated for continua involving previouslyunfamiliar faces as well (Levin & Beale, 2000; Stevenage, 1998).The strength of these effects for unfamiliar faces may derive froma combination of learning during the course of the experiment(Viviani, Binda, & Borsato, 2007), the use of labels during training(Kikutani, Roberson, & Hanley, 2008), and the inherent distinc-tiveness of endpoint stimuli in the continua (Angeli et al., 2008;Campanella et al., 2003).
Learning Artificial Categories
Several studies have demonstrated categorical effects that derivefrom categories learned in the laboratory, implying that the for-mation of novel categories can affect perception in laboratorysettings. As proposed by Liberman et al. (1957), this learningcomponent might take two forms: Acquired distinctiveness in-volves enhanced between-category discriminability, whereas ac-quired equivalence involves reduced within-category discrim-inability. Evidence for one or both of these processes has beenfound through categorization training in color perception (Ozgen& Davies, 2002) and auditory perception of white noise (Guenther,Husain, Cohen, & Shinn-Cunningham, 1999). These results extendto stimuli that vary along multiple dimensions as well. Categoriz-ing stimuli along two dimensions can lead to acquired distinctive-ness (Goldstone, 1994), and similarity ratings for drawings thatdiffer along several dimensions have shown acquired equivalencein response to categorization training (Livingston, Andrews, &Harnad, 1998). Such effects may arise partly from task-specificstrategies but likely involve changes in underlying stimulus rep-resentations as well (Goldstone et al., 2001).
Additionally, several studies have demonstrated that categoriesfor experimental stimuli are learned quickly over the course of anexperiment even without explicit training. Goldstone (1995) foundthat implicit shape-based categories influenced subjects’ percep-tion of hues and that these implicit categories changed dependingon the set of stimuli presented in the experiment. A similarexplanation has been proposed to account for subjects’ categoricaltreatment of unfamiliar face continua (Levin & Beale, 2000),where learned categories seem to correspond to continuum end-points. Gureckis and Goldstone (2008) demonstrated that subjectsare sensitive to the presence of distinct clusters of stimuli, showingincreased discriminability between clusters even when those clus-ters receive the same label. Furthermore, implicit categories havebeen used to explain why subjects often bias their perceptiontoward the mean value of a set of stimuli in an experiment.Huttenlocher et al. (2000) argued that subjects form an implicitcategory that includes the range of stimuli they have seen over thecourse of an experiment and that they use this implicit category to
754 FELDMAN, GRIFFITHS, AND MORGAN

correct for memory uncertainty when asked to reproduce a stim-ulus. Under their assumptions, the optimal way to correct formemory uncertainty using this implicit category is to bias allresponses toward the mean value of the category, which in thiscase is the mean value of the set of stimuli. The authors presenteda Bayesian analysis to account for bias in visual stimulus repro-duction that is nearly identical to the one-category model derivedhere in the context of speech perception, reflecting the similarstructure of the two problems and the generality of the approach.
Summary
The categorical effects in all of these domains are qualitativelysimilar, with enhanced between-category discriminability and re-duced within-category discriminability. Though there is some ev-idence that innate biases contribute to these perceptual patterns, thepatterns can be influenced by learned categories as well, even byimplicit categories that arise from specific distributions of exem-plars. Despite widespread interest in these phenomena, the reasonsand mechanisms behind the connection between categories andperception remain unclear. In the remainder of this article, weaddress this issue through a detailed exploration of the perceptualmagnet effect, which shares many qualitative features with thecategorical effects discussed above.
The Perceptual Magnet Effect
The phenomenon of categorical perception is robust in conso-nants, but the role of phonetic categories in the perception ofvowels has been more controversial. Acoustically, vowels arespecified primarily by their first and second formants, F1 and F2.Formants are bands of frequencies in which acoustic energy isconcentrated—peaks in the frequency spectrum—as a result ofresonances in the vocal tract. F1 is inversely correlated with tongueheight, whereas F2 is correlated with the proximity of the mostraised portion of the tongue to the front of the mouth. Thus, a fronthigh vowel such as /i/ (as in beet) spoken by a male talker typicallyhas center formant frequencies around 270 Hz (F1) and 2290 Hz(F2), and a back low vowel such as /a/ (as in father) spoken by amale typically has center formant frequencies around 730 Hz and1090 Hz (Peterson & Barney, 1952). Tokens of vowels are dis-tributed around these central values. A map of vowel space basedon data from Hillenbrand, Getty, Clark, and Wheeler (1995) isshown in Figure 1. Though frequencies are typically reported inHertz, most research on the perceptual magnet effect has used themel scale to represent psychophysical distance (e.g., Kuhl, 1991).The mel scale can be used to equate distances in psychophysicalspace because difference limens, the smallest detectable pitchdifferences, correspond to constant distances along this scale (S. S.Stevens, Volkmann, & Newman, 1937).
Early work suggested that vowel discrimination was not af-fected by native language categories (K. N. Stevens, Liberman,Studdert-Kennedy, & Ohman, 1969). However, later findings haverevealed a relationship between phonetic categories and vowelperception. Although within-category discrimination for vowels isbetter than for consonants, clear peaks in discrimination functionshave been found at vowel category boundaries, especially in tasksthat place a high memory load on subjects or that interfere withauditory memory (Beddor & Strange, 1982; Pisoni, 1975; Repp &
Crowder, 1990; Repp, Healy, & Crowder, 1979). In addition,between-category differences yield larger neural responses as mea-sured by event-related potentials (Naatanen et al., 1997; Winkler etal., 1999). Viewing phonetic discrimination in spatial terms, Kuhland colleagues have found evidence of shrunken perceptual spacespecifically near category prototypes, a phenomenon they havecalled the perceptual magnet effect (Grieser & Kuhl, 1989; Iverson& Kuhl, 1995; Kuhl, 1991; Kuhl, Williams, Lacerda, Stevens, &Lindblom, 1992).
Empirical Evidence
The first evidence for the perceptual magnet effect came fromexperiments with English-learning 6-month-old infants (Grieser &Kuhl, 1989). Using the conditioned head-turn procedure to assesswithin-category generalization of speech sounds, Grieser and Kuhlfound that a prototypical /i/ vowel based on mean formant valuesin Peterson and Barney’s production data was more likely to begeneralized to sounds surrounding it than was a nonprototypical /i/vowel. In addition, they found that infants’ rate of generalizationcorrelated with adult goodness ratings of the stimuli, so stimuli thatwere judged as the best exemplars of the /i/ category were gener-alized most often to neighboring stimuli. Kuhl (1991) showed thatadults, like infants, can discriminate stimuli near a nonprototype ofthe /i/ category better than stimuli near the prototype. Kuhl et al.(1992) tested English- and Swedish-learning infants on discrimi-nation near prototypical English /i/ (high, front, unrounded) andSwedish /y/ (high, front, rounded) sounds, again using the condi-tioned headturn procedure; they found that whereas English infantsgeneralized the /i/ sounds more than the /y/ sounds, Swedish-learning infants showed the reverse pattern. On the basis of thisevidence, Kuhl et al. described the perceptual magnet effect as alanguage-specific shrinking of perceptual space near native lan-guage phonetic category prototypes, with prototypes acting as
500100015002000250030003500
200
300
400
500
600
700
800
900
1000
1100
1200
Second Formant (Hz)
Firs
t For
man
t (H
z)
English Vowels
iI
e
εæ
u
o
a
Λ
Figure 1. Map of vowel space from Hillenbrand et al.’s (1995) produc-tion experiment. Ellipses delimit regions corresponding to approximately90% of tokens from each vowel category. Adapted from “Acoustic Char-acteristics of American English Vowels” by J. Hillenbrand, L. A. Getty,M. J. Clark, & K. Wheeler, 1995, Journal of the Acoustical Society ofAmerica, 97, p. 3103. Copyright 1995 by the Acoustical Society of Amer-ica. Reprinted with permission.
755INFLUENCE OF CATEGORIES ON PERCEPTION

perceptual magnets to exert a pull on neighboring speech sounds(see also Kuhl, 1993). They concluded that these language-specificprototypes are in place as young as 6 months.
Iverson and Kuhl (1995) used signal detection theory and mul-tidimensional scaling to produce a detailed perceptual map ofacoustic space near the prototypical and nonprototypical /i/ vowelsused in previous experiments. They tested adults’ discrimination of13 stimuli along a single vector in F1–F2 space, ranging from F1
of 197 Hz and F2 of 2489 Hz (classified as /i/) to F1 of 429 Hz andF2 of 1925 Hz (classified as /e/, as in bait). In both analyses, theauthors found shrinkage of perceptual space near the ends of thecontinuum, especially near the /i/ end. They found a peak indiscrimination near the center of the continuum between Stimulus6 and Stimulus 9. This supported previous analyses, suggestingthat perceptual space was shrunk near category centers and ex-panded near category edges. The effect has since been replicated inthe English /i/ category (Sussman & Lauckner-Morano, 1995), andevidence for poor discrimination near category prototypes hasbeen found for the German /i/ category (Diesch, Iverson, Ketter-mann, & Siebert, 1999). In addition, the effect has been found inthe /r/ and /l/ categories in English but not Japanese speakers(Iverson & Kuhl, 1996; Iverson et al., 2003), lending support to theidea of language-specific phonetic category prototypes.
Several studies have found large individual differences betweensubjects in stimulus goodness ratings and category identification,suggesting that it may be difficult to find vowel tokens that areprototypical across listeners and thus raising methodological ques-tions about experiments that examine the perceptual magnet effect(Frieda, Walley, Flege, & Sloane, 1999; Lively & Pisoni, 1997).However, data collected by Aaltonen, Eerola, Hellstrom, Uusi-paikka, and Lang (1997) on the /i/–/y/ contrast in Finnish adultsshowed that discrimination performance was less variable thanidentification performance, and on the basis of these results, theauthors argued that discrimination operates at a lower level thanovert identification tasks. A more serious challenge has come fromstudies that question the robustness of the perceptual magneteffect. Lively and Pisoni (1997) found no evidence of a perceptualmagnet effect in the English /i/ category, suggesting that listeners’discrimination patterns are sensitive to methodological details ordialect differences, although the authors could not identify thespecific factors responsible for these differences. The effect hasalso been difficult to isolate in vowels other than /i/: Sussman andGekas (1997) failed to find an effect in the English /I/ (as in bit)category, and Thyer, Hickson, and Dodd (2000) found the effect inthe /i/ category but found the reverse effect in the /ɔ/ (as in bought)category and failed to find any effect in other vowels. Whereasthere has been evidence linking changes in vowel perception todifferences in interstimulus interval (Pisoni, 1973) and task de-mands (Gerrits & Schouten, 2004), much of the variability foundin vowel perception has not been accounted for.
In summary, vowel perception has been shown to be continuousrather than categorical: Listeners can discriminate two vowels thatreceive the same category label. However, studies have suggestedthat even in vowels, perceptual space is shrunk near phoneticcategory centers and expanded near category edges. In addition,studies have shown substantial variability in the perceptual magneteffect. This variability seems to depend on the phonetic categorybeing tested and also on methodological details. On the basis of thepredictions of our rational model, we argue that some of this
variability is attributable to differences in category variance be-tween different phonetic categories and to differences in theamount of noise through which stimuli are heard.
Previous Models
Grieser and Kuhl (1989) originally described the perceptualmagnet effect in terms of category prototypes, arguing that pho-netic category prototypes exert a pull on nearby speech sounds andthus create an inverse correlation between goodness ratings anddiscriminability. Although this inverse correlation has been exam-ined more closely and has been used to argue that categoricalperception and the perceptual magnet effect are separate phenom-ena (Iverson & Kuhl, 2000), most computational models of theperceptual magnet effect have assumed that it is a categoricaleffect, parallel to categorical perception.
Lacerda (1995) began by assuming that the warping of percep-tual space emerges as a side effect of a classification problem: Thegoal of listeners is to classify speech sounds into phonetic catego-ries. His model assumes that perception has been trained withlabeled exemplars or that labels have been learned using otherinformation in the speech signal. In perceiving a new speechsound, listeners retrieve only the information from the speechsignal that is helpful in determining the sound’s category, or label,and they categorize and discriminate speech sounds on the basis ofthis information. Listeners can perceive a contrast only if the twosounds differ in category membership. Implementing this idea inneural models, Damper and Harnad (2000) showed that whentrained on two endpoint stimuli, neural networks will treat a voiceonset time continuum categorically. One limitation of the modelproposed by Lacerda (1995) is that it does not include a mecha-nism by which listeners can perceive within-category contrasts. Asdemonstrated by Lotto et al. (1998), this assumption cannot cap-ture the data on the perceptual magnet effect because within-category discriminability is higher than this account would predict.
Other neural network models have argued that the perceptualmagnet effect results not from category labels but instead fromspecific patterns in the distribution of speech sounds. Guenther andGjaja (1996) suggested that neural firing preferences in a neuralmap reflect Gaussian distributions of speech sounds in the inputand that because more central sounds have stronger neural repre-sentations than do more peripheral sounds, the population vectorrepresenting a speech sound that is halfway between the center andthe periphery of its phonetic category will appear closer to thecenter of the category than to its periphery. This model implementsthe idea that the perceptual magnet effect is a direct result ofuneven distributions of speech sounds in the input. Similarly,Vallabha and McClelland (2007) have shown that Hebbian learn-ing can produce attractors at the locations of Gaussian inputcategories and that the resulting neural representation fits humandata accurately. The idea that distributions of speech sounds in theinput can influence perception is supported by experimental evi-dence showing that adults and infants show better discriminationof a contrast embedded in a bimodal distribution of speech soundsthan of the same contrast embedded in a unimodal distribution(Maye & Gerken, 2000; Maye, Werker, & Gerken, 2002).
These previous models have provided process-level accounts ofhow the perceptual magnet effect might be implemented algorith-mically and neurally, but they leave several questions unanswered.
756 FELDMAN, GRIFFITHS, AND MORGAN

The prototype model does not give independent justification forthe assumption that prototypes should exert a pull on neighboringspeech sounds; several models cannot account for better thanchance within-category discriminability of vowels. Other modelsgive explanations of how the effect might occur but do not addressthe question of why it should occur. Our rational model fills thesegaps by providing a mathematical formalization of the perceptualmagnet effect at Marr’s (1982) computational level, consideringthe goals of the computation and the logic by which these goalscan be achieved. It gives independent justification for the optimal-ity of a perceptual bias toward category centers and simultaneouslypredicts a baseline level of within-category discrimination. Fur-thermore, our model goes beyond these previous models to makenovel predictions about the types of variability that should be seenin the perceptual magnet effect.
Theoretical Overview of the Model
Our model of the perceptual magnet effect focuses on the ideathat we can analyze speech perception as a kind of optimal statis-tical inference. The goal of listeners, in perceiving a speech sound,is to recover the phonetic detail of a speaker’s target production.They infer this target production using the information that isavailable to them from the speech signal and their prior knowledgeof phonetic categories. Here we give an intuitive overview of ourmodel in the context of speech perception, followed by a moregeneral mathematical account in the next section.
Phonetic categories are defined in the model as distributions ofspeech sounds. When speakers produce a speech sound, theychoose a phonetic category and then articulate a speech soundfrom that category. They can use their specific choice of speechsounds within the phonetic category to convey coarticulatory in-formation, affect, and other relevant information. Because thereare several factors that speakers might intend to convey, and giventhat each factor can cause small fluctuations in acoustics, weassume that the combination of these factors approximates aGaussian, or normal, distribution. Phonetic categories in the modelare thus Gaussian distributions of target speech sounds. Categoriesmay differ in the location of their means, or prototypes, and in theamount of variability they allow. In addition, categories may differin frequency so that some phonetic categories are used morefrequently in a language than others. The use of Gaussian phoneticcategories in this model does not reflect a belief that speech soundsactually fall into parametric distributions. Rather, the mathematicsof the model are easiest to derive in the case of Gaussian catego-ries. As discussed later, the general effects that are predicted in thecase of Gaussian categories are similar to those predicted for othertypes of unimodal distributions.
In the speech sound heard by listeners, the information about thetarget production is masked by various types of articulatory, acous-tic, and perceptual noise. The combination of these noise factors isapproximated through Gaussian noise, so that the speech soundheard is normally distributed around the speaker’s target produc-tion.
Formulated in this way, speech perception becomes a statisticalinference problem. When listeners perceive a speech sound, theycan assume it was generated by selecting a target production froma phonetic category and then generating a noisy speech sound onthe basis of the target production. Listeners hear the speech sound
and know the structure and location of phonetic categories in theirnative language. Given this information, they need to infer thespeaker’s target production. They infer phonetic detail in additionto category information in order to recover the gradient coarticu-latory and nonlinguistic information that the speaker intended.
With no prior information about phonetic categories, listeners’perception should be unbiased, given that under Gaussian noise,speech sounds are equally likely to be shifted in either direction. Inthis case, listeners’ safest strategy is to guess that the speech soundthey heard was the same as the target production. However,experienced listeners know that they are more likely to hear speechsounds near the centers of phonetic categories than speech soundsfarther from category centers. The optimal way to use this knowl-edge of phonetic categories to compensate for a noisy speechsignal is to bias perception toward the center of a category, towardthe most likely target productions.
In a hypothetical language with a single phonetic category,where listeners are certain that all sounds belong to that category,this perceptual bias toward the category mean causes all of per-ceptual space to shrink toward the center of the category. Theresulting perceptual pattern is shown in Figure 2a. If there is nouncertainty about category membership, perception of distantspeech sounds is more biased than perception of proximal speechsounds so that all of perceptual space is shrunk to the same degree.
In order to optimally infer a speaker’s target production in thecontext of multiple phonetic categories, listeners must determinewhich categories are likely to have generated a speech sound. Theycan then predict the speaker’s target production on the basis of thestructure of these categories. If they are certain of a speech sound’scategory membership, their perception of the speech sound shouldbe biased toward the mean of that category, as was the case in a
Actual Stimulus
Perceived Stimulus
(a)
Actual Stimulus
Perceived Stimulus
(b)
Figure 2. Predicted relationship between acoustic and perceptual space inthe case of (a) one category and (b) two categories.
757INFLUENCE OF CATEGORIES ON PERCEPTION

language with one phonetic category. This shrinks perceptualspace in areas of unambiguous categorization. If listeners areuncertain about category membership, they should take into ac-count all of the categories that could have generated the speechsound they heard, but they should weight the influence of eachcategory by the probability that the speech sound came from thatcategory. This ensures that under assumptions of equal frequencyand variance, nearby categories are weighted more heavily thanthose farther away. Perception of speech sounds precisely on theborder between two categories is pulled simultaneously towardboth category means, each canceling out the other’s effect. Per-ception of speech sounds that are near the border between catego-ries is biased toward the most likely category, but the competingcategory dampens the bias. The resulting pattern for the two-category case is shown in Figure 2b.
The interaction between the categories produces a pattern ofperceptual warping that is qualitatively similar to descriptions ofthe perceptual magnet effect and other categorical effects that havebeen reported in the literature. Speech sounds near category cen-ters are extremely close together in perceptual space, whereasspeech sounds near the edges of a category are much farther apart.This perceptual pattern results from a combination of two factors,both of which were proposed by Liberman et al. (1957) in refer-ence to categorical perception. The first is acquired equivalencewithin categories due to perceptual bias toward category means; thesecond is acquired distinctiveness between categories due to thepresence of multiple categories. Consistent with these predictions,infants acquiring language have shown both acquired distinctive-ness for phonemically distinct sounds and acquired equivalence formembers of a single phonemic category over the course of the firstyear of life (Kuhl et al., 2006).
Mathematical Presentation of the Model
This section formalizes the rational model within the frameworkof Bayesian inference. The model is potentially applicable to anyperceptual problem in which a perceiver needs to recover a targetfrom a noisy stimulus, using knowledge that the target has beensampled from a Gaussian category. We therefore present themathematics in general terms, referring to a generic stimulus S,target T, category c, category variance �c
2, and noise variance �S2.
In the specific case of speech perception, S corresponds to thespeech sound heard by the listener, T to the phonetic detail of aspeaker’s intended target production, and c to the language’sphonetic categories; the category variance �c
2 represents meaning-ful within-category variability, and the noise variance �S
2 repre-sents articulatory, acoustic, and perceptual noise in the speechsignal.
The formalization is based on a generative model in which atarget T is produced by sampling from a Gaussian category c withmean �c and variance �c
2. The target T is distributed as
T �c � N��c, �c2�. (1)
Perceivers cannot recover T directly, but instead perceive a noisystimulus S that is normally distributed around the target productionwith noise variance �S
2 such that
S�T � N�T, �S2�. (2)
Note that integrating over T yields
S�c � N��c, �c2 � �S
2�, (3)
indicating that under these assumptions, the stimuli that perceiversobserve are normally distributed around a category mean �c, witha variance that is a sum of the category variance and the noisevariance.
Given this generative model, perceivers can use Bayesian infer-ence to reconstruct the target from the noisy stimulus. Accordingto Bayes’ rule, given a set of hypotheses H and observed data d,the posterior probability of any given hypothesis h is
p�h�d� �p�d�h�p�h�
�h�H
p�d�h�p�h�, (4)
indicating that it is proportional to both the likelihood p(d�h),which is a measure of how well the hypothesis fits the data, andthe prior p(h), which gives the probability assigned to thehypothesis before any data were observed. Here, the stimulus Sserves as data d; the hypotheses under consideration are all thepossible targets T; and the prior p(h), which gives the proba-bility that any particular target will occur, is specified bycategory structure. In laying out the solution to this statisticalproblem, we begin with the case in which there is a singlecategory and then move to the more complex case of multiplecategories.
One Category
Perceivers are trying to infer the target T given stimulus S andcategory c, so they must calculate p(T �S, c). They can use Bayes’rule:
p�T �S, c� � p�S�T�p�T �c�. (5)
The likelihood p(S�T), given by the noise process (Equation 2),assigns highest probability to stimulus S, and the prior p(T �c),given by category structure (Equation 1), assigns highest proba-bility to the category mean. As described in Appendix A, theright-hand side of this equation can be simplified to yield aGaussian distribution
p�T �S, c� � N��c2S � �S
2�c
�c2 � �S
2 ,�c
2�S2
�c2 � �S
2� (6)
whose mean falls between the stimulus S and the categorymean �c.
This posterior probability distribution can be summarized by itsmean (the expectation of T given S and c),
E�T �S, c� ��c
2S � �S2�c
�c2 � �S
2 . (7)
The optimal guess at the target, then, is a weighted average of theobserved stimulus and the mean of the category that generated thestimulus, where the weighting is determined by the ratio of cate-
758 FELDMAN, GRIFFITHS, AND MORGAN

gory variance to noise variance.1 This equation formalizes the ideaof a perceptual magnet: The term �c pulls the perception of stimulitoward the category center, effectively shrinking perceptual spacearound the category.
Multiple Categories
The one-category case, while appropriate to explain perfor-mance on some perceptual tasks (e.g., Huttenlocher et al., 2000), isinappropriate for describing natural language. In a language withmultiple phonetic categories, listeners must consider many possi-ble source categories for a speech sound. We therefore extend themodel so that it applies to the case of multiple categories.
Upon observing a stimulus, perceivers can compute the proba-bility that it came from any particular category using Bayes’ rule
p�c�S� �p�S�c�p�c�
�c
p�S�c�p�c�, (8)
where p(S�c) is given by Equation 3 and p(c) reflects the priorprobability assigned to category c.
To compute the posterior on targets p(T �S), perceivers need tomarginalize, or sum, over categories,
p�T �S� � �c
p�T �S, c�p�c�S�. (9)
The first term on the right-hand side is given by Equation 6, andthe second term can be calculated from Bayes’ rule, as given byEquation 8. The posterior has the form of a mixture of Gaussians,where each Gaussian distribution represents the solution for asingle category. Restricting our analysis to the case of categorieswith equal category variance �c
2, we find that the mean of thisposterior probability distribution is
E�T �S� � �c
p�c�S��c
2S � �S2�c
�c2 � �S
2 , (10)
which can be rewritten as
E�T �S� ��c
2
�c2 � �S
2 S ��S
2
�c2 � �S
2�c
p�c�S��c . (11)
A full derivation of this expectation is given in Appendix A.Equation 11 gives the optimal guess for recovering a target in the
case of multiple categories. This guess is a weighted average of thestimulus S and the means �c of all the categories that might haveproduced S. When perceivers are certain of a stimulus’s category, thisequation reduces to Equation 7, and perception of a stimulus S isbiased toward the mean of its category. However, when a stimulus ison a border between two categories, the optimal guess at the target isinfluenced by both category means, and each category weakens theother’s effect (Figure 2b). Shrinkage of perceptual space is thusstrongest in areas of unambiguous categorization—the centers ofcategories—and weakest at category boundaries.
This analysis demonstrates that warping of perceptual space that isqualitatively consistent with the perceptual magnet effect emerges asthe result of optimal perception of noisy stimuli. In the next twosections, we provide a quantitative investigation of the model’s pre-
dictions in the context of speech perception. The next section focuseson comparing the predictions of the model with empirical data on theperceptual magnet effect using phonetic category parameters that areestimated from human data. In the subsequent section, we examinethe consequences of manipulating these parameters, relating the mod-el’s behavior to further results from the literature.
Quantitative Evaluation
In this section, we test the model’s predictions quantitativelyagainst the multidimensional scaling results from Experiment 3 inIverson and Kuhl (1995). These data were selected as a modelingtarget because they give a clean, precise spatial representation ofthe warping associated with the perceptual magnet effect, mapping13 /i/ and /e/ stimuli that are separated by equal psychoacousticdistance onto their corresponding locations in perceptual space.Because these multidimensional scaling data constitute the basisfor both this simulation and the experiment reported below, wedescribe the experimental setup and results in some detail here.
Iverson and Kuhl’s (1995) multidimensional scaling experimentwas conducted with thirteen vowel stimuli along a single contin-uum in F1–F2 space ranging from /i/ to /e/, whose exact formantvalues are shown in Table 1. The stimuli were designed to beequally spaced when measured along the mel scale, which equatesdistances on the basis of difference limens (S. S. Stevens et al.,1937). Subjects performed an AX discrimination task in whichthey pressed and held a button to begin a trial, releasing the buttonas quickly as possible if they believed the two stimuli to bedifferent or holding the button for the remainder of the trial (2000ms) if they heard no difference between the two stimuli. Subjectsheard 156 “different” trials, consisting of all possible ordered pairsof nonidentical stimuli, and 52 “same” trials, four of each of the 13stimuli.
Iverson and Kuhl (1995) reported a total accuracy rate of 77% ondifferent trials and a false alarm rate of 31% on same trials, but theydid not further explore direct accuracy measures. Instead, they createda full similarity matrix consisting of log reaction times of differentresponses for each pair of stimuli. To avoid sparse data in the cellswhere most participants incorrectly responded that two stimuli wereidentical, the authors replaced all same responses with the trial length,2,000 ms, effectively making them into different responses with longreaction times. This similarity matrix was used for multidimensionalscaling, which finds a perceptual map that is most consistent with agiven similarity matrix. In this case, the authors constrained thesolution to be in one dimension and assumed a linear relation betweensimilarity values and distance in perceptual space. The interstimulusdistances obtained from this analysis are shown in Figure 3. Theperceptual map obtained through multidimensional scaling showedthat neighboring stimuli near the ends of the stimulus vector wereseparated by less perceptual distance than neighboring stimuli near thecenter of the vector. These results agreed qualitatively with dataobtained in Experiment 2 of the same article (Iverson & Kuhl, 1995),which used d as an unbiased estimate of perceptual distance. Wechose the multidimensional scaling data as our modeling target be-cause they are more extensive than the d data, encompassing theentire range of stimuli.
1 The expectation is optimal if the penalty for misidentifying a stimulusincreases with squared distance from the target.
759INFLUENCE OF CATEGORIES ON PERCEPTION

We tested a two-category version of the rational model todetermine whether parameters could be found that would repro-duce these empirical data. Equal variance was assumed for the twocategories, and parameters in the model were based as much aspossible on empirical measures in order to reduce the number offree parameters. The simulation was constrained to a single di-mension along the direction of the stimulus vector. The parametersthat needed to be specified were as follows:
� /i/: /i/ category mean
�/e/: /e/ category mean
�c2: category variance
�S2: uncertainty in the speech signal.
Subject goodness ratings from Iverson and Kuhl (1995) werefirst used to specify the mean of the /i/ category, �/i/. Thesegoodness ratings indicated that the best exemplars of the /i/ cate-gory were Stimuli 2 and 3, so the mean of the /i/ category was sethalfway between these two stimuli.2
The mean of the /e/ category, �/e/, and the sum of the variances,�c
2 �S2, were calculated as described in Appendix B on the basis
of phoneme identification curves from Lotto et al. (1998). Theseidentification curves were produced through an experiment inwhich subjects were played pairs of stimuli from the 13-stimulusvector and asked to identify either the first or the second stimulusin the pair as /i/ or /e/. The other stimulus in the pair was one oftwo reference stimuli, either Stimulus 5 or Stimulus 9. Lotto et al.obtained two distinct curves in these two conditions, showing thatthe phoneme boundary shifted depending on the identity of thereference stimulus. Because the task used for multidimensionalscaling involved presentation of all possible pairings of the 13stimuli, the phoneme boundary in the model was assumed to behalfway between the boundaries that appeared in these two refer-ent conditions. In order to identify this boundary, we fit twologistic curves to the prototype and nonprototype identification
curves. The two curves were constrained to have the same gain,and the biases of the two curves were averaged to obtain a singlebias term. On the basis of Equation 34, these values indicated that�/e/ should be placed just to the left of Stimulus 13; Equation 35yielded a value of 10,316 for �c
2 �S2. The resulting discriminative
boundary is shown together with the data from Lotto et al. (1998)in Figure 4.
The ratio between the category variance �c2 and the speech signal
noise �S2 was the only remaining free parameter, and we chose its
value so as to maximize the fit to Iverson and Kuhl’s (1995) multi-dimensional scaling data. This direct comparison was made by cal-culating the expectation E[T �S] for each of the 13 stimuli according toEquation 11 and then determining the distance in mels between theexpected values of neighboring stimuli. These distances were com-pared with the distances between stimuli in the multidimensionalscaling solution. Because multidimensional scaling gives relative, andnot absolute, distances between stimuli, we evaluated this comparisonon the basis of whether mel distances in the model were proportionalto distances found through multidimensional scaling. As shown inFigure 3, the model yielded an extremely close fit to the empiricaldata, yielding interstimulus distances that were proportional to thosefound in multidimensional scaling (r � .97). This simulation used thefollowing parameters:
� /i/: F1 � 224 Hz, F2 � 2413 Hz
� /e/: F1 � 423 Hz, F2 � 1936 Hz
2 Note that this is more extreme than the mean value of the /i/ categoryproduced by male speakers in Peterson and Barney (1952), which wouldinstead correspond to Stimulus 5.
1 2 3 4 5 6 7 8 9 10 11 12 130
2Relative Distances Between Neighboring Stimuli
Rel
ativ
e P
erce
ptua
l Dis
tanc
e
Stimulus Number
MDSModel
Figure 3. Relative distances between neighboring stimuli in Iverson andKuhl’s (1995) multidimensional scaling (MDS) analysis and in the model.Adapted from P. Iverson & P. K. Kuhl, “Mapping the Perceptual MagnetEffect for Speech Using Signal Detection Theory and MultidimensionalScaling, 1995, Journal of the Acoustical Society of America, 97, p. 559.Copyright 1995 by the Acoustical Society of America. Reprinted withpermission.
Table 1Formant Values for Stimuli Used in the MultidimensionalScaling Experiment, Reported in Iverson and Kuhl (2000)
Stimulus no. F1 (Hz) F2 (Hz)
1 197 24892 215 24383 233 23884 251 23395 270 22906 289 22427 308 21958 327 21489 347 2102
10 367 205711 387 201212 408 196813 429 1925
Note. F1 and F2 represent the first and second formants, respectively.Reprinted from P. Iverson & P. K. Kuhl, “Perceptual Magnet and PhonemeBoundary Effects in Speech Perception: Do They Arise From a CommonMechanism?” 2000, Perception & Psychophysics, 62, p. 879.
760 FELDMAN, GRIFFITHS, AND MORGAN

�c2: 5,873 (�c � 77 mels)
�S2: 4,443 (�S � 67 mels)
The fit obtained between the simulation and the empiricaldata is extremely close; however, the model parameters derivedin this simulation are meant to serve only as a first approxima-tion of the actual parameters in vowel perception. Because ofthe variability that has been found in subjects’ goodness ratingsof speech stimuli, it is likely that these parameters are some-what off from their actual values, and it is also possible that theparameters vary between subjects. Instead, the simulation is aconcrete demonstration that the model can reproduce empiricaldata on the perceptual magnet effect quantitatively as well asqualitatively using a reasonable set of parameters, supportingthe viability of this rational account.
Effects of Frequency, Variability, and Noise
The previous section has shown a direct quantitative corre-spondence between model predictions and empirical data. Inthis section we explore the behavior of the rational model undervarious parameter combinations, using the parameters derivedin the previous section as a baseline for comparison. Thesesimulations serve a dual purpose: They establish the robustnessof the qualitative behavior of the model under a range ofparameters, and they make predictions about the types of vari-ability that should occur when category frequency, category
variance, and speech signal noise are varied. We first introduceseveral quantitative measures that can be used to visualize theextent of perceptual warping and subsequently use these mea-sures to illustrate the effects of parameter manipulations.
Characterizing Perceptual Warping
Our statistical analysis establishes a simple function mappinga stimulus, S, to a percept of the intended target, given byE[T �S]. This is a linear mapping in the one-category case(Equation 7), but it becomes nonlinear in the case of multiplecategories (Equation 11). Figure 5 illustrates the form of thismapping in the cases of one category and two categories withequal variance. Note that this function is not an identificationfunction: The vertical axis represents the exact location of astimulus in a continuous perceptual space, E[T �S], not theprobability with which that stimulus receives a particular label.Slopes that are more horizontal indicate that stimuli are closerin perceptual space than in acoustic space. In the two-categorycase, stimuli that are equally spaced in acoustic space arenevertheless clumped near category centers in perceptual space,as shown by the two nearly horizontal portions of the curve nearthe category means. In order to analyze this behavior moreclosely, we examine the relationship among three measures:identification, the posterior probability of category member-ship; displacement, the difference between the actual and per-ceived stimulus; and warping, the degree of shrinkage or ex-pansion of perceptual space.
The identification function p(c�S) gives the probability of astimulus having been generated by a particular category, as calcu-lated in Equation 8. This function is then used to compute theposterior on targets, summing over categories. In the case of twocategories with equal variance, the identification function takes theform of a logistic function. Specifically, the posterior probabilityof category membership can be written as
Category 1 Mean Category 2 Mean
Cat. 1 Mean
Cat. 2 Mean
Actual Stimulus
Per
ceiv
ed S
timul
us
Location in Perceptual Space
Two CategoriesOne Category
Figure 5. Model predictions for location of stimuli in perceptual spacerelative to acoustic space. Dashed lines indicate patterns corresponding toa single category; solid lines indicate patterns corresponding to two cate-gories of equal variance. Cat. � Category.
1 2 3 4 5 6 7 8 9 10 11 12 130
1
Stimulus Number
Per
cent
age
of T
rials
Cla
ssifi
ed a
s /i/
Discriminative Boundary Between /i/ and /e/
Ref. Stimulus 5Ref. Stimulus 9Model
Figure 4. Identification percentages obtained by Lotto et al. (1998) withReference (Ref.) Stimuli 5 and 9 were averaged to produce a singleintermediate identification curve in the model (solid line). Adapted fromA. J. Lotto, K. R. Kluender, & L. L. Holt, “Depolarizing the PerceptualMagnet Effect,” 1998, Journal of the Acoustical Society of America, 103,p. 3650. Copyright 1998 by the Acoustical Society of America. Reprintedwith permission.
761INFLUENCE OF CATEGORIES ON PERCEPTION

p�c1�S� �1
1 � e�gSb , (12)
where the gain and bias of the logistic are given by
g ��1 � �2
�c2 � �S
2
and
b ��1
2 � �22
2��c2 � �S
2�.
An identification function of this form is illustrated in Figure 6a.In areas of certain categorization, the identification function is ateither 1 or 0; a value of 0.5 indicates maximum uncertainty aboutcategory membership.
Displacement involves a comparison between the location of astimulus in perceptual space E[T �S] and its location in acousticspace S. It corresponds to the amount of bias in perceiving astimulus. We can calculate this quantity as
E�T �S� � S ��c
2
�c2 � �S
2S ��S
2
�c2 � �S
2 �c
p�c�S��c � S
��S
2
�c2 � �S
2 ��c
p�c�S��c � S� . (13)
In the one-category case, this means that the amount ofdisplacement is proportional to the distance between the stim-ulus S and the mean �c of the category. As stimuli get fartheraway from the category mean, they are pulled proportionatelyfarther toward the center of the category. The dashed lines inFigure 6b show two cases of this. In the case of multiplecategories, the amount of displacement is proportional to thedistance between S and a weighted average of the means �c ofmore than one category. This is shown in the solid line, whereambiguous stimuli are displaced less than would be predicted inthe one-category case because of the competing influence of asecond category mean.
Finally, perceptual warping can be characterized by the distancebetween two neighboring points in perceptual space that are sep-arated by a fixed step S in acoustic space. This quantity isreflected in the distance between neighboring points on the bottomlayer of each diagram in Figure 2. By the standard definition of thederivative as a limit, as S approaches zero this measure ofperceptual warping corresponds to the derivative of E[T �S] withrespect to S. This derivative is
dE�T �S�
dS�
�c2
�c2 � �S
2 ��S
2
�c2 � �S
2�c
�c
dp(c�S)
dS, (14)
where the last term is the derivative of the logistic functiongiven in Equation 12. This equation demonstrates that distancebetween two neighboring points in perceptual space is a linearfunction of the rate of change of p(c�S), which measures cate-gory membership of stimulus S. Probabilities of category as-signments are changing most rapidly near category boundaries,resulting in greater perceptual distances between neighboringstimuli near the edges of categories. This is shown in Figure 6c,
and the form of the derivative is described in more detail inAppendix C.
In summary, the identification function (Equation 12) showsa sharp decrease at the location of the category boundary, goingfrom a value near one (assignment to Category 1) to a value
Category 1 Mean Category 2 Mean
0
1
Category Identification
Stimulus Location
Pro
babi
lity
of B
elon
ging
to C
ateg
ory
1
(a)
Category 1 Mean Category 2 Mean
0
Stimulus Location
Am
ount
of D
ispl
acem
ent
Stimulus Displacement
Two CategoriesOne Category
(b)
Category 1 Mean Category 2 Mean
1
Stimulus Location
Rel
ativ
e P
erce
ptua
l Dis
tanc
e
Warping of Perceptual Space
Two CategoriesOne Category
(c)
Figure 6. Model predictions for (a) identification, (b) displacement, and(c) warping. Dashed lines indicate patterns corresponding to a singlecategory; solid lines indicate patterns corresponding to two categories ofequal variance.
762 FELDMAN, GRIFFITHS, AND MORGAN

near zero (assignment to Category 2). Perceptual bias, or dis-placement (Equation 13), is a linear function of distance fromthe mean in the one-category case but is more complex in thetwo-category case; it is positive when stimuli are displaced in apositive direction and negative when stimuli are displaced in anegative direction. Finally, warping of perceptual space (Equa-tion 14), which has a value greater than one in areas whereperceptual space is expanded and a value less than one in areaswhere perceptual space is shrunk, shows that all of perceptualspace is shrunk in the one-category case but that there is an areaof expanded perceptual space between categories in the two-category case. Qualitatively, we note that displacement is al-ways in the direction of the most probable category mean andthat the highest perceptual distance between stimuli occurs nearcategory boundaries. This is compatible with the idea thatcategories function like perceptual magnets and also with theobservation that perceptual space is shrunk most in the centersof phonetic categories. In the remainder of this section, we usethese measures to explore the model’s behavior under variousparameter manipulations that simulate changes in phonetic cat-egory frequency, within-category variability, and speech signalnoise.
Frequency
Manipulating the frequency of phonetic categories correspondsin our model to manipulating their prior probability. This manip-ulation causes a shift in the discriminative boundary between twocategories, as described in Appendix B. In Figure 7a, the boundaryis shifted toward the category with lower prior probability so thata larger region of acoustic space between the two categories isclassified as belonging to the category with higher prior probabil-ity. Figure 7b shows that when the prior probability of Category 1is increased, most stimuli between the two categories are shifted inthe negative direction toward the mean of that category. Thisoccurs because more sounds are classified as being part of Cate-gory 1. Decreasing the prior probability of Category 1 yields asimilar shift in the opposite direction. Figure 7c shows that thelocation of the expansion of perceptual space follows the shift inthe category boundary.
This shift qualitatively resembles the boundary shift that hasbeen documented on the basis of lexical context (Ganong, 1980).In contexts where one phoneme would form a lexical item and theother would not, phoneme boundaries are shifted toward the pho-neme that makes the nonword, so that more of the sounds betweencategories are classified as the phoneme that would yield a word.Similar effects have also been found for lexical frequency (Con-nine, Titone, & Wang, 1993) and phonotactic probability (Massaro& Cohen, 1983; Pitt & McQueen, 1998). To model such a shiftusing the rational model, information about a specific lexical orphonological context needs to be encoded in the prior p(c). Theprior distribution would thus reflect the information about thefrequency of occurrence of a phonetic category in a specificcontext. The rational model then predicts that the boundary shift
can be modeled by a bias term of magnitude logp(c2)
p(c1)and that the
peak in discrimination should shift together with the categoryboundary.
Variability
The category variance parameter indicates the amount of mean-ingful variability that is allowed within a phonetic category. Onecorrelate of this might be the amount of coarticulation that a
Category 1 Mean Category 2 Mean
0
1
Category Identification
Stimulus Location
Pro
babi
lity
of B
elon
ging
to C
ateg
ory
1
Original PriorHigh PriorLow Prior
(a)
Category 1 Mean Category 2 Mean
0
Stimulus Displacement
Stimulus Location
Am
ount
of D
ispl
acem
ent
Original PriorHigh PriorLow Prior
(b)
Category 1 Mean Category 2 Mean
1
Warping of Perceptual Space
Stimulus Location
Rel
ativ
e P
erce
ptua
l Dis
tanc
e
Original PriorHigh PriorLow Prior
(c)
Figure 7. Effects of prior probability manipulation on (a) identification,(b) displacement, and (c) warping. The prior probability of category 1,p(c1), was either increased or decreased while all other model parameterswere held constant.
763INFLUENCE OF CATEGORIES ON PERCEPTION

category allows: Categories that undergo strong coarticulatoryeffects have high variance, whereas categories that are resistant tocoarticulation have lower variance.3 In the model, categories withhigh variability should differ from categories with low variabilityin two ways. First, the discriminative boundary between the cat-egories should be either shallow, in the case of high variability, orsharp, in the case of low variability (Figure 8a). This means thatlisteners should be nearly deterministic in inferring which categoryproduced a sound in the case of low variability, whereas theyshould be more willing to consider both categories if the categorieshave high variability. This pattern has been demonstrated empir-ically by Clayards, Tanenhaus, Aslin, and Jacobs (2008), whoshowed that the steepness of subjects’ identification functionsalong a /p/–/b/ continuum depends on the amount of categoryvariability in the experimental stimuli.
In addition to this change in boundary shape, the rational modelpredicts that the amount of variability should affect the weightgiven to the category means relative to the stimulus S whenperceiving acoustic detail. Less variability within a category im-plies a stronger constraint on the sounds that the listener expects tohear, and this gives more weight to the category means. Thisshould cause more extreme shrinkage of perceptual space in cat-egories with low variance.
These two factors should combine to yield extremely categoricalperception in categories with low variability and perception that isless categorical in categories with high variability. Figure 8bshows that displacement has a higher magnitude than baseline forstimuli both within and between categories when category vari-ance is decreased. Displacement is reduced with higher categoryvariance. Figure 8c shows the increased expansion of perceptualspace between categories and the increased shrinkage within cat-egories that result from low category variance. In contrast, cate-gories with high variance yield more veridical perception.
Differences in category variance might explain why it is easierto find perceptual magnet effects in some phonetic categories thanin others. According to vowel production data from Hillenbrand etal. (1995), reproduced here in Figure 1, the /i/ category has lowvariance along the dimension tested by Iverson and Kuhl (1995).The difficulty in reproducing the effect in other vowel categoriesmight be partly attributable to the fact that listeners have weakerprior expectations about which vowel sounds speakers might pro-duce within these categories.
This parameter manipulation can also be used to explore thelimits on category variance: The rational model places an implicitupper limit on category variance if one is to observe enhanceddiscrimination between categories. This limit occurs when catego-ries are separated by less than two standard deviations, that is,when the standard deviation increases to half the distance to theneighboring category. When the category variance reaches thispoint, the distribution of speech sounds in the two categoriesbecomes unimodal, and the acquired distinctiveness between cat-egories disappears. Instead of causing enhanced discrimination atthe category boundary, noise now causes all speech sounds to bepulled inward toward the space between the two category means,as illustrated in Figure 9. Shrinkage of perceptual space may beslightly less between categories than within categories, but all ofperceptual space is pulled toward the center of the distribution.This perceptual pattern resembles the pattern that would be pre-dicted if these speech sounds all derived from a single category,
3 Coarticulatory effects are context dependent rather than being aninherent property of specific phonetic categories. However, listenersshould be able to estimate the typical range of coarticulation that occurswithin specific contexts and thus obtain a context-specific estimate ofcategory variance.
Category 1 Mean Category 2 Mean
0
1
Category Identification
Stimulus Location
Pro
babi
lity
of B
elon
ging
to C
ateg
ory
1
Original VarianceHigh VarianceLow Variance
(a)
Category 1 Mean Category 2 Mean
0
Stimulus Displacement
Stimulus Location
Am
ount
of D
ispl
acem
ent
Original VarianceHigh VarianceLow Variance
(b)
Category 1 Mean Category 2 Mean
1
Warping of Perceptual Space
Stimulus Location
Rel
ativ
e P
erce
ptua
l Dis
tanc
e
Original VarianceHigh VarianceLow Variance
(c)
Figure 8. Effects of category variance on (a) identification, (b) displace-ment, and (c) warping. The category variance parameter �c
2 was eitherincreased or decreased while all other model parameters were held con-stant.
764 FELDMAN, GRIFFITHS, AND MORGAN

indicating that it is the distribution of speech sounds in the input,rather than the explicit category structure, that produces perceptualwarping in the model.
Noise
Manipulating the speech signal noise also affects the optimalsolution in two different ways. More noise means that listenersshould be relying more on prior category information and less onthe speech sound they hear, yielding more extreme shrinkage ofperceptual space within categories. However, adding noise to thespeech signal also makes the boundary between categories lesssharp so that in high-noise environments, listeners are uncertain ofspeech sounds’ category membership (Figure 10a). This combina-tion of factors produces a complex effect: Whereas adding lowlevels of noise makes perception more categorical, there comes apoint where noise is too high to determine which category pro-duced a speech sound, blurring the boundary between categories.
With very low levels of speech signal noise, perception is onlyslightly biased (Figure 10b), and there is a very low degree ofshrinkage and expansion of perceptual space (Figure 10c). Thisoccurs because the model relies primarily on the speech sound inlow-noise conditions, with only a small influence from categoryinformation. As noise levels increase to those used in the simula-tion in the previous section, the amount of perceptual bias andwarping both increase. With further increases in speech signalnoise, however, the shallow identification function begins to in-terfere with the availability of category information. For unambig-uous speech sounds, displacement and shrinkage are both in-creased, as shown at the edges of the graphs in Figure 10.However, this does not simultaneously expand perceptual spacebetween the categories. Instead, the high uncertainty about cate-gory membership causes reduced expansion at points betweencategories, dampening the difference between between-categoryand within-category discriminability.
The complex interaction between perceptual warping andspeech signal noise suggests that there is some level of noise forwhich one would measure between-category discriminability asmuch higher than within-category discriminability. However, forvery low levels of noise and for very high levels of noise, thisdifference would be much less noticeable. This suggests a possibleexplanation for variability that has been found in perceptual warp-ing even among studies that have examined the English /i/ cate-
gory (e.g., Lively & Pisoni, 1997). Extremely low levels of am-bient noise should dampen the perceptual magnet effect, whereasthe effect should be more prominent at higher levels of ambientnoise.
A further prediction regarding speech signal noise concerns itseffect on boundary shifts. As discussed above, the rational model
Category 1 Mean Category 2 Mean
0
1
Category Identification
Stimulus Location
Pro
babi
lity
of B
elon
ging
to C
ateg
ory
1
Original NoiseHigh NoiseLow Noise
(a)
Category 1 Mean Category 2 Mean
0
Stimulus Displacement
Stimulus Location
Am
ount
of D
ispl
acem
ent
Original NoiseHigh NoiseLow Noise
(b)
Category 1 Mean Category 2 Mean
1
Warping of Perceptual Space
Stimulus Location
Rel
ativ
e P
erce
ptua
l Dis
tanc
e
Original NoiseHigh NoiseLow Noise
(c)
Figure 10. Effects of speech signal noise on (a) identification, (b) dis-placement, and (c) warping. The speech signal noise parameter �S
2 waseither increased or decreased while all other model parameters were heldconstant.
Actual Stimulus
Perceived Stimulus
Figure 9. Categories that overlap to form a single unimodal distributionact perceptually like a single category: Speech sounds are pulled toward apoint between the two categories.
765INFLUENCE OF CATEGORIES ON PERCEPTION

predicts that when prior probabilities p(c) are different betweentwo categories, there should be a boundary shift caused by a bias
term of logp(c2)
p(c1). This bias term produces the largest boundary
shift for small values of the gain parameter, which correspond toa shallow category boundary (see Appendix B). High noise vari-ance produces this type of shallow category boundary, giving thebias term a large effect. This is illustrated in Figure 11, where forconstant changes in prior probability, larger boundary shifts occurat higher noise levels. This prediction qualitatively resembles dataon lexically driven boundary shifts: Larger shifts occur whenstimuli are low-pass filtered (McQueen, 1991) or presented inwhite noise (Burton & Blumstein, 1995).
Summary
Simulations in this section have shown that the qualitativeperceptual patterns predicted by the rational model are the sameunder nearly all parameter combinations. The exceptions to this arethe case of no noise, in which perception should be veridical, andthe case of extremely high category variance or extremely highnoise, in which listeners cannot distinguish between the two cat-egories and effectively treat them as a single, larger category. Inaddition, these simulations have examined three types of variabil-ity in perceptual patterns. Shifts in boundary location occur in themodel as a result of changes in the prior probability of a phoneticcategory, and these shifts mirror lexical effects that have beenfound empirically (Ganong, 1980). Differences in the degree ofcategorical perception in the model depend on the amount ofmeaningful variability in a category, and these predictions areconsistent with the observation that the /i/ category has low vari-ance along the relevant dimension. Finally, the model predictseffects of ambient noise on the degree of perceptual warping, amethodological detail that might explain the variability of percep-tual patterns under different experimental conditions.
Testing the Predicted Effects of Noise
Simulations in the previous section suggested that ambient noiselevels might be partially responsible for the contradictory evidencethat has been found in previous empirical studies of the perceptualmagnet effect. In this section, we present an experiment to test themodel’s predictions with respect to changes in speech signal noise.The rational model makes two predictions about the effects ofnoise. The first prediction is that noise should yield a shallowercategory boundary, making it difficult at high noise levels todetermine which category produced a speech sound. This effectshould lower the discrimination peak between categories at veryhigh levels of noise and is predicted by any model in which noiseincreases the variance of speech sounds from a phonetic category.The second prediction is that listeners should weight acoustic andcategory information differentially depending on the amount ofspeech signal noise. As noise levels increase, they should relymore on category information, and perception should becomemore categorical. This effect is predicted by the rational model butnot by other models of the perceptual magnet effect, as discussedin detail later in the article. Although this effect is overshadowedby the shallow category boundary at very high noise levels, ex-amining low and intermediate levels of noise allows us to test thissecond prediction.
Previous research into effects of uncertainty on speech perceptionhas focused on the role of memory uncertainty. Pisoni (1973) foundevidence that within-category discrimination, in comparison withbetween-category discrimination, shows a larger decrease in accuracywith longer interstimulus intervals. Pisoni interpreted these results asevidence that within-category discrimination relies on acoustic (ratherthan phonetic) memory and that acoustic memory traces decay withlonger interstimulus intervals. Iverson and Kuhl (1995) also investi-gated the perceptual magnet effect at three different interstimulusintervals; though they did not explicitly discuss changes in warpingrelated to interstimulus interval, within-category clusters appear to betighter in their 2,500-ms condition than in their 250-ms condition.These results are consistent with the idea that memory uncertaintyincreases with longer interstimulus intervals.
Several studies have also studied asymmetries in discrimination,under the assumption that memory decay will have a greater effect onthe stimulus that is presented first. However, many of these studieshave produced contradictory results, making the effects of memoryuncertainty difficult to interpret (Polka & Bohn, 2003; Repp & Crow-der, 1990). Furthermore, data from Pisoni (1973) indicate that longerinterstimulus intervals do not necessarily increase uncertainty: Dis-crimination performance was worse with a 0-ms interstimulus intervalthan with a 250-ms interstimulus interval.
Adding white noise is a more direct method of introducingspeech signal uncertainty, and its addition to speech stimuli hasconsistently been shown to decrease subjects’ ability to identifystimuli accurately. Subjects make more identification errors (G. A.Miller & Nicely, 1955) and display a shallower identificationfunction (Formby, Childers, & Lalwani, 1996) with increasednoise, consistent with the rational model’s predictions. Although itis known that subjects rely to some extent on both temporal andspectral cues in noisy conditions (Xu & Zheng, 2007), it is notknown how reliance on these acoustic cues compares with relianceon prior information about category structure. To test whetherreliance on category information is greater in higher noise condi-
Category 1 Mean Category 2 Mean
0
1
Effects of Noise on Frequency−Based Boundary Shifts
Stimulus Location
Pro
babi
lity
of B
elon
ging
to C
ateg
ory
1
High NoiseLow Noise
Figure 11. Effects of speech signal noise on the magnitude of a boundaryshift. Simulations at both noise levels used prior probability values for c1
of 0.3 (left boundary) and 0.7 (right boundary). The boundary shift isnevertheless larger for higher levels of speech signal noise.
766 FELDMAN, GRIFFITHS, AND MORGAN

tions than in lower noise conditions, we replicated Experiment 3 ofIverson and Kuhl (1995)—their multidimensional scaling experi-ment—with and without the presence of background white noise.
The rational model predicts that perceptual space should bedistorted to different degrees in the noise and no-noise conditions.At moderate levels of noise, we should observe more perceptualwarping than with no noise because of higher reliance on categoryinformation. At very high noise levels, however, if subjects areunable to make reliable category assignments, warping shoulddecrease; as noted, this decrease is predicted by any model inwhich subjects are using category membership to guide theirjudgments. Thus, whereas the model is compatible with changes inboth directions for different noise levels, our aim is to find levelsof noise for which warping is higher with increased speech signalnoise. Moreover, manipulating the noise parameter in the rationalmodel should account for behavioral differences due to changingnoise levels.
Method
Subjects. Forty adult participants were recruited from theBrown University community. All were native English speakerswith no known hearing impairments. Participants were compen-sated at a rate of $8 per hour. Data from two additional participantswere excluded, one because of equipment failure and one becauseof failure to understand the task instructions.
Apparatus. Stimuli were presented through noise cancellationheadphones, Bose Aviation Headset model AHX-02, from a com-puter at comfortable listening levels. Subjects’ responses wereentered and recorded using the computer that presented the stimuli.The presentation of the stimuli was controlled through Bliss soft-ware (Mertus, 2004), developed at Brown University for use inspeech perception research.
Stimuli. Thirteen /i/ and /e/ stimuli, modeled after the stimuli inIverson and Kuhl (1995), were created with the KlattWorks software(McMurray, 2009). Stimuli varied along a single F1–F2 vector thatranged from an F1 of 197 Hz and an F2 of 2489 Hz to an F1 of 429Hz and an F2 of 1925 Hz. The stimuli were spaced at equal intervalsof 30 mels; exact formant values are shown in Table 1. For all stimuli,F3 was set at 3010 Hz, F4 at 3300 Hz, and F5 at 3850 Hz. Thebandwidths for the five formants were 53, 77, 111, 175, and 281 Hz.Each stimulus was 435 ms long. Pitch rose from 112 to 130 Hz overthe first 100 ms and dropped to 92 Hz over the remainder of thestimulus. Stimuli were normalized in Praat (Boersma, 2001) to havea mean intensity of 70 dB.
For stimuli in the noise condition, we created 435 ms of whitenoise using Praat by sampling randomly from a uniform [�0.5,0.5] distribution at a sampling rate of 11025 Hz. The mean inten-sity of this waveform was then scaled to 70 dB. The white noisewas added to each of the 13 stimuli, creating a set of stimuli witha zero signal-to-noise ratio.
Procedure. Subjects were assigned to either the no-noise orthe noise condition. After reading and signing a consent form,they completed ten practice trials designed to familiarize themwith the task and stimuli and subsequently completed a singleblock of 208 trials. This block included 52 “same” trials, fourtrials for each of 13 stimuli, and 156 “different” trials in whichall possible ordered pairs of nonidentical stimuli were presentedonce each. In each trial, participants heard two stimuli sequen-
tially with a 250-ms interstimulus interval. They were in-structed to respond as quickly as possible, pressing one buttonif the two stimuli were identical and another button if theycould hear a difference between the two stimuli. Responses andreaction times were recorded.
This procedure was nearly identical to that used by Iverson andKuhl (1995), though the response method differed slightly in orderto provide reaction times for same responses in addition to differ-ent responses. We also eliminated the response deadline of 2000ms and instead recorded subjects’ full reaction times for eachcontrast, up to 10,000 ms.
Results and Discussion
Of the 8,320 responses, 14 were excluded from the analysisbecause subjects either responded before hearing the second stim-ulus or failed to respond altogether within the 10–s responseperiod. Table 2 shows the percentage of the remaining trials onwhich subjects responded same for each contrast. As expected, thepercentage of same responses was extremely high for one-stepdiscriminations and got successively lower as the psychoacousticdistance between stimuli increased. This correlation was signifi-cant in a by-item analysis for both the no-noise (r � �0.85, p �.01) and the noise (r � �0.87, p � .01) condition.4
Figure 12a shows these confusion data schematically, wheredarker squares indicate a higher percentage of same responses.This schematic representation highlights three differences be-tween the conditions. First, the overall percentage of sameresponses was higher in the noise condition than in the no-noisecondition, as evidenced by the higher number of dark squares.Second, the percentage of same responses declined more slowlyin the noise condition than in the no-noise condition withincreasing psychophysical distance, as reflected by a moregradual change from dark squares to light squares in the noisecondition. Third, the difference between within-category andbetween-category contrasts was greater in the noise conditionthan in the no-noise condition. Whereas the no-noise conditionshowed fairly constant performance along any given diagonal,with only a small dip in the percentage of same responsestoward the center of the stimulus continuum, the noise condi-tion showed a much larger difference along the diagonal, witha strong decrease in same responses near the between-categorycontrasts at the center of the stimulus continuum. This thirddifference suggests that there is a larger degree of within-category shrinkage and between-category expansion of percep-tual space in the noise condition, consistent with the predictionsof the rational model.
Same–different model. We used the rational model to sim-ulate these confusion data, assuming that participants perceivespeech sounds by sampling a target production from the poste-rior distribution on target productions, p(T �S). We extended themodel to account directly for same– different responses byassuming that participants respond same if the sampled targetproductions for the two speech sounds are within a thresholddistance � of each other; otherwise they respond different. Theparameter � thus played a similar role to the response criterion
4 All statistical significance tests reported in this article are two-tailed.
767INFLUENCE OF CATEGORIES ON PERCEPTION

of the observer in signal detection theory (Green & Swets,1966), determining the magnitude of a difference that will yielda positive response. Under this model, the number of sameresponses to a given contrast is predicted to follow a binomialdistribution B(n, p) where n is the number of trials in which a givencontrast was presented and p is the probability that the two sampledtarget productions for that contrast are within a distance � of eachother, p(�TA � TB� � ��SA, SB). This probability can be computedas described in Appendix D.
The simulation used the same category means �/i/ and �/e/ andcategory variance �c
2 as the simulation of the Iverson and Kuhl(1995) data. The noise variance was a free parameter that couldvary between conditions to capture differences in perceptual warp-ing; in addition, the decision threshold � was a free parameter thatcould vary between the two conditions, allowing the model tocapture the overall greater number of same responses in the noisecondition. These free parameters were chosen to maximize thelikelihood of the same–different data. The best fitting model usedparameters of � � 76 mels and �S
2 � 878 (�S � 30 mels) for theno-noise condition and � � 111 mels and �S
2 � 2129 (�S � 46mels) for the noise condition. Using these parameters, we foundthat the percentage of same responses predicted by the model foreach contrast was highly correlated with that found empirically(r � .98 for the no-noise condition; r � .97 for the noise condi-tion), and these correlations remained high even after controllingfor acoustic distance (r � .94 and r � .87 for the no-noise andnoise conditions, respectively). Model performance is shown sche-matically in Figure 12b.
The key prediction for this experiment was that the noise vari-ance parameter �S
2 could account for differences in performancebetween the no-noise and noise conditions. However, in the abovesimulation, � was an additional free parameter that could varybetween conditions. To demonstrate quantitatively that the noiseparameter accounted for differences above and beyond those ac-counted for simply by varying the decision threshold, we used ageneralized likelihood ratio test (e.g., Rice, 1995) to compare thefull model described above with a restricted model (Figure 12c) inwhich the noise parameter was constant across conditions. Like thefull model, the restricted model used category means and thecategory variance from the previous simulations, and the decisionthreshold was a free parameter that could vary between the twoconditions.5 The models differed only in their assumptions aboutthe noise parameter. These two models thus constitute a nestedhierarchy, and we can determine whether the additional noiseparameter makes a statistically significant difference by examiningthe difference between the log likelihoods of the models, computedusing the maximum likelihood estimates of the parameters. Underthe null hypothesis that the data were generated from the restrictedmodel, twice this difference has a �2(1) distribution. The log
5 Constraining � to be the same between the two conditions significantlydecreases the likelihood of the data; however, even under the assumptionof a constant threshold, allowing the speech signal noise parameter to varybetween conditions makes a statistically significant difference.
Table 2Percentage of Trials on Which Subjects Responded “Same” for Each Pair of Stimuli in the No-Noise and Noise Conditions
Stimulus no. 1 2 3 4 5 6 7 8 9 10 11 12 13
No-noise condition
1 98.8 82.5 82.5 40.0 22.5 7.5 5.0 5.0 0.0 0.0 2.5 0.0 2.52 97.5 95.0 70.0 52.5 10.0 5.0 0.0 2.5 2.5 0.0 0.0 0.03 91.3 97.5 75.0 32.5 12.5 5.0 2.5 0.0 2.5 2.5 0.04 97.5 87.5 40.0 12.5 5.0 2.5 0.0 2.5 0.0 0.05 97.5 77.5 27.5 12.5 5.0 2.5 0.0 0.0 0.06 92.5 75.0 30.0 15.0 2.5 2.5 2.6 0.07 91.3 75.0 42.5 17.5 5.0 5.0 0.08 95.0 80.0 50.0 32.5 7.5 5.09 93.8 87.5 67.5 27.5 22.5
10 92.5 87.5 76.9 37.511 97.5 87.5 65.012 96.3 97.513 100.0
Noise condition
1 95.0 95.0 87.5 80.0 82.5 57.5 25.0 7.0 5.0 0.0 0.0 5.0 2.52 96.3 97.5 97.5 87.5 80.0 42.5 15.0 5.0 5.0 0.0 2.5 2.53 95.0 97.5 90.0 80.0 42.5 30.0 7.5 0.0 2.5 2.5 0.04 92.5 95.0 90.0 55.0 20.0 10.0 7.5 2.5 2.5 7.55 95.0 90.0 67.5 27.5 5.0 12.5 2.5 15.0 10.06 96.3 87.5 50.0 25.0 7.5 2.5 10.0 2.57 91.3 75.0 42.5 20.0 12.5 12.5 10.08 87.5 72.5 52.5 40.0 20.0 10.09 90.0 92.5 72.5 47.5 37.5
10 93.8 95.0 85.0 52.511 95.0 100.0 85.012 95.0 97.513 95.0
768 FELDMAN, GRIFFITHS, AND MORGAN

likelihood of the data was �676 under the restricted model6 and�568 under the full model. The full model therefore accounted forthese data significantly better than did the restricted model,�2(1) � 216, p � .001; allowing the noise parameter to changebetween the noise and no-noise conditions resulted in a statisticallysignificant improvement in fit.
This comparison indicates that the rational model accounts foradditional differences between conditions beyond the overall in-crease in same responses. As noted earlier, there are two suchdifferences apparent in the data. First, the decrease in same re-sponses with psychophysical distance is more gradual in the noisecondition than in the no-noise condition. In the rational model, thisoccurs because listeners in the noise condition assume that thespeech sound might have come from a wider range of targetproductions, leading to higher variability in the posterior distribu-tion (Equation 25). Higher posterior variance leads to a shallowerdecline in same responses. Second, the responses are more cate-gorical in the noise condition than in the no-noise condition, asevidenced by response patterns along each diagonal. This occurs inthe rational model because of increased weighting of categoryinformation in higher noise conditions (Equation 7).
Although both of these aspects of the data are compatible withthe rational model, a straightforward alternative explanation isavailable for the first. In modeling these data we have made theassumption that the stimulus heard by experimental participants isidentical to the stimulus played. This assumption allows the use ofknown stimulus values S when computing listeners’ optimal per-cepts. However, in reality there is likely to be some variability inthe stimuli heard by listeners, and this variability should be higherin the noise condition than in the no-noise condition. The shallowdecrease in same responses in the noise condition might then be asimple result of higher stimulus variability. Taking into accountexperimental noise might improve the performance of the re-stricted model by providing a mechanism to account for thisshallower decrease in same responses in the noise condition.
To investigate this possibility, we simulated experimental noisein the restricted model by drawing values of S, the speech soundheard by listeners, from a Gaussian distribution centered aroundeach stimulus value. The probability of a same response for a givencontrast was approximated by drawing 100 samples of each speechsound in the pair and computing the probability of a same responsefor each pair of samples. These probabilities were then averaged toobtain the expected probability of a same response for each con-trast, and a binomial model was used to compute the likelihood ofthe data. The experimental noise variance was a free parameter thatvaried between the two conditions, under the assumption thatlisteners in the two conditions heard the stimuli through differentamounts of noise. A third noise parameter that governed listeners’inferences was held constant between the two conditions, as in therestricted model, implementing an assumption that listeners weightcategory information equally in the two conditions. This modelyielded a log likelihood of �618, significantly higher than therestricted model described above, �2(2) � 116, p � .001 but lowerthan the full model despite having one more free parameter.7 Theremaining difference in likelihood between this model and the fullmodel reflects listeners’ increased reliance on category informa-tion in higher noise conditions, as captured by our rational model.
Multidimensional scaling. The two noise parameters used inthe simulation of our confusion data were both lower than thenoise variance estimated on the basis of the Iverson and Kuhl(1995) data. However, the ambient noise level in Iverson andKuhl’s experiment should have been comparable to that of ourno-noise condition and was almost certainly lower than the zerosignal-to-noise ratio in our noise condition. This discrepancy mayreflect a difference in analysis methods. Whereas Iverson and Kuhlused multidimensional scaling to analyze their results, we based
6 The maximum likelihood parameters for the restricted model were� � 85 mels and � � 103 mels for the no-noise and noise conditions,respectively, and �S
2 � 1447 (�S � 38 mels).7 This model cannot be compared with the full model in a generalized
likelihood ratio test because the two models are not nested. To make anested variant of the full model, we augmented it with the same two freeparameters for experimental noise. This augmented full model had a loglikelihood of �568. It therefore accounted for the data significantly betterthan did the augmented restricted model, �2(1) � 100, p � .001, though itdid not yield any improvement over the original full model. This againindicates that allowing the inference-related noise parameter to differbetween the two conditions results in a statistically significant improve-ment in fit.
No Noise Noise
(c)
Subject Confusion Data
Full Model
Restricted Model
(b)
(a)
Figure 12. Confusion matrices showing the percentage of same responsesto each contrast in (a) subject data, (b) the full model in which the noiseparameter varied between conditions, and (c) the restricted model in whichthe noise parameter was constrained to be the same between conditions.The left-hand plots show the no-noise condition, and the right-hand plotsshow the noise condition. Darker cells indicate a higher percentage of sameresponses.
769INFLUENCE OF CATEGORIES ON PERCEPTION

our analysis directly on subject confusion data. To draw a closercomparison to the results from Iverson and Kuhl and to furtherhelp visualize the difference between the noise and no-noise con-ditions, we used multidimensional scaling to create perceptualmaps from the behavioral data.
Our multidimensional scaling analysis incorporated informationfrom both reaction times and same–different responses. Reactiontime data were normalized across subjects by first taking the logtransform to ensure normal distributions and then converting theseto z-scores for each subject. Psychoacoustic distance had a signif-icant positive correlation with these normalized reaction times forsame responses (r � .45, p � .01, for the no-noise condition; r �.27, p � .02, for the noise condition),8 reflecting the predictedresult that subjects who responded same were slower when thestimuli were separated by a greater psychoacoustic distance. Con-versely, the data showed a significant negative correlation betweenpsychoacoustic distance and normalized reaction times on differ-ent responses (r � �.69, p � .01, for the no-noise condition; r ��.56, p � .01, for the noise condition), indicating that subjectswere faster to respond different when the stimuli were farther apartin psychoacoustic space. Both same and different reaction timeswere therefore included as measures of perceptual distance in ourmultidimensional scaling analysis.
The intuition behind our multidimensional scaling analysis,which is supported by the correlations presented above, is thatreaction times and same–different responses are consistent with asubject’s perceptual map of the stimuli. Different responses withshort reaction times indicate that stimuli are far apart in thisperceptual map; different responses with long reaction times indi-cate that stimuli are closer together; same responses with longreaction times indicate that stimuli are even closer, and sameresponses with short reaction times indicate that stimuli are ex-tremely close together in the perceptual map. Nonmetric multidi-mensional scaling (Shepard, 1980) is an optimization method thataims to minimize violations of distance rankings in a perceptualmap. It assumes a monotonic relation between reaction times andperceptual distance but does not assume any parametric form forthis relation.9
We constructed a similarity matrix for each condition thatmirrored these intuitions. This was implemented computationallyby subtracting z-scores for same responses from a z-score of six,10
effectively transforming same responses into different responseswith extremely long reaction times, such that shorter reaction timeson a same response mapped onto longer reaction times on adifferent response. This is similar to the procedure used by Iversonand Kuhl, who substituted a reaction time of 2000 ms (the triallength in their experiment) for any same response. The medianscore across subjects for each contrast was then entered into thesimilarity matrix, and scores were normalized to fall between zeroand one.
Nonmetric multidimensional scaling solutions based on thesesimilarity matrices are shown in Figure 13. The plots are modeledafter Figure 5: The horizontal axis shows acoustic space, and thevertical axis shows perceptual space. A linear function wouldindicate a linear mapping between acoustic and perceptual space,whereas nonlinearities suggest that perceptual space is warpedrelative to acoustic space. Areas that are more nearly horizontalindicate greater shrinkage of perceptual space. These multidimen-sional scaling solutions suggest that there is a difference in sub-
jects’ perceptual maps between the two conditions. Consistent withresults from Iverson and Kuhl, there is some evidence of percep-tual warping in the no-noise condition, but here interstimulusdistances are relatively constant. As predicted by our model,perceptual space is more warped in the noise condition than in theno-noise condition. Unambiguous stimuli near category centers arevery close together in perceptual space, whereas stimuli near thecategory boundary are much farther apart. The precise stimuluslocations in these multidimensional scaling solutions are not com-patible with the parameters used for the simulation of raw confu-sion data, suggesting that multidimensional scaling yields an im-perfect perceptual map of the stimuli. It is possible that Iverson andKuhl’s (1995) multidimensional scaling analysis produced a par-allel exaggeration of the degree of warping, yielding the discrep-ancy in noise parameters discussed above. However, the multidi-mensional scaling solution illustrates the same qualitativedifference between the conditions as is seen in the raw confusiondata: Subjects in the noise condition relied more on categoryinformation than subjects in the no-noise condition.
As predicted for moderate noise levels, we observed increasedperceptual warping with increased speech signal noise. Theseresults provide evidence that listeners are sensitive to the level ofspeech signal noise and that their perception reflects these differ-ing noise levels in a way that is compatible with the optimalbehavior predicted by the rational model. This effect of noise is notdirectly predicted by previous models, though it may be compat-ible with some of them, as discussed in the next section.
Comparison With Previous Models
Our rational model has taken a new approach to explaining theperceptual magnet effect, framing it as the optimal solution to theinference problem of perceiving speech sounds in the presence ofnoise. However, the solution derived in this analysis shares ele-ments with several previous computational models, which haveimplicitly incorporated mechanisms that implement reliance onprior information and optimal inference of category membership.These parallels allow the various approaches to be seen as com-plementary descriptions of the same system that we describe here,articulated at different levels of analysis (Marr, 1982). Previousmodels provide process-level accounts showing how a system likethe one we propose might be implemented, whereas the rationalmodel uses analysis of the computational-level problem to explainwhy the mechanisms proposed by previous models should work.
Exemplar Model
A direct mathematical connection occurs with Lacerda’s (1995)model, in which listeners’ discrimination abilities are the side
8 These correlations are relatively low on account of sparse data in cellswhere most participants responded different. The correlations increase tor � .72 and r � .52 (both ps � .01) for the no-noise and noise conditions,respectively, when the analysis is limited to zero-, one-, two-, and three-step contrasts.
9 This differs from Iverson and Kuhl’s (1995) assumption of a linearrelationship between log reaction times and perceptual distance.
10 The exact value did not affect the analysis, as long as the value washigh enough that z-scores for different responses and z-scores for sameresponses did not overlap substantially.
770 FELDMAN, GRIFFITHS, AND MORGAN

effect of an exemplar-based categorization problem. Lacerda’smodel rests on the assumption that phonetic categories have ap-proximate Gaussian distributions and that listeners store labeledexemplars from these categories. Perception requires listeners todetermine the category membership of a new speech sound. Lac-erda defines a speech sound’s similarity to a category as theproportion of stored exemplars within some distance � from thespeech sound that belong to the category. Listeners’ discriminationof two speech sounds then depends on the difference between thetwo speech sounds’ similarity values.
In a system with two categories A and B, the similarity of aspeech sound x to Category A (sA) is defined in the exemplarmodel as
sA�x� �NeighbA�x, ��
NeighbA�x, �� � NeighbB�x, ��, (15)
where NeighbA(x, �) indicates the number of neighbors withinrange � of speech sound x. The discrimination function depends onthe difference in similarity between neighboring speech sounds; asthe distance between neighboring speech sounds approaches zero,this corresponds to the derivative of the similarity function. Thediscrimination function is therefore defined as
discr�x� �
�dsA�x�
dx� � �dsB�x�
dx�
k, (16)
where k is an arbitrary constant. This indicates that the discrim-inability at a point in perceptual space depends on the rate ofchange of category membership.
The mathematics underlying this exemplar model have adirect connection to our rational model. The first point ofconnection is that the similarity function in the exemplar modelapproximates the posterior probability of category membershipin the rational model. This can be seen by noting that the exem-plars are generated from a Gaussian distribution so that listenerswho have heard NA exemplars from Category A have heard ap-proximately �x��
x� p(S�A)NAdS exemplars from Category A withina range � from speech sound x. As epsilon approaches zero, thenumber of neighbors is proportional to p(x�A)NA. The similaritymetric then becomes
sA�x� �p�x�A�NA
p�x�A�NA � p�x�B�NB, (17)
which is equivalent to Bayes’ rule as long as the number of storedexemplars in each category, NA and NB, is proportional to the priorprobabilities of the categories, p(A) and p(B). This calculationyields the posterior probability p(A�x), indicating that the similaritymetric used in the exemplar model approximates the posteriorprobability of category membership.
Furthermore, the discrimination function defined in the exem-plar model is a component of the measure of warping defined inthe rational model. This can be shown by substituting p(A�x) and itsanalogue p(B�x) into the discrimination function, yielding
discr�x� �
�dp�A�x�
dx� � �dp�B�x�
dx�
k. (18)
Recall that Equation 14, which defined perceptual warping in therational model, included the term
�c
�c
dp(c�S)
dS.
There is a direct correspondence between the derivative terms inthe two equations: Both indicate that the discriminability at aparticular point in perceptual space is a linear function of the rateof change in the identification function. The constant k in theexemplar model corresponds in our model to a number that isbased on the speech signal noise, category variance, and distancebetween the two category means, as discussed in Appendix C.Unlike in the exemplar model, discriminability in the rationalmodel includes an additional component that is not based oncategory membership: Listeners can discriminate speech soundsthat differ acoustically to the extent that they rely on acousticinformation from the speech sounds.
This analysis shows that the rational model incorporates the ideafrom Lacerda’s exemplar model that discrimination peaks occurnear category boundaries as a result of the distributions of exem-plars in phonetic categories. Our model goes beyond the exemplarmodel to account for better than chance within-category discrim-inability and to provide independent justification for why discrim-ination should be best near those speech sounds where categoryuncertainty is highest. This maximum discriminability occurs be-cause of the attractors that form at each phonetic category throughoptimal compensation for speech signal noise. The attractors pullequally on speech sounds that are on the boundary between pho-
1 13Stimulus Number
Pos
ition
in M
DS
Sol
utio
n
No−Noise Condition(a)
1 13Stimulus Number
Pos
ition
in M
DS
Sol
utio
n
Noise Condition(b)
1 13Stimulus Number
Pos
ition
in M
DS
Sol
utio
n
Data from Iverson and Kuhl (1995)(c)
Figure 13. Perceptual maps for the (a) no-noise and (b) noise conditions obtained through multidimensional scaling(MDS). Data from (c) Iverson and Kuhl’s (1995) multidimensional scaling experiment are shown for comparison.
771INFLUENCE OF CATEGORIES ON PERCEPTION
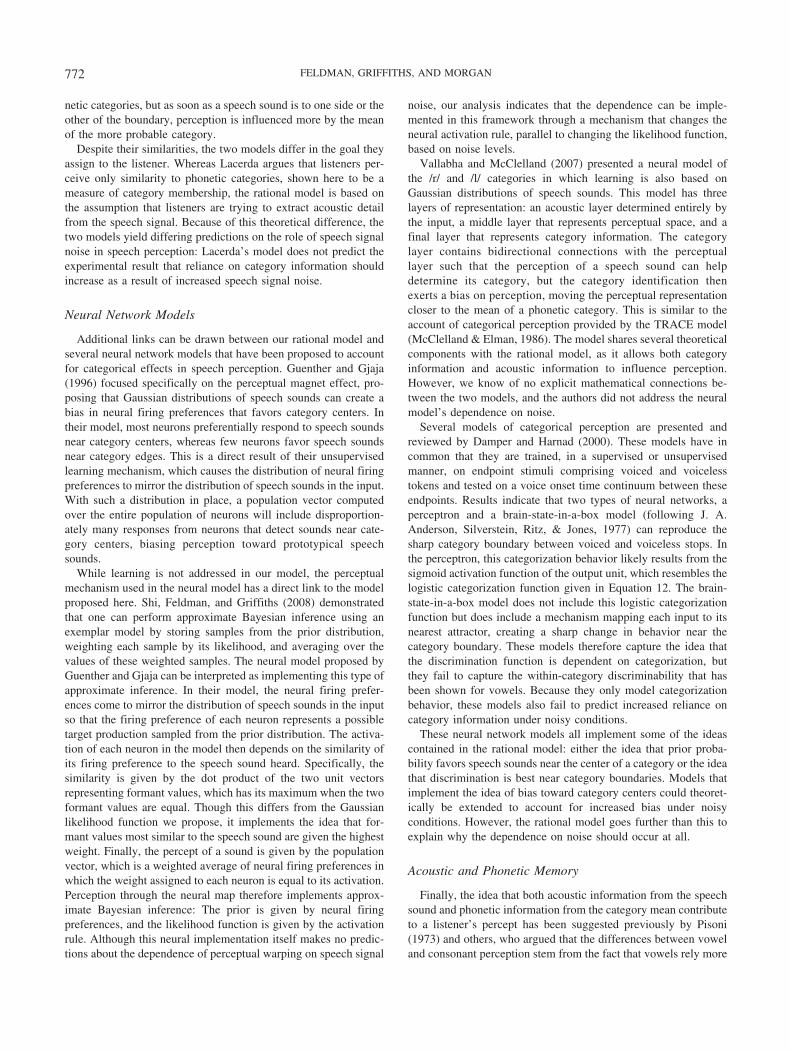
netic categories, but as soon as a speech sound is to one side or theother of the boundary, perception is influenced more by the meanof the more probable category.
Despite their similarities, the two models differ in the goal theyassign to the listener. Whereas Lacerda argues that listeners per-ceive only similarity to phonetic categories, shown here to be ameasure of category membership, the rational model is based onthe assumption that listeners are trying to extract acoustic detailfrom the speech signal. Because of this theoretical difference, thetwo models yield differing predictions on the role of speech signalnoise in speech perception: Lacerda’s model does not predict theexperimental result that reliance on category information shouldincrease as a result of increased speech signal noise.
Neural Network Models
Additional links can be drawn between our rational model andseveral neural network models that have been proposed to accountfor categorical effects in speech perception. Guenther and Gjaja(1996) focused specifically on the perceptual magnet effect, pro-posing that Gaussian distributions of speech sounds can create abias in neural firing preferences that favors category centers. Intheir model, most neurons preferentially respond to speech soundsnear category centers, whereas few neurons favor speech soundsnear category edges. This is a direct result of their unsupervisedlearning mechanism, which causes the distribution of neural firingpreferences to mirror the distribution of speech sounds in the input.With such a distribution in place, a population vector computedover the entire population of neurons will include disproportion-ately many responses from neurons that detect sounds near cate-gory centers, biasing perception toward prototypical speechsounds.
While learning is not addressed in our model, the perceptualmechanism used in the neural model has a direct link to the modelproposed here. Shi, Feldman, and Griffiths (2008) demonstratedthat one can perform approximate Bayesian inference using anexemplar model by storing samples from the prior distribution,weighting each sample by its likelihood, and averaging over thevalues of these weighted samples. The neural model proposed byGuenther and Gjaja can be interpreted as implementing this type ofapproximate inference. In their model, the neural firing prefer-ences come to mirror the distribution of speech sounds in the inputso that the firing preference of each neuron represents a possibletarget production sampled from the prior distribution. The activa-tion of each neuron in the model then depends on the similarity ofits firing preference to the speech sound heard. Specifically, thesimilarity is given by the dot product of the two unit vectorsrepresenting formant values, which has its maximum when the twoformant values are equal. Though this differs from the Gaussianlikelihood function we propose, it implements the idea that for-mant values most similar to the speech sound are given the highestweight. Finally, the percept of a sound is given by the populationvector, which is a weighted average of neural firing preferences inwhich the weight assigned to each neuron is equal to its activation.Perception through the neural map therefore implements approx-imate Bayesian inference: The prior is given by neural firingpreferences, and the likelihood function is given by the activationrule. Although this neural implementation itself makes no predic-tions about the dependence of perceptual warping on speech signal
noise, our analysis indicates that the dependence can be imple-mented in this framework through a mechanism that changes theneural activation rule, parallel to changing the likelihood function,based on noise levels.
Vallabha and McClelland (2007) presented a neural model ofthe /r/ and /l/ categories in which learning is also based onGaussian distributions of speech sounds. This model has threelayers of representation: an acoustic layer determined entirely bythe input, a middle layer that represents perceptual space, and afinal layer that represents category information. The categorylayer contains bidirectional connections with the perceptuallayer such that the perception of a speech sound can helpdetermine its category, but the category identification thenexerts a bias on perception, moving the perceptual representationcloser to the mean of a phonetic category. This is similar to theaccount of categorical perception provided by the TRACE model(McClelland & Elman, 1986). The model shares several theoreticalcomponents with the rational model, as it allows both categoryinformation and acoustic information to influence perception.However, we know of no explicit mathematical connections be-tween the two models, and the authors did not address the neuralmodel’s dependence on noise.
Several models of categorical perception are presented andreviewed by Damper and Harnad (2000). These models have incommon that they are trained, in a supervised or unsupervisedmanner, on endpoint stimuli comprising voiced and voicelesstokens and tested on a voice onset time continuum between theseendpoints. Results indicate that two types of neural networks, aperceptron and a brain-state-in-a-box model (following J. A.Anderson, Silverstein, Ritz, & Jones, 1977) can reproduce thesharp category boundary between voiced and voiceless stops. Inthe perceptron, this categorization behavior likely results from thesigmoid activation function of the output unit, which resembles thelogistic categorization function given in Equation 12. The brain-state-in-a-box model does not include this logistic categorizationfunction but does include a mechanism mapping each input to itsnearest attractor, creating a sharp change in behavior near thecategory boundary. These models therefore capture the idea thatthe discrimination function is dependent on categorization, butthey fail to capture the within-category discriminability that hasbeen shown for vowels. Because they only model categorizationbehavior, these models also fail to predict increased reliance oncategory information under noisy conditions.
These neural network models all implement some of the ideascontained in the rational model: either the idea that prior proba-bility favors speech sounds near the center of a category or the ideathat discrimination is best near category boundaries. Models thatimplement the idea of bias toward category centers could theoret-ically be extended to account for increased bias under noisyconditions. However, the rational model goes further than this toexplain why the dependence on noise should occur at all.
Acoustic and Phonetic Memory
Finally, the idea that both acoustic information from the speechsound and phonetic information from the category mean contributeto a listener’s percept has been suggested previously by Pisoni(1973) and others, who argued that the differences between voweland consonant perception stem from the fact that vowels rely more
772 FELDMAN, GRIFFITHS, AND MORGAN

on acoustic memory, whereas consonants rely more on phoneticmemory. Like the Bayesian model, this account of acoustic andphonetic memory predicts that as the acoustic uncertainty in-creases, listeners should rely increasingly on phonetic memory,making perception more categorical. This idea has been tested inempirical studies that interfered with acoustic memory to obtainmore categorical perception of vowels (Repp et al., 1979) orencouraged use of acoustic memory to obtain less categoricalperception of consonants (Pisoni & Lazarus, 1974). In addition,tasks that required less memory load were found to increaseespecially the within-category discriminability of vowels (Pisoni,1975).
This model is compatible with our Bayesian analysis, givensome assumptions about the interaction between acoustic andphonetic memory and the degree to which each is used. Theperception of speech sounds in the Bayesian model is a weightedaverage of the speech sound S and the means �c of a set ofphonetic categories. One possible mechanism for implementingthis approach would be to store the speech sound in acousticmemory and activate the phonetic category mean in phoneticmemory. Under this assumption, the Bayesian model complementsthe process-level memory model by predicting the extent to whicheach mode of memory is used: For categories with high variabilityand in lower noise conditions, listeners should rely more onacoustic memory, whereas for categories with low variability andin higher noise conditions, listeners should rely more on phoneticmemory.
It is worth noting that the closed-form solution given in Equa-tion 11 holds only in the case of Gaussian phonetic categories andGaussian noise. Qualitatively similar effects are predicted for anyunimodal distribution of speech sounds, but these cases generallydo not yield a quantitative solution that takes the form of aweighted average between acoustic and phonetic components.However, the weighted average may provide a close approxima-tion to optimal behavior even in these cases.
Summary
In this section, we have shown that direct links can be drawnbetween the rational model and several process-level models thathave been proposed to account for the perceptual magnet effectand categorical perception more generally. Any of these mecha-nisms might be consistent with the computational-level account wepropose, and our analysis does not provide evidence for one particularimplementation over another. Instead, our model contributes byproviding a higher level explanation of the principles that underliethe behavior of many of these models and by identifying phenom-ena such as the importance of speech signal noise that have notbeen predicted by previous accounts.
General Discussion
This article has described a Bayesian model of speech percep-tion in which listeners infer the acoustic detail of a speaker’s targetproduction on the basis of the speech sound they hear and theirprior knowledge of phonetic categories. Uncertainty in the speechsignal causes listeners to infer a sound that is closer to the mean ofthe phonetic category than the speech sound they actually heard.Assuming that a language has multiple phonetic categories, listen-
ers use the probability with which different categories might havegenerated a speech sound to guide their inference of the acousticdetail. Simulations indicate that this model accurately predictsinterstimulus distances in the detailed perceptual map from Iversonand Kuhl’s (1995) multidimensional scaling experiment as well asdiscrimination data from a novel experiment investigating theeffect of noise on listeners’ use of category information. Theremainder of the article revisits the model’s assumptions andqualitative predictions in the context of previous research on theperceptual magnet effect, phonetic category acquisition, spokenword recognition, and categorical effects in other domains.
The Perceptual Magnet Effect
The rational model predicts that three factors are key in deter-mining the nature of perceptual warping: category frequency,category variance, and speech signal noise. Nearly all values ofthese parameters imply the same pattern of perception, though todiffering degrees. Speech sounds are pulled toward the means ofnearby categories, yielding reduced discriminability near the cen-ters of phonetic categories and increased discriminability nearcategory edges. This is qualitatively in line with previous descrip-tions of the perceptual magnet effect. However, research on theperceptual magnet effect has found seemingly conflicting empiri-cal data: Several studies have found better discrimination nearcategory boundaries than near the prototype, consistent with theidea of a perceptual magnet effect (Diesch et al., 1999; Grieser &Kuhl, 1989; Iverson & Kuhl, 1995, 1996; Iverson et al., 2003;Kuhl, 1991), whereas other studies have found that the effect doesnot extend to other vowel categories (Sussman & Gekas, 1997;Thyer et al., 2000) or that methodological details affect the degreeto which categorical effects are observed (Lively & Pisoni, 1997;Pisoni, 1975). The model’s predictions concerning differences incategory variance and noise conditions suggest some avenues bywhich this debate might be resolved.
The predicted influence of category variance on perceptualwarping may provide a reason why some categories show a higherdegree of categorical perception than others. Data from Hillen-brand et al. (1995) suggest that the /i/ category has lower variancethan other vowel categories in the direction tested by Iverson andKuhl (1995), and it may be because of these higher levels ofvariability that the perceptual magnet effect has been difficult tofind in other categories. Clayards et al. (2008) have demonstratedthat adults are sensitive to the degree of within-category variabilityin an identification task, and our model predicts that this sensitivitycarries over to discrimination tasks and makes perception lesscategorical in categories with high variability.
A second factor that should affect perceptual warping is theamount of speech signal noise, and the results of our experimentdemonstrate that the perceptual magnet effect in the English /i/ and/e/ categories can be modulated by adding white noise. One im-mediate implication of this is that details of stimulus presentationare critical in speech perception experiments. Poor stimulus qualitymight actually yield better categorical perception results, and sim-ilar manipulations of memory uncertainty should also have thiseffect. This idea is consistent with results that show more pro-nounced discrimination peaks at category boundaries with longerinterstimulus intervals, where memory uncertainty should be high-est (Pisoni, 1973). Further research is necessary to determine the
773INFLUENCE OF CATEGORIES ON PERCEPTION

extent to which these factors can explain the variability in empir-ical results.
Another debate in the literature discusses the extent to which theperceptual magnet effect is a between-category or within-categoryphenomenon, and the rational model provides a way of reconcilingthese two characterizations. The within-category account involvesspeech sound prototypes that act as perceptual magnets, pulling theperception of speech sounds toward them (Kuhl, 1991). The ideaof a perceptual magnet is formalized in Equation 7, where speechsounds are perceived based on the mean of the category thatproduced them. The between-category account ties the perceptionof speech sounds to the task of inferring category membership(Lacerda, 1995). In line with this, the Bayesian solution to theproblem of speech perception with multiple categories (Equation11) is consistent with the idea that listeners calculate the proba-bility of each phonetic category having generated a speech sound.However, in contrast to Lacerda’s model, which assumes thatlisteners are perceiving only category membership, the presentmodel predicts that listeners perceive speech sounds in terms ofspeakers’ intended target productions, a continuous variable thatdepends only partly on category membership. The rational modeltherefore synthesizes these two previous proposals into a singleframework in which the perceptual magnet effect arises throughthe interaction between shrinkage of perceptual space toward cat-egory centers and enhanced discrimination between categoriesthrough optimal inference of category membership.
Similar to probabilistic models in visual perception (e.g., Yuille& Kersten, 2006), the use of the term inference here is not meantto imply that listeners are performing explicit computations, andthe model does not attempt to distinguish between inference andperception. Likewise, in determining which categories might havegenerated a speech sound, listeners need not be making explicitcategorization judgments. This computation may involve nothingmore than implicit and automatic activation of the relevant pho-netic categories, or even simple retrieval of stored exemplars (Shiet al., 2008). The argument presented here is that the perceptualmagnet effect results from a process that approximates the math-ematics of optimal inference and that this process is advantageousto listeners because it allows them to perceive speech soundsaccurately.
Phonetic Category Acquisition
The rational model assumes that listeners have prior knowledgeof phonetic categories in their language. Although this is true ofadult listeners, it poses an acquisition problem because infantsneed to learn which categories are present in their native language.This acquisition problem has been studied in the context of severalcomputational models that use a mixture of Gaussians approach torecover Gaussian categories from unlabeled input. In de Boer andKuhl’s (2003) model, the expectation maximization algorithm(Dempster, Laird, & Rubin, 1977) was used to find an appropriateset of three vowel categories from a batch of stored exemplars.More recently, McMurray, Aslin, and Toscano (2009) used anincremental algorithm to learn the category parameters for a voic-ing contrast, and Vallabha, McClelland, Pons, Werker, and Amano(2007) applied this incremental algorithm to vowel formant andduration data from English and Japanese infant-directed speech.Incremental algorithms lend psychological plausibility to this ac-
count, allowing infants to learn from each speech sound as it isheard. The Gaussian categories learned by this type of algorithmwould provide the necessary prior information assumed in ourBayesian model.
Learning explicit Gaussian categories yields a prior that isconsistent with this model, but it is also possible to relax theassumptions of normality and of discrete categories so that theperceptual magnet effect arises simply as a result of listeners’estimating the distribution of speech sounds in their language.Formal analyses of models of categorization have shown thatsimply storing exemplars can provide an alternative method forestimating the distribution associated with a category (Ashby &Alfonso-Reese, 1995). If it is assumed that probabilities are as-signed to stimuli in a way that is determined by their similarity topreviously observed exemplars, and that the distribution associatedwith a category results from summing the probabilities producedby each exemplar from that category, the result is a kernel densityestimator, a nonparametric method for estimating probability dis-tributions (Silverman, 1986). Given sufficiently many exemplars,the distribution estimated in this fashion will approximate thedistribution associated with the category. If the category distribu-tion is Gaussian, the result will be approximately Gaussian. How-ever, listeners do not need explicit knowledge of this larger struc-ture. Rather, they can obtain the same perceptual effect by treatingeach exemplar as its own category. In this scenario, listeners needto take many small overlapping categories, or kernels, into accountusing Equation 11. In our discussion of limits on category vari-ance, we showed that if two Gaussian categories produce a col-lective unimodal distribution, all of perceptual space is biasedinward toward a point between the categories. Here, kernels thatrepresent speech sounds from a Gaussian phonetic category willcombine to produce a unimodal Gaussian distribution. The math-ematics of this case reduce to the mathematics of the case of asingle discrete category, with the weight on speech sound S equalto the sum of the kernel width and the variance in the locations ofkernels.
This method of learning distributions based on individualspeech sounds removes the need for listeners to have knowledge ofexplicit categories, reducing the severity of the learnability prob-lem. It suggests that the perceptual magnet effect requires priorknowledge of the distributions of speech sounds in the input butdoes not require knowledge of the discrete categories that thesedistributions represent. The mere presence of the perceptual mag-net effect does not necessarily imply knowledge of discrete pho-netic categories. Furthermore, this analysis can be used to relax theassumptions of Gaussian phonetic categories. Any unimodal dis-tribution in the locations of exemplars should produce a qualita-tively similar effect to that obtained with Gaussians, since as soonas the kernels representing exemplars are close enough together toyield a combined unimodal distribution, perception will be biasedinward to a point between those exemplars.
Multiple Dimensions
In this article, we have examined a simplified problem in speechperception, involving stimuli that lie along a single psychoacousticdimension. Real speech input contains multiple dimensions thatare relevant for categorizing and discriminating stimuli, and in
774 FELDMAN, GRIFFITHS, AND MORGAN

future work it will be interesting to examine discrimination pat-terns in categories that vary along multiple dimensions (e.g.,Iverson et al., 2003) as well as patterns of trading relations inphoneme identification (e.g., Repp, 1982). Both of these problemsrequire the use of more complex representations, such as multidi-mensional Gaussians, to represent phonetic categories and noiseprocesses.
Preliminary simulations of the two-dimensional /r/–/l/ data fromIverson and Kuhl (1996) using multidimensional Gaussians withdiagonal covariance matrices suggest that our rational model cap-tures some aspects of these data but that the model would need tobe extended to fully capture human data in multiple dimensions.These /r/–/l/ data show two basic effects. First, there is shrinkagetoward category means along the F3 dimension, the dimension thatseparates the two categories. This shrinkage is weakest near theboundary between the categories, as predicted by the rationalmodel. Second, the data show shrinkage in the F2 dimension, andthis F2 shrinkage is strongest at F3 values that are near the categorymeans. Although the rational model predicts shrinkage in the F2
dimension, it predicts the same amount of F2 shrinkage at anyvalue of F3.
This issue can potentially be addressed in two ways within theframework of the rational model. First, one can relax the assump-tion of Gaussian categories and Gaussian noise, an assumption thatwe have adopted only for computational simplicity. The neuralmap proposed by Guenther and Gjaja (1996) provides evidencethat relaxing the Gaussian assumption will allow the model tocapture human performance. As discussed above, Guenther andGjaja’s model implements an approximate form of optimal Bayes-ian inference (Shi et al., 2008). The likelihood is given by theiractivation function, which is non-Gaussian, and the prior distribu-tion is given by neural firing preferences in their neural map,which may be non-Gaussian as a result of their learning algorithm.This neural model therefore implements an approximation of ourrational model that relaxes the Gaussian assumption. Their modelobtains a close fit to the two-dimensional /r/–/l/ data, suggestingthat, in principle, the rational model is capable of capturing thispattern.
A second potential extension to the rational model would allowsounds to be generated from nonspeech categories. Currently, allsounds are assumed to belong to the /r/ and /l/ categories, butincorporating a nonspeech category would allow sounds that aredifferent from native language categories to be classified as non-speech. In the data from Iverson and Kuhl (1996), sounds that arefarthest from phonetic category centers are biased less than pre-dicted by our current model. Consistent with this, a nonspeechcategory with a uniform distribution over acoustic space wouldweaken the perceptual bias for sounds that are very different fromnative language categories. This would accord with suggestionsfrom the speech perception literature that sounds dissimilar tonative language phonetic categories remain perceptually unassimi-lated (e.g., Best, McRoberts, & Sithole, 1988). It would alsoparallel the suggestion by Huttenlocher et al. (2000) that partici-pants performing a visual stimulus reproduction task are less likelyto treat extreme stimulus values as belonging to the category ofexperimental stimuli, weakening the bias toward the edge of thecategory.
Phoneme Identification and Spoken Word Recognition
Speech perception involves recognizing not only speechsounds but also words, and our framework is potentially com-patible with several models of spoken word recognition. Short-list B (Norris & McQueen, 2008) uses a Bayesian framework tocharacterize word recognition in fluent speech at a computa-tional level, and a potential connection to this model comesthrough the quantity p(c�S), which is used as a primitive inShortlist B to compute word and path probabilities for spokenutterances. On an implementational level, our model is poten-tially compatible with either interactive (McClelland & Elman,1986) or feed-forward (Norris, McQueen, & Cutler, 2000)architectures, which give different accounts as to how acousticand lexical information are combined during phoneme recog-nition. Any computation that ultimately yields the posterior ontarget productions p(T �S) is compatible with our model. Undera feed-forward account, acoustic and lexical information wouldcombine at a decision level to generate the posterior distribu-tion, whereas in an interactive account, an initial guess at thedistribution on target productions might be recursively updatedby lexical feedback until it settles on the correct posteriordistribution. The model is also potentially compatible witheither an episodic lexicon (e.g., Bybee, 2001) or a more abstractlexicon (e.g., McClelland & Elman, 1986) that neverthelessincludes phonetic detail. As discussed above, groups of exem-plars can produce perceptual patterns similar to those obtainedusing abstract categories. The presence of a perceptual magneteffect for isolated phonemes suggests that some prior informa-tion is available at the level of the phoneme (see also McQueen,Cutler, & Norris, 2006), but this might be achieved eitherthrough abstraction or through analogy with stored lexicalitems.
At the level of phoneme perception, the rational model is aimedprimarily at explaining discrimination performance, but the quan-tity p(c�S) can potentially account for performance in explicitphoneme identification tasks as well. Consistent with our model’spredictions, Clayards et al. (2008) have demonstrated that listenersare sensitive to the degree of category variance when performingexplicit categorization tasks. Nevertheless, we acknowledge thepossibility that the quantity p(c�S) used for identification tasks isdifferent from that used for discrimination tasks. Such divergencemight be due to incorporation of additional information (e.g.,lexical information) into explicit categorization tasks or to loss ofinformation through imperfect approximations of the target pro-duction T before explicit categorization occurs. These possibilitiesremain open to further investigation.
Central to the rational model is the assumption that listenershave knowledge of phonetic categories but are trying to inferphonetic detail. This contrasts with previous models that haveassumed listeners recover only category information about pho-nemes. Phonemes do distinguish words from one another; how-ever, it is not clear that listeners abstract away from phonetic detailwhen storing and recognizing words (Goldinger, 1996; Ju & Luce,2006; McMurray, Tanenhaus, & Aslin, 2002). Evidence has shownthat listeners are sensitive to subphonemic detail at both neural andbehavioral levels (Andruski, Blumstein, & Burton, 1994; Blum-stein, Myers, & Rissman, 2005; Joanisse, Robertson, & Newman,2007; Pisoni & Tash, 1974). Phonetic detail provides coarticula-
775INFLUENCE OF CATEGORIES ON PERCEPTION

tory information that can help listeners identify upcoming wordsand word boundaries, and data from priming studies have sug-gested that listeners use this coarticulatory information online inlexical recognition tasks (Gow, 2001). This implies that listenersnot only infer a speech sound’s category but also attend to thephonetic detail within that category in order to gain informationabout upcoming phonemes and words. Though one could contendthat listeners ultimately categorize speech sounds into discretephonemes, their more direct goal must be to extract all relevantacoustic information from the speech signal. Because of its coreassumption that listeners recover the phonetic detail of speechsounds they hear, the rational model is in accord with thesebehavioral results showing the use of phonetic detail in spokenword recognition.
Categorical Effects in Other Domains
The assumptions underlying the rational model are not spe-cific to the structure of speech, and this makes the modelingresults potentially applicable beyond the specific case of vowelperception. The extent to which this model can account forphenomena such as categorical perception of consonants, col-ors, or faces is an exciting question for future research. Ageneralization of these results to consonant perception seems tobe the most straightforward, and results that are qualitativelycompatible with the rational model’s predictions have beenfound in stop consonant perception as measured by identifica-tion tasks (Burton & Blumstein, 1995; Clayards et al., 2008;Ganong, 1980). To the extent that consonants can be modeled asdistributions of speech sounds along acoustic dimensions, thesame principles that apply to vowel perception should yieldinsight into consonant perception. However, additional factorsmay need to be taken into account when modeling perception ofconsonants, especially stop consonants. Discrimination peakshave been found near stop consonant boundaries in animals(Kuhl & Padden, 1982, 1983) and very young infants (Eimas etal., 1971), suggesting that patterns in stop consonant perceptionare not solely the result of estimating distributions of speechsounds in the input but also involve auditory discontinuities.Auditory discontinuities are found in nonspeech stimuli as well(J. D. Miller et al., 1976; Pisoni, 1977) and might result fromdifferential perceptual uncertainty depending on the stimulusvalue (Pastore et al., 1977). Influences of auditory discontinui-ties on category learning have been shown in adults (Holt et al.,2004), and future research might investigate how these discon-tinuities interact with learned categories in speech perceptionand whether they continue to influence perception after pho-netic categories are acquired.
The rational model suggests that cross-linguistic differencesin speech perception result from differences in the distributionsof speech sounds heard by listeners, where perception is biasedtoward peaks in these distributions. A key issue in applyingthese results to color and face perception therefore involvesexamining the extent to which categories in these domains canbe characterized as clusters of exemplars. This seems plausiblefor both facial expressions and facial identities; however, thedistribution of colors in the world is unlikely to depend onlinguistic experience. Categorical perception of color appearsinstead to be mediated by linguistic codes, and effects of verbal
interference on categorical perception of facial expressionsparallel those in color perception (Roberson & Davidoff, 2000;Tan et al., 2008). The model presented here does not incorpo-rate the notion of linguistic codes, and it may need to beextended to account for these results. Nevertheless, direct be-havioral parallels have been drawn between color perceptionand speech perception (e.g., Bornstein & Korda, 1984). In thedomain of face perception, stronger categorical effects in fa-miliar faces than in unfamiliar faces (Beale & Keil, 1995) andshifts in the discrimination peak based on shifted categoryboundaries (Pollak & Kistler, 2002) are consistent with therational model’s predictions. Indeed, categorical perception offacial expressions has been argued to be more in line withprototype bias accounts than with labeling accounts (Robersonet al., 2007). These qualitative similarities may indicate thatcategories based on exemplar distributions and those based onlinguistic codes are processed in a similar manner, but furtherinvestigation is required to determine the extent of these par-allels.
Finally, evidence that our results are applicable beyond thespecific case of speech perception comes from nonlinguistic do-mains in which versions of this model have previously beenproposed. Huttenlocher et al. (2000) used the same one-categorymodel to explain category bias in visual stimulus reproduction, andthis has been followed by demonstrations of similar effects withother types of visual stimuli (Crawford, Huttenlocher, & Hedges,2006; Huttenlocher, Hedges, Corrigan, & Crawford, 2004). Kord-ing and Wolpert (2004) explained subjects’ behavior in motortasks using the same analysis. Similar ideas have also been used todescribe optimal visual cue integration (Landy, Maloney,Johnston, & Young, 1995) and audiovisual integration (Battaglia,Jacobs, & Aslin, 2003). Although this does not mean that themechanisms being used in these domains are equivalent, it at leastimplies that several low-level systems use the same optimal strat-egy when combining sources of information under uncertainty,explaining why categories should influence perception in each ofthese cases.
References
Aaltonen, O., Eerola, O., Hellstrom, Å., Uusipaikka, E., & Lang, A. H.(1997). Perceptual magnet effect in the light of behavioral and psycho-physiological data. Journal of the Acoustical Society of America, 101,1090–1105.
Abramson, A. S., & Lisker, L. (1970). Discriminability along the voicingcontinuum: Cross language tests. In Proceedings of the 6th InternationalCongress of Phonetic Sciences (pp. 569–573). Prague, Czech Republic:Academia.
Anderson, J. A., Silverstein, J. W., Ritz, S. A., & Jones, R. S. (1977).Distinctive features, categorical perception, and probability learning:Some applications of a neural model. Psychological Review, 84, 413–451.
Anderson, J. R. (1990). The adaptive character of thought. Hillsdale, NJ:Erlbaum.
Andruski, J. E., Blumstein, S. E., & Burton, M. (1994). The effect ofsubphonemic differences on lexical access. Cognition, 52, 163–187.
Angeli, A., Davidoff, J., & Valentine, T. (2008). Face familiarity, distinc-tiveness, and categorical perception. The Quarterly Journal of Experi-mental Psychology, 61, 690–707.
Ashby, F. G., & Alfonso-Reese, L. A. (1995). Categorization as probabilitydensity estimation. Journal of Mathematical Psychology, 39, 216–233.
776 FELDMAN, GRIFFITHS, AND MORGAN

Battaglia, P. W., Jacobs, R. A., & Aslin, R. N. (2003). Bayesian integrationof visual and auditory signals for spatial localization. Journal of theOptical Society of America, 20, 1391–1397.
Beale, J. M., & Keil, F. C. (1995). Categorical effects in the perception offaces. Cognition, 57, 217–239.
Beddor, P. S., & Strange, W. (1982). Cross-language study of perceptionof the oral–nasal distinction. Journal of the Acoustical Society of Amer-ica, 71, 1551–1561.
Berlin, B., & Kay, P. (1969). Basic color terms: Their universality andevolution. Berkeley: University of California Press.
Best, C. T., McRoberts, G. W., & Sithole, N. M. (1988). Examination ofperceptual reorganization for nonnative speech contrasts: Zulu clickdiscrimination by English-speaking adults and infants. Journal of Ex-perimental Psychology: Human Perception and Performance, 14, 345–360.
Blumstein, S. E., Myers, E. B., & Rissman, J. (2005). The perception ofvoice onset time: An fMRI investigation of phonetic category structure.Journal of Cognitive Neuroscience, 17, 1353–1366.
Boersma, P. (2001). Praat, a system for doing phonetics by computer. GlotInternational, 5(9/10), 341–345.
Bornstein, M. H., & Korda, N. O. (1984). Discrimination and matchingwithin and between hues measured by reaction times: Some implicationsfor categorical perception and levels of information processing. Psycho-logical Research, 46, 207–222.
Burton, M. W., & Blumstein, S. E. (1995). Lexical effects on phoneticcategorization: The role of stimulus naturalness and stimulus quality.Journal of Experimental Psychology: Human Perception and Perfor-mance, 21, 1230–1235.
Bybee, J. (2001). Phonology and language use. Port Chester, NY: Cam-bridge University Press.
Calder, A. J., Young, A. W., Perrett, D. I., Etcoff, N. L., & Rowland, D.(1996). Categorical perception of morphed facial expressions. VisualCognition, 3, 81–117.
Campanella, S., Hanoteau, C., Seron, X., Joassin, F., & Bruyer, R. (2003).Categorical perception of unfamiliar facial identities, the face–spacemetaphor, and the morphing technique. Visual Cognition, 10, 129–156.
Clayards, M., Tanenhaus, M. K., Aslin, R. N., & Jacobs, R. A. (2008).Perception of speech reflects optimal use of probabilistic speech cues.Cognition, 108, 804–809.
Connine, C. M., Titone, D., & Wang, J. (1993). Auditory word recognition:Extrinsic and intrinsic effects of word frequency. Journal of Experimen-tal Psychology: Learning, Memory, and Cognition, 19, 81–94.
Crawford, L. E., Huttenlocher, J., & Hedges, L. V. (2006). Within-categoryfeature correlations and Bayesian adjustment strategies. PsychonomicBulletin and Review, 13, 245–250.
Damper, R. I., & Harnad, S. R. (2000). Neural network models of cate-gorical perception. Perception & Psychophysics, 62, 843–867.
Davidoff, J., Davies, I., & Roberson, D. (1999). Colour categories in astone-age tribe. Nature, 398, 203–204.
de Boer, B., & Kuhl, P. K. (2003). Investigating the role of infant-directedspeech with a computer model. Acoustics Research Letters Online, 4,129–134.
de Gelder, B., Teunisse, J.-P., & Benson, P. J. (1997). Categorical percep-tion of facial expressions: Categories and their internal structure. Cog-nition and Emotion, 11, 1–23.
Dempster, A. P., Laird, N. M., & Rubin, D. B. (1977). Maximum likeli-hood from incomplete data via the EM algorithm. Journal of the RoyalStatistical Society, 39B, 1–38.
Diesch, E., Iverson, P., Kettermann, A., & Siebert, C. (1999). Measuringthe perceptual magnet effect in the perception of /i/ by German listeners.Psychological Research, 62, 1–19.
Eimas, P. D. (1974). Auditory and linguistic processing of cues for placeof articulation by infants. Perception & Psychophysics, 16, 513–521.
Eimas, P. D. (1975). Auditory and phonetic coding of the cues for speech:
Discrimination of the r–l distinction by young infants. Perception &Psychophysics, 18, 341–347.
Eimas, P. D., Siqueland, E. R., Jusczyk, P., & Vigorito, J. (1971). Speechperception in infants. Science, 171(3968), 303–306.
Etcoff, N. L., & Magee, J. J. (1992). Categorical perception of facialexpressions. Cognition, 44, 227–240.
Formby, C., Childers, D. G., & Lalwani, A. L. (1996). Labelling anddiscrimination of a synthetic fricative continuum in noise: A study ofabsolute duration and relative onset time cues. Journal of Speech andHearing Research, 39, 4–18.
Frieda, E. M., Walley, A. C., Flege, J. E., & Sloane, M. E. (1999). Adults’perception of native and nonnative vowels: Implications for the percep-tual magnet effect. Perception & Psychophysics, 61, 561–577.
Fry, D. B., Abramson, A. S., Eimas, P. D., & Liberman, A. M. (1962). Theidentification and discrimination of synthetic vowels. Language andSpeech, 5, 171–189.
Fujisaki, H., & Kawashima, T. (1969). On the modes and mechanisms ofspeech perception. Annual Report of the Engineering Research Institute,28, 67–72.
Ganong, W. F. (1980). Phonetic categorization in auditory word percep-tion. Journal of Experimental Psychology: Human Perception and Per-formance, 6, 110–125.
Gerrits, E., & Schouten, M. E. H. (2004). Categorical perception dependson the discrimination task. Perception and Psychophysics, 66, 363–376.
Gilbert, A. L., Regier, T., Kay, P., & Ivry, R. B. (2006). Whorf hypothesisis supported in the right visual field but not the left. Proceedings of theNational Academy of Sciences, 103, 489–494.
Goldinger, S. D. (1996). Words and voices: Episodic traces in spoken wordidentification and recognition memory. Journal of Experimental Psy-chology: Learning, Memory, and Cognition, 22, 1166–1183.
Goldstone, R. (1994). Influences of categorization on perceptual discrimina-tion. Journal of Experimental Psychology: General, 123, 178–200.
Goldstone, R. L. (1995). Effects of categorization on color perception.Psychological Science, 6, 298–304.
Goldstone, R. L., Lippa, Y., & Shiffrin, R. M. (2001). Altering objectrepresentations through category learning. Cognition, 78, 27–43.
Gow, D. W. (2001). Assimilation and anticipation in continuous spokenword recognition. Journal of Memory and Language, 45, 133–159.
Green, D. M., & Swets, J. A. (1966). Signal detection theory and psycho-physics. New York: Wiley.
Grieser, D., & Kuhl, P. K. (1989). Categorization of speech by infants:Support for speech–sound prototypes. Developmental Psychology, 25,577–588.
Guenther, F. H., & Gjaja, M. N. (1996). The perceptual magnet effect as anemergent property of neural map formation. Journal of the AcousticalSociety of America, 100, 1111–1121.
Guenther, F. H., Husain, F. T., Cohen, M. A., & Shinn-Cunningham, B. G.(1999). Effects of categorization and discrimination training on auditoryperceptual space. Journal of the Acoustical Society of America, 106,2900–2912.
Gureckis, T. M., & Goldstone, R. L. (2008). The effect of the internalstructure of categories on perception. In B. C. Love, K. McRae, & V. M.Sloutsky (Eds.), Proceedings of the 30th Annual Conference of theCognitive Science Society (pp. 1876–1881). Austin, TX: CognitiveScience Society.
Harnad, S. (1987). Introduction: Psychophysical and cognitive aspects ofcategorical perception: A critical overview. In S. Harnad (Ed.), Cate-gorical perception: The groundwork of cognition (pp. 1–25). New York:Cambridge University Press.
Hillenbrand, J., Getty, L. A., Clark, M. J., & Wheeler, K. (1995). Acousticcharacteristics of American English vowels. Journal of the AcousticalSociety of America, 97, 3099–3111.
Holt, L. L., Lotto, A. J., & Diehl, R. L. (2004). Auditory discontinuities
777INFLUENCE OF CATEGORIES ON PERCEPTION

interact with categorization: Implications for speech perception. Journalof the Acoustical Society of America, 116, 1763–1773.
Huttenlocher, J., Hedges, L. V., Corrigan, B., & Crawford, L. E. (2004).Spatial categories and the estimation of location. Cognition, 93, 75–97.
Huttenlocher, J., Hedges, L. V., & Vevea, J. L. (2000). Why do categoriesaffect stimulus judgment? Journal of Experimental Psychology: Gen-eral, 129, 220–241.
Iverson, P., & Kuhl, P. K. (1995). Mapping the perceptual magnet effectfor speech using signal detection theory and multidimensional scaling.Journal of the Acoustical Society of America, 97, 553–562.
Iverson, P., & Kuhl, P. K. (1996). Influences of phonetic identification andcategory goodness on American listeners’ perception of /r/ and /l/.Journal of the Acoustical Society of America, 99, 1130–1140.
Iverson, P., & Kuhl, P. K. (2000). Perceptual magnet and phoneme bound-ary effects in speech perception: Do they arise from a common mech-anism? Perception & Psychophysics, 62, 874–886.
Iverson, P., Kuhl, P. K., Akahane-Yamada, R., Diesch, E., Tohkura, Y.,Kettermann, A., et al. (2003). A perceptual interference account ofacquisition difficulties for non-native phonemes. Cognition, 87, B47–B57.
Joanisse, M. F., Robertson, E. K., & Newman, R. L. (2007). Mismatchnegativity reflects sensory and phonetic speech processing. NeuroRe-port, 18, 901–905.
Ju, M., & Luce, P. A. (2006). Representational specificity of within-category phonetic variation in the long-term mental lexicon. Journal ofExperimental Psychology: Human Perception and Performance, 32,120–138.
Kay, P., & Kempton, W. (1984). What is the Sapir–Whorf hypothesis?American Anthropologist, 86, 65–79.
Kay, P., & Regier, T. (2007). Color naming universals: The case ofBerinmo. Cognition, 102, 289–298.
Kiffel, C., Campanella, S., & Bruyer, R. (2005). Categorical perception offaces and facial expressions: The age factor. Experimental Aging Re-search, 31, 119–147.
Kikutani, M., Roberson, D., & Hanley, J. R. (2008). What’s in the name?Categorical perception for unfamiliar faces can occur through labeling.Psychonomic Bulletin and Review, 15, 787–794.
Kording, K. P., & Wolpert, D. M. (2004). Bayesian integration in senso-rimotor learning. Nature, 427, 244–247.
Kotsoni, E., de Haan, M., & Johnson, M. H. (2001). Categorical perceptionof facial expressions by 7-month-old infants. Perception, 30, 1115–1125.
Kuhl, P. K. (1981). Discrimination of speech by nonhuman animals: Basicauditory sensitivities conducive to the perception of speech–sound cat-egories. Journal of the Acoustical Society of America, 70, 340–349.
Kuhl, P. K. (1991). Human adults and human infants show a “perceptualmagnet effect” for the prototypes of speech categories, monkeys do not.Perception & Psychophysics, 50, 93–107.
Kuhl, P. K. (1993). Early linguistic experience and phonetic perception:Implications for theories of developmental speech perception. Journal ofPhonetics, 21, 125–139.
Kuhl, P. K., & Padden, D. M. (1982). Enhanced discriminability at thephonetic boundaries for the voicing feature in macaques. Perception &Psychophysics, 32, 542–550.
Kuhl, P. K., & Padden, D. M. (1983). Enhanced discriminability at thephonetic boundaries for the place feature in macaques. Journal of theAcoustical Society of America, 73, 1003–1010.
Kuhl, P. K., Stevens, E., Hayashi, A., Deguchi, T., Kiritani, S., & Iverson,P. (2006). Infants show a facilitation effect for native language phoneticperception between 6 and 12 months. Developmental Science, 9, F13–F21.
Kuhl, P. K., Williams, K. A., Lacerda, F., Stevens, K. N., & Lindblom, B.(1992). Linguistic experience alters phonetic perception in infants by 6months of age. Science, 255(5044), 606–608.
Lacerda, F. (1995). The perceptual-magnet effect: An emergent conse-quence of exemplar-based phonetic memory. In K. Elenius & P. Bran-derud (Eds.), Proceedings of the 13th International Congress of Pho-netic Sciences (Vol. 2, pp. 140–147). Stockholm: KTH and StockholmUniversity.
Landy, M. S., Maloney, L. T., Johnston, E. B., & Young, M. (1995).Measurement and modeling of depth cue combination: In defense ofweak fusion. Vision Research, 35, 389–412.
Levin, D. T., & Beale, J. M. (2000). Categorical perception occurs in newlylearned faces, other-race faces, and inverted faces. Perception & Psy-chophysics, 62, 386–401.
Liberman, A., Harris, K. S., Eimas, P. D., Lisker, L., & Bastian, J. (1961).An effect of learning on speech perception: The discrimination ofdurations of silence with and without phonemic significance. Languageand Speech, 4, 175–195.
Liberman, A. M., Harris, K. S., Hoffman, H. S., & Griffith, B. C. (1957).The discrimination of speech sounds within and across phoneme bound-aries. Journal of Experimental Psychology, 54, 358–368.
Liberman, A. M., Harris, K. S., Kinney, J. A., & Lane, H. (1961). Thediscrimination of relative onset-time of the components of certain speechand nonspeech patterns. Journal of Experimental Psychology, 61, 379–388.
Lively, S. E., & Pisoni, D. B. (1997). On prototypes and phonetic catego-ries: A critical assessment of the perceptual magnet effect in speechperception. Journal of Experimental Psychology: Human Perceptionand Performance, 23, 1665–1679.
Livingston, K. R., Andrews, J. K., & Harnad, S. (1998). Categoricalperception effects induced by category learning. Journal of Experimen-tal Psychology: Learning, Memory, and Cognition, 24, 732–753.
Lotto, A. J., Kluender, K. R., & Holt, L. L. (1998). Depolarizing theperceptual magnet effect. Journal of the Acoustical Society of America,103, 3648–3655.
Marr, D. (1982). Vision. San Francisco: W. H. Freeman.Massaro, D. W., & Cohen, M. M. (1983). Phonological context in speech
perception. Perception & Psychophysics, 34(4), 338–348.Maye, J., & Gerken, L. (2000). Learning phonemes without minimal pairs.
In S. C. Howell, S. A. Fish, & T. Keith-Lucas (Eds.), Proceedings of the24th Annual Boston University Conference on Language Development(pp. 522–533). Somerville, MA: Cascadilla Press.
Maye, J., Werker, J. F., & Gerken, L. (2002). Infant sensitivity to distri-butional information can affect phonetic discrimination. Cognition, 82,B101–B111.
McClelland, J. L., & Elman, J. L. (1986). The TRACE model of speechperception. Cognitive Psychology, 18, 1–86.
McMurray, B. (2009). Klattworks: A [somewhat] new systematic approachto formant-based speech synthesis for empirical research. Unpublishedmanuscript.
McMurray, B., Aslin, R. N., & Toscano, J. C. (2009). Statistical learningof phonetic categories: Insights from a computational approach. Devel-opmental Science, 12, 369–378.
McMurray, B., Tanenhaus, M. K., & Aslin, R. N. (2002). Gradient effectsof within-category phonetic variation on lexical access. Cognition, 86,B33–B42.
McQueen, J. M. (1991). The influence of the lexicon on phonetic catego-rization: Stimulus quality in word-final ambiguity. Journal of Experi-mental Psychology: Human Perception and Performance, 17(2), 433–443.
McQueen, J. M., Cutler, A., & Norris, D. (2006). Phonological abstractionin the mental lexicon. Cognitive Science, 30, 1113–1126.
Mertus, J. (2004). Bliss user’s manual. Providence, RI: Brown University.Miller, G. A., & Nicely, P. E. (1955). An analysis of perceptual confusions
among some English consonants. Journal of the Acoustical Society ofAmerica, 27, 338–352.
Miller, J. D., Wier, C. C., Pastore, R. E., Kelly, W. J., & Dooling, R. J.
778 FELDMAN, GRIFFITHS, AND MORGAN

(1976). Discrimination and labeling of noise-buzz sequences with vary-ing noise-lead times: An example of categorical perception. Journal ofthe Acoustical Society of America, 60, 410–417.
Miller, J. L., & Eimas, P. D. (1977). Studies on the perception of place andmanner of articulation: A comparison of the labial-alveolar and nasal-stop distinctions. Journal of the Acoustical Society of America, 61,835–845.
Miyawaki, K., Strange, W., Verbrugge, R., Liberman, A. M., Jenkins, J. J.,& Fujimura, O. (1975). An effect of linguistic experience: The discrim-ination of �r� and �l� by native speakers of Japanese and English.Perception & Psychophysics, 18, 331–340.
Morse, P. A., & Snowdon, C. T. (1975). An investigation of categoricalspeech discrimination by rhesus monkeys. Perception & Psychophysics,17, 9–16.
Naatanen, R., Lehtokoski, A., Lennes, M., Cheour, M., Huotilainen, M.,Iivonen, A., et al. (1997). Language-specific phoneme representationsrevealed by electric and magnetic brain responses. Nature, 385, 432–434.
Norris, D., & McQueen, J. M. (2008). Shortlist B: A Bayesian model ofcontinuous speech recognition. Psychological Review, 115, 357–395.
Norris, D., McQueen, J. M., & Cutler, A. (2000). Merging information inspeech recognition: Feedback is never necessary. Behavioral and BrainSciences, 23, 299–325.
Ozgen, E., & Davies, I. R. L. (2002). Acquisition of categorical colorperception: A perceptual learning approach to the linguistic relativityhypothesis. Journal of Experimental Psychology: General, 131, 477–493.
Pastore, R. E., Ahroon, W. A., Baffuto, K. J., Friedman, C., Puleo, J. S., &Fink, E. A. (1977). Common-factor model of categorical perception.Journal of Experimental Psychology: Human Perception and Perfor-mance, 3, 686–696.
Peterson, G. E., & Barney, H. L. (1952). Control methods used in a studyof the vowels. Journal of the Acoustical Society of America, 24, 175–184.
Pilling, M., Wiggett, A., Ozgen, E., & Davies, I. R. L. (2003). Is color“categorical perception” really perceptual? Memory & Cognition, 31,538–551.
Pisoni, D. B. (1973). Auditory and phonetic memory codes in the discrim-ination of consonants and vowels. Perception & Psychophysics, 13,253–260.
Pisoni, D. B. (1975). Auditory short-term memory and vowel perception.Memory and Cognition, 3, 7–18.
Pisoni, D. B. (1977). Identification and discrimination of the relative onsettime of two component tones: Implications for voicing perception.Journal of the Acoustical Society of America, 61, 1352–1361.
Pisoni, D. B., & Lazarus, J. H. (1974). Categorical and noncategoricalmodes of speech perception along the voicing continuum. Journal of theAcoustical Society of America, 55, 328–333.
Pisoni, D. B., & Tash, J. (1974). Reaction times to comparisons within andacross phonetic categories. Perception & Psychophysics, 15, 285–290.
Pitt, M. A., & McQueen, J. M. (1998). Is compensation for coarticulationmediated by the lexicon? Journal of Memory and Language, 39, 347–370.
Polka, L., & Bohn, O.-S. (2003). Asymmetries in vowel perception. SpeechCommunication, 41, 221–231.
Pollak, S. D., & Kistler, D. J. (2002). Early experience is associated withthe development of categorical representations for facial expressions ofemotion. Proceedings of the National Academy of Sciences, 99, 9072–9076.
Regier, T., Kay, P., & Khetarpal, N. (2007). Color naming reflects optimalpartitions of color space. Proceedings of the National Academy ofSciences, 104, 1436–1441.
Repp, B. H. (1982). Phonetic trading relations and context effects: New
experimental evidence for a speech mode of perception. PsychologicalBulletin, 92, 81–110.
Repp, B. H., & Crowder, R. G. (1990). Stimulus order effects in voweldiscrimination. Journal of the Acoustical Society of America, 88, 2080–2090.
Repp, B. H., Healy, A. F., & Crowder, R. G. (1979). Categories andcontext in the perception of isolated steady-state vowels. Journal ofExperimental Psychology: Human Perception and Performance, 5,129–145.
Rice, J. A. (1995). Mathematical statistics and data analysis (2nd ed.).Belmont, CA: Duxbury.
Roberson, D., Damjanovic, L., & Pilling, M. (2007). Categorical percep-tion of facial expressions: Evidence for a “category adjustment” model.Memory & Cognition, 35, 1814–1829.
Roberson, D., & Davidoff, J. (2000). The categorical perception of colorsand facial expressions: The effect of verbal interference. Memory &Cognition, 28, 977–986.
Roberson, D., Davidoff, J., Davies, I. R. L., & Shapiro, L. R. (2005). Colorcategories: Evidence for the cultural relativity hypothesis. CognitivePsychology, 50, 378–411.
Roberson, D., Davies, I., & Davidoff, J. (2000). Color categories are notuniversal: Replications and new evidence from a stone-age culture.Journal of Experimental Psychology: General, 129, 369–398.
Rosch Heider, E. (1972). Universals in color naming and memory. Journalof Experimental Psychology, 93, 10–20.
Rosch Heider, E., & Oliver, D. C. (1972). The structure of the color spacein naming and memory for two languages. Cognitive Psychology, 3,337–354.
Rotshtein, P., Henson, R. N. A., Treves, A., Driver, J., & Dolan, R. J.(2005). Morphing Marilyn into Maggie dissociates physical and identityface representations in the brain. Nature Neuroscience, 8, 107–113.
Shepard, R. N. (1980). Multidimensional scaling, tree-fitting, and cluster-ing. Science, 210, 390–398.
Shi, L., Feldman, N. H., & Griffiths, T. L. (2008). Performing Bayesianinference with exemplar models. In B. C. Love, K. McRae, & V. M.Sloutsky (Eds.), Proceedings of the 30th Annual Conference of theCognitive Science Society (pp. 745–750). Austin, TX: Cognitive ScienceSociety.
Silverman, B. W. (1986). Density estimation. London: Chapman & Hall.Stevenage, S. V. (1998). Which twin are you? A demonstration of induced
categorical perception of identical twin faces. British Journal of Psy-chology, 89, 39–57.
Stevens, K. N., Liberman, A. M., Studdert-Kennedy, M., & Ohman,S. E. G. (1969). Cross-language study of vowel perception. Languageand Speech, 12, 1–23.
Stevens, S. S., Volkmann, J., & Newman, E. B. (1937). A scale for themeasurement of the psychological magnitude pitch. Journal of theAcoustical Society of America, 8, 185–190.
Sussman, J. E., & Gekas, B. (1997). Phonetic category structure of [I]:Extent, best exemplars, and organization. Journal of Speech, Language,and Hearing Research, 40, 1406–1424.
Sussman, J. E., & Lauckner-Morano, V. J. (1995). Further tests of the“perceptual magnet effect” in the perception of �i�: Identification andchange/no-change discrimination. Journal of the Acoustical Society ofAmerica, 97, 539–552.
Tan, L. H., Chan, A. H. D., Kay, P., Khong, P.-L., Yip, L. K. C., & Luke,K.-K. (2008). Language affects patterns of brain activation associatedwith perceptual decision. Proceedings of the National Academy of Sci-ences, 105, 4004–4009.
Thyer, N., Hickson, L., & Dodd, B. (2000). The perceptual magnet effectin Australian English vowels. Perception & Psychophysics, 62, 1–20.
Vallabha, G. K., & McClelland, J. L. (2007). Success and failure of newspeech category learning in adulthood: Consequences of learned Heb-
779INFLUENCE OF CATEGORIES ON PERCEPTION

bian attractors in topographic maps. Cognitive, Affective, and BehavioralNeuroscience, 7, 53–73.
Vallabha, G. K., McClelland, J. L., Pons, F., Werker, J. F., & Amano, S. (2007).Unsupervised learning of vowel categories from infant-directed speech. Pro-ceedings of the National Academy of Sciences, 104, 13273–13278.
Viviani, P., Binda, P., & Borsato, T. (2007). Categorical perception ofnewly learned faces. Visual Cognition, 15, 420–467.
Winawer, J., Witthoft, N., Frank, M. C., Wu, L., Wade, A. R., &Boroditsky, L. (2007). Russian blues reveal effects of language on colordiscrimination. Proceedings of the National Academy of Sciences, 104,7780–7785.
Winkler, I., Lehtokoski, A., Alku, P., Vainio, M., Czigler, I., Csepe, V., et al.(1999). Pre-attentive detection of vowel contrasts utilizes both phonetic andauditory memory representations. Cognitive Brain Research, 7, 357–369.
Witthoft, N., Winawer, J., Wu, L., Frank, M., Wade, A., & Boroditsky,L. (2003). Effects of language on color discriminability. In R. Alter-man & D. Kirsh (Eds.), Proceedings of the 25th Annual Conferenceof the Cognitive Science Society (pp. 1247–1252). Mahwah, NJ:Erlbaum.
Xu, L., & Zheng, Y. (2007). Spectral and temporal cues for phonemerecognition in noise. Journal of the Acoustical Society of America, 122,1758–1764.
Young, A. W., Rowland, D., Calder, A. J., Etcoff, N. L., Seth, A., &Perrett, D. I. (1997). Facial expression megamix: Tests of dimen-sional and category accounts of emotion recognition. Cognition, 63,271–313.
Yuille, A., & Kersten, D. (2006). Vision as Bayesian inference: Analysisby synthesis? Trends in Cognitive Sciences, 10, 301–308.
Appendix A
Computing Expected Target Productions
Given a generative model where p(T �c) � N(�c, �c2) and p(S�T) �
N(T, �S2), we can use Bayes’ rule for the one-category case,
p(T �S, c) � p(S�T, c)p(T �c), to express the posterior on targets as
p�T �S, c� �1
�2��c2 exp�� �T � �c�
2
2�c2 �
�1
�2��S2 exp�� �S � T �2
2�S2 � . (19)
The normalizing constants can be eliminated while still retainingproportionality, so this expression becomes
p�T �S, c� � exp�� �T � �c�2
2�c2 �
�S � T �2
2�S2 � . (20)
Expanding the terms in the exponent and eliminating those termsthat do not depend on T, we obtain
p�T �S, c� � exp�� T 2
2�c2 �
2T�c
2�c2 �
2ST
2�S2 �
T 2
2�S2� . (21)
The expression in the exponent can be simplified into one termthat depends on T 2 and a second term that depends on T, so that
p�T �S, c� � exp�� �c2 � �S
2
2��c2�S
2�T 2 �
2��c2S � �S
2�c�
2��c2�S
2�T� . (22)
We make the form more similar to a Gaussian distribution,
p�T �S, c� � exp�� T 2 � 2�c
2S � �S2�c
�c2 � �S
2 T
2�c
2�S2
�c2 � �S
2 . (23)
and multiply by the constant
exp����c
2S � �S2�c�
2
��c2 � �S
2�2
2�c
2�S2
�c2 � �S
2
to complete the square, preserving proportionality because thisnew term does not depend on T. The expression
p�T �S, c� � exp�� �T ��c
2S � �S2�c
�c2 � �S
2 � 2
2�c
2�S2
�c2 � �S
2 (24)
now has the form of a Gaussian distribution with mean
�c2S � �S
2�c
�c2 � �S
2
and variance
�c2�S
2
�c2 � �S
2.
The posterior distribution in the one-category case is therefore
p�T �S, c� � N��c2S � �S
2�c
�c2 � �S
2 ,�c
2�S2
�c2 � �S
2� (25)
and the expected value of T is the mean of this Gaussian distribu-tion,
E�T �S, c� ��c
2S � �S2�c
�c2 � �S
2 . (26)
To compute the expectation E[T �S] in the case of multiple categories,we use the formula E[T �S] � �Tp(T �S)dT, where p(T�S) is computed bymarginalizing over categories, p(T �S) � c p(T �S, c)p(c�S). The expres-sion for the expectation becomes
E�T �S� � �T�c
p�T �S, c�p�c�S)dT. (27)
Bringing T inside the sum and then exchanging the sum and theintegral yields
780 FELDMAN, GRIFFITHS, AND MORGAN

E�T �S� � �c�Tp�T �S, c�p�c�S�dT. (28)
Because p(c�S) does not depend on T, this is equal to
E�T �S� � �c
p�c�S��Tp�T�S, c�dT, (29)
where �Tp(T �S, c)dT denotes E[T �S, c], the expectation in theone-category case (Equation 26). The expectation in the case ofmultiple categories is therefore
E�T �S� � �c
p�c�S��c
2S � �S2�c
�c2 � �S
2 , (30)
which is the same as the expression given in Equation 10.
Appendix B
Calculating Category Parameters From Identification Curves
Given a logistic identification curve for the percentage of par-ticipants that identified each stimulus as belonging to Category 1in a two-category forced-choice identification task, one can derivethe category means and common variance by noting that the curveis an empirical measure of p(c1�S), which in a two-category forced-choice task is defined according to Bayes’ rule (Equation 4) as
p�c1�S� �p�S�c1�p�c1�
p�S�c1�p�c1� � p�S�c2�p�c2�. (31)
Each part of the fraction can be divided by the quantity in thenumerator. Two inverse functions are applied to the last term, theexponential power and the natural logarithm, yielding
p�c1�S� �1
1 � elogp�S�c2� p�c2�
p�S�c1� p�c1�
. (32)
Assuming that the two categories c1 and c2 have equal priorprobability, and using the distribution for p(S�c) given in Equation3, we can simplify Equation 32 to a logistic equation of the form
p�c1�S� �1
1 � e�gSb, (33)
where
g ��1 � �2
�c2 � �S
2 and b ��1
2 � �22
2��c2 � �S
2�.
Thus, given values for g, b, and �1, one can calculate the value of�2 and the sum �c
2 �S2 as follows:
�2 �2b
g� �1 and (34)
�c2 � �S
2 ��1 � �2
g. (35)
Without the assumption of equal prior probability, the bias terminstead becomes
b ��1
2 � �22
2��c2 � �S
2�� log
p�c2�
p�c1�,
which produces a shift of the logistic toward the mean of the lessprobable category. Because the category boundary occurs wherep(c1�S) � 1/2 or S � b/g, this bias term produces a shift ofmagnitude
logp�c2�
p�c1�
g,
where g is the gain of the logistic. The extra bias term thereforecreates a larger shift in boundary locations for small values of the gainparameter, which can arise through high category variance �c
2, highnoise variance �S
2, or small separation between category means �1 � �2.
(Appendixes continue)
781INFLUENCE OF CATEGORIES ON PERCEPTION

Appendix C
Measure of Warping
Perceptual warping, which is a measure of the degree of shrink-age or expansion of perceptual space, corresponds mathematicallyto the derivative of the expected target E[T �S] with respect to S.We begin with the expectation from Equation 11
E�T �S� ��c
2
�c2 � �S
2S ��S
2
�c2 � �S
2�c
�c p�c�S� (36)
and compute its derivative, using the chain rule to compute thederivative of the second term,
dE�T �S�
dS�
�c2
�c2 � �S
2 ��S
2
�c2 � �S
2�c
�c
dp�c�S�
dS. (37)
This is the expression given in Equation 14. However, this deriv-ative includes a term that corresponds to the derivative of theidentification function. In the two-category case, the identificationfunction has the form of a logistic function
p�c1�S� �1
1 � e�gS b
whose derivative is given by
dp�c1�S�
dS� gp�c1�S��1 � p�c1�S��, (38)
where
g ��1 � �2
�c2 � �S
2 .
Because p(c2�S) � 1 � p(c1�S) in the two-category case, thederivative of the logistic for p(c2�S) is identical to Equation 38except that the gain has the opposite sign. Substituting this intoEquation 37 and expanding the sum yields
dE�T �S�
dS�
�c2
�c2 � �S
2 ��S
2
�c2 � �S
2 ��1gp�c1�S��1 � p�c1�S��
� �2gp�c1�S��1 � p�c1�S���, (39)
which can be simplified to
dE�T �S�
dS�
�c2
�c2 � �S
2 ��S
2
�c2 � �S
2 g��1 � �2��p�c1�S��1 � p�c1�S���
(40)
or, substituting in the expression for the gain of the logistic,
dE�T �S�
dS�
�c2
�c2 � �S
2 ��S
2��1 � �2�2
��c2 � �S
2�2 �p�c1�S��1 � p�c1�S���.
(41)
Appendix D
Same–Different Task
Given two stimuli SA and SB, the posterior probability that thetargets TA and TB are within range � of each other is p(�TA � TB�� ��SA, SB), which is equivalent to p(�� � TA � TB � ��SA, SB).This probability can be computed analytically by marginalizingover category assignments for the two stimuli,
�cA
�cB
p��� � TA � TB � ��cA, cB, SA, SB�p�cA�SA�p�cB�SB� (42)
under the assumption that the two stimuli are generated independently(cA and SA are independent of cB and SB). To compute the first term,note that the distributions p(TA�cA, SA) and p(TB�cB, SB) are bothGaussians as given by Equation 6. Their difference therefore followsa Gaussian distribution, with its mean equal to the difference betweenthe two means and its variance equal to the sum of the two variances,
TA � TB�cA, cB, SA, SB �
N��c2�SA � SB� � �S
2��A � �B�
�c2 � �S
2 ,2�c
2�S2
�c2 � �S
2� . (43)
Given this density, the probability of falling within a range be-tween �� and � can be expressed in terms of the standard cumu-lative normal distribution �,
p��� � TA � TB � ��cA, cB, SA, SB� � ��� � �d
�d�
� ���� � �d
�d� , (44)
where
�d ��c
2�SA � SB� � �S2��A � �B�
�c2 � �S
2
and
�d � � 2�c2�S
2
�c2 �S
2.
The second and third terms in Equation 42 can then be computedindependently for stimuli SA and SB from Equation 12.
Received January 4, 2008Revision received July 20, 2009
Accepted July 21, 2009 �
782 FELDMAN, GRIFFITHS, AND MORGAN