the influence of cultural practice, biology and
TRANSCRIPT

Retrospective Theses and Dissertations Iowa State University Capstones, Theses andDissertations
2004
The influence of cultural practice, biology andenvironment on maize pollen travelDale Steven IrelandIowa State University
Follow this and additional works at: https://lib.dr.iastate.edu/rtd
Part of the Agricultural Science Commons, Agriculture Commons, and the Agronomy and CropSciences Commons
This Dissertation is brought to you for free and open access by the Iowa State University Capstones, Theses and Dissertations at Iowa State UniversityDigital Repository. It has been accepted for inclusion in Retrospective Theses and Dissertations by an authorized administrator of Iowa State UniversityDigital Repository. For more information, please contact [email protected].
Recommended CitationIreland, Dale Steven, "The influence of cultural practice, biology and environment on maize pollen travel " (2004). Retrospective Thesesand Dissertations. 787.https://lib.dr.iastate.edu/rtd/787

NOTE TO USERS
This reproduction is the best copy available.
®
UMI


The influence of cultural practice, biology and environment on maize pollen travel
by
Dale Steven Ireland
A dissertation submitted to the graduate faculty
in partial fulfillment of the requirements for the degree of
DOCTOR OF PHILOSOPHY
Major: Crop Production and Physiology
Program of Study Committee: Mark E. Westgate, Major Professor
Susana Goggi Ricardo J. Salvador
Gene S. Takle Dennis Todey
Iowa State University
Ames, Iowa
2004
Copyright © Dale Steven Ireland, 2004. All rights reserved.

UMI Number: 3136320
INFORMATION TO USERS
The quality of this reproduction is dependent upon the quality of the copy
submitted. Broken or indistinct print, colored or poor quality illustrations and
photographs, print bleed-through, substandard margins, and improper
alignment can adversely affect reproduction.
In the unlikely event that the author did not send a complete manuscript
and there are missing pages, these will be noted. Also, if unauthorized
copyright material had to be removed, a note will indicate the deletion.
UMI UMI Microform 3136320
Copyright 2004 by ProQuest Information and Learning Company.
All rights reserved. This microform edition is protected against
unauthorized copying under Title 17, United States Code.
ProQuest Information and Learning Company 300 North Zeeb Road
P.O. Box 1346 Ann Arbor, Ml 48106-1346

Graduate College Iowa State University
This is to certify that the doctoral dissertation of
Dale Steven Ireland
has met the dissertation requirements of Iowa State University
Committee Memb
Committee Member
Committe Member
Committee Member
Major Prof
For the Maj Program
Signature was redacted for privacy.
Signature was redacted for privacy.
Signature was redacted for privacy.
Signature was redacted for privacy.
Signature was redacted for privacy.
Signature was redacted for privacy.

iii
TABLE OF CONTENTS
LIST OF FIGURES v
LIST OF TABLES vii
ABSTRACT viii
CHAPTER 1. GENERAL INTRODUCTION 1
Introduction 1
Dissertation Organization 2
References 3
CHAPTER 2. MANAGING REPRODUCTIVE ISOLATION IN HYBRID
SEED CORN PRODUCTION 5
Abstract 5
Background 6
Materials and Methods 11
Results and Discussion 16
Conclusions 23
Acknowledgments 25
References 26
CHAPTER 3. ESTIMATING EXTRA-FIELD TRAVEL OF MAIZE
POLLEN USING A GAUSSIAN-BASED PARTICULATE
DISPERSION MODEL 45
Abstract 45
Background 46
Materials and Methods 50
Results and Discussion 54
Conclusions 60
References 61

CHAPTER 4. GENERAL CONCLUSIONS
General Discussion
Recommendations for Future Research
References
APPENDIX A. Inter-Industry Isolation Study Data Set
1998
1999
2000
APPENDIX B. Pollen Deposition Data Set
2000 - Ames, Iowa
2001 - Ames, Iowa & Ankeny, Iowa
ACKNOWLEDGEMENTS

V
LIST OF FIGURES
Chapter 2
Figure 1. General diagram of sampling transect relative to adventitious pollen source.
Figure 2. Schematic of the ear collection pattern at each of the five sampling locations along the field transect.
Figure 3. Average outcross levels observed at each field sampling location by year.
Figure 4. Distribution of out-cross percentages in 60, 94 and 164 seed com fields in 1998, 1999 and 2000, respectively at field mid-point locations.
Figure 5. Distribution of outcross percentages for composite of the four field margin (6, 31, 68,118 ft) sample locations during the three years of study.
Figure 6. Distribution of female:male parent planting patterns in the hybrid seed fields included in the analysis.
Chapter 3
Figure 1. The ISCST3 model is based on the assumption of Gaussian distribution.
Figure 2. Schematic diagram of pollen sticky trap placement surrounding isolated maize field during 2000, the initial year of this investigation.
Figure 3. Pollen was identified through unique fluorescence emission.
Figure 4a. Windroses describing winds for 4 location days during July 2000.
Figure 4b. Windroses describing winds for 5 location-days during July 2001.
Figure 5a. Differences between measured and model simulated pollen deposition for four location days during 2000 at Ames, Iowa.
Figure 5b. Differences between measured and model simulated pollen deposition for five location days during 2001 at Ames, Iowa and Ankeny, Iowa.
Figure 6. On the left is the windrose for July 21, 2000 for the Ames, Iowa field. Nearly the entire measured period, northwesterly winds were received between 1.5-3.0 m s" .On

vi
the right of the figure is depicted the measured ;pollen deposition for the same date and location.
Figure 7. Graphical representation of model output when July 21, 2000 wind speed was quadrupled to 6-12 m s"1.
Figure 8. Pollen shed density effects on the distance pollen travels.
Figure 9. Representation of model output when pollen shed density was increased 3X.

vii
LIST OF TABLES
CHAPTER 2
Table 1. Parameters considered for managing reproductive isolation and the range of values for each parameter observed in this study.
Table 2. Average outcross levels for each year of study.
Table 3. Main effect of isolation distance on out-crossing percentages.
Table 4. Main effect of pollen parent class on out-crossing at field margin and midpoint.
Table 5. Comparison of out-crossing percentages in fields having pollen parents characterized as 'Good,' 'Fair,' or 'Poor' pollen shedders.
Table 6. Level of out-crossing associated with orientation of adventitious pollen source to the North, South, East or West of the seed field.
Table 7. Impact of adventitious source field size on observed out-cross levels at the field margin and midpoint.
Table 8. Effect of seed field size on observed levels of out-crossing at field margins and midpoints.
CHAPTER 3
Table 1. Summary of nine location-days during 2000 and 2001.
Table 2. Pollen physical parameters input into ISCST3 model.
Table 3. Sources of PCRAMMET required variables.
Table 4a. Location-day measured pollen trap deposition and model simulations for 2000.
Table 4b. Location-day measured pollen trap deposition and model simulations for 2001.

viii
ABSTRACT
Genetically modified agricultural field crops have provided a new lens with which to
view transgenic plant engineering. Production of hybrid corn (Zea mays L) depends on cross-
pollination between male and female inbred parents. As such, reproductive isolation of seed
fields is required to ensure genetic purity of the hybrid progeny. Customer demand for
improved genetic purity prompted the seed industry to examine the level of genetic purity
resulting from current isolation practices. This project was a two-pronged approach: 1) A
three-year study was conducted to monitor purity of hybrid seed produced in 291 fields from
24 seed companies in North America; and 2) Evaluate a particulate model to determine
whether it could be used to run multiple different seed production scenarios involving
meteorological, positional and biological data to evaluate these dynamic elements on the
production of genetically pure seed maize. Industry practices that most consistently
contributed to high levels of genetic purity were i) use of 'Good' or 'Fair' pollen parents, ii)
isolation greater than 165 ft from all potential adventitious pollen sources, iii) and large
(>100 ac) seed field size. The modeling study produced evidence that models may be
especially valuable for evaluating multiple "what if' seed production scenarios involving
adventitious pollen movement. However, the ISCST3 model is effective estimating gross
extra-field pollen movement, but lacks the precision to quantify absolute extra-field pollen
quantities needed to accurately estimate seed field adventitious presence. The learnings from
this project advance what the seed maize industry knows regarding seed field isolation
practices and provides a solid base for further investigation applying models to assessing risk
of adventitious presence within seed production.

1
CHAPTER 1. GENERAL INTRODUCTION
INTRODUCTION
Genetically modified agricultural field crops have provided a new lens with which to
view transgenic plant engineering. There is increased interest from all stakeholders regarding
plant pollen travel and potential for adventitious presence. Whether it is in agricultural
production centers, specie centers of origin, seed production organizations or hobby
vegetable producers, all parties have expressed significant interest in improving their
understanding of how pollen travels through the environment and the potential for
adventitious presence.
This project was initiated specifically to examine the parameters that influence
adventitious presence in maize seed production. A great deal of current practice within the
maize seed production industry is based on relatively little research accomplished during the
1940s and 1950s (L-Russell, 1946; Jones and Newell, 1946; Bonnett, 1947; Jones and
Newell. 1948; Kiesselbach, 1949; Jones and Brooks, 1950; Weatherwax, 1955; Hutchcroft,
1958). What research didn't specifically reveal, successful seed producers during the ensuing
years have determined through practical experience (Ireland, et al.).
Genetically modified plants have intensified the spotlight on field crop production
with concerns of genetically modified pollen traveling into fields where it is not desired.
Current seed production isolation practices were designed over the last 50 + years to provide
customers with genetically pure seed. The reality of transgenic pollen requires that the seed
maize industry reexamine practices that have provided very well for their livelihood.

2
Practices that provided adequate protection from visually unappealing adventitious presence
will likely not provide the level of protection required for genetically modified traits.
This project examined the state of the hybrid maize seed industry and determine those
practices consistently associated with highly genetically pure seed as well as determine those
practices that while adopted by the industry, have little association with pure seed. Chapter 2
provides this review as well as recommendations from the industry-wide multi-year seed
production investigation for practices that consistently provide highly genetically pure seed
maize. Furthermore, within Chapter 3 maize pollen is examined as a particulate within the
environment and its extra-field travel is measured and modeled employing a pollution
particulate environmental model.
Cross-pollinated plants depend on pollen travel within the environment to set seed for
further reproductive cycles. As science modifies our environment and the plants within it,
other challenges are created that must be understood and solved. This project provided
understanding of practices associated with protection from adventitious pollen and provided
understanding how maize pollen travels through the environment and how models may be
used to assess adventitious presence risk within hybrid seed maize fields.
DISSERTATION ORGANIZATION
This dissertation is organized into four chapters with the first chapter introducing the
background of project initiation and the central two chapters each being a paper that has or
soon will be submitted for publishing in peer-reviewed journals. Additional detail is provided
in those chapters, respectively, where the final peer-reviewed paper was published or is to be

3
published. The final chapter provides general project conclusions as well as
recommendations for further research opportunity.
Each chapter provides introduction of content, background, materials and methods
used for investigation as well as a discussion of the project findings and the conclusions
arrived upon by the authors. Each chapter also provides literature references used within that
chapter.
REFERENCES
Bonnett, O.T. 1947. Development of the corn kernel. Growth and development of the corn
plant. Am. Seed Trade Assn. pp. 32-36.
Hutchcroft, C D. 1958. Contamination in seed fields of corn resulting from incomplete
detasseling. Agron. J. 50:267-271.
Ireland, D.S., D O. Wilson, Jr., M.E. Westgate, J.S.Burris, and M.J. Lauer. Managing
reproductive isolation in hybrid seed com production, (in review).
Jones, M.D. and J. S. Brooks. 1950. Effectiveness of distance and border rows in preventing
outcrossing in com. Oklahoma Agric. Exp. Stn. Tech. Bull. No. T-38.
Jones, M.D. and L.C. Newell. 1946. Pollination cycles and pollen dispersal in relation to
grass improvement. Nebraska Agric. Exp. Stn. Res. Bull. 148.
Jones, M.D. and L.C. Newell. 1948. Size, variability, and identification of grass pollen. J.
Am. Soc. Agron. 40:136-143.
Kiesselbach, T.A. 1949. The structure and reproduction of com. Nebraska Agric. Exp. Stn.
Res. Bull. 161:1-96.

4
L-Russell, H.G. 1946. Factors which determine the importance of contamination in corn.
Masters thesis. Iowa State College.

5
CHAPTER 2. MANAGING REPRODUCTIVE ISOLATION IN HYBRID SEED CORN PRODUCTION
A paper submitted to Crop Science
O.S. Ireland, D O. Wilson, Jr., M.E. Westgate, J.S.Burris, and M.J. Lauer
ABSTRACT
Production of hybrid corn (Zea mays L) depends on cross-pollination between male and
female inbred parents. As such, reproductive isolation of seed fields is required to ensure
genetic purity of the hybrid progeny. Customer demand for improved genetic purity
prompted the seed industry to examine the level of genetic purity resulting from current
isolation practices. We conducted a three-year study to monitor purity of hybrid seed
produced in 291 fields from 24 seed companies in North America. Each field included in the
study was near a commercial field shedding pollen synchronously with the seed parent: a
worse case scenario. Seed samples were collected at five locations from each field along
transects perpendicular to the nearest potential adventitious pollen source. Sub-samples of
seed were subjected to isozyme analysis and percentage of seeds resulting from an out-cross
event were recorded for each sampling location. Analysis of this extensive data set
confirmed that methods used to achieve reproductive isolation produce hybrid seed that is
>99% genetically pure in most cases. Industry practices that most consistently contributed to
high levels of genetic purity were i) use of 'Good' or 'Fair' pollen parents, ii) isolation

6
greater than 165 ft from all potential adventitious pollen sources, iii) and large (>100 ac) seed
field size. Orienting seed fields relative to prevailing wind direction did not reduce risk of
out-crossing. In fields where higher levels of out-crossing were detected, the percentage of
out-crossing generally decreased from the field margin to the field mid-point. These results
indicate that current practices used to isolate hybrid seed fields often achieve the goal of
producing genetically pure seed. But high levels of out-crossing can and do occur,
particularly at the field margins. Greater understanding of atmospheric pollen transport
coupled with more quantitative approaches to document pollen production and flowering
dynamics are needed to minimize this risk and achieve consistently high and predictable
levels of genetic purity in hybrid seed corn production.
BACKGROUND
Production of genetically-pure hybrid corn (Zea mays L.) seed depends on cross-
pollination between specific male and female inbred parents. It also depends on effective
reproductive isolation of the female inbred from adventitious sources of corn pollen. Current
isolation standards adopted by crop improvement organizations are intended to maintain an
acceptable level of genetic purity across various environments and production conditions
(Indiana Crop Improvement Association, 2002). Seed companies, however, often have their
own standards for isolation that differ from public guidelines. These isolation standards are
based mainly on practical experience and limited experimental investigation (Russell, 1946;
Jones and Newell, 1946; Bonnett, 1947; Jones and Brooks, 1950; Hutchcroft, 1958; Rogers
and Parkes, 1995; Indiana Crop Improvement Association, 2002)

7
Isolation standards typically include a minimum distance from all potential pollen
sources, and a recommended number of border rows of the inbred male parent for a given
isolation distance (Hutchcroft, 1958; Wych, 1988, Indiana Crop Improvement Association,
2002). Common regimes for yellow seed com production are (isolation/border rows) 165
ft/24 rows, 330 ft/12 rows, and 660 ft/6 rows (Russell, 1946; Wych, 1988; Indiana Crop
Improvement Association, 2002). Greater isolation distance decreases the potential for
adventitious pollen to enter the seed field, and additional border rows of male inbred parent
are thought to minimize out-crossing by the adventitious pollen.
Until recently, these isolation standards have not been scrutinized because genetic
purity of seed maize produced in the United States has met or exceeded international
standards for purity (Wych, 1988; Rogers and Parkes, 1995; Organization for Economic Co
operation and Development, 2000; Indiana Crop Improvement Association, 2002). Recent
concerns by U.S. international trade partners regarding transgenic seed in non-transgenic
seed stocks, however, have raised significant doubts whether isolation guidelines designed
for customer needs in the past are meeting current market demands (Rogers and Parkes,
1995). The European Community in particular is concerned about non-transgenic seed
containing low levels of transgenic contaminants (Rogers and Parkes, 1995; Organization for
Economic Cooperation and Development, 2000). Likewise, use of com to produce plant-
made pharmaceuticals (PMP) crops has been under intense scrutiny because of the potential
for cross-pollination by airborne com pollen. Requirements for reproductive isolation of
com fields producing PMPs is considerably more stringent than those for conventional
hybrid seed production (Animal and Plant Health Inspection Service. 2002; Stevens, 2002).

8
These developments underscore the need to examine the effectiveness of reproductive
isolation in hybrid seed fields.
Reproductive isolation as it is managed in hybrid seed production has two interrelated
components: biological isolation and physical isolation. Biological isolation includes
elements such as flowering time, density of pollen shed, absolute amount of pollen shed, and
the ratio of male rows to female rows. Inherent within biological isolation is competition for
female silks by both the desirable male pollen and adventitious pollen sources. Physical
isolation affects the capacity of pollen to arrive and enter the seed field. Factors include
distance between the seed field and adventitious pollen source, relative orientation of the
seed and source fields, seed field size, the size of the block employing the same pollinator,
and the size of the adventitious source field.
Number of border rows is thought to contribute to both physical and biological
isolation of the female inbred parent. Additional pollen parent plants at the seed field edge
are thought to affect adventitious pollen entry into the seed field (Wych, 1988). As such,
border rows of the pollen parent commonly are planted around hybrid seed fields in an
attempt to saturate the field margin with pollen, and provide protection from adventitious
pollen entry (Jones and Brooks, 1950; Indiana Crop Improvement Association, 2002). These
additional rows also separate the seed parent from the potential adventitious pollen sources.
Production of pure hybrid seed requires that the overwhelming proportion of pollen
reaching the plane of exposed silks on the seed parent comes from the male inbred. Greater
pollen production supplied by the male border rows should favor pollination by the desired
parent. Within most seed fields, however, only 20 to 25 percent of the plants are pollen
parents. Additionally, inbred pollen parents typically have relatively small tassels with that

9
produce much less pollen than their hybrid progeny (Kiesselbach, 1949; Wych, 1988; Rasse,
2000). Seed producers often attempt to compensate for this level of low pollen production by
decreasing female:male row ratios and/or increase male inbred plant density. There is a
general lack of published information, however, relating the capacity for pollen production
and resulting genetic purity in seed production.
There is considerable evidence that the spatial relationship between the potential
adventitious pollen source and the seed field is an important determinant of genetic purity
(Russell, 1946; Bateman, 1947a, b; Jones and Newell, 1948; Jones and Brooks, 1950;
Hutchcroft, 1958; Patemiani and Stort, 1974; Raynor et al., 1974; Garcia et al., 1998; Luna et
al., 2001). But information regarding maize pollen travel and environmental effects on pollen
dispersal and viability is limited (Roy et al., 1995; Garcia et al., 1998; Luna et al., 2001).
Jones and Newell (1946), for example, reported that higher levels of pollen were collected on
the lee side of their experimental fields than on the windward side. Raynor (1972) reported
difficulties analyzing maize pollen deposition at "greater distances" due to low counts.
Patemiani and Stort (1974) in a study of four source fields, reported that that pollen was
"well mixed in the air" and decreased in quantity as one moved from the source. Jones and
Newell (1946) reported that several isolated stalks of detasseled com were pollinated from a
maize source some 250 meters away. The size of the adventitious pollen source probably
contributes to the potential for out-crossing as well (Russell, 1946; Jones and Brooks, 1950;
Di-Giovanni and Kevan, 1991). Jones and Brooks (1950) suggested that the shape of the
seedfield in relation to the potential adventitious source might significantly affect the level of
out-crossing. To our knowledge, this information has not been applied in a systematic
fashion to assess the effectiveness of isolation practices for hybrid seed production.

10
Current guidelines for seed isolation dictate uniform isolation distance 360 degrees
surrounding the hybrid seed field (Indiana Crop Improvement Association, 2002). Little
regard is currently given to how seed fields and potential adventitious sources are spatially
arranged as long as the seed field meets minimum seed isolation standards in all directions.
The U.S. hybrid com industry's current reputation for producing seed of high genetic
purity relies on its capacity to isolate hybrid seed fields. "Transgene-free" products may
require <0.5% transgene content in seed for some markets, a standard that is increasingly
difficult to meet as commercial transgenic production continues to gain popularity.
Identifying factors of biological and physical isolation that will contribute to greater genetic
purity clearly is important to the U.S. hybrid com industry. Therefore, the objectives of this
study were: i) to evaluate the capacity of current industry isolation practices to produce
hybrid seed that meets higher levels of genetic purity, and ii) to identify practices that will
improve reproductive isolation in hybrid seed fields. Resolving the interactions among
variables that contribute to the biological and physical isolation of the hybrid seed field forms
the basis of our analysis. Because this study was conducted on actual seed production fields,
the results necessarily reflect the practical constraints on hybrid seed production - focus on
saleable seed, variation in local agronomic practice, control and cost of land area, and
uncontrollable sources of adventitious pollen. These variables limit the resolving power of
our analysis, but do provide direct relevance to the hybrid seed industry.

11
MATERIALS AND METHODS
Our study was based on a survey of genetic purity in select hybrid seed production
fields in the North America. The analysis of these data focuses on identifying aspects of
reproductive isolation most closely correlated with the successful production of genetically
pure seeds.
The data set contains seed field data from three years, 1998, 1999 and 2000. During
1998, only data from Pioneer Hi-Bred International, Inc. was collected. During the winter of
1998-1999, the rest of the industry was invited to join Pioneer in this study, using the same
field selection protocol. During 1999 and 2000 all major North American seed corn
companies participated. Thus, the 1999 and 2000 data have a much broader range of
practices within it than 1998 alone.
Field Selection
Participating seed production plants from all major hybrid seed com companies in
North America were asked to identify 20 hybrid production fields as candidate fields for this
study. Candidate fields were representative of normal seed production, but had at least one
commercial corn production field in the vicinity that was considered a potential source of
adventitious pollen. Flowering notes taken on each of these fields were the date of anthesis
(50% of plants shedding pollen) for the pollen parent, date of silking (50% plants with silks
visible) for the seed parent, as well as anthesis dates of potential adventitious pollen sources
within 660 ft of the seed field. In addition to flowering data, each location collected
information on the previous crop, pollen parent border row number, pollen parent plant
population, pollen to seed parent row ratio, pollen parent flowering classification (poor, fair

12
or good), spatial orientation of any potential adventitious source relative to the seed field,
size of the adventitious pollen source, size of the hybrid seed field, distance to the nearest
potential adventitious pollen source, and the size of the contiguous area using the same
pollen parent (commonly referred to as "block size").
Flowering notes were collected on at least 1020 candidate fields. Of these, 291 fields
from 24 seed companies in eight US states (Illinois, Indiana, Iowa, Michigan, Minnesota,
Nebraska, and South Dakota) and Ontario Canada were selected for further study because
they met two criteria: i) synchronous flowering between the inbred pollen and seed parents,
and ii) flowering date of the potential adventitious source coincided with that of the seed
field. The application of these criteria means that these fields represent a worse case scenario
for seed production. The entire set of fields included a broader range of flowering scenarios
than could have been included for analysis. Fields that had synchronous flowering of hybrid
parents with no adventitious presence, for example, likely produced extremely pure seed
(about 75% of the candidate fields that were considered for this study). Likewise, fields with
asynchrony between hybrid parents with an adventitious pollen source flowering
synchronously with the seed parent would produce impure, and non-representative seed.
These fields were excluded in favor of those with synchronous flowering of the hybrid
parents and the adventitious source because the latter were more likely to provide a true test
of isolation practices with moderate (and manageable) levels of out-crossing.
The physical relationship between a typical seed field and an adventitious pollen
source is shown in Figure 1. The selected fields had at least 50 percent of the seed field and
potential adventitious pollen source overlapping to the East, North, South, or West. No fields
with diagonal exposure (NE, SE, NW, SW) were selected. These selection criteria of
13
synchrony and field orientation were established to simplify analysis. Although this is not a
random sampling of all field orientations, it provided increased resolving power in the 'field
orientation' analysis since at least 50 fields were included in each cardinal direction.
Sample Collection
Seed samples were collected along transects into the seed field established
perpendicular from the edge of the seed field facing the adventitious pollen source (Figure 1).
Five samples were taken along this transect at 6, 31, 68, 118 and 660 ft into the field, as
measured from the inside row of the pollen parent border (i.e. field border area was not
included). A subset of 27 fields was sampled along more than one transect, each representing
a separate adventitious pollen source facing the same seed field. Twenty-six seed fields had
dual sources while one field had three potential adventitious sources present. Considering
these fields with multiple adventitious sources, there were 318 sampling transects analyzed
within this data set. Each transect was considered as independent in the statistical analysis.
At each sampling location, 20 ears were collected from the center two female rows
according to the pattern shown in Figure 2. A primary ear was selected at random near the
transect, then every tenth primary ear was collected along the row for a total of ten ears
within that row. Collection continued in the same manner from the adjacent row to provide a
total of 20 ears for the location sample. These 20 ears were dried, shelled, and pooled to
produce the source of kernels for genetic analysis. Kernels were sized to pass between 26/64
and 16/64 mesh screens to approximate seeds suitable for commercial purposes (Wych,
1988).

14
Predictor Variables
Table 1 lists the potential predictors of genetic purity considered in this study. DIRECTION
describes the orientation of the seed field in relation to the potential adventitious pollen
source. SAMPLE LOCATION is the position along the transect from which a sample was
collected. The POLLEN PARENT CLASS is a description of the relative efficacy of the
parent. All companies in this study routinely classify pollen parents as 'Poor,' 'Fair' or
'Good.' This classification was provided by the seed companies based on their assessment of
absolute pollen production, pollen shed dynamics, or yield performance in seed production
fields. This study did not attempt to distinguish between these criteria. ISOLATION
DISTANCE is the physical separation between adjacent edges of the seed field and the
potential adventitious pollen source. SEED FIELD SIZE is the area of the hybrid seed field
containing the seed and pollen parents. BORDER ROWS is the number of pollen parent rows
that surround the seed field. SOURCE SIZE is the area of the potential adventitious source
field. The number of pollen parents per acre is reported as the POLLEN PARENT
POPULATION. SEED FIELD BLOCK SIZE is the number of contiguous acres containing
the same pollen parent, regardless of seed parent. The seed field block size was usually the
size of the single seed field, but in some cases encompassed several fields. The
FEMALE/MALE ratio is the percentage of the field area allocated to the female seed parent.
For example, a field planted in a 4:1 female/male row ratio allocates 80% of the field area to
the seed parent.
Although data for many of these predictors were collected as continuous variables,
much of the analysis was conducted on classes generated from these data. In some cases, this
was done because limited number of fields precluded meaningful analysis. In most cases,

15
however, creating classes simplified data presentation without sacrificing the ability to
determine the significance of a response variable in determining the observed level of out
crossing. Typically, the median value for the predictor variable was used as a boundary
between classes.
Genetic Purity Testing
One hundred seeds from each pooled sample were subjected individually to isozyme
analysis by starch gel electrophoresis (Stuber, et al., 1988). This analysis was performed at
each seed company's quality assurance lab. If a participating company did not possess an
electrophoresis lab, private labs were employed for this purpose. Seeds showing two or more
unexpected alleles were considered out-crosses in accordance with standard commercial
practice (Smith and Register, 1998). Data were reported as the percentage of out-crossed
seeds in each 100-seed sub-sample.
Data Analysis
Initial analysis revealed the data were heavily skewed to zero percent out-crossing
and there were few samples with high levels of out-crossing. As such, treating the percent
out-crossing as a continuous dependent variable or transforming the data by conventional
approaches such as arcsin transformation was not appropriate. Instead, each seed was
regarded as a Bernoulli trial and logistic regression was performed using SAS PROC
GENMOD (SAS Institute, Cary, NC, version 8.1). PROC GENMOD performs generalized
linear modeling by maximum-likelihood estimation, and is an extension of conventional
general linear modeling (e.g. PROC GLM) to non-Gaussian distributions (McCullagh and
Nelder, 1989).

These analyses revealed that the out-crossing responses to class variables were not
always independent. Therefore, an a priori covariance structure was established to coincide
with the design of the survey. Generalized estimating equations (GEE) were used to account
for correlation among observations from the same transect (Liang and Zeger, 1986). The
covariance structure was specified in PROC GENMOD using the REPEATED statement,
making the transect the subject or "cluster" in the GEE analysis.
In preliminary analyses, significant over-dispersion was detected. In other words, the
variance at a given response probability (out-crossing percentage) was greater than that
predicted by the binomial distribution. In subsequent analyses, the DSCALE option in
PROC GENMOD was used and the scale parameter estimated by the square root of the
deviance divided by the degrees of freedom. The scale parameter ranged from 1.3 to 1.9.
Because significant co-linearity occurred among the predictor variables, standard
null-hypothesis tests were potentially unreliable as a means to distinguish class variables.
Therefore, analyses were designed to estimate upper and lower confidence limits about the
mean out-crossing values for each class variable. Confidence limits were obtained as logit
scores from PROC GENMOD and transformed to percentages. The data presentation relies
on these confidence limits to distinguish significant differences between isolation variables.
RESULTS AND DISCUSSION
Out-crossing at Field-Margins and Mid-Point
Data were initially summarized as mean levels of out-crossing at the five sampling
positions across all locations sampled each year. The level of out-crossing was greatest at the
field margin and declined to its lowest level at the end of the field transect 660 ft into the

17
field (hereafter referred to as the field mid-point) (Figure 3). There was a significant
difference in out-crossing between the first four sampling positions (hereafter referred to as
the field margin) and the field mid-point sample (Table 2). The entire 3-year data set is
included in Appendix A.
The mean value of out-crossing for sampling positions 6, 31, 68, and 118 ft from the
border was greater than that at the field mid-point position in 80 % of the cases. Since the
field margin samples typically contained higher levels of out-crossing than those at the field
mid-point, analysis of isolation factors was simplified by pooling the four field margin
samples into a single field margin value for comparison with field mid-point values.
Figure 4 illustrates the distribution of out-crossing percentages for samples collected
at field mid-points over the course of this study. Out-crossed kernels were detected in about
half of the field mid-point samples. In two-thirds of these cases, the percentage of out
crossing was 2% or less. In a few fields, however, in excess of 10% of the kernels resulted
from an out-cross event (Figure 4).
Not only was the level of out-crossing greater at the field margin, but the proportion
of samples collected at the field margin contained out-crossed kernels was also greater
(Figure 5). There were no out-crossed kernels detected in about 25% of field margin samples.
But over 40% of the field margin samples exhibited out-cross levels of 2% or greater. The
closer proximity of the field margin to the adventitious pollen source presumably contributed
to the greater amount of out-crossing (see section on Isolation Distance below). These data
indicate that the seed field margin (or that portion of the field within 118 ft of the margin)
may need be segregated from the mid-field seed in some cases to meet the proposed
European guidelines of <1% transgenic material present within transgene-free seed stocks.

Currently, the decision whether to segregate all or a portion of seed fields must be delayed
until the genetic purity of mature seeds can be assessed — as was done in this study. The
capability to predict risk of out-crossing based on flowering characteristics of the inbreds and
potential adventitious pollen source would enable this decision to be made soon after
pollination. Modeling approaches are being used to develop this capability (Aston et al.
2000; Fonseca et al, 2002; Westgate et al. 2003; Lizaso et al. 2003).
Year Effects
The mean levels of out-crossing for field margin and mid-point samples were
significantly less in 1998 than in 1999 and 2000 (Table 2). Mean outcross levels at the field
margins and mid-points were nearly identical in 1999 and 2000. Growing conditions were
nearly ideal in 1998, which may have contributed to the lower level of out-crossing.
Variability across locations was greatest in 1999, a year of widespread drought and high
temperatures.
Physical and biological factors contributing to reproductive isolation
Isolation Distance
Maize pollen is relatively heavy for an airborne particle, so the vast majority of pollen
shed from anthers falls out of the air within a short distance of the source field (Raynor,
1972; Pleasants et al., 2001; Aylor 2002; Jarosz et al., 2003; Westgate et al. 2003). As such,
it is logical to expect that increasing isolation distance would decrease the potential for
adventitious pollen movement into a nearby seed field. With this in mind, our analysis of
isolation distance between the potential adventitious source and the seed field was simplified
by dividing fields into two classes; less than 211.5 ft and greater than 211.5 ft from the

nearest pollen source. The distance of 211.5 ft was the median value for isolation distances
between the potential adventitious sources and the 291 seed fields in this study.
Averaged across pollen parent classes and years, seed fields isolated by 211 ft or
more had less out-crossing at the field margins. Isolation distance apparently had little
impact on the average level of out-crossing at field midpoints (Table 3). Consistent with the
yearly averages (Table 2), out-crossing at the field margin was greater than that at the field
midpoint for both isolation distance classes.
Pollen Parent Class
We divided the seed fields into three classes based on seed company classification of
the pollen parent as Good, Fair, or Poor. We did not analyze how the seed companies
assigned a male inbred into one of these classes. But the classification typically involves
several practical considerations including total pollen production, pollen shed duration, and
silk coverage.
Male parent class had a significant effect on the level of out-crossing (Table 4).
Analysis of over 300 field transects confirmed that seed fields with Poor pollen parents
consistently had higher levels of out-crossing than those with male parents classified as Fair
or Good. Fields with Poor pollen parents also showed greater variability in outcross values
than did the other two male parent classes. Out-crossing at the field margins was consistently
greater than at the field midpoint for the Good and Fair male pollen classes.
Isolation distance affected the level of out-crossing observed at the field margin and
field midpoint for each pollen parent class (Table 5). Typically, lower out-crossing values
were observed within each class for fields isolated by more than 211 ft. Exceptions were the

20
at the field margin for the Poor pollen parent, and the field midpoint for the Fair pollen
parent.
As might be expected, fields with Poor pollen parents isolated by less than 211 ft had
the highest level of out-crossing on average, while fields with Good pollen parents isolated
by more than 211 ft had the highest genetic purity. It is noteworthy, however, that there was
no significant difference in out-crossing at the field margin among the Good, Fair, or Poor
pollen classes for fields isolated by less than 211 ft. Field margin out-crossing decreased
only slightly for Poor pollen parents when greater isolation distance was used, but midpoint
outcrossing decreased significantly. These data indicate that distance and pollen parent class
interact to 'isolate' the seed field from the impact of an adventitious pollen source. With
sufficient pollen production, most of the seed field was effectively isolated; increasing
isolation distance provided greater protection at the field margins. At low levels of pollen
production, greater isolation distance decreased out-crossing within the field, but increasing
the distance from an adventitious source provided little additional protection at the field
margin.
Border Rows
Border rows of the male inbred parent around the edges of a seed field are thought to
provide several benefits for seed production (Wych, 1988). They can provide excess pollen
at the field edges, act as a physical windbreak to remove adventitious pollen from the air
entering the seed field, and add additional isolation distance from the adventitious pollen
source (L-Russell, 1946; Bonnett, 1947; Jones and Brooks, 1950; Weatherwax, 1955;
Hutchcroft, 1958 Raynor et al., 1972;).

21
Conventional practice within the seed industry is to increase the number of border
rows if there is risk of increased adventitious pollen entry due to smaller isolation distance
(Jones and Brooks, 1950; Newlin, 1971; Wych, 1988; Roy et al. 1995). In addition to
outcross percentage, Table 5 contains the mean number of border rows for each combination
of male class and isolation distance. In our data set, 175 fields with isolation greater than
211 ft had an average of 8.0 border rows, whereas 143 fields with isolation less than 211 ft
had an average of 15.6 border rows (Table 3).
Increasing the number of pollen parent border rows surrounding the seed field
appeared to have no effect on the level of out-crossing at the field margins or at midpoint
positions. These data suggest that border rows cannot compensate for the increased risk
associated with shorter isolation distances and lower pollen production. Because of the
correlation between distance and border row number within the data set, no definitive
conclusion can be reached regarding the effect of border rows, except that this is a weak
management option for isolating a seed field compared to isolation distance.
Spatial Orientation
Outcross levels at the field margin varied with the orientation of the adventitious
pollen source relative to the seed field (Table 6). The 3-year mean for out-cross levels at the
field margin was significantly greater when the potential adventitious source was oriented to
the West. There was no evidence, however, to suggest that orientation of the adventitious
source relative to the seed field determined the level of outcrossing at the field midpoint.
This result is not surprising since wind speed and direction during pollination could bear little
resemblance to the prevailing winds for a given location. As such, orienting seed fields to
avoid a potential adventitious pollen source in the direction of the 'prevailing winds' would

22
not necessarily ensure a high level of genetic purity. Since field orientation only affected
out-cross levels at the field margin, decisions about spatial location of seed fields should first
consider pollen parent class and the isolation distance, both of which had much larger
impacts on out-crossing at this field position (Tables 4 and 5).
Field Size: Adventitious Pollen Source and Seed Field
Presumably, the size of the adventitious pollen source can affect the extent of out
crossing by altering the intensity and duration of pollen exposure. However, we did not
detect a significant effect of the size class for the adventitious pollen source on observed
outcross levels at either the field margin or midpoint (Table 7). The strength of this
conclusion is limited, however, for several reasons. We only compared two field size
classes: above and below the median field size (80 ac.) in the study. There were very few
small fields to consider; only 7 % of the fields were 35 acres or less in size. And, we
intentionally selected fields that had good synchrony between the male and female inbred
parents. In this case, it is less likely that variation in the duration and intensity of
adventitious pollen production (as determined by field size) would impact pollination of
exposed silks by the desired male pollen.
Seed field size, on the other hand, had a significant effect on the level of out-crossing
(Table 8). In seed fields larger than 106 ac., the average level of out-crossing at the midpoint
sampling positions was less than 0.9%. Fields smaller than 106 ac. had significantly greater
out-crossing values on average at the field margin than did fields larger than 106 ac. Out
crossing at the field midpoint also was about 0.5% higher. The impact of seed field size
varied with isolation distance. In seed fields smaller than 106 ac, the level of out-crossing at
the field mid-point increased with shorter isolation distance, and out-crossing was

23
significantly greater at the field margin when these fields were isolated by less than 211 ft.
(Table 8). These data indicate that larger seed fields have a greater probability of producing
seed of adequate purity to meet European import standards.
Other Management Factors
Male population density typically varies with male parent class. In the current study,
the highest plant populations were generally in fields using pollen parents with Poor
pollination characteristics. Our analysis, however, indicated that the population of the pollen
parent did not affect the level of out-crossing (data not shown). Nor did the pollen parent to
seed parent row ratio (Male:Female) effect the level of out-crossing observed in this study
(data not shown). This result probably reflects the narrow range of Male:Female row ratios
included in the 291 fields evaluated. Sixty-two percent of the fields within this study used
Male:Female ratios of 1:4, and approximately 32 % of the fields used 6:1:4:1 ratios (Fig. 6).
Other ratios were used in a few fields.
CONCLUSIONS
Current isolation practices have provided the North American seed corn industry a
strong foundation for producing genetically pure seeds. The introduction of transgenic traits,
however, has placed greater constraints on seed purity levels than at any time in history. We
need to understand effective management practices to deliver the higher level of purity
demanded by some markets.
Results from over 291 seed corn fields sampled during 1998-2000 indicate that
current isolation practices produce hybrid seed that often exceeds 99% genetic purity, even
when a potential contaminant is nearby. The following practices significantly improve the

24
probability of achieving this high level of purity: i) employing fair and good male pollinators,
ii) maintaining isolation distances greater than 165 ft, iii) segregate the outer edge of the seed
field when necessary, and iv) utilize seed fields greater than 100 ac in size.
Poor class pollen parents were associated with higher levels of outcrossing. Practices
that decreased out-crossing despite the poor classification were the same; i) increasing
isolation distance beyond 165 ft, ii) segregation of seed harvested from field edges from
more highly pure central portions of the seed field, and iii) utilizing larger seed fields.
These data reinforced the significance of isolation distance. No other single
management factor was more influential in assuring production of pure seed. The greater the
isolation distance between the seed field and the potential adventitious source, the greater the
probability of the seed meeting the standard of > 99% genetic purity. For simplicity of
analysis and presentation, fields were pooled into two distance classes: closer than or further
than 211 ft. from the nearest adventitious pollen source. This was the median distance for all
fields included for analysis, and as such, is an arbitrary value unique to this data set. It does
not represent a new standard for minimum isolation distance for the seed industry. There
was no evidence that doubling the number of border rows around the seed field compensated
for decreased isolation distance. This result does not support the commonly used practice of
doubling the number of pollen parent border rows when isolation distances are halved.
Segregating the exposed edge of seed fields could be expected to increase seed purity levels.
Potential application of this knowledge in seed production might occur in the
following way. Ten days prior to harvest, seed fields are sampled along a transect as
employed with this study. Kernel samples would be milled and subjected to PGR testing for
evidence of transgenic pollination. The results could be used along with field inspection

25
reports to assess the adventitious presence in the exposed perimeter compared to the field
interior. Allowing the pre-harvest field quality samples to drive the decision making process
of whether to segregate the field edge(s) from the interior could improve seed dryer and bulk
storage bin allocation and lead to seed lots of consistently high genetic purity.
Using fewer and larger fields has a number of risks and benefits. Conventional
wisdom suggests that fewer fields increase the risk of calamity due to hail, erratic rains,
severe wind, etc. Spreading production risk to reduce the threat of catastrophic loss has been
the norm. The results of this study, however, indicate that reducing field size beyond a
certain level increases the potential for out-crossing. The widespread use of irrigation in seed
corn production reduces weather related risks. While increasing seed field size might serve to
increase genetic purity, it will concentrate seed production in fewer fields, leading to greater
production risk should calamity strike. This study shows that genetic purity can be managed
by manipulating various factors under control of production managers. The full value of
manipulating these factors is yet to be determined.
ACKNOWLEDGEMENTS
The authors are especially grateful to Pioneer - A Dupont Company and their cooperating seed plant personnel for three years of seed field data collection. Special thanks to Dave Shoultz and to Dave Langer for initiating and supporting this project. Thanks is extended to the American Association of Seed Certifying Agencies, American Seed Trade Association and the U.S. EPA for their support and funding of the Inter-Industry portion of this study. Thanks to the following companies for two years of seed field data collection: Burrus Brothers & Associated Growers, Cargill Inc., Curry Seed Co. Inc., Dairyland Seed Co., Inc., Fontanelle Hybrids, Garst Seed Co., Inc., Golden Harvest, J.C. Robinson, Inc., Great Lakes Hybrids, Inc., Kaltenberg Seed Farms, LG Seeds, Monsanto Seed Co., Inc., Mycogen Seeds, Inc., Syngenta Seeds, Inc. and Wyffels Hybrids, Inc. Special recognition is also due Dave Shoultz for his suggestion and support of this inter-industry project from its inception. Additionally, we would be remiss not to thank the following project team members who provided guidance and supported these efforts: Ace Catlett, Gary Lawrance, Dan Smith,

26
Jerry Tank, Bob Wych and Bob York... Thank-you also to Greg Mangold and the Beal Seed Testing laboratory at Pioneer Hi-Bred International, Inc. for their significant contribution in electrophoresis testing. And finally, thank-you to Kerry Mounsey, Scott Koenigsfeld and Kent Mowrer for their support and assistance throughout this endeavor.
REFERENCES
Animal and Plant Health Inspection Service. 2002. APHIS permits for corn plants that
produce pharmaceuticals. Available at
http://www.aphis.usda.gov/ppq/biotech/pdf/pharm-2002.pdf (verified 22 March
2003).
Aylor, D. E. 2002. Settling speed of corn (Zea mays) pollen. J. Aerosol Science 33:1599-
1605.
Aylor, D.E., N.P. Schultes, E.J. Shields. 2003. An aerobiological framework for assessing
cross-pollination in maize. Agric. For. Meteor. 119: 111-129.
Bateman A.J. 1947a. Contamination of seed crops II. Wind pollination. Heredity 1:235-246.
Bateman A.J. 1947b. Contamination in seed crops III. Relation of isolation distance.
Heredity 1:303-336.
Bassetti, P. and Westgate, M.E. 1994. Floral asynchrony and kernel set in maize quantified
by image analysis. Agron. J. 86:699-703.
Bonnett, O.T. 1947. Development of the com kernel. Growth and development of the com
plant. Am. Seed Trade Assn. pp. 32-36.
Di-Giovanni, F. and P.G. Kevan. 1991. Factors affecting pollen dynamics and its importance
to pollen contamination: a review. Can. J. For. Res. 21:1155-1170.

27
Di-Giovanni, F., P.G. Kevan, and M.E. Nasr. 1995. The variability in settling velocities of
some pollen and spores. Grana 34:39-44.
Fonseca, A., M.E. Westgate, and R.T. Doyle. 2002. Application of fluorescence microscopy
and image analysis for quantifying dynamics of maize pollen shed. Crop Sci.
42:2201-2206.
Garcia, C., M., J. Figueroa, M., R. Gomez L., R. Townsend, and J. Schoper. 1998. Pollen
control during transgenic hybrid maize development in Mexico. Crop Sci. 38:1597-
1602.
Goss, J. A. 1968. Development, physiology, and biochemistry of corn and wheat pollen. Bot.
Rev. 34:333-358.
Hutchcroft, C.O. 1958. Contamination in seed fields of corn resulting from incomplete
detasseling. Agron. J. 50:267-271.
Indiana Crop Improvement Association. 2002. ICIA Standards Handbook. Lafayette,
Indiana.
Jarosz, N., B. Loubet, B. Durand, A. McCartney, X. Foueillassar, and L. Huber. 2003. Field
measurement of airborne concentration and deposition rate of maize pollen. Agric.
For. Meteor. 119: 37-51.
Jones, M.D. and J. S. Brooks. 1950. Effectiveness of distance and border rows in preventing
outcrossing in com. Oklahoma Agric. Exp. Stn. Tech. Bull. No. T-38.
Jones, M.D. and L.C. Newell. 1946. Pollination cycles and pollen dispersal in relation to
grass improvement. Nebraska Agric. Exp. Stn. Res. Bull. 148.
Jones, M.D. and L.C. Newell. 1948. Size, variability, and identification of grass pollen. J.
Am. Soc. Agron. 40:136-143.

28
Kiesselbach, T. A. 1949. The structure and reproduction of corn. Nebraska Agric. Exp. Stn.
Res. Bull. 161:1-96.
L-Russell, H.G. 1946. Factors which determine the importance of contamination in corn.
Masters thesis. Iowa State College.
Liang, K.Y., and Zeger, S.L. 1986. Longitudinal data analysis using generalized linear
models. Biometrika 73:13-22.
Lizaso, J.I., M.E. Westgate, W.D. Batchelor, and A.E. Fonseca. 2003. Predicting Potential
Kernel Set in Maize From Simple Flowering Characteristics. Crop Sci. 43:892-903.
Luna, V., S., J. Figueroa, M., B. Baltazar M., R. Gomez L., R. Townsend, and J.B. Schoper.
2001. Maize pollen longevity and distance isolation requirements for effective pollen
control. Crop Sci. 41:1551-1557.
McCullagh, P., and Nelder, J.A. 1989. Generalized Linear Models, New York. Chapman and
Hall.
Newlin, O.J. 1971. Need and opportunity for better pollen control techniques in com and
sorghum seed production. 26th Hybrid Com Industry-Research Conference.
Organization for Economic Co-operation and Development. 2000. OECD minimum
requirements for the production of basic and certified seed under the OECD maize
and sorghum seed scheme. Available at
http://www.oecd.org/agr/code/seeds/seeds 1.htm (verified 22 March 2003).
Paterniani, E. and A.C. Stort. 1974. Effective maize pollen dispersal in the field. Euphytica
23:129-134.

Pleasants, J.M., R.L. Hellmich, G.P. Dively. M.K. Sears, D.E. Stanley-Horn, H.R. Mattila,
J.E. Foster, P. Clark, and G.D. Jones. 2001. Corn pollen deposition on milkweeds in
and near cornfields. Proc. Natl. Acad. Sci. 98: 11919-11924.
Rasse, D.P., J.T. Ritchie, W.W. Wilhelm, J. Wei and B.C. Martin. 2000. Simulating inbred-
maize yields with CERES maize. Agron. J. 92:672-678.
Raynor, G.S., E.C. Ogden and J.V. Hayes. 1972. Dispersion and deposition of com pollen
from experimental sources. Agronomy J. 64:420-427.
Rogers, H.J. and H.C. Parkes. 1995. Transgenic plants and the environment. J. Exp. Bot.
46:467-488.
Roy, S.K., S.M.L. Rahaman, and A.B.M. Salahuddin. 1995. Pollination control in relation to
seed yield and effect of temperature on pollen viability of maize (Zea mays). Indian J.
Agric. Sci. 65:785-788.
Smith, J.S.C. and Register, J.C. 1998. Genetic purity and testing technologies for seed
quality: a company perspective. Seed Science Research, 8:285-293.
Stevens, Gene. 2002. Implications of pollen research to APHIS pharmaceutical com
regulations. Available at http://www.isb.vt.edu/news/2002/artspdf/sep0203.pdf
(verified 22 March 2003).
S tuber, C.S., Wendel, J.F., Goodman, M.M., and Smith, J.S.C. 1988. Techniques and scoring
procedures for starch gel electrophoresis of enzymes from Maize (Zea mays L.).
Technical Bulletin 286. Raleigh, North Carolina, North Carolina Agricultural
Research Service, North Carolina State University.
Weatherwax, P. 1955. Structure and development of reproductive organs. Com and com
improvement. Academic Press, New York.

Westgate, M.E., J. Lizaso, and W.D. Batchelor. 2003. Quantitative relationships between
pollen shed density and grain yield in maize {Zea mays L.). Crop Sci. 43:934-942.
Wych. R.D. 1988. Production of hybrid seed corn. pp. 565-607. In G.G. Sprague and J.W.
Dudley (ed.) Corn and corn improvement. Agron. Monogr. 18, 3rd ed. ASA, CSSA,
and SSSA, Madison, WI.

31
List of Figures
Figure 1. General diagram of sampling transect relative to adventitious pollen source. Seed
fields selected for this study were adjacent to an adventitious pollen source that
overlapped at least 50 % of the seed field to the North, East, South or West.
Sampling transects were located on the side of the field adjacent to the adventitious
pollen source. Ears were collected along a linear sampling transect at 6, 31, 68, 118
and 660 ft from the border rows at the edge of the seed field.
Figure 2. Schematic of the ear collection pattern at each of the five sampling locations along
the field transect. A total of 20 ears were pooled from the center two seed (female
inbred) rows at each location sample along the transect. The example is for a 4:1
(female :male) planting pattern.
Figure 3. Average outcross levels observed at each field sampling location by year. Data are
the mean for 60, 94, and 164 samples in 1998, 1999, and 2000, respectively. Note the
near-logarithmic scale of x-axis.
Figure 4. Distribution of out-cross percentages in 60, 94 and 164 seed corn field in 1998,
1999 and 2000, respectively at field mid-point locations. Seventy to eighty percent of
the locations had 1% outcrossing or less.
Figure 5. Distribution of outcross percentages for composite of the four field margin (6, 31,
68, 118 ft) sample locations during the three years of study. More than half of the
field-margin samples collected showed 1% or less out-crossing.
Figure 6. Distribution of female:male parent planting patterns in the hybrid seed fields
included in the analysis. Parent ratios of four female rows to one male row (4:1)

32
and/or six female rows to one male row (6:1 or 6:1:4:1) comprised over 90% of the
fields examined.

33
Table 1. Parameters considered for managing reproductive isolation and the range of values
for each parameter observed in this study.
Parameter Range of Values Year Orientation of adventitious pollen
source relative to seed field Field sample location Pollen parent classification Isolation distance Seed field size Number of border rows Size of adventitious pollen source field Plant population density for pollen parent Seed field block size Ratio of seed parent/pollen parent
1998,1999, 2000 North, East, South, West
Margin, Mid-point Poor, Fair, Good
0 - 600 ft 16 - 615 ac 0-30 rows 10 - 320 ac
10 - 49 k plants/ac 20- 1900 ac
83% - 57% female
Table 2. Average outcross levels for each year of study. Field margin values are pooled for
the four samples collected within 118 ft. of the border rows (see Fig. 1). Data are the mean
outcross percentages for the indicated number of fields.
Margin Mid-point Year N Lower Upper Lower Upper
fields C.I..* Outcross C.I.. C.I.. Outcross C.I.. 90% (%) 90% 90% (%) 90%
1998 60 0.78 0.98 1.18 0.51 0.73 0.96 1999 94 1.65 2.05 2.46 0.79 1.12 1.45 2000 164 1.81 2.12 2.44 1.04 1.31 1.57
•The confidence interval abbreviation is C.I.

34
Table 3. Main effect of isolation distance on out-crossing percentages. Fields isolated by 211
ft or less from the nearest adventitious pollen source were analyzed separately from those
isolated by 211 or more. This value was the median isolation distance for all fields in
the study. Field margin values were pooled for the four samples collected within 118 ft.
of the border rows (see Fig. 1). Mid-point samples were collected 660 ft from the border
rows at the field edge. Data are the mean outcross percentages for the indicated number
of fields.
Margin Mid-point Isolation N Lower Upper Lower Upper Avg. Distance fields C.I..* Outcross C.I.. C.I.. Outcross C.I.. no.
(ft) 90% (%) 90% 90% (%) 90% border rows
>211 175 1.34 1.58 1.87 0.72 1.02 1.48 8.0 <211 143 1.86 2.17 2.54 0.88 1.12 1.73 15.6
•The confidence interval abbreviation is C.I.
Table 4. Main effect of pollen parent class on out-crossing at field margin and midpoint.
Field margin values were pooled for the four samples collected within 118 ft. of the
border rows (see Fig. 1). Mid-point samples were collected 660 ft from the border
rows at the field edge. Data are the mean outcross percentages for the indicated
number of fields.
Margin Midpoint Lower Upper Lower Upper
Parental N C.I..* Outcross C.I.. C.I.. Outcross C.I.. Class field
s 90% (%) 90% 90% (%) 90%
Good 116 1.54 1.72 1.92 0.77 0.97 1.22 Fan- 150 1.67 1.84 2.03 0.85 1.03 1.26 Poor 52 1.97 2.32 2.73 1.24 1.77 2.52
•The confidence interval abbreviation is C.I.

35
Table 5. Comparison of out-crossing percentages in fields having pollen parents
characterized as 'Good,' 'Fair,' or 'Poor' pollen shedders. Fields isolated by 211 ft or
less from the nearest adventitious pollen source were analyzed separately. This value
was the median isolation distance for all fields in the study. Field margin values were
pooled for the four samples collected within 118 ft. of the border rows (see Fig. 1). Mid
point samples were collected 660 ft from the border rows at the field edge. Data are the
mean outcross percentages for the indicated number of fields.
Margin Mid-point Isolation Lower Upper Lower Upper
Male Distance N C.I..* Outcross C.I.. C.I.. Outcross C.I.. Border Class (ft) fields 90% (%) 90% 90% (%) 90% rows
Good >211 67 1.09 1.31 1.58 0.56 0.84 1.27 7.4 Good <211 49 1.86 2.13 2.43 0.86 1.12 1.46 16.3 Fair >211 73 1.30 1.49 1.72 0.79 1.07 1.44 9.0 Fair <211 77 1.89 2.15 2.44 0.78 1.00 1.30 15.6 Poor >211 35 1.88 2.27 2.74 0.91 1.35 2.00 7.0 Poor <211 17 1.79 2.41 3.25 1.44 2.53 4.41 13.4 *The confidence interval abbreviation is C.I.

36
Table 6. Level of out-crossing associated with orientation of adventitious pollen source to the
North, South, East or West of the seed field. Field margin values were pooled for the
four samples collected within 118 ft. of the border rows (see Fig. 1). Mid-point
samples were collected 660 ft in from the field edge. Data are the mean outcross
percentages for the indicated number of fields.
Margin Midpoint Lower Upper Lower Upper
N C.I..* Outcross C.I.. C.I.. Outcross C.I.. Orientation fields 90% (%) 90% 90% (%) 90%
North 52 1.53 1.80 2.11 0.76 1.00 1.33 South 85 1.61 1.84 2.09 0.90 1.17 1.51 East 77 1.42 1.64 1.90 0.90 1.21 1.62 West 91 1.88 2.10 2.35 0.83 1.10 1.45
*The confidence interval abbreviation is C.I.

37
Table 7. Impact of adventitious source field size on observed out-cross levels at the field
margin and midpoint. Eighty acres was the median size of the fields included in this
study. Field margin values were pooled for the four samples collected within 118 ft. of
the border rows (see Fig. 1). Mid-point samples were collected 660 ft from the border
rows at the field edge. Data are the mean outcross percentages for the indicated number
of fields.
Margin Mid-point Pollen N Lower Upper N Lower Upper source fields C.I..* Outcross C.I.. fields C.I.. Outcross C.I..
size (ac) 90% (%) 90% 90% (%) 90%
<80 157 1.74 2.05 2.36 176 0.90 1.13 1.36 >80 140 1.54 1.85 2.16 139 0.89 1.16 1.43
*The confidence interval abbreviation is C.I.

38
Table 8. Effect of seed field size on observed levels of out-crossing at field margins and mid
points. Seed fields larger than 106 ac (median field size) were analyzed separately.
Within each field size class, those isolated by 211 ft or less (median isolation distance)
also were analyzed separately. Field margin values were pooled for the four samples
collected within 118 ft. of the border rows (see Fig. 1). Mid-point samples were collected
660 ft from the border rows at the field edge. Data are the mean outcross percentages for
the indicated number of fields.
Margin Mid-point Field Isolation Lower Upper Lower Upper size Distance N C.I..* Outcross C.I.. C.I.. 90 Outcross C.I.. Border (ac) (ft) fields 90% (%) 90% % (%) 90% rows
< 106 >211 157 1.20 1.37 1.57 0.67 0.87 1.13 < 106 <211 161 2.00 2.26 2.56 1.02 1.33 1.77
> 106 >211 74 1.06 1.23 1.43 0.65 0.84 1.10 7.8 >106 <211 83 1.32 1.49 1.69 0.69 0.89 1.15 16.0 < 106 >211 101 1.61 1.83 2.08 0.89 1.17 1.57 8.1 <106 <211 60 2.66 3.00 3.37 1.23 1.61 2.11 15.3 The confidence interval abbreviation is C.I.

39
Adventitious Pollen Source
î 50%
overlap
1
Hybrid Seed Field
31' 118' S' 68' 660'
Sampling Transect
S3
Figure 1. General diagram of sampling transect relative to adventitious pollen source. Seed
fields selected for this study were adjacent to an adventitious pollen source that
overlapped at least 50 % of the seed field to the North, East, South or West. Sampling
transects were located on the side of the field adjacent to the adventitious pollen source.
Ears were collected along a linear sampling transect at 6, 31, 68, 118 and 660 ft from the
border rows at the edge of the seed field.

40
$ ? Sampling
18 7 ft
transect
< ? $ $ < ?
Figure 2. Schematic of the ear collection pattern at each of the five sampling locations along
the field transect. A total of 20 ears were pooled from the center two seed (female
inbred) rows at each location sample along the transect. The example is for a 4:1
(female:male) planting pattern.

41
3.5
1998
e—1999
% 2.5 </>
2 2 Y
2000
3 O C
O 0)
0.5
0 100 200 300 400 500 600 700
Distance into seed field (ft)
Figure 3. Average out-cross levels observed at each field sampling location by year. Data
are the mean for 60, 94, and 164 locations sampled in 1998, 1999, and 2000,
respectively. The Y-axis error bars represent the 95% CI. Note, 1998 contains data
from Pioneer Hi-Bred International, Inc. seed fields only.

42
S
c <D a
CL
W C o % £ 0> M S O
• 1999
4 6 8
Percent o utero ss
Figure 4. Distribution of out-cross percentages in 60, 94 and 164 seed corn field in 1998,
1999 and 2000, respectively at field mid-point locations. Seventy to eighty percent of
the locations had 1% outcrossing or less. Note, 1998 contains data from Pioneer Hi-
Bred International, Inc. seed fields only.

43
60,
50
** o
Percent outcross
• 1998
01999
• 2000
Figure 5. Distribution of outcross percentages for composite of the four field margin (6, 31,
68, 118 ft) sample locations during the three years of study. More than half of the field-
margin samples collected showed 1% or less out-crossing. Note, 1998 contains data
from Pioneer Hi-Bred International, Inc. seed fields only.
44
70
6:1 6:1:4:1 4:1 6:2 31:2:1:21
Female parent : male parent
Figure 6. Distribution of female:male parent planting patterns in the hybrid seed fields
included in the analysis. Parent ratios of four female rows to one male row (4:1)
and/or six female rows to one male row (6:1 or 6:1:4:1) comprised over 90% of
the fields examined.
45
CHAPTER 3. SIMULATING EXTRA-FIELD TRAVEL OF MAIZE POLLEN USING
A GAUSSIAN-BASED PARTICULATE DISPERSION MODEL
A paper to be submitted to Crop Science
D.S. Ireland, B. Ashton, M.E. Westgate, D. Todey, G.S. Takle
Abstract
Demand for genetic purity of non-genetically modified seeds has placed increased
pressure on seed companies to re-examine isolation practices in their seed production fields.
While seed producers generally recognize the value of reassessing physical isolation
practices, evaluating risk associated with adventitious presence has been significantly more
difficult. The ability to evaluate multiple scenarios - involving variables such as isolation
distance, orientation of potential adventitious pollen sources surrounding the seed field as
well as meteorological information - such as wind direction and speed parameters as well as
upper level atmospheric stability - and then use the scenario that suggests the best genetic
purity for the cost. This would allow seed companies the ability to estimate the costs
associated with producing seed of increasing levels of genetic purity prior to entering specific
markets.
This project combined recent advances in modeling the flowering biology of maize
with the United States Environmental Protection Agency's Industrial Source Complex Short
Term (ISCST3) model to simulate extra-field pollen travel distance and density. These
simulation tools have been used to evaluate risks associated with adventitious pollen entry

46
into seed maize (Zea mays L.) fields. Model simulations were tested on 9 location-days
against measured pollen dispersal from isolated maize fields during 2000 and 2001. While
the model over-predicted pollen deposition across all location days, model simulations were
consistent and correlated well with measured values within 100 m on the leeward side of the
field. Predictions on the windward side as well as at 90-degree angles from the primary daily
wind direction were consistently under-estimated.
Our study produced evidence that models may be especially valuable for evaluating
multiple "what if' seed production scenarios involving adventitious pollen movement. The
ISCST3 model is effective simulating gross extra-field pollen movement, but lacks the
precision to quantify absolute extra-field pollen quantities needed to accurately predict seed
field adventitious presence. However, recently published flowering biology and seed set
research combined with learnings from this study may be applied to improving models that
will predict outcrossing risk.
BACKGROUND
Within the maize (Zea mays L.) seed industry, current practices for isolating seed
maize production fields from adventitious pollen entry generally are based on private
company data, practical experience and a financial assessment of the risk of contamination
vs. the cost of isolation (Ireland, et al., 2004). Demand for genetic purity of non-genetically
modified seeds has placed increased pressure on seed companies to re-examine their seed
field isolation practices. Ireland (2004) and Burris (2001) confirmed that methods used to
achieve reproductive isolation in order to produce hybrid seed that is >99% genetically pure
in most cases. However the capacity to simulate adventitious risk associated with a given set

47
of environmental and isolation parameters would add great value to the industry. These two
publications only summarized how the seed industry was achieving the current state of
genetic purity.
The United States Department of Agriculture Animal and Plant Health Inspection
Service (APHIS) division is now requiring a minimum isolation distance of one mile for corn
being used to produce pharmaceuticals. This example reflects the lack of capability to predict
pollen travel parameters. Simple linear travel has been accepted as the probable path for
pollen movement. We possess basic knowledge of maize pollination biology (Westgate et al,
2003; Lizaso et al 2003) and knowledge of particle transport in the atmosphere from soil
wind erosion and EPA particulate modeling activities. The challenge is to apply this
knowledge to manage adventitious pollen.
Westgate et al. (2003) and Fonseca et al. (2002) confirm that the quantity of pollen
produced by maize is tremendous. The range of pollen an individual maize plant produces
can range from 9,000 to 50,000 pollen grains for each kernel. This super-production of pollen
is, in large part, the basis on which current maize seed isolation practices are based. While
maize plant growth and seed-yield modeling has received significant attention (Ritchie et al.,
1986, 1991; Kovacs et al., 1995; Otegui et al., 1996; Xevi et al., 1996; Rasse et al., 2000),
models of pollen movement have not been employed to simulate extra-field maize pollen
movement. Environmental modeling of extra-field pollen transport prior to seed field
establishment would allow seedsmen the opportunity to evaluate the potential for
adventitious presence. By evaluating multiple scenarios given different isolation and

48
environmental parameters, seed production personnel could make improved decisions,
leading to improved seed genetic purity as well as improving seed cost estimates.
Ireland et al. (2004) reported that the industry practices that most consistently
contributed to high levels of genetic purity were i) use of 'Good' or 'Fair' pollen parents, ii)
isolation greater than 165 ft from all potential adventitious pollen sources, iii) and large
(>100 ac) seed field size. In fields where higher levels of out-crossing were detected, the
percentage of out-crossing generally decreased from the field margin to the field mid-point.
These results indicate that current practices used to isolate hybrid seed fields often achieve
the goal of producing genetically pure seed. But high levels of out-crossing can and do occur,
particularly at the field margins. Greater understanding of atmospheric pollen transport
coupled with more quantitative approaches to document pollen production and flowering
dynamics are needed to minimize this risk and achieve consistently high and predictable
levels of genetic purity in hybrid seed corn production.
An alternative approach to studying pollen movement within the seed production
environment would be to treat pollen as an airborne particulate. Studying pollen travel
through the boundary layer as a particulate would lend itself to modeling and to discovery of
how pollen is affected by meteorological and geographical as well as the metrics of distance
and time.
Plant species other than maize have had their pollen travel modeled successfully (Di-
Giovanni, F. and P.M. Beckett, 1990). If maize pollen is modeled as an airborne particulate,
then existing atmospheric particulate models may be applicable; one such model is the
United States Environmental Protection Agency's (US EPA) Industrial Source Complex
Short Term (ISCST3) model.

There are many particulate models in use today. Figure 1 illustrates three logical
approaches to modeling environmental pollen movement. The ISCST3 model is currently
used for evaluating emissions of proposed industrial and power plants across the United
States. This model assumes a Gaussian distribution. Gaussian distribution is often assumed
until it is proven incorrect (Weisstein, 2000). Random variates with unknown distributions
are often assumed to be Guassian. The ISCST3 model is the current regulatory model for
evaluating particulate matter ejection into the atmosphere from industrial sites. This model is
applicable for estimating particulate travel distances and loading rates from point and area
sources.
This model is primarily used in industrial situations to simulate the effects a given
facility has on local air quality. It does this through the use of user-specified inputs. These
inputs can be broken down into two basic types: runstream and meteorological (Dicke,1997).
Runstream inputs are those inputs used to control the program and tell it where to find certain
files. Meteorological inputs are the formatted data from the PCRAMMET program. The
model takes these inputs and runs them through a set of complex mathematical algorithms to
calculate a pollutant concentration at points within 50 km.
The particulate movement interaction with the environment that this model was
designed for, in many ways approximates maize pollen in the environment. The ISCST3
model was selected for this reason. In addition to local weather data, this model requires
input values for the weight, size, density, and emission rate of the particulates to be modeled.
Pollen grain size, mass, density and production rate have all been quantified and reported
(Fonseca, et al., 2002; Westgate, et al. 2003). Thorough understanding of these parameters is
critical to proper variable input for modeling.

50
The focus of this project was to evaluate a particulate distribution model for use in
assessing risk of adventitious pollen entry into seed maize fields. The ISCST3 model appears
to offer significant potential for this purpose.
MATERIALS AND METHODS
During July 2000 and 2001, extra-field pollen travel from isolated flowering maize
fields was measured. Table 1 includes detail for dates, locations and receptor number for
each location-day. The maize fields were all located in central Iowa with soybean or grass
surrounding the maize fields. No flowering maize was located within 1500 meters.
Pollen dispersal around the source field was monitored using passive pollen traps
according to Fonseca et al. 2002. During 2000, traps were distributed systematically in eight
radi surrounding the source field (Figure 2). Along each radius, pollen traps were placed 1.5,
3, 9, 27, 50 and 100 m from the field edge. Additionally, nine traps were placed within the
isolated field to measure inter-field pollen shed. During 2001, additional fields were added to
this study. Due to this, the number of pollen traps placed at each individual field had to be
reduced; but more strategic placement was employed. Each evening prior to placing pollen
trap stands, detailed wind predictions were consulted to determine the following day's
prevailing wind direction. Considering this, the arrays of traps in transects emanating from
the field were located primarily on the leeward sides of the fields.
All traps were placed and exposed at 0800, and retrieved at 1700 hours. Sticky traps
were replaced daily during flowering. The sticky traps were made of two lanes of double-
sided tape mounted on a dark non-reflective background adhered across a plastic card
measuring 8 cm x 8 cm. These traps were placed at 1.0 m height on garden stakes and

51
positioned as noted in Figure 1. Pollen collected on these traps was imaged using digital
microscopy as described by Fonseca (2002). This light source allowed differentiation of
maize pollen from other debris on the sticky trap (Figure 3). Each 8 cm lane across the trap
was recorded using 5 images. The 10 images per trap were analyzed to determine mean
pollen count per position.
A Campbell™ weather station was used to log wind speed and direction at a three-
meter height, ambient air temperature, rainfall and relative humidity at field edge. During the
flowering period, meteorological measurements were made every minute and the fifteen
minute mean was logged.
ISCST3 Model Inputs
Using physical, meteorological and biological data, known and collected on site, the
US EPA ISCST3 model was used to model pollen movement. Physical data included pollen
receptor position distance relative to the isolated maize field, height from ground surface, and
the specific orientation of each receptor array relative to the field. Biological data input into
the model included specific maize-pollen inputs listed in table 2 as well as maize flowering
pattern information as reported by Lizaso et al. (2003) and Westgate et al. (2003).
Meteorological Variables and PCRAMMET
Model receptors can be altered in the ISCST3 program to mimic physical receptors.
Several variables, including receptor height and location, were used to do this. The ISCST3
model requires some basic meteorological variables to be input. The only runstream
meteorological variables that the model requires are the anemometer height and the date
range that it will be running. All other meteorological data come from files produced by a
program named PCRAMMET.This meteorological preprocessor for the ISC model is used to

52
format the hourly weather station data and twice-a-day upper air soundings into a file the
model can use. The required variables for this program are listed in Table 3.
PCRAMMET uses these inputs and calculates several important case-dependent
variables. In the case of dry deposition, these variables include the stability class, rural
mixing height, urban mixing height, friction velocity, and the incoming short wave radiation
(Eckhoff, 1999).
Mathematical Algorithms
After collecting all the necessary input, the model calculates the concentration of the
particulate at every receptor. For dry deposition, a deposition velocity is then multiplied by
this predicted concentration. The model calculates the deposition velocity at the same
reference height as the receptor at which the concentration was calculated. This can be
written simply as:
F d = X d " v d '
(1)
where Fj is the deposition flux, %d is the concentration at reference height za and Vj is the
computed deposition velocity at reference height za (Baily and Tourna 1995).

53
In Equation (1), %d can be written as:
x(x,y) = QKVD
2%| exp
(2) / x
a v y y
where Q is the emission rate, K is a scaling coefficient, V is the vertical term, D is the decay
term, ay and <yz are the standard deviations of horizontal and vertical distribution, and us is
the mean wind speed at the release height (Baily and Tourna, 1995).
Equation (2) is valid for point sources. This project utilized area sources to represent
the maize field. To calculate the concentration from an area source, the ISCST3 model
integrates Equation (2) over the upwind (x) and crosswind (y) directions (Baily and Tourna,
1995). This can be written as shown in Equation (3).
/
f \ 2 \
fexp 1 T
y dy
y
V
L l y j
/
To complete Equation (1), the deposition velocity can then be written as shown in
Equation (4):

54
^ 'a+rd+VdVg^' (4)
where Vd is the deposition velocity, ra is the aerodynamic resistance, rd is the deposition layer
resistance, and Vg is the gravitational settling velocity (Baily and Tourna, 1995).
RESULTS AND DISCUSSION
The model consistently over-estimated pollen deposition on the leeward side of the
field. Additionally, modeled values on the windward side of the field were predictably under
estimated. The stronger and less dynamic the wind, the greater the model over-estimated
pollen deposition.
Model Correlation to Measured Values
Model simulations of pollen deposition at trap locations correlated best with
measured values within approximately 135 - 225 degrees of the primary wind direction. The
weakest correlation was found for side and windward directions. Considering that the ISC
model algorithms are based on Guassian assumptions of normal steady-state systems, this
finding was not unexpected.
The model assumes that the wind blows at the measured average speed of the hour for
the entire hour. The next hour the same is assumed and so on. A total of 24 one-hour winds,
each defined as blowing the entire hour for a specific speed and direction, then drive the
particulate deposition value estimate.
The authors believe the reason the model is most accurate for days with a narrow
wind direction profile is due to the model's inflexibility to account for shifting winds. The

55
stronger and more unidirectional the wind the higher the model simulation correlated to
measured pollen values.
Tables 4a and 4b contain measured and model simulated deposition values for each of
the nine location-days. Figures 4a and 4b contain daily wind direction and magnitude
information as well as correlation values (0.0 - 0.99) between measured and model
deposition simulated for each of the deposition trap arrays surrounding the isolated fields,
respectively. Additionally, the modeled total pollen deposition per transect is reported as a
percentage of the measured. Note that on days with multiple fields in the same locale, the
windroses are the same, but each individual field's measurements are reported.
The daily wind information figure is called a windrose. Each windrose describes
graphically the percent of time a wind speed and direction occurred using vectors and colors.
For example, from the windrose for Ankeny 1 on 7/26/2001 (Figure 4b), an easterly wind
blew for approximately 45 percent of the time-period at 1.5-3.0 m*s"' and from the same
direction, the wind blew at 3.1-5.1 m*s-1 for 25 percent of the time-period, and for another 15
percent of the time period the wind blew over 5.1 m*s"\ Additionally, 15 percent of the time
period the wind blew from the east-northeast between 1.5-5.1 m*s™1. These windroses
describe the winds each day from 10:00AM to 3:00PM. This was defined as the daily period
during which pollen was shed.
Model prediction was highly correlated with observed values estimating pollen travel
quantity on vectors within 135 - 225 degrees of the primary wind direction. The weakest
correlation between measured and simulated values occurred either to the side of the primary
daily wind vector or upwind from the field. Two location-days did not follow this pattern
well; especially interesting were the days of gentle and fluctuating winds; 7/23/2000 Ames

56
and 7/27/2000 Ames (Figure 4a). Both had fairly strong correlation between measured and
simulated surrounding the field. While the correlation of some transects from the field were
weaker than others, there were no transects on either day that didn't have a positive
correlation.
Accounting for the fact that seedsmen are most interested in adventitious pollen travel
that moves furthest on unidirectional air streams, the model's decreased accuracy within the
+/- 90 degree region of the daily primary wind direction may be palatable. Correlation
between observed pollen counts and model simulation remains strong on the leeward side of
the source field across years and locations. This is encouraging for possibly using models to
estimate physical isolation distances needed for defined levels of seed purity.
Wind Speed Effects
The stronger the daily winds, the lower the correlation between measured and
simulated values for transects within 90 degrees of the daily primary wind direction (Figures
4a and 4b). The correlation on the leeward side of the field for days with strong primary wind
direction compared to days with weak, fluctuating winds was rather similar but model
accuracy within 90 degrees of the daily primary wind direction vector continued to be
weaker.
Simulated vs. Observed Pollen Deposition
Curves were developed using the measured and model simulated pollen deposition
values. The area under the best-fit model simulated value curve was then divided by the area
under the curve generated by measured pollen values for each location-day transect (Figures
4a and 4b). This information is reported as a percentage around the perimeter of each
location-day windrose.

57
A very similar pattern is seen with simulated versus observed pollen deposition
amounts compared to previously described correlation relationships. However the
simulated:observed ratio values add a great deal more definition to evaluating the model
simulation accuracy. It is readily apparent that for each location day, even though there is
strong correlation existing between measured and simulated, the accuracy of the model
suffers greatly. Figures 5a and 5b reinforce the predictable pattern of model over-estimation
on the field leeward side. These figures describe the difference between measured and model
simulated pollen deposition for each location-day. The level of simulation accuracy appears
to be affected by two main factors: 1) Wind speed; and 2) Wind direction fluctuation.
The greater the wind fluctuation, the less apparent a particular pattern is exhibited
when looking at the simulated:observed ratio; as seen for 7-23-2000 Ames and 7-27-2000
Ames windroses (Figure 5a). However, with strong winds in a unidirectional pattern, such as
on 7-26-2001 Ankeny 1 or 7-26-2001 Ankeny 2 location days (Figure 5b), the model
inaccuracy is clearly exhibited with extreme over prediction on the leeward field side.
Side winds seemed to erode model over-prediction as in the example of 7-26-2001
Ames (Figure 5b). The north and south transects, which are at right angles from the primary
daily wind vector, are greatly under-predicted as is the windward side in the example of 7-
25-2001 Ankeny 1. The solid-state assumptions of a Gaussian model assuming the
continuous nature of wind, both for direction and speed, during specific periods of time
greatly exaggerated or understated actual measurements. Employing a more dynamic model
that responded more naturally to measured winds should improve simulated extra-field
pollen deposition.

58
Selected What If Scenarios
Wind Speed
Employing pollen modeling allows for numerous "risk scenarios" to be evaluated.
Consider for a moment that a seed product is needed for a market in which there was little
tolerance for adventitious presence - not unlike organic seed or some European or markets.
There is obvious value in being able to run multiple risk scenarios prior to planting. This
would allow one to determine likely isolation distances required for specific meteorological
events or the potential effects of different orientations between the seed field and potential
adventitious sources. Below, a couple of elementary examples of such risk scenario
evaluation are developed.
The distance pollen travels has a relationship with wind speed. How does increasing
wind speed affect the pollen plume? Through modeling we evaluated different wind speed
scenarios. When the wind speed was 1.5-3.0 m s"1 (IX), as was the case on July 21, 2000
pollen traveled approximately 115m down wind (Figure 6). The model estimates that when
wind speed increases to 4X, the distance pollen travels increases dramatically to
approximately 210 m (Figure 7).
Increasing wind speed increased the distance pollen traveled, according to model
estimates. Wind speeds of IX and 2X of July 21, 2000 moved pollen into the theoretical seed
field 100 m from the potential contaminant source, however the seed field 200m away
appears safe from adventitious pollen from this source. However, when the wind speed is
increased to 4X, the pollen moves into the proposed seed field 200 m from the contaminant
(Figure 7). These effects illuminate the importance of wind direction, speed and duration on
pollen travel distance, and the value of pre-plant risk assessment.

59
Pollen Shed Quantity
How would increasing absolute pollen shed from a potential adventitious source
affect risks of outcrossing? Pollen travel modeling can assist in evaluating potential risks
associated with such eventualities. Figures 8 and 9 depict effects of increasing pollen shed
density to 3X that of July 21, 2000. Doubling the density of pollen shed did not increase the
distance pollen dispersed very much (not shown). However, by tripling the pollen-shed
density of 21 July 2000, pollen travel increased significantly (Figure 9). It is important to
note, however that increasing pollen-shed density had less impact on pollen dispersion
distance than did increasing wind speed. This is another finding that would be difficult to
conceive without modeling.
Considering that typical maize seed field isolation distances range from 50-200 m,
wind speed appears to play a larger role in seed field adventitious pollen than does pollen
shed density of the adventitious source.
Model Limitations
The ISCST3 model is not dynamic enough for modeling pollen travel. Due to the
steady state nature of the model, it is unable to account for inter-hour wind shifts and other
small-scale meteorological events. The model is also unable to calculate deposition within
the source. It will return values for receptors placed within the source, but they are even less
accurate than extra-source (Baily et al., 1995A).
The ISCST3 model has a preprocessor that calculates downwash from any
obstruction that is close to the source. However, it is only applicable to solid structures. The
downwash calculated by this preprocessor is also not applicable to area sources (Brode,
2000).

60
Additionally, this model is based on Gaussian, or normal distribution of particles.
These assumptions provide for particulates that move from the source in an extremely
predictable way described by simpler mathematical assumptions. This does not provide for
the dynamic nature of pollen within the lower boundary layer environment.
There are two more likely naturally robust distribution patterns that are likely more
applicable to pollen movement: 1) A statistical or "random-walk" distribution in which each
individual particle moves independently and thus does not fit a normal distribution, or 2) A
diffusion-like distribution, where gradients become averaged out over space and time (Figure
1). Both of these more complex approaches should provide added levels of reality to
interactions of pollen within the environment.
A model based on Guassian assumptions is a logical point to initiate modeling efforts,
but the authors are confident that more robust approaches will provide improvements in
pollen deposition model accuracy. Ideally, a pollen model would also accept more dense
micro-climate meteorological and biological data. The ISCST3 model only allows for hourly
inputs and loss of pollen viability is also not easily accounted for. The pollen viability issue
could be approached through the 'chemical decay' function included in the Gaussian
equation. This function might be able to be manipulated to mimic simply understood
environmental effects that reduce pollen viability.
CONCLUSIONS
Upon reviewing the success and limits of the ISCST3 model, it does provide a solid
point from which more robust modeling approaches will be derived. Prior to this project,
there had been no success modeling maize pollen travel. With increasing pressure on seed
61
production personnel to understand and indeed exercise improved control of adventitious
pollen, modeling provides a useful new tool for seedsmen. The ISCST3 model provides
reliable evidence of the value of pollen travel modeling. There is obvious value in the ability
of running multiple "what if' scenarios using historic weather data to determine isolation
elements needed to reach specific adventitious presence goals. The authors above, in addition
to other investigators, are currently evaluating the ISC3 model against a more comprehensive
Lagrangian-based model.
REFERENCES
Aylor, D.E., H.A. McCartney and A. Bainbridge. 1981. Deposition of particles liberated in
gusts of wind. J Appl Met 20:12-1221.
Baily, 0. T., and D.B. Schwede, and J. S. Tourna, 1995A: User's Guide for the Industrial
Source Complex (ISC3) Dispersion Models. Volume 1 - User Instructions. Pacific
Environmental Services and Sigma Research Corporation, 230 pp.
Baily, D. T., and J. S. Tourna, 1995B: User's Guide for the Industrial Source Complex
(ISC3) Dispersion Models. Volume 2 - Description of Modeling Algorithms. Pacific
Environmental Services and Sigma Research Corporation, 83 pp.
Brode, R. W., 2000: User's Guide for the Industrial Source Complex (ISC3) Dispersion
Models Addendum. Volume 1 - User instructions. Pacific Environmental Services,
15 pp.
Dicke, J. L., 1997: Introduction to Dispersion Modeling. Environmental Protection Agency,
250 pp.

62
Di-Giovanni, F. and P.M. Beckett. 1990. On the mathematical modeling of pollen dispersal
and deposition. J. of Appl. Met. Vol 29, December.
Di-Giovanni F., P.G. Kevan and M.E. Nasr. 1995. The variability in settling velocities of
some pollen and spores. Grana 34:39-44.
Eckhoff, P., 1999: PCRAMMET User's Guide. Pacific Environmental Services, 63 pp.
Fonseca, A.E., M.E. Westgate, and R.T. Doyle. 2002. Application of fluorescence
microscopy and image analysis for quantifying dynamics of maize pollen shed. Crop
Sci. 42: 2201-2206.
Garcia, M.C., Figueroa M., J., Gomez L., R., Townsend, R., and J. Schoper. 1998. Crop Sci.
38:1597-1602.
Hutchcroft, C D. 1958. Contamination in seed fields of corn resulting from incomplete
detasseling. Agron. J. 40:267-271.
Ireland, O.S., D O. Wilson, Jr., M.E. Westgate, J.S.Burris, and M.J. Lauer. Managing
reproductive isolation in hybrid seed corn production, (in review Crop Science).
Jones, M.D., and L.C. Newell. 1946. Pollination cycles and pollen dispersal in relation to
grass improvement. U of N Agri. Exp. Stat. Res. Bui 148.
Kovacs, G.J., T. Nemeth, and J.T. Ritchie. 1995. Testing simulation models for the
assessment of crop production and nitrate leaching in Hungary. Agric. Syst. 49:385-
397.
Lizaso, J.I., M.E. Westgate, W.D. Batchelor, and A.E. Fonseca. 2003. Predicting Potential
Kernel Set in Maize From Simple Flowering Characteristics. Crop Sci. 43:892-903.
Old Dominion University ISC3 - Industrial Source Complex Dispersion Air Quality Model
Windows Interface, http://www.cee.odu.edu/air/isc3/odu_isc3 .html#overview

63
Otegui, M.E., R. A. Ruiz, and D. Petruzzi. 1996. Modeling hybrid and sowing date effects on
potential grain yield of maize in a humid temperate region. Field Crops Res. 47:167-
174.
Patemiani, E. and A.C. Stort. 1974. Effective maize pollen dispersal in the field. Euphytica
23:129-134.
Rasse, D P. and Ritchie, J.T., Wilhelm, W.W., Wei, J., and E.C. Martin. 2000. Simulating
inbred-maize yields with CERES-IM. Agron. J. 92:672-678.
Ritchie, J.T., J.R. Kiniry, C.A. Jones, and P.T. Dyke. 1986. Model inputs. P. 37-49. In C.A.
Jones and J.R. Kiniry (ed.) CERES-MAIZE. A simulation model of maize growth and
development. Texas A&M University Press, College Station, Texas, USA.
Ritchie, J.T., and O.S. NeSmith. 1991. Temperature and crop development. P. 5-29. In J.T.
Ritchie and O.S. NeSmith (ed.) Modeling plant and soil systems. Agron. Monogr. 31.
ASA, CSSA, and SSSA, Madison, WI.
Shaw, R.H., O.P. Ward and D.E. Aylor. 1979. Frequency of occurrence of fast gusts of wind
inside a corn canopy. J Appl Met 18:167-171.
Stanley, R.G. and H.F. Linskens. 1974. Pollen: Biology, biochemistry, Management.
Springer-Verlag.. Heidelberg, Germany.
United States Environmental Protection Agency. Industrial Source Complex Short Term
Model 3 Operating Manuals I & II. http://www.epa.gov/ttn/scram/ U.S.
ENVIRONMENTAL PROTECTION AGENCY Office of Air Quality Planning and
Standards, Emissions, Monitoring, and Analysis Division Research Triangle Park,
North Carolina 27711

Weisstein,E. 2000. World of Mathematics.
http://mathworld.wolfram.com/GaussianDistribution.html
Westgate, M.E., J. Lizaso, and W.D. Batchelor. 2003. Quantitative relationships between
pollen shed density and grain yield in maize (Zea mays L.). Crop Sci. 43:934-942.
Xevi, E., J. Gilley, and J. Fey en. 1996. Comparative study of two crop yield simulation
models. Agric. Water Manage. 30:155-173.
65
List of Figures
Figure 1. The ISCST3 model is based on the assumption of Gaussian distribution. Pollen distribution may also be described by at least two other means - a statistical approach or through diffusion distribution.
Figure 2. Schematic diagram of pollen sticky trap placement surrounding isolated maize field during 2000, the initial year of this investigation.
Figure 3. Pollen was identified through unique fluorescence emission. The light wavelength used was 510 nm.
Figure 4a. Windroses describing winds for 4 location days during July 2000. Values presented between 0.0-0.99 are the correlation between measured and model estimated pollen deposition. Percent values are ratios of total modeled pollen deposition divided by measured pollen deposition, presented by transect.
Figure 4b. Windroses describing winds for 5 location-days during July 2001. Values presented between 0.0-0.99 are the correlation between measured and model estimated pollen deposition. Percent values are ratios of total modeled pollen deposition divided by measured pollen deposition, presented by transect.
Figure 5a. Differences between measured and model simulated pollen deposition for four location days during 2000 at Ames, Iowa.
Figure 5b. Differences between measured and model simulated pollen deposition for five location days during 2001 at Ames, Iowa and Ankeny, Iowa.
Figure 6. On the left is the windrose for July 21, 2000 for the Ames, Iowa field. Nearly the entire measured period, northwesterly winds were received between 1.5-3.0 m s" On the right of the figure is depicted the measured ;pollen deposition for the same date and location. Hypothetical seedfields have been inserted into the figure on the leeward side of the isolated subject field.
Figure 7. Graphical representation of model output when July 21, 2000 wind speed was quadrupled to 6-12 m s"1. The model estimated pollen would travel approximately 210 m down wind. Schematic depictions of seed fields have been inserted 100 m and 200 m downwind.
Figure 8. Pollen shed density effects on the distance pollen travels. Data displayed illustrate July 21, 2000 measured pollen deposition.

66
Figure 9. Representation of model output when pollen shed density was increased 3X. Data displayed illustrates 3X July 21, 2000 pollen shed density. Note that pollen shed density affects the distance pollen travels; in this case well beyond 150 m for the same wind conditions as in Fig 7.

67
List of Tables
Table 1. Summary of nine location-days during 2000 and 2001 where passive pollen receptors were arranged surrounding isolated maize fields measuring extra-field pollen deposition.
7/21/2000 Ames, Iowa 48 7/23/2000 Ames, Iowa 41 7/24/2000 Ames, Iowa 45 7/27/2000 Ames, Iowa 45 7/25/2001 Ames, Iowa 13 7/25/2001 Ankeny, Iowa - Field 1 24 7/26/2001 Ames, Iowa 13 7/26/2001 Ankeny, Iowa - Field 1 11 7/26/2001 Ankeny Iowa - Field 2 15
Table 2. Pollen physical parameters input into ISCST3 model
• Particle weight: 200 10"9 g • Particle size: mean 85 mm dia (10% 75 mm, 80% 85 mm, 10% 95 mm) • Particle density: 0.875 g cm"3
• Terminal velocity:calc. (20 cms"1) • Deposition velocity: calc. (40 cm s"1) • Daily pattern of pollen shed parsed hourly from 0800 to 1700 local standard time

68
Table 3. Sources of PCRAMMET required variables.
Surface station ID Surface observation dimensionless Mixing station ID Upper air dimensionless Y ear/month/day/hour Surface/upper air Time Opaque cloud cover Surface observation Percentage Dry bulb temperature Surface observation C Station pressure Surface observation Millibars (mb) Wind direction Surface observation degrees Wind speed Surface observation -l m s Ceiling height Surface observation m AM mixing value Upper air m PM mixing value Upper air m Surface roughness PCRAMMET guide m Noon-time albedo PCRAMMET guide dimensionless Bowen Ratio PCRAMMET guide dimensionless Anthropologic heat flux PCRAMMET guide W/mA2 Radiation absorbed PCRAMMET guide dimensionless
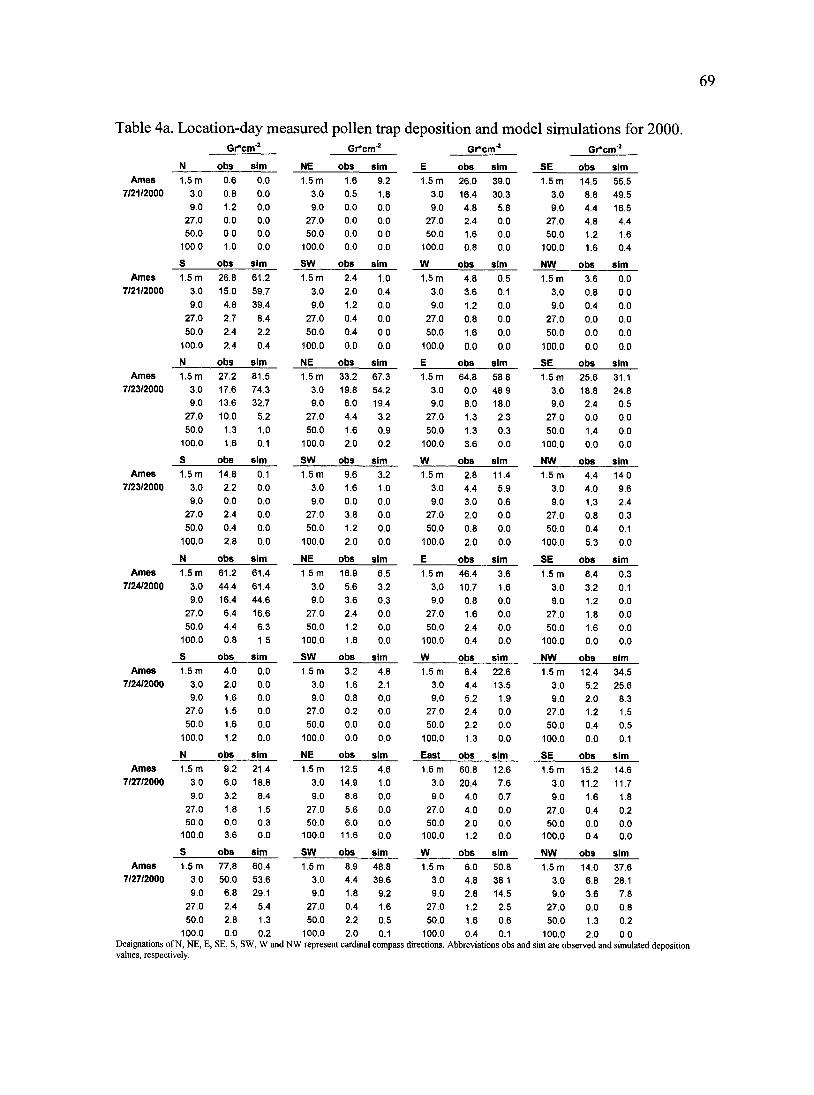
69
Table 4a. Location-day measured pollen trap deposition and model simulations for 2000. Gr*cm2 Gf*cm'2 Gr*cm'2 Gf*cm2
N obs sim NE obs sim E obs sim SE obs sim Ames 1.5 m 0.6 0.0 1.5 m 1.6 9.2 1.5 m 26.0 39.0 1.5 m 14.5 55.5
7/21/2000 3.0 0.8 0.0 3.0 0.5 1.8 3.0 16.4 30.3 3.0 8.8 49.5 9.0 1.2 0.0 9.0 0.0 0.0 9.0 4.8 5.8 9.0 4.4 16.5
27.0 0.0 0.0 27.0 0.0 0.0 27.0 2.4 0.0 27.0 4.8 4.4 50.0 0.0 0.0 50.0 0.0 0.0 50.0 1.6 0.0 50.0 1.2 1.6
100.0 1.0 0.0 100.0 0.0 0.0 100.0 0.8 0.0 100.0 1.6 0.4
S obs sim SW obs sim W obs sim NW obs sim Ames 1.5 m 26.8 61.2 1.5 m 2.4 1.0 1.5 m 4.8 0.5 1.5 m 3.6 0.0
7/21/2000 3.0 15.0 59.7 3.0 2.0 0.4 3.0 3.6 0.1 3.0 0.8 0.0 9.0 4.8 39.4 9.0 1.2 0.0 9.0 1.2 0.0 9.0 0.4 0.0
27.0 2.7 8.4 27.0 0.4 0.0 27.0 0.8 0.0 27.0 0.0 0.0 50.0 2.4 2.2 50.0 0.4 0.0 50.0 1.6 0.0 50.0 0.0 0.0
100.0 2.4 0.4 100.0 0.0 0.0 100.0 0.0 0.0 100.0 0.0 0.0
N obs sim NE obs sim E obs sim SE obs sim Ames 1.5 m 27.2 81.5 1.5 m 33.2 67.3 1.5 m 64.8 58.8 1.5 m 25.6 31.1
7/23/2000 3.0 17.6 74.3 3.0 19.8 54.2 3.0 0.0 48.9 3.0 18.8 24.8 9.0 13.6 32.7 9.0 6.0 19.4 9.0 8.0 18.0 9.0 2.4 0.5
27.0 10.0 5.2 27.0 4.4 3.2 27.0 1.3 2.3 27.0 0.0 0.0 50.0 1.3 1.0 50.0 1.6 0.9 50.0 1.3 0.3 50.0 1.4 0.0
100.0 1.6 0.1 100.0 2.0 0.2 100.0 3.6 0.0 100.0 0.0 0.0
S obs sim SW obs sim W obs sim NW obs sim Ames 1.5 m 14.8 0.1 1.5 m 9.6 3.2 1.5 m 2.8 11.4 1.5 m 4.4 14.0
7/23/2000 3.0 2.2 0.0 3.0 1.6 1.0 3.0 4.4 5.9 3.0 4.0 9.6 9.0 0.0 0.0 9.0 0.0 0.0 9.0 3.0 0.6 9.0 1.3 2.4
27.0 2.4 0.0 27.0 3.8 0.0 27.0 2.0 0.0 27.0 0.8 0.3 50.0 0.4 0.0 50.0 1.2 0.0 50.0 0.8 0.0 50.0 0.4 0.1
100.0 2.8 0.0 100.0 2.0 0.0 100.0 2.0 0.0 100.0 5.3 0.0
N obs sim NE obs sim E obs sim SE obs sim Ames 1.5 m 61.2 61.4 1.5 m 16.9 6.5 1.5 m 46.4 3.6 1.5 m 8.4 0.3
7/24/2000 3.0 44.4 61.4 3.0 5.6 3.2 3.0 10.7 1.6 3.0 3.2 0.1 9.0 16.4 44.6 9.0 3.6 0.3 9.0 0.8 0.0 9.0 1.2 0.0
27.0 6.4 16.6 27.0 2.4 0.0 27.0 1.6 0.0 27.0 1.8 0.0 50.0 4.4 6.3 50.0 1.2 0.0 50.0 2.4 0.0 50.0 1.6 0.0
100.0 0.8 1.5 100.0 1.6 0.0 100.0 0.4 0.0 100.0 0.0 0.0
S obs sim SW obs sim W obs sim NW obs sim Ames 1.5 m 4.0 0.0 1.5 m 3.2 4.8 1.5 m 6.4 22.6 1.5 m 12.4 34.5
7/24/2000 3.0 2.0 0.0 3.0 1.6 2.1 3.0 4.4 13.5 3.0 5.2 25.6 9.0 1.6 0.0 9.0 0.8 0.0 9.0 5.2 1.9 9.0 2.0 8.3
27.0 1.5 0.0 27.0 0.2 0.0 27.0 2.4 0.0 27.0 1.2 1.5 50.0 1.6 0.0 50.0 0.0 0.0 50.0 2.2 0.0 50.0 0.4 0.5
100.0 1.2 0.0 100.0 0.0 0.0 100.0 1.3 0.0 100.0 0.0 0.1
N obs sim NE obs sim East obs sim SE obs sim Ames 1.5 m 9.2 21.4 1.5 m 12.5 4.6 1.5 m 60.8 12.6 1.5 m 15.2 14.6
7/27/2000 3.0 6.0 18.8 3.0 14.9 1.0 3.0 20.4 7.6 3.0 11.2 11.7 9.0 3.2 8.4 9.0 8.8 0.0 9.0 4.0 0.7 9.0 1.6 1.8
27.0 1.8 1.5 27.0 5.6 0.0 27.0 4.0 0.0 27.0 0.4 0.2 50.0 0.0 0.3 50.0 6.0 0.0 50.0 2.0 0.0 50.0 0.0 0.0
100.0 3.6 0.0 100.0 11.6 0.0 100.0 1.2 0.0 100.0 0.4 0.0
S obs sim SW obs sim W obs sim NW obs sim Ames 1.5 m 77.8 60.4 1.5 m 8.9 48.8 1.5 m 6.0 50.8 1.5 m 14.0 37.6
7/27/2000 3.0 50.0 53.6 3.0 4.4 39.6 3.0 4.8 38.1 3.0 6.8 28.1 9.0 6.8 29.1 9.0 1.8 9.2 9.0 2.8 14.5 9.0 3.6 7.8
27.0 2.4 5.4 27.0 0.4 1.6 27.0 1.2 2.5 27.0 0.0 0.8 50.0 2.8 1.3 50.0 2.2 0.5 50.0 1.6 0.6 50.0 1.3 0.2
100.0 0.0 0.2 100.0 2.0 0.1 100.0 0.4 0.1 100.0 2.0 0.0 Designations of N, NE, E, SE, S, SW, W and NW represent cardinal compass directions. Abbreviations obs and sim are observed and simulated deposition values, respectively.

70
Table 4b. Location-day measured pollen trap deposition and model simulations for 2001. Gr*cm"2 Gr*cm"2 Gr*cm"2 Gr*cm"2
S obs sim SW obs sim W obs sim NW obs sim Ames 1 m 26.8 53.6 1 m 19.6 89.5 1 m 54.0 83.3 1 m 1.6 43.8
7/25/2001 25 6.0 0.6 25 0.8 35.1 25 0.4 12.6 25 2.0 0.0 50 4.8 0.0 50 0.8 14.2 50 0.8 0.7 50 N/A N/A 75 1.6 0.0 75 0.0 6.0 75 0.0 0.1 75 0.4 0.0
100 1.8 0.0 100 0.4 2.9 100 0.4 0.0 100 0.0 0.0 N obs sim E obs sim
Ames 1 m 0.0 0.0 1 m 24.9 0.0 7/25/2001 25 0.3 0.0 25 8.8 0.0
50 0.4 0.0 50 3.2 0.0 75 0.8 0.0 75 3.2 0.0 100 0.4 0.0 100 5.6 0.0 SW obs sim WSW obs sim West obs sim WNW obs sim
Ames 1 m 11.6 53.2 1 m N/A N/A 1 m 112.4 55.6 1 m 51.2 61.7 7/26/2001 25 0.0 9.4 25 N/A N/A 25 2.0 30.7 25 N/A N/A
50 0.4 0.4 50 0.8 8.9 50 1.6 13.5 50 0.4 11.4 75 0.0 0.0 75 0.7 5.1 75 0.4 6.8 75 N/A N/A 100 0.0 0.0 100 0.4 1.6 100 0.4 3.8 100 0.4 2.5 NW obs sim
Ames 1 m 12.4 55.7 7/26/2001 25 0.0 15.1
50 0.4 0.9 75 0.0 0.3 100 N/A N/A E obs sim S obs sim SSW obs sim W obs sim
Ankeny 1 1 m 1.3 0.5 1 m 50.8 73.2 1 m 48.0 94.4 1 m 4.0 70.5 7/25/2001 25 1.2 0.0 25 1.6 13.1 25 2.4 41.5 25 3.1 2.7
50 0.8 0.0 50 0.4 3.3 50 0.8 11.5 50 0.4 0.0 75 0.0 0.0 75 0.0 1.5 75 0.4 3.4 75 0.0 0.0 100 0.0 0.0 100 0.0 0.8 100 0.0 1.1 100 N/A N/A
N obs sim NE obs sim
Ankeny1 1 m 0.0 0.0 1 m 0.0 0.0 7/25/2001 25 0.0 0.0 25 0.0 0.0
50 0.8 0.0 50 0.0 0.0 75 1.2 0.0 75 0.0 0.0 100 0.0 0.0 100 0.0 0.0
SSW obs sim SW obs sim W obs sim NW obs sim Ankeny 1 1 m 39.6 71.2 1 m 10.8 65.7 1 m 30.0 66.1 1 m 12.0 63.8 7/26/2001 25 N/A N/A 25 0.0 13.4 25 0.4 30.4 25 0.6 10.5
50 0.4 47.5 50 0.4 2.2 50 0.4 12.8 _ _ 50 N/A N/A 75 N/A N/A 75 N/A N/A 75 0.0 6.5 75 0.2 2.4 100 0.0 0.0 100 N/A N/A 100 N/A N/A 100 N/A N/A
N obs sim S obs sim
Ankeny1 1 m 23.6 9.8 1 m 33.1 13.2 7/26/2001 25 0.8 0.0 25 0.0 0.0
50 0.4 0.0 50 0.4 0.0 75 0.0 0.0 75 0.0 0.0 100 0.0 0.0 100 0.8 0.0 S obs sim SW obs sim W obs sim NW obs sim
Ankeny2 1 m 25.6 13.2 1 m 22.8 65.7 1 m 15.6 66.1 1 m 7.1 63.8 7/26/2001 25 0.8 9.1 25 1.6 13.4 25 0.4 30.4 25 0.5 10.5
50 0.0 0.0 50 0.8 2.2 50 0.4 12.8 50 0.0 0.5 75 N/A N/A 75 N/A N/A 75 0.4 6.5 75 0.8 0.0 100 N/A N/A 100 N/A N/A 100 0.0 3.7 100 0.0 0.0
Designations of N, NE, E, SE, S, SW, W and NW represent cardinal compass directions. Abbreviations obs and sim are observed and simulated deposition values, respectively.

71
List of Figures
CLOUD SPREADS AS IT TRAVELS DOWNWIND IN A GAUSSIAN MANNER
RANDOM WALK OF MANY POLLEN PARTICLES
GRADIENTS BECOME f AVERAGED OUT
Figure 1. The ISCST3 model is based on the assumption of Gaussian distribution. Pollen distribution may also be described by at least two other means - a statistical approach or through diffusion distribution.
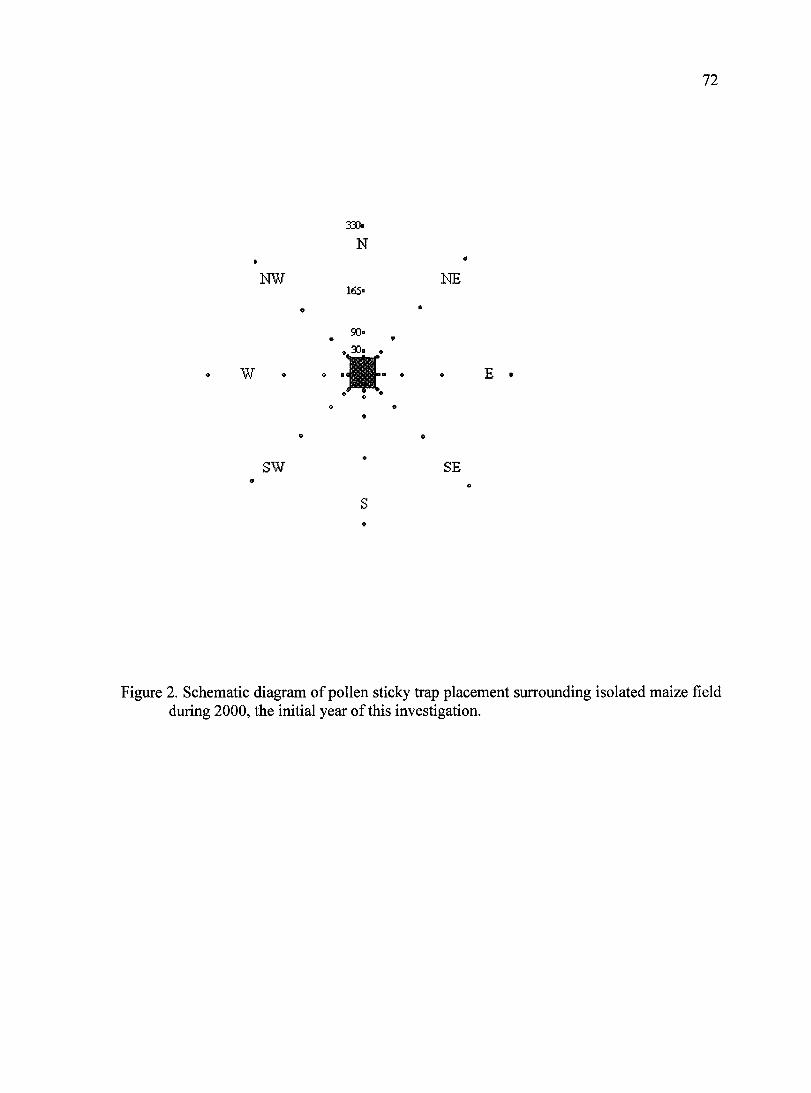
72
330» N
NW 165-
NE
W
90-.30.
SW SE
Figure 2. Schematic diagram of pollen sticky trap placement surrounding isolated maize field during 2000, the initial year of this investigation.

73
Figure 3. Pollen was identified through unique fluorescence emission. The light wavelength used was 510 nm.
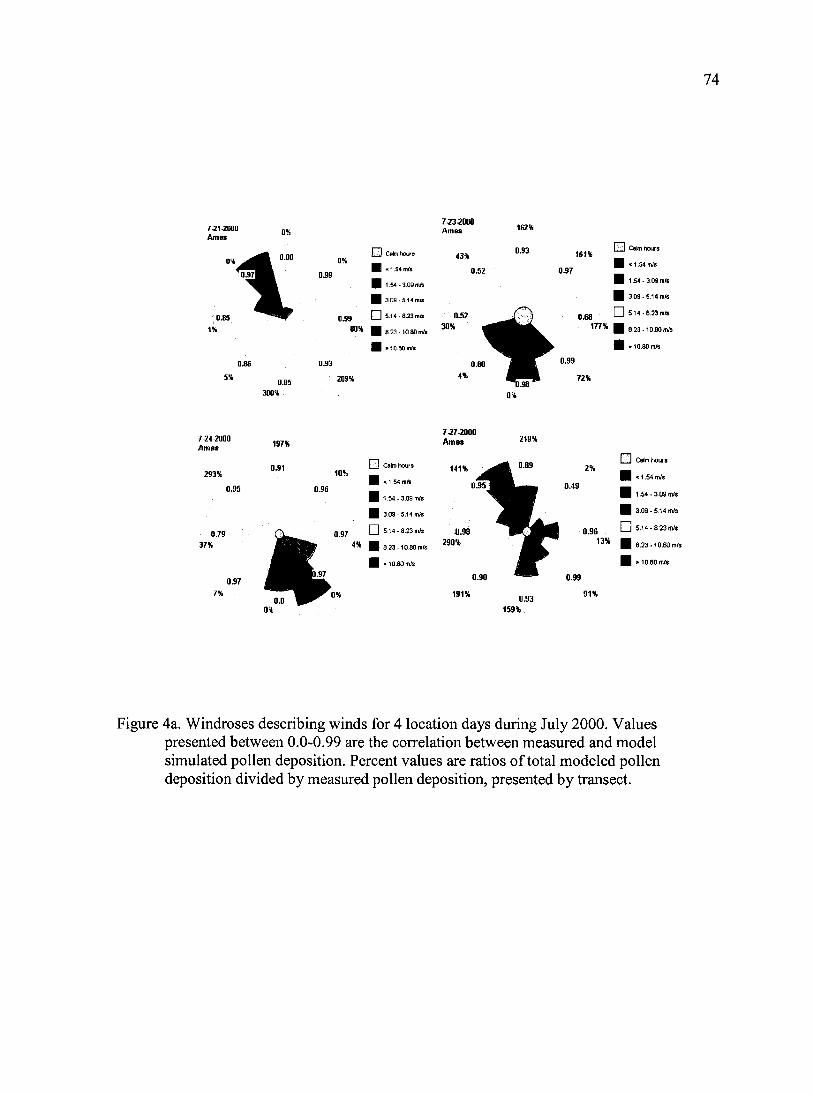
74
Ames
7-23-2000
u Cekn hours
• < 1.54 m/s
• 1.54. 3.09 mA
• 3.09.
D 5.14. . 8.23 m/s
• 8.23. • 10.80 m/s
• » 10.80 m/S
209%
30%
162%
0.93 161%
0.68
72%
[H] Calm hours
| «1.54 m/s
| 1.54- 3.09 m/s
| 3.09-5.14 m/s
l~~l 5.14-6.23 m/s
| 8.23-10.60 m/s
H » 10.80 m/s
7-24-2000 Ames
293%
0.95
0.79
37%
0.97
197%
0.91 10%
0.96
• Calm hours
H < 1 54 m/s
| 1.54 - 3.09 m/s
| 3.09-5.14 m/s
I I 5.14-8.23 m/s
00 8.23 -10.80 m/s
1 >10.80 m/s
7 -27 -2000 Ames
0.90
191% 0.93
2%
0.96 13%
0.99
O Calm hours
H <154 m/s
H 1.54-3.09 m/s
H 3 09-5.14 m/s
• 5.14-823 m/s
| 8.23-10.80 m/s
| » 10.80 m/s
159%
Figure 4a. Windroses describing winds for 4 location days during July 2000. Values presented between 0.0-0.99 are the correlation between measured and model simulated pollen deposition. Percent values are ratios of total modeled pollen deposition divided by measured pollen deposition, presented by transect.

75
7-25-2001 Ames
535%
0.99
195%
0%
0.00
0.42
7-26-2001 Ames
• Calm h
705%
1.54 - 3.09 m/s 0.96
0.88 1.23-10.80 m/s 136%
48%
0.99
40
E3 Calm hours
1 < 1.54 m/s
3.09- 5.14 mfc
• 5.14-8.23 mfe
8.23-10.80 m/s
0.95
0.99 101%
606% 0.99
43%
7-26-2001 Ankeny 1
0%
0.97
0.93 511%
37%
0.99 m Calm hours
81 « 1.54 m/s
H 1.54 - 3.09 m/s
7-26-2001 Ankeny 2
0.99
3.09 - 5.14 m/S
5.14-8.23 m/s
5.23-10.80 m/s
0.92 953% •o
(33 Calm hours
| « 1.54 m/s
I 1.54- 3.09m/s
• 3.09.
• 5.14-
• 8.23 •
5.14 m/s
8.23 m/s
10.80 m/s
0.76
0.99 355%
0.75
0%
7-25-2001 Ankeny 1
0.74 681%
0.54
• <
• <
0.93 832% 0.99
202%
Figure 4b. Windroses describing winds for 5 location-days during July 2001. Values presented between 0.0-0.99 are the correlation between measured and model simulated pollen deposition. Percent values are ratios of total modeled pollen deposition divided by measured pollen deposition, presented by transect.
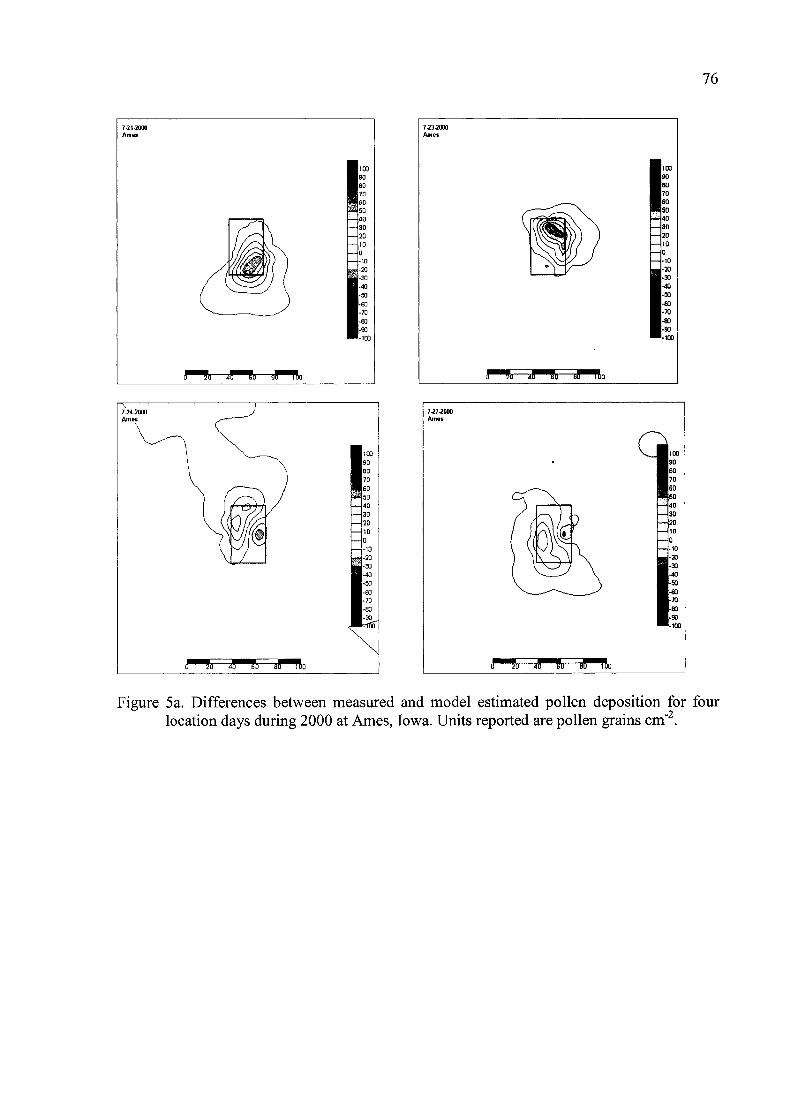
76
723.2000 7-21-2000
7 -27 -2000 7-24-2000
Figure 5a. Differences between measured and model estimated pollen deposition for four location days during 2000 at Ames, Iowa. Units reported are pollen grains cm"2.

Figure 5b. Differences between measured and model estimated pollen deposition for five location days during 2001 at Ames, Iowa and Ankeny, Iowa. Units reported are pollen grains cm"2.
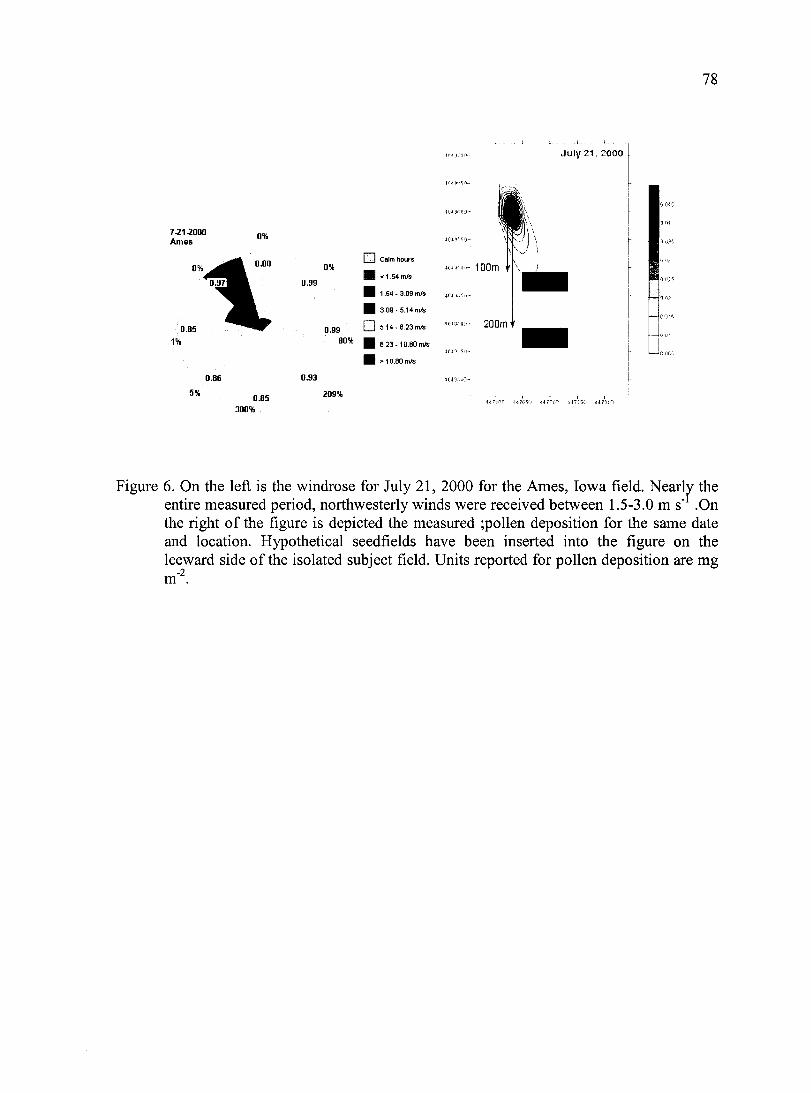
78
July 21. 2000
7-21-2000 Ames
d) Calm hours
200m
209%
Figure 6. On the left is the windrose for July 21, 2000 for the Ames, Iowa field. Nearly the entire measured period, northwesterly winds were received between 1.5-3.0 m s" .On the right of the figure is depicted the measured ;pollen deposition for the same date and location. Hypothetical seedfields have been inserted into the figure on the leeward side of the isolated subject field. Units reported for pollen deposition are mg m"2.

79
J u l y 2 1 , 2 0 0 0
49.1 MO-
4349550
48493C0-
1S19150-
4643400-
100m '«
200m f
:
id COS'S
|h i;(i:-.h
0C075
0C065
0 C065
0(045
"jOXO.M
-0Ç0JU
'UC015
-prnnn
4)4 9 Hi
1 ; 1 ' 1 «47*00 417650 <W7?W 447750 147-30]
Figure 7. Graphical representation of model output when When July 21, 2000 wind speed was quadrupled to 6-12 m s"1. The model estimated pollen would travel approximately 210 m down wind. Schematic depictions of seed fields have been inserted 100 m and 200 m downwind. Units reported for pollen deposition are mg m"2.

80
4f4970n- July 21, 2000
4f49G50-
4H9600-
4C4S*.ni:i- 100m T
«•113-iori 200 m1
4(49)50-
4(49300-
1(1 04 Î
III OS'j
ooaî
ijT&X 34T6S0 4477(0 147750 44T3CQ
Figure 8. Pollen shed density effects on the distance pollen travels. Data displayed illustrate July 21, 2000 measured pollen deposition. Units reported for pollen deposition are mg m"2.

81
4&49700
I I
July 21, 2000
46:9650-
46&9640-
4649540-
46*9450-
lÔiyqJO-
100m i*.
200m i'
l a ID iy Id i s j o 1 7
|) 16 16 | M
h I *• |j 12
5 11 ) 1 ) 09 » 08
07 nr. I'-
(W i.'
();:• 101
44.'*nn
Figure 9. Representation of model output when pollen shed density was increased 3X. Data displayed illustrates 3X July 21, 2000 pollen shed density. Note that pollen shed density affects the distance pollen travels; in this case well beyond 150 m for the same wind conditions as in Fig 8. Units reported for pollen deposition are mg m"2.

82
CHAPTER 4. GENERAL CONCLUSIONS
General Discussion
Biological engineering has placed increased pressure on the seed production industry
to provide genetically pure seed. Past success can't be depended upon to provide the level of
genetic purity the market is demanding today.
This project laid the groundwork for confirming anecdotal evidence as well as
identified new findings - such as the relative unimportance of high numbers of border rows
surrounding seed fields when compared with the increased importance of isolation distance
to insuring seed purity. Anecdotally in the past, there has been industry-wide acceptance that
decreasing isolation distance was compensated for by increasing border-row number. Our
study did not confirm this.
Additionally, we must continually improve our understanding of how to achieve
higher levels of genetic purity to meet the next levels of customer expectation. To improve
our understanding of how to achieve this goal, we must understand what practices
contributed to our past success and which are likely to provide assistance in reaching new,
higher goals of seed purity. Increased isolation distance and seed field size as well as
removing the field margin all increased the probability of reaching 99% or greater seed field
purity.
Secondly, we must increase our understanding of micro-meteorological influence on
pollen travel surrounding seed fields as well as potential adventitious sources. Through
further measurement and model development, advanced modeling will be able to provide risk
assessment. While the model evaluated in this project didn't provide the level of accuracy

83
needed currently, it did provide concrete examples of the challenges that lie ahead and
further define potential areas where modeling will provide critical information to seed
industry personnel.
The complexity of extra-field pollen travel was clear from the numerous location day
model estimations compared to measured values. Modeling will provide the ability to
evaluate several scenarios combining different source and seed field sizes as well as
geospatial arrangements. Risk evaluation will allow seed producers to understand what
measures provide them the needed level of purity for specific products and what costs will
likely be associated with employing those practices.
RECOMMENDATIONS FOR FUTURE RESEARCH
The seed industry needs to continue to evaluate isolation practices in light of
increased market place demands. Further economic analysis of practices associated with
highly genetically pure seed must continue. The market place must improve their
understanding of the costs associated with their desires. It is likely that the seed production
industry has not fully passed along these increased seed costs to the primary user of the seed.
Furthermore, the commercial grain producer is also much more likely to be drawn into this
vortex of seed purity by end-users; these all exhibit wide areas of further research
opportunity.
Improving our ability to measure the influence of biological, meteorological and
geospatial effects on producing seed merits significant attention. Inter-field pollen travel
must be better understood. While maize seed set biology has recently been investigated

84
further understanding of how pollen travels within the field is needed to increase our
comprehension of extra-field pollen emission (Lizaso, et al., 2003; Westgate, et al., 2003).
Further modeling work is needed and indeed is being accomplished regarding maize
pollen travel within the environment. Treating pollen grains as individual particles with
random nature should improve the accuracy of modeling attempts compared to Guassian
assumption-based models such as the ISCST3 model. The Lagrangian-based approach is
being evaluated currently using this project's measured pollen data from nine location days.
Further investigation is required to optimize currently developing models as well as identify
new approaches that will increase model accuracy.
REFERENCES
Lizaso, J.I., M.E. Westgate, W.D. Batchelor, and A.E. Fonseca. 2003. Predicting Potential
Kernel Set in Maize From Simple Flowering Characteristics. Crop Sci. 43:892-903.
Westgate, M.E., J. Lizaso, and W.D. Batchelor. 2003. Quantitative relationships between
pollen shed density and grain yield in maize (Zea mays L.). Crop Sci. 43:934-942.
85
APPENDIX A
Inter-Industry Isolation Study Data Set
1998

State Year Block Size Size
Seed Field Size Isol Dist
Border Margin OC Value
Point OC Value Long
Algona 1A 1998 SMALL SMALL LARGE 1.00 1.00 -94.4357
Algona IA 1996 SMALL LARGE LARGE 1.00 0.00 43.2657 -94.3692
Durant IA 1998 LARGE LARGE SMALL LARGE SMALL 0.25 0.00
Durant IA 1998 LARGE SMALL SMALL LARGE SMALL 2.00 2.00
Durant IA 1998 LARGE LARGE SMALL LARGE LARGE 0.75 0.00
Durant IA 1998 SMALL SMALL SMALL LARGE SMALL 0.50 0.00
Durant IA 1998 LARGE LARGE LARGE LARGE SMALL 0.00 0.00
Hedrick IA 1998 LARGE SMALL LARGE LARGE SMALL 0.25 1.00
Hedrick IA 1998 LARGE SMALL SMALL LARGE SMALL 0.25 0.00
Hedrick IA 1998 SMALL SMALL SMALL LARGE SMALL 1.00 4.00
Mt. Pleasant IA 1998 LARGE LARGE LARGE LARGE SMALL 0.75 0.00 41.0766 -91 0014
Mt. Pleasant IA 1998 LARGE LARGE SMALL LARGE LARGE 0.25 0.00 41.1003 -91.0346
Mt. Pleasant IA 1998 LARGE LARGE SMALL LARGE SMALL 0.00 3.00 41.1003 -91.0346
Mt. Pleasant IA 1998 SMALL SMALL SMALL LARGE SMALL 0.25 1.00 41.1058 -91.0345
Mt. Pleasant IA 1998 SMALL SMALL SMALL LARGE SMALL 0.00 0.00 41.1058 -91.0345
Mt. Pleasant IA 1998 SMALL LARGE LARGE LARGE SMALL 4.25 3.00 41.0082 -90.9754
Mt. Pleasant IA 1998 LARGE LARGE LARGE LARGE SMALL 0.75 0.00 41.0627 -91.0281
Mt. Pleasant IA 1998 LARGE LARGE LARGE LARGE SMALL 1.25 0.00 41.0568 -91.028
Mt. Pleasant IA 1998 LARGE LARGE LARGE LARGE SMALL 0.25 3.00 41.0568 -91.028
Mt Pleasant IA 1998 LARGE LARGE LARGE LARGE SMALL 0.25 0.00 41.0702 -90.9907
Mt. Pleasant IA 1998 LARGE LARGE SMALL LARGE SMALL 0.75 0.00 41.0756 -90.9819
Mt. Pleasant IA 1998 LARGE LARGE LARGE LARGE LARGE 3.00 3.00 40.9822 -91.0138
Reinbeck IA 1998 SMALL SMALL SMALL LARGE SMALL 0.67 0.00
Reinbeck IA 1998 SMALL SMALL LARGE LARGE SMALL 0.75 2.00
Reinbeck IA 1998 SMALL SMALL LARGE LARGE SMALL 0.67 0.00
Toledo IA 1998 SMALL LARGE LARGE SMALL 0.75 0.00 42.1331 -92.5092
Toledo 1998 SMALL LARGE LARGE SMALL 0.50 0.00 42.1331 -92.5092
Toledo 1998 SMALL SMALL LARGE SMALL 0.75 0.00 42.1776 -92.7331
Toledo 1998 SMALL SMALL LARGE SMALL 2.25 1.00 42.2017 -92.8014
Toledo IA 1998 SMALL LARGE LARGE SMALL 1.00 2.00 42.1272 -92.5451
Toledo IA 1998 SMALL LARGE LARGE SMALL 0.50 0.00 41.9883 -93.43
Toledo IA 1998 SMALL LARGE LARGE SMALL 0.50 0.00 41.9883 -93.43
Toledo IA 1998 SMALL LARGE LARGE SMALL 0.50 1.00 42 04 -93.4349
Toledo IA 1998 SMALL LARGE LARGE SMALL 2.50 0.00 42.04 -93.4349
Princeton 1998 LARGE LARGE SMALL LARGE 0.25 0.00
Princeton IL 1998 SMALL LARGE SMALL LARGE 0.50 0.00
Princeton IL 1998 SMALL LARGE SMALL LARGE 1.75 1.00
Princeton IL 1998 SMALL LARGE SMALL LARGE 2.25 1.00
Princeton IL 1998 SMALL SMALL SMALL LARGE 1.25 0.00
Princeton IL 1998 LARGE LARGE SMALL LARGE 0.25 0.00
Princeton IL 1998 SMALL SMALL LARGE SMALL 0.50 0.00
Princeton IL 1998 SMALL LARGE SMALL 0.50 2.00
Princeton IL 1998 LARGE SMALL LARGE 3.00 1.00 41.5966 -89.1044
St Joseph IL 1998 SMALL LARGE SMALL LARGE SMALL 0.50 0.00
St. Joseph IL 1998 LARGE LARGE LARGE SMALL SMALL 0.33 0.00 40.1328 -88.6808
Rushville 1998 LARGE SMALL SMALL LARGE SMALL 1.00 000
Rushviile 1998 SMALL SMALL LARGE SMALL 0.75 0.00
Rushville 1998 SMALL SMALL LARGE SMALL 0.75 0 00
Tipton 1998 LARGE SMALL LARGE SMALL 0.75 1.00
Tipton 1998 SMALL SMALL LARGE SMALL 0.75 0.00
Tipton 1998 SMALL SMALL LARGE SMALL 0.00 1 00
Constantine 1998 LARGE LARGE SMALL 1.00 0.00
Seed Field
Pollinator Class
Femaie:Ma ie Parent
Ratio Source
Number
Row Orient to Block Size
Seed Field Dist Source Size
Pollinator Population
Previous Crop
GOOD 4:1 0.25 W PAR 45 45 330 28100
GOOD 4:1 0.25 W 6 PER P 149 134 330 30900
FAIR 6:1:4:1 0.21 E 6 PAR 225 71 330 160 27400
FAIR 6:1:4:1 0.21 W 6 PAR 225 71 330 80 27400
FAIR 6:1 0.17 W 12 PERP 208 87 330 120 36600
GOOD 6:1-4:1 0.21 w 4 PAR 154 100 388 80 33800
POOR 6:1:4:1 0.21 E 6 PAR 423 360 330 160 40000
POOR 6:1:4:1 0.21 N 6 PERP 743 151 330 60 45000 soy
GOOD 6:1:4:1 0.21 S 6 PER P 232 76 330 80 13000 soy
GOOD 4:1 IP 0.25 NW 6 PERP 80 70 330 80 22000 soy
POOR 6:1:4:1 0.21 W 6 PAR 579 130 330 100 44090 seed
GOOD 6:1:4:1 0.21 E 12 PERP 400 48 330 100 25800 seed
GOOD 6:1:4:1 0.21 S 6 PERP 400 48 330 100 25800 seed
GOOD 6:1:4:1 0.21 E 6 PAR 150 102 330 50 33000 seed
GOOD 6:1:4:1 0.21 W 6 PAR 150 102 330 50 33000 seed
POOR 4:1 0.25 w 6 PAR 131 131 330 100 46833 eomcorn
POOR 6:1:4:1 0.21 w 6 PERP 313 110 330 100 41550 comcorn
POOR 6:1:4:1 0.21 S 6 PAR 313 203 330 100 47450 eomcorn
POOR 6:1:4:1 0.21 w 6 PERP 313 203 330 100 47450 comcorn
POOR 6:1:4:1 0.21 E 8 PERP 442 123 330 100 49545 seed
POOR 6:1:4:1 0.21 S 6 PAR 422 52 330 100 46500 seed
FAIR 6:1:4:1 0.21 w 12 PERP 378 192 330 100 35071 seed
GOOD 4:1 0.25 E 6 PAR 54 54 440 45 30000 soy
FAIR 4:1 IP 0.25 N 6 PERP 178 178 330 20 29000 soy
GOOD 6:1:4:1 0.21 W 2 PAR 108 108 365 40 28000 soy
FAIR 4:1 0.25 E 6 PERP 112 375 40 27000 soy
FAIR 4:1 0.25 S 6 PERP 112 330 80 27000 soy
GOOD 4:1 0.25 S 6 PAR 67 330 80 29000 soy
GOOD 4:1 0.25 S 6 PERP 54 330 80 29000 soy
FAIR 4:1 0.25 s 6 PERP 153 330 60 26000 soy
GOOD 4:1 0.25 N 6 PAR 169 330 80 29833 soy
GOOD 4:1 0.25 S 6 PAR 169 330 80 29833 soy
FAIR 4:1 0.25 N 6 PAR 180 330 40 26666 soy
FAIR 4:1 0.25 S 6 PAR 180 330 30 26666
GOOD 6:1 0.17 S 14 PERP 112 200 100 22000 seed
GOOD 6:1 0.17 W 14 PAR 112 200 20 22000 seed
GOOD 6:1 0.17 E 14 PAR 112 200 12 22000
FAIR 4:1 0.25 S 14 PERP 114 101 20 29800 seed
FAIR 4:1 0.25 S PAR 89 165 50 32300 seed
FAIR 4:1 0.25 s 14 PERP 141 165 100 27500 seed
FAIR 4:1 0.25 w 6 PAR 59 315 50 36500 seed
POOR 4:1 0.25 NE PAR 124 40 50 soy
POOR 4:1 0.25 N PERP 458 458 0 20 soy
POOR 4:1 0.25 W 1 PAR 126 68 495 200 37300
GOOD 4:1 0.25 E 6 PER P 292 292 70 200 39400
GOOD 4:1 0.25 W 6 PER P 368 76 330 55 15000 soy
POOR 4:1 0.25 S 6 PERP 569 59 330 30 10000
POOR 4:1 0 25 s 6 PERP 97 97 330 30 20000 soy
GOOD 6:1:4:1 0.21 w 6 PAR 18 330 120 32800 soy
GOOD 4:1 0.25 s 6 PERP 32 400 40 43600 soy
GOOD 0.25 s 6 PERP 70 330 40 soy
FAIR 0.25 E PERP 1442 130 150

Nearest Town State Year Block Size Size
Seed Field Size Isol Dist Row#
Margin OC Value
OC Value Lat Long
Constantine Ml 1998 LARGE SMALL SMALL SMALL SMALL 2.50 1.00
Doniphan NE 1998 LARGE LARGE LARGE SMALL LARGE 1.00 0.00 40.7092 -98.1639
Doniphan NE 1998 LARGE SMALL SMALL SMALL LARGE 3.00 2.00 40.7745 -98.3928
Doniphan NE 1998 LARGE SMALL SMALL SMALL LARGE 0.67 2.00 41.0643 -98.2353
Doniphan NE 1998 LARGE SMALL SMALL SMALL LARGE 0.50 1.00 41.057 -98.2278
York NE 1998 LARGE SMALL LARGE SMALL LARGE 0.25 0.00
York NE 1998 LARGE LARGE LARGE SMALL LARGE 1.50 3.00 -97.3835
York NE 1998 LARGE LARGE SMALL SMALL LARGE 3.25 1.00 -97.1539
Seed Field
Class
Female: Ma le Parent
Ratio Orient Number
Row Orient to Seed Field isol.
Dist Source Size Pollinator Population
PrevkMj Crop
FAIR 0.25 S 0 601 89 150 30
FAIR 0.25 N 14 PERP 400 146 165 160 22000
GOOD 0.25 W PAR 320 71 165 80 30000 seed
FAIR 0.25 w PAR 400 63 175 80 34000 seed
FAIR 4:1 0.25 E 14 PAR 400 64 175 80 34000 seed
FAIR 4:1 IP 0.25 W 14 PAR 699 120 165 40 28000 seed
GOOD 6:1:4:1 0.21 E 14 PAR 321 321 165 160 31000 seed
FAIR 4:1 IP 0.25 W PERP 310 90 165 160 28500 seed
OO <1
88
APPENDIX A
Inter-Industry Isolation Study Data Set
1999

Sock Size tee"
Seed field Size Fsoi Dist
Margin OC Value
Mid-Point OC Value Long
Algona 1999 SMALL SMALL LARGE 0.00 -93.8235
Algona 1999 SMALL LARGE SMALL LARGE 0.00 -93.8235
Algona 1999 LARGE SMALL LARGE 0.00 -93.8235
Algona 1999 SMALL LARGE LARGE 0.00 0.00
Algona 1999 SMALL LARGE LARGE 1.25 0.00
Algona SMALL LARGE LARGE 0.00 -93.8077
Algona LARGE LARGE -93 8077
Algona SMALL LARGE -93.8622
Algona LARGE SMALL SMALL 1.00
Algona 1999 SMALL SMALL 0.75 0.00
Algona 1999 SMALL SMALL SMALL 0.00 0.00 43.2451
Algona 1999 SMALL SMALL LARGE SMALL 0.00 43.2451
Durant 1999 LARGE LARGE LARGE SMALL 0.50 41.7387
Durant 1999 LARGE LARGE SMALL LARGE LARGE o.oo -90.9109
Durant 1999 SMALL LARGE SMALL 0.00 41.9213
Durait LARGE SMALL LARGE 0.00 41.9215 -91.1569
Durait LARGE LARGE LARGE 41.9213 -91.1372
Durant LARGE LARGE 41.9213 -91.1372
Durant LARGE LARGE
Marengo LARGE
Marengo LARGE
Marengo 0.00
Marengo LARGE 4.00
Marengo LARGE LARGE LARGE SMALL 3.00
Marengo LARGE SMALL LARGE LARGE SMALL 1.00
Mt Pleasant LARGE SMALL LARGE SMALL 0.00
Mt Pleasant LARGE LARGE 0.00 -90.9804
Mt Pleasant LARGE SMALL SMALL 2.00 -91.0015
Mt Pleasant LARGE SMALL SMALL SMALL 0.00 41.07 -91.0015
Mt Pleasant LARGE SMALL LARGE LARGE 41.0654 -90.9941
Mt Pleasant SMALL LARGE LARGE LARGE 0.00 41.0392 -91.0121
Mt Pleasant LARGE LARGE LARGE
Reinbeck 1999 SMALL LARGE LARGE SMALL -92.5874
Reinbeck 1999 SMALL SMALL SMALL LARGE SMALL -92.5802
Reinbeck 1999 SMALL LARGE LARGE LARGE o.oo -92.4116
Reinbeck LARGE SMALL SMALL 5.25 13.00 42.2649 -92.5773
Reèfceck SMALL LARGE SMALL 1.00 0.00 42.272 -92.485
Reinbeck 1999 LARGE LARGE SMALL 9.00 2.00 42.2888 -92.382
Reinbeck 1999 LARGE SMALL SMALL 1.25 000 42.2861 -92.3721
Reinbeck 1999 SMALL LARGE SMALL LARGE SMALL 2.75 42.3076 -92.7057
Reinbeck 1999 LARGE LARGE LARGE LARGE SMALL 2.25 1 00 42.3802 -92.6563
Reinbeck 1999 SMALL SMALL LARGE SMALL 1.25 1.00 42.3779 -92 8024
Reinbeck LARGE 0.00 -92.7829
Toledo LARGE 0.75 1 00 -92.8897
Toledo SMALL LARGE SMALL 6.25 5.00 42.1249 -92.5191
Toledo LARGE SMALL SMALL 7.50 1.00 42.1249 -92.5191
Toledo 1999 LARGE LARGE SMALL 0 00 42.2052 -92.9384
Princeton 1999 LARGE SMALL LARGE 1.50 1.00 41.6607 -89.9662
Princeton 1999 LARGE LARGE 0.00 -89.8325
Princeton LARGE SMALL 000 -89.6609
Princeton LARGE 41.8792
Princeton LARGE LARGE 000 41.5923
Princeton LARGE LARGE LARGE 41.3695
St Joseph LARGE LARGE LARGE 300 39.9345
St. Joseph 1999 SMALL 0.00 40.1328 -88.6808
St Joseph 1999 0.00 40.4624 -87.6223
Pol- Hnator Maie Parent Class Pattern Number
Seed Field Row Orientation to Advent Source isol Dist Size
Pollinator Population
GOOD 6:1:4:1 6 PERP 330 160 31000
GOOD 6:1:4:1 PERP 182 330 160 31000
GOOD 6 PERP 182 330 160 31000
GOOD 6:1:4:1 0.21 S 6 PERP 182 99 330 160 31000
0.25 E 39 330 160 33000
0.25 E 6 PAR 95 330 160 32000 soy
0.25 S PERP 330 160 32000 soy
0.21 6 PERP 330 40 32000 soy
0.25 E PAR 99 330 160 soy
GOOD 0.25 E 6 PAR 74 330 160 30000 soy
GOOD 0.25 S 6 PERP 74 330 160 30000 soy
GOOD 0.25 W PAR 330 160 30000 soy
1 0.21 PERP 663 555 40 12000
1 0.21 S PERP 663 330 85 11000
GOOD 1 0.21 E PERP 463 330 17000
GOOD 6 1 021 S PAR 330 55 15000
GOOD 6 1 0.21 6 PERP 463 330 155 14000 soy
GOOD 6 1 0.21 PERP 463 330 40 14000 soy
GOOD 6 1 0.21 120 330 85 33800 soy
GOOD 6 1 0.21 PAR 258 330 90 33000 soy
1 PERP 354 330 160 33000 soy
1 PERP 354 330 160 32400 soy
1 360 330 160 soy
1 0.21 400 330 160 33450
1 0.21 400 330 80
1 0.21 447 330 28900 soy
GOOD 6 1 253 380 29800 seed
POOR 6 1 0.21 724 32100 seed
POOR 6 1 0.21 724 101 seed
POOR 6 1 0.21 PERP 724 108 33400 seed
GOOD 6 1 0.21 PAR 172 172 552 31900 seed
GOOD 6 1 0.21 PERP 139 330 60 seed
POOR 6 1 0.21 E PERP 109 330 80 soy
POOR 6 1 0.21 E PAR 201 46 330 80 soy
GOOD 0.25 W 12 PERP 59 330 soy
GOOD 0.17 E 6 PAR 90 330 120
FAIR 6 0.21 W 8 PAR 115 330 100
POOR 6 0.21 W PAR 225 330 160 soy
POOR 0.25 S 8 PAR 225 330 100 soy
GOOD 6 0.21 w PERP 86 160
POOR 6:1.4:1 0.21 PAR 220 160
GOOD 0.25 10 PERP 58 80 33300 soy
GOOD 017 E PAR 75 30 26800 soy
0.25 E PERP 333 201 140 28000
0.25 E PAR 316 52 100 31000
0.25 S 6 PERP 52 60 soy
PERP 206 160 soy
0.25 PAR 503 204 78 seed
0.25 S PAR 453 199 18500 seed
0.25 S PERP 75 17375 seed
025 w PAR 80 28000 soy
0.25 s PERP 377 225 seed
POOR 0.25 w 6 PERP 330 140 16650
0.25 400 160 32000 soy
GOOD 0.25 6 PAR 141 330 150 32000 seed
GOOD 0.25 S 14 PAR 608 200 34000

Year Block
Size
Seed Field Margin OC
Value Mid-Point OC Value Long
Plymouth 1999 SMALL 2.50 -87.1258
Plymouth SMALL LARGE 11.75
Plymouth LARGE SMALL LARGE LARGE 7.00 -86.2721
Plymouth SMALL LARGE LARGE 3.25 000 -86.2395
Plymouth LARGE LARGE LARGE LARGE 1.25 2.00 41.263 -86.0995
Plymouth SMALL LARGE 2.00 0.00 41.3512
Plymouth LARGE SMALL LARGE 2.50 41.3512 -85.8366
Plymouth LARGE LARGE LARGE 1.00 -85.8368
Plymouth LARGE SMALL LARGE SMALL -85.9691
Rushville LARGE SMALL LARGE SMALL -85.9477
Rushvifle LARGE SMALL SMALL LARGE 6.75 39.3295 -85.956
Rushvie 1999 SMALL LARGE 2.00 39.4017
Tipton 1999 LARGE SMALL LARGE 0.00
Upton 1999 LARGE SMALL LARGE SMALL 0.25
Tipton SMALL SMALL SMALL SMALL 7.50
Tipton SMALL LARGE SMALL LARGE SMALL 9.00
Tipton LARGE LARGE SMALL LARGE 0.75
Tipton SMALL SMALL LARGE 1.50
Tipton LARGE SMALL LARGE
Tipton LARGE LARGE LARGE
Tipton SMALL LARGE LARGE 0.50
Tipton LARGE LARGE LARGE 0.75 0.00
Tipton SMALL LARGE 2.50 2.00
Worthington LARGE SMALL 0.00 000 38.7404
Worthington LARGE LARGE LARGE 4.75 38.7357
Worthington SMALL SMALL SMALL 2.50 38.885
Doniphan LARGE LARGE 0.50 41.0426
Doniphan LARGE SMALL 0.25 41.0426 -98.2205
Doniphan LARGE LARGE SMALL LARGE -98.166
Doniphan LARGE LARGE SMALL LARGE -98.1397
Marquette LARGE LARGE LARGE 2.25
York SMALL LARGE LARGE 0.00 -97.4586
York 1999 LARGE SMALL SMALL LARGE 2.25 -97.3637
1999 LARGE LARGE LARGE LARGE 40.9086 -97 4206
1999 SMALL LARGE 0.00 40.6167
Sioux Fails SD LARGE LARGE LARGE SMALL 1.00 200
Sioux Falls SO SMALL LARGE SMALL LARGE 2.00 2.00
Sioux Falls SD LARGE LARGE LARGE LARGE 0.25
ol- Ifnator Male Parent Class Pattern Number
Seed Field Row Orientation to Advent Source ^7" Isol Dlst IT PolMnator
Population Crop
S 14 255 25
S 14 290 50
FAIR 0.25 s 14 280 280 seed
GOOD 0.25 s 14 190 190 165 soy
GOOD 0.25 S 14 330 131 165 soy
0.25 S 14 PAR 690 165 seed
E 14 PERP 690 seed
0.25 14 PAR 690 seed
0.25 S 6 PERP 405 seed
POOR 0.25 s 6 PAR 562 32500 seed
POOR 0.25 w 6 25000 seed
GOOD 0.21 6 497 25000
GOOD 0.25 N 6 330 27000 soy
GOOD 0.25 E PAR 181 250 28000 soy
0,21 W PERP 100 28000 soy
GOOD PAR 143 263 27000
FAIR 820 330 28000 soy
FAIR 0.25 820 330 28000 soy
0.21 W 6 PERP 222 330 soy
0.21 E 6 PERP 1545 330 soy
0.25 W 6 PAR 120 330 28000 soy
0.25 PERP 322 330 10000 soy
PERP 270 28000 soy
PERP 165 20000 soy
W 14 PAR 165 27000 soy
E 6 101 330 30000 comcom
0,25 S 14 260 165 34000 comcom
0.25 S PERP 260 165 125 34000 comcom
025 w PER P 500 165 160 30000 seed
0.25 E PERP 500 165 320 26000 comcom
W 1000 36000 seed
GOOD 1 0.21 s 193 132 32000 seed
FAIR 1 0.21 s 400 55 165 80 seed
POOR 4:1:6 1 0.21 E 230 112 165 160 24000
POOR 4:1:6 1 0.21 W 630 165 40 21000
FAIR 6:1:4 1 0.21 227 600 120 33000 soy
FAIR 6:1:4 1 0.21 129 160
FAIR 1 0.21 soy
\o o

91
APPENDIX A
Inter-Industry Isolation Study Data Set
2000

Source Size OC Value
Atgona SMALL LARGE SMALL 0.50 43.1087 -94.3986 GOOD
Algona LARGE LARGE SMALL 43.1156 -94.1779 FAIR
41.79746050 90.42299590
41.79746050 90.42299590
41.67106300 9055072940
41.87106300 90.55072940
41.66571100 90.55175940
41,66571100 90.55175940
41.72435550 90.58544390
41 87464200 90.59959590
4163454600 90.62845290
4183454800 90.62845290
41.88564600 90.63081090
41.88564800 90.63081090
41.84204400 90.68213590
41.85475450 90.66392840
41.85464050 90.66706490
41.84746100 90.71276790
41.83210150 90.73592240
41.83210150 90.73592240
92.910181
92.807265
92.807265
Marengo
Marengo
Mt. Pleasant
41.45573660 91.38020940
River Junction 41.47051350 91.38409290
River Junction 41.46569550 91.41349040
River Junction 41.49788750 91.42054590
River Junction 41.46357200 91 44111390
Advent Seed Field Row Source Border Row Orientation to Block Orient Number Advent Source Size
Field Advent Pollinator Size I sol Dist Source Size Population
07/12/CO
07/13/00
07/1 MM
07/1*00
07/21/00
07/12/00
07/12130
07/15/00
07/15/00
07/12/00
07/15/00
07/15/00
07/15/00
07/21/00
07/17/00
07/21/00
07/21/00
07/21/00
07/21/00
07/2800
07/31/00
07/21/00
07/21/00
07/23/00
07/19/00
07/31/00
07/15/00
07/11/00
07/10/00
07/10/00
07/28/00
07/20/00
07/18/00
07/28/00
07/17/00
07/18/00
07/24/00
to

Seed Field ocvL
Sheffield 2000 SMALL LARGE SMALL LARGE 42.618730 93203954 GOOD
Sheffield 42.632957 33.182944
41.35413900 91.35483990
Wellsburg 93.016383
Goodhope
Goodhope
Princeton
Princeton
Princeton
Princeton
Princeton
Princeton
Rock Fate
Walnut
KendaBvilfe
Kendallvtile
KendaBviHe
Plymouth
Plymouth
Plymouth
Plymouth
Plymouth
Rushvffle
Rushville
Rush ville
RushvMIe
Rushvitle
Rush vile
RushviHe
Worth sigton
Constantine
Constantino D3204W
Constandne
Constant**
Bear Valley
Bear Valley
New Sweden
New Sweden
N40 50.83V W098 05.564'
N4051688' W098 02 149
N40 51.6881 W098 02.149-
N40 52 345 W096 09.290-
N40 52 37CT W098 10.420r
N40 52370- W096 10.42ff
Male Male: Parent Female Pattern Ratio
2% Border Row Seed Field Row Orientation to Advent Source Isol Diet Source Size
Pollinator Population
Previous S% Silk Date 95% Silk Da
07/13/00 07/19^00
07/15/00 07/22/00
07/10/00 07/16/00
07/21/00 07/31/00
07/13/00 07/19/00
07/15/00 07/20/00
W 07/25/00 07/31/00
E 07/17/00 07/22/00
07/17/00 07/24/G0
07/14/00
08/01/00 08*04/00
07/25/00
30000
4:1:6:1 0.21
4:1:6:1 0.21
07/18/00
07/19/00
07/19/00
07/24/00 06/01/00
07/28/00
07/28/00
07/18/00
07/26/00 08/02/00
07/26/00 08/02/00
07/10/00
07/2000
07/1800

Source Size Row#1
OC Pol-
5: '"MO" Border Row
Seed Field Row Orientation to Advent Source isoi Dist Source Size
Pollinator Population
Previous 5% Silk Date 95% Silk Da
Aurora LARGE LARGE SMALL LARGE 0.00 N40 53.847" W096 08.420" FAIR 17 32060 7/15/00 07/22/00
Aurora SMALL LARGE SMALL LARGE N40 54.968" W097 57.950" FAIR 12 29460 7/12/00 07/18/00
N40 55.365" W096 05.560" 07/24/00 06/01/00
07/19/00
07/14/00 07/18/00
Doniphan
Doniphan
Doniphan
Doniphan
Doniphan
Doniphan
Doniphan
Doniphan
Doniphan
Doniphan
Doniphan
Doniphan
Doniphan N41 -15.89 W97-20.92
N41-22.78 W96-39.72 07/20/00
N41-23.59 W96-33.77
N41-30.20 W96-31.30 07/18AM
0.50
Chatham Ontario, Canz 2000 LARGE SMALL 0.00 3:1:2:1:2:1 6 27000
Chatham Ontario, Car# 2000 LARGE LARGE 0.00 0.00 3:1:2:1:2:1 0.43 12 56 27000
s

APPENDIX B
Pollen Deposition Data Set
2000-2001

96
2000 Ames, Iowa Isolation Plot Deposition Values by Trap Location
07/21/00 07/23/00 7/24/2000 7/27/2000 gr/cm2 gr/cm2 gr/cm2 gr/cm2
c Field 89.0 C Field 234.0 C Field 312.0 C Field 289.0 E Field 51.0 E Field 162.0 E Field 162.0 E Field 316.0 E 5 26.0 E 5 64.8 E 5 46.4 E 5 60.8 E 10 16.4 E 10 E 10 10.7 E 10 20.4 E 30 4.8 E 30 8.0 E 30 0.8 E 30 4.0 E 90 2.4 E 90 1.3 E 90 1.6 E 90 4.0 E 165 1.6 E 165 1.3 E 165 2.4 E 165 2.0 E 330 0.8 E 330 3.6 E 330 0.4 E 330 1.2 E 660 E 660 4.4 E 660 E 660 N Field 19.0 N Field 147.0 N Field 247.0 N Field 226.0 N 5 0.6 N 5 27.2 N 5 61.2 N 5 9.2 N 10 0.8 N 10 17.6 N 10 44.4 N 10 6.0 N 30 1.2 N 30 13.6 N 30 16.4 N 30 3.2 N 90 0.0 N 90 10.0 N 90 6.4 N 90 1.8 N 165 0.0 N 165 1.6 N 165 4.4 N 165 0.0 N 330 1.0 N 330 1.6 N 330 0.8 N 330 3.6 N 660 N 660 N 660 N 660 NE Field 3.0 NE Field 147.0 NE Field 248.0 NE Field 391.0 NE 5 1.6 NE 5 33.2 NE 5 16.9 NE 5 12.5 NE 10 0.0 NE 10 19.8 NE 10 5.6 NE 10 14.9 NE 30 0.0 NE 30 6.0 NE 30 3.6 NE 30 8.8 NE 90 0.5 NE 90 4.4 NE 90 2.4 NE 90 5.6 NE 165 0.0 NE 165 1.6 NE 165 1.2 NE 165 6.0 NE 330 0.0 NE 330 2.0 NE 330 1.6 NE 330 11.6 NE 660 1.2 NE 660 2.4 NE 660 0.8 NE 660 NW Field 8.0 NW Field 15.0 NW Field 56.0 NW Field 85.0 NW 5 3.6 NW 5 4.4 NW 5 12.4 NW 5 14.0 NW 10 0.8 NW 10 4.0 NW 10 5.2 NW 10 6.8 NW 30 0.4 NW 30 1.3 NW 30 2.0 NW 30 3.6 NW 165 NW 165 0.4 NW 165 0.4 NW 165 1.3 NW 330 NW 330 5.3 NW 330 0.0 NW 330 2.0 NW 660 NW 660 NW 660 NW 660 S Field 13.0 S Field 113.0 S Field 230.0 S Field 341.0 S 5 26 * S 5 14.8 S 5 4.0 S 5 77.8 s 10 15.0 S 10 2.2 S 10 2.0 S 10 50.0 s 30 4.8 S 30 S 30 1.6 S 30 6.8 s 90 2.7 S 90 2.4 S 90 1.5 S 90 2.4 s 165 2.4 S 165 0.4 S 165 1.6 S 165 2.8 s 330 2.4 S 330 2.8 S 330 1.2 S 330 0.0 s 660 S 660 2.0 S 660 1.6 S 660 SE Field 46.0 SE Field 113.0 SE Field 236.0 SE Field 391.0 SE 5 14.5 SE 5 25.6 SE 5 8.4 SE 5 15.2 SE 10 8.8 S E 10 18.8 SE 10 3.2 SE 10 11.2 SE 30 4.4 SE 30 2.4 SE 30 1.2 SE 30 1.6 SE 90 4.8 SE 90 SE 90 1.8 SE 90 0.4 SE 165 1.2 SE 165 1.4 SE 165 1.6 SE 165 0.0 SE 330 1.6 SE 330 4.7 SE 330 0.0 SE 330 0.4 SW Field 3.0 SW Field 19.0 SW Field 100.0 SW Field 110.0 SW 5 2.4 SW 5 9.6 SW 5 3.2 SW 5 8.9 SW 10 2.0 SW 10 1.6 SW 10 1.6 SW 10 4.4 SW 30 1.2 SW 30 0.0 SW 30 0.8 SW 30 1.8 SW 90 0.4 SW 90 3.8 SW 90 1.6 SW 90 0.4 SW 165 0.4 SW 165 1.2 SW 165 2.4 SW 165 2.2 SW 330 0.0 SW 330 0.4 SW 330 2.0 SW 330 2.0 W Field 8.0 W Field 26.0 W Field 131.0 W Field 121.0 W 5 4.8 W 5 2.8 W 5 6.4 W 5 6.0 W 10 3.6 W 10 4.4 W 10 4.4 W 10 4.8 W 30 1.6 W 30 3.0 W 30 5.2 W 30 2.8 W 90 1.2 W 90 2.0 W 90 2.4 W 90 1.2 W 165 0.8 W 165 0.8 W 165 2.2 W 165 1.6 w 330 W 330 2.0 W 330 1.3 W 330 0.4 w 660 W 660 W 660 0.4 W 660

97
2001 Ames, Iowa Field Isolation Plot
Deposition Values by Trap Location
07/25/01
gr/cm2
07/26/01
gr/cm2
c Field Field c E Field 60.8 Field 6.8 E
E 1 24.9 1 0.0 E
E 25 8.8 25 0.0 E
E 50 3.2 50 . E
E 75 3.2 75 . E
E 100 5.6 100 . E
N Field 41.6 Field 37.6 N N 1 0.0 1 20.8 N
N 25 0.3 25 0.0 N
N 50 0.4 50 0.4 N
N 75 0.8 75 0.8 N
N 100 0.4 100 0.8 N
NE Field Field NE
NE 1 0.2 1 0.8 NE NE 25 . 25 . NE NE 50 . 50 . NE
NE 75 0.0 75 . NE
NE 100 0.4 100 . NE
ENE 50 4.8 ENE ENE 100 1.6 ENE
NW Field Field NW NW 1 1.6 1 12.4 NW
NW 25 2.0 25 0.0 NW
NW 50 . 50 . NW NW 75 0.4 75 0.4 NW
NW 100 0.0 100 0.0 NW
WNW 50 . 50 0.4 WNW
WNW 100 . 100 0.4 WNW S Field 54.8 Field 42.8 S
S 1 26.8 1 14.0 S
S 25 6.0 25 0.4 S S 50 4.8 50 0.0 S S 75 1.6 75 1.2 S
S 100 1.8 100 . S
SW Field Field SW
SW 1 19.6 1 11.6 SW SW 25 0.8 25 0.0 SW
SW 50 0.8 50 0.4 SW
SW 75 0.0 75 0.0 SW SW 100 0.4 100 0.0 SW WSW 50 . 50 0.8 WSW
wsw 75 0.0 75 . WSW
WSW 100 . 100 0.4 WSW
w Field 64.0 Field 29.2 W
w 1 54.0 1 112.4 W
w 25 0.4 25 2.0 W
w 50 0.8 50 1.6 W
w 75 0.0 75 0.4 W
w 100 0.4 100 0.4 W

98
2001 Ankeny, Iowa Field 1 Isolation Plot Deposition Values by Trap Location
07/25/01 07/26/01 gr/cm2 gr/cm2
c Field Field C E Field 72.0 Field 34.4 E E 1 1.3 1 E E 25 1.2 25 E E 50 0.8 50 E E 75 0.0 75 E E 100 0.0 100 E N Field 62.4 Field 162.7 N N 1 0.0 1 23.6 N N 25 0.0 25 0.8 N N 50 0.8 50 0.4 N N 75 1.2 75 0.0 N N 100 0.0 100 0.0 N NE Field Field NE NE 1 0.0 1 1.6 NE NE 25 0.0 25 NE NE 50 0.0 50 NE NE 75 0.0 75 NE NE 100 0.0 100 NE ENE 50 50 ENE ENE 100 100 ENE NW Field Field NW NW 1 1 12.0 NW NW 25 25 0.6 NW NW 50 50 NW NW 75 75 NW NW 100 100 NW WNW 50 50 WNW WNW 100 100 WNW S Field 60.8 Field 132.0 S S 1 50.8 1 33.1 S S 25 1.6 25 0.0 S S 50 0.4 50 0.4 S S 75 0.0 75 0.0 S S 100 0.0 100 0.8 S SW Field 55.6 Field 113.7 SW SW 1 1 10.8 SW SW 25 25 0.0 SW SW 50 50 0.4 SW SW 75 75 SW SW 100 100 SW WSW 50 50 WSW WSW 75 75 WSW WSW 100 100 WSW w Field Field w w 1 4.0 1 30.0 W w 25 3.1 25 0.4 W w 50 0.4 50 0.4 W w 75 0.0 75 0.0 W
w 100 100 W SSW Field Field 101.0 SSW ssw 1 48.0 1 39.6 SSW SSW 25 2.4 25 SSW SSW 50 0.8 50 0.4 SSW SSW 75 0.4 75 0.0 SSW SSW 100 0.0 100 0.4 SSW

99
2001 Ankeny, Iowa Field 2 Isolation Plot Deposition Values by Trap Location
Dist from Trap Field 7/26/01
-ocation Edge gr/cm2 SSW 1 SSW 25 SSW 50 SSW 75 SSW 100
S 1 25 6 S 25 0.8 s 50 s 75 s 100
ENE 50 ENE 100
SW 1 22.8 SW 25 1.6 SW 50 0.8 SW 75 SW 100
W 1 15.6
W 25 0.4 W 50 0.4 W 75 0.4 W 100 0.0
WSW 75
NE 1 NE 75 NE 100
N 1 N 25 0.4 N 50 0.0 N 75 0.4 N 100 0.0
NW 1 7.1 NW 25 0.5 NW 50 0.0 NW 75 0.8 NW 100 0.0
Interior Center plot SSW plot
E plot N plot 48.0 N plot
NE plot NW plot S plot 61.6
SE plot SW plot W plot

100
ACKNOWLEDGEMENTS
The author would like to acknowledge Pioneer, A DuPont Company, for its support
of this project. Also, I would like to thank Mr. Bill Camerer and Mr. Willard Jones at
Doebler's, Inc. for their continued support and encouragement to finish this project.
Additionally I would like to extend personal thanks to Dr. Dale Wilson, Mr. Dave Shoultz,
and Dr. Michael Lauer for their encouragement and support during the last several years of
this project. Furthermore, I would like to extend humble thanks to my Major Professor, Dr.
Mark Westgate, who provided guidance, wisdom and understanding to a full-time employed
part-time graduate student. Thank you for your not insignificant patience. Finally, I would
like to thank my family for their understanding during this extended odyssey.