the influence of economic value added and return on assets
TRANSCRIPT

International Journal of Economics and Finance; Vol. 9, No. 4; 2017
ISSN 1916-971X E-ISSN 1916-9728
Published by Canadian Center of Science and Education
63
The Influence of Economic Value Added and Return on Assets on
Created Shareholders Value: A Comparative Study in Jordanian Public
Industrial Firms
Sliman S. Alsoboa1
1 College of Business Administration and Economics, Al-Hussein Bin Talal University, Ma‟an, Jordan
Correspondence: Sliman Alsoboa, College of Business Administration and Economics, Al-Hussein Bin Talal
University, Ma‟an, Jordan. E-mail: [email protected]
Received: January 19, 2017 Accepted: February 14, 2017 Online Published: March 10, 2017
doi:10.5539/ijef.v9n4p63 URL: https://doi.org/10.5539/ijef.v9n4p63
Abstract
This study has two main objectives. The first one is to address the relationship between Economic Value Added
(EVA) and Created Shareholders Value (CSV) in Jordanian public industrial firms (JPIF), comparing to the
Return on Assets (ROA) over the period 2011-2015. The second objective is to address the possible superiority
of EVA to ROA by explaining the changes in CSV for JPIF. In this study, CSV is measured using two models;
Fernandez model and market value added model. Multiple and simple regressions were used in the study. These
analyses have shown, generally, that the superiority of EVA in predicting and evaluating the CSV could be put
into a conclusive and positive light compared to ROA. However, the results suggested that one financial measure
cannot be enough to measure neither CSV nor firms‟ performance. Therefore, this study highly recommends that
JPIF use a combination of different measure in assessing and evaluating their value and performance, especially
modern indicators.
Keywords: economic value added, return on assets, created shareholders value, market value added, Fernandez
model, Jordan
1. Introduction
In recent years, the main objectives of corporations have shifted to the creation of value and achieving
satisfactory returns via increasing profitability and shareholders‟ wealth. Consequently, all the available
resources are to be exploited and managed wisely to enhance these objectives. Among other stakeholders, the
creation of value to shareholders is an important key to success in a developed business environment. In general,
it is accepted that the value is created when the firm generates or sustains returns that are more than its cost of
capital. There are hence many indicators that can be used to measure CSV including EVA.
However, the measurement and evaluation of value and the performance of firms have become very important
concerns. Investors usually make their investment decision based on the best choice of alternatives, which
depend primarily on the size and timeliness of the expected cash flows generated from the firm‟s operations.
Therefore, in order to create value for shareholders, management is required to maximise shareholder returns
(Rappaport, 1986; Monks & Minow, 2011; Jensen, 2002; Smith, 2003).
From this perspective, Fernandez (2001) has introduced a measure for CSV (hereafter CSV-F).He believes that
the firm will achieve CSV when the required return to equity exceeds the cost of equity. Three important
indicators constitute the structure of the Fernandez Model; which are equity market value, shareholder return and
the cost of equity. MVA is another well-known measure of shareholder value introduced by Stewart
(1991).According to this indicator, the focus in increasing shareholders‟ wealth is placed upon maximising the
market capitalisation in comparison with the capital invested.
From another perspective, for a long time the use of traditional accounting data for the purpose of measuring and
evaluating value and performance of firms has been criticised because its preparation is based on generally
accepted accounting principles (GAAP), or based on International Accounting Standards (IASs).These principles
and standards permit the estimation of many figures, in addition to the diversity of applications; however, this
leads to the accounting of distorted data. In this regard, as a financial measure, EVA plays a vital role in allowing
adjustments to accounting data to reflect the true economic status of the firm. Furthermore, EVA has become a

ijef.ccsenet.org International Journal of Economics and Finance Vol. 9, No. 4; 2017
64
popular tool by which the firm can maximise the shareholder value.
As a measure of performance, EVA comes closer than any other tool to representing the true economic profit of
an enterprise. It is directly linked to the creation of shareholders‟ wealth over time (Stern et al., 1995). Shil (2009)
defines EVA as a value-based performance measure that gives importance to value creation by company
management on behalf of the owners. Bahadur and Deb (2013) refer to how “EVA attempts to understand
whether a business creates sufficient surplus to cover the cost of its capital or to fulfill the shareholders‟
expectation into value creation” (p. 233).
This study intends to provide empirical evidence on the influence of EVA on CSV in the JPIF, comparing it to
ROA as a proxy of traditional performance measures. Two models, CSV-F and MVA, have been utilised to
measure CSV in JPIF over the period of 2011-2015. Therefore, this study has two main objectives. The first one
is to address the relationship between EVA and CSV in JPIF listed on ASE compared to ROA over the period of
2011-2015. The second objective is to address the possible superiority of EVA to ROA for explaining the
changes of CSV for JPIF for the years 2012-2015.
This study has suggested that one financial measure cannot be enough to measure both Created Shareholders
Value and firms‟ performance. Therefore, JPIF can use a combination of measures to assess and evaluate CSV
and financial performance. Generally, the superiority of EVA in predicting and evaluating the CSV could be put
into a conclusive and positive light compared to ROA. However, a few studies have been conducted in Jordan to
assess the relationships between traditional and modern financial measures relating to CSV. Therefore, this study
may be the first to address these relationships in Jordan, especially in industrial firms.
The paper will proceed as follows. The second section reviews the related literature. The third section presents a
brief theoretical framework of the main topics and the development of our hypotheses. The fourth section
describes the methodology of the study, including the measurement of variables. The fifth section supplies the
empirical results. The sixth section summarises the conclusions, while the seventh section outlines the
limitations.
2. Literature Review
Many studies address the relationships between different measures of wealth creation and different performance
measures. This section will summarise the most important related literature. For instance, Sirbu (2012) notes that
“EVA promises an effective way to manage shareholder value. It aligns management‟s objectives with those of
the shareholders, improves accountability and enables better performance analysis‟‟ (p. 305).
Hence, many studies have addressed the relationship between CSV and EVA. Nuroush et al. (2004), as cited in
Abdoli et al. (2012) indicate that “EVA is a better index for predicting the created shareholders value and
represents the management‟s capability in increasing the company‟s value (shareholders‟ wealth)” (p. 876). A
study conducted by Panigrahi et al. (2014) reveals that “there is a positive and significant relationship between
EVA and shareholder‟s wealth maximization”(p. 280). Bao and Bao (1999) have revealed that the “EVA is
positively and significantly correlated with the firm value” (p. 161). Meanwhile, Abdoli et al. (2012) also point
out that EVA has a significant relationship with shareholders‟ created wealth. On the other hand, it is important to
mention that EVA itself has classified as a measure of CSV (see, for example, Sakthivel, 2011; Suresh &
Sengottaiyan, 2015; Kaur & Narang, 2008). However, the present study has to deal with EVA as a performance
measure.
However, this study addresses two measures of CSV; namely, CSV-F and MVA. In terms of measuring CSV via
the Fernandez model, we noted a shortage of research in the field. However, Fernandez (2001) has concluded
that EVA does not measure wealth creation properly, whereas Fernandez and Reinoso (2003) have found a weak
correlation between EVA and created shareholder value. In another study done by ElMir and Seboui (2006), a
non-significant relationship was found between EVA and CSV-F. A similar result was found by Nekounam et al.
(2013) when they refer to the lack of a relationship between EVA and CSV-F. From the other perspective, a
positive correlation was found between the difference of these two variables (i.e. CSV-EVA) when they
controlled by governance mechanisms and earnings management (ElMir & Seboui, 2006). Other studies have
found different results; for instance, Imanzadeh (2014) has found a direct link between EVA and CSV-F.
Unlike CSV-F, a lot of studies have assessed the association between MVA and EVA. From a theoretical view of
point, the literature has referred to a direct association between EVA and MVA (e.g. DeWet, 2005; Brigham &
Ehrhardt, 2014; Aloy & Alfred, 2014). Furthermore, prior studies have found a statistically significant relationship
between EVA and MVA (Stern, Shiely, & Ross, 2001; Pinto & Santos, 2011; Sharma & Kumar, 2012; Pourali &
Roze, 2013). Furthermore, Banerjee (2000, p. 23) emphasises that “MVA can be well predicted by estimated

ijef.ccsenet.org International Journal of Economics and Finance Vol. 9, No. 4; 2017
65
future EVA streams”.
On the other hand, the relationships between EVA, accounting performance measures and CSV were addressed
in many comparative studies. Mixed results were found in this regard. Some of prior studies have concluded that
EVA has a stronger correlation with MVA compared to accounting measures(e.g., Grant, 1996; Uyemura et al.,
1996; Paula & Elena, 2009; Sichigea & Vasilescu, 2015). In this context, Nakhaei and Hamid (2013) also
indicate that “there is meaningful correlation between EVA, and ROE with MVA, but there is not meaningful
association between ROA and MVA” (p. 2). Yaghoob and Akkaf (2007) also recognize that there are meaningful
relationships between EVA, residual income, return on sales and return on investment with MVA.
Meanwhile, Ghanbari and More (2007) have found “strong evidence that EVA is greater to the traditional
performance appraising, and it is the best internal evolution of firm success in adding value to shareholders‟
investments” (p. 7). Madhavi and Prasad (2015) have also affirmed that, “EVA is a better predictor of market
value of the firms as compared to EPS and is successful in indicating stronger relationship and relevance to
capital markets than other traditional measures” (p. 49). Finally, Roze et al. (2013) have examined the
relationship between moderated EVA, as well as some accounting and financial criteria such as ROS, EPS, ROA
and ROE, with MVA as an external indicator of value-creation. They have indicated that all the study variables
are in a direct linear and significant relationship with MVA.
However, the literature also contains reverse findings. For instance, Bhasin and Shaikh (2013, p. 107; Bhasin,
2013, p. 185) indicate that, “there is no strong evidence to support Stern Stewart‟s claim that EVA is superior to
the traditional performance measures in its association with MVA”. In turn, Aloy and Alfred (2014) have found
no association between EVA and MVA. They also reveal that EVA has no profound impact on MVA. DeWet
(2005) concluded that EVA doesn‟t has a strongest relation with MVA compared to operating cash flow, return
on assets, earning per share and dividends per share.
In addition, Ramana (2005) suggests that EVA does not outperform common accounting criteria, such as NOPAT
and EBIT. Furthermore, the result of the study conducted by Kim (2006) does not “support the hypothesis that
EVA is superior to traditional accounting measures in association with equity market value” (p. 34). He also
points out that NOPAT and FCF are more highly correlated with market value rather than EVA. Thus, accounting
measures, such as NOPAT, are also found superior to EVA in its association with firm values (Biddle et al., 1997;
Clinton & Chen, 1998).
3. Theoretical Framework
3.1 Created Shareholder Value
The creation or destruction of value to the capital employed is recognised as one of the most important aspects in
the evaluation of the performance of an enterprise (Hall, 1998, p. 149). In the theoretical foundations of a firm‟s
management, there are two approaches that can be followed by the managers to creating value: the shareholder
value approach and the stakeholders‟ value approach. The shareholder value approach refers to a “Management
philosophy that regards maximization of shareholders‟ equity as its highest objective. It attempts to increase this
value by following policies that (1) enhance the firm‟s earnings, (2) increase the market value of its shares, and
(3) increase the amount or frequency of the dividend paid” (Business Dictionary, 2016). Alfred Appaport (1986)
(as cited in Bierman Jr., 1990) stated that, “The shareholder value approach estimates the economic value of an
investment by discounting forecasted cash flows by the cost of capital. These cash flows, in turn, serve as the
foundation for shareholder returns from dividends and share-price appreciation” (p. 144). According to Smith
(2003),” in the shareholder theory, the primary duty of management is to maximize shareholder returns” (p. 85).
In this context, Jensen (2002) recognises that, “value maximization states that managers should make all
decisions so as to increase the total long-run market value of the firm” (p. 236). Here, total value is the sum of
the values of all financial claims on the firm, including equity, debt, preferred stock and warrants.
Sundaram and Inkpen (2004) give five parts to their argument for why shareholder value maximisation should be
the preferred corporate goal. These parts include “the goal of maximizing shareholder value is pro-stakeholder,
maximizing shareholder value creates the appropriate incentives for managers to assume entrepreneurial risks,
having more than one objective function will make governing difficult, if not impossible, it is easier to make
shareholders out of stakeholders than vice versa, and finally, in the event of a breach of contract or trust,
stakeholders, compared with shareholders, have protection through contracts and the legal system” (p. 353).
The literature on the measurement of shareholder value has addressed many of measures including EVA,
Adjusted EVA, FCF, total business returns, shareholder value analysis, economic profit, cash flow return on
investment, market-adjusted total share return, ratio of market value to the book value of shares, shareholders‟

ijef.ccsenet.org International Journal of Economics and Finance Vol. 9, No. 4; 2017
66
annual returns and shareholders‟ abnormal returns (CIMA, 2004; Erasmus & Scheepers, 2008; Maham et al.,
2008; Maimako & Oladele, 2010; Saha, 2015; Farahani et al., 2016). However, the focus of this study is on the
CSV in JPIF listed in the Amman exchange stock (ASE) over the period 2011-2015. Two measures of CSV have
been addressed in this study, discussed below.
3.1.1 Fernandez Model
This measure of Created Shareholders Value was developed by Pablo Fernandez in 2001. In his study,
“Shareholder Value Creators and Shareholder Value Destroyers in USA: Year 2000”, Fernandez (2001) has
defined and quantified CSV for 274 American companies for the years 1998, 1999, 2000, as well as
for1993-2000. According to Fernandez and Reinoso (2002), “A company creates value for the shareholder when
the shareholder return exceeds the cost of equity (the required return to equity). In other words, a company
creates value in one year when it outperforms expectations‟‟ (p. 4). However, the technical procedures for
computation of this measure will be discussed later in the section on the measurement of variables.
3.1.2 Market Value Added
Stewart (1991) introduced MVA as measure of shareholder value. Since then, MVA is frequently referred to as a
proxy or measure of CSV (e.g. Kramer & Peters, 2001, p. 42; DeWet, 2005; Paula & Elena, 2009, p. 53; Aloy &
Alfred, 2014, p. 127; Madhavi & Prasad, 2015, p. 49; Nakhaei, 2016, p. 434; Pandya, 2016, p. 40). In addition,
MVA has been classified as “an external performance measure, which is considered to be the best index of
creation shareholder value” (Nakhaei, 2016, p. 436). For instance, Kramer and Peters (2001) have defined MVA
as “a cumulative measure of the value created by management in excess of the capital invested by shareholders‟‟
(p. 42). Wibowo and Berasategui (2008) have also stated that “MVA is a tool in determining how much money
investors have made on their investment and the level of value a company has accumulated over time
(company‟s wealth)” (p. 63). Therefore, it is argued that, “MVA depends on the rate of return of a company”
(Banerjee, 2000, p. 29).
From another perspective, the relationship between MVA and EVA has frequently been addressed. From a
theoretical view of point, the literature refers to a direct association between EVA and MVA. Luber (1996, as
cited in Vijayakumar, 2011, p. 23) confirms that “a positive EVA over a period of time will also have an
increasing MVA while negative EVA will bring down MVA as the market loses confidence in the competence of
a company to ensure a handsome return on the invested capital”. In their study, Stern et al. (2001, p. 17) also
state that, “there is significant link between EVA growth and growth in MVA”. Finally, Aloy and Alfred (2014)
have also concluded that, “the best way to maximize MVA is to maximize EVA” (p. 126).
3.2 Economic Value Added
EVA currently is considered to be one of most popular performance measures in the field of business. It analyses
the performance of firm to show which are truly profitable. Therefore, it is frequently classified as one of the
best developed measures to judge whether this objective had been achieved or not. In fact, empirical studies have
shown the superiority of EVA over other traditional financial performance measures (Stem, 1990; Stewart, 1994;
Lehn & Makhija, 1996; Sirbu, 2012). According to Stewart (1994) EVA has four main features in general, which
include measurement of business performance, management systems, methods of motivation and ways of
thinking. Furthermore, Sirbu (2012) argues that, “EVA promises an effective way to manage shareholder value. It
aligns management‟s objectives with those of the shareholders, improves accountability and enables better
performance analysis” (p. 305).
From another perspective, the traditional accounting measures have been frequently criticised because of their
deficiency in expressing the actual value created by the firm. In this regard, as a financial measure, EVA plays a
vital role in adjusting accounting data to reflect the true economic status of the firm. Moreover, EVA overcomes
this criticism because it is computed as an excess profit of a firm after accounting for the cost of capital.
Consequently, it is the difference between Net Operating Profit after Tax (NOPAT) and the capital charge for
both debt and equity. However, being that EVA is at the heart of this study, it is addressed as an independent
variable relating to CSV.
3.3 Traditional Performance Measures
The use of traditional accounting data for the purpose of evaluating value and performance of firms has been
criticised over a long period of time because it is prepared based on generally accepted accounting principles
(GAAP), or based on International Accounting Standards (IASs). These principles and standards are then
provide an estimation of many figures, in addition to the diversity of applications, which leads to distorted
accounting data.

ijef.ccsenet.org International Journal of Economics and Finance Vol. 9, No. 4; 2017
67
Over the years, a lot of accounting indicators have been developed to measure the value and performance of
economic entities. These traditional performance measures, such as residual income and accounting based returns,
have also been criticised because they do not consider the total cost of capital employed and because they fail to
assess the genuine economic returns (Chen & Dodd, 1997; Haque et al., 2004; Shil, 2009; Nakhaei & Hamid,
2013).
However, despite the variety of measures that could be used to measure and explain the value of a firm and
evaluate its performance, researchers have highlighted that, “there is no single accounting measure which explains
the variability in the shareholders‟ wealth” (West & Worthington, 2001; Rogerson, 1997; Chen & Dodd, 1997;
Lehn & Makhija, 1996). In this regard, Sharma and Kumar (2010, p. 201) recognise that, “Any financial measures
used in assessing firm‟s performance must be highly correlated with shareholders‟ wealth and on the other hand
should not be subjected to randomness inherent in it”. Therefore, the search for substitute measures in accounting
and financial fields could be said to have begun three decades ago when modern measures such as EVA, MVA and
CSV were born.
However, this study has considered return on assets as a proxy of the accounting measures. ROA is a measure of
profitability of the firm in relation to its total assets. It is considered as an independent variable in the current study.
In addition, simple regression has been used to test, yearly, the explanatory power of both of EVA and ROA upon
the change of measures of CSV, starting from the year 2012.
3.4 Hypotheses of the Study
As we discussed in the section on prior studies and the theoretical framework, a positive significant relationship
was found, in general, between EVA and CSV. The objective of this study is to address this relationship in JPIF
listed on ASE comparing to the return on assets. In addition, this study also aims to address the possible
superiority of EVA to ROA in explaining the changes of CSV (for the two measures, CSV-F and MVA) for JPIF
over the period 2012-2015. Therefore, the following six hypotheses have been drawn:
H01: EVA positively affects CSV-F for JPIF for each year from 2011 to 2015.
H02: EVA positively affects MVA for JPIF for each year from 2011 to 2015.
H03: ROA positively affects CSV-F for JPIF for each year from 2011 to 2015.
H04: ROA positively affects MVA for JPIF for each year from 2011 to 2015.
H05: EVA is superior to ROA in explaining the changes of CSV-F for JPIF over the period 2012-2015.
H06: EVA is superior to ROA in explaining the changes of MVA for JPIF over the period 2012-2015.
4. Methodology
4.1 The Population and Sample of the Study
The population of study mainly consists of all the Jordanian industrial firms publicly listed on the ASE during
the period 2011-2015. The sample of the study was selected according to two main conditions: 1-the firm should
be listed on ASE and continued with normal operations over all years from the beginning of 2011 to the ending
of 2015; 2-the availability of all the data required for 6years from 2010 to 2015. Based on these two conditions,
the study sample includes 51 industrial firms from groups of firms ranging annually from 66 firms to 74 firms
listed on ASE during the period, as seen in Table 1.
Table 1. Numbers and classification of companies that comprise the study sample
Industrial Sector
Sub-Sectors Number of companies
Pharmaceutical & Medical Industries 6
Chemical Industries 9
Paper and Cardboard Industries 3
Food and Beverages 7
Mining & Extraction Industries 7
Engineering & Construction 7
Electrical Industries 4
Textiles, Leathers & Clothing 5
Other sectors 3
Total 51

ijef.ccsenet.org International Journal of Economics and Finance Vol. 9, No. 4; 2017
68
4.2 Collection and Preparation of Data
For the purposes of this study, we depended on secondary resources to gather data. The data was collected
entirely from published annual financial reports. For the purposes of statistical analysis, the data was prepared
manually for all the variables, with the exception of two variables-ROA and Debit Ratio-which were taken
directly from the reports as computed by the firms. In addition, all the important and applicable accounting
adjustments have been taken into account when calculating the invested capital, NOPAT, and hence EVA.
4.3 Variables Measurement
Empirical models have been used in this study to assess the relationships between EVA, ROA and CSV. CSV has
been measured by two models: Fernandez‟s model (2001) and MVA model. In addition, capital structure and
growth of firm were taken as control variables. However, the variables are defined as follows.
4.3.1 Economic Value Added
The economic value added is calculated on an annual basis according to the following formula:
EVA=NOPAT –(IC* WACC)
Where: NOPAT is net operating profit after tax, IC is invested capital and WACC is the weighted average cost of
capital.
WACC = Debts
(Cost of Debt)(1- T)+ Equity
(Cost of Equity) Total Funding Total Funding
Where: T is the tax rate, debts are all interest-bearing debts, total funding is the summation of all interest-bearing
debts and ordinary equity, while in this study, the cost of debt is the gross interest expense divided by all
interest-bearing debts.
Cost of equity is mostly determined using theCapital Asset Pricing Model(CAPM), as in the following equation:
ri=rf +β(rm-rf)
Where:
ri: The return on risky assets (the cost of equity).
rf: The return on risk-free assets (such as Treasury Bills). In this study, rf is computed based on a 10-year
government bond yield.
rm: The return on the stock market (index).
Β: Beta is a measure of systemic risk (market risk) and represents, annually, a coefficient of the change of the
company‟s share price compared to the overall market index. Therefore, it consists of the day-to-day fluctuations
in a stock‟s price and is calculated as follows:
β= ri∆
*100
rm∆
4.3.2 Fernandez Model
According to Fernandez (2001), CSV can be quantified as follows:
Created shareholder value=Equity market value x(Shareholder return-Ke)
According to this model,CSV can be computed through the following steps:
1-Equity market value (capitalisation) = Share‟s price x the number of shares
2-The Increase of equity market valuet(E) = The equity market valuet- the equity market valuet-1
3-Shareholder value added =Increase of equity market value
+Dividends paid during the year
+Other payments to shareholders (discounts on par value, share buy-backs, …)
-Outlays for capital increases, exercise (purchase) of stock options and stock
warrants
-Conversion of convertible debentures
4-All-shareholder return =Shareholder value added t /Equity market valuet-1
5-Ke =Cost of capital
4.3.4 Market Value Added Model
The market value added has become a popular tool in the financial field after it was initiated by the consulting

ijef.ccsenet.org International Journal of Economics and Finance Vol. 9, No. 4; 2017
69
firm Stern Stewart. Young and O‟Byrne (2001) hence explain MVA as the difference between the firm‟s market
value (including equity and debt) and the total capital invested in the company. Therefore, in this study, MVA is
measured in the following formula:
MVA = Total Market Value–Total Capital = (MV of Stock+MV of Debt)-Total invested Capital
Where the MV of stock is the market capitalisation and the MV of debt is market value of debts. However, in
Jordan, as it is in many other developing countries, there is no active market for debts where it could receive the
market value for the debt. Therefore, to estimate MVA in this study, the book value of debt has been considered
as equivalent to the market value of debt. Total invested capital is hence equal to the total book value of debt and
equity modified by accounting adjustments.
4.3.5 Traditional Accounting Measures
There are many accounting measures traditionally used to assess firm performance. In this regard, the most
popular factor is profitability, measured mostly by ROA. In this study, data for this variable has been taken
directly from the annual published financial statements for Jordan‟s publicly listed industrial firms. The formula
to calculate this variable is as follow:
ROA= (Net Income+Finance Interests)*100
Total Assets
4.3.6 Control Variables
Reviewing the literature in the areas such as this study, we could find many variables that affect the value of firm,
either positively or negatively, such as profitability, growth, capital structure, firm size, taxes and the investment
and cost of capital. This study has considered two factors expected to affect the firm‟s value positively. These
two variables are the growth measured by the average of both total assets growth rate and net sales growth rate
and the capital structure measured by the debt ratio.
Debit Ratio=𝑇𝑜𝑡𝑎𝑙 𝑙𝑖𝑎𝑏𝑖𝑙𝑖𝑡𝑖𝑒𝑠∗100
𝑇𝑜𝑡𝑎𝑙 𝐴𝑠𝑠𝑒𝑡𝑠
Total net sales growth rateit =𝑇𝑜𝑡𝑎𝑙 𝑛𝑒𝑡 𝑠𝑎𝑙𝑒𝑠𝑡–𝑡𝑜𝑡𝑎𝑙 𝑛𝑒𝑡 𝑠𝑎𝑙𝑒𝑠𝑡−1
𝑡𝑜𝑡𝑎𝑙 𝑛𝑒𝑡 𝑠𝑎𝑙𝑒𝑠𝑡−1
5. Empirical Results
5.1 Descriptive Statistics
The descriptive statistics for the variables used in the study are presented in Table 2. We note that there are no
consistent trends in the mean for all variables over the years with the exception of the department ratio. In fact,
the changes in these averages have fluctuated from year to year. In general, the best performance for JPIF was in
the year 2014, when all three of the variables achieved their best indicators; namely, EVA=852852, ROA=2.86%
and MVA=13007209. The next best year for JPIF was 2012, where the two variables that achieved their best
indicators, were CSV-F=24857265 and Growth=3.41%.
For EVA, the worst performance for JPIF was in 2012 (EVA=-936495). In this year, JPIF also reported the
lowest CSV-F(CSV-F=20087322), although the lowest CSV measured was reported in 2011 (MVA=6363432).
The worst performance for ROA and Growth for JPIF was in the year2015,where ROA was-0.59% and the
growth rate was-9.66%.
Regarding to the DebtR, the lowest percentage for JPIF was in 2011 (DebtR=34.54%) and this may be due to the
global financial crisis, which ended later that year. After 2011, the external financing part of capital structure
increased yearly until it reached its best level in the year 2015 (DebtR=40.02%).
Table 2. Descriptive statistics for the variables used in the study
No. Variables Descriptive
Statistics
Years
2015 2014 2013 2012 2011
1- EVA Mean -21491 852852 398198 -936495 509775
SD 5286172 4642256.3 6377524 7076468 5002853
2- ROA Mean -.0059 .0286 .0250 .0035 .0023
SD .1184 .0917 .0839 .1042 .0885
3- CSV-F Mean 23513760 24695412 24857265 20087322 20274137
SD 61358326 45146381 52068492 31843162 27968701

ijef.ccsenet.org International Journal of Economics and Finance Vol. 9, No. 4; 2017
70
4- MVA Mean 11897925 13007209 12836182 7017462 6363432
SD 53855621 37320789 44566935 22786261 16622536
5- DebtR. Mean .4002 .3876 .3793 .3754 .3454
SD .2980 .2307 .2228 .2241 .2059
6- Growth Mean -.0966 .0318 .0341 .0080 .0178
SD .1668 .2694 .2656 .2589 .1927
Note. *CSV =Created Shareholders Value.
With regard to the correlation, there are no fixed accepted rules for describing correlation strength. In this study,
the absolute value of correlation depends on the following guidelines: when 0<r<.30 the correlation is weak;
when 30<r<.70 the correlation is moderate; and when r>.70 the correlation is strong. Based on these rules, Table
3 and Table 4 present, respectively, the strong and moderate Pearson correlations for variables used in the study
over the years 2011-2015. The weak relationships between variables have been neglected in this study.
As can be seen in Table 3, all the variables correlate with each other with positive significant relationships in
some years. What is notable in Table 3 is that MVA-CSV-F has strong relationships every year. In Table 4, we
can also see that most of variables are correlated with moderately positive significant relationships, with the
exception of DebtR, which has a negative significant relationship with EVA in two years (2011 and 2015) and
ROA in years 2011, 2012 and 2015.
Table 3. Summary of Pearson correlation for the strong correlation coefficients between variables over the years
2011-2015
Variables Strong Correlations
2015 2014 2013 2012 2011
EVA-CSV-F .866** .851**
EVA-MVA .804** .822**
EVA-ROA .727**
MVA-CSV-F .962** .939** .962** .839** .829**
Note. **Correlation is significant at the 0.01 level (2-tailed). *Correlation is significant at the 0.05 level (2-tailed).
Table 4. Summary of Pearson correlation for the moderate correlation coefficients between variables over the
years 2011-2015
Variables Moderate Correlations
2015 2014 2013 2012 2011
EVA-CSV-F .632** .488**
EVA-MVA .629** .417** .419**
EVA-ROA .679** .572** .580** .453**
EVA-DebtR -.383** -.328*
EVA-Growth .365**
MVA-CSV-F
MVA-ROA .331* .392** .388** .380**
ROA-CSV-F .436** .428** .421** .421** .305*
ROA-DebtR -.614** -.351* -.374**
ROA-Growth .508** .473** .301*
Note. **Correlation is significant at the 0.01 level (2-tailed). *Correlation is significant at the 0.05 level (2-tailed).
5.2 Testing and Discussion of Hypotheses
In this study, the multiple regression was used to test, independently, the influence of both EVA and ROA on
each of the measures of CSV adopted in this study. In each case, the regression was controlled by two
explanatory variables: the debt ratio and the growth rate of the firm.
This procedure has been performed separately for all years from 2011 to 2015 for each of the hypotheses
H01-H04. In addition, a simple regression was used to test, yearly, the explanation power (i.e.R2) of both EVA
and ROA in terms of the change of measures of CSV starting from the year 2012 for each of the hypotheses
H05-H06. The results of testing these hypotheses H01-H06 are as follow:

ijef.ccsenet.org International Journal of Economics and Finance Vol. 9, No. 4; 2017
71
H01: EVA positively affects CSV-F for each year from2011 to2015.
This hypothesis has been drawn to determine whether EVA affects the CSV measured positively by the
Fernandez model in JPIF for each year from 2011 to2015. A multiple regression, as in equation1, was run to
predict CSV-F from EVA, the debt ratio and the growth of firms for all the years2011-2015.
CSV-F=αi+β1EVA+β2DebtR+β3Growtht+e (1)
Table 5 presents the results of testing of hypothesis H01 in the years 2011-2015.These variables were, jointly,
found in all years statistically significantly predicted CSV-F. In addition, all three variables added, in all the years,
statistically significant in relation to the prediction, p≤.021. At this level of detail, it is found that EVA
significantly affects CSV-F in all the years concerned. Therefore, we accept the hypothesis H01: EVA positively
affects firm value measured by CSV-F.
With respect to explanatory variables, the debt ratio is found to affect CSV-F significantly in 2015. The results of
this study are consistent with Imanzadeh (2014) who found a direct link between EVA and CSV-F. Consequently,
these results may refer to the hypothesis that EVA properly measures wealth creation in terms of CSV-F, which
makes it inconsistent with the studies conducted by Fernandez (2001, 2002), ElMir and Seboui (2006) and
Nekounam et al. (2013).
Table 5. Multiple regression results for the effect of EVA on CSV-F for the years2011-2015 (controlled by the
debt ratio and growth of firms)
Years Variables Model Summary ANOVA Coefficients
R R2 Adj.R2 F Sig. B t Sig.
2015 DebtR
.910 .829 .818
75.862 .000
58688409 4.350 .000
Growth -31448752 -1.316 .195
EVA 11.684 14.608 .000
2014 DebtR
.860 .739 .722
44.386 .000
18229123 1.230 .225
Growth -13897274 -1.104 .275
EVA 8.539 11.503 .000
2013 DebtR
.637 .406 .368
10.703 .000
19331660 .725 .472
Growth 4068408 .179 .859
EVA 5.218 5.500 .000
2012 DebtR
.435 .190 .137
3.585 .021
-12999547 -1.025 .311
Growth 13728683 1.268 .211
EVA 1.365 3.082 .003
2011 DebtR
.523 .273 .227
5.892 .002
9918251 .554 .582
Growth -25640337 -1.379 .174
EVA 3.095 4.112 .000
Note. Dependent Variable:CSV-F.
H02: EVA positively affects MVA for each year from 2011 to 2015.
This hypothesis has been drawn to determine whether EVA affects the MVA positively in JPIF for each year
from 2011 to 2015. Thus, as in equation 2, a multiple regression was run to predict MVA from EVA, the debt
ratio and growth of firms for each of the years 2011-2015.
MVA=αi+β1EVA+β2DebtR+β3Growtht+e (2)
Table 6 presents the results of testing of hypothesis H02 in years 2011-2015. These variables, jointly, were found
in all years statistically significantly predicted MVA. In addition, all three variables added, in all years, statistically
significantly to the prediction, p≤.022. At this level of detail, it is found that EVA significantly affects MVA in all
years. Therefore, we accept the hypothesis H02, EVA also affects firm value positively measured by MVA. These
results are inconsistent with the study carried by Aloy and Alfred (2014) who found no association between EVA
and MVA. With respect to explanatory variables, we can see that the debt ratio is found significantly affect MVA
in two years, 2015 and 2004, whereas the growth rate found to be significantly affect MVA in the year 2011.
Generally, the result of present study is consistent with a lot of studies carried out in this area. Actually, we could
say that MVA can be well predicted by EVA.
ijef.ccsenet.org International Journal of Economics and Finance Vol. 9, No. 4; 2017
72
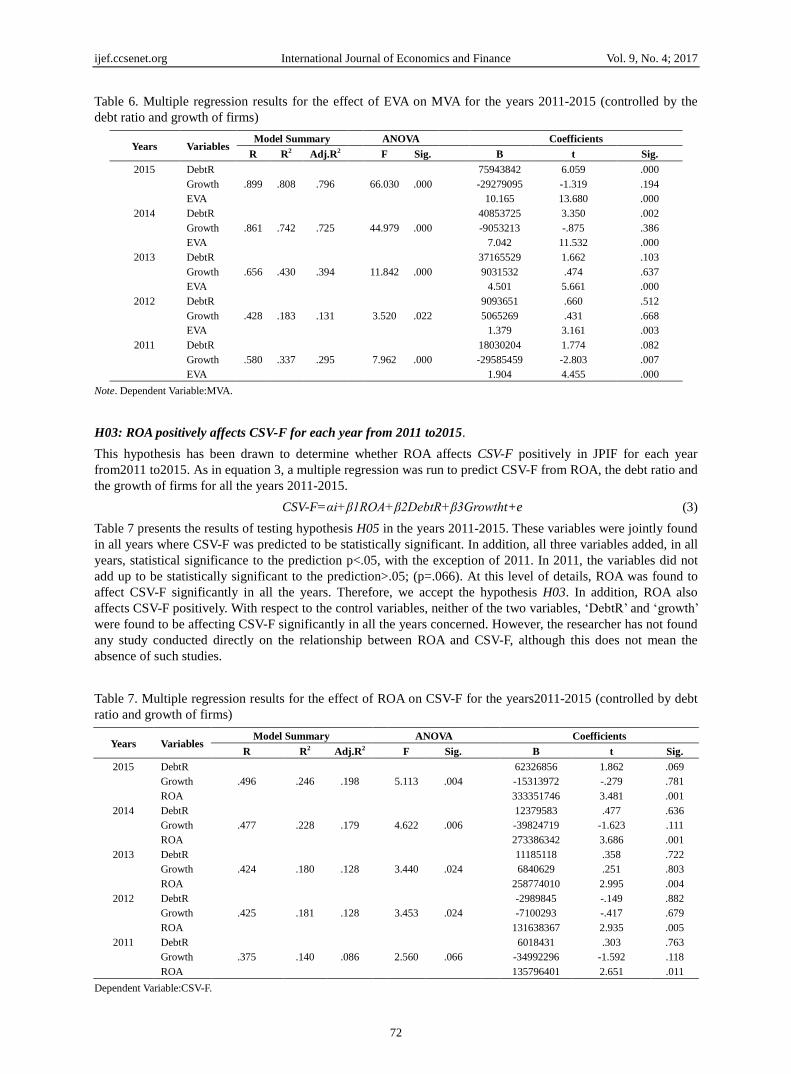
Table 6. Multiple regression results for the effect of EVA on MVA for the years 2011-2015 (controlled by the
debt ratio and growth of firms)
Years Variables Model Summary ANOVA Coefficients
R R2 Adj.R2 F Sig. B t Sig.
2015 DebtR
.899 .808 .796
66.030 .000
75943842 6.059 .000
Growth -29279095 -1.319 .194
EVA 10.165 13.680 .000
2014 DebtR
.861 .742 .725
44.979 .000
40853725 3.350 .002
Growth -9053213 -.875 .386
EVA 7.042 11.532 .000
2013 DebtR
.656 .430 .394
11.842 .000
37165529 1.662 .103
Growth 9031532 .474 .637
EVA 4.501 5.661 .000
2012 DebtR
.428 .183 .131
3.520 .022
9093651 .660 .512
Growth 5065269 .431 .668
EVA 1.379 3.161 .003
2011 DebtR
.580 .337 .295
7.962 .000
18030204 1.774 .082
Growth -29585459 -2.803 .007
EVA 1.904 4.455 .000
Note. Dependent Variable:MVA.
H03: ROA positively affects CSV-F for each year from 2011 to2015.
This hypothesis has been drawn to determine whether ROA affects CSV-F positively in JPIF for each year
from2011 to2015. As in equation 3, a multiple regression was run to predict CSV-F from ROA, the debt ratio and
the growth of firms for all the years 2011-2015.
CSV-F=αi+β1ROA+β2DebtR+β3Growtht+e (3)
Table 7 presents the results of testing hypothesis H05 in the years 2011-2015. These variables were jointly found
in all years where CSV-F was predicted to be statistically significant. In addition, all three variables added, in all
years, statistical significance to the prediction p<.05, with the exception of 2011. In 2011, the variables did not
add up to be statistically significant to the prediction>.05; (p=.066). At this level of details, ROA was found to
affect CSV-F significantly in all the years. Therefore, we accept the hypothesis H03. In addition, ROA also
affects CSV-F positively. With respect to the control variables, neither of the two variables, „DebtR‟ and „growth‟
were found to be affecting CSV-F significantly in all the years concerned. However, the researcher has not found
any study conducted directly on the relationship between ROA and CSV-F, although this does not mean the
absence of such studies.
Table 7. Multiple regression results for the effect of ROA on CSV-F for the years2011-2015 (controlled by debt
ratio and growth of firms)
Years Variables Model Summary ANOVA Coefficients
R R2 Adj.R2 F Sig. B t Sig.
2015 DebtR
.496 .246 .198
5.113 .004
62326856 1.862 .069
Growth -15313972 -.279 .781
ROA 333351746 3.481 .001
2014 DebtR
.477 .228 .179
4.622 .006
12379583 .477 .636
Growth -39824719 -1.623 .111
ROA 273386342 3.686 .001
2013 DebtR
.424 .180 .128
3.440 .024
11185118 .358 .722
Growth 6840629 .251 .803
ROA 258774010 2.995 .004
2012 DebtR
.425 .181 .128
3.453 .024
-2989845 -.149 .882
Growth -7100293 -.417 .679
ROA 131638367 2.935 .005
2011 DebtR
.375 .140 .086
2.560 .066
6018431 .303 .763
Growth -34992296 -1.592 .118
ROA 135796401 2.651 .011
Dependent Variable:CSV-F.

ijef.ccsenet.org International Journal of Economics and Finance Vol. 9, No. 4; 2017
73
H04: ROA positively affects MVA for each year from 2011 to2015.
This hypothesis has been drawn to determine whether ROA affects MVA positively in JPIF for each year from
2011 to2015. As in equation4, a multiple regression was run to predict MVA from ROA, the debt ratio and the
growth of the firms concerns for each year 2011-2015.
MVA=αi+β1ROA+β2DebtR+β3Growtht+e (4)
Table 8 presents the results of testing hypothesis H04 in the years 2011-2015. These variables were found jointly
in all the years statistically significantly where MVA was predicted. In addition, all the three variables added
were statistically significantly to the prediction, p<.05, in all the years concerned. At this level of details, ROA is
found to affect MVA significantly in all the years concerned. Consequently, the results confirm HypothesisH04
and we accept this hypothesis; ROA positively affect firm value measured by MVA. These results are consistent
with the conclusion of Roze et al. (2013), which indicated that financial criteria such as ROA are in direct linear
and significant relationship with MVA. With respect to the control variables, the debt ratio was found to affect
the MVA significantly in the year 2015, whereas the growth rate is found to affect MVA significantly in the year
2011. However, mixed results were found regarding the relationship between EVA, accounting measures and
creating shareholders.
Table 8. Multiple regression results for the effect of ROA on MVA for the years2011-2015 (controlled by debt
ratio and growth of firms)
Years Variables Model Summary ANOVA Coefficients
R R2 Adj.R2 F Sig. B T Sig.
2015 DebtR
.468 .219 .169 4.382 .008
76305713 2.551 .014
Growth -11478797 -.234 .816
ROA 276789034 3.234 .002
2014 DebtR
.477 .227 .178 4.610 .007
35777498 1.665 .102
Growth -29993022 -1.478 .146
ROA 222692412 3.631 .001
2013 DebtR
.418 .175 .122 3.325 .027
29426282 1.096 .279
Growth 13147065 .562 .577
ROA 204129711 2.752 .008
2012 DebtR
.403 .162 .109 3.036 .038
14548244 1.003 .321
Growth -1211836 -.098 .922
2011 ROA 94893281 2.925 .005
DebtR
.473 .224 .174 4.516 .007
16807078 1.500 .140
Growth -36914384 -2.974 .005
ROA 91928573 3.177 .003
H05: EVA is superior to ROA in explaining the changes of CSV-F for JPIF over the period 2012-2015.
This hypothesis has been drawn to determine whether EVA is superior to ROA in explaining the changes of
CSV-F for JPIF over the period 2012-2015. As in equations 5 and 6, a simple regression was run to predict the
changes of CSV-F for the four years 2012-2015.
ΔCSV-Ft=EVAt-1+e (5)
ΔCSV-Ft=ROAt-1+e (6)
Table 9 presents the results of testing hypothesis H05 in the years 2012-2015. Here, EVA is found to be
statistically significantly in predicting the changes of CSV-F for JPIF over the period 2012-2015. In all the years,
it is added to be statistically significantly to the prediction, p<.001. Thus, in relation to ROA, it is found to be
statistically significantly in predicting the changes of CSV-F for JPIF in two years, 2012 and 2013, and it is
added, in these two years, to be statistically significantly to the prediction, p<.001.
Taking a closer look at Table 9, we can see that EVA demonstrates explanatory powers in the years 2012, 2013
and 2015, with much more done by ROA. What is notable is that the two variables had a same explanation
power in the years 2014 for EVA and 2013 for ROA. In general, these results do support the hypothesis that EVA
is superior to ROA in explaining the changes of CSV-F for JPIF over the period 2012-2015. Therefore, it could
be said that the results confirm the hypothesis H05.

ijef.ccsenet.org International Journal of Economics and Finance Vol. 9, No. 4; 2017
74
Table 9. Simple regression results for the effect of each of EVA and ROA on the changes to CSV-F for the years
2012-2015
Variables Years Model Summary ANOVA
R R2 Adj.R2 F Sig.
EVA- CHCSV-F 2015 .740 .548 .539 59.470 .000
2014 .471 .222 .206 13.998 .000
2013 .775 .600 .592 73.627 .000
2012 .531 .282 .268 19.283 .000
ROA-CHCSV-F 2015 .107 .011 -.009 .569 .454
2014 .043 .002 -.019 .090 .766
2013 .471 .222 .206 13.991 .000
2012 .400 .160 .143 9.315 .000
H06: EVA is superior to ROA in explaining the changes of MVA for JPIF over the period 2012-2015.
This hypothesis has been drawn to determine whether EVA is superior to ROA in explaining the changes of MVA
for JPIF over the period 2012-2015. As in equations 7 and 8, a simple regression was run to predict the changes
of MVA for four years 2012-2015.
ΔMVAt=EVAt-1+e (7)
ΔMVAt=ROAt-1+e (8)
Table 10 resents the results of testing hypothesis H06 in the years 2012-2015. EVA is found to be statistically
significant in predicting the changes of MVA for JPIF over the period 2012-2015 while, it is added, in all the
years, to be statistically significant to the prediction, p<.001. ROA is then found to be statistically significant in
predicting the changes of CSV-F for JPIF in two years, 2012 and 2013, and it is added, in these two years, to be
statistically significantly to the prediction, p≤.018.
As can we see in Table 10, EVA demonstrates explanatory powers in all the years, much more than done by ROA.
These results strongly support the superiority of EVA to ROA in explaining the changes of MVA for JPIF over
the period 2012-2015. Therefore, it could be said that the results succeed in confirming the hypothesis H06.
These results are inconsistent with the studies carried out by Biddle et al. (1997), Clinton and Chen (1998),
Ramana (2005) and Kim (2006).
Table 10. Simple regression results for the effect of each of EVA and ROA on the changes of MVA for the
years2012-2015
Variables Years Model Summary ANOVA
R R2 Adj.R2 F Sig.
EVA-CHMVA 2015 .668 .446 .435 39.525 .000
2014 .507 .257 .242 16.920 .000
2013 .529 .280 .266 19.076 .000
2012 .587 .344 .331 25.708 .000
ROA-CHMVA 2015 .191 .037 .017 1.860 .179
2014 .084 .007 -.013 .348 .558
2013 .357 .127 .109 7.147 .010
2012 .331 .109 .091 6.012 .018
6. Conclusion
These days, the main objectives of firms have shifted to the creation of value and achieving satisfactory returns
through increasing profitability and shareholders‟ wealth. There are many indicators that can be used to measure
CSV, including CSV-F and MVA. On the other hand, the measurement and evaluation of value and the
performance of firms have become a very important concern. Therefore, the firm should choose the use of a
performance measure that could lead to maximising shareholder returns and, consequently, the value of the firm.
This study has two main objectives. The first is to address the relationship between EVA and CSV in JPIF listed
on the ASE, comparing it to the traditional accounting measures represented by ROA. We have found that both
EVA and ROA have a positive and significant influence on CSV measured by Fernandez Model and MVA for
each of the years2011-2015.Therefore, the results confirm the general hypotheses that these two measures affect

ijef.ccsenet.org International Journal of Economics and Finance Vol. 9, No. 4; 2017
75
CSV positively. With respect to the explanatory variables used in the study (i.e. the debt ratio and growth rate),
we have found that the effects of these variable differ from one measure of CSV to another and from one year to
another. Nonetheless, we can say that the explanatory variables were found, jointly, in all years to be statistically
significant in predicting CSV for all measures with the exception of ROA-CSVF in the year 2011.
The second objective of this study has been to address the possible superiority of EVA to ROA in explaining the
changes of CSV for JPIF over the period 2012-2015. With regard to CSV-F, EVA has demonstrated explanatory
powers in the years 2012, 2013 and 2015 much more than that performed by ROA, although the two variables
had the same explanatory power in the years2014 for EVA and 2013 for ROA. In general, these results support
the superiority of EVA to ROA in explaining the changes of CSV-F for JPIF over the period 2012-2015. With
regard to MVA, ROA was found to be statistically significant in predicting the changes of CSV-F for JPIF in two
years; 2012 and 2013, whereas EVA showed explanatory powers in all the years, to a much greater extent than
ROA. This strongly supports the superiority of EVA to ROA in explaining the changes of MVA for JPIF over the
period 2012-2015.
The study revealed that CSV is influenced by EVA and ROA, both of which are utilised in this study. In general,
the superiority of EVA in predicting and evaluating the CSV can now be taken in a conclusive and positive light
compared to ROA. Summing up then, the results of this study suggest that one financial measure cannot be
enough to measure neither the created shareholders value nor the performance of firms.
JPIF can get a handle on the measurement of created shareholders value using a combination of two main
models, the Fernandez Model and MVA. In addition, for the purpose of performance evaluation, JPIF can also
use a combination of the two main indicators, EVA and ROA. Up until now, there have been no regulations in
Jordan to compute and disclose these measures in the public firms. Therefore, this study is highly recommended,
JPIF is to give more attention to the use of modern indicators, especially CSV, MVA and EVA, in assessing and
evaluating their value and performance.
7. Limitations
This study has utilised a limited number of measures to show the relationships between CSV and performance
measurement. Different measures could be affecting such relations, either positively or negatively. Therefore, the
use of other measures has been suggested to confirm the relationships between the variables. In addition, the
sample of the study only contains the industrial firms listed in ASE. We would hence suggest the inclusion of the
other industries in future studies.
References
Abdoli, M., Shurvarzi, M., & Farokhad, A. D. (2012). Economic Value Added vs. Accounting Residual Income;
Which One Is a Better Criterion for Measurement of Created Shareholders Value? World Applied Sciences
Journal, 17(7), 874-881.
Aloy, N. J., & Alfred, M. (2014). The Association between Economic Value Added, Market Value Added and
Leverage. International Journal of Business and Management, 9(10), 126-133.
Bahadur, S. K., & Deb, B. C. (2013). Economic Value Added (EVA): A Better Performance Indicator- The Case
Study of Square Pharmaceuticals Limited. Journal of Business Studies, 34(2), 233-241.
Banerjee, A. (2000). Linkage between Economic Value Added and Market Value: An Analysis. Vikalpa, 25(3),
23-36. https://doi.org/10.1177/0256090920000304
Bao, B. H., & Bao, D. H. (1999). The Association between Firm value and Economic Value Added. Indian
Accounting Review, 3(2), 161-164.
Bhasin, M. L. (2013). Economic value added and shareholders‟ wealth creation: The portrait of a developing
Asian country. International Journal of Finance and Accounting, 2(4), 185-198.
https://doi.org/10.1504/ijmfa.2013.053208
Bhasin, M., & Shaikh, J. M. (2013). Economic value added and shareholders‟ wealth creation: The portrait of a
developing Asian country. International Journal of Managerial and Financial Accounting, 5(2), 107-137.
https://doi.org/10.1504/IJMFA.2013.053208
Biddle, G. C., Bowen, R. M., & Wallace, J. S. (1997). Does EVA beat earnings? Evidence on associations with
stock returns and firm values. Journal of Accounting and Economics, 24(3), 301-336.
http://dx.doi.org/10.1016/S0165-4101(98)00010-X
Bierman, Jr. H. (1990). A review of Alfred Appaport‟s creates shareholder value. Journal of Management

ijef.ccsenet.org International Journal of Economics and Finance Vol. 9, No. 4; 2017
76
Accounting Research, 2, 140-154.
Brigham, E. F., & Ehrhardt, M. C. (2014). Financial Management: Theory and Practice (14th ed.).
South-Western, USA.
Business Dictionary. (2016). Shareholder value approach. Retrieved December 2, 2016, from
http://www.businessdictionary.com/definition/shareholder-value-approach.html
Chen, S., & Dodd, J. L. (1997). Economic Value Added: An Empirical Examination of a New Performance
Measure. Journal of Managerial Issues, 9(3), 301-336. Retrieved from
http://www.jstor.org/stable/40604150
CIMA. (2004). Maximizing shareholder value achieving clarity in decision-making. Technical Report, The
Chartered Institute of Management Accountants, London, UK.
Clinton, B. D., & Chen, S. (1998). Do new performance measures measure up? Management Accounting, 80(4),
38-43.
DeWet, J. HvH. (2005). EVA versus Traditional Accounting Measures of Performance as Drivers of Shareholder
Value-A Comparative Analysis. Meditari Accountancy Research, 13(2), 1-16.
http://dx.doi.org/10.1108/10222529200500009
ElMir, A., & Seboui, S. (2006). Corporate governance and earnings management and the relationship between
economic value added and created shareholder value. Journal of Asset Management, 7(3), 242-254.
http://dx.doi.org/10.1057/palgrave.jam.2240216
Erasmus, P., & Scheepers, R. (2008). The Relationship between Entrepreneurial Intensity and Shareholder Value
Creation. Managing Global Transitions, 6(3), 229-256.
Farahani, Z., Mehri, M. G., & Pooya, M. R. K. (2016). The Effect of Free Cash Flows on the Evidence of
Earnings Management in Enterprises Listed on the Tehran Stock Exchange. International Research Journal
of Applied and Basic Sciences, 10(5), 602-609.
Fernandez, P. (2001). Shareholder Value Creators and Shareholder Value Destroyers in USA: Year 2000. SSRN
Electronic Journal. http://dx.doi.org/10.2139/ssrn.272252
Fernandez, P. (2002). A Definition of Shareholder Value Creation. Research Paper No. 448, IESE, University of
Navarra.
Fernandez, P., & Reinoso, L. (2003). Shareholder Value Creation and Shareholder Value destroyers in USA-Year
2002. Working Paper No. 501, CIIF-International Center for Financial Research, IESE Business School,
University of Navarra.
Ghanbari, A. M., & More, V. (2007). The Relationship between Economic Value Added and Market Value Added:
An Empirical Analysis in Indian Automobile Industry. The IUP Journal of Accounting Research and Audit
Practices, 6(3), 7-22. Retrieved from http://citec.repec.org/rss/icficfjarv_06_y_2007_i_3_p_7-22.xml
Grant, J. L. (1996). Foundations of EVATM for Investment Managers. The Journal of Portfolio Management,
23(1), 41-45. http://dx.doi.org/10.3905/jpm.1996.409573
Hall, J. H. (1998). The agency problem, agency cost and proposed solutions there to: A South African
perspective. Meditari Accountancy Research, 6(2), 144-161.
Haque, M., Akter, M., & Shil, N. C. (2004). Value-Based Measure: An Application of EVA in Small
Manufacturing Company in Bangladesh. Retrieved from http://mpra.ub.uni-muenchen.de/7711/
Imanzadeh, P. (2014). Corporate governance and the relationship between EVA and created shareholder value.
Applied Mathematics in Engineering, Management and Technology, 2(3), 94-102.
Jensen, M. C. (2002). Value Maximization, Stakeholder Theory, and the Corporate Objective Function. Business
Ethics Quarterly, 12(2), 235-56. Retrieved from http://www.jstor.org/stable/3857812
Kaur, M., & Narang, S. (2008). Economic value added reporting and corporate performance: A study of Satyam
computer services Ltd. The ICFAI Journal of Accounting Research, 7(2), 40-52.
Kim,W. G. (2006). EVA and traditional accounting measures: Which metric is a better predictor of market value
of hospitality companies? Journal of Hospitality & Tourism Research, 30(1), 34-49.
https://doi.org/10.1177/1096348005284268
Kramer, J. K., & Peters, J. R. (2001). An Interindustry Analysis of Economic Value Added as a Proxy for Market

ijef.ccsenet.org International Journal of Economics and Finance Vol. 9, No. 4; 2017
77
Value Added. Journal of Applied Finance, 11(1),41-49.
Lehn, K., & Makhija, A. K. (1996). EVA and MVA: As Performance Measures and Signals for Strategic Change.
Strategy and Leadership, 24(3), 34-38. http://dx.doi.org/10.1108/eb054556
Luber, R. B. (1996). Who are the real wealth creators. Fortune, 2-3.
Madhavi, E., & Prasad, M. S. V. (2015). An Empirical Study of Economic Value-Added and Market
Value-Added of Selected IndianFMCG Companies. The IUP Journal of Accounting Research & Audit
Practices, 14(3), 49-65.
Maham, K., Ali Asghar, F. Z., & Javad, H. (2008). Free cash flow. Knowledge and Research on Accounting, (13),
30-37.
Maimako, S. S., & Oladele, K. O. (2012). Impact of Corporate Restructuring on Value Creation in the Nigerian
Banking Industry. SDMIMD Journal of Management, 3(2), 77-96.
Monks, R. A. G., & Minnow, N. (2011). Corporate Governance (5th ed.). JohnWiley & Sons, Inc., USA.
Nakhaei, H. (2016). Market value added and traditional accounting criteria: Which measure is a best predictor of
stock return in Malaysian companies? Iranian Journal of Management Studies (IJMS), 9(2), 433-455.
Nakhaei, H., & Hamid, N. I. N. B. (2013). The Relationship between Economic Value Added, Return on Assets,
and Return on Equity with Market Value Added in Tehran Stock Exchange (TSE). Proceedings of Global
Business and Finance Research Conference, 28-29 October, 2013, Howard Civil Service International
House, Taipei, Taiwan.
Nekounam, J., Sotudeh, R., & Kohandel, Z. (2013). Explain the relationship between corporate governance on
economic value-added (EVA) and created shareholder value (CSV). Life Science Journal, 10(2), 67-73.
Pandya, B. (2016). Impact of financial leverage on market value added: Empirical evidence from India. Journal
of Entrepreneurship, Business and Economics, 4(2), 40-58.
Panigrahi, S. K., Zainuddin, Y., & Azizan, N. A. (2014). Comparing Traditional and Economic Performance
Measures for Creating Shareholders Value: A Perspective from Malaysia. International Journal of
Academic in Accounting, Finance and Management Sciences, 4(4), 280-289.
Paula, D. A., & Elena, D. C. (2009). EVA versus traditional accounting measures of performance as drivers of
shareholder value – A comparative analysis (pp. 53-63). Retrieved from
http://www.upm.ro/proiecte/EEE/Conferences/papers/S309.pdf
Pinto, T. C., & Santos, M. C. (2011). An analysis of the correlation between EVA® and MVA® : The Case of a
NYSE Euronext Lisbon Listed Company. Global Journal of International Business Research, 4(4), 69-79.
Pourali, M. R., & Roze, Z. (2013). The Relationship between Market Value Added with Refined Economic Value
Added and Performance Accounting Criteria in the Firms listed in the Tehran Stock Exchange.
International Research Journal of Applied and Basic Sciences, 4(6), 1636-1645.
Ramana, D. V. (2005). Market Value Added and Economic Value Added: Some Empirical Evidence. 8th
Capital
Markets Conference, Indian Institute of Capital Markets Paper. https://doi.org/10.2139/ssrn.871404
Rappaport, A. (1986). Creating Shareholder Value: The New Standard for Business Performance. NewYork:
FreePress.
Rogerson,W. (1997). International cost allocation and managerial investments incentives: A theory explaining
the use of Economic Value Added as Performance Measure. Journal of Political Economy, 105(4), 770-775.
Roze, Z., Meshki, M., & Pourali, M. R. (2013). A Study of the Relationship between Economic Criteria and
Performance Evaluation Accounting with Market‟s Value added in the Firms Listed in the Tehran Stock
Exchange. Research Journal of Recent Sciences, 2(7), 31-36.
Saha, S. S., & Roy, M. N. (2015). Performance Measurement and Shareholder Value Creation in Indian
Computer Software Industry: An Empirical Analysis. Information and Knowledge Management, 5(6),
74-84.
Sakthivel, N. (2011). Shareholders‟ Value in Indian Pharmaceutical Industry: An Empirical Analysis. Indian
Journal of Commerce & Management Studies, 2(1), 87-99.
Sharma, A. K., & Kumar, S. (2010). Economic Value Added(EVA)-Literature Review and Relevant Issues.
International Journal of Economics and Finance, 2(2), 200-220. https://doi.org/10.5539/ijef.v2n2p200

ijef.ccsenet.org International Journal of Economics and Finance Vol. 9, No. 4; 2017
78
Sharma, A. K., & Kumar, S. (2012). EVA Versus Conventional Performance Measures-Empirical Evidence from
India. Paper presented at the ASBBS Annual Conference, Las Vegas.
Shil, N. C. (2009). Performance measures: An application of economic value added. International Journal of
Business and Management, 4(3), 169-177. https://doi.org/10.5539/ijbm.v4n3p169
Sichigea, N., & Vasilescu, L. (2015). Economic value added and market value added-modern indicators for
assessment the firm’s value. Annals of „Constantin Brancusi‟ University of Targu-Jiu, Economy Series. 2015
Special Iss. ECO-TREND 2015, Performance, Competitiveness, Creativity, pp. 488-493.
Sirbu, A. (2012). Economic value added (EVA) approach in Russia: Concepts, approaches, instruments. Review
of International Comparative Management, 13(2), 305-312. Retrieved from
http://EconPapers.repec.org/RePEc:rom:rmcimn:v:13:y:2012:i:2:p:305-312
Smith, H. J. (2003). The Shareholders vs. Stakeholders Debate. MIT Sloan Management Review, 44(4), 85-90.
Stem, J. M. (1990). One way to build value in your firm, a la Executive Compensation. Financial Executive, 6(6),
51-54.
Stern, J. M., Shiely, J. S., & Ross, I. (2001). The EVA challenge: Implementing value-added change in an
organization. NewYork, USA: John Willey & Sons, Inc.
Stern, J. M., Stewart, G. B., & Chew, D. H. (1995). The EVA Financial Management System. Journal of Applied
Corporate Finance, 8(2), 32-46. http://dx.doi.org/10.1111/j.1745-6622.1995.tb00285.x
Stewart, G. B. (1991). The Quest for Value. NewYork: Harper Collins Publishers.
Stewart, G. B. (1994). EVA: Fact and Fantasy. Journal of Applied Corporate Finance, 7(2), 71-84.
http://dx.doi.org/10.1111/j.1745-6622.1994.tb00406.x
Sundaram, A. K., & Inkpen, A. C. (2004). The corporate objective revisited. Organization Science, 15(3),
350-363. http://dx.doi.org/10.1287/orsc.1040.0068
Suresh, S., & Sengottaiyan, A. (2015). A Study on Shareholders Value Creation and Financial Performance of
Selected Auto Mobile Companies in India. International Journal of Humanities Social Sciences and
Education(IJHSSE), 2(8), 95-102.
Uyemura, D. G., Kantor, C. C., & Pettit, J. M. (1996). EVA for banks: value creation, risk management, and
profitability measurement. Journal of Applied Corporate Finance, 9(2), 94-109.
http://dx.doi.org/10.1111/j.1745-6622.1996.tb00118.x
Vijayakumar, A. (2011). Economic Value Added (EVA) and Shareholders Wealth Creation: A Factor Analytic
Approach. Research Journal of Finance and Accounting, 2(12), 22-37.
West, T., & Worthington, A. C. (2001). The usefulness of economic value-added (EVA) and its components in
the Australian context. Accounting, Accountability and Performance, 7(1), 73-90.
Wibowo, P. P., & Berasategui, R. G. (2008). The relationship between economic value added (EVA® ) and
market value added (MVA) with reported earnings: An empirical research of40 listed companies in
Indonesia stock exchange for the years 2004-2007. Journal of Applied Finance and Accounting, 1(1),
60-72.
Yaghoob-nejad, A., & Akaf, A. (2007). The Relationship between Evaluation Performance Measures (EVA, RI,
ROS, ROI) and Market Value Added (MVA) in Companies Accepted in Tehran Stock Exchange (TSE).
Iranian Economic and Management Journal, 75, 77-89.
Young, D., & O‟Byrne, S. F. (2001). EVA and Value Based Management. NewYork: McGrow–Hill.
Copyrights
Copyright for this article is retained by the author(s), with first publication rights granted to the journal.
This is an open-access article distributed under the terms and conditions of the Creative Commons Attribution
license (http://creativecommons.org/licenses/by/4.0/).