the influence of income and prices on global dietary
TRANSCRIPT

United States Department of Agriculture
Economic Research Service
Economic Research Report Number 225
February 2017
The Influence of Income and Prices on Global Dietary Patterns by Country, Age, and Gender
Andrew Muhammad, Anna D’Souza, Birgit Meade, Renata Micha, and Dariush Mozaffarian

Economic Research Service www.ers.usda.gov
United States Department of Agriculture
Cover image: iStock
Use of commercial and trade names does not imply approval or constitute endorsement by USDA.
To ensure the quality of its research reports and satisfy government-wide standards, ERS requires that all research reports with substantively new material be reviewed by qualified technical research peers. This technical peer review process, coordinated by ERS' Peer Review Coordinating Council, allows experts who possess the technical background, perspective, and expertise to provide an objective and meaningful assessment of the output’s substantive content and clarity of communication during the publication’s review. For more information on the Agency’s peer review process, go to: http://www.ers.usda.gov/about-ers/peer-reviews.aspx
In accordance with Federal civil rights law and U.S. Department of Agriculture (USDA) civil rights regulations and policies, the USDA, its Agencies, offices, and employees, and institutions participating in or administering USDA programs are pro-hibited from discriminating based on race, color, national origin, religion, sex, gender identity (including gender expression), sexual orientation, disability, age, marital status, family/parental status, income derived from a public assistance program, political beliefs, or reprisal or retaliation for prior civil rights activity, in any program or activity conducted or funded by USDA (not all bases apply to all programs). Remedies and complaint filing deadlines vary by program or incident.
Persons with disabilities who require alternative means of communication for program information (e.g., Braille, large print, audiotape, American Sign Language, etc.) should contact the responsible Agency or USDA's TARGET Center at (202) 720-2600 (voice and TTY) or contact USDA through the Federal Relay Service at (800) 877-8339. Additionally, program information may be made available in languages other than English.
To file a program discrimination complaint, complete the USDA Program Discrimination Complaint Form, AD-3027, found online at How to File a Program Discrimination Complaint and at any USDA office or write a letter addressed to USDA and provide in the letter all of the information requested in the form. To request a copy of the complaint form, call (866) 632-9992. Submit your completed form or letter to USDA by: (1) mail: U.S. Department of Agriculture, Office of the Assis-tant Secretary for Civil Rights, 1400 Independence Avenue, SW, Washington, D.C. 20250-9410; (2) fax: (202) 690-7442; or (3) email: [email protected].
USDA is an equal opportunity provider, employer, and lender.
Access this report online: www.ers.usda.gov/publications/
Download the charts contained in this report:
• Gotothereport’sindex page www.ers.usda.gov/publications/
• Clickonthebulleteditem“Downloaderr225zip”
• Openthechartyouwant,thensaveittoyourcomputer
Recommended citation format for this publication:
Muhammad,Andrew,AnnaD’Souza,BirgitMeade,RenataMicha,andDariushMozaffarian.The Influence of Income and Prices on Global Dietary Patterns by Country, Age, and Gender, ERR-225, U.S. Department of Agriculture, Economic Research Service, February 2017.

United States Department of Agriculture
Economic Research Service
Economic Research Report Number 225
February 2017
Abstract Worldwide changes in eating habits are contributing to a rise in obesity and chronic noncommunicable diseases (NCDs) such as diabetes and heart disease, across all coun-tries, including middle- and low-income countries. Now that many countries share common challenges related to food choice and public health, international organizations such as the World Health Organization have recommended global campaigns to address the rise of NCDs by implementing policies to improve diets. Although these organiza-tions have proposed pricing and income policies, the effectiveness of such policies—based on income level and regional preferences, as well as on age and gender—could differ across countries. To address this issue, this study investigates how income and prices influence dietary habits globally. No prior studies have globally evaluated the influence of price and income on major dietary risk factors for NCDs by age or gender. In this report, nationally representative dietary intake data for 164 countries were used to derive income and own-price elasticities of food consumption across the spectrum of rich and poor countries. Our results show considerable differences among individuals across food groups, regions/countries, and age and gender subgroups. Similar to past studies of cross-country food demand, results also show that low-income countries are more affected by changes in income and food prices than are higher income countries.
Keywords: demand, diets, elasticity, food, global, income, intake, noncommunicable diseases (NCDs), nutrition, prices
Acknowledgments The authors thank Cheryl Christensen and Joanne F. Guthrie, USDA, Economic Research Service (ERS); Carol Levin, University of Washington, Department of Global Health; Hui Jiang, USDA, Foreign Agricultural Service (FAS); and Dave Weatherspoon, Michigan State University, Agricultural, Food and Resource Economics Department, for their review. We also thank Priscilla Smith, Dale Simms, Maria Williams, and Cynthia A. Ray of ERS for editorial and design assistance. Development of the Global Dietary Database, which is used in this report, was funded by the Bill and Melinda Gates Foundation. The Bill and Melinda Gates Foundation also provided research funding to the coauthors affiliated with Tufts University.
AndrewMuhammad,AnnaD’Souza,BirgitMeade, RenataMicha,andDariushMozaffarian
The Influence of Income and Prices on Global Dietary Patterns by Country, Age, and Gender

About the AuthorsAndrew Muhammad and Birgit Meade are economists with USDA, Economic Research Service. Anna D’Souza is an Associate Professor at Baruch College, City University of New York. Renata Micha is a Research Assistant Professor at the Friedman School of Nutrition Science and Policy, Tufts University, and Dariush Mozaffarian is Dean of the Friedman School of Nutrition Science and Policy, Tufts University.
On March 2, 2017, the report The Influence of Income and Prices on Global Dietary Patterns by Country, Age, and Gender was revised to correct a regional country grouping covering Central and Eastern Europe and Central Asia. All references to this country grouping inaccurately defined as the “Former Soviet Union (FSU)” were changed to “Former Centrally Planned economies (FCP).”

iii The Influence of Income and Prices on Global Dietary Patterns by Country, Age, and Gender, ERR-225
Economic Research Service/USDA
Contents
Summary . . . . . . . . . . . . . . . . . . . . . . . . . . . . . . . . . . . . . . . . . . . . . . . . . . . . . . . . . . . . . . . . . . . . . iv
Introduction . . . . . . . . . . . . . . . . . . . . . . . . . . . . . . . . . . . . . . . . . . . . . . . . . . . . . . . . . . . . . . . . . . . .1
Income, Prices, and Diet . . . . . . . . . . . . . . . . . . . . . . . . . . . . . . . . . . . . . . . . . . . . . . . . . . . . . . . . .4
Data and Methods . . . . . . . . . . . . . . . . . . . . . . . . . . . . . . . . . . . . . . . . . . . . . . . . . . . . . . . . . . . . . . .6The Global Dietary Database . . . . . . . . . . . . . . . . . . . . . . . . . . . . . . . . . . . . . . . . . . . . . . . . . . . . .6Income Data . . . . . . . . . . . . . . . . . . . . . . . . . . . . . . . . . . . . . . . . . . . . . . . . . . . . . . . . . . . . . . . . . .6Food Price Data . . . . . . . . . . . . . . . . . . . . . . . . . . . . . . . . . . . . . . . . . . . . . . . . . . . . . . . . . . . . . . 10Model and Estimation . . . . . . . . . . . . . . . . . . . . . . . . . . . . . . . . . . . . . . . . . . . . . . . . . . . . . . . . .12
Empirical Results . . . . . . . . . . . . . . . . . . . . . . . . . . . . . . . . . . . . . . . . . . . . . . . . . . . . . . . . . . . . . .16Income and Price Elasticities by Region and Subgroup . . . . . . . . . . . . . . . . . . . . . . . . . . . . . . . 16Income Elasticity Across Countries . . . . . . . . . . . . . . . . . . . . . . . . . . . . . . . . . . . . . . . . . . . . . .23
Conclusion . . . . . . . . . . . . . . . . . . . . . . . . . . . . . . . . . . . . . . . . . . . . . . . . . . . . . . . . . . . . . . . . . . . .25
References . . . . . . . . . . . . . . . . . . . . . . . . . . . . . . . . . . . . . . . . . . . . . . . . . . . . . . . . . . . . . . . . . . . .27
Appendix 1: Full-Model and Base-Model Estimates . . . . . . . . . . . . . . . . . . . . . . . . . . . . . . . . .32
Appendix 2: Dietary Intake Across Regions . . . . . . . . . . . . . . . . . . . . . . . . . . . . . . . . . . . . . . . .37

United States Department of Agriculture
ERS is a primary source of economic research and
analysis from the U.S. Department of Agriculture, providing timely informa-
tion on economic and policy issues related to agriculture, food, the environment, and
rural America. www.ers.usda.gov
United States Department of Agriculture
Economic Research Service
Economic Research Report Number 225
February 2017
The Influence of Income and Prices on Global Dietary Patterns by Country, Age, and Gender
Andrew Muhammad, Anna D’Souza, Birgit Meade, Renata Micha, and Dariush Mozaffarian
February 2017
Find the full report at www.ers.usda.gov/
publications
AndrewMuhammad,AnnaD’Souza,BirgitMeade,RenataMicha,andDariushMozaffarian
The Influence of Income and Prices on Global Dietary Patterns by Country, Age, and Gender
What Is the Issue?
Worldwide changes in eating habits and poor nutrition are contributing to a global rise in obesity and chronic noncommunicable diseases (NCDs) such as diabetes, heart disease, and stroke, putting all income groups and ages, as well as both genders, at risk of these diseases. NCDs are particularly problematic in developing countries, where they have been shown to nega-tively affect economic growth and development potential and are more likely than in developed countries to result in premature deaths. In recent years, a number of international meetings and reports have focused on promoting policies (1) to reduce the availability and consumption of saturated fatty acids, high-sodium prepared and processed foods, and added sugars in food and nonalcoholic beverages, and (2) to increase the availability, affordability, and consumption of fruits, vegetables, and other healthy foods. Although international organizations have encour-aged healthier diets through pricing and income policies, their effectiveness could differ among countries by income levels and regional preferences, as well as within countries by gender and age subgroups.
What Did the Study Find?
ERS research confirms that changes in income and food prices more strongly affect food intakes in low-income countries than in higher income countries. Income and prices also influence dietary intake patterns across gender, age, regions, countries, and the 11 food categories consid-ered in this study (fruit, vegetables, beans and legumes, nuts and seeds, whole grains, unpro-cessed red meat, processed meat, fish, milk, sugar-sweetened beverages, and 100-percent fruit juice). All findings are based on 2010 and 2011 data.
Income elasticities (the percentage change in intake due to a percentage change in income) were largest for countries in the lowest income decile (those with incomes in the bottom 10 percent of countries studied). The responsiveness of fruit intake to an income increase was the exception: the change was positive for all income groups except the lowest income countries, where the change was insignificant. In the lowest-income-decile countries, milk intake (with a more than 1.0 percent response to a 1-percent change in income) responded more strongly than other foods. Milk intake was followed by that of processed meat (0.8 percent) and sugar-sweetened bever-ages (0.6 percent). Across countries and income levels, in response to income growth, the intake of meat and beverages is more likely than that of other commodities to rise, and intake of plant-based food, other than fruit, shows little or no change.
A report summary from the Economic Research Service
Summary

Individuals in low-income countries also respond more than those in higher income countries to food prices. When intakes of fruit, milk, processed meat, and sugar-sweetened beverages were compared across income groups, countries in the lowest income decile showed the largest response to food-price changes, and intakes of processed meat and fruit were affected most strongly by those changes, followed by sugar-sweetened beverages. At the lowest income level, milk intake was not responsive to price. Across countries and income levels, a rise in prices is more likely to cause a decrease in meat and beverage intake (milk, 100-percent fruit juice, and sugar-sweetened beverages), with little or no change in plant-based food intake, other than fruit and whole grains.
The associations among income, prices, and food intake globally shown by this report may be important when considering policy options for improving diets and addressing the challenges of NCDs related to dietary intake. However, programs focusing solely on increasing incomes or lowering food prices, without a nutrition-promo-tion component, may fail to improve their populations’ health and well-being. The results also show the impor-tance of relating initiatives to specific groups of people and countries/regions.
How Was the Study Conducted?
Comprehensive data of global consumption patterns available from the Global Dietary Database (2010) were used in this research. The database contains intake data on 11 major food categories and provides estimates of daily consumption levels of major food groups by country, age, and gender. Per-capita 2010 gross domestic product (GDP) estimates from the World Bank were used to account for income differences across coun-tries, and price-level indexes for related food categories from the 2011 International Comparison Program were used to account for price differences across countries. Similar to the Global Dietary Database, the 2011 International Comparison Program data represent the most up-to-date, comprehensive snapshot of global food prices available.
Intake demand for each food category was estimated separately, accounting for differences across gender and age subgroups by allowing these factors to have a direct effect on food intake, as well as an additional effect through income and price responsiveness. The modeling framework also allowed the income and price effects to vary based on income level. To account for cross-country differences due to cultural preferences or related factors, binary variables were added to the model to allow for differences in intake across the following regions: Sub-Saharan Africa, Latin America and the Caribbean, Former Centrally Planned economies of Central and Eastern Europe and Central Asia, Southeast Asia and the Asian Pacific, North Africa and the Middle East, and an aggregate category to account for rich countries in the Western Hemisphere, Australia, New Zealand, and surrounding islands.
www.ers.usda.gov

1 The Influence of Income and Prices on Global Dietary Patterns by Country, Age, and Gender, ERR-225
Economic Research Service/USDA
The Influence of Income and Prices on Global Dietary Patterns by Country, Age, and Gender
Introduction
Although undernutrition continues to be a problem for low-income people and countries, worldwide changes in eating habits and poor nutrition are contributing to a global rise in obesity—in middle- and low-income countries, as well as in high-income countries (Lim et al., 2013). For instance, since 1990, obesity rates among women in high-income Western countries have increased from 16 percent to 28 percent in 2014. During this same period, however, obesity rates among women also increased in East and South East Asia (from 2 percent to 8 percent), Sub-Saharan Africa (from 5 percent to 14 percent), Latin America and Caribbean (from 16 percent to 27 percent), and Central Asia, Middle East, and North Africa (from 19 percent to 31 percent).1 In turn, the global rise in obesity has led to an increase in diet-related noncommunicable diseases (NCDs) such as diabetes and heart disease (Lim et al., 2013). As obesity rates have risen around the globe, many developing countries now face the double burdens of addressing food insecurity and undernutrition while also addressing overnutri-tion and NCDs (Mendez et al., 2005).
According to the World Health Organization (WHO), NCDs are a global problem, putting all income groups, men and women, adults as well as children, at risk of these diseases (Beaglehole et al., 2011a). NCDs are most serious in developing countries, where they have been shown to negatively affect economic growth and development potential. These effects are especially strong for rapidly growing countries such as China and India, but also for least developed countries such as Tanzania, which have experienced an upsurge in chronic disease risks and deaths (WHO, 2005). All countries have suffered economically because of the health care expenditures and increased mortality related to the spread of NCDs. In the United States, for instance, the direct medical costs alone have been estimated at over $500 billion annually (Cawley and Meyerhoefer, 2012; Muka et al., 2015), straining public budgets and tax bases.
Now that many low-, middle-, and high-income countries share common challenges related to food choice and public health, international organizations such as the WHO have advocated for global initiatives to examine policy options for improving diets and nutrition. The need for a global approach was the topic of the United Nations (UN) High-Level Meeting on NCDs in 2011, seen as creating an opportunity for a global campaign against NCDs and their consequences (Beaglehole et al., 2011b). A global approach was also addressed in the WHO Global Action Plan for the Prevention and Control of NCDs 2013-2020 and the Framework for Action from the Second International Conference on Nutrition, organized by the Food and Agriculture Organization of the UN and the WHO in 2014.2 These initiatives provide a framework and policy options for member countries to reduce premature mortality from NCDs by improving diets and reducing other risk factors.
1These data were obtained from the NCD Risk Factor Collaboration (NCD-RisC) Network, http://www.ncdrisc.org/index.html. Obesity rates among men have also increased, but at a lower prevalence than women.
2The Second International Conference on Nutrition was held in Rome, November 2014, and jointly organized by the UN’s Food and Agriculture Organization (FAO) and WHO. The conference focused particularly on nutrition challenges in developing countries. The Framework for Action can be found at http://www.fao.org/about/meetings/icn2/documents/en/.

2 The Influence of Income and Prices on Global Dietary Patterns by Country, Age, and Gender, ERR-225
Economic Research Service/USDA
A key component of the WHO Global Action Plan is the strengthening of global food and nutri-tion policies to improve diets, thereby lessening the exposure of individuals and populations to the common risk factors associated with NCDs. It has been argued that policies implemented by member countries should reduce the availability and consumption of saturated fatty acids, high-sodium prepared and processed foods, and added sugars in food and nonalcoholic beverages, and likewise, that such policies should increase the availability, affordability and consumption of fruit, vegetables, and other healthy foods (WHO, 2013). Affordability is an important driver of food demand and underscores the importance of income and prices in dietary choices. Knowing how prices and income affect the consumption of healthy and unhealthy foods within and across coun-tries is critical to understanding the role that government policies can play in changing global diets and nutrition. While organizations such as the WHO and UN have proposed pricing and income polices to encourage healthier diets, it is important to note that the effectiveness of such policies could differ across countries based on income level and regional preferences, and within countries across gender and age subgroups.
This report investigates how income and prices influence dietary habits globally. Nationally repre-sentative intake data for 164 countries are used to derive income and price elasticities of food consumption across the complete spectrum of rich and poor countries.3 The heterogeneity in food intake is evaluated, as are the income and price elasticities based on gender and age subgroups within each country and for 11 food categories that can affect the risk of NCDs: fruit, vegetables, beans and legumes, nuts and seeds, whole grains, fish, milk, 100-percent fruit juice, unprocessed red meat, processed meat, and sugar-sweetened beverages.4
The dietary intake data come from the 2010 Global Dietary Database (GDD), the first database to provide estimates of daily consumption levels of major food groups by country, age, and gender (Del Gobbo et al., 2015; Imamura et al., 2015; Micha et al., 2015; Micha et al., 2014; Micha et al., 2012; Singh et al., 2015). We used 2010 per-capita gross domestic product (GDP) (purchasing power parity-adjusted) from the World Bank as our measure of income, and we used price-level indexes for related food categories from the 2011 International Comparison Program (ICP), World Bank.5 Similar to the GDD, the 2011 ICP data represent the most up-to-date, comprehensive snapshot of global food prices available.
While the relationship among income, prices, and food choice has been extensively studied, the GDD and ICP data allowed for a global coverage rarely seen in food and nutrition demand research facilitating comparisons of individuals in rich and poor countries. Food and nutrition studies with a global focus mostly use national food availability estimates based on agricultural production, exports, and imports. Findings based on such estimates may be limited by differences between national food availability data and actual dietary consumption (Del Gobbo et al., 2015). Additionally, the nature of the available data in multi-country studies permit only estimates of elas-ticities at the national level, precluding an understanding of how income or price elasticities might
3The relationship between income and food choice is often defined by the income elasticity, which is the percentage re-sponse in intake due to a percentage change in income; the relationship between price and food choice is often defined by the own-price elasticity, which is the percentage response in intake due to a percentage change in the price of the good.
4While we present results related to individual food groups, a discussion of their nutritional and disease impacts is outside the scope of our analysis. Readers are referred to Imamura et al. (2015) and Lim et al. (2013) for a more thorough discussion of NCD risk and the selected food categories.
5The ICP data that are available for public access are limited to price-level indexes for broad categories such as food and nonalcoholic beverages. We were given special access to the disaggregated data for this project and related research.

3 The Influence of Income and Prices on Global Dietary Patterns by Country, Age, and Gender, ERR-225
Economic Research Service/USDA
vary across and within countries by age or gender—differences that could greatly influence certain dietary choices in response to income or prices. Furthermore, studies that consider subgroup charac-teristics have been limited to a single country or a select group of countries (Dubois et al., 2014; Guo et al., 2000).

4 The Influence of Income and Prices on Global Dietary Patterns by Country, Age, and Gender, ERR-225
Economic Research Service/USDA
Income, Prices, and Diet
Dietary choices are influenced by a range of factors including income, food prices, sociocultural and religious preferences, education, local and regional agricultural production, domestic and inter-national food transportation networks, and marketing and retailing (Afshin et al., 2014). Although choosing a healthy diet may involve higher food costs, thus requiring more income or expenditures, this choice is also determined by an understanding of the links between nutrition and health and a willingness to forgo certain food attributes that could negatively affect future well-being (Blaylock et al., 1999; Finke and Huston, 2003). The latter implies that nutritional knowledge and personal discipline play an important role in determining food intake (Wardle et al., 2000). Some studies have found that when controlling for factors like education, which is a proxy for nutrition and health knowledge, the effect of income on intake may be relatively small (Behrman et al., 1988; Behrman and Wolfe, 1984; Wolfe and Behrman, 1983; Zhong et al., 2012). Other studies have found that nutri-tional knowledge modifies the effect of economic variables on intake, rather than being the main determinant (Beydoun and Wang, 2008).
There is extensive literature that focuses on estimating income and price elasticities of demand for food, nutrients, and/or calories, with estimates that vary based on the populations studied. Although income and prices are clearly important determinants of food choice, there is no strong consensus on how they affect food and nutrient intake, or how income and price changes might relate to qualita-tive rather than just quantitative dietary changes. Some interesting results, however, have emerged: Finke and Huston (2003) examined U.S. households and found income to be significant and inversely related to the probability of having a risky diet as measured by an index of unhealthy food consumption. Examining households in Europe and the United States, Darmon and Drewnowski (2008) found that higher socioeconomic status as measured by occupation, education, and income positively influenced healthy food choices. Similar relationships have been found in other studies (Gundersen et al., 2011; Loopstra and Tarasuk, 2013).
Since the share of income spent on food tends to decline as incomes rise (Engel’s law) (Houthakker, 1957), the effects of income on food demand tend to be stronger among lower income households. Consequently, income elasticities tend to be larger for poorer households and smaller for richer households. Income elasticities can also differ by food group, with staple foods having low or even negative income elasticities and high-value food products having higher elasticities, though results are often context-specific (Deaton, 1997; Strauss and Thomas, 1995). Income (or expenditure) elas-ticity estimates for staple foods tend to vary between 0.3 and 0.6 (Bouis, 1994).6 These household-level results on income and diet from the 1990s preceded the recent decades of income growth and rapid changes due to globalization. More recently, Kumar et al. (2011) estimated expenditure elastici-ties for India, and their results for cereals varied from 0.5 for very poor households to 0.0 for higher income households. Zhou et al. (2014) find that the income elasticity for cereals in China declined from 0.4 in 2000 to 0.3 in 2010, reflecting the economic growth during this period. Estimates for expenditure elasticities for bread in Australia, the United States, Canada, and Japan, as reported by Ulubasoglu et al. (2015), ranged from 0.5 in Japan to approximately 1.0 in Canada.
Although country-specific studies can take advantage of a lot of detailed information from house-hold surveys, the results from these studies are to some degree influenced by the underlying defini-tion of the food groups considered, as well as other country-specific factors, and therefore do not
6Total expenditure is often used as a proxy for income since it is (often) measured more accurately than income.

5 The Influence of Income and Prices on Global Dietary Patterns by Country, Age, and Gender, ERR-225
Economic Research Service/USDA
lend themselves to cross-country comparisons. However, global nutrition and health research can benefit from comparing consumer behavior across countries, ideally worldwide. Unfortunately, there are relatively few cross-country studies because there are few publicly available databases with information on per capita expenditures or intake for multiple goods and countries. For conducting cross-country research, a dataset that covers a sufficiently large number of countries to be represen-tative of global trends is ideal.
One such dataset is the ICP database, which has been used by a number of researchers over the years. Clements and Theil (1979) and Suhm (1979) were the first to apply a cross-country demand system to ICP data, which in 1975 covered 15 countries and 8 groups of consumer goods (Regmi and Seale, 2010). Muhammad et al. (2011) reported expenditure elasticities for food based on the 2005 ICP data, which covered 144 countries.7 Their expenditure elasticity estimates ranged from 0.51 in low-income countries to just 0.02 in high-income countries for cereals. Results for meats were higher, 0.77 in low-income countries and 0.49 in high-income countries. Similar estimates were found by Seale et al. (2003) using 1996 ICP data.
Consumer demand, particularly food demand, usually responds to price changes. While it is intui-tively clear that the quantity demanded for a product will decrease if its relative price increases, the degree of this price response depends on a number of factors including income, the availability of substitutes, and other factors. Preferences, such as those rooted in cultural and religious practices, may lead to weaker price responsiveness than otherwise expected. Additionally, consumers tend to have lower price responsiveness (measured own-price elasticities) for necessities, such as staple foods, than for higher value foods such as meats (Schnepf and Richardson, 2011).
The importance of income level as a determining factor in price responsiveness was shown by Timmer (1981), who found that in order to study food consumption patterns, it was necessary to disaggregate by commodity as well as by income class. He argued that “the poor behave rationally, but more sensitively to changes in their economic environment” (Timmer, 1981, p. 441).
Overall, lower income households tend to be more responsive to food prices than high-income households. Using 2005 ICP data, Muhammad et al. (2011) showed that food budgets in lower income countries were on average 49 percent of total expenditures compared to 20 percent in high-income countries and the corresponding own-price elasticities for food were estimated to be an average of -0.57 for low-income countries, compared to -0.36 for high-income countries. Green et al. (2013) conducted a systematic review of the effect of rising food prices on food consumption by running meta-regressions on 3,495 own-price food elasticities from 162 countries as reported in 136 studies. They found that in low-income countries, a 1-percent increase in the price of cereals led to a 0.61-percent reduction in consumption; in contrast, in high-income countries, they found a 0.43-percent reduction. The effect of a percentage increase in the price of meat, a higher value product, showed stronger price responsiveness: -0.78 for low-income countries and -0.60 for high-income countries. Andreyeva et al. (2010) reviewed 160 studies on the price elasticity of demand for major food categories. They found price elasticities for foods and nonalcoholic beverages ranging from -0.27 to -0.81, and much higher responsiveness for food away from home, soft drinks, juice, and meats, with price elasticities between -0.70 and -0.80.
7The estimates in this study were based on per-capita expenditures and not dietary intake.

6 The Influence of Income and Prices on Global Dietary Patterns by Country, Age, and Gender, ERR-225
Economic Research Service/USDA
Data and Methods
The Global Dietary Database
For our assessment of global dietary behavior, we used the 2010 Global Dietary Database (GDD), a database of intake data (in gram equivalents per day) on 11 major food categories based on age and gender across 187 countries (see box, “Global Dietary Database Overview”). Our analysis is global in reach and includes 164 countries, divided into 6 regions: Southeast Asia and the Asian Pacific (Asia); Former Centrally Planned economies (FCP) of Central and Eastern Europe and Central Asia; the Middle East, North Africa, and South Asia (MENA/South Asia); Latin America and the Caribbean (LAC); Sub-Saharan Africa (SSA); and the Rest of the World (ROW) (table 1).8 Although the GDD covers 187 countries, our analysis was limited to the number of countries with corresponding price data from the 2011 ICP; for each country in the analysis, both intake values and prices were needed.
The food categories are plant based (fruit, vegetables, beans/legumes, nuts/seeds, whole grains); meat and fish (unprocessed red meat, processed meat, fish); and beverages (milk, 100-percent fruit juice, and sugar-sweetened beverages). These food categories are not exhaustive and, in some cases, do not cover dietary staples and other important sources of calories such as corn and potatoes.9
The fruit category includes fresh, frozen, and canned fruit, all of which may provide micronutri-ents. However, salted and pickled fruits were excluded during data collection because of their high sodium levels and possible negative health effects. The vegetable group excludes starchy vegetables such as potatoes and corn. The whole-grains category includes foods that have a fiber content of at least 1 gram per 10 grams of carbohydrate, among typically consumed processed grain products such as breakfast cereals, bread, and pasta. The fruit juice category includes only 100-percent juice, while all other juice-containing beverages are included in the sugar-sweetened beverages category (see table 2 for further details).
Income Data
For income, we used 2010 per-capita gross domestic product (GDP) data from the World Bank Development Indicators Database.10 To account for differences in currency and purchasing power across economies, we used purchasing power parity-adjusted estimates, discounting differences across countries due to disparities in the overall price level. The lowest per capita income region is SSA (an average per capita income of $4,160); however, within SSA are large variations in income ranging from $632 in the Democratic Republic of Congo to $34,441 in Equatorial Guinea (table 3). The richest region is ROW, which includes most of the world’s developed countries. The average per capita income for ROW is $38,799, ranging from $7,366 in Fiji to $89,147 in Luxembourg.
8The ROW region comprises largely Western, industrialized countries; while not geographically connected, these countries share other similarities. We included several small island countries in this grouping because they were not suf-ficiently numerous to merit their own regional grouping.
9See Appendix 2: Dietary Intake Across Regions for a discussion of GDD mean intake levels by food category and region.
10The World Bank database of development indicators can be accessed at http://data.worldbank.org/data-catalog/world-development-indicators.

7 The Influence of Income and Prices on Global Dietary Patterns by Country, Age, and Gender, ERR-225
Economic Research Service/USDA
Global Dietary Database Overview
The Global Dietary Database (GDD) contains intake values on select food categories by age and gender for 187 countries. It makes use of 325 dietary surveys of 1.75 million individuals, repre-senting 116 countries and 89 percent of the global adult population, and is currently maintained by the Global Nutrition and Policy Consortium based at the Tufts Friedman School of Nutrition Science and Policy. Using qualitative assessment and quantitative modeling, the information from the 325 surveys was combined with relevant country-level information and the United Nations Food and Agriculture Organization (FAO) food balance sheets to derive estimates of intakes by food category, age, gender, and country.
In developing the database, researchers searched multiple electronic databases and worked with government authorities worldwide to identify and obtain nationally representative dietary intake surveys and large subnational surveys. Individual-level surveys from large cohort studies as well as other data sources on diet such as the World Health Organization (WHO) Global InfoBase, WHO STEPwise approach to Surveillance (STEPS) database, and household expenditure surveys were used for countries without identified national or subnational individual-level dietary surveys.
Although GDD data represent the most up-to-date, comprehensive snapshot of global consump-tion patterns available, there are limitations to consider. The fact that individual-level national surveys were not available for every country and dietary factor resulted in increased statistical uncertainty and a greater reliance on modeling and adjusted FAO data than on individual-level national surveys to arrive at final estimates. Consequently, GDD data could be more similar to data from FAO food balance sheets than to national survey data and have greater statistical uncertainty for foods, countries, and demographic subgroups underrepresented in global dietary surveys.
For instance, fruit and vegetables were the most frequently assessed dietary factor in individual-level surveys, included in 214 surveys from 109 countries (85 percent of the global population). Nearly 60 percent of the 214 surveys had age- and gender-specific data. For whole grains, however, there were only 39 surveys from 53 countries. Although all 39 surveys contained age- and gender-specific data, they covered only 41 percent of the global population. Patterns in data availability also indicate key gaps for developing nations, particularly in Sub-Saharan Africa (SSA). For example, among world regions, SSA had the fewest available individual-level dietary data, and mostly only on fruit and vegetables from the WHO Global InfoBase. Arguably, our results for whole grains may be statistically less precise than our results for fruit and vegetables. Likewise, our results for SSA may be statistically less precise than our results for higher income countries and more represented regions.
See the following for a more detailed discussion of the methods and descriptive findings of the Global Dietary Database: Del Gobbo et al., 2015; Imamura et al., 2015; Micha et al., 2012; Micha et al., 2014; Micha et al., 2015; Singh et al., 2015.

8 The Influence of Income and Prices on Global Dietary Patterns by Country, Age, and Gender, ERR-225
Economic Research Service/USDA
Table 1Countries included in this study, by region
Southeast Asia/ Asian Pacific (Asia)
Former Centrally Planned econo-mies (FCP)
Mideast/North Africa (MENA)/ South Asia
Latin America/ Caribbean (LAC)
Sub-Saharan Africa (SSA)
High income/ rest of world (ROW)
Brunei DarussalamCambodiaChinaIndonesiaJapanSouth KoreaLaosMalaysiaMaldivesPhilippinesSingaporeThailandVietnam
AlbaniaArmeniaAzerbaijanBelarusBosnia and HerzegovinaBulgariaCroatiaCzech RepublicEstoniaGeorgiaHungaryKazakhstanKyrgyzstanLatviaLithuaniaMacedoniaMoldovaMongoliaMontenegroPolandRomaniaRussiaSerbiaSlovak RepublicSloveniaTajikistanUkraine
AlgeriaBahrainBangladeshBhutanEgyptIndiaIranIraqIsraelJordanKuwaitMoroccoNepalOmanPakistanQatarSaudi ArabiaSri LankaTunisiaTurkeyUnited Arab EmiratesWest Bank-GazaYemen
Antigua and BarbudaBahamasBarbadosBelizeBoliviaBrazilChileColombiaCosta RicaCubaDominicaDominican RepublicEcuadorEl SalvadorGrenadaGuatemalaHaitiHondurasJamaicaMexicoNicaraguaPanamaParaguayPeruSt. LuciaSt. Vincent and GrenadinesSurinameTrinidad and TobagoUruguayVenezuela
AngolaBeninBotswanaBurkina FasoBurundiCabo VerdeCameroonCentral African RepublicChadComorosCongo, Democratic RepublicCongo, RepublicCote d’IvoireDjiboutiEquatorial GuineaEthiopiaGabonGambiaGhanaGuineaGuinea-BissauKenyaLesothoLiberiaMadagascarMalawiMaliMauritaniaMauritiusMozambiqueNamibiaNigerNigeriaRwandaSao Tome and PrincipeSenegalSierra LeoneSouth AfricaSudanSwazilandTanzaniaTogoUgandaZambiaZimbabwe
AustraliaAustriaBelgiumCanadaCyprusDenmarkFijiFinlandFranceGermanyGreeceIcelandIrelandItalyLuxembourgMaltaNetherlandsNew ZealandNorwayPortugalSeychellesSpainSwedenSwitzerlandUnited KingdomUnited States
Source: USDA, Economic Research Service.

9 The Influence of Income and Prices on Global Dietary Patterns by Country, Age, and Gender, ERR-225
Economic Research Service/USDA
Table 2Food categories in the Global Dietary Database1
Food Description: total intake is measured in gram equivalents per day.
Fruit Total fruit intake, including fresh, frozen, cooked, canned, or dried fruit (excludes fruit juices and salted or pickled fruits)
VegetablesTotal vegetable intake, including fresh, frozen, cooked, canned, or dried vegetables (excludes salted or pickled vegetables, vegetable juices, starchy vegetables (e.g., potatoes, corn), legumes, nuts, and seeds)
Beans/legumes Total intake of beans and legumes, including tofu (excludes soy milk)
Nuts/seeds Total intake of nuts and seeds
Whole grains
Total intake of whole grain foods, including from cereals, bread, rice, pasta, biscuits, muffins, tortillas, etc. A whole grain is defined as a food with ≥1.0 grams of fiber per 10 grams of carbohydrate, representing the approximate fiber content of whole wheat.
Unprocessed red meat Total unprocessed red meat intake from all livestock, both domesticated and non-domesticated (excludes poultry, fish, eggs, and all processed meats)
Processed meatTotal processed meat intake processed with sodium or other preservatives, including processed deli or luncheon meats, bacon, salami, sausages, bratwursts, frankfurters, hot dogs, etc.
Fish Total seafood intake from fish and shellfish
Milk Total milk intake, combining non-fat, and low-fat and full-fat milk (excludes soy milk, other plant-derived alternatives)
Fruit juice Total fruit-juice intake, 100-percent fruit juice only
Sugar-sweetened beverages
Total sugar-sweetened beverages intake, defined as any sugar-sweetened beverage containing ≥ 50 calories per 8-ounce (226.8-gram) serving, includ-ing carbonated beverages, soft drinks, sodas, energy drinks, sweetened ice teas, fruit drinks, etc. (excludes 100-percent fruit and vegetable juices)
1These dietary factors were originally identified and evaluated because of their influence on chronic diseases such as coronary heart disease, stroke, diabetes, obesity, and diet-related cancers.
Source: Tufts University Friedman School of Nutrition Science and Policy, Global Nutrition and Policy Consortium, Global Dietary Database.
Table 3Gross domestic product per capita (purchasing power parity-adjusted) statistics by region, 2010
Region Mean MedianStandard deviation Minimum Maximum
--------------------------------------------Dollars--------------------------------------------
World 17,103 10,651 19,060 632 127,236
Sub-Saharan Africa 4,160 1,953 6,035 632 34,441
Latin America/Caribbean 12,128 10,664 6,066 1,518 29,321
Former Centrally Planned economies 14,752 15,703 7,492 2,110 28,016
Asia 21,933 10,681 24,035 2,513 71,816
MENA/South Asia 24,421 11,256 30,667 1,999 127,236
High income/ROW 38,799 38,671 14,508 7,366 89,147
MENA = Middle East/North Africa. ROW = rest of world.
Source: USDA, Economic Research Service, based on data from the World Bank.

10 The Influence of Income and Prices on Global Dietary Patterns by Country, Age, and Gender, ERR-225
Economic Research Service/USDA
Food Price Data
We used price-level indexes for select food categories from the 2011 ICP data. The ICP is a world-wide statistical initiative that estimates purchasing power parities (PPPs) for use as conversion factors to compare the size and price levels of economies around the world. The 2011 ICP data cover nearly 200 economies from 8 regions, 7 geographical regions: Africa, Asia and the Pacific, Commonwealth of Independent States, Latin America, the Caribbean, Western Asia, and the Pacific Islands, and an eighth region composed of Organization for Economic Co-operation and Development (OECD) and Western European economies. The ICP derives PPP estimates in stages: first for individual goods and services, then for groups of products, and finally for each of the various levels of aggregation up to GDP. While the purpose of the ICP is to estimate the real size of the global economy, the GDP and aggregate PPP estimates are based on expenditure and price data for narrowly defined catego-ries, including disaggregated food groups (table 4).11 For a more detailed discussion of the ICP, see Purchasing Power Parities and the Real Size of World Economies: A Comprehensive Report of the 2011 International Comparison Program (World Bank, 2015).12
PPPs are spatial indexes comparing the price of a given basket of goods and services across econo-mies relative to a base economy. For example, if the price of a hamburger is €4.80 in France and $4.00 in the United States, the PPP for hamburgers between the two economies is $0.83 to the euro from the French perspective (4.00/4.80) and €1.20 to the dollar from the U.S. perspective (4.80/4.00) (World Bank, 2014, p. 7). Put differently, for every dollar spent on hamburgers in the United States, €1.20 would have to be spent in France. To make cross-country comparisons, PPPs must be standard-ized to a common currency unit (usually the U.S. dollar). For instance, at an exchange rate of €0.80 per $1.00, the previous example can be restated as follows: for every dollar spent on hamburgers in the United States, $1.50 would have to be spent in France. Currency-standardized PPPs are often referred to as price-level indexes.
Table 4 shows the GDD food categories and their corresponding ICP food categories. Fish and milk are categories with a one-to-one matching between the two data sources. Proxies were used for beans/legumes and nuts/seeds since they are not explicitly defined in the ICP data. For instance, the fish intake category from the GDD corresponded to the fish (fresh, chilled, and frozen) price index from the ICP, but the nuts and seeds category from the GDD was matched with the edible oils and fats price index from the ICP, which is the closest food category given the use of nuts and seeds in oil production. The most narrowly defined ICP category for nonalcoholic beverages is mineral waters, soft drinks, fruit, and vegetable juices. The price index for this category was originally used for both sugar-sweetened beverages and fruit juice. However, preliminary results showed that the sugar price index and fresh-fruit price index were considerably better predictors of sugar-sweetened beverage and 100-percent fruit juice intake, respectively.13 This is plausible because both are primary inputs in production, affecting the price of the final product. All else equal, countries with relatively low sugar prices should have lower sugar-sweetened beverage prices. The same could be said of 100-percent fruit juice prices in countries with relatively low fresh-fruit prices.
11The ICP data for these narrowly defined categories cover 180 countries. 12ICP publications can be found at http://siteresources.worldbank.org/ICPEXT/Resources/ICP_2011.html.13In comparing the relative performance of the price indexes, we considered the overall fit of the model (adjusted R2),
parameter significance, and the predictive power of the model in explaining intake values across countries.

11 The Influence of Income and Prices on Global Dietary Patterns by Country, Age, and Gender, ERR-225
Economic Research Service/USDA
The nonalcoholic beverage category from the ICP includes all beverage products (including bottled water). Consequently, price differences for either sugar-sweetened beverages or 100-percent fruit juice may not be fully reflected by this category.
The remaining GDD food categories corresponded to more than one ICP category. For instance, the ICP disaggregates fruits and vegetables into two groupings: fresh and frozen/preserved/processed. For fruits and vegetables, we used a simple average of the ICP categories. Simple averages were not sufficient for whole grains, unprocessed red meat, and processed meat because of significant differ-ences in expenditures across countries (e.g., negligible pork demand in Islamic countries relative to Western countries). For these categories, we used an expenditure-weighted average of the ICP cate-gories. For instance, whole grains corresponded to two ICP categories: bread and rice. If a country’s expenditure on bread as a share of its total expenditure on bread and rice was 0.20, the whole grains
Table 4Global Dietary Database and 2011 International Comparison Program food categories
Global Dietary Database Select ICP food categories Price measure
Fruit Fresh or chilled fruitSimple average
Frozen, preserved, or processed fruit and fruit-based products
Vegetables Fresh or chilled vegetables other than potatoesSimple average
Frozen, preserved, or processed vegetables and vegetable-based products
Beans and legumes Frozen, preserved, or processed vegetables and vegetable-based products No averaging required
Nuts and seeds Other edible oils and fats No averaging required
Whole grains BreadExpenditure weighted average
Rice
Unprocessed red meat Beef and veal
Expenditure weighted averagePork
Lamb, mutton, and goat
Processed meat Beef and vealExpenditure weighted average
Pork
Fish Fresh, chilled, or frozen fish and seafood No averaging required
Milk Fresh milk No averaging required
Sugar-sweetened beverages Sugar No averaging required
Fruit juice Fresh or chilled fruit No averaging required
Note: Price averaging was not required for one-to-one category mappings (beans and legumes, nuts and seeds, fish, milk, sugar-sweetened beverages, and 100-percent fruit juice).
Source: USDA, Economic Research Service, based on Tufts University Friedman School of Nutrition Science and Policy, Global Nutrition and Policy Consortium, Global Dietary Database; and World Bank, International Comparison Program (ICP).

12 The Influence of Income and Prices on Global Dietary Patterns by Country, Age, and Gender, ERR-225
Economic Research Service/USDA
price index for that country was 0.20×bread price index + 0.80×rice price index.14 See table 4 for the complete listing of how the GDD intake data were matched to the ICP price data.
Model and Estimation
Since the focus of this study is intake and not purchases or expenditures, the economic properties associated with demand estimation based on expenditure data do not necessarily apply. For example, the adding-up property in demand is based on expenditures on all categories “adding up” to total income (or total expenditures). Such a relationship does not apply to individual intake, particu-larly when the correspondence between purchases and intake is not one to one. Since the standard demand framework does not fully apply in this context, past studies using intake, nutrients, or calo-ries data have used fairly basic functional forms for analysis (linear, log-linear, etc.) (e.g., Behrman and Wolfe, 1984; Sahn, 1988; Subramanian and Deaton, 1996). Yet, there are still economic factors that must be considered. An important consideration is selecting a functional form that fits the observed data while providing estimates consistent with basic economic theory and consumer behavior. As mentioned, intake responsiveness to income and prices will likely diminish as incomes rise. The reason being, once the need for a well-balanced meal is satisfied, increases in income could result in increased demand for other quality attributes, such as taste, variety, and convenience, resulting in a smaller share of expenditures being devoted to intake and nutrition, and thus a smaller responsiveness of intake to changes in income or prices (Timmer, 1981; Banks et al., 1997; Deaton, 1997; Regmi et al., 2001). Therefore, any functional form considered should account for the effects of income level on intake responsiveness.
Let qgiC represent mean daily intake (in gram equivalents per day) of the ith food category in country C by subgroup g and piC the price level index for the same food category and country.15 Let YC and PC represent real per capita income and the food-price level index, respectively, in country C. The following semi-log quadratic form is used to estimate the relationship among food intake, income, and prices: 16
(1) q Y pP
Y pgiC i i C i
iC
Ci C
i= + ( ) +
+ ( )×α α α α0 1 2 3
* * * *log log log log CC
C
i C giC
P
Y u
+ ( ) +α42* log .
The αni* � terms are parameters to be estimated and ugiC is a random error term.17
14When mapping the two data sources, we considered other ICP food categories (preserved milk and dairy products, processed and preserved fish, other meat, cereals, and pasta). These categories made no significant difference in results and, in many instances, decreased the performance of the models.
15g = {gender and age}16Many studies actually used a double-log quadratic form (e.g., Sahn, 1988). However, a problem with the double-log
form is that significant differences in intake across subgroups can be lost in log conversions. For instance, assume that intake is 60 grams per day (g/d) for one demographic subgroup and 90 g/d for another. The logs of these values are 4.09 and 4.50, respectively. A semi-log relationship allowed for a better assessment of subgroup effects on intake responsive-ness. It has also been shown that under straightforward conditions, semi-log models of demand are consistent with eco-nomic theory and contain the necessary information for obtaining, for instance, reliable measures of consumer welfare and the underlying preference structure of consumers (LaFrance, 1990).
17n = {0,1,2,3,4}.

13 The Influence of Income and Prices on Global Dietary Patterns by Country, Age, and Gender, ERR-225
Economic Research Service/USDA
Note that equation (1) allows for the income and price effects to vary based on income level due to the quadratic income term, log(YC)2, and income-price interaction term, log(YC) × log(piC/PC) . Also, note that the price term is defined by the price of the ith food category piC relative to overall food prices PC . Thus, the model discounts any price differences across countries due to differences in overall food prices and implicitly accounts for the cross-price effects of other foods, albeit in a very general way. For instance, holding real income and other factors constant, if both fruit and food prices are 10 percent higher in one country than in another, there should be no difference in fruit intake between the two countries. Additionally, if fruit prices are the same in two countries, but the overall food price level is not, fruit intake should be greater in the country with the higher food price level because fruits are cheaper relative to other foods.
Our modeling framework accounts for differences across gender and age subgroups by allowing these factors to have a direct effect on food intake, as well as an additional effect through income and prices. Accordingly, the parameters in equation (1) were expanded to account for differences across gender and age subgroups. Global analyses of food demand behavior should also account for differences in preferences across countries due to cultural differences or other non-income or non-price related factors (Kearney, 2010; Clements and Theil, 1979). We assumed these preferences are region specific and expanded the model parameters accordingly:
(2) α α α α α αni ni ni ni ni ni k kkW Age Age Regionn
*
, , ,= + + + +
=
∑0 1 2 32
4
0 1 2 3,, .4{ }
W is a binary variable (= 1 for women and 0 otherwise). Age is a continuous variable ranging from 20 to 80 in 5-year intervals. The Age2 term is added to allow for nonlinear age effects and the possi-bility of optimal responsiveness between the youngest and oldest subgroups. We account for prefer-ences across countries due to factors not related to income or prices by including regional binary variables (Region). These terms account for differences in dietary intake that are influenced by factors such as religious traditions and culture (Kearney, 2010). The regions are defined according to table 2: Asia, FCP, LAC, SSA, and MENA/South Asia. The rest of the world (ROW) is the base or reference region.
Taking the derivative of equation (1) with respect to log(YC) or log(piC), and then multiplying by 1qgiC
, the income elasticity (ε) and own-price elasticity (η) are respectively derived as follows:
(3) ε α α αgiCgiC
C giCi i
iC
Ci C
qY q
pP
Y= = +
+ ( )
%%
log log* * *∆
∆1 21 3 4
(4) η α αgiCgiC
iC giCi i C
qp q
Y= = + ( ) %%
log .* *∆
∆1
2 3
εgiC is the percentage change in intake due to a percentage change in income and is positive or nega-tive depending on the food category. If εgiC > 0, the food category is considered normal since an increase in income results in an increase intake. And when εgiC < 0, the food category is considered inferior since an increase in income results in a decline in intake. ηgiC is the percentage change in intake due to a percentage change in the price level; ηgiC should be negative since an increase in price usually leads to a decrease in quantity demanded. Intake could be highly responsive to price

14 The Influence of Income and Prices on Global Dietary Patterns by Country, Age, and Gender, ERR-225
Economic Research Service/USDA
(elastic demand), which is the case when ηgiC > 1, indicating that the magnitude of intake respon-siveness is larger than the percentage change in price. If 1 >ηgiC > 0, the magnitude of intake responsiveness is smaller than the percentage change in price (inelastic demand).18
Since αni* � can
vary with gender, age, and region, depending on significance of the terms in equation (2), εgiC and ηgiC can also vary with gender, age, and region.
Equation (1)—including the parameters from equation (2)—was estimated for each food category separately using a least-squares procedure that allowed for error correlations among observations within the same country (country clusters) (Cameron and Trivedi, 2005).19 The coefficients from equation (1) and (2) were then used to derive estimates of εgiC and ηgiC for each food category, by country or region, and by age and gender. We also derived the standard errors for each εgiC and ηgiC estimate using the delta method (Hall and Cummins, 2005, p.37).20
Preliminary results indicated that while α0i* varied with gender, age, and region, the remaining
estimates (α α1 4i i* * to ) varied with gender and age only. Thus, the parameters in the final model were
specified as follows:
α α α α α α
α α0 0 0 0 1 0 2 0 3
20 4
1 1 0
i i i i i i k k
i i
kW Age Age Region*
*
.= + + + +
= +
Σ
αα α α
α α α α α
α
1 1 1 2 1 32
2 2 0 2 1 2 2 2 32
3
i i i
i i i i i
i
W Age AgeW Age Age+ +
= + + +*
**
*
= + + +
= + + +
α α α α
α α α α α3 0 3 1 3 2 3 3
2
4 4 0 4 1 4 2 4 3
i i i i
i i i i i
W Age AgeW Age AAge2
While the GDD provides the most comprehensive country-level dataset that we are aware of, there are limitations that must be considered. Dietary intake varies by socio-economic status and location (rural versus urban) within countries, as well as age and gender. While the dataset provides broad age categories and gender, we are unable to account for other types of group heterogeneity. Similarly, our income and price data are at the national level; however, income and prices vary greatly within countries, across regions and socioeconomic groups. While we enable cross-country comparisons of individual behavior by providing a global perspective of how intake responds to income and prices at the national level, we do not account for differences in income and prices between men and women, and among different age groups within countries/regions.
Our defined regions may not completely represent behavior across the countries within each region. That is, there are some countries that do not perfectly fit within their defined region. For instance, individuals in high-income Asian countries such as Japan and South Korea are likely different from individuals in other Asian countries such as China and the Philippines. The same could be said of individuals in South Asian countries such as India and Bangladesh when compared to North African and Middle Eastern countries, and the relatively few island economies included in ROW when compared to the Western countries that make up ROW. It could be argued that these inconsisten-
18WhenηgiC = 1, demand is considered unit elastic; the percentage changes in intake and price are of equal magnitude.19Since we are not estimating share equations or imposing parameter restrictions across food categories (equations),
each intake equation could be estimated separately.20The econometric software TSP version 5.0 (Palo Alto, CA) was used to estimate all equations and derive the income
and price elasticity estimates and their corresponding standard errors.

15 The Influence of Income and Prices on Global Dietary Patterns by Country, Age, and Gender, ERR-225
Economic Research Service/USDA
cies could lead to biased elasticity estimates. Note that these countries were not explicitly defined as regions due to their limited number; high-income Asian countries were only 2 percent of total coun-tries, South Asia only 3 percent, and island countries only 0.6 percent. These are particularly small when compared to other regions (e.g., SSA accounted for 27 percent). To examine if our results were sensitive to how the regions were specified, we estimated similar models with these smaller regions explicitly defined. That is, we removed high-income Asian countries, South Asian countries, and Other Islands from Asia, MENA/South Asia, and ROW, respectively, and specified these regions in addition to the original six. Overall, we found no significant difference in the estimates, particularly in the income, price, age, and gender estimates used to derive the income and own-price elasticities (see “Appendix 1: Full-Model and Base-Model Estimates” for more detail).

16 The Influence of Income and Prices on Global Dietary Patterns by Country, Age, and Gender, ERR-225
Economic Research Service/USDA
Empirical Results
Income and Price Elasticities by Region and Subgroup
The following discussion focuses on the income and price elasticities. The estimated coefficients used to derive the elasticities are discussed in Appendix 1. Also, see “Appendix 2: Dietary Intake Across Regions” for a discussion of mean intake levels of the various food categories by region.
The income (tables 5−6) and price (tables 7−8) elasticities are reported for four demographic groups (women, age 20; men, age 20; women, age 80; and men, age 80).21 These groups were chosen to provide the range of responses based on age. We identified the “type” of good based on the income elasticities. Economists define “normal goods” as those with positive income elasticities. Goods with negative income elasticities are considered “inferior” goods; individuals consume these goods, particularly when income is low, but prefer other goods when income increases. Among normal goods, those with elasticities between 0 and 1 are considered “necessities” and those with elasticities greater than 1 are considered “luxury” goods. The intuition is that demand for household necessi-ties is not affected greatly by changes in income; rather, households sacrifice other food or nonfood purchases to protect such basic necessities. On the other hand, when income decreases, luxury items are the first foods to be sacrificed. Recall that based on the own-price elasticities, intake demand could either be inelastic (a small response to a price change) or elastic (a large response to a price change). Overall, our income and price elasticity estimates differed across regions and food catego-ries. However, differences across gender and age subgroups within regions were not as significant except for fruit, processed meat, fish, and sugar-sweetened beverages.
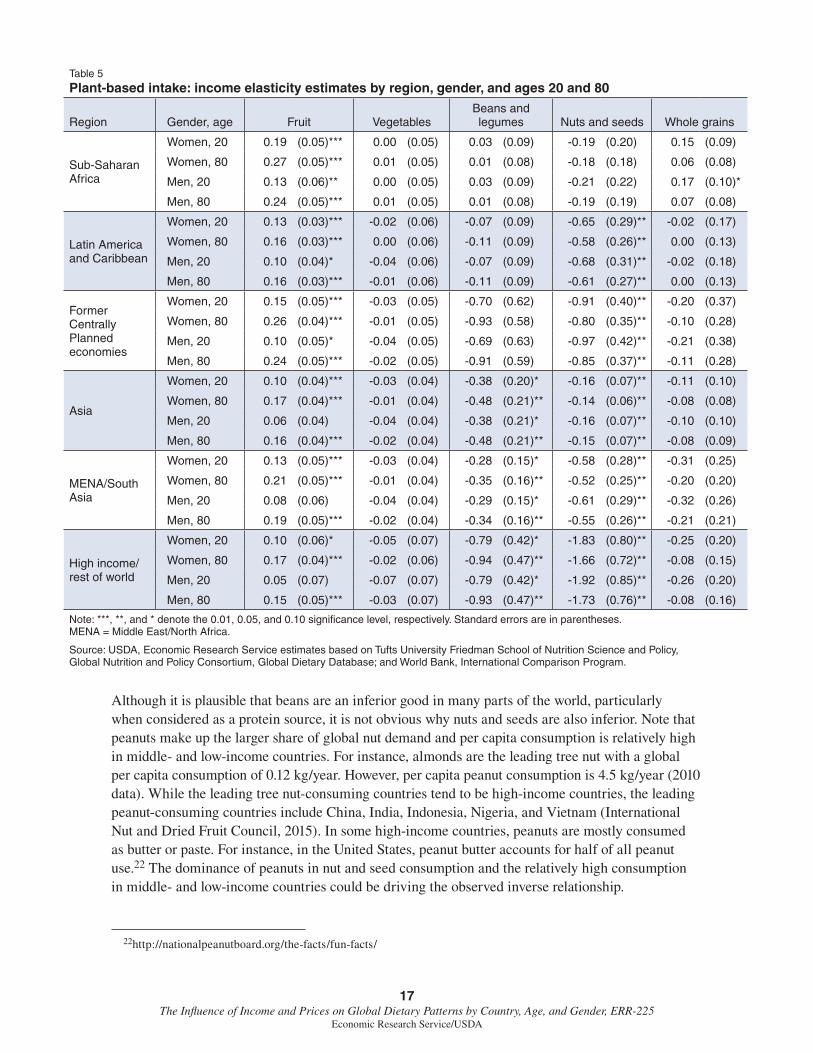
We begin with results for plant-based food intake. For fruit, we observe positive income elastici-ties across all demographic groups and regions ranging from 0.27 in SSA (women, age 80) to 0.05 in ROW (men, age 20). Across regions, the fruit income elasticity is highest for SSA, and within regions, older women are the most responsive to changes in income while young men are the least responsive and, in some instances, nonresponsive. If we leave out the insignificant estimates for men, age 20, in MENA/South Asia, Asia, and ROW, percentage increases in income are associated with increased fruit intake ranging from 0.10 to 0.27 percent (table 5). While these results are partly driven by older women consuming more fruit than any other subgroup, they also indicate a common finding in nutrition research: age tends to be positively correlated with nutritional knowledge and better diet choices, and women are more likely than men to be concerned with their diet (Baker and Wardle, 2003; Parmenter et al., 2000).
Other than fruit, nuts/seeds and beans/legumes are the only other plant-based categories with income elasticities significantly different from zero. Unlike fruit, however, these categories are infe-rior goods. For beans and legumes, the responsiveness of intake to income is insignificant in the two high-consuming regions (SSA and LAC), as well as in FCP. However, in MENA/South Asia and Asia, a 1-percent increase in income is associated with decreased intake of 0.28 to 0.38 percent. In ROW, the decreased intake is 0.79 to 0.94 percent. Nuts and seeds are inferior in all regions except SSA where the estimates are negative but statistically insignificant. The income elasticities are the most negative in ROW (-1.92), which is in part influenced by relatively low nut and seed intake in these countries, and the least negative are in Asia (-0.14) (see table 5).
21The estimates in tables 5-8 are derived using regional averages of income and prices.
17 The Influence of Income and Prices on Global Dietary Patterns by Country, Age, and Gender, ERR-225
Economic Research Service/USDA
Although it is plausible that beans are an inferior good in many parts of the world, particularly when considered as a protein source, it is not obvious why nuts and seeds are also inferior. Note that peanuts make up the larger share of global nut demand and per capita consumption is relatively high in middle- and low-income countries. For instance, almonds are the leading tree nut with a global per capita consumption of 0.12 kg/year. However, per capita peanut consumption is 4.5 kg/year (2010 data). While the leading tree nut-consuming countries tend to be high-income countries, the leading peanut-consuming countries include China, India, Indonesia, Nigeria, and Vietnam (International Nut and Dried Fruit Council, 2015). In some high-income countries, peanuts are mostly consumed as butter or paste. For instance, in the United States, peanut butter accounts for half of all peanut use.22 The dominance of peanuts in nut and seed consumption and the relatively high consumption in middle- and low-income countries could be driving the observed inverse relationship.
22http://nationalpeanutboard.org/the-facts/fun-facts/
Table 5Plant-based intake: income elasticity estimates by region, gender, and ages 20 and 80
Region Gender, age Fruit VegetablesBeans and legumes Nuts and seeds Whole grains
Sub-Saharan Africa
Women, 20 0.19 (0.05)*** 0.00 (0.05) 0.03 (0.09) -0.19 (0.20) 0.15 (0.09)
Women, 80 0.27 (0.05)*** 0.01 (0.05) 0.01 (0.08) -0.18 (0.18) 0.06 (0.08)
Men, 20 0.13 (0.06)** 0.00 (0.05) 0.03 (0.09) -0.21 (0.22) 0.17 (0.10)*
Men, 80 0.24 (0.05)*** 0.01 (0.05) 0.01 (0.08) -0.19 (0.19) 0.07 (0.08)
Latin America and Caribbean
Women, 20 0.13 (0.03)*** -0.02 (0.06) -0.07 (0.09) -0.65 (0.29)** -0.02 (0.17)
Women, 80 0.16 (0.03)*** 0.00 (0.06) -0.11 (0.09) -0.58 (0.26)** 0.00 (0.13)
Men, 20 0.10 (0.04)* -0.04 (0.06) -0.07 (0.09) -0.68 (0.31)** -0.02 (0.18)
Men, 80 0.16 (0.03)*** -0.01 (0.06) -0.11 (0.09) -0.61 (0.27)** 0.00 (0.13)
Former Centrally Planned economies
Women, 20 0.15 (0.05)*** -0.03 (0.05) -0.70 (0.62) -0.91 (0.40)** -0.20 (0.37)
Women, 80 0.26 (0.04)*** -0.01 (0.05) -0.93 (0.58) -0.80 (0.35)** -0.10 (0.28)
Men, 20 0.10 (0.05)* -0.04 (0.05) -0.69 (0.63) -0.97 (0.42)** -0.21 (0.38)
Men, 80 0.24 (0.05)*** -0.02 (0.05) -0.91 (0.59) -0.85 (0.37)** -0.11 (0.28)
Asia
Women, 20 0.10 (0.04)*** -0.03 (0.04) -0.38 (0.20)* -0.16 (0.07)** -0.11 (0.10)
Women, 80 0.17 (0.04)*** -0.01 (0.04) -0.48 (0.21)** -0.14 (0.06)** -0.08 (0.08)
Men, 20 0.06 (0.04) -0.04 (0.04) -0.38 (0.21)* -0.16 (0.07)** -0.10 (0.10)
Men, 80 0.16 (0.04)*** -0.02 (0.04) -0.48 (0.21)** -0.15 (0.07)** -0.08 (0.09)
MENA/South Asia
Women, 20 0.13 (0.05)*** -0.03 (0.04) -0.28 (0.15)* -0.58 (0.28)** -0.31 (0.25)
Women, 80 0.21 (0.05)*** -0.01 (0.04) -0.35 (0.16)** -0.52 (0.25)** -0.20 (0.20)
Men, 20 0.08 (0.06) -0.04 (0.04) -0.29 (0.15)* -0.61 (0.29)** -0.32 (0.26)
Men, 80 0.19 (0.05)*** -0.02 (0.04) -0.34 (0.16)** -0.55 (0.26)** -0.21 (0.21)
High income/ rest of world
Women, 20 0.10 (0.06)* -0.05 (0.07) -0.79 (0.42)* -1.83 (0.80)** -0.25 (0.20)
Women, 80 0.17 (0.04)*** -0.02 (0.06) -0.94 (0.47)** -1.66 (0.72)** -0.08 (0.15)
Men, 20 0.05 (0.07) -0.07 (0.07) -0.79 (0.42)* -1.92 (0.85)** -0.26 (0.20)
Men, 80 0.15 (0.05)*** -0.03 (0.07) -0.93 (0.47)** -1.73 (0.76)** -0.08 (0.16)
Note: ***, **, and * denote the 0.01, 0.05, and 0.10 significance level, respectively. Standard errors are in parentheses. MENA = Middle East/North Africa.
Source: USDA, Economic Research Service estimates based on Tufts University Friedman School of Nutrition Science and Policy, Global Nutrition and Policy Consortium, Global Dietary Database; and World Bank, International Comparison Program.

18 The Influence of Income and Prices on Global Dietary Patterns by Country, Age, and Gender, ERR-225
Economic Research Service/USDA
Next, we turn to the results for non-plant intake, where the income elasticities are mostly positive and significant across all food categories (table 6). Results indicate that unprocessed red meat is a normal good with little variation in the income elasticity across demographic groups (around 0.17 in ROW to 0.34 in Asia). The income elasticity for processed meat, unlike unprocessed red meat, is not significant for individuals in MENA/South Asia, Asia, and ROW, and income has no effect on women, age 80, globally. Processed meat intake is most responsive to income in SSA (as high as 0.46 for men, age 20), more than seven times the estimates for the same demographic group in other regions (0.06 in LAC and 0.05 in FCP). In LAC, MENA/South Asia, FCP, and Asia, fish is a normal good for older adults; however, fish intake for young adults is nonresponsive to income. Compared with the other meat cate-gories, fish intake is the least responsive to income; the largest income elasticity is only 0.12 (FCP men, age 80), and in SSA and ROW, fish intake levels are not associated with differences in income. The meat and fish income elasticities suggest that income growth will more likely lead to greater unpro-cessed red meat intake than processed meat or fish intake, with the exception of SSA, where there is a greater preference for processed meat, particularly for young adults (see table 6).
Table 6Meat, fish, and beverage intake: income elasticity estimates by region, gender, and ages 20 and 80
Region Gender, ageUnprocessed
red meatProcessed
meat Fish Milk
Sugar- sweetened beverages Fruit juice
Sub- Saharan Africa
Women, 20 0.26 (0.06)*** 0.38 (0.10)*** 0.05 (0.06) 0.38 (0.06)*** 0.21 (0.05)*** 1.01 (0.20)***
Women, 80 0.26 (0.06)*** 0.10 (0.12) 0.06 (0.05) 0.38 (0.06)*** 0.20 (0.06)*** 0.94 (0.29)***
Men, 20 0.26 (0.06)*** 0.46 (0.10)*** 0.05 (0.06) 0.39 (0.07)*** 0.19 (0.05)*** 1.03 (0.23)***
Men, 80 0.25 (0.06)*** 0.26 (0.10)** 0.07 (0.05) 0.39 (0.06)*** 0.20 (0.06)*** 0.79 (0.34)**
Latin America and Carib-bean
Women, 20 0.22 (0.04)*** 0.05 (0.03)* 0.00 (0.04) 0.14 (0.03)*** 0.01 (0.02) 0.20 (0.03)***
Women, 80 0.23 (0.04)*** 0.01 (0.03) 0.07 (0.04)** 0.12 (0.03)*** -0.02 (0.02) 0.20 (0.04)***
Men, 20 0.22 (0.04)*** 0.06 (0.03)** 0.01 (0.04) 0.14 (0.03)*** 0.01 (0.02) 0.20 (0.04)***
Men, 80 0.23 (0.04)*** 0.04 (0.03) 0.07 (0.04)** 0.12 (0.03)*** -0.03 (0.02) 0.18 (0.05)***
Former Centrally Planned econo-mies
Women, 20 0.20 (0.04)*** 0.04 (0.03) -0.01 (0.08) 0.14 (0.04)*** 0.08 (0.08) 0.45 (0.08)***
Women, 80 0.21 (0.04)*** 0.01 (0.03) 0.11 (0.07)* 0.11 (0.03)*** -0.06 (0.09) 0.48 (0.11)***
Men, 20 0.20 (0.04)*** 0.05 (0.02)** 0.00 (0.08) 0.14 (0.04)*** 0.06 (0.07) 0.47 (0.09)***
Men, 80 0.21 (0.04)*** 0.04 (0.03) 0.12 (0.06)* 0.11 (0.03)*** -0.08 (0.09) 0.43 (0.12)***
Asia
Women, 20 0.32 (0.09)*** 0.04 (0.06) 0.02 (0.03) 0.10 (0.10) -0.02 (0.10) 0.49 (0.11)***
Women, 80 0.33 (0.09)*** 0.00 (0.08) 0.06 (0.03)* 0.04 (0.09) -0.19 (0.11)* 0.51 (0.13)***
Men, 20 0.32 (0.09)*** 0.08 (0.07) 0.02 (0.03) 0.11 (0.10) -0.03 (0.09) 0.52 (0.12)***
Men, 80 0.34 (0.09)*** 0.05 (0.07) 0.06 (0.03)* 0.05 (0.10) -0.22 (0.11)** 0.47 (0.14)***
MENA/South Asia
Women, 20 0.21 (0.06)*** 0.04 (0.14) -0.01 (0.07) 0.08 (0.06) 0.00 (0.08) 0.47 (0.11)***
Women, 80 0.22 (0.06)*** -0.01 (0.17) 0.11 (0.07) 0.04 (0.06) -0.11 (0.09) 0.51 (0.13)***
Men, 20 0.22 (0.06)*** 0.11 (0.15) 0.01 (0.07) 0.09 (0.06) -0.01 (0.07) 0.48 (0.12)***
Men, 80 0.23 (0.06)*** 0.09 (0.15) 0.12 (0.07)* 0.04 (0.06) -0.13 (0.10) 0.48 (0.15)***
High income/ rest of world
Women, 20 0.17 (0.07)** -0.02 (0.04) -0.02 (0.06) 0.04 (0.05) -0.09 (0.09) 0.19 (0.05)***
Women, 80 0.17 (0.07)*** -0.01 (0.04) 0.06 (0.05) -0.00 (0.05) -0.26 (0.11)** 0.21 (0.06)***
Men, 20 0.17 (0.06)*** -0.00 (0.04) -0.01 (0.05) 0.04 (0.05) -0.09 (0.08) 0.20 (0.06)***
Men, 80 0.18 (0.07)*** 0.00 (0.04) 0.07 (0.05) -0.00 (0.05) -0.31 (0.12)** 0.20 (0.07)***
Note: ***, **, and * denote the 0.01, 0.05, and 0.10 significance level, respectively. Standard errors are in parentheses. MENA = Middle East/North Africa.
Source: USDA, Economic Research Service estimates based on Tufts University Friedman School of Nutrition Science and Policy, Global Nutrition and Policy Consortium, Global Dietary Database; and World Bank, International Comparison Program.

19 The Influence of Income and Prices on Global Dietary Patterns by Country, Age, and Gender, ERR-225
Economic Research Service/USDA
Compared with the other food categories, beverage intake is the most responsive to income. Milk is a normal good for all demographic groups in SSA, LAC, and FCP; however, milk intake levels are not associated with differences in income in MENA/South Asia, Asia, and ROW. The largest effects of income on milk intake are observed for SSA (0.39), followed by LAC and FCP (0.14). Of all the food categories, fruit juice intake is the most responsive to income where income elasticities are fairly consistent across demographic groups but differ across regions: 1.03 (SSA men, age 20) to 0.18 (LAC men, age 80) (see table 6).
The results for sugar-sweetened beverages are particularly interesting and require a more thorough explanation. Worldwide, there are large differences in sugar-sweetened beverage intake across age groups (which is not the case for the other food categories), with 20-year-olds consuming 4 times as much as 80-year-olds in most countries. Consequently, there are notable differences in the income elasticities for sugar-sweetened beverages between these two age groups, particularly in Asia and ROW. Interestingly, SSA is the only region where income has a positive effect on sugar-sweetened beverage intake, but in many parts of the world (LAC, FCP, and MENA/South Asia), the effects of income on intake is insignificant. In Asia and ROW, the effects of income on intake are not signifi-cant for young adults, but are significant and negative for older adults suggesting that older adults in these regions view sugar-sweetened beverages as inferior goods and will decrease their intake by about 0.2 percent (Asia) and 0.3 percent (ROW), given a percentage increase in income.
The differences in the income elasticities across regions are due, in part, to differences in regional income. To highlight the effects of affluence on intake responsiveness, we estimated the income elas-ticities across countries by income decile. Results are reported in figure 1 for four food categories (fruit, milk, processed meat, and sugar-sweetened beverages). As expected, the income elasticities are largest for countries in the lowest income decile where the average income is $1,079 per capita. The fruit income elasticity is the only exception, which is insignificant for countries in the bottom 10 percent. In the poorest countries, milk intake is the category most responsive to a percentage increase in income at 1.04 percent, followed by processed meat (0.76 percent), and sugar-sweetened beverages (0.59 percent). However, the income elasticities significantly decrease with each income decile and are mostly insignificant by the eighth income decile, where average income is $24,500 per capita. In contrast, the fruit income elasticity slightly increases across the lower income deciles and remains positive and significant, even in the highest income countries (fig. 1).
As noted in a previous chapter, diets are also affected by education and nutritional knowledge. Because these factors are not included in our model and are likely positively correlated with national income, our income elasticity estimates may reflect these effects.23 Thus, the actual effects of income on intake (when the effect is positive) could be smaller when factors such as education are accounted for. However, it is also possible that educational attainment and income are highly correlated at the national level, where income could be both a measure of purchasing power as well as a proxy for other affluence-related variables. In this context, our results could be interpreted as revealing the effects of affluence (or economic growth), which include not only increased purchasing power, but also the associated outcomes of being in a richer economy such as better education, healthcare, and committed public resources to nutrition programs.
23Given the global coverage of our data, it was difficult finding other variables (such as education level) with the same global coverage.

20 The Influence of Income and Prices on Global Dietary Patterns by Country, Age, and Gender, ERR-225
Economic Research Service/USDA
Next, we turn to the own-price elasticities (tables 7 and 8). Fruit and whole grains are the only plant-based categories significantly affected by prices. Overall, fruit intake is inelastic with respect to price changes, but is more elastic in SSA than in other regions. In SSA, men, age 20, are the most responsive to fruit prices (-0.91), while women, age 80, are the least responsive (-0.77). However, the difference between these two groups is not significant. In LAC, the own-price elasticity for fruit is about the same across all subgroups (-0.3), as well as in FCP (-0.5). In Asia, women and men, age 80, are responsive to fruit prices (-0.32), but young adults are not responsive to them. The relation-ship between fruit intake and prices is not significant for individuals in MENA/South Asia (women, age 80, are the exception) and ROW (table 7).
The responsiveness of whole grain intake to prices is significant for all subgroups in SSA, LAC, and FCP. By and large, whole grain intake is more elastic than fruit intake, ranging from -0.66 in SSA (men, age 20) to -3.23 in FCP (men, age 80). It must be noted, however, that the particularly large estimates for FCP are partly due to the region’s low whole grain intake compared with other regions (see Appendix 2).
Figure 1
Selected income elasticities by income decile
Note: Each income decile is composed of 16 countries (except the 4 lowest deciles, which are each composed of 17 countries). The income range (PPP-adjusted in $thousands) for each decile is as follows: (1st) $0.6-$1.5, (2nd) $1.5-$2.7, (3rd) $2.7-$5.3, (4th) $5.5-$8.0, (5th) $8.3-$10.8, (6th) $11.1-$15.2, (7th) $15.3-$20.3, (8th) $20.6-$29.4, (9th) $30.4-$40.9, and (10th) $41.3-$127.2. Error bars (the I-shaped bars) are 90-percent confidence intervals. Estimates are averaged across gender and are derived at age 40. Source: USDA, Economic Research Service estimates based on Tufts University Friedman School of Nutrition Science and Policy, Global Nutrition and Policy Consortium, Global Dietary Database; and World Bank, International Comparison Program.
Income elasticity
-0.20
0.00
0.20
0.40
0.60
0.80
1.00
1.20
1.40
1st 2nd 3rd 4th 5th 6th 7th 8th 9th 10th
Income decile
Milk Processed meat Sugar-sweetened beverages Fruit

21 The Influence of Income and Prices on Global Dietary Patterns by Country, Age, and Gender, ERR-225
Economic Research Service/USDA
Processed meat and fish intake are significantly influenced by price. Interestingly, men and women, age 20, are the only subgroup where unprocessed red meat intake is influenced by price. For processed meat, we observe significant own-price elasticities across all demographic groups in SSA, LAC, and FCP, and young adults in MENA/South Asia. Estimates range from -1.36 in MENA/South Asia (women, age 20) to -0.21 in FCP (women, age 80). The influence of price on fish intake is significant across all regions ranging from -0.90 in FCP (men, age 20) to -0.34 in Asia (women and men, age 20) (table 8).
Worldwide, milk intake for all subgroups and regions is negatively associated with rising prices; countries are the most responsive to price in Asia (-0.7) and are the least responsive in LAC (around -0.3). Overall, the own-price elasticity for sugar-sweetened beverages indicates that individuals across all sub-groups and regions will likely decrease their intake when prices increase. These esti-mates also reflect the greater preference for sugar-sweetened beverages by young adults. Note that older adults in all regions will decrease their sugar-sweetened beverage intake by a larger percentage
Table 7Plant-based intake: own-price elasticity estimates by region, gender, and ages 20 and 80
Region Gender, age Fruit VegetablesBeans and legumes Nuts and seeds Whole grains
Sub-Saharan Africa
Women, 20 -0.87 (0.23)*** -0.05 (0.19) -0.00 (0.24) -0.38 (0.89) -0.69 (0.33)**
Women, 80 -0.77 (0.22)*** -0.15 (0.19) 0.08 (0.24) -0.32 (0.77) -0.93 (0.31)***
Men, 20 -0.91 (0.23)*** 0.04 (0.18) -0.01 (0.24) -0.42 (0.93) -0.66 (0.33)**
Men, 80 -0.86 (0.23)*** -0.08 (0.19) 0.07 (0.24) -0.35 (0.79) -0.93 (0.31)***
Latin America and Caribbean
Women, 20 -0.33 (0.14)** -0.01 (0.27) -0.16 (0.28) 0.34 (1.19) -1.65 (0.83)**
Women, 80 -0.33 (0.13)** -0.13 (0.26) -0.07 (0.29) 0.32 (1.04) -1.78 (0.74)**
Men, 20 -0.32 (0.14)** 0.10 (0.27) -0.17 (0.29) 0.30 (1.24) -1.59 (0.82)*
Men, 80 -0.34 (0.14)** -0.05 (0.27) -0.08 (0.30) 0.28 (1.08) -1.76 (0.74)**
Former Centrally Planned economies
Women, 20 -0.47 (0.23)** 0.00 (0.25) -1.75 (2.68) 0.57 (1.48) -3.12 (1.70)*
Women, 80 -0.54 (0.24)** -0.11 (0.25) -0.97 (2.64) 0.53 (1.29) -3.21 (1.50)**
Men, 20 -0.46 (0.25)* 0.09 (0.25) -1.86 (2.75) 0.52 (1.58) -3.11 (1.75)*
Men, 80 -0.55 (0.25)** -0.03 (0.25) -1.03 (2.65) 0.48 (1.36) -3.23 (1.54)**
Asia
Women, 20 -0.25 (0.18) 0.01 (0.19) -0.98 (1.26) 0.13 (0.24) -0.68 (0.45)
Women, 80 -0.32 (0.18)* -0.06 (0.19) -0.72 (1.32) 0.12 (0.21) -0.63 (0.39)
Men, 20 -0.22 (0.19) 0.08 (0.21) -1.03 (1.29) 0.12 (0.24) -0.66 (0.45)
Men, 80 -0.32 (0.20)* -0.01 (0.20) -0.75 (1.34) 0.11 (0.22) -0.63 (0.40)
MENA/South Asia
Women, 20 -0.31 (0.24) 0.01 (0.19) -0.67 (0.84) 0.53 (0.90) -1.59 (1.11)
Women, 80 -0.37 (0.22)* -0.05 (0.18) -0.51 (0.88) 0.49 (0.80) -1.36 (0.91)
Men, 20 -0.24 (0.24) 0.07 (0.19) -0.71 (0.88) 0.50 (0.94) -1.58 (1.13)
Men, 80 -0.36 (0.23) -0.01 (0.19) -0.53 (0.88) 0.46 (0.84) -1.42 (0.96)
High income/ rest of world
Women, 20 -0.19 (0.24) 0.03 (0.31) -1.71 (2.03) 1.61 (2.23) -0.82 (0.72)
Women, 80 -0.27 (0.21) -0.06 (0.30) -1.50 (2.18) 1.49 (2.00) -0.63 (0.61)
Men, 20 -0.12 (0.28) 0.12 (0.33) -1.75 (2.05) 1.54 (2.36) -0.80 (0.71)
Men, 80 -0.25 (0.23) 0.00 (0.30) -1.54 (2.19) 1.43 (2.11) -0.64 (0.62)
Note: ***, **, and * denote the 0.01, 0.05, and 0.10 significance level, respectively. Standard errors are in parentheses. MENA = Middle East/North Africa.
Source: USDA, Economic Research Service estimates based on Tufts University Friedman School of Nutrition Science and Policy, Global Nutrition and Policy Consortium, Global Dietary Database; and World Bank, International Comparison Program.

22 The Influence of Income and Prices on Global Dietary Patterns by Country, Age, and Gender, ERR-225
Economic Research Service/USDA
than do younger adults when prices increase, in spite of significantly less consumption globally. The own-price elasticity for sugar-sweetened beverages ranges from a high of -1.61 in FCP (among men, age 80) to a low of -0.18 in LAC (among men and women, age 20)—partly because of LAC’s gener-ally high consumption compared with other regions. Fruit-juice intake is elastic with respect to a price change in SSA (approximately -1.5 to -1.6 for all subgroups), but is lower in Asia and MENA/South Asia (-0.8 to -0.9), FCP (-0.7 to -0.8), and LAC (between -0.3 and -0.4). The relationship between fruit juice intake and prices is not significant for individuals in ROW (see table 8).
The own-price elasticities are also evaluated across countries by income decile for fruit, milk, processed meat, and sugar-sweetened beverages (fig. 2). As expected, the own-price elasticities are largest for countries in the bottom 10 percent for all categories (milk intake is the exception). For the lowest income group, processed meat and fruit own-price elasticities are the greatest in magnitude (-1.5 and -1.2, respectively) of all food categories, followed by sugar-sweetened beverages (-0.9). The own-price elasticity for milk is insignificant for countries that make up the bottom 10 percent (first
Table 8Meat, fish, and beverage intake: own-price elasticity estimates by region, gender, and ages 20 and 80
Region Gender, ageUnprocessed
red meatProcessed
meat Fish Milk
Sugar- sweetened beverages Fruit juice
Sub- Saharan Africa
Women, 20 -0.19 (0.21) -1.10 (0.38)*** -0.44 (0.19)** -0.27 (0.14)* -0.73 (0.20)*** -1.49 (0.49)***
Women, 80 -0.17 (0.21) -0.80 (0.39)** -0.52 (0.16)*** -0.31 (0.14)** -1.18 (0.23)*** -1.55 (0.54)***
Men, 20 -0.21 (0.21) -1.11 (0.37)*** -0.45 (0.19)** -0.25 (0.15)* -0.71 (0.19)*** -1.58 (0.52)***
Men, 80 -0.19 (0.21) -0.90 (0.36)** -0.52 (0.16)*** -0.30 (0.15)** -1.30 (0.25)*** -1.46 (0.55)***
Latin America and Carib-bean
Women, 20 -0.20 (0.13) -0.30 (0.12)*** -0.56 (0.24)** -0.25 (0.11)** -0.18 (0.04)*** -0.31 (0.15)**
Women, 80 -0.18 (0.13) -0.22 (0.12)* -0.59 (0.20)*** -0.26 (0.10)** -0.28 (0.04)*** -0.35 (0.17)**
Men, 20 -0.21 (0.12)* -0.29 (0.11)*** -0.56 (0.23)** -0.24 (0.11)** -0.18 (0.04)*** -0.33 (0.16)**
Men, 80 -0.19 (0.13) -0.23 (0.11)** -0.60 (0.20)*** -0.25 (0.10)** -0.32 (0.04)*** -0.35 (0.17)**
Former Centrally Planned econo-mies
Women, 20 -0.19 (0.11)* -0.30 (0.12)** -0.87 (0.37)** -0.30 (0.13)** -0.93 (0.22)*** -0.72 (0.37)*
Women, 80 -0.17 (0.12) -0.21 (0.12)* -0.94 (0.33)*** -0.30 (0.12)** -1.46 (0.21)*** -0.84 (0.43)*
Men, 20 -0.19 (0.11)* -0.28 (0.12)** -0.90 (0.38)** -0.29 (0.13)** -0.90 (0.19)*** -0.79 (0.40)**
Men, 80 -0.18 (0.11) -0.22 (0.11)* -0.93 (0.33)*** -0.29 (0.12)** -1.61 (0.21)*** -0.84 (0.44)*
Asia
Women, 20 -0.32 (0.19)* -0.65 (0.31)** -0.34 (0.15)** -0.73 (0.32)** -0.82 (0.21)*** -0.82 (0.49)*
Women, 80 -0.29 (0.19) -0.46 (0.31) -0.36 (0.14)*** -0.70 (0.29)** -1.23 (0.20)*** -0.94 (0.55)*
Men, 20 -0.33 (0.18)* -0.65 (0.33)** -0.34 (0.15)** -0.69 (0.32)** -0.80 (0.19)*** -0.91 (0.53)*
Men, 80 -0.31 (0.19) -0.48 (0.30) -0.35 (0.13)*** -0.68 (0.30)** -1.35 (0.21)*** -0.97 (0.57)*
MENA/South Asia
Women, 20 -0.22 (0.13)* -1.36 (0.68)** -0.81 (0.36)** -0.44 (0.20)** -0.67 (0.17)*** -0.77 (0.48)
Women, 80 -0.19 (0.13) -0.96 (0.69) -0.82 (0.32)*** -0.42 (0.18)** -0.96 (0.17)*** -0.89 (0.54)*
Men, 20 -0.22 (0.13)* -1.28 (0.68)* -0.81 (0.36)** -0.42 (0.20)** -0.65 (0.16)*** -0.83 (0.51)*
Men, 80 -0.20 (0.13) -1.00 (0.66) -0.82 (0.32)*** -0.42 (0.18)** -1.07 (0.18)*** -0.93 (0.56)*
High income/ rest of world
Women, 20 -0.19 (0.13) -0.28 (0.17) -0.52 (0.25)** -0.34 (0.16)** -0.52 (0.17)*** -0.32 (0.23)
Women, 80 -0.17 (0.12) -0.19 (0.17) -0.48 (0.20)** -0.33 (0.15)** -0.84 (0.21)*** -0.38 (0.26)
Men, 20 -0.18 (0.12) -0.25 (0.16) -0.50 (0.24)** -0.31 (0.15)** -0.49 (0.15)*** -0.35 (0.25)
Men, 80 -0.17 (0.12) -0.18 (0.16) -0.48 (0.20)** -0.33 (0.15)** -0.94 (0.22)*** -0.40 (0.27)
Note: ***, **, and * denote the 0.01, 0.05, and 0.10 significance level, respectively. Standard errors are in parentheses. MENA = Middle East/North Africa.
Source: USDA, Economic Research Service estimates based on Tufts University Friedman School of Nutrition Science and Policy, Global Nutrition and Policy Consortium, Global Dietary Database; and World Bank, International Comparison Program.

23 The Influence of Income and Prices on Global Dietary Patterns by Country, Age, and Gender, ERR-225
Economic Research Service/USDA
income decile) but is significant for the eighth income decile. With the exception of milk, the own-price elasticities significantly decrease (in absolute value) with income and are mostly insignificant by the eighth income decile.
The results suggest important implications for policy and suggest that price incentives could influ-ence intake behavior, particularly in low-income countries. However, the effectiveness of such policies decreases at higher income levels as evidenced by the smaller (in absolute value) and insig-nificant own-price elasticities in the top income deciles.
Income Elasticity Across Countries
For illustrative purposes, we report the income elasticities of fruit for men and women, ages 20 and 80, across all countries. Equation (3) shows that the income elasticity can vary by country, age, and gender, because of the age and gender interaction estimates (α estimates), differences in income and prices across countries, and differences in intake levels across countries and subgroups. While the elasticities in the previous chapter were derived using regional averages for income, prices, and
Figure 2
Selected own-price elasticities by income decile
Note: Each income decile is composed of 16 countries (except the 4 lowest deciles, which are each composed of 17 countries). The income range (PPP-adjusted in $thousands) for each decile is as follows: (1st) $0.6-$1.5, (2nd) $1.5-$2.7, (3rd) $2.7-$5.3, (4th) $5.5-$8.0, (5th) $8.3-$10.8, (6th) $11.1-$15.2, (7th) $15.3-$20.3, (8th) $20.6-$29.4, (9th) $30.4-$40.9,and (10th) $41.3-$127.2. Error bars (the I-shaped bars) are 90-percent confidence intervals. Estimates are averaged across genders and are derived at age 40. Source: USDA, Economic Research Service estimates based on Tufts University Friedman School of Nutrition Science and Policy, Global Nutrition and Policy Consortium, Global Dietary Database; and World Bank, International Comparison Program.
Own-price elasticity-2.6
-2.4
-2.2
-2.0
-1.8
-1.6
-1.4
-1.2
-1.0
-0.8
-0.6
-0.4
-0.2
0.0
0.2
0.41st 2nd 3rd 4th 5th 6th 7th 8th 9th 10th
Income decile
Processed meat Fruit Sugar-sweetened beverages Milk

24 The Influence of Income and Prices on Global Dietary Patterns by Country, Age, and Gender, ERR-225
Economic Research Service/USDA
subgroup intake, the estimates reported in this chapter are derived using income and price values at the country level and the intake level for the subgroup.
Recall that fruit exhibited noticeable differences in income responsiveness across subgroups and regions; these differences seem to hold true even at the country level (fig. 3). Although differences in the fruit-intake income elasticities across subgroups are small, there is still a distinct global pattern of income responsiveness. Note that fruit intake by older adults (women and men, age 80) is more sensitive to increases in income globally than that of young adults (women and men, age 20), suggesting that income growth will have a more positive effect on the fruit intake of older adults. Even within age groups, the fruit-intake income elasticities are higher for women across most coun-tries, supporting the notion that women are more nutritionally aware than men.
Figure 3
Income elasticity of fruit intake by country (ordered by elasticity value for women, age 80)
Note: Congo, Dem. Rep. = Democratic Republic of Congo.Source: USDA, Economic Research Service estimates based on Tufts University Friedman School of Nutrition Science and Policy, Global Nutrition and Policy Consortium, Global Dietary Database; and World Bank, International Comparison Program.
Income elasticity
-0.05
0.00
0.05
0.10
0.15
0.20
0.25
0.30
0.35
0.40
0.45
0.50
0.55
0.60
0.65
0.70
0.75
Bot
swan
aC
amer
oon
Chi
naH
unga
ryM
ongo
liaB
elar
usM
aurit
ania
Ukr
aine
Con
goK
orea
Mal
awi
Trin
idad
and
Tob
ago
Nig
erK
yrgy
zA
rmen
iaLa
tvia
Aze
rbai
jan
Bur
kina
Fas
oA
lger
iaB
urun
diA
ngol
aIc
elan
dF
ijiC
zech
Rep
ublic
Cen
tral
Afr
ican
Rep
ublic
Sen
egal
Ken
yaS
waz
iland
Tan
zani
aR
ussi
aB
ulga
riaR
wan
daU
gand
aU
rugu
ayC
roat
iaN
orw
ayC
uba
Phi
lippi
nes
Slo
vak
Rep
ublic
Japa
nB
oliv
iaS
wed
enE
quat
oria
l Gui
nea
Cot
e d'
Ivoi
reG
hana
Dom
inic
aB
rune
i Dar
ussa
lam
Can
ada
Mau
ritiu
sO
man
Ven
ezue
laC
abo
Ver
deS
ao T
ome
and
Prin
cipe
Sur
inam
eLu
xem
bour
gV
ietn
amP
ortu
gal
Qat
arF
inla
ndU
nite
d A
rab
Em
irate
sG
uine
aM
exic
oG
uate
mal
aB
eliz
eP
anam
aA
ustr
iaC
osta
Ric
aD
enm
ark
Tur
key
Sey
chel
les
Bah
amas
Sw
itzer
land
Moz
ambi
que
Sin
gapo
reC
ongo
, Dem
. Rep
.B
enin
Pol
and
New
Zea
land
Mal
aysi
aLa
os
Women, age 20 Women, age 80 Men, age 20 Men, age 80

25 The Influence of Income and Prices on Global Dietary Patterns by Country, Age, and Gender, ERR-225
Economic Research Service/USDA
Conclusion
Changes in global eating habits have led to a global rise in obesity and related chronic diseases in both developing and developed countries. Consequently, many low-, middle-, and high-income coun-tries share common challenges related to food choice, diet-related diseases, and public health. These common challenges have led to global initiatives by the World Health Organization, the United Nations Food and Agriculture Organization, and other organizations to combat the spread and risk of diet-related diseases such as diabetes, heart disease, and stroke. Toward these ends, implementing policy options that would encourage healthy diets is a priority on these organizations’ agendas. Both pricing and income-support policies have been proposed as a means to influence behavior. However, it is unclear if such incentives could be applied globally.
To address these issues, we used daily intake data from the 2010 Global Dietary Database (GDD), 2010 per-capita GDP data (purchasing power parity-adjusted) from the World Bank, and 2011 International Comparison Program (ICP) food-price indexes to examine the relationship among income, prices, and dietary patterns across 164 countries, with particular attention to the influence of gender and age in shaping these relationships. We estimated the responsiveness of individuals’ food intake (based on gender and age subgroups) in 11 categories to changes in income and prices. The extensiveness of the GDD and ICP data allowed for a global coverage rarely seen in food and nutri-tion demand research.
This study provides evidence of how prices and income might influence behavior in both rich and poor countries. Increasing the affordability of fruit and vegetables is a key objective for international organizations, and our results suggest that fruit intake by men and women of all ages and across almost all countries would be positively affected by an increase in income. However, the relationship between income and fruit intake was particularly weak for countries in the bottom 10 percent. For fruit, processed meat, and sugar-sweetened beverages, the relationship between prices and intake was strongest among low-income countries, but became significantly weaker at higher income levels. This result implies that the use of price incentives to affect fruit, processed-meat, or sugar-sweetened beverage intake would be most effective in lower income countries. However, policies such as taxes to influence prices could be problematic given the limits of governments to implement effective and transparent incentive schemes and opposition from industry (Barquera et al., 2013). Developing countries carry added concerns about how these policies would affect food- insecure populations (Swinnen and Squicciarini, 2012).
Overall, the income-elasticity estimates suggest that income growth is likely to cause an increase in meat and beverage intake and to have little or no effect on plant-based intake, other than fruit. For nuts, seeds, beans, and legumes, income growth is actually associated with decreases in intake. The WHO and supporting organizations advocate a goal of increasing fruit and vegetable intake glob-ally to decrease the spread of NCDs. Toward that end, governments are often advised to invest in ways to increase income, particularly for the most vulnerable populations. Although our results show that income growth is associated with increased fruit intake globally, they also suggest that income growth would not affect vegetable intake. Some of the results related to processed meat, unprocessed red meat, and sugar-sweetened beverages could be concerns, given their suggested role in global obesity trends.
26 The Influence of Income and Prices on Global Dietary Patterns by Country, Age, and Gender, ERR-225
Economic Research Service/USDA
Although our results show associations among income, prices, and food intake globally, some of these relationships may represent deeper causal linkages. If the relationships are causal, policy-makers may choose to consider the price and income elasticities of certain foods, as well as the behavior of demographic subgroups, as they address current and future nutrition and health chal-lenges. However, the importance of education also has been demonstrated. Programs that focus solely on increasing incomes or lowering prices, without a nutrition-education component, might fail to achieve their goals (Finkelstein et al., 2004). It would also benefit international organizations such as the WHO to consider the differences in price and income elasticities for certain countries and regions and for income and demographic subgroups within countries. The heterogeneity of the results underscores the importance of context/country-specific income, price, nutrition, and food-related programs.

27 The Influence of Income and Prices on Global Dietary Patterns by Country, Age, and Gender, ERR-225
Economic Research Service/USDA
References
Afshin, A., R. Micha, S. Khatibzadeh, L. Schmidt, and D. Mozaffarian. 2014. “Dietary Policies to Reduce Noncommunicable Diseases,” in The Handbook of Global Health Policy, G. Yamey, ed. San Francisco: Wiley-Blackwell.
Andreyeva, T., M.W. Long, and K.D. Brownell. 2010. “The Impact of Food Prices on Consumption: A Systematic Review of Research on the Price Elasticity of Demand for Food,” American Journal of Public Health 100(2):216-222.
Baker, A.H., and J. Wardle. 2003. “Sex Differences in Fruit and Vegetable Intake in Older Adults,” Appetite 40(3): 269-275.
Banks, J., R. Blundell, and A. Lewbel. 1997. “Quadratic Engel Curves and Consumer Demand,” Review of Economics and Statistics 79(4):527-539.
Barquera, S., I. Campos, and J.A. Rivera. 2013. “Mexico Attempts to Tackle Obesity: The Process, Results, Push Backs and Future Challenges,” Obesity Reviews 14: 69–78.
Beaglehole, R., R. Bonita, R. Horton, et al. 2011a. “Priority Actions for the Non-Communicable Disease Crisis,” The Lancet 377(9775): 1438-1447.
Beaglehole, R., R. Bonita, G. Alleyne, et al. 2011b. “UN High-Level Meeting on Non-Communicable Diseases: Addressing Four Questions,” The Lancet 378(9789):449-455.
Behrman, J.R., A.B. Deolalikar, and B.L. Wolfe. 1988. “Nutrients: Impacts and Determinants,” World Bank Economic Review 2(3):299-320.
Behrman, J.R., and B.L. Wolfe. 1984. “More Evidence on Nutrition Demand: Income Seems Overrated and Women’s Schooling Underemphasized,” Journal of Development Economics 14(1):105-128.
Beydoun, M.A., and Y. Wang. 2008. “Do Nutrition Knowledge and Beliefs Modify the Association of Socio-Economic Factors and Diet Quality among US Adults?” Preventive Medicine 46(2):145-153.
Blaylock, J., D. Smallwood, K. Kassel, J. Variyam, and L. Aldrich. 1999. “Economics, Food Choices, and Nutrition,” Food Policy 24(2-3):269-286.
Bouis, H.E. 1994. “The Effect of Income on Demand for Food in Poor Countries: Are Our Food Consumption Databases Giving us Reliable Estimates? Journal of Development Economics 44(1): 99-226.
Cameron, A.C., and P.K. Trivedi. 2005. Microeconometrics: Methods and Applications. Cambridge, UK: Cambridge University Press.
Cawley, J. and C. Meyerhoefer. 2012. “The Medical Care Costs of Obesity: An Instrumental Variables Approach,” Journal of Health Economics 31(1):219-230.

28 The Influence of Income and Prices on Global Dietary Patterns by Country, Age, and Gender, ERR-225
Economic Research Service/USDA
Clements, K.W., and H. Theil. 1979. A Cross-Country Analysis of Consumption Patterns, Center for Mathematical Studies in Business and Economics Report No. 7924, University of Chicago.
Darmon, N., and A. Drewnowski. 2008. “Does Social Class Predict Diet Quality?” The American Journal of Clinical Nutrition 87(5):1107-1117.
Deaton, A. 1997. The Analysis of Household Surveys: A Microeconometric Approach to Development Policy. Baltimore, MD: Johns Hopkins University Press.
Del Gobbo, L.C., S. Khatibzadeh, F. Imamura, et al. 2015. Assessing global dietary habits: a comparison of national estimates from the FAO and the Global Dietary Database. The American Journal of Clinical Nutrition 101(5):1038-1046.
Dubois, P., R. Griffith, and A. Nevo. 2014. “Do Prices and Attributes Explain International Differences in Food Purchases?” American Economic Review 104(3):832-867.
Finke, M., and S. Huston. 2003. “Factors Affecting the Probability of Choosing a Risky Diet,” Journal of Family and Economic Issues 24(3):291-303.
Finkelstein, E., S. French, J.N Variyam, and P.S. Haines. 2004. “Pros and Cons of Proposed Interventions to Promote Healthy Eating,” American Journal of Preventive Medicine 27(3):163-171.
Green, R., L. Cornelsen, A.D. Dangour, R. Turner, B. Shankar, M. Mazzocchi, and R.D. Smith. 2013. “The Effect of Rising Food Prices on Food Consumption: Systematic Review with Meta-regression,” BMJ: British Medical Journal 346:f3703.
Gundersen, C., B. Kreider, and J. Pepper. 2011. The Economics of Food Insecurity in the United States. Applied Economic Perspectives and Policy 33(3): 281-303.
Guo, X., T.A. Mroz, B.M. Popkin, and F. Zhai. 2000. “Structural Change in the Impact of Income on Food Consumption in China, 1989–1993,” Economic Development and Cultural Change 48(4):737-760.
Hall, B.H., and C. Cummins. 2005. TSP 5.0 Reference Manual. Palo Alto, CA: TSP International.
Houthakker, H. S. 1957. “An International Comparison of Household Expenditure Patterns, Commemorating the Centenary of Engel’s Law,” Econometrica 25(4):532-551.
Imamura, F., R. Micha, S. Khatibzadeh, S. Fahimi, P. Shi, J. Powles, J., and D. Mozaffarian. 2015. “Dietary Quality Among Men and Women in 187 Countries in 1990 and 2010: A Systematic Assessment,” The Lancet Global Health 3(3):e132-e142.
International Nut and Dried Fruit Council. 2015. Global Statistical Review 2014-2015 www.nutfruit.org.
Kearney, J. 2010. “Food Consumption Trends and Drivers,” Philosophical Transactions of the Royal Society B: Biological Sciences 365(1554):2793-2807.
Kumar, A., P. Kumar, S. Parappurathu, and S.S. Raju. 2011. “Estimation of Demand Elasticity for Food Commodities in India,” Agricultural and Economics Research Review 24(1):1-14.
29 The Influence of Income and Prices on Global Dietary Patterns by Country, Age, and Gender, ERR-225
Economic Research Service/USDA
LaFrance, J.T. 1990. “Incomplete Demand Systems and Semilogarithmic Demand Models,” Australian Journal of Agricultural Economics 34(2):118-131.
Lim, S.S., T. Vos, A.D. Flaxman, et al. 2013. “A Comparative Risk Assessment of Burden of Disease and Injury Attributable to 67 Risk Factors and Risk Factor Clusters in 21 Regions, 1990–2010: A Systematic Analysis for the Global Burden of Disease Study 2010,” The Lancet 380(9859):2224-2260.
Loopstra, R., and V. Tarasuk. 2013. “Severity of Household Food Insecurity Is Sensitive to Change in Household Income and Employment Status among Low-Income Families,” Journal of Nutrition 143(8):1316-1323.
Mendez, M.A., C.A. Monteiro, and B.M. Popkin. 2005. “Overweight Exceeds Underweight Among Women in Most Developing Countries,” The American Journal of Clinical Nutrition 81(3):714-721.
Micha, R., S. Kalantarian, P. Wirojratana, et al. 2012. “Estimating the Global and Regional Burden of Suboptimal Nutrition on Chronic Disease: Methods and Inputs to the Analysis,” European Journal of Clinical Nutrition 66(1): 119-129.
Micha, R., S. Khatibzadeh, P. Shi, et al. 2014. “Global, Regional, and National Consumption Levels of Dietary Fats and Oils in 1990 and 2010: A Systematic Analysis Including 266 Country-specific Nutrition Surveys,” BMJ: British Medical Journal 348:g2272.
Micha, R., S. Khatibzadeh, P. Shi, et al. 2015. “Global, Regional and National Consumption of Major Food Groups in 1990 and 2010: A Systematic Analysis Including 266 Country-specific Nutrition Surveys Worldwide,” BMJ: British Medical Journal Open 5(9): e008705.
Muhammad, A., J.L. Seale, B. Meade, and A. Regmi. 2011. International Evidence on Food Consumption Patterns: An Update Using 2005 International Comparison Program Data. U.S. Department of Agriculture, Economic Research Service, TB-1929.
Muka, T., D. Imo, L. Jaspers, V. Colpani, et al. 2015. “The Global Impact of Non-Communicable Diseases on Healthcare Spending and National Income: A Systematic Review,” European Journal of Epidemiology 30(4):251-277.
Parmenter, K., J. Waller, and J. Wardle. 2000. “Demographic Variation in Nutrition Knowledge in England,” Health Education Research 15(2):163-174.
Regmi, A., M.S. Deepak, J.L. Seale, and J. Bernstein. 2001. “Cross-Country Analysis of Food Consumption Patterns” chapter in Changing Structure of Global Food Consumption and Trade, U.S. Department of Agriculture, Economic Research Service.
Regmi, A., and J.L. Seale. 2010. Cross-Price Elasticities of Demand Across 114 Countries, U.S. Department of Agriculture, Economic Research Service, TB-1925.
Sahn, D.E. 1988. “The Effect of Price and Income Changes on Food-Energy Intake in Sri Lanka,” Economic Development and Cultural Change 36(2):315-340.

30 The Influence of Income and Prices on Global Dietary Patterns by Country, Age, and Gender, ERR-225
Economic Research Service/USDA
Schnepf, R., and J. Richardson. 2011. Consumers and Food Price Inflation. Congressional Research Service 7-5700.
Seale, J., A. Regmi, A., and J. Bernstein. 2003. International Evidence on Food and Consumption Patterns, Economic Research Service, TB-1904.
Singh G.M., R. Micha, S. Khatibzadeh, P. Shi, S. Lim, K.G. Andrews, R.E. Engell, M. Ezzati, and D. Mozaffarian. 2015. “Global, Regional, and National Consumption of Sugar-Sweetened Beverages, Fruit Juices, and Milk: A Systematic Assessment of Beverage Intake in 187 Countries,” PLoS ONE 10(8):e0124845.
Strauss, J., and D. Thomas. 1995. “Human Resources: Empirical Modeling of Household and Family Decisions,” in Handbook of Development Economics (Volume 3A), J, Behrman and T.N. Srinivasan, eds., Amsterdam: Elsevier.
Subramanian, S., and A. Deaton. 1996. “The Demand for Food and Calories,” Journal of Political Economy 104(1):133-162.
Suhm, F.E. 1979. “A Cross-Country Analysis of Divisia Covariances of Prices and Quantities Consumed,” Economics Letters 3(3):287-291.
Swinnen, J., and P. Squicciarini. 2012. “Mixed Messages on Prices and Food Security,” Science 335(6067):405-406.
Timmer, P.C. 1981. “Is There ‘Curvature’ in the Slutsky Matrix?” The Review of Economics and Statistics 63(3):395-402.
Ulubasoglu, M., D. Mallick, M. Wadud, P. Hone, and H. Haszler. 2015. “Food Demand Elasticities for Australia,” Australian Journal of Agricultural and Resource Economics 60(2):177-195.
Wardle, J., K. Parmenter, and J. Waller. 2000. “Nutrition Knowledge and Food Intake,” Appetite 34(3):269-275.
Wolfe, B.L., and J.R. Behrman. 1983. “Is Income Overrated in Determining Adequate Nutrition?” Economic Development and Cultural Change 31(3):525-549.
World Bank. 2014. Purchasing Power Parities and Real Expenditures of World Economies: Summary of Results and Findings of the 2011 International Comparison Program. Washington, D.C.: World Bank Publications.
World Bank. 2015. Purchasing Power Parities and the Real Size of World Economies: A Comprehensive Report of the 2011 International Comparison Program. Washington, D.C.: World Bank Publications.
World Health Organization. 2005. Preventing chronic diseases: a vital investment, WHO global report. http://www.who.int/chp/chronic_disease_report/contents/en/.
World Health Organization. 2013. Global action plan for the prevention and control of noncommu-nicable diseases 2013-2020. Geneva, Switzerland: WHO Press.

31 The Influence of Income and Prices on Global Dietary Patterns by Country, Age, and Gender, ERR-225
Economic Research Service/USDA
Zhong, F., J. Xiang, and J. Zhu. 2012. “Impact of Demographic Dynamics on Food Consumption—A Case Study of Energy Intake in China,” China Economic Review 23(4):1011-1019.
Zhou, D., X. Yu, D.G. Abler, and D. Chen. 2014. Projecting Meat and Cereals Demand for China Based on a Meta-Analysis of Income Elasticities. Discussion Papers from Georg-August-Universitaet Goettingen, Department of Agricultural Economics and Rural Development, No 168528.

32 The Influence of Income and Prices on Global Dietary Patterns by Country, Age, and Gender, ERR-225
Economic Research Service/USDA
Appendix 1: Full-Model and Base-Model Estimates
The coefficients and standard errors used to derive the income and price elasticities are examined (appendix tables 1.1 and 1.2). For comparison, we also provide estimation results from models without interaction terms (base models) (appendix tables 1.3−1.4). Given the complexity of the full model, particularly the interaction terms, it is difficult to discuss the raw estimates in the context of dietary behavior. For instance, the estimate for the gender binary variable (W) is significant and negative in the fruit-intake model (full model) (26.05). However, this is due to the interaction terms and is not an indication of a ceteris-paribus relationship. Note that the same estimate in the fruit-intake model without the interaction terms is positive and significant (22.83), reflecting the fact that women consume more fruit than men, all else equal. Consequently, we do not discuss any particular estimate in detail and limit the discussion in this chapter to the relationship between the full- and base-model estimates and the elasticity results reported in the study.
The base-model results show that fruit, processed meat, fish, sugar-sweetened beverages, and fruit juice are the only categories affected by both price and income. Interestingly, these are the only categories where the income and own-price elasticities derived from the full model were mostly significant. Even when a base-model estimate for a food category was significant for income or price (but not both), the corresponding income or price elasticities were also significant (e.g., nuts and seeds and whole grains). Note that the base-model price effect for unprocessed red meat was not highly insignificant, which is why the own-price elasticity was significant for at least one subgroup. In comparing the results, it is clear that the significance of the income and price estimates in the base models is an indication of the significance of the corresponding elasticities derived using the full model, at least for some regions, countries, and demographic subgroups. The base-model income and price estimates were not significant for vegetables as well as beans and legumes; however, vegetable intake is the only category where the income and price elasticities were insignificant for all regions and subgroups. For beans and legumes, the base and full-model price and income estimates were insignificant, yet the income elas-ticities were significant for three regions. This is in part due to the primary income effect (78.01) in the full model not being highly insignificant. Lastly, it is important to note that when the base-model price and income estimates were significant, but the full-model estimates were mostly insignificant, (e.g., unprocessed red meat, fish, and fruit juice), there was little variation in the elasticities across subgroups and differences across regions were mostly due to differences in relative consumption levels.
Our defined regions may not be completely representative of nonincome- and nonprice-related factors across all countries within each region. For instance, it could be argued that high-income Asian countries such as Japan and South Korea (APC) are very different from other Asian countries such China and the Philippines, South Asian (SA) countries such as India and Bangladesh are very different from North African and Middle Eastern countries, and the relatively few island economies included in the rest of the world (ROW) are very different from high-income Western economies that most make up ROW. Here we present estimation results where APC, SA, and Other Islands are removed from Asia, MENA/South Asia, and ROW, respectively, and defined as additional regions. As noted, we aggregated these countries with other regions due to their small number. To illustrate how our estimates are fairly robust to different regional definitions, we report the base-model results with these added “regions” for comparison purposes (appendix table 1.5). Note that when comparing these estimates to the estimates in appendix tables 1.3 and 1.4, there are no significant differences. Most importantly, the effects of gender (W) and age (Age and Age2) are almost identical for most food categories, and the effects income (Y) and price (P) are statistically equal.

33 The Influence of Income and Prices on Global Dietary Patterns by Country, Age, and Gender, ERR-225
Economic Research Service/USDA
Appendix table 1.1Estimates for plant-based intake (full model)
Variable Fruit Vegetables Beans and legumes Nuts and seeds Whole grains
Constant 5.11 (196.05) -20.89 (163.20) -366.51 (240.07) -5.40 (40.31) -488.53 (246.39)**
Women (W) -26.05 (44.35) 28.68 (30.98) 1.02 (7.77) 0.47 (3.37) -0.81 (8.78)
Age 4.73 (4.68) 4.23 (3.94) 1.73 (3.61) -1.35 (1.90) -0.28 (1.10)
Age2 -0.05 (0.04) -0.04 (0.03) -0.02 (0.03) 0.01 (0.02) 0.00 (0.01)
Asia 14.92 (21.59) 27.72 (24.15) 0.85 (6.52) 28.21 (12.87)** -8.81 (35.35)
FCP -35.82 (13.25)*** -27.23 (20.90) -12.46 (6.98)* -7.06 (4.09) -75.96 (25.51)***
LAC 47.77 (16.66)*** -43.76 (20.70)** 58.69 (15.37)*** -6.62 (4.41) -56.92 (26.85)**
SSA -12.90 (14.80) -27.12 (20.13) 101.97 (25.77)*** -7.53 (5.05) 4.85 (33.45)
MENA/South Asia -8.94 (14.12) 51.42 (19.07)*** 13.62 (5.66)** -0.91 (3.96) -57.81 (26.79)**
log(Y) 25.39 (43.98) 31.25 (34.76) 78.01 (48.78) 5.06 (9.39) 119.73 (51.32)**
W × log(Y) 3.24 (9.96) -3.59 (6.96) 0.12 (1.72) 0.30 (0.71) -0.09 (1.90)
Age × log(Y) -1.47 (1.07) -0.65 (0.88) -0.01 (0.79) 0.51 (0.44) 0.05 (0.24)
Age2 × log(Y) 0.01 (0.01) 0.01 (0.01) 0.00 (0.01) -0.01 (0.00) 0.00 (0.00)
log(P) -361.95 (129.49)*** -28.63 (107.47) 34.33 (126.83) -11.59 (20.79) -6.81 (173.38)
W × log(P) 25.70 (30.24) -8.57 (20.53) 2.39 (3.84) -2.74 (1.65)* -17.05 (6.13)***
Age × log(P) 5.06 (3.05)* -0.34 (2.45) 3.29 (2.21) -1.29 (0.80) -2.12 (0.80)***
Age2 × log(P) -0.04 (0.02) 0.00 (0.02) -0.03 (0.02) 0.01 (0.01) -0.02 (0.01)***
log(P) × log(Y) 35.19 (14.72)** 5.96 (12.74) -5.98 (13.53) 1.23 (2.59) -3.57 (19.52)
W × log(P) × log(Y) -3.68 (3.49) -0.13 (2.36) -0.20 (0.40) 0.33 (0.17)** 1.48 (0.64)**
Age × log(P) × log(Y) -0.61 (0.36)* -0.08 (0.28) -0.29 (0.24) 0.15 (0.08)* 0.18 (0.09)**
Age2 × log(P) × log(Y) 0.00 (0.00) 0.00 (0.00) 0.00 (0.00) 0.00 (0.00)* 0.00 (0.00)***
log(Y)2 -1.79 (2.44) -2.06 (1.88) -4.06 (2.48) -0.43 (0.55) -6.46 (2.76)**
W × log(Y)2 0.24 (0.55) 0.24 (0.39) -0.02 (0.09) -0.03 (0.04) 0.03 (0.10)
Age × log(Y)2 0.12 (0.06)* 0.04 (0.05) -0.01 (0.04) -0.03 (0.02) 0.00 (0.01)
Age2 × log(Y)2 0.00 (0.00)* 0.00 (0.00) 0.00 (0.00) 0.00 (0.00) 0.00 (0.00)
Adjusted R2 0.47 0.32 0.40 0.31 0.29
Note: ***, **, and * denote the 0.01, 0.05, and 0.10 significance level, respectively. Standard errors are in parentheses. FCP = Former Centrally Planned economies. LAC = Latin America and Caribbean. SSA = Sub-Saharan Africa. MENA = Middle East/North Africa.
Source: USDA, Economic Research Service estimates based on Tufts University Friedman School of Nutrition Science and Policy, Global Nutrition and Policy Consortium, Global Dietary Database; and World Bank, International Comparison Program.
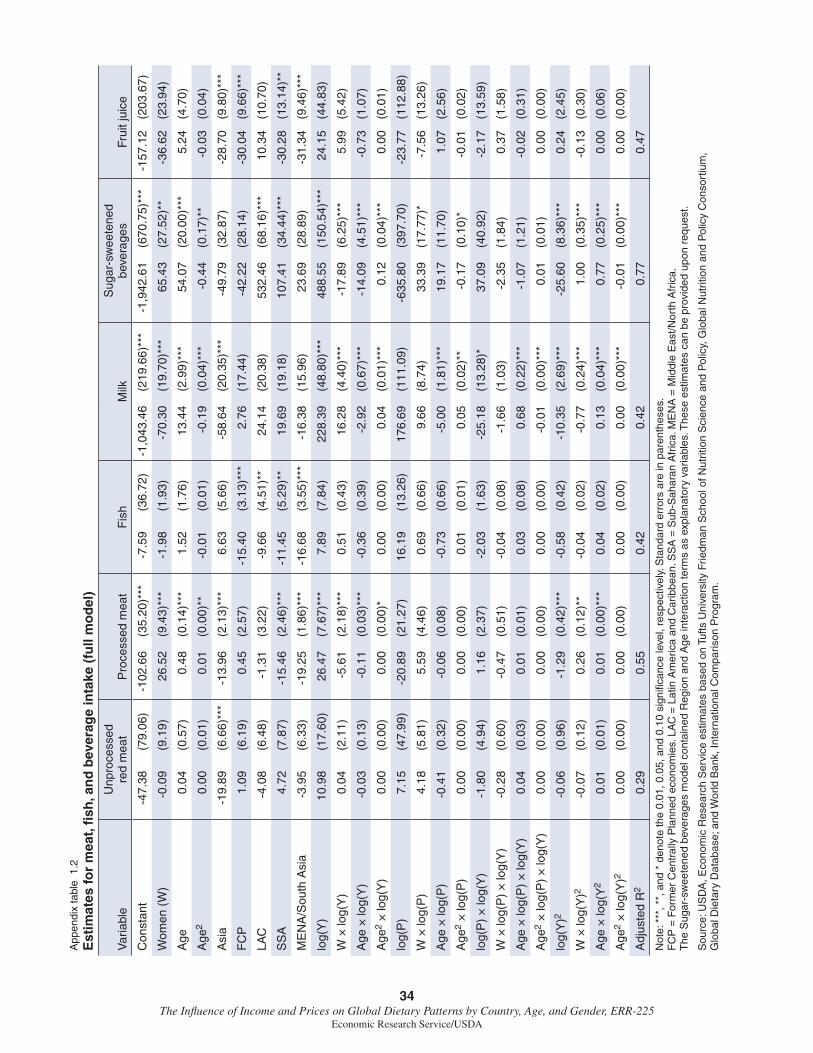
34 The Influence of Income and Prices on Global Dietary Patterns by Country, Age, and Gender, ERR-225
Economic Research Service/USDA
App
endi
x ta
ble
1.2
Est
imat
es fo
r m
eat,
fish
, an
d b
ever
age
inta
ke (
full
mo
del
)
Var
iabl
eU
npro
cess
ed
red
mea
tP
roce
ssed
mea
tF
ish
Milk
Sug
ar-s
wee
tene
d
beve
rage
sFr
uit j
uice
Con
stan
t-4
7.38
(79.
06)
-102
.66
(35.
20)*
**-7
.59
(36.
72)
-1,0
43.4
6(2
19.6
6)**
*-1
,942
.61
(670
.75)
***
-157
.12
(203
.67)
Wom
en (
W)
-0.0
9(9
.19)
26.5
2(9
.43)
***
-1.9
8(1
.93)
-70.
30(1
9.70
)***
65.4
3(2
7.52
)**
-36.
62(2
3.94
)
Age
0.04
(0.5
7)0.
48(0
.14)
***
1.52
(1.7
6)13
.44
(2.9
9)**
*54
.07
(20.
00)*
**5.
24(4
.70)
Age
20.
00(0
.01)
0.01
(0.0
0)**
-0.0
1(0
.01)
-0.1
9(0
.04)
***
-0.4
4(0
.17)
**-0
.03
(0.0
4)
Asi
a-1
9.89
(6.6
6)**
*-1
3.96
(2.1
3)**
*6.
63(5
.66)
-58.
64(2
0.35
)***
-49.
79(3
2.87
)-2
8.70
(9.8
0)**
*
FC
P1.
09(6
.19)
0.45
(2.5
7)-1
5.40
(3.1
3)**
*2.
76(1
7.44
)-4
2.22
(28.
14)
-30.
04(9
.66)
***
LAC
-4.0
8(6
.48)
-1.3
1(3
.22)
-9.6
6(4
.51)
**24
.14
(20.
38)
532.
46(6
8.16
)***
10.3
4(1
0.70
)
SS
A4.
72(7
.87)
-15.
46(2
.46)
***
-11.
45(5
.29)
**19
.69
(19.
18)
107.
41(3
4.44
)***
-30.
28(1
3.14
)**
ME
NA
/Sou
th A
sia
-3.9
5(6
.33)
-19.
25(1
.86)
***
-16.
68(3
.55)
***
-16.
38(1
5.96
)23
.69
(28.
89)
-31.
34(9
.46)
***
log(
Y)
10.9
8(1
7.60
)26
.47
(7.6
7)**
*7.
89(7
.84)
228.
39(4
8.80
)***
488.
55(1
50.5
4)**
*24
.15
(44.
83)
W ×
log(
Y)
0.04
(2.1
1)-5
.61
(2.1
8)**
*0.
51(0
.43)
16.2
8(4
.40)
***
-17.
89(6
.25)
***
5.99
(5.4
2)
Age
× lo
g(Y
)-0
.03
(0.1
3)-0
.11
(0.0
3)**
*-0
.36
(0.3
9)-2
.92
(0.6
7)**
*-1
4.09
(4.5
1)**
*-0
.73
(1.0
7)
Age
2 ×
log(
Y)
0.00
(0.0
0)0.
00(0
.00)
*0.
00(0
.00)
0.04
(0.0
1)**
*0.
12(0
.04)
***
0.00
(0.0
1)
log(
P)
7.15
(47.
99)
-20.
89(2
1.27
)16
.19
(13.
26)
176.
69(1
11.0
9)-6
35.8
0(3
97.7
0)-2
3.77
(112
.88)
W ×
log(
P)
4.18
(5.8
1)5.
59(4
.46)
0.69
(0.6
6)9.
66(8
.74)
33.3
9(1
7.77
)*-7
.56
(13.
26)
Age
× lo
g(P
)-0
.41
(0.3
2)-0
.06
(0.0
8)-0
.73
(0.6
6)-5
.00
(1.8
1)**
*19
.17
(11.
70)
1.07
(2.5
6)
Age
2 ×
log(
P)
0.00
(0.0
0)0.
00(0
.00)
0.01
(0.0
1)0.
05(0
.02)
**-0
.17
(0.1
0)*
-0.0
1(0
.02)
log(
P)
× lo
g(Y
)-1
.80
(4.9
4)1.
16(2
.37)
-2.0
3(1
.63)
-25.
18(1
3.28
)*37
.09
(40.
92)
-2.1
7(1
3.59
)
W ×
log(
P)
× lo
g(Y
)-0
.28
(0.6
0)-0
.47
(0.5
1)-0
.04
(0.0
8)-1
.66
(1.0
3)-2
.35
(1.8
4)0.
37(1
.58)
Age
× lo
g(P
) ×
log(
Y)
0.04
(0.0
3)0.
01(0
.01)
0.03
(0.0
8)0.
68(0
.22)
***
-1.0
7(1
.21)
-0.0
2(0
.31)
Age
2 ×
log(
P)
× lo
g(Y
)0.
00(0
.00)
0.00
(0.0
0)0.
00(0
.00)
-0.0
1(0
.00)
***
0.01
(0.0
1)0.
00(0
.00)
log(
Y)2
-0.0
6(0
.96)
-1.2
9(0
.42)
***
-0.5
8(0
.42)
-10.
35(2
.69)
***
-25.
60(8
.36)
***
0.24
(2.4
5)
W ×
log(
Y)2
-0.0
7(0
.12)
0.26
(0.1
2)**
-0.0
4(0
.02)
-0.7
7(0
.24)
***
1.00
(0.3
5)**
*-0
.13
(0.3
0)
Age
× lo
g(Y
20.
01(0
.01)
0.01
(0.0
0)**
*0.
04(0
.02)
0.13
(0.0
4)**
*0.
77(0
.25)
***
0.00
(0.0
6)
Age
2 ×
log(
Y)2
0.00
(0.0
0)0.
00(0
.00)
0.00
(0.0
0)0.
00(0
.00)
***
-0.0
1(0
.00)
***
0.00
(0.0
0)
Adj
uste
d R
20.
290.
550.
420.
420.
770.
47
Not
e: *
**, *
*, a
nd *
den
ote
the
0.01
, 0.0
5, a
nd 0
.10
sign
ifica
nce
leve
l, re
spec
tivel
y. S
tand
ard
erro
rs a
re in
par
enth
eses
.F
CP
= F
orm
er C
entr
ally
Pla
nned
eco
nom
ies.
LA
C =
Lat
in A
mer
ica
and
Car
ibbe
an. S
SA
= S
ub-S
ahar
an A
fric
a. M
EN
A =
Mid
dle
Eas
t/Nor
th A
fric
a.T
he S
ugar
-sw
eete
ned
beve
rage
s m
odel
con
tain
ed R
egio
n an
d A
ge in
tera
ctio
n te
rms
as e
xpla
nato
ry v
aria
bles
. The
se e
stim
ates
can
be
prov
ided
upo
n re
ques
t.
Sou
rce:
US
DA
, Eco
nom
ic R
esea
rch
Ser
vice
est
imat
es b
ased
on
Tufts
Uni
vers
ity F
riedm
an S
choo
l of N
utrit
ion
Sci
ence
and
Pol
icy,
Glo
bal N
utrit
ion
and
Pol
icy
Con
sort
ium
, G
loba
l Die
tary
Dat
abas
e; a
nd W
orld
Ban
k, In
tern
atio
nal C
ompa
rison
Pro
gram
.

35 The Influence of Income and Prices on Global Dietary Patterns by Country, Age, and Gender, ERR-225
Economic Research Service/USDA
Appendix table 1.3Estimates for plant-based intake (base model)
Variable Fruit Vegetables Beans and legumes Nuts and seeds Whole grains
Constant -94.33 (39.32)** 102.83 (52.08)** 17.86 (61.92) 30.63 (15.45)** 8.27 (67.20)
Women (W) 22.83 (1.05)*** 15.00 (0.57)*** 0.77 (0.15)*** 0.74 (0.07)*** 2.31 (0.21)***
Age 1.15 (0.09)*** 1.89 (0.07)*** 0.78 (0.07)*** 0.38 (0.05)*** 0.30 (0.03)***
Age2 -0.01 (0.00)*** -0.02 (0.00)*** -0.01 (0.00)*** 0.00 (0.00)*** 0.00 (0.00)***
Asia 15.64 (20.60) 29.57 (23.73) 2.49 (7.85) 31.74 (13.14)*** -8.34 (34.01)
FCP -35.67 (12.29)*** -24.21 (17.70) -9.62 (9.93) -2.38 (2.75) -71.70 (19.12)***
LAC 49.26 (15.61)*** -40.24 (16.50)** 61.70 (17.53)*** -1.68 (3.06) -51.67 (19.90)**
SSA -10.72 (14.70) -26.61 (19.23) 100.93 (26.76)*** -5.59 (4.51) 0.65 (31.13)
MENA/South Asia -7.35 (13.82) 52.27 (17.31)*** 13.91 (7.51)* 2.86 (2.71) -58.39 (22.23)***
log(Y) 19.80 (3.65)*** -1.17 (4.99) -2.15 (5.82) -3.22 (1.46)** 3.64 (6.23)
log(P) -63.09 (20.65)*** -11.38 (22.68) 3.09 (27.41) -1.13 (7.08) -78.01 (31.54)**
Adjusted R2 0.46 0.32 0.40 0.30 0.28
Note: ***, **, and * denote the 0.01, 0.05, and 0.10 significance level, respectively. Standard errors are in parentheses.FCP = Former Centrally Planned economies. LAC = Latin America and Caribbean. SSA = Sub-Saharan Africa. MENA = Middle East/North Africa.
Source: Estimates by USDA, Economic Research Service, based on Tufts University Friedman School of Nutrition Science and Policy, Global Nutrition and Policy Consortium, Global Dietary Database; and World Bank, International Comparison Program.
Appendix table 1.4
Estimates for meat, fish, and beverage intake (base model)
VariableUnprocessed
red meatProcessed
meat Fish MilkSugar-sweetened
beverages Fruit juice
Constant -54.85 (19.43)*** 13.36 (7.00)* -8.55 (10.35) -92.51 (51.87) 280.25 (47.59)*** -18.27 (29.82)
Women (W) -5.57 (0.21)*** -2.91 (0.18)*** -0.69 (0.04)*** 12.43 (0.58)*** -13.36 (0.82)*** 7.76 (0.59)***
Age 0.35 (0.01)*** -0.05 (0.00)*** 0.81 (0.03)*** -2.28 (0.11)*** -10.87 (0.74)*** -1.46 (0.11)***
Age2 0.00 (0.00)*** 0.00 (0.00)*** -0.01 (0.00)*** 0.03 (0.00)*** 0.08 (0.01)*** 0.01 (0.00)***
Asia -19.73 (6.47)*** -13.37 (2.21)*** 7.29 (5.59) -53.54 (20.17) -10.63 (15.21) -29.12 (9.76)***
FCP 1.35 (5.67) 1.33 (2.44) -15.36 (2.96)*** 14.26 (17.56) -4.32 (11.53) -30.34 (9.50)***
LAC -3.87 (6.20) -0.26 (3.18) -9.32 (4.17)** 35.64 (18.89)* 263.13 (30.50)*** 9.79 (10.55)
SSA 4.85 (7.91) -15.58 (2.50)*** -10.97 (5.08)** 17.80 (20.64) 54.52 (15.10)*** -30.28 (13.13)**
MENA/ South Asia -3.53 (5.96) -18.88 (1.83)*** -16.16 (3.21)*** -14.03 (16.77) 25.29 (12.49)** -31.36 (9.35)***
log(Y) 11.18 (1.79)*** 1.77 (0.68)*** 1.78 (0.96)* 27.79 (4.73)*** 13.96 (4.48)*** 11.73 (2.73)***
log(P) -9.82 (6.26) -6.96 (2.77)** -15.18 (4.81)*** -36.71 (16.90)** -53.61 (15.15)*** -20.28 (8.00)**
Adjusted R2 0.29 0.54 0.42 0.39 0.67 0.46
Note: ***, **, and * denote the 0.01, 0.05, and 0.10 significance level, respectively. Standard errors are in parentheses.FCP = Former Centrally Planned economies. LAC = Latin America and Caribbean. SSA = Sub-Saharan Africa. MENA = Middle East/North Africa.
Source: Estimates by USDA, Economic Research Service, based on Tufts University Friedman School of Nutrition Science and Policy, Global Nutrition and Policy Consortium, Global Dietary Database; and World Bank, International Comparison Program.

36 The Influence of Income and Prices on Global Dietary Patterns by Country, Age, and Gender, ERR-225
Economic Research Service/USDA
Appendix table 1.5
Estimates for selected categories with High-Income Asian Pacific (APC), South Asia (SA), and Other Islands as additional regions (base model)
VariableUnprocessed
red meatProcessed
meat Fish MilkSugar-sweetened
beverages Fruit juice
Constant -67.12 (44.27) 7.09 (7.77) 4.28 (11.06) -110.53 (61.02)* 249.46 (58.04)*** 3.92 (36.09)
Women (W) 22.83 (1.05)*** -2.91 (0.18)*** -0.69 (0.04)*** 12.43 (0.58)*** -13.36 (0.82)*** 7.76 (0.59)***
Age 1.15 (0.09)*** -0.05 (0.00)*** 0.81 (0.03)*** -2.28 (0.11)*** -10.87 (0.74)*** -1.46 (0.11)***
Age2 -0.01 (0.00)*** 0.00 (0.00)*** -0.01 (0.00)*** 0.03 (0.00)*** 0.08 (0.01)*** 0.01 (0.00)***
Asia (w/o APC) 25.08 (27.88) -10.04 (2.76)*** -2.13 (5.31) -45.12 (26.80)* 10.40 (17.83) -34.11 (12.02)***
FCP -40.05 (13.00)*** 2.35 (2.56) -16.44 (3.09)*** 14.39 (18.38) 0.41 (11.92) -34.02 (9.96)***
LAC 44.03 (16.29)*** 1.26 (3.38) -10.89 (4.47)** 36.03 (19.64)* 268.94 (32.06)*** 5.84 (10.98)
SSA -19.30 (16.16) -13.09 (3.01)*** -14.81 (5.77)*** 20.71 (22.76) 63.72 (17.36)*** -36.90 (14.70)**
MENA (w/o SA) 4.73 (14.56) -19.38 (1.82)*** -17.06 (3.28)*** -18.86 (16.19) 32.17 (13.40)** -30.89 (9.58)***
APC -19.17 (26.26) -18.14 (2.07)*** 23.43 (7.51)*** -73.29 (20.65)*** -42.07 (16.46)** -30.45 (10.82)***
SA -57.98 (18.75)*** -14.31 (2.90)*** -18.51 (4.90)*** -0.50 (38.41)* 22.66 (17.81) -46.39 (11.40)***
Other Is-lands -38.92 (11.67)*** 0.28 (2.17) 4.75 (4.31) -46.68 (15.74)*** 54.56 (15.13)*** -46.52 (9.96)***
log(Y) 17.34 (4.09)*** 2.32 (0.72)*** 0.51 (1.05) 29.68 (5.59)*** 16.72 (5.63)*** 9.80 (3.32)***
log(P) -60.88 (20.55)*** -4.78 (3.23) -16.25 (5.12)*** -36.06 (16.81)** -52.29 (15.57)*** -18.75 (7.96)**
Adjusted R2 0.50 0.55 0.46 0.40 0.67 0.47
Note: ***, **, and * denote the 0.01, 0.05, and 0.10 significance level, respectively. Standard errors are in parentheses.FCP = Former Centrally Planned economies. LAC = Latin America and Caribbean. SSA = Sub-Saharan Africa. MENA = Middle East/North Africa. APC = High-Income Asian Pacific. SA = South Asia.
Source: Estimates by USDA, Economic Research Service, based on Tufts University Friedman School of Nutrition Science and Policy, Global Nutrition and Policy Consortium, Global Dietary Database; and World Bank, International Comparison Program.

37 The Influence of Income and Prices on Global Dietary Patterns by Country, Age, and Gender, ERR-225
Economic Research Service/USDA
Appendix 2: Dietary Intake Across Regions
Mean intake levels of the various food categories by region are reported in appendix figures 2.1-2.3, which highlight plant-based, meat- and fish-based, and beverage intake, respectively. Considerable differences in daily intake across food categories, as well as regions, were evident. Overall, fruits and vegetables are important components of diets in every region; however, intake levels vary greatly. Fruit intake in LAC is about 160 grams per day (g/d), nearly twice the intake level in SSA. All other regions fall between LAC and SSA: ROW (151 g/d), Asia (136 g/d), MENA/South Asia (117 g/d) and FCP (96 g/d). Mean vegetable intake ranges from 104 g/d in LAC to 191 g/d in MENA/South Asia.
Intake of beans/legumes shows a much greater variability across regions, with the largest intake in SSA (121 g/d) and LAC (79 g/d). This is mostly due to relatively high consumption in Southern Africa (Zimbabwe, Botswana, Namibia, and Swaziland), Paraguay, Guatemala, Nicaragua, and Brazil, with very low consumption in most other regions: MENA/South Asia (31 g/d), Asia (26 g/d), ROW (13 g/d), and FCP (8 g/d). Average whole-grain intake is relatively high in SSA (92 g/d), followed by Asia (85 g/d) and ROW (56 g/d), but is significantly lower in other parts of the world, particularly in the FCP region (20 g/d). Nut and seed intake is significantly lower than other plant-based food categories, except in Asia, where intake of nuts/seeds is 38 g/d.
Appendix figure 2.1
Average individual intake in grams/day by region (plant-based intake), 2010
Note: MENA = Middle East/North Africa. ROW = rest of world.Source: USDA, Economic Research Service, based on Tufts University Friedman School of Nutrition Science and Policy, Global Nutrition and Policy Consortium, Global Dietary Database.
Mean intake (grams per capita per day)
0
25
50
75
100
125
150
175
200
225
Sub-SaharanAfrica
Latin Americaand the
Caribbean
Former Centrally Planned economies
Asia MENA/South Asia
High income/ROW
Fruit Vegetables Beans, legumes Nuts, seeds Whole grains

38 The Influence of Income and Prices on Global Dietary Patterns by Country, Age, and Gender, ERR-225
Economic Research Service/USDA
Unprocessed-red-meat intake, the largest of the meat and fish categories, is highest in ROW at 65 g/d, followed by FCP (54 g/d), MENA/South Asia (53 g/d), and LAC (51 g/d). Asia has the lowest intake of unprocessed red meat (32 g/d) but the highest fish intake (41 g/d). Fish intake in ROW (37 g/d) is the next highest, followed by SSA (25 g/d), LAC (25 g/d), FCP (17 g/d), and MENA/South Asia (18 g/d). Processed-meat intake is lower than unprocessed-red-meat intake in all regions. In MENA/South Asia, SSA, and Asia, processed meat is the least consumed on average, ranging from only 5 to 11 g/d. Processed meat intake in ROW is 24 g/d, LAC is 27 g/d, and FCP is 26 g/d.
Appendix figure 2.2
Average individual intake in grams/day by region (meat and fish), 2010
Note: MENA = Middle East/North Africa. ROW = rest of world.Source: USDA, Economic Research Service, based on Tufts University Friedman School of Nutrition Science and Policy, Global Nutrition and Policy Consortium, Global Dietary Database.
Mean intake (grams per capita per day)
0
10
20
30
40
50
60
70
Unprocessed red meat Processed meat Fish
Sub-SaharanAfrica
Latin Americaand the
Caribbean
Former Centrally Planned economies
Asia MENA/South Asia
High income/ROW

39 The Influence of Income and Prices on Global Dietary Patterns by Country, Age, and Gender, ERR-225
Economic Research Service/USDA
Daily milk intake is about the same in LAC, FCP and ROW (150 g/d), significantly greater than intake in SSA (89 g/d) and MENA/South Asia (109 g/d), and twice the intake in Asia (75 g/d). Fruit-juice intake is low when compared to the other beverage categories, ranging from one-third to one-fifth the level of milk intake in all regions, except LAC, where fruit-juice intake is about one-half the level of milk. The most pronounced difference in beverage consumption is the very high consumption of sugar-sweetened beverages in LAC (436 g/d), which is approximately 38 percent of total g/d of the combined 11 food categories. Intake in all other regions is below 150 g/d, with the share of total g/d ranging from 12-19 percent. SSA has the second-highest sugar-sweetened beverage intake (139 g/d), and FCP (75 g/d) has the lowest.
Appendix figure 2.3
Average individual intake in grams/day by region (beverages), 2010
Note: MENA = Middle East/North Africa. ROW = rest of world.Source: USDA, Economic Research Service, based on Tufts University Friedman School of Nutrition Science and Policy, Global Nutrition and Policy Consortium, Global Dietary Database.
Mean intake (grams per capita per day)
0
50
100
150
200
250
300
350
400
450
500Milk Sugar-sweetened beverages Fruit juice
Sub-SaharanAfrica
Latin Americaand the
Caribbean
Former Centrally Planned economies
Asia MENA/South Asia
High income/ROW