the influence of interest rates on the duration of ... · 4 essays on interest rates gathers...
TRANSCRIPT

This PDF is a selection from an out-of-print volume from the National Bureauof Economic Research
Volume Title: Essays on Interest Rates, Volume 1
Volume Author/Editor: Jack M. Guttentag and Phillip Cagan, eds.
Volume Publisher: NBER
Volume ISBN: 0-87014-201-1
Volume URL: http://www.nber.org/books/gutt69-1
Publication Date: 1969
Chapter Title: The Influence of Interest Rates on the Duration of BusinessCycles
Chapter Author: Phillip Cagan
Chapter URL: http://www.nber.org/chapters/c1207
Chapter pages in book: (p. 3 - 28)

Essays o,, interest Rojes


1
The Influence of Interest Rates on theDuration of Business Cycles Phillip Cagan
introduction
FINANCIAL EFFECTS ON INVESTMENT. In economic theory the cost ofcapital has an important influence on decisions to invest and, therefore,on business cycles. Increases in capital costs may curtail investmentundertakings thus contributing to a downturn in aggregate activity, andconversely, for decreases. Since the rate of interest is a major item incapital costs, empirical studies have looked for rate effects on invest-ment decisions and expenditures. Short-term rates are supposed toinfluence inventory investment and trade credit, while long-term ratesinfluence plans for plant and equipment installations and for residentialhousing; Such an effect would show up first in orders and contracts,later in appropriations and expenditures.
The typical cyclical pattern of interest rates does not at first sightsupport the foregoing theory. Interest rates and investment seriesgenerally conform to business activity on a positive basis, and so theircorrelation with each other is positive rather than negative as thetheory implies. A negative effect could still occur, and be consistentwith this behavior, if offsetting factors intervened for some time to de-lay the effect. For example, during business upswings, at first investorslook favorably upon capital projects despite the accompanying rise ininterest rates; but, if the rising cost of capital eventually exceeds ex-pected returns, the resulting reduction in investment expenditurescould bring on a downturn in general activity. Then, as the downturn
NOTE: I benefited greatly from the comments and suggestions of F. Thomas Juster,Jacob Mincer, and Geoffrey H. Moore. Josephine Trubek and Jae Won Lee provided in-valuable research assistance.

4 Essays on Interest Ratesgathers momentum, business prospects dim even further and the rem-nants of optimism fade. Investment undertakings previously held backby high interest rates no longer appear attractive even when rates aremuch lower. If cutbacks in the demand for capital funds are large,interest rates will decline. Interest rates and investment expenditurescan therefore display a positive association over cycles, even thoughthe rates have a delayed, inverse effect which contributes to fluctua-tions in investment.
This view of the cyclical role of interest rates can be expressed interms of traditional supply and demand analysis. Price in that frame-work would represent interest rates, and quantity would be capitalborrowing per period of time. A positive association between price andquantity reflects cyclical shifts in a downward sloping demand curvecombined with an upward sloping supply curve. A restriction on busi-ness expansions due to rising capital costs implies that the supply curveshifts leftward; if at a later stage of the expansion those shifts came tooutweigh the rightward shifts in demand, capital borrowing and ex-penditures would then decline, contributing to a downturn in aggregateactivity. A recession in activity, no matter how initiated, usually leadsto substantial leftward shifts in the investment demand curve, over-coming all other effects on supply and demand to make interest ratesand investment fall. Notwithstanding the over-all positive associationbetween price and quantity, countercyclical shifts in the supply curve,by further raising rates and eventually reducing the quantity demanded,could be a factor in the downturn of business activity.
Deriving evidence of such supply effects, however, presents severedifficulties. To disentangle the shifts in demand and supply, econometricstudies specify and attempt to measure the separate curves. Even forthe more successful studies, the data requirements usually restrict thecoverage to recent periods, which limits the significance of the results.It is desirable to draw on the evidence of long periods. This study re-ports experiments with a new test for supply effects utilizing the cyclicalbehavior of series just of interest rates and investment or business ac-tivity, and so allows coverage of a long period. The results are promis-ing, though tentative because of some remaining difficulties in measure-ment and interpretation.
A TEST FOR SUPPLY EFFECTS. One might, in principle, draw conclusionsabout supply and demand effects simply from the cyclical behavior ofthese series at turning points. If investment and the interest rate turndown, for example, the decline reflects a predominant, leftward shift in

Interest Rates and Business Cycles 5
demand—if the rate continues to rise, a predominant, leftward shift insupply. In practice, however, such inferences are subject to doubt. Theinterest rate may not correctly reflect the cost of financing the particu-lar items covered by the investment series, and a comparison confinedto concurrent movements does not allow for lags. A downturn in capitalborrowing while the rate is, at the moment, still rising might indicate aleftward shift in the supply curve, for example, or it might indicate adecline in investment demand which reduces orders immediately buthas a delayed effect on the interest rate. With lags, such comparisonshave ambiguous interpretations.
The test for supply effects presented here is designed to allow forlong lags, in both demand effects on interest rates and rate effects onquantities, as well as to simplify the data requirements. The test treatseach cyclical phase in the rate or in investment or business activity asone observation, and is based on the assumption that cyclical fluctua-tions in interest rates reflect largely reinforcing shifts in both the de-mand and the supply curves of capital funds (that is, the demand shiftsprocyclically and the supply countercyclically). While such shifts indemand tend to prolong the accompanying cyclical movement in in-vestments, those in supply tend to limit it. Cyclical fluctuations in de-mand and supply do not, however, have identical timing, and disparateturning points in interest rates and related investment series are oftenobserved. Much of the independent behavior of the supply curve canbe attributed to monetary and other financial factors. At business re-vivals, for example, the supply of capital funds often continues to ex-pand following an upturn in investment demand, as indicated by a fallin interest rates while borrowing increases; but such a procyclical shiftin supply soon ends and then is reversed, and interest rates rise. Thetightening of credit restricts and eventually may help to end the expan-sion in investment. Therefore, for each month that the leftward shift insupply is delayed the expansion in investment would tend, other thingsthe same, to last longer. A test of this supply effect is to determinewhether investment and business expansions are longer when interestrates start to rise later. A similar test may be used for contractions.
Shifts in demand also affect rates and the duration of phases, ofcourse, but presumably not in the same way. Demand factors may wellaccount for the tendency of interest rates to lag at business cycle turns,contrary to the assumption here that supply shifts are responsible. Butthere is no reason to expect the timing of, say, an upturn in investmentdemand to determine the date of the subsequent downturn in businessactivity unless, as the test here assumes, expansion in the supply of

6 Essays on Interest Ratescapital funds was limited and thus restricted the duration of the up-swing.
Although the logic of such a test applies in general to the price-quantity fluctuations of any sector of the economy, it uses a small partof the potentially available information and therefore appears usefulprimarily where the complexity of relationships and lack of data pre-clude a more complete analysis. Aggregate investment is such a sector.Even after making the simplifications, there are difficulties in represent-ing the cost of financing particular investment activities by any of theavailable interest-rate series. Generally the investment series whichcover a fairly long period pertain to certain industries. Since this studyis mainly concerned with the financial effects on general business ac-tivity, most of it compares interest-rate movements with the NationalBureau's chronology of business cycles, on the assumption that totalinvestment demand in the economy is closely related to general busi-ness activity and has largely the same turning points. Later the analysisis extended to some series on residential and business construction.Since business cycles depend upon a variety of economic relationships,such a test cannot establish whether monetary and financial effects oncapital costs play a dominant role in cyclical turns. But it can suggestwhether they make an important independent contribution.
Cyclical Fluctuations in Interest Rates and theDuration of Reference-Cycle Phases
THE LAGGED TIMING OF INTEREST RATES. Reasonably accurate esti-mates of the duration of business cycles extend back to the mid-1800's,providing a large number of observations. The estimates are used herewith series on commercial paper rates and high-grade bond yields.Those rates are assumed to reflect the relative movements of demandand supply in the financial market as a whole. Paper rates are relevantto short-term business loans for inventory investment; bond yields, tolong-term capital financing. The bond series is Macaulay's high-graderailroad average, through 1937, and Moody's Aaa public utility aver-age, thereafter. Before the 1930's, railroad bonds were much in favorwith investors seeking safety; but after the experiences of that decade,preferences shifted, in particular to public utility bonds. During the1930's no group of corporate bonds was widely viewed as high grade.For that and other reasons, to be noted later, none of the cyclical move-

Interest Rates and Business Cycles 7
ments between 1933 and 1945 are retained for bonds in the subsequentanalysis. The turning points selected for bond series are shown inChart 1-1. Those for commercial paper (not shown) are similar.
Turning points present certain problems of identification. First of all,cyclical turns are not always clearly defined, and the selection of aparticular date may involve considerable error. Second, interest ratessometimes have extra cyclical movements corresponding to the samereference phase, and it is not always clear which movement corre-sponds to the reference phase. The choice of one turn rather than an-other can make considerable difference in the length of leads or lags.To avoid arbitrary matchings when the rate has multiple turns, thehighest peak has been matched with reference peaks, the lowesttrough with reference troughs; the extra turns are ignored. This pro-cedure cannot be defended as always being appropriate, but multipleturns in rates are not numerous. A few of the special cases could un-duly influence the statistical results, and they have been excluded.Reference phases skipped by the interest rates are also excluded; theywill be discussed later.
The rate series conform to most reference cycles, but usually with alag of variable length. For the conforming movements, the median lagfor bonds is six months at troughs and fourteen at peaks; for commer-cial paper, five and four months, respectively. A long, fairly regular lagis characteristic of few other economic variables. The lags may beattributed in part to monetary and other financial developments on thesupply side.' Demand factors are less likely to run counter to generalbusiness activity for long and therefore to produce lags in rates.
A REGRESSION TEST. For conforming movements in the interest rate,the relevant variables may be denoted by
L has usually been positive, indicating that the interest ratelags behind the reference-cycle turn. (Sometimes the lag is so long thatL even exceeds D.) Occasionally, when rates have led, L is negative.The amplitude of movement in the interest rate during the lag segmentis represented by A. According to the test for supply effects outlinedabove, both the length and the amplitude of the segment should affectthe duration of the corresponding reference phase. We may separatethe joint effect by treating the lag L and the amplitude per month AlL
'See my "Changes in the Cyclical Behavior of Interest Rates," Review of Economicsand Statistics, Aug. 1966, reprinted as Occasional Paper 100, New York, NBER.

CH
AR
T 1-
1. C
yclic
al T
urni
ng P
oint
s in
Hig
h-G
rade
Cor
pora
te B
ond
Yie
lds,
1857
—19
65C
yclic
altu
rnin
g po
ints
• co
nfor
min
g 10
ref
eren
ce c
ycle
lurn
szS
not
con
form
ing
-S -S
Per
cen
t per
onn
umP
er c
ent p
er a
nnum

L —.
(.n0'— l_
C—
'I.
.—
—
o
Ocd
o
L'1)
C4-
—
rM
I-N
V
k
9Interest Rates and Business CyclesEc
0,0.C0,UI-4'
0

10 Essays on Interest RatesTiming of:
Reference phases
Interest rate
FIGURE 1-1. Movement of Interest Rates at Reference-CycleTurns
as independent variables. An effect of interest rates on duration maythen be expressed by the regression equation (assumed linear):
(1)
where a and /3 are constant parameters, C is a constant term, and isa random variable representing all the other factors which producevariations in the duration of phases. The sign of AlL is defined to bepositive when rates are rising between peaks in the rate and businessor when rates are declining between troughs; and negative for the op-posite movements. By this designation of the sign, positive movementsin AlL tend to shorten the accompanying reference phase, so the signof /3 should be negative.
Charts 1-2 and 1-3 present scatter diagrams of D and L for the twointerest rates. Skipped phases, as mentioned earlier, have been ex-cluded.2 A few extreme observations pertain to unusually long dura-tions: 1873—79, 1933—37, and 1938—45, except that. bond yieldsskipped the last one. The latter two had long lags in the interest rateswhich exaggerate the apparent correlation with duration, while the1873—79 contraction had a leading turn in the interest rates which re-
2 One could mechanically include them by relating the skipped phase to the nearestappropriate turn in the interest rate, but that would relate the same turn to two phaseswhich has the implausible implication that the timing of the same interest-rate movementaffects the duration of two separate phases. For this reason it seems preferable simplyto exclude the few skipped phases.
Months

Interest Rates and Business Cycles 11
duces the apparent correlation. The 1873—79 contraction was a specialcase: There is reason to believe that the business trough actually cameearlier than 1879. Also, the interest rates had multiple cyclical turnsand began a secular downtrend during that phase, casting doubt onwhether our selection of the first of those turns is appropriate. In anyevent, the extreme observations are best excluded when examining theassociation for most cycles. The 1937—38 contraction is also excludedfor bonds, as noted earlier, because of doubt about the data used forthat period.
For the remaining forty-two phases for bonds and forty-six for corn-
CHART 1-2. Lead or Lag in Bond Yields at ReferenceCycle Turns, and Duration of References Phases, 1857—1960
S Troughs and expansion phasesX Peaks and coniraction phases
Duration in months70
x4
60 -
50 -
xS
40 -x
SS
x30 -
20—S. S
xxx
X 4=1873-79 contractionB = 1933-37 expansion
0 I I I I
—10 0 +10 +20 +30 +40 +50Lead C—) or lag (+) in months
SOURCE: Same as Chart 1-1.
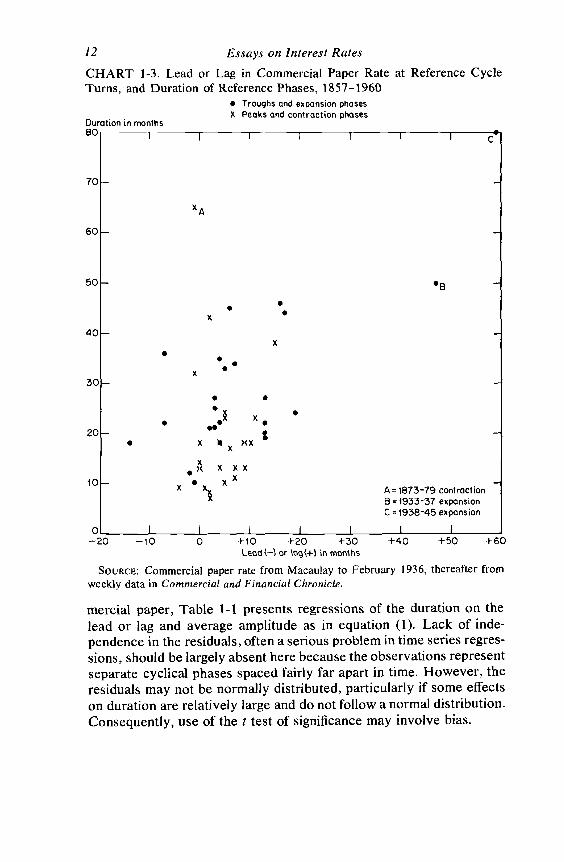
12 Essays on Interest RatesCHART 1-3. Lead or Lag in Commercial Paper Rate at Reference CycleTurns, and Duration of Reference Phases, 1857—1960
• Troughs and expansion phasesX Peaks and contraction phases
Durat ion in months80
C
70 -
x
x
x
x xxxx
X A1873-79 contractionB = 1933-37 expansionC = 1938-45 expansion
0 I I I
—20 —10 0 +10 +20 +30 +40 +50 +60Lead (—'1 or months
SOURCE: Commercial paper rate from Macaulay to February 1936, thereafter fromweekly data in Commercial and Financial Chronicle.
mercial paper, Table 1-1 presents regressions of the duration on thelead or lag and average amplitude as in equation (1). Lack of inde-pendence in the residuals, often a serious problem in time series regres-sions, should be largely absent here because the observations representseparate cyclical phases spaced fairly far apart in time. However, theresiduals may not be normally distributed, particularly if some effectson duration are relatively large and do not follow a normal distribution.Consequently, use of the t test of significance may involve bias.

Interest Rates and Business Cycles 13
Table 1-1 indicates a relationship in the expected direction, though,as might be expected from our disregard of demand effects, the correla-tion is low. Yet by the t test it is significant (t > 2) for all phases to-gether and for bonds in expansions. The coefficient of the amplitudevariable has the correct sign but is not significant. Apparently theamplitude, as distinct from the direction of movements early in the
TABLE 1-1. Interest Rates and Duration of Reference Phases 1857—1960,Regression Equations
TotalRegression Coefficient b Cor-
(and t value) Con-stantTerm
rela-tionCo- No. ofLead Amplitude
Interest Rate and or Lag Per Month C (months) effi- Obser-Reference Phases a (L) (AlL) (C) dent vations
Bonds .58(3.8) —.25(0.8) 18 .52 42Commercial paper .52(2.2) —.04(1.0) 20 .34 46
BondsAll phases .62(3.8) 17 .52 42Expansions .45(2.4) 22 .49 21Contractions .64(1.8) 14 .38 21
Commercial paperAll phases .49(2.1) 19 .31 46Expansions .41(1.6) 24 .35 22Contractions .58(1.4) 15 .29 24
Bonds, Expansions Added to:Subsequent contractions .48(2.0) 37 .43 19Previous contractions .36(1.9) 37 .43 18
Commercial paper, ExpansionsAdded to:
Subsequent contractions .25(0.8) 42 .17 21Previous contractions .27(1.1) 40 .24 21
SOURCE: Same as Charts 1-1 and 1-3.a Excluding 1873—79, 1933—37, and 1938—45 reference phases for commercial paper
rate and first two of those phases and 1937—38 for bond yields, as well as adjacentphases for the bottom four regressions.
b Regression equation is eq. (1) in text. See accompanying figure for definition ofvariables. Signs of t values have been dropped. For 19 or 20 degrees of freedom, thevalue of t significant at the .05 level is 2.09; for 40 degrees of freedom it is 2.02.
C Sign is positive if change in rate during period of lead or lag relative to reference turnworks to shorten corresponding reference phase, negative if to lengthen it (that is, in-creases relative to peaks and declines relative to troughs are positive, declines at peaksand increases at troughs are negative). If L is zero, AlL is also made zero.

.14 Essays on Interest Ratesphase, is an unimportant part of the total effect of supply shifts duringthe entire phase. We cannot disentangle that total effect from demandeffects in a test of this kind.3 The amplitude variable has been omittedfrom the other regressions in the table, which show roughly similarresults for expansions and contractions separately.
The bottom group of four regressions is designed to test for possiblebias due to secular variations in trend. Reference cycle turns are derivedfrom series with growth trends whereas interest rates, being pure num-bers, have no natural growth. Although bond yields exhibit long swingsof 15—30 years duration, they have no clear trend over the period cov-ered as a whole. An upward trend in a series shifts peaks forward andtroughs backward, thus lengthening expansions and shortening contrac-tions. Hence, when the intercyclical trend in business activity is rela-tively strong (assuming the trend in the rates is negligible), businesscycles have longer expansions and shorter contractions than interestrates do. This by itself would tend to increase lags in interest rates attroughs and to reduce lags at peaks. If the magnitude of the trend variedsecularly, there would appear to be a positive association between theduration of phases and the corresponding lag in interest rates, as foundhere. And this effect of trend could pertain separately to expansionsand contractions. If we add together the L's for adjacent expansionsand contractions, the shifts in timing due to such trend will cancel out.The bottom four regressions in Table 1-1 give the result.s two ways,pairing expansions (1) with subsequent contractions and (2) with pre-vious contractions. For each pair, the regression related the sum of thetwo D's to the sum of the two L's. Either method of pairing produces areduction in correlation, suggesting that trend may have affected theprevious results, though less for bonds than for commercial paper. Thetrend-adjusted relation for bonds remains on the borderline of signifi-
Various regressions (not presented) were run to measure the effect on duration ofthe amplitude of change per month in the interest rate from its turning point to the end ofthe reference phase and of the amplitude for the initial sections of that segment. The par-tial correlation of such variables were usually negative (showing, as expected, that alarger amplitude produces a shorter phase), but on the whole they were not significant.
This may not indicate unimportance, however, because the concurrent positive effectof business activity on interest rates tends to hide the inverse effect of their changes onduration. A vigorous business expansion, for example, generates momentum to prolongthe upswing while it also raises interest rates. The separate effects of demand and supplyon rates cannot readily be distinguished. Indeed, the tests of Table 1-I are specificallydesigned to avoid that problem by examining the early stages of the phase, before rateshave turned, during which L and AlL measure the extent to which shifts in supply ex-ceed those in demand. During the lag segment, supply conditions contribute to a con-tinuation of the phase and have not yet begun to restrict it.

Interest Rates and Business Cycles 15
cance (at the .05 level). That for commercial paper rates remains posi-tive but falls below the significance level; turns in that series appear toreflect cyclical shifts in the supply curve of total credit less strongly.
The remainder of this section discusses the problem of skippedphases and of the shift in timing of bond yields after 1914.
SKIPPED PHASES. In a few cases, the interest rates have no identifiablecyclical movement corresponding to a reference phase. Such an unin-terrupted rise or decline in the rate, if supply shifts are mainly re-sponsible, tends to shorten or prolong the phase. Table 1-2 gives theexpected and actual effects for the skipped phases. In five of the six
TABLE 1-2. Reference-Cycle Phases Skipped by Interest Rates, 1857—1960
Reference PhaseDirection of Cyclical
Movement and Effect onRela-
Direc-Dura-tion
tion toAverage
Dura-
Reference Phase Skipped
Commercial CorporateDate tion (months) tion a Paper Rates Bond Yield
Jan. 1910—Jan. 1912 Cont. 24 Long Up, ProlongJan. 1912—Jan. 1913 Exp. 12 Short Up, ShortenJuly 1924—Oct. 1926 Exp. 27 Equal Down, ProlongOct. 1926—Nov. 1927 Cont. 13 Short Down, ShortenJune 1938—Feb. 1945 Exp. 80 Long Down, ProlongFeb. 1945—Oct. 1945 Cont. 8 Short Up, Prolong Down, ShortenOct. 1945—Nov. 1948 Exp. 37 Long Up, Shorten
SOURCE: Same as Chart 1-1 for bond yields; Chart 1-3 for commercial paper rates.a Average of all reference phases, 1857—1960: 26.9 months for expansions, 17.2 for
contractions.
phases skipped by the bond series, the relative duration of the phasewas consistent with the expected effect of the movement in bondyields: rising bond yields appeared to shorten, and falling yields toprolong, business expansions; and conversely for business contrac-tions. (The evidence for the sixth phase, which is equal to the average,is neutral.) Commercial paper rates skipped but two reference phases,both in the early post-World War II years when the Federal Reservepegged government bond prices. Those two phases had lengths incon-sistent with the upward movements in commercial paper rates, butthose movements were extremely small and understandably exerted

16 Essays on Interest Rateslittle restraint on business activity. On the whole, the skipped phasesare consistent with supply effects on the duration of reference phases.
THE SHIFT IN TIMING OF BOND YIELDS. Although the statistical evi-dence clearly indicates a financial effect by bond yields on businessactivity, the yields nevertheless raise questions of interpretation thatrequire further consideration. As shown in Table 1-3, the lagged timingof bond yields, typically quite long before World War I, has shortenednoticeably since then.4 The regression results suggest that such ashortening of lags would reduce the duration of later reference phases,
TABLE 1-3. Timing of Bond Yields at Reference Turns and Average Dura-tion of Reference Phases, Before and After 1914 (months)
Median Lag (+) at AverageDuration of
Reference PhasesPeaks Troughs
1857—1914 +9.5 +14 231915—60 +1 +3.5 23
NoTE: Coverage same as for Table 1-1, that is, excluding 1873—79, 1933—37, and1937—38, as well as skipped phases.
yet the average duration has not changed. Evidently the regressionlines shifted between the two periods, as is confirmed by the separatefits reported in the top part of Table 1-4. The slope of the line and theconstant term increased from the earlier to the later period. For ex-pansions and contractions fitted separately (not shown), there is thesame increase in the constant term; the slope also increases for expan-sions though not for contractions. Such a major shift in the relationshipseems to indicate that interest-rate movements do not affect duration.But that conclusion then leaves no apparent explanation for the corre-lations within each period.
Another interpretation is that the correlations do indicate an effectof supply shifts on investment and business activity but that the reflec-tion of those shifts in bond movements has speeded up, altering ourmeasuring rod. Why the timing of bond cycles changed is not clear,though, presumably, growth in the size and activity of the bondmarket contributed to greater sensitivity of yields to financial develop-ments.
See also "Changes in the Cyclical Behavior of Interest Rates."

Interest Rates and Business Cycles 17
TABLE 1-4. Regression of Reference-Phase Duration on Lead or Lag inBond Yields and in Monetary Growth Rate, Before and After 1914
RegressionCoefficient
(and t value) ofLead or Lag (L)
ConstantTerm
(months)
TotalCorrelationCoefficient
No. ofObser-vations
Bonds1857—1914 .70(4.4) 14 .67 261915—60 .98(2.5) 20 .56 16
Monetary GrowthRate (inverted)
1870—1960 .73(5.6) 17 .69 371870—1914 .61(3.2) 17 .60 211915—61 .85(4.3) 17 .75 16
SOURCE: Bond yields, same as for Table 1-1; money, currency outside banks plusdemand and time deposits from M. Friedman and A. Schwartz, A Monetary Historyof the United States, 1867—1 960, Princeton for NBER, 1963, Table Al series revisedand extended. The monetary series is annual before 1907, making the turning pointsless reliable in the earlier period. The dates of some of the monetary turns are differentthan those shown in "Changes in the Cyclical Behavior of Interest Rates," Chart 3,because of revisions.
This interpretation is further suggested by the related behavior ofthe growth rate of the money stock. Cycles in monetary growth con-tribute to cyclical shifts in the supply of loanable funds and help toaccount for the lagged cyclical behavior of interest rates. My earlierstudy5 found that troughs in interest rates tend to coincide with peaksin monetary growth, and peaks in rates with monetary troughs — thatis, monetary growth has an inverted relation to interest rates. We maytherefore expect to find a relation between turns in monetary growth(inverted) and the duration of reference phases. (Chart 1-4 presentsthe scatter diagram.) Monetary growth (inverted) tends over the periodcovered there to lag behind matched reference turns, in the same waythat interest rates do, and to exhibit a similar correspondence to phasedurations. Correlations of this relation, shown in the lower panel ofTable 1-4 which excludes the three extreme observations marked onthe chart, are significant. The relation for bond yields thereforeparallels a similar relation for monetary growth.
5lbid., Chart 1-3 and Table 1-7. That study also presented evidence that the cyclesin monetary growth are not themselves produced by interest-rate movements.

18 Essays on Interest RatesCHART 1-4. Lead or Lag in the Rate of Change in the Money Stock at Non-war Reference Cycle Turns, and Duration of Reference Phases, 1870—1960
• Troughs and expansion phasesx Peaks and contraction phases
Duration in monthsBC c
70 -
60 -
50 -
x
40x
• .S
30
SV •
S.20— S.
xx •III X
•X XX
10 X x.X X A 1873-79 contraction
X B 1933-37 expanstonC = 1938-45 expansion
0 I I I I
—20 —10 0 +10 +30 +40 +50 +60Lead (—) or lag (+) in months
NOTE: Troughs in the rate of change of the money stock are related to reference peaks,and peaks to reference troughs.
SOURCE: Same as Table 1-4.
This similarity suggests the following interpretation: A cyclicaldownturn in monetary growth during business expansion contributesto an upturn in interest rates and exerts a growing restraint on invest-ment which eventually helps to bring on a recession in activity; and,conversely, a cyclical upturn in monetary growth during a recessioncontributes to a decline in interest rates, stimulates investment, andsubsequently leads to a business revival. The money correlations are

Interest Rates and Business Cycles 19
pertinent to the shift in timing for bonds, mentioned above, becausethe constant term of the money regressions is not larger after 1914 thanit was before. That the timing of the monetary cycles and their relationto duration have remained the same suggests that the change in timingfor bonds did not reflect a change in the cyclical effect of the supply ofloanable funds on business activity.6
To be sure, the evidence is far from conclusive and must be viewedas tentative. Other interpretations cannot be ruled out, though twoalternatives examined in the next section, at first sight appealing, arefound not to be supported by the evidence.
Alternative Interpretations of the Evidence
The fact that D can be viewed as the sum of two correlated segments,L and D — L, suggests two alternative interpretations of the data.One is that D is spuriously correlated with L because both are in-fluenced by the same cyclical factors. Another is that the associationis purely mechanical and without economic significance, because turnsin interest rates occur at random somewhere within each referencephase. Thus, although D is independent of L, if for any reason D shouldbe larger L would also tend to be larger. We may consider these twoalternative interpretations in turn.
COMMON INFLUENCES ON D AND L. Some business phases, one mightargue, proceed slowly and some rapidly, and interconnections acrossthe economy maintain a similar rate of movement in each sector. Inslowly developing phases which have long durations, interest ratestend to move sluggishly and to have delayed turning points; and rapidlydeveloping phases behave conversely. There could be an associationbetween L and D, therefore, even though neither was directly relatedto the other. Since interest rates obviously depend on developmentsin the economy at large, this rationalization of the preceding results isplausible on the surface and deserves consideration.
To judge its importance in the correlations of Tables 1-2 and 1-4,a variable representing the pace of general business activity in eachphase can be added to those regressions. Such a variable may be
6 This conclusion disregards the increased slope of the later regressions for bothbonds and money, which seems to suggest that in the later period the lag in the turningpoint is more nearly additive to the phase.duration. It is not clear what might producesuch a change.

20 • Essays on Interest Ratesrepresented by the average change per month in an index of generalbusiness activity and is denoted by B. If it accounted for the previousresults, it would be the only variable having a significant partial cor-relation with duration. The results are presented in Table 1-5.
TABLE 1-5. Bond Yield and Duration of Reference Cycle Phase: Regressionof Duration on Lead or Lag and Severity of Reference Phase
Partial Correlation Coefficient (and t value)
Severity of MultipleReference Correlation
Lead or Lag (L) Phase (B) Coefficient
Expansions .48(2.3) —.66(3.6) .74Contractions .27(1.2) —.36(1.6) .50All phases .41(2.8) —.54(3.9) .69
SOURCE: Bond yield, same as Chart 1-1; severity of reference phase, G. H. Moore(ed.), Business Cycle Indicators, Vol. 1, Princeton for NBER, 1961, P. 104, and un-published extensions and revisions.
NOTE: Regression equation is
DaL+f3B+C,where L is lead (—) or lag (+) of interest rate from reference-cycle turn, D is durationof reference phase, B is an index of severity of the reference phase per month, and a, 13,and C are regression coefficients. Signs of i values have been dropped.
Coverage is the same as for Table 1-2.
As expected, the index of business activity has a significant (nega-tive) association with duration. The index does not, however, accountfor the effects found above for interest rates. The partial correlationcoefficient of D on L is still significant in all phases, taken together,and for expansions, taken separately. Although the measure used forthe average amplitude of business activity may not perfectly representthe common cyclical influences on the variables, it should be a reason-able proxy, and its failure to make a significant difference suggests thatsuch influences are not important here.
EFFECTS OF D ON L. It is conceivable that the financial system operatesin such a manner that interest rates tend to have cyclical upturns whenbusiness activity expands and downturns when it contracts. If, inaddition, the turns in rates occur at random during the concurrent

Interest Rates and Business Cycles 21
reference phase, L would tend to vary with D. There are some diffi-culties in specifying the economic conditions under which such adependence could happen,7 but the possibility has disarming simplicityand should be examined.
Evidence is afforded by the behavior of other economic series. Ifthe correlation between D and L for interest rates reflects a mechani-cal relationship rather than financial influences on business cycles,nonfinancial series should be correlated with D in the same way. Agroup of representative economic time series was examined for suchcorrelation.8 The selection favored series with a long coverage andincluded a broad sample of economic activity. Only one gave evidenceof a systematic correlation between the lead or lag from referenceturns and the duration of the concurrent reference phase.9 Since bondyields and monetary growth exhibit a rare relationship to referencephases, it cannot be dismissed as simply a mechanical characteristicof cycles observable in a variety of series.
Some Statistical Properties of the Relationship
If, as the evidence suggests, increases in interest rates restrain businessexpansions and decreases stimulate recovery from business contrac-tions, such effects seem to imply a cyclical pattern of rates having aninverted conformity to reference cycles and a lead in timing. How-
As a purely statistical proposition, can be defined as a stochastic variable drawnat random from a population whose mean value is some fraction of D,. The two wouldthen be correlated over time, consistent with the results here. But if this were taken toimply an effect of D upon L, the inference would face difficulties in economic interpre-tation. Since the mean of the distribution of L is proportional to the length of the con-current business phase not yet ended, an event early in the cycle is made to depend uponfuture developments. For developments early in a phase to be determined by its ultimateduration seems far fetched. In addition, contrary to this determination of L, the turn inrates does not always occur during the phase; it sometimes occurs earlier or later.
8Those examined were new incorporations 1861—1960; wholesale prices 1857—1960;common stock prices 1873—1960; bank clearings outside New York City 1879—1960;new orders of durable goods 1921—60; contracts for total commercial and industrialbuilding 19 19—60; labor costs per unit of output 1919—60; capital expenditures for newplant and equipment 19 18—60; production worker employment 19 14—60.
9New incorporations, 1861—1960 (with extreme observations for 1873—79, 1933—37,and 193 8—45 excluded), was the only series to show a significant correlation betweenD and L at the .05 level, though unlike bonds and money (inverted), generally this seriesleads reference turns (L is usually negative).

22 Essays on Interest Ratesever, movements in business activity also exert a strong pull (from thedemand side) on interest rates, which tends to produce positive con-formity and coincident or lagging timing. Which pattern predominatesmay be judged from the stability of the timing relation on each basis.
is the variance of the timing relation on a positive basis; isthe variance of the timing on an inverted basis. Table 1-6 shows that
is smaller than (though about the same in expansions, takenalone). Interest rates conform more closely to reference cycles on apositive than on an inverted basis.1° By implication, the effect of busi-ness activity on interest rates is slightly more powerful than the effectof the rates on activity in determining the relation between the two.
TABLE 1-6. Stability of Timing in Bond Yields at ReferenceCycle Turns on Positive and Inverted Basis (standard error oflead or lag, months)
PositiveBasis 0L
invertedBasis °D—L
Ratio ofStandardErrors
Expansions 11.2 10.8 1.03Contractions 5.7 9.2 .62All phases 9.3 10.1 .92
1852—1914 8.5 6.3 1.361915—61 7.6 11.0 .69
SOURCE: Same as for Tables 1-1 and 1-4.
It is just this—the strong effect of activity on the rates—that makesthe reverse effect elusive and difficult to identify. Nevertheless, activityeffects on rates do not result in a perfect positive conformity, partlybecause of deviations produced by monetary and other financialinfluences. Because of the frequent occurrence of deviations from per-fect positive conformity, the preceding test of a rate effect on durationbecomes possible.
The fact that D — L varies more than L is one reason for the lowcorrelation with D, since the ratio of segment variances and the slopeof the regression line jointly determine the correlation coefficient.
10 is easily shown that this implies RD,,. < Rr,,D_L, which expresses the general rulethat the sum of two nonidentical series has a greater correlation with the componenthaving the larger variance.

Interest Rates and Business Cycles 23
This may be demonstrated. By definition we have
D2 —9
where & is the estimate of the regression slope, OD.L/c4. The varianceof D can be decomposed into
= + +Since °DL,L = — = — = —(1 — &)oj, we have
1). (1)
Hence
= + 2& — i(2)
The ratio of segment variances, and the slope a are usuallygreater than unity. Consequently, RD,L is less than a."
A regression slope below unity means that an increase in L is as-sociated on the average with a smaller numerical increase in D, sug-gesting that financial effects on duration are not additive to othereffects but interact with them. Interest rates appear to influence busi-ness activity by speeding up or slowing down the effects of other fac-tors, which in turn constrain the financial effects. Without taking thoseother factors into account, we cannot take full advantage of the infor-mation provided by movements in interest rates. The statistical resultof specifying such a nonlinear relationship as linear is to introduce anegative correlation between L and €. Since they are assumed to beuncorrelated by the least squares regression procedure, the negativecorrelation shows up between L and D — L, the remainder of the refer-ence phase after the turn in the interest rate.12
Because of this negative correlation and the relatively high vari-ability in D — L, L provides a weak prediction of D. The regression isnevertheless significant, and therefore a better predictor than the meanlength of past phases. if the probability distribution of phase durationsdoes not change over time, the error of such a prediction can be esti-
"It is not clear which of these quantities are independent and which are determinedby the others. We might plausibly expect economic factors to determine the segmentvariances and the slope of the relationship between D and L, which would make thecorrelation coefficient the dependent quantity. In view of the increase in & after 1914,however, it is not clear whether that reasoning is correct.
12 Since, = —(1 — as shown above, RL.D_1, < 0 if < 1.

24 Essays on interest Ratesmated by the standard deviation of past durations, Under the as-sumption of no change in the probability distribution, however, theregression equations of Tables 1-1 and 1-4 give a better prediction,namely + ê, where & and ê are the estimated regression coeffi-cients. The standard error of their predictions is less than by thefraction Vi — R2, where R is the correlation coefficient of the regres-sion fit. For bonds in all phases it is 85 per cent ('Vl — .522); and inthe earlier and the later period separately, 74 and 83 per cent, respec-tively. That provides a slight improvement over simply projecting themean value of past durations, though the comparison disregards thefew phases listed in Table 1-2 in which the interest rate failed to giveany prediction at all because of no cyclical turn. It is also true that theregression prediction can be made only after the interest rate turns —and becomes known. While this usually occurs during the phase,not at its beginning, the evidence still suggests that a phase is mostunlikely to end before the interest rate turns.
interest-Rate Effects on Construction Contracts
Changes in bond yields mainly affect the capital or durable goodssector of the economy where interest costs are relevant to purchasers.Therefore, the previous evidence will be extended to examine therelation between cycles in interest rates and investment. Unfor-tunately, there are few monthly or quarterly series on investmenthaving a broad and fairly long coverage. Construction is one sectorthat partially meets those criteria. We have series on the value ofconstruction contracts, subdivided into business and residential con-struction. Since cycles in these series often deviate considerably fromgeneral business activity, their use does not involve a repetition ofthe previous test. Indeed, contracts are signed well before any ex-penditures are made and represent an early stage of investment under-takings.
The three sections of Chart 1-5 show scatter diagrams of the lead orlag in bond yields at cyclical turns in the contract series and the dura-tion of the corresponding phase in contract cycles. Skipped or non-matching cyclical movements in the series have been excluded. Insome cases there is no turn in bond yields during a contract phase, andit is not always clear whether an earlier or later turn in bonds shouldbe matched with the phase in contracts. All matchings which appear atall reasonable are included in Chart 1-5. It would be desirable, in

Interest Rates and Business Cycles 25
CHART 1-5. Lead or Lag in Bond Yields at Turning Points in Value of Total,Residential and Nonresidential Construction Contracts, and Duration ofPhases in Construction.
Total • Troughs and expansion phasesDuration in months X Peaks and contraction phases
I I I
60 -B
501929-32
X4 B=1932-3740
C= 1928-33D = 1933-37
30 E=1951_56
F = 1928-3320 G=1951-57
x •X
10-x X
X
0 I I I I
-10 0 +10 +20 ÷30 +40 +50Lead (—) or lag (+) in months
Residential NonresidentialDuration in months Duration in months7C 7C
60 XC 60
X50 50
40 40S
30 30 .X x
20 20 5x x .
X X)( )(10. 10- *
X X
0 I I I 0 I I I I I
-10 0 ÷10 +20 ÷30 ÷40 +50 -10 0 +10 +20 +30 +40 +50Lead (—) or lag (+) in months
SOURCE: F. W. Dodge Corporation. Periods covered are total construction 1912—60,residential 1916—60, nonresidential 1919—60.

26 Essays on interest Ratesaddition, to examine many other series covering a variety of capital-goods industries, and different interest rates. The chart neverthelessprovides one sample of the timing relationship between interest ratesand investment.
For the cyclical phases covered, the scatter diagrams reveal a posi-tive association between the lead or lag in interest rates and the dura-tion of the phases in contracts similar to the previous findings forreference phases. There are a few extreme observations dated on thechart. Most of these pertain to the 1930's as before, but one is for the1950's: Residential and total construction contracts skipped the1953—54 recession (except for a mild decline in 1951, not matched inbond yields), which produces an unusually long expansion from 1951to 1956 or 1957. These dated observations would strongly influenceregression estimates and have been excluded from the correlationspresented in Table 1-7.
TABLE 1-7. Relation Between Interest Rates and Duration of CyclicalPhases in Value of Construction Contracts: Regression of Duration on Leador Lag in Rates, and Stability of Timing
Regression Correla-
Standard Error of Lead or Lag
Positive Inverted No. ofCoefficient tion Basis Basis Ratio Obser-
(and r value) Coefficient 0D-L crjon..y vations(1) (2) (3) (4) (5) (6)
Total, 1912—60 .84(5.3) .83 8.7 5.2 1.7 15Nonresidential, 19 19—60 .49(2.5) .64 8.4 6.5 1.3 11
Residential, 1916—60 .55(3.5) .73 10.7 8.6 1.3 13
SOURCE: Same as Chart 1-3 excluding dated points.
The table gives results broadly similar to those of Tables 1-4 and1-6 for reference phases. There are some differences: The regressioncoefficients are smaller and the correlation coefficients higher herethan in Table 1-4 for the later period.
One indication that bond yields are related more closely to invest-ment than to general business activity is the smaller variation in timingon an inverted basis (Table 1-7, Col. 4). Troughs in interest rates leadcorresponding peaks in construction contracts, and peaks in rateslead troughs in contracts, with less variation in the length of leads(D — L) than is true for reference phases (Table 1-6). As was shown byidentity (2) on page 23, however, these statistical measures are notindependent of each other. When the ratio of timing variances (Table

interest Rates and Business Cycles 27
1-7, Col. 5) favors the positive basis, the correlation coefficient tendsto be higher, while it tends to be lower for a smaller slope of theregression. Because of the limited coverage, these differences may bein the nature of random variations. The over-all results here for con-struction activity nevertheless support implications of the previoustables and suggest, if tentatively, an interest-rate effect on investmentundertakings.
Summary
Business commentators have long pointed to the importance of finan-cial effects in business cycles. Yet it has proved difficult to measurethese effects statistically because of their complex interaction withother cyclical developments. This paper examines one aspect of thefinancial role, and partly avoids some of the difficulties, by comparingturning points in interest rates with the duration of cyclical phases inbusiness activity. Most interest rates have, as a rule, lagged business-cycle turns. On the assumption that shifts in the demand for loanablefunds conform closely to movements in business activity, the laggedturns reflect nonconforming movements in the supply function forfunds. If autonomous shifts in supply play an important role in cycles,they will affect the timing of interest-rate cycles and contribute with alag to the turning points in business activity. The test of such effectspresented here is whether delayed upturns in rates prolong businessexpansions and delayed downturns prolong contractions, and whetherthe converse is true for early turns in rates. To be sure, the test ignoresmuch relevant information about business cycles, but it has the impor-tant advantage of not requiring a large variety or high quality of dataand therefore allows the coverage of a long period. The analysis relatesbond yields and commercial paper rates to business cycles for theperiod 1857 to 1960, and to cycles in construction contracts for theperiod since World War I.
The statistical results point to a weak but significant associationbetween the duration of business cycle expansions and contractionsand the corresponding lag in rates at the initial turn of the phase. Theassociation appears to reflect a financial influence on business activityrather than some mechanical characteristic of cyclical movements.The finding that turns in bond yields account for variations in the dura-tion of cyclical phases in the value of construction contracts supportsthe results for business cycle phases.

28 Essays on interest RatesThe expansion of business activity since 1961 (not included in the
analysis) dramatically illustrates the relationship, though of courseno single instance is conclusive by itself. The cyclical upturn in bondyields came in early 1963 (Chart 1-1), two years after the businesscycle trough and uncommonly late, while by the end of 1968 the busi-ness expansion had lasted nearly six years, the longest on record. Onthe previous interpretation, the supply of loanable funds in the early1960's kept pace with the demand for funds and prevented financialrestraint from impeding investment undertakings until 1963, and eventhen the restraint did not become strong, judging by the rate of rise ininterest rates, until the second half of 1965.
The results suggest that interest-rate effects on business are notsimply added to other factors but interact with them. If the upturn ininterest rates is delayed so many months, the business expansion is notprolonged, on the average, by an equal number of months, but only by afraction of the time. This makes interest-rate turns a less than idealpredictor of cycle duration; indeed, the predictive power of the rela-tionship was found to be very small, except that business phases areunlikely to end while interest rates continue a cyclical movement inthe opposite direction. Turning points in interest rates contain only aminimal amount of information about financial developments, and areoften difficult to pinpoint even well after they have occurred. Con-sequently, interest rates cannot be seriously proposed as more than ofmarginal value for short-term forecasting.
The findings also require qualification for other reasons. Turningpoints in interest rates are sometimes ambiguous even by hindsightand may involve considerable error. Attempts to extend the analysisto the amplitude of movements in interest rates were not entirelysuccessful, though in theory the amplitude as well as the direction ofmovements should be important. Finally, the regression for bond yieldsshifted after 1914, the explanation and relevance of which is not en-tirely clear. Despite these qualifications, the findings have value inlending concrete statistical support to other studies which point tofinancial influences in the business cycle. A similar relationship be-tween turning points and the duration of reference phases also holdstrue for the monetary growth rate (inverted), which represents anautonomous source of fluctuations in the supply of loanable funds.Although indirect, the evidence suggests that monetary and otherfinancial factors produce cyclical variations in bond yields which haveimportant effects on business activity.