the influence of iso 9001 quality management · pdf filethe influence of iso 9001 quality...
TRANSCRIPT
THE INFLUENCE OF ISO 9001 QUALITY MANAGEMENT SYSTEMS
CERTIFICATION ON THE COMPETITIVE ADVANTAGE OF KENYA’S
UNIVERSITIES. A SURVEY OF SELECTED ISO 9001 QMS CERTIFIED UNIVERSITIES
IN NAIROBI, KENYA
KHALONYERE, DAVID BARAZA
REG. NO: D53/CTY/PT/20818/2010
A RESEARCH PROJECT REPORT SUBMITTED TO THE SCHOOL OF BUSINESS IN
PARTIAL FULFILLMENT OF THE REQUIREMENT FOR THE AWARD OF THE
DEGREE OF MASTER OF BUSINESS ADMINISTRATION IN STRATEGIC
MANAGEMENT OPTION OF KENYATTA UNIVERSITY
MAY, 2013
ii
DECLARATION
I declare that this research project report is my original work and has not been submitted
in this or other form for the award of a degree in this or any other university.
_________________________ _____________________________
Signature Date
KHALONYERE, DAVID BARAZA
Reg. No. D53/CTY/PT/20818/2010
This research project report has been submitted for examination with our approval as University
Supervisors:
Dr. OFAFA, GORRETTY A.
Lecturer, School of Business
Department of Business Administration,
Kenyatta University
_________________________ __________________________
Signature Date
Ms. ANNE MUCHEMI
Lecturer, School of Business
Department of Business Administration
Kenyatta University
________________________________ ____________________________
Signature Date
This Research Project Report has been submitted for examination with my approval
Dr. S.M. Muathe
Chairman,
Department of Business Administration
School of Business
______________________________ _____________________________
Signature Date

iii
DEDICATION
I dedicate this research project report to my beloved Wife Dorice and my children Alex, Samantha
and Nixon.
iv
ACKNOWLEDGEMENT
The time, support and opportunity to study are always precious when granted. I thank all
those who stood by me during this time. My family especially my wife Dorice who helped me in
typing this work, Dr. Bob and Dr. Tongoi, your prayers and support are invaluable. I thank God
on how He is using you.
To my supervisors Dr. Ofafa Gorretty A. and Ms. Anne Muchemi who were so patient with me
through this research, and added a critical mass to the body of this study, you are indeed a
treasure to learners.
The Kenyatta University, The University of Nairobi, The Strathmore University, and the Catholic
University of East Africa who offered me a chance to carry out this research embedded in their
busy schedule and accepted this research to be carried out in their institutions; all able scholars at
the universities who offered both material and wisdom to help me get through with this research
report; THANK YOU.
v
TABLE OF CONTENTS
Declaration..................................................................................................................................... ii
Dedication ..................................................................................................................................... iii
Acknowledgement ........................................................................................................................ iv
Operational Defination Of Terms .............................................................................................. ix
Abstract ......................................................................................................................................... xi
Abbreviations and Acronyms .................................................................................................... xii
List Of Tables and Figures ........................................................................................................ xiii
CHAPTER ONE ............................................................................................................................1
INTRODUCTION..........................................................................................................................1
1.1. Background of the Study ..........................................................................................................1
1.1.1. Understanding Competitive Advantage ............................................................................2
1.1.2. History of Quality Management Systems (QMS) .............................................................3
1.1.3. The Concept of Quality .....................................................................................................6
1.2. Statement of the Problem ..........................................................................................................7
1.3. General Objective .....................................................................................................................8
1.4. Specific Objectives ...................................................................................................................8
1.5. Research Questions ...................................................................................................................9
1.6. Significance of the Study ..........................................................................................................9
1.7. Limitations of the Study..........................................................................................................11
1.8. Scope of the Study ..................................................................................................................12
CHAPTER TWO .........................................................................................................................13
LITERATURE REVIEW ...........................................................................................................13
2.1. Introduction .............................................................................................................................13
2.2. The Theoretical framework.....................................................................................................13
2.2.1. Models of Quality Management Systems .........................................................................14
2.2.2. The Background of ISO 9001 QMS Model ......................................................................16
2.3. Quality Management Principles ..............................................................................................19
vi
2.4. Requirements of ISO 9001......................................................................................................21
2.5. The ISO 9001 QMS certification in Higher Educational Institutions.....................................24
2.6. Quality in the Education Sector ..............................................................................................27
2.7. Challenges associated with the implementation of ISO 9001 QMS .......................................31
2.8. The Benefit of the ISO 9001 Certification ..............................................................................32
2.9. Conceptual Framework ...........................................................................................................33
CHAPTER THREE .....................................................................................................................35
RESEARCH METHODOLOGY ...............................................................................................35
3.1. Introduction .............................................................................................................................35
3.2. Research Design......................................................................................................................35
3.3. The Target Population.............................................................................................................35
3.4. Sampling Procedure and Sampling Technique. ......................................................................36
3.5. Data Collection and Collection Instrument.............................................................................40
3.6. Operationalization of Variables ..............................................................................................40
3.7. Validity and Reliability ...........................................................................................................44
3.8. Data Analysis ..........................................................................................................................44
3.9. Data Presentation ....................................................................................................................45
CHAPTER FOUR ........................................................................................................................46
DATA ANALYSIS AND INTERPRETATION ........................................................................46
4.1. Introduction .............................................................................................................................46
4.2. Response rate ..........................................................................................................................46
4.2.1. Gender ...............................................................................................................................46
4.2.2. Job Category .....................................................................................................................47
4.2.3. Length of service...............................................................................................................47
4.2.4. Understanding of ISO 9001 Quality Management Systems certification standard ..........48
4.3. Students Enrolment .................................................................................................................48
4.3.1. Changes in student enrollment ..........................................................................................49
4.3.2. How ISO 9001 QMS certification has affected the student’s enrolment ..........................49

vii
4.3.3. ISO 9001 QMS certification contribution to the students’ enrolment ..............................50
4.4. Perception and Image ..............................................................................................................50
4.4.1. Attendance to any ISO 9001 QMS training ......................................................................50
4.4.2. Effects of training .............................................................................................................51
4.4.3. Image and perception of your university before and after being ISO 9001 certified .......52
4.4.4. Review of the ISO 9001 QMS ..........................................................................................52
4.5. Research and Development.....................................................................................................53
4.5.1. Effects of research and development ................................................................................53
4.5.2. Competitive edge over other universities .........................................................................53
4.5.3. Competiveness of the university’s growth in Research and development .......................54
4.5.4. ISO 9001 QMS certification as a strategy for Universities’ competitiveness in R & D ..55
4.5.5. Research and development at Universities as affected by ISO 9001 quality issues .........55
4.6. University Ranking .................................................................................................................56
4.6.1. Awareness of the of the university’s position ...................................................................56
4.6.2. ISO 9001 certification has contributed to the position .....................................................57
4.6.3. University ranking extent ..................................................................................................57
4.6.4. Factors that motivated changes at the Universities ...........................................................59
4.7. Summary of statistics ..............................................................................................................60
4.7.1. Reliability Test ..................................................................................................................60
4.7.2. Correlation analysis ..........................................................................................................61
4.7.3. Regression Analysis ..........................................................................................................61
CHAPTER FIVE .........................................................................................................................66
SUMMARY, CONCLUSIONS AND RECOMMENDATIONS .............................................66
5.1. Introduction .............................................................................................................................66
5.2. Summary of findings...............................................................................................................66
5.3. Conclusion…….. ....................................................................................................................69
5.4. Recommendation ....................................................................................................................70
5.5. Suggestion for Further Studies................................................................................................71
viii
REFERENCES .............................................................................................................................72
APPENDICES………………………………………………………………………………… ..81
APPENDIX I: LETTER OF INTRODUCTION……………………………………………… 81
APENDIX II: AUTHORIZATION LETTER ………………………………………………... 82
APPENDIX III: QUESTIONNAIRE…………………………………………………………. 83
APPENDIX IV: TIME LINE…………………………………………………………………..92
APPENDIX V: LIST OF UNIVERSITIES IN KENYA AND INSTITUTES, & NAIROBI: ...93
APPENDIX VI: LIST OF ISO 9001 QMS CERTIFIED UNIVERSITIES IN NAIROBI,
DEMING'S AND JURANS’S QUALITY POINTS ..................................................................96
ix
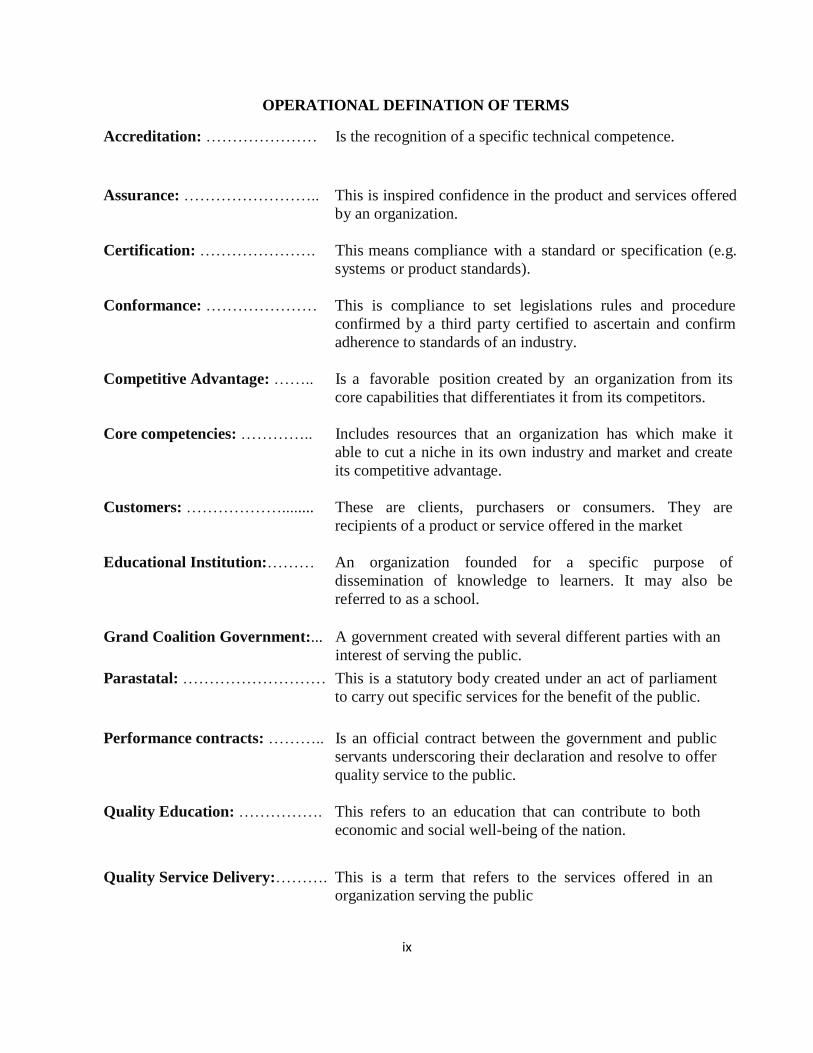
OPERATIONAL DEFINATION OF TERMS
Accreditation: ………………… Is the recognition of a specific technical competence.
Assurance: …………………….. This is inspired confidence in the product and services offered
by an organization.
Certification: …………………. This means compliance with a standard or specification (e.g.
systems or product standards).
Conformance: ………………… This is compliance to set legislations rules and procedure
confirmed by a third party certified to ascertain and confirm
adherence to standards of an industry.
Competitive Advantage: …….. Is a favorable position created by an organization from its
core capabilities that differentiates it from its competitors.
Core competencies: ………….. Includes resources that an organization has which make it
able to cut a niche in its own industry and market and create
its competitive advantage.
Customers: ………………........ These are clients, purchasers or consumers. They are
recipients of a product or service offered in the market
Educational Institution:……… An organization founded for a specific purpose of
dissemination of knowledge to learners. It may also be
referred to as a school.
Grand Coalition Government:... A government created with several different parties with an
interest of serving the public.
Parastatal: ……………………… This is a statutory body created under an act of parliament
to carry out specific services for the benefit of the public.
Performance contracts: ……….. Is an official contract between the government and public
servants underscoring their declaration and resolve to offer
quality service to the public.
Quality Education: ……………. This refers to an education that can contribute to both
economic and social well-being of the nation.
Quality Service Delivery:………. This is a term that refers to the services offered in an
organization serving the public
x
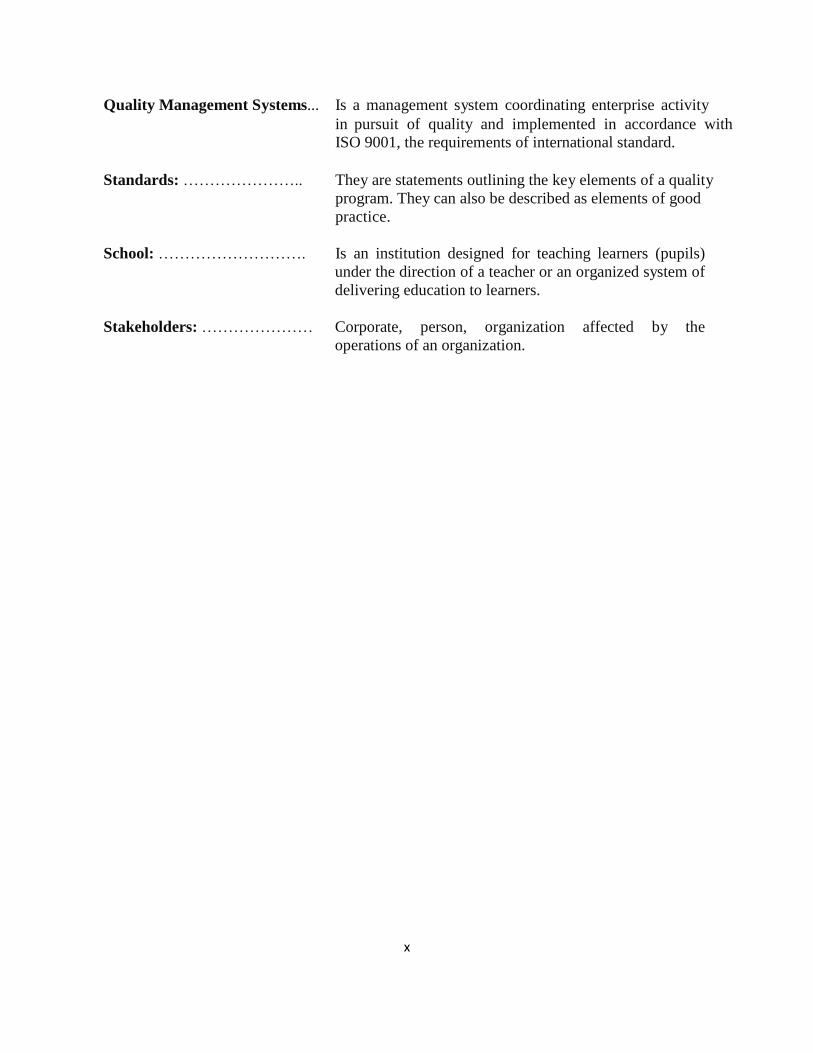
Quality Management Systems... Is a management system coordinating enterprise activity
in pursuit of quality and implemented in accordance with
ISO 9001, the requirements of international standard.
Standards: ………………….. They are statements outlining the key elements of a quality
program. They can also be described as elements of good
practice.
School: ………………………. Is an institution designed for teaching learners (pupils)
under the direction of a teacher or an organized system of
delivering education to learners.
Stakeholders: ………………… Corporate, person, organization affected by the
operations of an organization.
xi
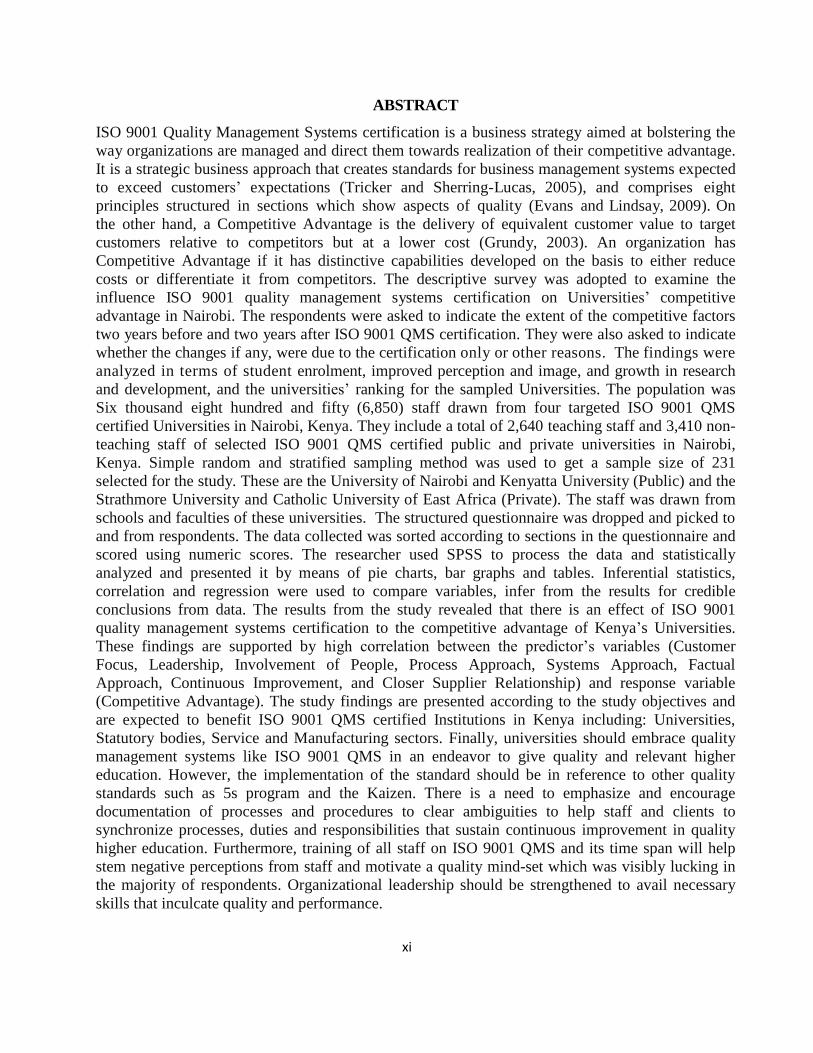
ABSTRACT
ISO 9001 Quality Management Systems certification is a business strategy aimed at bolstering the
way organizations are managed and direct them towards realization of their competitive advantage.
It is a strategic business approach that creates standards for business management systems expected
to exceed customers’ expectations (Tricker and Sherring-Lucas, 2005), and comprises eight
principles structured in sections which show aspects of quality (Evans and Lindsay, 2009). On
the other hand, a Competitive Advantage is the delivery of equivalent customer value to target
customers relative to competitors but at a lower cost (Grundy, 2003). An organization has
Competitive Advantage if it has distinctive capabilities developed on the basis to either reduce
costs or differentiate it from competitors. The descriptive survey was adopted to examine the
influence ISO 9001 quality management systems certification on Universities’ competitive
advantage in Nairobi. The respondents were asked to indicate the extent of the competitive factors
two years before and two years after ISO 9001 QMS certification. They were also asked to indicate
whether the changes if any, were due to the certification only or other reasons. The findings were
analyzed in terms of student enrolment, improved perception and image, and growth in research
and development, and the universities’ ranking for the sampled Universities. The population was
Six thousand eight hundred and fifty (6,850) staff drawn from four targeted ISO 9001 QMS
certified Universities in Nairobi, Kenya. They include a total of 2,640 teaching staff and 3,410 non-
teaching staff of selected ISO 9001 QMS certified public and private universities in Nairobi,
Kenya. Simple random and stratified sampling method was used to get a sample size of 231
selected for the study. These are the University of Nairobi and Kenyatta University (Public) and the
Strathmore University and Catholic University of East Africa (Private). The staff was drawn from
schools and faculties of these universities. The structured questionnaire was dropped and picked to
and from respondents. The data collected was sorted according to sections in the questionnaire and
scored using numeric scores. The researcher used SPSS to process the data and statistically
analyzed and presented it by means of pie charts, bar graphs and tables. Inferential statistics,
correlation and regression were used to compare variables, infer from the results for credible
conclusions from data. The results from the study revealed that there is an effect of ISO 9001
quality management systems certification to the competitive advantage of Kenya’s Universities.
These findings are supported by high correlation between the predictor’s variables (Customer
Focus, Leadership, Involvement of People, Process Approach, Systems Approach, Factual
Approach, Continuous Improvement, and Closer Supplier Relationship) and response variable
(Competitive Advantage). The study findings are presented according to the study objectives and
are expected to benefit ISO 9001 QMS certified Institutions in Kenya including: Universities,
Statutory bodies, Service and Manufacturing sectors. Finally, universities should embrace quality
management systems like ISO 9001 QMS in an endeavor to give quality and relevant higher
education. However, the implementation of the standard should be in reference to other quality
standards such as 5s program and the Kaizen. There is a need to emphasize and encourage
documentation of processes and procedures to clear ambiguities to help staff and clients to
synchronize processes, duties and responsibilities that sustain continuous improvement in quality
higher education. Furthermore, training of all staff on ISO 9001 QMS and its time span will help
stem negative perceptions from staff and motivate a quality mind-set which was visibly lucking in
the majority of respondents. Organizational leadership should be strengthened to avail necessary
skills that inculcate quality and performance.
xii
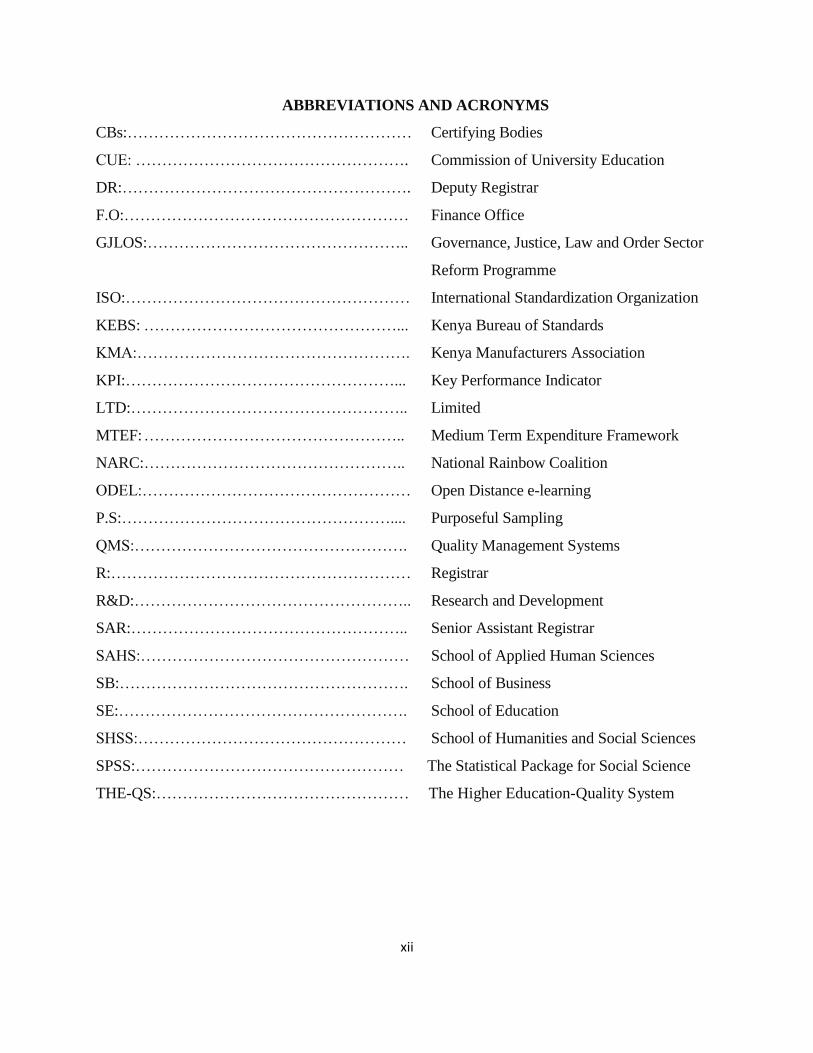
ABBREVIATIONS AND ACRONYMS
CBs:……………………………………………… Certifying Bodies
CUE: ……………………………………………. Commission of University Education
DR:………………………………………………. Deputy Registrar
F.O:……………………………………………… Finance Office
GJLOS:………………………………………….. Governance, Justice, Law and Order Sector
Reform Programme
ISO:……………………………………………… International Standardization Organization
KEBS: …………………………………………... Kenya Bureau of Standards
KMA:……………………………………………. Kenya Manufacturers Association
KPI:……………………………………………... Key Performance Indicator
LTD:…………………………………………….. Limited
MTEF: ………………………………………….. Medium Term Expenditure Framework
NARC:………………………………………….. National Rainbow Coalition
ODEL:…………………………………………… Open Distance e-learning
P.S:…………………………………………….... Purposeful Sampling
QMS:……………………………………………. Quality Management Systems
R:………………………………………………… Registrar
R&D:…………………………………………….. Research and Development
SAR:…………………………………………….. Senior Assistant Registrar
SAHS:…………………………………………… School of Applied Human Sciences
SB:………………………………………………. School of Business
SE:………………………………………………. School of Education
SHSS:…………………………………………… School of Humanities and Social Sciences
SPSS:…………………………………………… The Statistical Package for Social Science
THE-QS:………………………………………… The Higher Education-Quality System
xiii
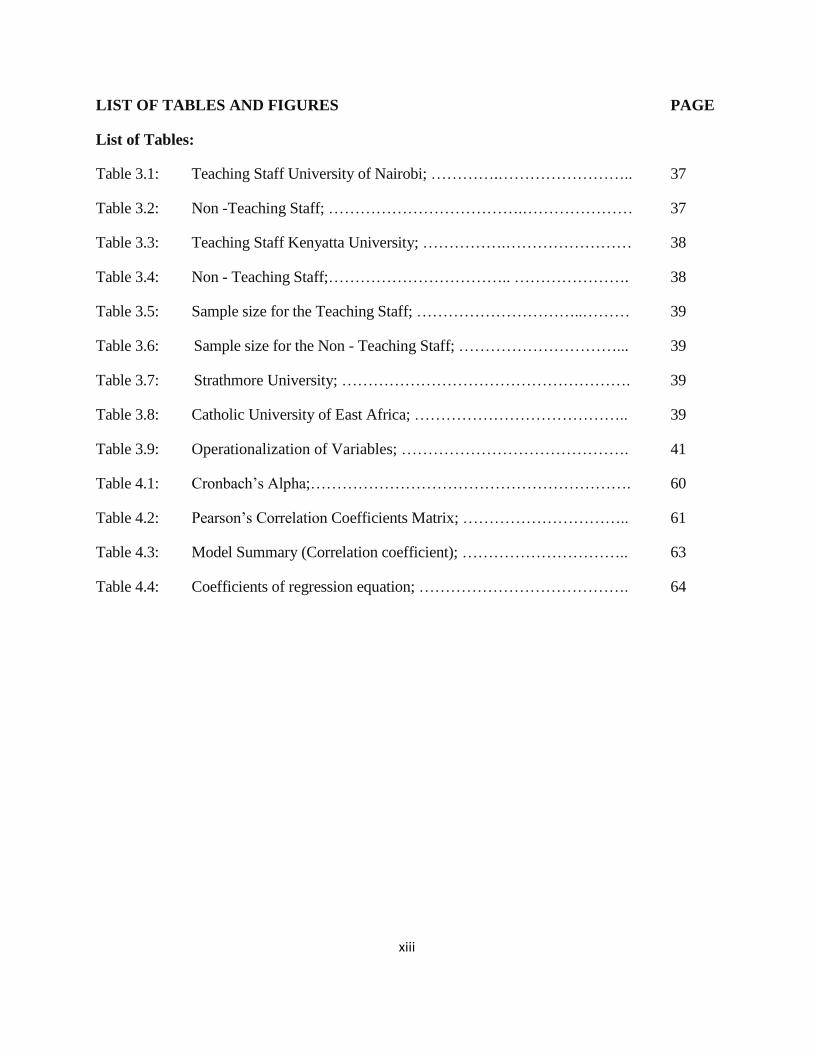
LIST OF TABLES AND FIGURES PAGE
List of Tables:
Table 3.1: Teaching Staff University of Nairobi; ………….…………………….. 37
Table 3.2: Non -Teaching Staff; ……………………………….………………… 37
Table 3.3: Teaching Staff Kenyatta University; …………….…………………… 38
Table 3.4: Non - Teaching Staff;…………………………….. …………………. 38
Table 3.5: Sample size for the Teaching Staff; …………………………..……… 39
Table 3.6: Sample size for the Non - Teaching Staff; …………………………... 39
Table 3.7: Strathmore University; ………………………………………………. 39
Table 3.8: Catholic University of East Africa; ………………………………….. 39
Table 3.9: Operationalization of Variables; ……………………………………. 41
Table 4.1: Cronbach’s Alpha;……………………………………………………. 60
Table 4.2: Pearson’s Correlation Coefficients Matrix; ………………………….. 61
Table 4.3: Model Summary (Correlation coefficient); ………………………….. 63
Table 4.4: Coefficients of regression equation; …………………………………. 64

xiv
List of Figures:
Figure 2.1: Conceptual Framework; ……………………………………………… 34
Figure 4.1: Gender ; ……………………………………………………………… 46
Figure 4.2: Training Attendance; ………………………………………………... 51
Figure 4.3: Awareness of the University Ranking; ……………………………… 56
1
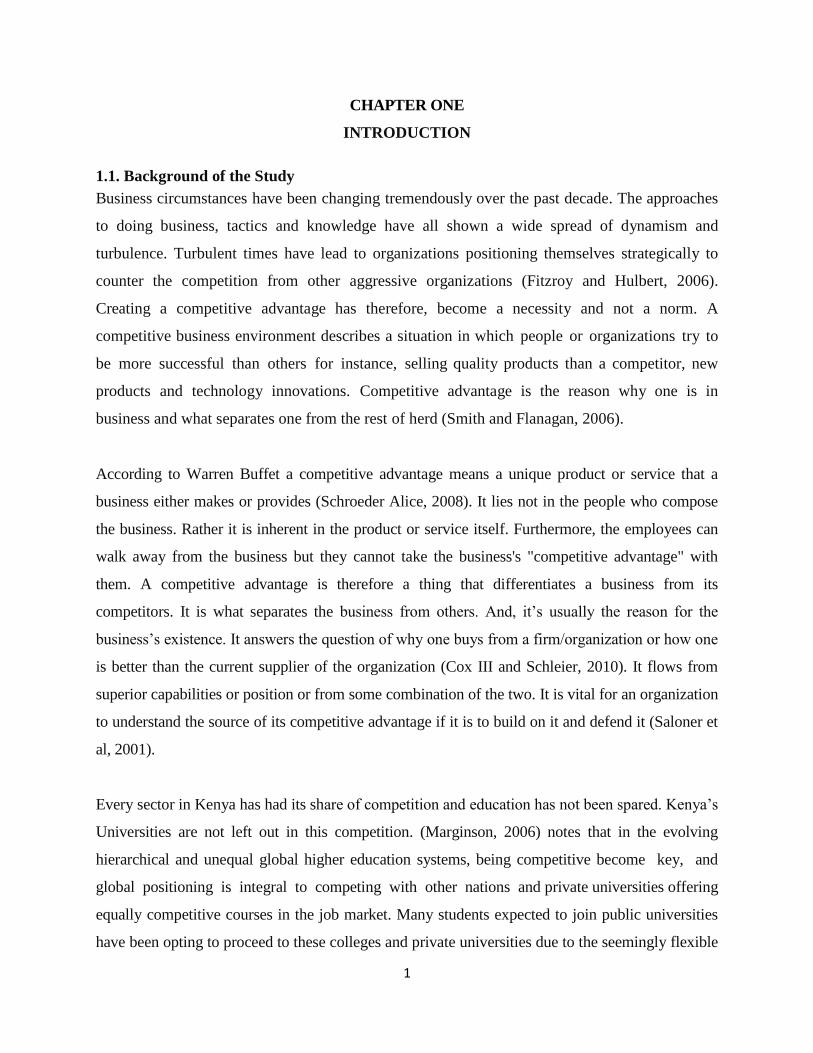
CHAPTER ONE
INTRODUCTION
1.1. Background of the Study
Business circumstances have been changing tremendously over the past decade. The approaches
to doing business, tactics and knowledge have all shown a wide spread of dynamism and
turbulence. Turbulent times have lead to organizations positioning themselves strategically to
counter the competition from other aggressive organizations (Fitzroy and Hulbert, 2006).
Creating a competitive advantage has therefore, become a necessity and not a norm. A
competitive business environment describes a situation in which people or organizations try to
be more successful than others for instance, selling quality products than a competitor, new
products and technology innovations. Competitive advantage is the reason why one is in
business and what separates one from the rest of herd (Smith and Flanagan, 2006).
According to Warren Buffet a competitive advantage means a unique product or service that a
business either makes or provides (Schroeder Alice, 2008). It lies not in the people who compose
the business. Rather it is inherent in the product or service itself. Furthermore, the employees can
walk away from the business but they cannot take the business's "competitive advantage" with
them. A competitive advantage is therefore a thing that differentiates a business from its
competitors. It is what separates the business from others. And, it’s usually the reason for the
business’s existence. It answers the question of why one buys from a firm/organization or how one
is better than the current supplier of the organization (Cox III and Schleier, 2010). It flows from
superior capabilities or position or from some combination of the two. It is vital for an organization
to understand the source of its competitive advantage if it is to build on it and defend it (Saloner et
al, 2001).
Every sector in Kenya has had its share of competition and education has not been spared. Kenya’s
Universities are not left out in this competition. (Marginson, 2006) notes that in the evolving
hierarchical and unequal global higher education systems, being competitive become key, and
global positioning is integral to competing with other nations and private universities offering
equally competitive courses in the job market. Many students expected to join public universities
have been opting to proceed to these colleges and private universities due to the seemingly flexible

2
study schedule among other merits. This has resulted into large volumes of enrollment at the
expense of the public universities. The universities are currently said to be in the ‘’ reputation
race’’, in which they compete for reputation and academic prestige (Frans Van Vught, 2008). As a
wakeup call, public universities have changed largely the approach on both the study schedules,
pricing, and marketing in the industry. Ultimately, selected universities in this study have to adopt
a competitive model aligned to the education sector with a focus on quality and quality
management systems that effectively meet and exceed the ever changing students and stakeholders
expectations.
Schiefer (2002) says that quality has become of outmost importance to society. Consumers have
become more conscious of quality, and organizations are now judged more on their overall quality
performance instead of their financial performance alone. The most drastic change in quality
thinking is probably the change from production-oriented to consumer- oriented concepts.
Moreover, integrative approaches, system thinking, the focus on advanced technologies and belief
in human capacities have had a considerable impact on current quality management systems. Since
creating value is about generating a gap between customer valuation and cost of providing the
product or service, quality and cost are often useful ways to describe competitive Advantage. An
organization creates value only when there is a difference (preferably large) between what
customers are willing to pay for its products or services and what an organization must pay to
produce (Saloner et al, 2001). So far, establishing competitive advantage within the higher
education sector in Kenya is a continuous effort for universities. However, the question is how the
ISO 9001 Quality Management Systems certification influences the universities’ competitive
advantage.
1.1.1 Understanding Competitive Advantage
Kenichi Ohmae (1982) is probably one of the first persons to give a relevant account of the basis
of competitive advantage in strategy while working as head of strategy at the McKinsay
Co, Tokyo. He defined competitive advantage in one of his book ‘The Mind of the
Strategist’(1982) as either delivering superior value advantage to target customers relative to
competitors or delivering equivalent customer value to target customers relative to competitors
but at a lower cost. Prior to this ‘competitive advantage’ had remained implicitly in economics.
3
(Kay John, 1993) says competitive advantage is sourced from the organization’s distinctive
capabilities. Distinctive capabilities are derived from characteristics that others lack and which
are also sustainable and appropriable. “A distinctive capability becomes a competitive advantage
when it is applied in an industry or brought to a market.” It measures the value of competitive
advantage as value added, with the costs of physical assets measured as the cost of capital
applied to replacement costs.
Michael Porter (1985) developed more on Ohmae’s work and is perhaps the most revolutionary
thought about Competitive Advantage (Grundy, 2003). Porter says “competitive advantage is at
the heart of a firm’s performance in competitive markets” and adds that the purpose of his work
on the subject is to show “how a firm can actually create and sustain a competitive advantage in
an industry—how it can implement the broad generic strategies.” Thus, competitive advantage
means having low costs, differentiation advantage, or a successful focus strategy. In addition,
Porter argues that “competitive advantage grows fundamentally out of value a firm is able to
create for its buyers that exceeds the firm’s cost of creating it” (Harry and Kunin, 2003). Porters’
competitive five forces model is a prominent technique used in creating competitive advantage.
The five forces are: threat of substitute products and services, the bargaining power of suppliers,
the bargaining power of buyers, threat of new entrants and rivalry among existing
organizations (Grundy, 2003). Interestingly, not so many scholars have worked to build from it.
Businesses have had to adopt this model more by default than by design due to the speed for the
need to reposition to remain relevant and competitive. Therefore, an organization has to have
distinctive capabilities on which it develops a basis to either reduce costs or differentiate itself
from other competitors.
1.1.2. History of Quality Management Systems (QMS)
Quality Management Systems and practices have been investigated extensively (Kaynak, 2003)
from both the philosophical point of view to the very specific practical methods. QMS can be
observed from different models presented by the authorities of quality from the early 1950’s
through 1980’s namely: Edward Deming, (1950’s), Joseph Juran (1950’s), and Philip Crosby
(1980’s) among others who prescribed several models and approaches to the concept of quality
and its relationship to improving organization’s competitive advantage.
4
First, Deming (1950’s) an American statistician believed that the management at all levels was
responsible for over 94% of quality problems and formulated 14 points (appendix vi) plan which
any serious business that adopts and acts on the points could stay in business (Deming, 1982). He
advocated for a systematic a systematic approach to problem solving and promoted the widely
known Plan, Do, Check, Act (PDCA) cycle. The PDCA cycle is also known as the Deming
cycle. The cycle is about learning and ongoing improvement. It is meant to reduce the difference
between the requirements of the customers and the performance of the process. Second, Juran
(1950’s) developed the quality trilogy-quality control, quality planning, and quality
improvement. He believed quality was related with the satisfaction of customers and
dissatisfaction with products. He therefore, emphasized the ongoing quality improvement
through a succession of small projects carried out in the organization (Juran, 1995). Juran also
came up with his 10 steps of quality improvement (appendix vi). His attention was not just on the
end customer but on other external and internal customers. Third, in the 1980’s Armand V
Feigenbaum developed ‘’ total quality control’’ and defined it as an effective system for
integrating quality development, quality maintenance and quality improvement efforts of the
various groups within an organization, so as to enable production and service at the most
economical levels that allow full customer satisfaction (Feigenbaum, 2004). He viewed this as
a business method and proposed three steps to quality: quality leadership, modern quality
technology and organizational commitment.
Thereafter, the Japanese and the Western theorists also made immense contributions to the field
of quality. Dr. Kaoru Ishikawa’s viewed total quality as companywide control and he gave the
human side of quality with his Ishikawa diagram and assembly and the use of the ‘Seven basic
tools of quality’ (Ishikawa, 1990). Shigeo Shingo (1986) created the single minute exchange of
die (SMED) system where set up times are reduced from hours to minutes, and Poka-Yoke
(mistake proofing system. The Poka-Yoke examines defects, the production system and
immediate feedback given (Shingeo, 1987). This helps rooting out of problems, identification
and prevention. He noted that humans can forget mistakes and so need to be reminded. Dr.
Genichi Taguchi’s (2004), focused on the manufacturing process and the aspects of quality. He
believed that it is preferable to design a product that is robust or insensitive to variation in the
manufacturing process, rather than attempt to control all the many variations during actual
5
manufacture (Taguchi et al., 2004). He was concerned with routine optimization of product and
process to manufacture rather than quality through inspection. He noted that Quality and
reliability are pushed back to the design stage where they really belong, and he broke down off-
line quality into three stages: system design, parameter design, and tolerance design.
Philip B Crosby (1980’s) developed the concepts of ‘’ quality is free’’ and ‘’ zero
defects’’, based on four absolutes of quality: quality is conformance to requirements, the system
of quality is prevention, the performance standard is zero defects, and the measurement of
quality is the price of non-conformance (Crosby, 1979). Tom Peters (2005) in his work
discarded management for leadership and noted that leadership was central for quality
improvement process and the new role was managing by walking about (MBWA). He thought
that this helped the leader to keep in touch with customers, innovation and people. The main
areas to pursuit of excellence happened when a leader walks around: listening, teaching, and
facilitating knowledge.
Total Quality Management (TQM) embodied the basis of interest for the authorities in the early
1950’s. Deming, Juran and Ishikawa are considered to be the founders of TQM philosophy
(Hackman and Wageman, 1995). It is a model of organizational change, and has been used in
various forms for decades (Yong & Wilkinson, 2002). TQM has also faced criticized that it
provides a rhetoric that is individually interpreted by different individuals and organizations as
noted by Lemak & Mero (2002). However, it’s flattering success has led to researchers to
establish its relationship with certain contextual factors such as leadership (Zairi, 2002),
teamwork (Hong & Meng, 2002), training (Palo & Padhi 2003) and culture (Pun, 2001). On this
account Magutu et al (2010) in their study at the university of Nairobi on quality management
practices noted that different approaches have been adopted for the introduction of quality
management systems and practices to universities such as self assessment, and external
assessment, accreditation and certification systems, and different models of TQM. It is a credible
strategic option that efficiently and effectively put an organization to sustainable competitive
advantage (Goldberg and Cole, 2002).

6
1.1.3. The Concept of Quality
The concept of quality has taken up a more strategic dimension rather than a functional or
tactical one. Its extent keeps challenging managers and professionals (Evans and Lindsay, 2010).
Quality can be confusing due to the varied subjectivity based perspectives. These include:
transcendent quality, product-based quality, user-based quality, value-based quality,
manufacturing-based quality and customer-driven quality. Quality has been defined as ‘’ a
predictable degree of uniformity and dependability at low cost and suited to market’’ (Gitlow,
2000). It is that which adds value, that which makes our lives better (Kemp, 2005).
It is important that quality is approached in all sectors from the systems, rather than a process
perspective. Management systems are becoming more and more integrated for instance, quality
education, environment, safety and health must be viewed together since quality has
transitioned from control, to assurance, to management; the next era is expected to focus
heavily on the quality of design (Evans and Lindsay, 2010). The leadership of any organization
is tasked to direct the purpose of quality to be achieved by the employees as part of a strategic
objective of the organization (Cianfrani et al. 2009). Quality is an act of excellence and
performing quality is a function of competitive advantage achieved by turning a source
advantage resulting from superior skills and resources into a competitive advantage (Day and
Wensley, 1988). Key elements reviewed and are crucial in ascertaining quality in organizations
include; quality control, assurance, and conformance.
The ISO 9001 QMS establish standards that require credible quality control mechanisms and
conditions. It involves control of processes and systems to realize quality and results. Control of
process as part of quality control implies low variability, consistency of process,
performance, and conformity of products and services to the customer and internal
requirements (Cianfrani and West, 2009). Poorly done controls can stifle positive changes and
continuous improvement while properly done controls well integrated in the organizations’ QMS
facilitate learning, innovation, and improvement. These are key component in any institute of
higher learning.
7
Tricker (2010) affirms that quality control is exercised at all levels of the organization and
all personnel are responsible for the particular activities they are doing and they are all quality
controllers. This is an aspect of people involvement which is a key principle in any QMS. The
customers need an assurance that the product or service they intend to derive utility has attained
the highest quality standards. Quality assurance is therefore, an integral part in ensuring that the
customer is sustainably retained through inspired confidence in the products and services offered
by a particular organization. It is part of the QMS focused on providing confidence that quality
requirements are fulfilled. They are planned and systematic actions necessary to provide
adequate confidence that a service or product will satisfy given requirements for quality (Tricker,
2010). The two focal points for quality assurance in business are: the design of the products and
services and the control of quality as earlier mentioned. They are both aided by some form of
measurement and inspection activities which should be structured consistent to the requirements
of the QMS (Evans and Lindsay, 2010).
Products and service offered to customers need to have some degree of predictability in terms of
uniformity and dependability. Not so many institutions of higher learning like can ascertain the
degree to which their ‘products’ and services are predictable to consumers. Quality conformance
is therefore important in retention and extension of competitive edge. Gitlow (2000) says it is the
extent to which an organization and suppliers can produce products and services with predictable
degree of conformity and dependability at a cost that is in-keeping with quality characteristics
determined in quality design. The organization should continuously strive to make sure that
the specification of the quality design is eventually surpassed. This is what ensures that there is a
sustained competitive advantage over the rest of the industry players.
1.2. Statement of the Problem
Núria Balagué Mola (2007) in her study on the use of ISO 9001 quality standard in higher
education institution libraries; noted that management’s desire to lead libraries to be certified
was key to better implementation of quality systems in the libraries and that ISO 9001 QMS
allows adequate adaptation to the structure, size and complexity of each library system size
notwithstanding. She also found out that the prestige of acquiring the standard, although highly
valued, is not a determinant and is secondary when it comes to deciding on certification. The
Journal of Achievement in Materials and Manufacturing Engineering (2007) studied problems of

8
quality management in university education and found out that the introduction of quality
management system based on ISO 9001:2000 standards is viewed valid with reference to the
other means of assurance of quality in education.
They also noted that the standard had various advantages compared to other standards among
them quality improvement, organization of work, increased awareness of quality by employees,
customer satisfaction, and improved reputation.
Aluvi A. Patrick and G. Kimutai (2011) presented on the role of ISO 9001:2000 certification in
Kenya’s sugar industry on Mumias Sugar Company and found out that production in the
company increased after certification and that employees enjoyed the benefits of the company
being ISO certified. Other studies made by Cua et al. (2001) and Kaynak (2003), found that there
is an underlined importance and causal relations between quality management practices and
competitive advantage. Cua et al. (2001) and Kaynak (2003) further suggested a positive
association between QM practices and organizational performance. The Brazilian Journal of
production and operations management (2009) studied on management practices in Leather-
Footwear Chain in Brazil and found out that ISO 9001QMS certified organizations performed
better in management practices and obtained superior results than the non-certified ones and that
the standard motivated the firms to succeed. Although a number of studies had been done on the
concept and context of quality management in the higher education sector, not much have been
done within the context of public universities in Kenya (Magutu et al., 2010). This study
intended to establish the extent to which ISO 9001 QMS certification of Universities has
influenced their attainment of competitive advantage in view of; students’ enrolment; customer
perception and image; research and development, and their ranking.
1.3. General Objective
The general objective of this study was to establish the influence of ISO 9001 quality
management systems certification on the competitive advantage of Kenya’s Universities.
1.4. Specific Objectives
I. To establish the effect of ISO 9001 QMS certification on students’ enrolment in ISO 9001
QMS certified universities.
II. To establish the effect of ISO 9001 QMS certification on customer perception and image of

9
the ISO 9001 QMS certified universities.
III. To determine whether acquiring ISO 9001 QMS certification has inspired growth in
research and development of the ISO 9001 QMS certified Universities.
IV. To establish the influence of ISO 9001 QMS certification on the Universities’ Ranking.
1.5. Research Questions
I. How had the acquisition of ISO 9001 QMS certification influenced the Student’s
enrolment at the Universities?
II. What was the effect of ISO 9001 QMS certification on the customer perception and image
of the Universities?
III. How did ISO 9001 QMS certification affect research and development in ISO 9001 QMS
certified Universities?
IV. What was the effect of ISO 9001 QMS certification on the ISO 9001 certified Universities?
1.6. Significance of the Study
This study is significant to the following key areas; firstly, is the higher education sector in
Kenya. The quality of education in Kenya has sometimes come into focus due to a miss-match
between the relevance of degrees to the labour market and the rate at which production is
undertaken. The human resource gap in Kenya is said not to be in speed with the national
strategic vision 2030 and therefore likely to affect its realization. Researchers agree that adoption
of proper quality management systems like the ISO 9001 model by organizations can help close
the divide coupled with quality results. Universities can use this model to provide quality
education that will match the ever-changing needs of the Kenyan society. The study is intended
to amplify the ISO 9001 QMS certification in Kenya’s Universities as a proper strategic
approach to generation of quality graduates to drive Vision 2030.
Secondly, the manufacturing industry is experiencing a lot of new up-coming, cheaper,
customer-oriented and yet valuable products. This calls for a steady and an alert management.
KMA is struggling on how to counter cheaper and yet valuable products from Asia and other
parts of the world and a hosts of other counterfeiting challenges. This study will help
manufacturer’s embolden the resolve to put-up ‘tamper-proof’ quality management systems that
attract, listen and retains customers as a measure of creating competitive advantage.
10
It will also add value to the process of conformity which will help most manufacturing firms
acquiring ISO 9001 QMS certification as a standard of best practice.
Thirdly, the service industry in Kenya has many organizations dealing with customers directly.
The industry is facing the challenge to listen. From the tourism and hotels industry that
contributes a substantial part of our national budget, the education sector that produces millions
of human manpower to the public service sector that is expected to champion responsiveness to
Kenyan’s interests and needs. Establishing competitive advantage within the systems and
processes involved in exceeding customers’ expectations cannot be ignored. Therefore, any
quality management system such as the ISO 9001 standards as a strategy to strengthen the
sector’s competitive advantage in the region is attractive.
Fourthly, the Kenya Government statutory bodies have in the past decade received in equal
measure both positive and negative criticisms on the systems employed in the service of
Kenyans. Public servants have been blamed for sluggishness, carelessness, corruption and
mediocrity. This resulted seemingly from incomprehensible, hidden and unclear systems of
service delivery. In 2003, there was a new wave of demands engineered by the Narc government
and the general public to receive quality service from public servants. Systems had to be put in
place to make sure that the public is satisfied with government services. There was a directive by
the new government that all public servants sign performance contracts and subscribe to giving
quality service to the public.
In 2008 after the creation of the Grand Coalition Government, the Prime Minister’s office was
mandated to spearhead the implementation of the performance contracting process in all the
government departments (Office of the Prime Minister Strategic Plan, 2009-2012). Systems had
to be put in place by all government departments including the statutory bodies to offer quality
service. In two years, Kenyans could feel the change in most government department since
service charters, systems and processes of service could be easily accessed by all Kenyans in
most departments. In short, there were clear and well documented quality management systems
which culminated in most serious government institution and departments being ISO 9001
certified. This study tries to suggest better measures of enhancing, strengthening, and sustaining
11
the efforts which were emboldened from 2003 by the government. Better quality management
systems based on ISO 9001 standards will guarantee trust, seal-off corruption loopholes, and
create a business friendly environment which could overtime foster growth in the country’s
overall GDP.
Fifthly, the employees, students, and the general public are expected to be core
beneficiaries of this study. Once the recommendations of the study are formulated and
documented into implementable practical manuals, the universities’ staff, students, and the
general public will be aware not only about service delivery systems in universities but also with
processes through which quality services, products, and education take to have value. They will
be able to ask the right quality questions about products and services across all sectors creating a
responsible production sector accountable to the consumer. The employees will appreciate the
ISO 9001 quality management systems that bequeaths to them relevant quality service delivery
processes and education. The consumers will also be able to identify areas that need
improvement and increase the speed of quality-in- innovativeness and appreciate process
documentation in both service and product sectors.
Finally, the researcher did not assume the first contributor to this area of knowledge or the last.
Interest in ISO 9001 quality management systems and their functionality to provide value to
customers is evolving. Innovations and inventions yearly foster the need for quality management
systems. Therefore, future researchers in this field of quality management systems and related
areas will access insights invaluable on how to use and improve ISO 9001 QMS processes to
capture competitive advantage not only at Kenya’s Universities but also around the world.
1.7. Limitations of the Study
This study had several limitations namely; Time, Resources and Non- Responsiveness. First, the
researcher was a student and at the same time fully engaged with work-related activities that
involve travelling. This study was expected to take a period of three months, however, time
constraints to meet both the research need and work-related operations caused delays is both
collection and compilation of data. The availability of employees at one single time was a
challenge since both the teaching and non- teaching staffs came to work at irregular intervals. To
12
overcome this challenge, the researcher assigned two days per week to concentrate on the
collection, analyzing, editing and recording of data. The researcher met the employees at
different times of the day e.g. evening for most evening lectures and morning hours for day-long
employees.
Second, this study needed both tangible and intangible resources. The tangible resources
included finances and stationary. The intangible resources encompassed employees of the
selected Universities. Accessing all required resources had challenges especially fare to travel
to collect data and meeting employees most of whom are busy people. The researcher identified
lead-students from selected schools to assist in the delivery of questionnaires and collection. The
money used in the study was substantial and depending on monthly income could not fulfill the
budget. The researcher drew some money from his savings and also requested family and friends
for support.
Finally, non-responsiveness to research questionnaires from some sampled universities’ affected
the data collected. Though most Universities seemed to adopt an open policy to access to
information, not all information could be easily accessed and could lead to inadequate capture of
information and low response in some universities. To increase responsiveness the researcher
acquired a letter suctioning the study from Kenyatta University Vice- Chancellor’s office. The
seemingly express intention to add value to the universities’ ISO 9001 quality Management
systems processes helped allay any mistrust by respondents. Furthermore, the researcher made
personal calls and meetings with both teaching and non-teaching staff to get first-hand responses.
1.8. Scope of the Study
The study was carried out within Nairobi in the selected ISO 9001 QMS certified Universities. It
targeted four universities with 6,850 staff. They included a total of 2,640 teaching staff and 3,410
non-teaching staff of four ISO 9001 QMS certified public and private universities. These were
the University of Nairobi and Kenyatta University (Public) and the Strathmore University and
Catholic University of East Africa (Private). The staff was drawn from selected schools of 3
universities and a faculty of 1 university.

13
CHAPTER TWO
LITERATURE REVIEW
2.1. Introduction
The growth of the education sector and the need for more Universities in Kenya has generated
competition in the education sector. It has led to the need to determine quality in the new and the
expanding older universities so that the knowledge accessed from the universities is not only for
the sake of it but contribute to the growth and development of Kenya in many ways (IPAR,
2010). There is the need to have quality education through quality management practices that
stands out all through. Quality management practices are recognized in organizations not only
internally through products realized but externally through awards of quality which are also
referred to as models that motivate quality. Pabedinskaitė and Vitkauskas, (2011) in one of
their writings on implementation of Quality Management Practices in Lithuanian Enterprises
have identified three main models or approaches to quality management in scientific literature
namely: Total Quality Management (TQM), Quality Management System (QMS) and European
Foundation for Quality Management (EFQM). There are several other models created to ensure
quality management is celebrated as it is implemented in organizations Bauer (2006), this study
summarizes a few models by quality scholars.
2.2. The Theoretical framework
Quality Management Systems models/awards form the core to many quality professionals. They
establish quality criteria in most industries and form the principles on which quality is gauged.
They also offer step-by-step practical techniques on how to ‘do’ quality (Gitlow, 2000). Most
salient in the models is the standard of their similarities such as continuous improvement, since
the very principles that form each model seam different in wordings but some are the same in
many ways. For example, most models identify and stress leadership involvement in quality
processes, customer focus; identifying, gathering and analysis of information to make informed
decisions, development of people in the organization, and process management as key principles.
But, as we learn, they are the key characteristics that define quality as it is practiced today in
many organizations (Bauer, 2006).
14
2.2.1. Models of Quality Management Systems
Dr. Deming prize (1951) was the first model established to commemorate the late Dr. William
Edwards Deming. It was developed in Japan and is one of the highest awards because it helped
promote TQM (Total Quality Management) in the world. He contributed greatly to Japan’s
proliferation of statistical quality control after the World War II. His teachings helped Japan
build its foundation by which the level of Japan’s product quality has been recognized as the
highest in the world (JUSE, 2012). TQM is explained in seven points which form the basis of
TQM and if followed an organization may receive the Dr. Deming Prize. These are; 1.
“Systematic activities” 2. “Carrying out by the entire organization effectively and efficiently” 3.
“Organization’s objectives” 4. Provide" refers to the series of activities from producing
“products and services” to delivering them to the customers include research and study,
planning, development, design, production preparation, purchasing, manufacturing, installation,
inspection, order-taking, distribution, sales and marketing, maintenance, after-sales services, and
after-usage disposal and recycling. 5 "Products and services" refers to all the benefits that are
delivered to the customers, 6. "Quality" refers to the usability (in functional and psychological
aspect), reliability, and, 7. "Customers" not only refers to the buyers but also stakeholders
include the users, consumers, and beneficiaries (Deming, 2000).
Second, the Six Sigma program a business management strategy developed in 1986 by Motorola
formally headed by Bob Galvin. Bill Smith is considered the father and it became popular when
used centrally by Jack Welch as a business strategy at General Electric in 1995. It seeks to
improve quality of process output by identifying and removing the causes of defects and
minimizing variability in the manufacturing sector. It uses a set of quality management methods
and statistical methods and creates a special infrastructure of people (George and Rowland,
2004). Six sigma projects are based on two methodologies influenced by Demings’ Plan-Do-
Check-Art Cycle and compose five phases fused in the acronyms DMAIC (Define-Measure-
Analyze-Improves-Control, then Recognize) - improves existing business process then result in
RDMAIC methodology and DMADV (Define-Measure-Analyze-Design-Verify)-aims at
projects creating new products or process design (Keller and Pyzdek, 2010).
15
Third is the Baldrige National Quality Program. The model was established and signed in law in
the US based on the public law 100-107 on August 20th, 1987 and officially put in practice in
1988 created as the Malcolm Baldrige National Quality Award. It was originally designed
to promote TQM as the best approach for improving and restoring high level competitiveness to
the US corporations (Leonard and McGuire, 2007). Organizations are expected to keep
improving on quality and maximizing productivity growth. Therefore, setting standards of
excellence that can enable them attain this objective will affirm the position of competitiveness
in the market. The initial core purpose for the model has been evolving over the years since its
inception. Most US Corporations have had to gravitate toward this model to stay competitive.
The design has created a public-private partnership standard of quality excellence that has since
covered education, healthcare organizations and service companies as well as not-for-profit
organizations. This remains the powerful set of guideline for the determination and execution of
organizations’ priorities in the US (Leonard and McGuire, 2007).
The primary objectives of this model include: assisting organizations to improve their
performance practices, results and capabilities; facilitate communication and Benchmarking
where organizations share best practices information among themselves―it is the identification
of those organizations at the top of their game and motivating them to share the knowledge and
wisdom that helped them reach the plateau as a crucial part (Leonard and McGuire, 2007). How
far universities are able to benchmark their best practices could be another platform of research:
and finally, providing a working tool for understanding and managing performance, guiding in
planning and creating opportunities for the organizational learning. The important feature to the
Baldrige applicants is the strategic planning component which must address both the short-term
and long-term goals of the organization (Latham and Vinyard, 2011).
The applicants to the Baldrige criteria may be drawn from manufacturing, service, and small
businesses as well as educational, healthcare and nonprofit organizations. They present a fifty
page application explaining how they run their businesses and present the business results
achieved. The examination and award to organizations covers seven core principles
corresponding to the categories of the criteria for the award. These include: 1) Leadership 2)
Strategic planning 3) Customer and market focus 4) Measurement, analysis and knowledge

16
management 5) Workforce focus 6) Process management and, 7) Results (Brown, 2008). The
winners of this award have found it not possible to trade off financial results for satisfied
employees or customers. They have all agreed that achieving exemplary results, delighting
customers and providing employees with good working environment are in practice the reason
why quality excellence and performance can create an organization’s competitive position
(Brown, 2008). Particularly, these criteria or principles, well executed provide fundamental
aspects for quality excellence in both service and product delivery.
Fourth, the Kaizen quality program was created for the purpose of continuous improvement and
believed that when little is improved each day, eventually big things occur. Maurer (2004) notes
that Deming was the first advocate of continuous improvement and that it seemed inadequate at
the start but somehow the little steps added up to a brilliant acceleration of America’s
manufacturing capacity. It was introduced in Japan after the war when General Douglas Mac
Arthur’s occupation forces began to rebuild the devastated country. It was modeled in the Toyota
Industry which rewarded people who could find and fix problems in a Toyota plant (Chamber,
2008). Kaizen taught workers the value of continuous incremental improvement every day.
Fifth, the European Quality Award now referred to European Foundation for Quality
Management (EFQM) was first made in 1992 to Robert Xerox (EFQM, 2011). According to the
British quality Foundation (2000), the model is based on the belief that excellent organizations
achieve and sustain superior levels of performance that meet or exceed the expectations of all
stakeholders.
2.2.2. The Background of ISO 9001 QMS Model
ISO means International Standardization Organization established first as a UN agency in 1947
(Tricker, 2010). It is a non-governmental organization and a network of the national standards
institutes of over 160 countries (Hoyles, 2009). Its aim is to facilitate the international
coordination and unification of Industrial Standards. It though has no power to enforce the
implementation of the standards it develops (Ward, 2008). Before the development of ISO 9001
QMS model, ISO 9000 was first published in 1987 in the UK and immediately ratified in Europe
and encompasses fundamentals and vocabulary to be used in the standards. It defines Quality
Systems Standards, based on the premises that certain generic characteristics of management
17
practices can be standardized, and that a well-designed, well-implemented, and carefully
managed quality system provides confidence that the results and out-puts will meet and even
exceed customer expectations and requirements (Evans and Lindsay, 2009).
The ISO 9000:2000 has comprehensive and fundamental rules of belief for leading and operating
organizations. It is aimed at continually improving performance over the long- term by focusing
on customers while addressing the needs of all other stakeholders (Bauer, 2006). To a larger
extent, many standards agreed upon at the international level apply to certain types of products
and services and how they are delivered to customers. They aim at ensuring interchangeability,
compatibility, interoperability, safety, efficiency and reduction of variations (Hoyle, 2009).
Mutual recognition of standards between trading organizations and countries increases
confidence and decreases the effort spend in verifying that suppliers have shipped acceptable
products to customers.
ISO 9000 is just one small group of standards among a collection of over 17000 internationally
agreed upon standards and other types of normative documents in ISO’s portfolio (Hoyles, 2009;
Cianfrani et al., 2009). Holyle (2009) has noted that ISO 9001 is derived from the ISO 9000
family of standards and one among several standards. It has become a market requirement since
it focuses on giving confidence to customers that products and services meet the needs and
expectations of customers and other stakeholders and improves capabilities of the organization to
do this. ISO 9001 structure is based on ISO 9000:2000 and provides the specific requirements for
quality management systems, to which users must conform in order to obtain third-party
certification. For instance, the supplier’s management with the executive responsibility shall
define and document its policy for quality, including objectives for quality and commitment to
quality (Micklewright, 2010). The quality policy shall be relevant to the supplier’s organizational
goals and expectations and needs of its customers. The supplier shall ensure that this policy is
understood, maintained and implemented at all levels of the organization. The major sections in
which the requirements are organized are viewed differently by different writers. It is
these sections if well examined and attended to by organizations that culminate into
certification.
18
ISO 9001:2000 is an overall standard that put together a collection of three other standards: ISO
9001:1994 (QA in design, development, production, installation, and servicing), ISO 9002:1994
(QA in production, installation and servicing), and ISO 9003:1994 (QA in final inspection and
test) (Tricker, 2010). To reiterate, the version ISO 9001:2000 stems from the ISO 9000 model
and seeks to address deficiencies and challenges noted in other versions. It is much more
business focused aimed at improving organizations’ management systems through application of
eight principles. It is a standard for business management systems (Tricker and Sherring-Lucas,
2005). The standard, though based on eight principles, have them operational in at least 5 key
varied sections that show aspects of quality (Hoyles, 2009; Tricker, 2010; Evans and Lindsay,
2009, Cianfrani, West, and Tsiakals, 2009). The 4 sections and the 8 principles are discussed
below and include:
2.2.2.1. Management Responsibility
For the quality system to effectively function there should be a commitment from the
management that supports its development. The commitment should be customer oriented,
responsible for the QMS and able to plan the quality policy implementation, well communicated
and reviewed to the whole organization. This shows that the management is actually in control of
the whole process and thus a guarantee for its success.
2.2.2.2. Resource Management
This section sets out requirements that include planning for the identification, allocation and
provision of resources. It further emphasizes the need for better management of the same
resources, the infrastructure and the work environment that fosters effective implementation of
the QMS.
2.2.2.3. Product Realization
This is a critical section for the implementation of an effective QMS. It requires that products
planning, design and development, and delivery are suitable to the organization and the
customers. It is a customer-related process which may also include purchasing, the real product
provision, and control of the monitoring and measurement tools.
19
2.2.2.4. Measurement, Analysis and Improvement.
This section gives the requirements that demonstrate both the conformity of the product and the
QMS. It monitors and analyses the effectiveness of the system and its capability to continually
improve the QMS. Generally, the 5 key process-based sections reviewed, collect and reflect
the eight principles of the quality management systems which form the theoretical framework of
the study.
2.3. Quality Management Principles
A quality management principle is a fundamental and comprehensive rule for leading and
operating an organization to continuous improvement customer satisfaction and creation of
stakeholders’ value (ISO, 2012). They include: customer orientation; leadership; involvement of
people; process management; systems management; continual improvement; fact-based decision;
and close supplier relationship. The importance of these quality management principles cannot
be over-emphasized (Tricker, 2002). They have been well reviewed in literature but apparently
customer service and assurance is most prominent since the ISO 9001 standard’s ultimate goal is
customer satisfaction (Evans and Lindsay, 2010).
2.3.1. Customer Focus
A quality assured customer is a happy customer and a working QMS should be aimed at
exceeding customers’ requirements (Hoyles, 2009). This is a customer driven view for quality
which creates a sustained organization’s competitive advantage through customer loyalty
(Tricker, 2005). Organizations should understand both the current and future needs of customers
since they depend on them. It helps in realizing the customers’ needs and requirement and strives
to exceed the customers’ expectations (Cianfrani and West, 2002).
2.3.2. Leadership
The organizations’ leadership establishes unity of purpose and direction. They are expected to
create, maintain and sustain an internal environment in which people can become fully involved
in achieving the objectives of the organization (Cianfrani and West, 2002). The selected
Universities have had robust direction and unity of purpose. Focusing on leadership is therefore,
important in helping the achievement of planned goals.

20
2.3.3. Involvement of people
The essence of any organization is People (Cianfrani and West, 2002). Their involvement in the
implementation of action plans is crucial in developing their abilities to be used in the
organization. Their proactive participation promotes the quality ethos (Tricker and Sherring-
Lucas, 2005). People involvement allows the utilizations of a spread of skills from the people
and by the people for the good of the organization.
2.3.4. Process Approach/Management
This principle examines the logical sequencing of activities to effectively achieve a desired goal
(Tracker and Sherring-Lucas, 2005). All activities and resources are managed as a process aimed
at giving desired results (Cianfrani and West, 2002). A business process is abroad collection of
activities within the organization. It helps in the understanding of how things are really done and
improvement of performance (Carson Sr. et al., 2004).
2.3.5. Systems Approach/Management
This principle sees organizations as composed of many inter-related processes which form a
system. Managing these processes that form a system is an integral principle of quality (Tracker
and Sherring-Lucas, 2005). It involves the identifying, understanding and managing the inter-
related processes as a system that contribute to the effectiveness and efficiency in achieving
organization objectives (Cianfrani and West, 2002). Each quality system is influenced by
different objectives, instructional methods if it were in education sector and by different
administrative practices specific to the university (Kattman and Johnson, 2003): this is important
because poor interface between different processes may have a debilitating impact on the overall
process and consequently affect the organization’s strength in competitive positioning (Tricker,
2006).
2.3.6. Continual improvement
Quality management is sustained with continuous improvement ― a review of the workability of
all processes and systems to suite the ever- changing business environment. It involves constant
refining of processes to enable the organization to become more efficient (Tricker and Sherring-
Lucas, 2005). It is being committed to the ideal of continuously improving in all parts of the
organization (Liker and Franz, 2011). Customer satisfaction is a constantly moving and dynamic
entity depending on changes in technology and the market place turbulence, so an effective QMS

21
must be in a condition of continual improvement. For this to be achieved, attention needs to be
given to both the voice of the customer - through complaint analysis, opinion surveys and regular
contacts – and the voice of the processes – through measurement, monitoring and analysis of
both process and product data. It results in factual decision making and continuous improvement
which should therefore, be permanent objectives (Baranzeli, 2009).
2.3.7 Factual Approach
This principle examines the careful analysis of information and consequent making of decisions
based on the facts so derived from data. It therefore calls for maintaining useful, factual,
complete and accurate data for use in decision making (Tricker and Sherring- Lucas, (2006).
Data collected is monitored, measured and analyzed for use to come up with logical decisions
based on facts (Carson et al., 2004).
2.3.8. Close supplier relationship
The principle examines the mutual benefits derived from the creation of either strategic alliances
or partnerships of value (Tricker and Sherring-Lucas, 2005). The support that the organization
mutually receives from suppliers establishes independent, synergetic and quality driven
relationships (Imtiaz, 2001). This, in the long-run positions the organization to deal with the
challenges that comes with competition. It increases the organization’s ability to create value
since it ensures early involvement and participation in defining the requirements for joint
development and improvement of products, processes and systems. These helps strengthen
mutual trust, respect and commitment to customer satisfaction and continual improvement
(Kattman and Johnson, 2003).
2.4. Requirements of ISO 9001
Researchers and scholars on quality management systems have varied presentations on what
should actually be covered in the ISO 9001 QMS model. However, key to all the different
presentations is the general agreement on the requirements of the ISO 9001. This is the most
important stuff for the ISO 9001 systems model as set out from clause 4.1 of the ISO 9001
standard (Russell and Arter, 2008). The general requirements summarize the model into
commitments to the quality standards, the final goal being customer satisfaction (Cianfrani et al.
2009). Documentation becomes the hallmark of this system and includes procedures, policies,
work instructions, specifications and other tools that formally communicate organizations’ useful
22
information (Cochran, 2008). However, the leaner the documentation the better since it is
dependent on the training and skills of employees, the amount of supervision, and the nature of
the organizations’ tasks. It is best to have documents as streamlined as possible so that only
much documents as absolutely needed are documented. The explicitly required documents by
ISO 9001 includes; quality policy, quality objectives, and quality manual. These are fundamental
documents in an organization because they set the direction of the entire management system.
They say what organizations do and help them to do what they say (Russell and Arter, 2008).
2.4.1. Quality Policy
This identifies pertinent quality items about the products and services of the organization that the
management system is set for or focused on. It may also serve as a mission statement for the
organization. The management includes the process of establishing and reviewing quality
objectives of the organization (Tricker, 2005). Cianfrani and West (2011) describe a quality
policy to include the overall intentions and directions of an organization related to quality as
formally expressed by the top management. The top management of the organization must be
fully involved in the formulation of the quality policy and spearhead its realization.
2.4.2. Quality Objectives
As a key planning item, the objectives for quality must be well defined, described and
determined for documentation (Cochran, 2008). They must align themselves effectively with the
organizations quality policy (Tricker, 2005).
2.4.3. Quality Manual
This is a high level description of the organizations’ management system that typically offers a
road map to where all pieces of the management system are located. It takes commitment to
meeting the standards of the requirement. While it describes the management system, it does not
give specifics but merely points to other documents where these specifics reside (Cochran,
2009). The manual captures important tasks so that they are done correctly the first time round.
Any manual that repeats what is in the standard will not be attractive and useful to either
employees or customers (Russell and Arter, 2008).
2.4.4. The Six Quality Procedures
Many studies on the documentation of ISO 9001 QMS standard have identified the six core
procedures for documentation made around any organizational quality manual (Grimes, 2002).
23
Cochran (2009) has identified six procedures namely: document control; record control; internal
audit; control of non-conforming products; corrective action and; preventive actions.
These procedures require documentation as long as they are built around the quality manual
(Grimes, 2002; Tricker, 2005).
2.4.4.1. Document Control
This is a process of making sure that people have maximum access to timely and accurate
information to do their job. It is the most basic discipline that must be exercised in any
management system (Cochran, 2008). Many people are expected to access vital documents of the
organization and therefore, it is important that they are clearly aware on how to handle the
organizations’ documents (Tricker, 2010).
2.4.4.2. Record Control
This is a procedure that deals with history of activities or transactions that have taken place in an
organization (Cianfrani and West, 2009). A record is a document stating the results achieved or
providing evidence of the activities performed (Myhrberg, 2009). Records are important in the
review of prior activities for present and future strategic actions. They give assurance that an
organization is actually doing what it promised. They are the most believable form of
communication (Russell and Arter, 2008). Quality records are essential feature of a quality
assurance system but need not to be so extensive and exhaustive (Bolton, 1999). Quality records
must be sufficient to demonstrate that all essential processes have been carried out and that all
necessary inspections and tests have been undertaken (Bolton, 1999).
2.4.4.3. Internal Audit
An Audit is a systematic, independent, and a documented process for obtaining audit evidence
and evaluating it objectively to determine the extent to which audit criteria has been fulfilled
(Philips, 2009). This is the ‘’first-party auditing’’ for any organization (Collines Jr. and Steigar,
2011). The objectives of any internal audit system includes; verifying conformance to applicable
standards; conformance to documented process; effectiveness of the processes in the system; and
identifying opportunities to improve the system (Cochran, 2008; Philips, 2009). Different
organizations have different internal audit systems and thus, any audit system must be structured
to the success requirements of the organizations.
24
2.4.4.4. Control of Non-conforming products or services
The procedure aims at identifying products or services of the non-conforming nature and do not
agree with the market demands or the needs of the customers. The products that do not conform
to the specifications are identified by quality control inspection, customer complaints or the
internal quality audits. Bolton (1999) notes that a system of possible segregation is necessary to
prevent the product or service from being inadvertently used or to prevent the non-conforming
service being continued. Whether some courses have been disposed-off, or reformatted and
reorganized to conform to the needs of the market as part of continuous quality improvement
could be another area of study.
2.4.4.5. Corrective Actions
It is important for any organization to think of corrective measures in case of non- conformance
of its products or services. The procedure involved matters to help the organization stop the
reoccurrence of non-conforming products of services (Hoyles, 2009). The corrective action
results are actions planned and taken to stop something from recurring (ISO 9000:2005
Clause 3.6.5). Cianfrani and West (2009) refer to this procedure as an action to eliminate the
cause of a defected nonconformity or other undesirable situations. Organizations that strive to
eliminate the causes of defected nonconformity have a strong internal audit process that
identifies these defects for correction purposes. This assists the continuous improvement process
adding value to excellence and competitiveness in the market.
2.4.4.6. Preventive Actions
These are actions proposed and taken to stop something from occurring (Hoyles, 2009). It is
proactive in nature and aims at stopping rework exercises which could cause extra costs and
losses to the organization. It is equally important to correction, though it endeavors to eliminate
potential nonconformity or other undesirable potential situations (Cianfrani and West, 2009).
2.5. The ISO 9001 QMS Certification in Higher Educational Institutions
Kenya is fast moving towards realizing regulation mechanisms for organizations’ ISO 9001QMS
certification. The creation of an accrediting body KENAS by the government for certifying firms
attests to this effort and the value with which ISO 9001 QMS certification has. KENAS is
established under legal notice No. 55 of the State Corporations Act (Cap 446) dated 11th May
2009 to accredit ISO 9001 certifying firms. The world over, most firms/organizations, are talking
25
about attaining ISO 9001QMS certification (ISO Certified Firms Expo manual, 2011) viewed as
a key indicator of quality service delivery and customer satisfaction. Notable in the education
sector is that quality education is driven by a working quality management systems focused on
adding more value to the students and stakeholders.
The cut-throat business competition in various sectors in the 21st Century has seen organizations
endeavor to identify their competitive advantages. The basis with which to create this
competitive advantage has also differed from one sector to the other. The education sector is
driven more by the quality of education than mass production of graduates. As stated, quality has
become of outmost value to all organizations Schiefer (2002), thus Universities are not spared.
Therefore, any strategic plan that puts the universities at an advantageous position is attractive.
Since certification the selected universities have been at the forefront on quality education and
service deliver. Below is a brief reviews on the quality background of the selected universities.
2.5.1. University of Nairobi
This is a pioneer university in university education in Kenya. It is located in the centre of the city
with 7 campuses around the country. It is the largest university in terms of infrastructure and
students enrolment. The university was awarded ISO 9001: 2000 QMS certification in August
2008. Its quality policy statement is based on quality and quality improvement as the guiding
principle in the decision making, leadership and in provision of the university’s educational and
related issues to its customers (University of Nairobi Quality Policy Statement, 2008).
2.5.2. Kenyatta University
Kenyatta University has a rich history stemming from the University of Nairobi and has
produced thousands of able scholars and professionals serving Kenya in several sectors. It also
has various campuses around the country encompassing City Campus, Parklands, Mombasa, and
Nyeri just to mention a few. It was the first Public University to scoop the first position in
performance contracting in 2006/2007 performance cycle and also the first University to achieve
the excellent category in the 2007/2008 performance cycle. Kenyatta University was awarded
ISO 9001:2000 in May 2008, later referred to as ISO 9001:2008 certification. The University has
been conducting both internal and external audits as part of the quality management system

26
maintenance program (Kenyatta University Strategic Vision Plan, 2005-2015). On March 26th
2012, KU was again ranked the 2nd best performing State Corporation in performance
contracting during the 2010/2011 cycle. This indicates continuously enhanced and sustained
service delivery coupled with strategic leadership and transformational processes. The key
winning targets included: prevention of Human Immune Virus (HIV) infections; increase in
student population; increase in research proposals; increase in the number of researchers;
increase in the number of scientific publications; establishing university industrial linkages;
implementation of community based projects; integrating e-learning in the institutional based
programs; gender mainstreaming and disability mainstreaming (Kenyatta University newsletter
Vol. 8 Issue 3, 2012). Kenyatta University’s Quality policy aims at providing quality education
and training that is globally competitive and responsive to the market needs; consequently,
strengthening the quality management offices by putting specific strategies to ensure continuous
evaluation of standards in all areas of operation to meet the ever-changing needs of the students
and stakeholders (The Kenyatta University Graduate School Prospectus, 2010/2012).
2.5.3. Strathmore University
This was the first private university to be certified with the ISO 9001: 2000 award. The
University was begun in 1961. It was awarded a letter of interim authority to run as a university
in 2002 and was awarded a charter in 2007 by the commission of higher education. The
university was IS0 9001 certified in 2004 and re- certified twice in 2007 and 2009 after
undergoing recertification assessment. Quality based on the QMS has helped the university to
provide quality services that meet the expectations of its customers and applicable regulatory
measures, fostered continuous improvement, prevented and corrected non-conformities. The
university has been top on quality implementation strategies to be benchmarked.
2.5.4. Catholic University of East Africa
The university is based in Nairobi and started in 1984 as a theological school and today offers
more other programs other than theology. It has three campuses in Nairobi, Kisumu and Eldoret.
The university successfully implemented the ISO 9001: 2008 QMS in August, 2011 and
was awarded quality certification. It is committed to offer quality scientific research that will
27
generate new knowledge for holistic teaching and beneficial community service to cater for the
needs and expectations of its customers. The university also emphasizes continuous
improvement according to the ISO 9001: 2008 standard (Catholic University of East Africa
Quality Policy Statement, 2011).
2.6. Quality in the Education Sector
The need for quality education that contributes towards sustainable economic development is
important. Kenya’s Vision 2030 captures quality education as a social strategy pillar to sustained
economic growth and development therefore, it is so necessary in establishing a formidable
future for the nation (Kenya’s Vision 2030, the popular version, 2007). Educational Institutions
from basic to higher education have put practical measures that will contribute toward attainment
of quality education. Quality assurance in most institutions of higher learning is ensured by the
institutions themselves and therefore, an internal responsibility based on an internal evaluation of
the institutions programs (Orsingher, 2010). However, the education sector’s approach to quality
has had its share of challenges. Cheng and Tam (1997) suggest that ‘’ education quality is rather
vague and a controversial concept’’ Pounder (1999) on the other hand argues that quality is a ‘’
notoriously ambiguous term’’ and as a result the difficulty in defining quality, the measurement
of quality has also proved contentious. Lewis and Smith (1994) agree that the perception of
“quality of education” by many academics is increasingly becoming a problem for many
outside the system. Even so, the adoption of a working quality management system creates the
scope with which quality in education could be measured.
Other than the shortcomings of present higher education systems characterized by deprived
teaching practices, anachronistic programs, incoherent curricula, excessive price, and growing
inefficient administrative bureaucracies (Engelkemeyer, 1993; Hansen (1993) noted that an
efficient QMS like ISO 9001 model is seen by many as having enormous potential to respond to
these challenges in defining and measuring quality in education. Cowles and Gilbreath (1993)
emphasize that a working Quality Management System can be applied as a means for improving
student/ staff morale, increasing productivity, and delivering higher quality services to both
internal and external customers.
28
As a measure to entrench quality education, many higher educational institutions in Kenya have
worked or are in the processes of attaining the ISO 9001QMS as a clear resolve to quality
education development. It is generally recognized that rather than mass production and
considering the huge public and private investment in university education, there is an urgent
need to evaluate how effectively this investment is being utilized by examining the quality of the
educational infrastructure, the cadre of qualified tutors and other resources in place, and the
quality of teaching and learning (Unesco, 2003). The educational quality agenda needs to move
to the forefront of all educational policy makers, but rather in a structured manner which can be
measured, analyzed and assessed by all stakeholders (Magutu et al, 2010).
While the approaches to the processes adopted in view of quality differ from industry to industry
especially in the commercial environment, ISO 9001QMS has transcended to educational
institutions. The model’s practicability in educational institutions takes up a direct relationship
between the conception of higher education being taken, the definition of quality being used and
the performance indicators chosen to measure quality (Tam, 2001). ISO 9001 QMS provides
room for educational institutions to define quality in accordance to their structures and formulate
policies, objectives and manuals based on the structure of the prevailing education system and
expectations of stakeholders. This is an engagement that is able to foster quality education
standards and development in educational institutions. As a result University of Nairobi,
Kenyatta University, Strathmore University and the Catholic University of East Africa among
other institutions of higher learning have been certified with ISO 9001 QMS standards and
several others are in the process of attaining certification. The ISO 9001 QMS certification may
influence the Universities’ competitive advantage in many ways. The areas reviewed below
represent just a few of its Influences:-
2.6.1. Students enrolment
The student’s admissions and consequent enrolment in universities is on the rise. It is even
expected to rise following the introduction of free and subsidized basic education from where
universities have a pool of students (Republic of Kenya, 2005b). An even greater demand for
higher education has stemmed from the new, non-traditional learners-the mature students. These
are those who are 30 years and above and either missed the earlier opportunity to get to
universities or those who want to increase their work qualification (IPAR, 2010). The
29
(UNESCO,2003) report on higher education development in African states show that many
countries with higher education systems that are at critical development phases have experienced
higher rates of expansion and increase in student enrolment than anticipated. The unprecedented
students’ enrolment has caused some universities to register more self- sponsored students than
government sponsored students registered through JAB. Despite this expansion and as a result of
inadequate government funding, the institutions face demand-related challenges especially in
terms of access and equity; quality and relevance; science and technology; and management and
global marketability (Republic of Kenya, 2005b). Quality and relevance has even been a greater
challenge that every university has had to grapple with. Expansion in students’ enrolment has
called for higher quality in education and bolder quality management systems that are able to
match the speed of expansion of universities. Adopting the ISO 9001 QMS model by most
universities to ensure quality education delivery has seen certification of some universities to the
ISO 9001 standard.
2.6.2. Perception and Image
Perception involves an idea, a belief, or image that is created as a result of how we see or
understand something while an image is the impression that a person, an organization, or a
product gives to the public. ISO 9001 QMS certification of organizations creates an image and
perception to the clients and customers. Dick et al. (2002) have concluded that ISO 9001
certification makes a profound difference in the ways quality is perceived and measured. The
perception and image whether positive or negative have certain influences they make to the
organizations. However, not much literature is available on whether ISO 9001QMS improves or
not the perception and image of any organization (Muslim and Nur Riza Suradi, 2012). Though,
in their specific study on both academic and non-academic staff of private colleges (Rosly
Othman & Melissa Ng Lee Yen Abdullah, 2007) observed that non-academic staffs were more
satisfied with ISO 9001 QMS implementation than academic staffs. The Academics were
negative about (a) ISO implementation, and (b) quality of operation management and also have
no interest on the certification process and have the impression that certification will not improve
the existing operation management. The respondents in the study argued that they are overloaded
with too many responsibilities on top of teaching and learning activities which is of utmost
importance. On the other hand, Non academic staffs felt that ISO certification enables them to be
more efficient and responsive to the needs of their internal and external customers. They also felt

30
that ISO certification has improved the quality of their service towards customers, and reduced a
number of complaints and failures in delivering their services (Muslim and Nur Riza Suradi,
2012).
2.6.3. Research and Development
Quality education and research are the backbone to Universities. The challenge to policy makers
today is how to balance quality education and research and greater access (Mohamedbhai, 2008).
However, due to very heavy teaching load, the staffs have hardly any time to devote to research.
The big number of students enrolled in both regular and parallel degrees is increasing. Parallel
degree programs are attracting a large turnover of staff neglecting research at the platform of
teaching which offers an extra remuneration. The promotion of most of these lecturers has been
slow since most universities use research output as an important criterion. Because of their
limited research, many young staff, overburdened with teaching, have fewer chances of being
promoted, thus affecting their morale (Mohamedbhai, 2008). ISO 9001 QMS certification
generates new energy to research in higher education’s development.
2.6.4. University Ranking
Ranking of Universities is a key indicator for the fast growing global competition in higher
education. Rauhvargers (2011) defines ranking as a relationship between a set of items such that,
for any two items, the first is either ‘ranked higher than’, ‘ranked lower than’ or ‘ranked equal
to’ the second. In mathematics, this is known as a weak order or total preorder of objects. It is
not necessarily a total order of objects because two different objects can have the same ranking.
The rankings themselves are totally ordered. For example, materials are totally preordered by
hardness, while degrees of hardness are totally ordered. It has raised the bar in the higher
education sector encouraging competition in education enterprise and innovativeness,
management of the institution, and strengthening the three primary functions of an institution
namely; teaching, research, and service. The three types of measures of effectiveness of an
organization include: rankings, accountability and quality assurance. They share common goals;
however, continuous improvement of quality- one of the principles of quality based on ISO 9001
QMS is emphasized (Shin, Toutkoushian, and Teichler, 2011).

31
The first global university ranking was developed by the Shanghai Jiao Tong University in 2003
(Hazelkorn, 2011), and since then a number of systems have been developed in an endeavor to
effectively rank universities. For instance, UNESCO European Centre for higher education
(UNESCO-CEPES) and the institute for higher education policy in Washington, D.C founded in
2004 the International Ranking Experts Group which developed a set of quality principles and
good practices, referred to the Berlin principles of ranking of higher education institution.
Another system is the THE-QS World University ranking which is referenced in over 1000
newspapers, journals and websites every year (The Journal of Educational Studies NO.1 2010).
The World University Ranking Web is the most recent ranking system and most Kenyan
Universities were ranked this 2012. Shin, Toutkoushian, and Teichler (2011), note that a
university’s effectiveness can be measured theoretically by a combination of inputs, throughputs
and/or outputs. Another factor to be addressed is how to properly measure the concept of ‘’
quality’’ in higher education. They agree that is difficult to find a proxy measure for this
construct, thus a critical issue to researchers is how to use available quantitative indicators to best
represent quality in higher education. This study intends to find out if ISO 9001 QMS
certification of Kenya’s Universities forms a basis to influence their level of ranking.
2.7. Challenges associated with the implementation of ISO 9001 QMS
In his explanation about the challenges of ISO 9001implementation Grimes (2007) noted that is
the simple things; the ones we take for granted that trip us down most time. The implementation
of the ISO 9001 encompasses very simple and often ignored steps which indeed are the basis of
customer satisfaction and service delivery. For instance, if no one is sure of the proper
communication lines of the organization, communication fails in the whole company. Secondly,
incomprehensible flow-chart to workers creates conflicts and poor information flow. There is no
substitute to flow-charting processes in an organization (Grimes, 2007). ISO itself does not force
down a particular layout for organizations setting up their quality management systems, but
emphasizes a working system for the organization appreciated by customers in product or service
delivery. Most organizations have challenges on how to start up the process, the struggle to get
the exact ISO layout as a prototype, the question of what happens when they fail to conform, the
magnitude of documentation required, an apparent belief that ISO instructs how organizations
should be run and the fear of failure to conform to the standard after an audit.

32
While most organizations can go around all these challenges including acquiring the
certification, staying on course to do what they actually promise customers is most profound
(Hoyles, 2009).
2.8. The Benefit of the ISO 9001 Certification
The terms registration and certification have been used interchangeably to mean the same thing
in different countries. In Kenya, certification has been the most prominent word to refer to those
organizations that have been officially audited by a third party and duly registered as having
attained what is contained in the ISO 9001 standard and requirements. Hoyles (2009) refers to
certification as a process by which a product, process, person or organization is deemed to meet
specified requirements while registration is a process of recording details of organizations of
assessed capabilities that have satisfied prescribed standards and in this case ISO 9001 standards.
Vavra (2002) emphasizes that being ISO 9001 certified is a respected cue which stresses the
importance of measuring and striving to improve customer satisfaction. The benefits of the ISO
9001 certification are intertwined in the organization’s capability to demonstrate improved
customer satisfaction. ISO 9001 stresses customer satisfaction as the first goal attained by the
standard (Robitaille, 2003). It rains awareness to customers’ requirements within the
organization, defines and controls processes for communicating with customers and mandates
the analysis of data relative to customer satisfaction. Secondly, the standard is more closely
aligned to actual business practices, mimicking sequences and interrelations that typify most
organizations. Most aspects in product realization section such as determination of customer
requirements, design and development; purchasing; production; monitoring and measuring;
traceability; storage and shipment present a rudimentary synopsis of the process approach
(Robitaille, 2003) which aligns the business to current practices.
Nanda’s (2003) presents the benefits of ISO 9001 registration and underscores the following;
first, it provides customers a high degree of assurance regarding the organization QMS
considering that the organization was independently audited by an accredited registrar. This
strengthens customer confidence and relationship (Myhrberb, 2009); second, it fosters
continuous improvement in the productivity of the organization on both with-in budget project
33
execution and on-time delivery performance. This enables the organization to improve on its
bottom-line; third, most ISO 9001 certified organizations desire to have their suppliers certified
too, therefore, certification enables the organization to bid for tenders that require ISO 9001
certified suppliers; fourth, key to the study is ISO 9001 QMS influence to Universities’
competitive advantage. It enables the organization to gain competitive advantage to being
perceived a ‘’ best in class’’ by its customers and this consequently, helps the organization to
retain customers, increase market share, attract new customers and enhance top-line revenue
growth; fifth, project execution in organizations require some degree of consistence by the use of
the same known processes. ISO 9001 increases this degree of consistence in project execution
across multiple projects using similar processes. This helps in improvement of the quality
deployment process (Myhrberb, 2009).
Sixth, the ISO 9001 QMS helps reduce or even eliminate the dependence on a few individuals in
the organization who may hold important information regarding vital processes because such
processes are well documented and everybody new or old is able to follow them up; and seventh,
the organization is able to get rid of the reliance on ‘’ heroes’’ to make projects a success
because all employees are aware of the needed quality procedures and practices. Overall, the
contribution of ISO 9001 QMS on organizations cannot be ignored by any organization playing
business in this century. The service, manufacturing, public and private organizations all alike
have a challenge to document all their processes, practices and procedures that enables
continuous improvement and always better service delivery focusing on exceeding customers’
expectations. This creates and sustains the organization’s competitive advantage.
2.9. Conceptual Framework
The schematic framework below (Figure 2.1) was proposed to guide this study. It interrogated
the employees of selected Kenya’s universities and independent variables moderated by work
policies, technology, training and organizational policies. The independent variable was studied
in sample analysis hypothesizing that their reciprocal causal relationship affects the dependent
variable. This study therefore, tests competitive factors in the ISO 9001 QMS certified
universities’ in Nairobi, Kenya.
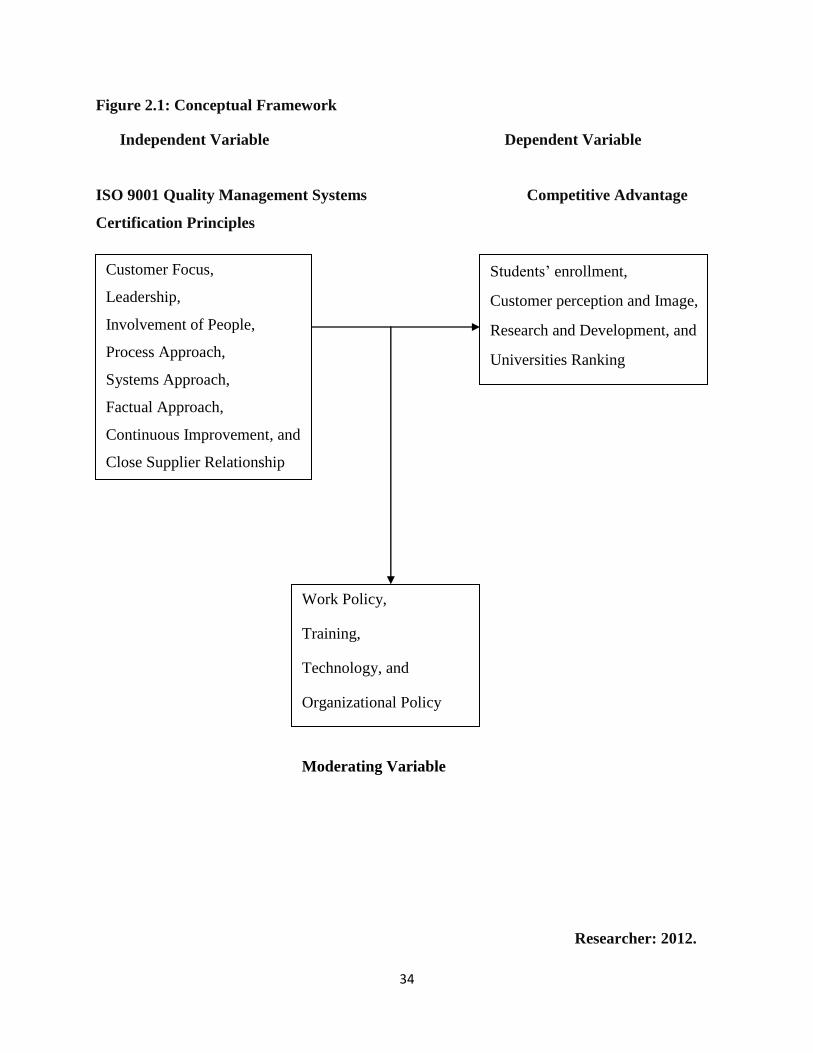
34
Figure 2.1: Conceptual Framework
Independent Variable Dependent Variable
ISO 9001 Quality Management Systems Competitive Advantage
Certification Principles
Moderating Variable
Researcher: 2012.
Work Policy,
Training,
Technology, and
Organizational Policy
Students’ enrollment,
Customer perception and Image,
Research and Development, and
Universities Ranking
Customer Focus,
Leadership,
Involvement of People,
Process Approach,
Systems Approach,
Factual Approach,
Continuous Improvement, and
Close Supplier Relationship

35
CHAPTER THREE
RESEARCH METHODOLOGY
3.1. Introduction
The chapter describes an overview of the methods used in the study. Sections and areas covered
include the Research design; The Study Population, Sampling and Sampling techniques, data
collection and collection instruments, analysis, and presentation.
3.2. Research Design
The study involved the descriptive survey design in establishing the influence of ISO 9001QMS
certification on the competitive advantage of Kenya’s ISO 9001 QMS certified universities in
Nairobi, Kenya. The study design was selected because it explores the influence of the
independent variable on the dependent variables besides collecting and describing the relevant
data for the study. It also allows details to be secured from multiple sources of information and
evidence to be verified through in-depth probing (Cooper and Emory, 1996).
3.3. The Target Population
Four ISO 9001 QMS certified Universities in Nairobi, Kenya with a population 6,850 employees
from schools and faculties were targeted in this study. Four thousand eight hundred and seventy
four (4,874) staff members of the University of Nairobi categorized into 1,411 teaching staff and
3,463 non-teaching staff (University of Nairobi Staff Handbook, 2006 updated, 2011), 2,294
staff of Kenyatta University categorized into 747 teaching and 1,547 non-teaching staff (The
Kenyatta University Prospectus, 2009-2011), 438 staff of Strathmore University categorized into
233 academic staff and 205 administration and support (Strathmore University strategic plan and
projects, 2010) and 49 Academic, 5 Research staff members, 12 Heads and Deputies from 6
faculties of the Catholic University of East Africa (http://www.cuea.edu/).
The optimal sample in any representative study includes that which fulfils the needs of
efficiency, representativeness, reliability and flexibility and thus thirty percent (30%) is referred
to as an optimum sample in view of the situations of this study as noted by (Kothari, 2003).
University of Nairobi has 20 schools (University of Nairobi Catalogue, 2006-2010), 6 schools
are selected;

36
Kenyatta University has thirteen (13) schools (Kenyatta University Catalogue, 2011/2013), 4
schools are selected; Strathmore University has 7 schools, 2 schools are selected; and finally
from the 6 faculties of the Catholic University of East Africa 2 are selected for the study.
3.4. Sampling Procedure and Sampling Technique.
Simple random sampling and stratified sampling techniques were used to select schools and
faculties for the study. The School of Business, School of Education, School of Public Health,
School of Engineering, School of Law, and School of Economics are selected from the
University of Nairobi; School of Applied Human Sciences, School of Business, School of
Education, School of Humanities and Social sciences were selected from Kenyatta University;
School of Management and Commerce and the School of Business were selected from the
Strathmore University; and finally the faculties of Education and Commerce were selected from
the Catholic University of East Africa. The stratified random sampling procedure was used to get
the sample and sample size. Random sampling presents the characteristic of each unit of the
sample and approximates the characteristics and responses of the total population allowing the
calculation of sampling error. On the other hand, stratified sampling does foster homogeneity of
each stratum, therefore, posts more valid, reliable and detailed information since it has a smaller
sampling error compared to the random sample.
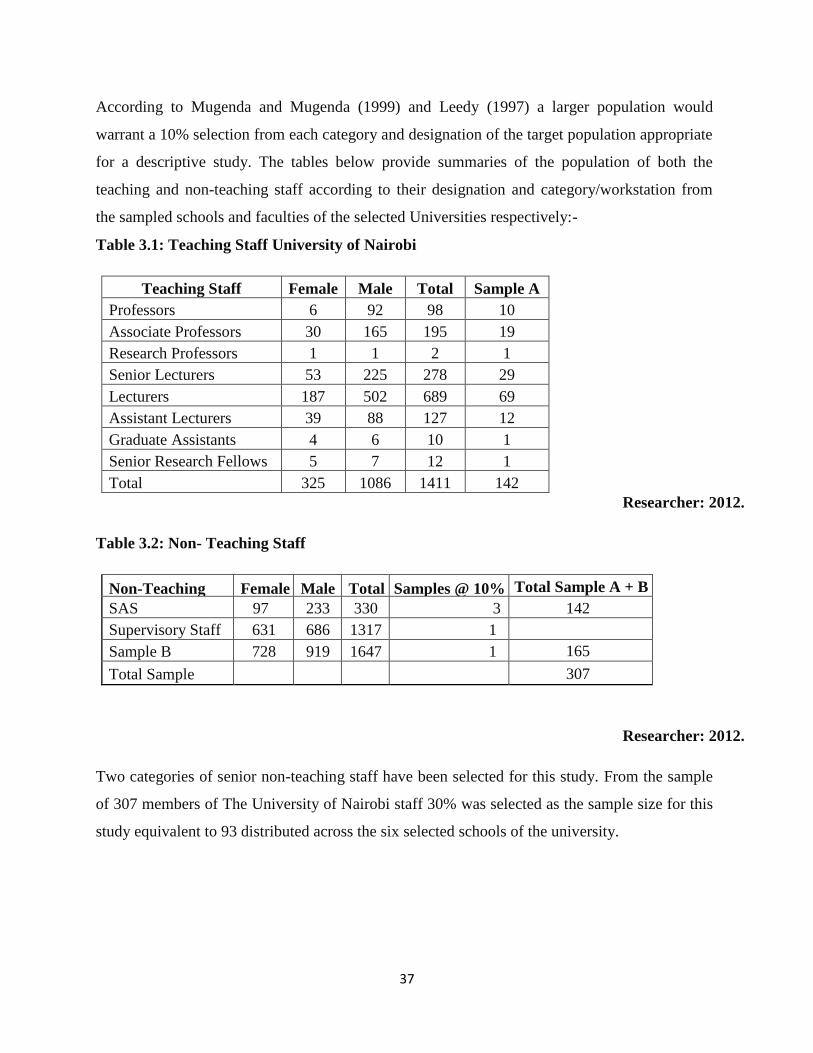
37
According to Mugenda and Mugenda (1999) and Leedy (1997) a larger population would
warrant a 10% selection from each category and designation of the target population appropriate
for a descriptive study. The tables below provide summaries of the population of both the
teaching and non-teaching staff according to their designation and category/workstation from
the sampled schools and faculties of the selected Universities respectively:-
Table 3.1: Teaching Staff University of Nairobi
Teaching Staff Female Male Total Sample A
Professors 6 92 98 10
Associate Professors 30 165 195 19
Research Professors 1 1 2 1
Senior Lecturers 53 225 278 29
Lecturers 187 502 689 69
Assistant Lecturers 39 88 127 12
Graduate Assistants 4 6 10 1
Senior Research Fellows 5 7 12 1
Total 325 1086 1411 142
Researcher: 2012.
Table 3.2: Non- Teaching Staff
Non-Teaching Female Male Total Samples @ 10% Total Sample A + B
SAS 97 233 330 3
3
142
Supervisory Staff 631 686 1317 1
3
2
Sample B 728 919 1647 1
6
5
165
Total Sample 307
Researcher: 2012.
Two categories of senior non-teaching staff have been selected for this study. From the sample
of 307 members of The University of Nairobi staff 30% was selected as the sample size for this
study equivalent to 93 distributed across the six selected schools of the university.

38
Table 3.3: Teaching Staff Kenyatta University
Teaching Staff Schools
Designation S.E S.B SAHS SHSS Total
Full Professors 10 0 1 9 20
Associate Professors 7 1 3 24 35
Senior Lecturers 24 2 8 34 68
Lecturers 62 14 16 53 145
Assistant Lecturers 6 22 9 5 42
Tutorial Fellows 29 11 16 26 82
Total 138 50 53 151 392 Researcher: 2012.
Table 3.4: Non-Teaching Staff
Category/Work
Station I/II III/IV A/B C/D E/F 11 AS SAR DR R F.O Total
Total No. of Staff 230 627 246 177 120 22 68 38 15 3 1 1547
Researcher: 2012.
From the selected sample population of 659 employees comprising 392 teaching and 267 non-
teachings staff, a stratified random sampling method was used to get a total sample size of 79.
The tables below summarize the sample sizes for each category of the staff:-
Table 3.5: Sample size for the teaching staff
Designation S.E S.B SAHS SHSS Population Sampling
Method
Sample
size
Full Professor 10 0 1 9 20 Simple Random 10
Associate Professor 7 1 3 24 35 Simple Random 4
Senior Lecturer 24 2 8 34 68 Simple Random 7
Lecturer 62 14 16 53 145 Simple Random 15
Assistant Lecturer 6 22 9 5 42 Simple Random 4
Tutorial Fellow 29 11 16 26 82 Simple Random 8
Total 138 50 53 151 392 48
N.B- The excess in the sample resulted from non-random sampling. Researcher: 2012.

39
There are 12 non-teaching staff categories from grade I/II to F.O making a total population of
1547 (Table 4) The grades reflect the seniority of the staff (Kenyatta University Strategic
Vision Plan, 2005-2015) from the non-teaching population, 267 were sampled representing
17% of the most senior non-teaching staff per category and grade. The table below shows the
sample size selected from the sample category;
Table 3.6: Sample size for non-teaching staff
Category/Work Station E/F 11 AS SAR DR R F.O Total
Total No. of Staff 120 22 68 38 15 3 1 267
Sample Size 12 2 7 4 2 3 1 31
Sampling method S.R S.R S.R S.R S.R P.S P.S
N.B- The excess in the sample resulted from non-random sampling. Researcher: 2012.
Table 3.7: Strathmore University
Staff Number Sample
Academic Staff 233 23
Administration and Support staff 205 21
Totals 438 44
Table 3.8: Catholic University of East Africa
Staff Number Sample
Academic staff 49 5
Research Staff 5 5
Faculty Heads 6 6
Total 60 16
N/B: The excess in the sample resulted from non random sampling. Researcher, 2012
40
3.5. Data Collection and Collection Instrument
A Questionnaire was administered in this study and both the open ended and closed questions
were included. The questionnaire had structured questions, consisting eight sections namely:
’A’, ‘B’, ‘C’, ‘D’, and ‘E’. The sections represent the variables that were tested. The sequence
of the questions was designed to be random in nature to preclude any guessing of the
underlying factors sought. The Questionnaire used in this study is appended on this research
project report. Most of the structured questions were close-ended and respondents were asked
to mark the appropriate numeral matching the correct answer. The questions were rated on a
scale of 1-5 to help establish the extent to which respondents were aware of the aspects being
studied i.e. the extent of influence that ISO 9001 Quality Management System certification
has to their Universities’ Competitive Advantage. Before the actual data collection, the
researcher collected an introductory letter from the Office of the Vice-Chancellor to the
sampled Universities. The letters and questionnaires were dropped at the respective
universities and later picked after they were filled.
3.6. Operationalization of Variables
This shows the choice of specific procedures that resulted in representing concepts of interest.
The dependent variable is the competitive advantage that universities attain when they are
ISO 9001 QMS certified. ISO 9001 QMS is the independent variable. The extent to which the
universities that are ISO 9001 QMS certified had increased the number of students enrolled;
had changed the degree (high or low) on customer perception and image, increase in the
number of research proposals, and progress in rank for the universities (Current Rank). This
was measured using the Likert scale of 1-5 in close ended questions to the respondents. The
table 3.9 shows the operations that were carried out on the variables.
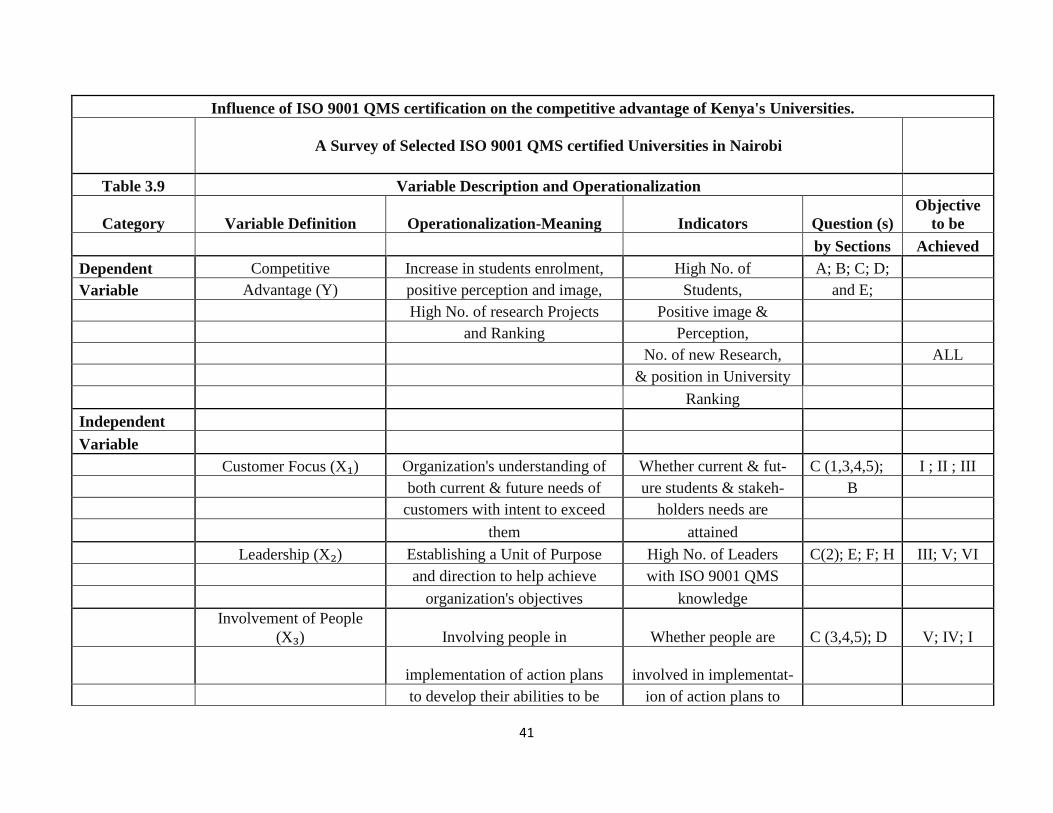
41
Influence of ISO 9001 QMS certification on the competitive advantage of Kenya's Universities.
A Survey of Selected ISO 9001 QMS certified Universities in Nairobi
Table 3.9 Variable Description and Operationalization
Category Variable Definition Operationalization-Meaning Indicators Question (s)
Objective
to be
by Sections Achieved
Dependent Competitive Increase in students enrolment, High No. of A; B; C; D;
Variable Advantage (Y) positive perception and image, Students, and E;
High No. of research Projects Positive image &
and Ranking Perception,
No. of new Research, ALL
& position in University
Ranking
Independent
Variable
Customer Focus (X₁) Organization's understanding of Whether current & fut- C (1,3,4,5); I ; II ; III
both current & future needs of ure students & stakeh- B
customers with intent to exceed holders needs are
them attained
Leadership (X₂) Establishing a Unit of Purpose High No. of Leaders C(2); E; F; H III; V; VI
and direction to help achieve with ISO 9001 QMS
organization's objectives knowledge
Involvement of People
(X₃) Involving people in Whether people are C (3,4,5); D V; IV; I
implementation of action plans involved in implementat-
to develop their abilities to be ion of action plans to

42
used in the organization grow their abilities
Process Approach (X₄) Logical sequencing of activities No. of logical activities B; C; D; I; III;
to effectively achieve desired in ISO 9001 QMS impli-
goals mentation
Systems Approach (X₅) Identifying, understanding, and Ways and levels in D; G; B I; VII; V
managing inter-related processes which inter-related
as systems to achieve organizat- processes are managed
ion's objectives
Factual Approach(X₆) Careful analysis of information Whether decisions are D; E; G; F III; I; VI
and consequent decisions based made based on facts
on data and facts
Continuous Improvement
(X₇) Review of all the work processes No. of measures put in G; D; E; B;C I; III;
and systems to suite the ever- place to improve proce-
changing business environment sses & systems
intended to improve efficiency
Close Supplier Mutual benefits derived from No. of consistent D;F;R;C III; V; I; IV
Relationship (X₈) creation of strategic alliances or suppliers
partnerships of value to the
organization
Intervening Work Policy (X₉) Rules/principles that guide
decisions No. of policies by the B;C;D;E;F;G I; II; IV
Variables and achieve rational outcome government on
ISO 9001QMS
Training (X₁₀) Activities aimed at imparting No. of trainings done F; G; C VI; VII; II
knowledge/instructions to improve on ISO 9001 QMS
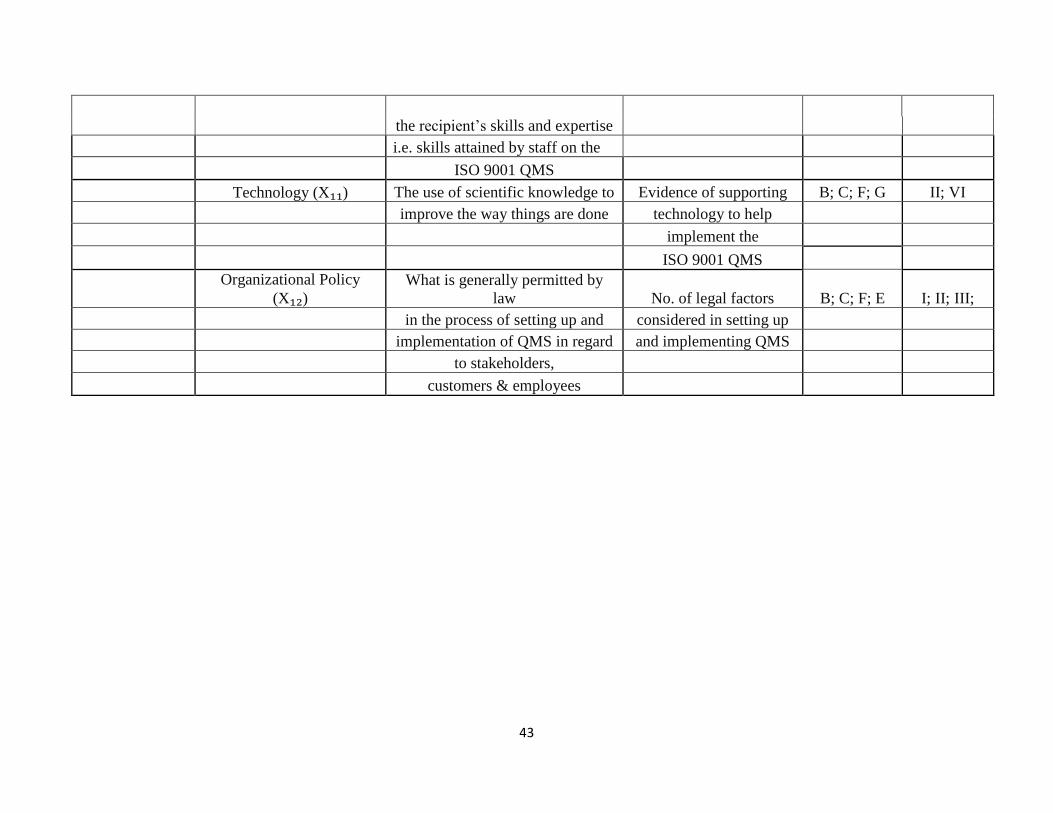
43
the recipient’s skills and expertise
i.e. skills attained by staff on the
ISO 9001 QMS
Technology (X₁₁) The use of scientific knowledge to Evidence of supporting B; C; F; G II; VI
improve the way things are done technology to help
implement the
ISO 9001 QMS
Organizational Policy
(X₁₂) What is generally permitted by
law No. of legal factors B; C; F; E I; II; III;
in the process of setting up and considered in setting up
implementation of QMS in regard and implementing QMS
to stakeholders,
customers & employees
44
3.7. Validity and Reliability
Validity is concerned with the soundness and effectiveness of the measuring instrument (Leedy,
1997). Face, content, construct, and external validity are applied in this study; therefore, the
researcher equally pilot tested 10 members of both the teaching staff and non-teaching staff from
schools other than those selected for face, content and construct validity and reliability. The
purpose of the pilot test was to ensure that all the questions are comprehensible and relevant.
External validity was based on the literature covered on ISO 9001 QMS and its influence on
competitive advantage of Universities. Reliability refers to whether the measuring instrument in
this case the questionnaire, measures what it was intended to measure (Riley et al, 2000). It is the
consistency with which the instrument performs (Leedy, 1997) and how significant the results
will be inherently ascertained in any repeated research.
3.8. Data Analysis
The researcher analyzed data using descriptive statistics including measures of central tendencies
such as mean, mode and percentages. Inferential statistics; Correlation and regression analysis
of the relationships and effects between variables was also used. This is because data collected
was both qualitative and quantitative. The data was sorted according to the sections of the
questionnaire, scored using numeric scores and entered in a codebook to determine individual
responses and represent it in tables and figures to summarize it so to help draw conclusions that
provided answers to research questions. SPSS program was used in the data processing.
The model specification is as follows
Y=α + β1X1 + β2X2 + β3X3 + β4X4 + β5X5+ β6X6+ β7X7+ β8X8+ ε.
Where;
Y= Competitive Advantage
X1= Customer Focus
X2= Leadership
X3= Involvement of People
X4= Process Approach
X5= Systems Approach
X6= Factual Approach
45
X7= Continuous Improvement, and
X8= Close Supplier Relationship
α= constant
β=coefficient
ε= error term
3.9. Data Presentation
The qualitative data is presented through a written narration while quantitative data is presented
in pie charts, bar graphs and tables. It was expected that ISO 9001 QMS certification had
influence on the growth in students’ enrolment, revenue collection, development in both
research and infrastructure, and that the perception and image of the university had positively
changed since certification.
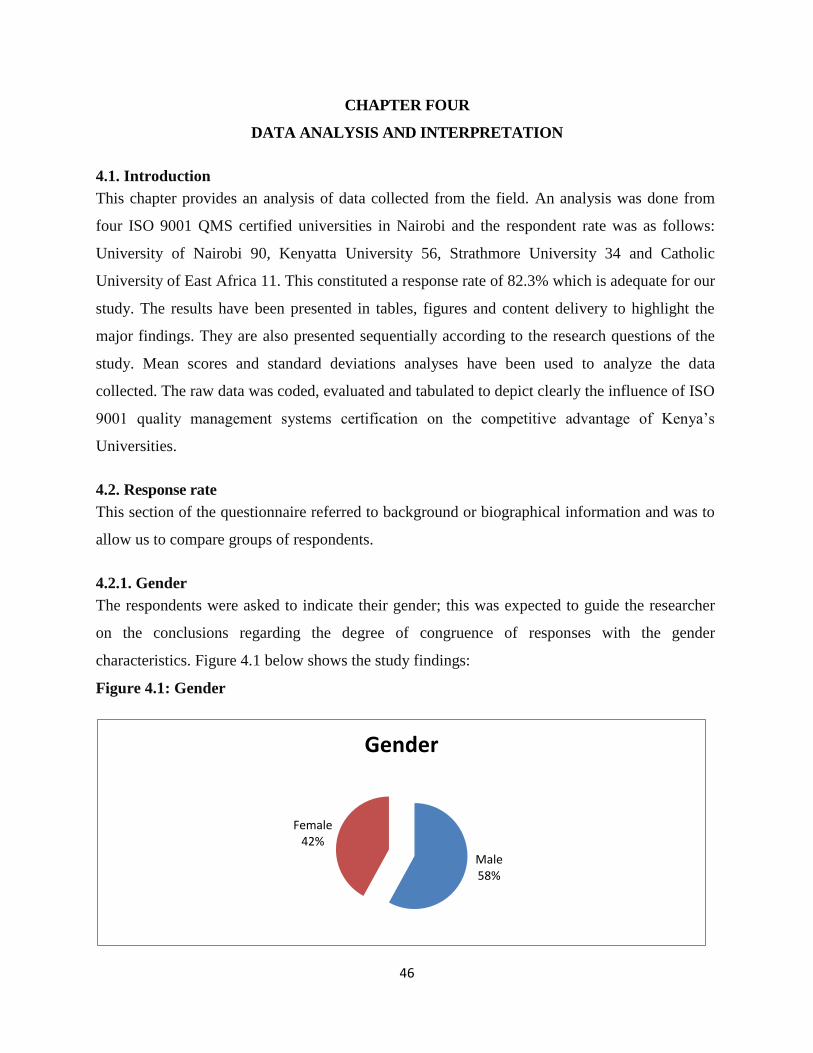
46
CHAPTER FOUR
DATA ANALYSIS AND INTERPRETATION
4.1. Introduction
This chapter provides an analysis of data collected from the field. An analysis was done from
four ISO 9001 QMS certified universities in Nairobi and the respondent rate was as follows:
University of Nairobi 90, Kenyatta University 56, Strathmore University 34 and Catholic
University of East Africa 11. This constituted a response rate of 82.3% which is adequate for our
study. The results have been presented in tables, figures and content delivery to highlight the
major findings. They are also presented sequentially according to the research questions of the
study. Mean scores and standard deviations analyses have been used to analyze the data
collected. The raw data was coded, evaluated and tabulated to depict clearly the influence of ISO
9001 quality management systems certification on the competitive advantage of Kenya’s
Universities.
4.2. Response rate
This section of the questionnaire referred to background or biographical information and was to
allow us to compare groups of respondents.
4.2.1. Gender
The respondents were asked to indicate their gender; this was expected to guide the researcher
on the conclusions regarding the degree of congruence of responses with the gender
characteristics. Figure 4.1 below shows the study findings:
Figure 4.1: Gender
Male 58%
Female 42%
Gender
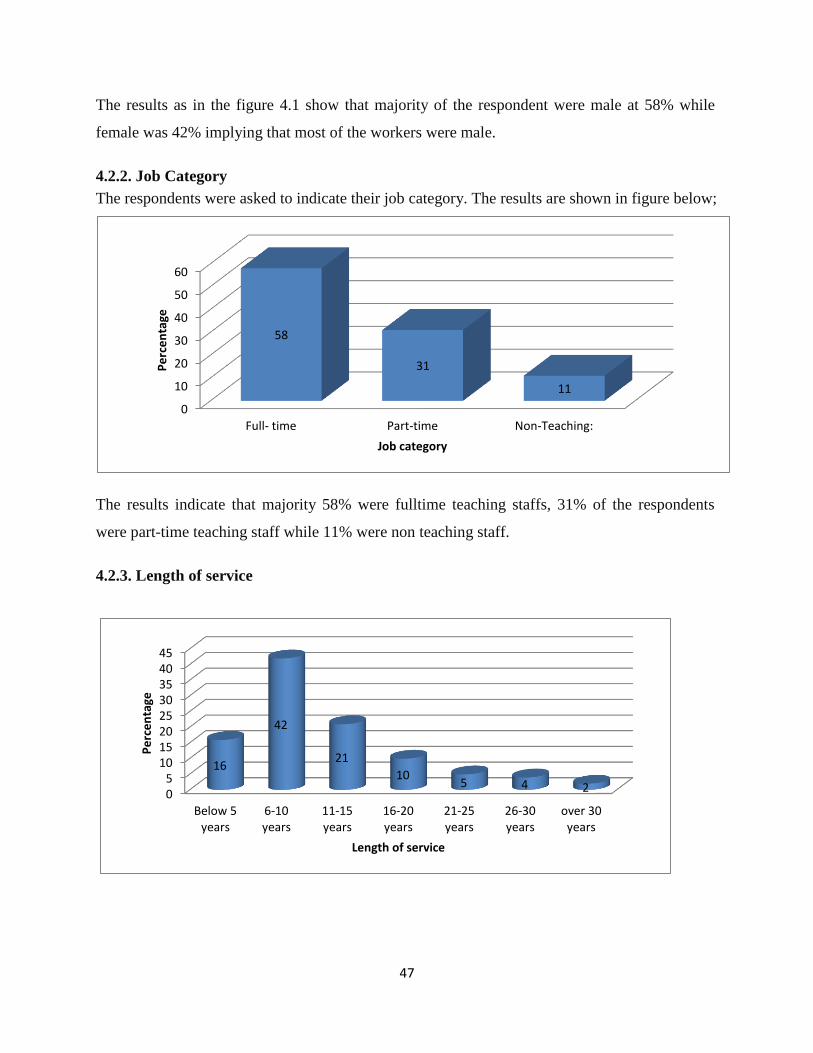
47
The results as in the figure 4.1 show that majority of the respondent were male at 58% while
female was 42% implying that most of the workers were male.
4.2.2. Job Category
The respondents were asked to indicate their job category. The results are shown in figure below;
The results indicate that majority 58% were fulltime teaching staffs, 31% of the respondents
were part-time teaching staff while 11% were non teaching staff.
4.2.3. Length of service
0
10
20
30
40
50
60
Full- time Part-time Non-Teaching:
58
31
11
Pe
rce
nta
ge
Job category
0 5
10 15 20 25 30 35 40 45
Below 5 years
6-10 years
11-15 years
16-20 years
21-25 years
26-30 years
over 30 years
16
42
21
10 5 4 2
Pe
rce
nta
ge
Length of service

48
The results indicate that majority 42% had worked for their institutions for 6-10 years, 21% had
worked for 11-15 years, and 16 % had worked for less than 5 years. Ten percent (10 %) of the
respondents indicated that they had worked for 16-20 years, 5% had worked for 21-25 years
while 2% had worked for more than 30 years.
4.2.4. Understanding of ISO 9001 Quality Management Systems certification standard
In this section the respondents were asked to rate their understanding of ISO 9001 Quality
Management Systems certification standard. The figure below shows the results;
The figure above shows that 40% of the respondents understood ISO 9001 Quality Management
Systems certification standard to a very small extent. Twenty five (25%) indicated they
understood to a moderate extent, 14% understood to a very great extent, 11% did not understand
while 10% fully understood.
4.3. Students Enrolment
This section explored the competitive factors that may have influenced any change in students’
enrolment as a result of your university being ISO 9001 QMS certified.
10 14
25
40
11
0
5
10
15
20
25
30
35
40
45
Fully To a very great extent
Moderately To very small extent
Do not Understand
Pe
rce
tage
Understanding of ISO
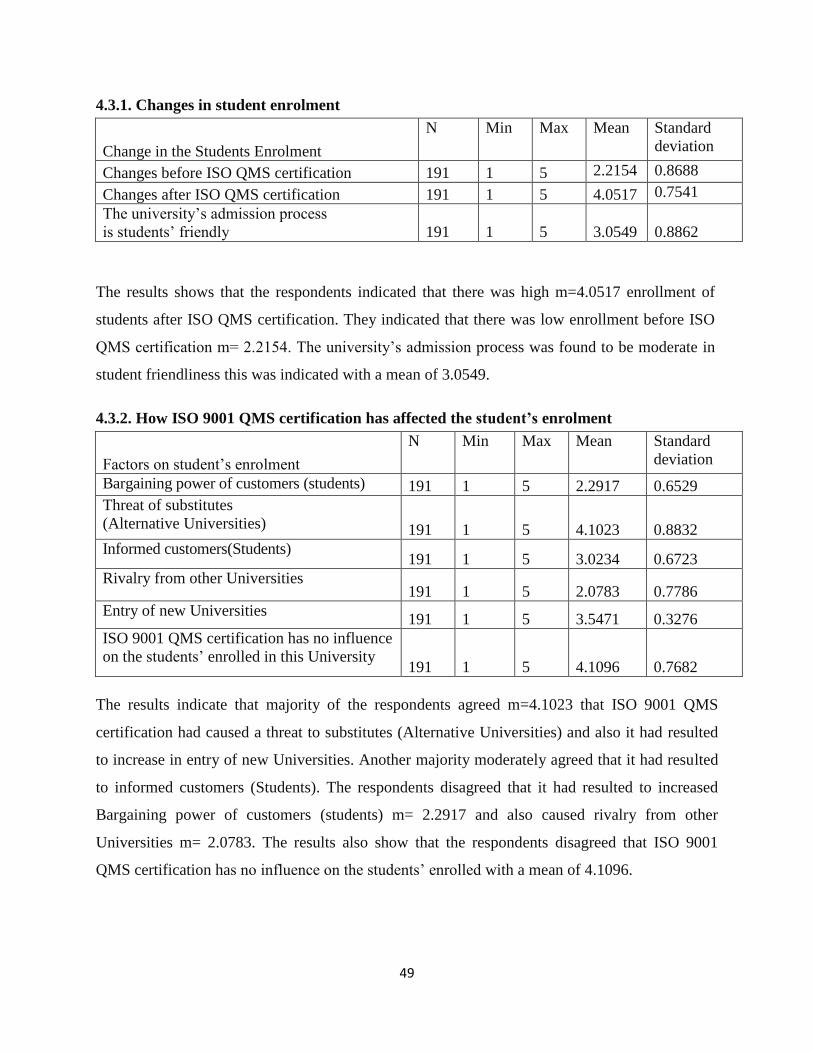
49
4.3.1. Changes in student enrolment
Change in the Students Enrolment
N Min Max Mean Standard
deviation
Changes before ISO QMS certification 191 1 5 2.2154 0.8688
Changes after ISO QMS certification 191 1 5 4.0517 0.7541
The university’s admission process
is students’ friendly 191 1 5 3.0549 0.8862
The results shows that the respondents indicated that there was high m=4.0517 enrollment of
students after ISO QMS certification. They indicated that there was low enrollment before ISO
QMS certification m= 2.2154. The university’s admission process was found to be moderate in
student friendliness this was indicated with a mean of 3.0549.
4.3.2. How ISO 9001 QMS certification has affected the student’s enrolment
Factors on student’s enrolment
N Min Max Mean Standard
deviation
Bargaining power of customers (students) 191 1 5 2.2917 0.6529
Threat of substitutes
(Alternative Universities) 191 1 5 4.1023 0.8832
Informed customers(Students) 191 1 5 3.0234 0.6723
Rivalry from other Universities 191 1 5 2.0783 0.7786
Entry of new Universities 191 1 5 3.5471 0.3276
ISO 9001 QMS certification has no influence
on the students’ enrolled in this University 191 1 5 4.1096 0.7682
The results indicate that majority of the respondents agreed m=4.1023 that ISO 9001 QMS
certification had caused a threat to substitutes (Alternative Universities) and also it had resulted
to increase in entry of new Universities. Another majority moderately agreed that it had resulted
to informed customers (Students). The respondents disagreed that it had resulted to increased
Bargaining power of customers (students) m= 2.2917 and also caused rivalry from other
Universities m= 2.0783. The results also show that the respondents disagreed that ISO 9001
QMS certification has no influence on the students’ enrolled with a mean of 4.1096.
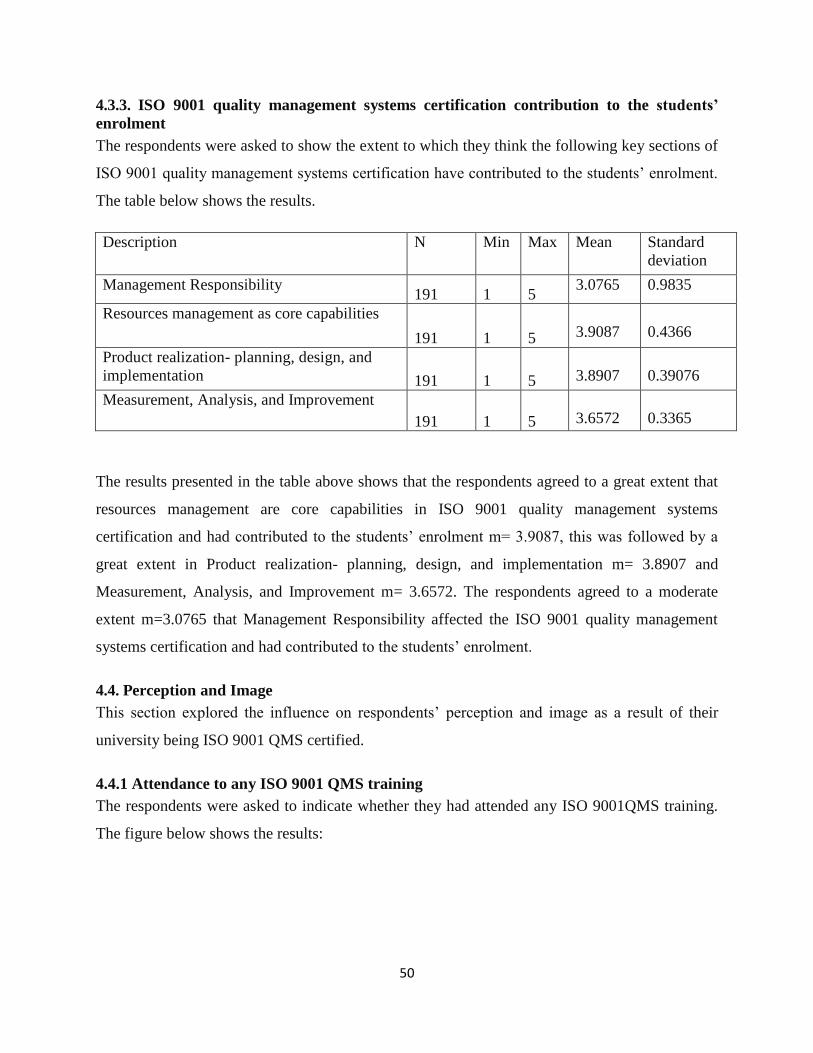
50
4.3.3. ISO 9001 quality management systems certification contribution to the students’
enrolment
The respondents were asked to show the extent to which they think the following key sections of
ISO 9001 quality management systems certification have contributed to the students’ enrolment.
The table below shows the results.
Description N Min Max Mean Standard
deviation
Management Responsibility 191 1 5
3.0765 0.9835
Resources management as core capabilities
191 1 5
3.9087
0.4366
Product realization- planning, design, and
implementation 191 1 5
3.8907
0.39076
Measurement, Analysis, and Improvement
191 1 5
3.6572
0.3365
The results presented in the table above shows that the respondents agreed to a great extent that
resources management are core capabilities in ISO 9001 quality management systems
certification and had contributed to the students’ enrolment m= 3.9087, this was followed by a
great extent in Product realization- planning, design, and implementation m= 3.8907 and
Measurement, Analysis, and Improvement m= 3.6572. The respondents agreed to a moderate
extent m=3.0765 that Management Responsibility affected the ISO 9001 quality management
systems certification and had contributed to the students’ enrolment.
4.4. Perception and Image
This section explored the influence on respondents’ perception and image as a result of their
university being ISO 9001 QMS certified.
4.4.1 Attendance to any ISO 9001 QMS training
The respondents were asked to indicate whether they had attended any ISO 9001QMS training.
The figure below shows the results:
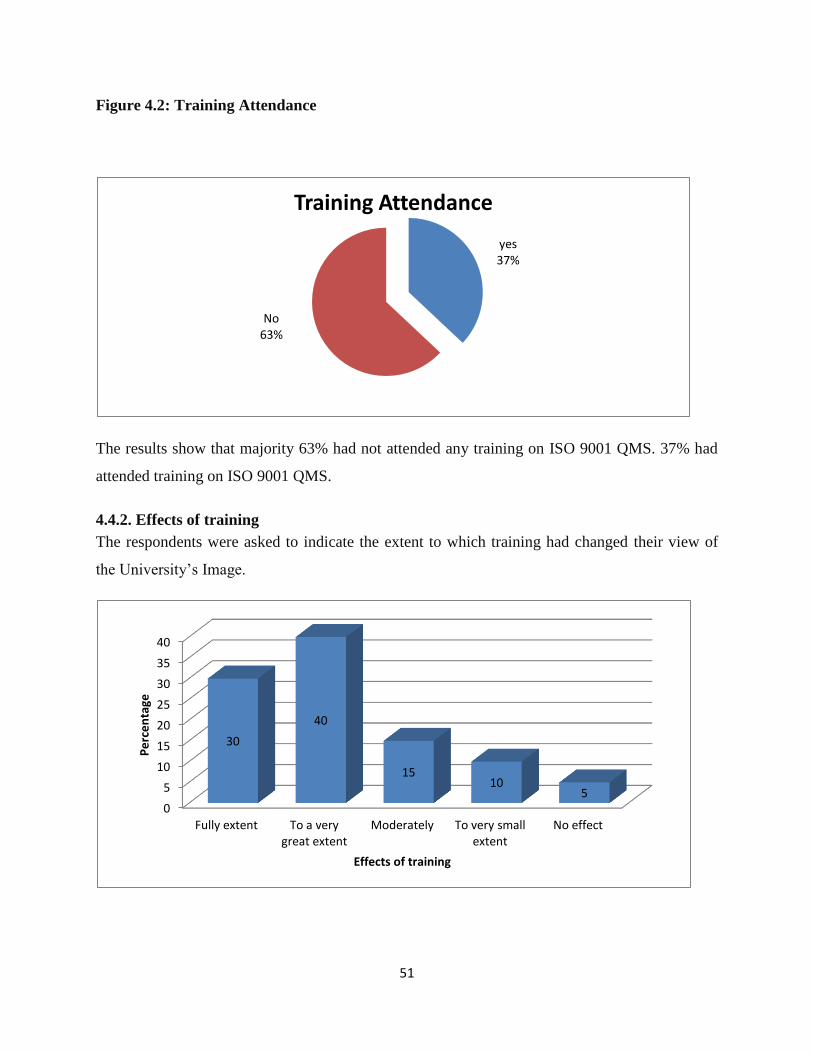
51
Figure 4.2: Training Attendance
The results show that majority 63% had not attended any training on ISO 9001 QMS. 37% had
attended training on ISO 9001 QMS.
4.4.2. Effects of training
The respondents were asked to indicate the extent to which training had changed their view of
the University’s Image.
yes 37%
No 63%
Training Attendance
0
5
10
15
20
25
30
35
40
Fully extent To a very great extent
Moderately To very small extent
No effect
30
40
15 10
5
Pe
rce
nta
ge
Effects of training

52
The results show that training had changed majority of the respondents to a very great extent
40%, 30% indicated their view had changed fully, 15 % view had changed to a moderate extent,
10% had changed to a small extent while 5% indicated training had no effect at all.
4.4.3. Image and perception of your university before and after being ISO 9001 certified
Image and perception Before % After %
Very good 10 70
Quite good 35 20
Neither good or bad 50 8
Quite bad 5 2
Total 100 100
The results show that the image before ISO 9001 QMS certification was neither good nor bad as
majority 50% indicated. 35% indicated the image and perception was quite good, 10% indicated
it was very good while 5% indicated it was quite bad. The respondents indicated that the image
and perception of the university after certification become very good (70%), 20% indicated quite
good, 8% indicated neither good or bad while 2% indicated was quite bad.
4.4.4. Review of the ISO 9001 QMS
The respondents were asked to indicate how often ISO 9001 QMS was reviewed at the
university. The results are shown below:
0
5
10
15
20
25
30
35
40
After Every 3-6 months
After every 2 Years
After every 3 Years
After Every 5 Years
10
35 40
15
Pe
rce
nta
ge
Review

53
The results show that the majority at 40% indicated that the review on the ISO 9001 QMS at the
university was done after every 3 years, 35% indicated it was reviewed after every 2 years, 15%
indicated after every 5 years while 10% indicated every 3-6 months.
4.5. Research and Development
This section explored the views of the respondents on research and development as affected by
having ISO 9001 QMS certification.
4.5.1. Effects of research and development
The respondents were asked to show the extent to which research and development had been
affected at their university since ISO 9001 QMS certification as a strategy for competitiveness.
The results are shown below:
Effects of research and development Before % After %
Extremely great extent 5 65
To a very great extent 10 20
Moderately 40 10
To very small extent 35 3
No change 10 2
100 100
The results show that research and development before ISO certification majority 40% saw
changes at a moderate extent, 35% indicated that changes were to a very small extent, 10%
indicated there were no changes and another 10% indicated changes were at a great extent while
5% indicated to an extremely great extent. After the ISO 9001 QMS certification the respondents
indicated there was changes to an extremely great extent 65%, 20% indicated to a very great
extent, 10% indicated to very small extent and No change were indicated by 3% and2%
respectively.
4.5.2. Competitive edge over other universities
The respondents were asked to indicate whether they consider their university to have a
competitive edge over other universities. The results are shown below:

54
The results show that 60% of the respondents indicated that their university was at a competitive
edge over other universities. 30% indicated that their university was not at a competitive edge
over other universities while 10% did not know where their competitive edge lied.
4.5.3. Competiveness of the Universities’ growth in Research and development
The respondents were asked to rate the importance of the following principles on the
competiveness of the university’s growth in Research and development. The results are shown
below:
Factors in consideration
N Min Max Mean Standard
deviation
University Leadership 191 1 5 4.0324 0.8101
Focus on the students 191 1 5 2.0786 0.3261
Work policy and involvement of students in
R&D 191 1 5
3.9231
0.9517
Technological development in Research
191
1
5
3.8976
0.5628 Inspection and testing records and documents
191 1 5
2.1765
0.9654 Process and Systems approaches on quality
audits 191 1 5 3.4643 0.4325
Continuous improvement 191 1 5 4.2137 0.8700
Documentation of all records and factual
approach on issues 191 1 5
3.9065
0.6251
Closer stakeholders’ relationships that foster
Corrective and preventive measures in R&D 191 1 5
4.2347
0.7112
60
30
10 0
10
20
30
40
50
60
70
Yes No Do not Know
Pe
rce
nta
ge
Competitive edge
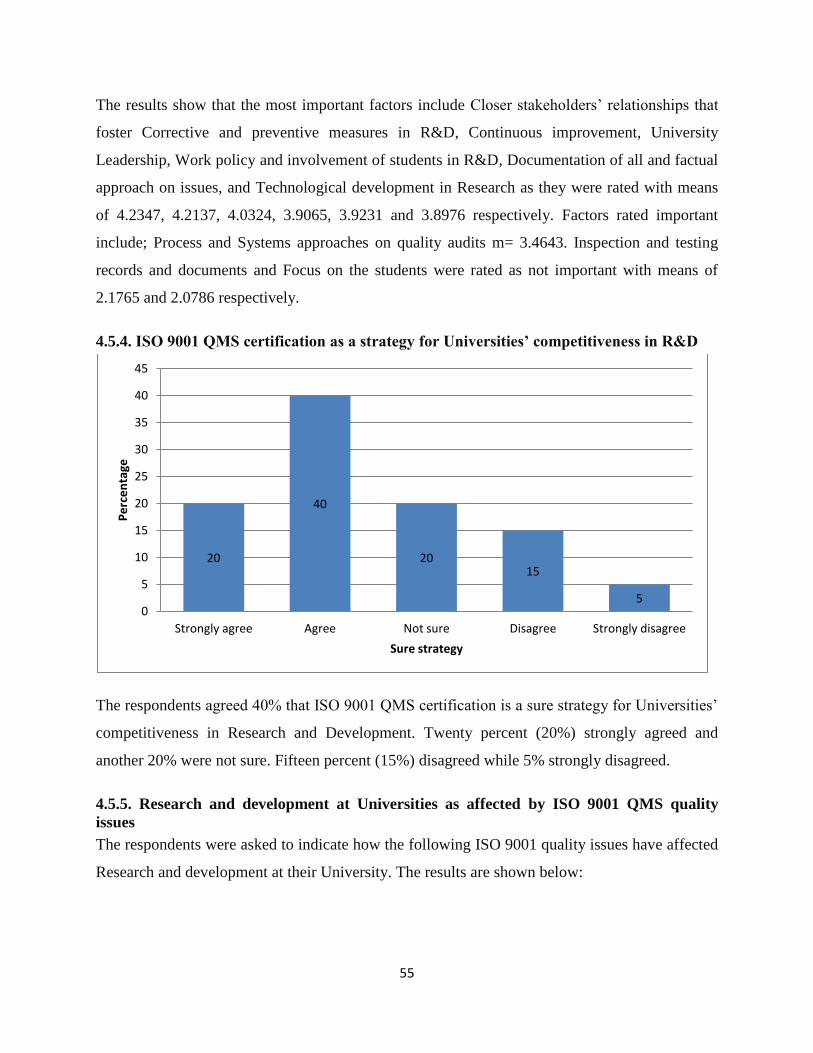
55
The results show that the most important factors include Closer stakeholders’ relationships that
foster Corrective and preventive measures in R&D, Continuous improvement, University
Leadership, Work policy and involvement of students in R&D, Documentation of all and factual
approach on issues, and Technological development in Research as they were rated with means
of 4.2347, 4.2137, 4.0324, 3.9065, 3.9231 and 3.8976 respectively. Factors rated important
include; Process and Systems approaches on quality audits m= 3.4643. Inspection and testing
records and documents and Focus on the students were rated as not important with means of
2.1765 and 2.0786 respectively.
4.5.4. ISO 9001 QMS certification as a strategy for Universities’ competitiveness in R&D
The respondents agreed 40% that ISO 9001 QMS certification is a sure strategy for Universities’
competitiveness in Research and Development. Twenty percent (20%) strongly agreed and
another 20% were not sure. Fifteen percent (15%) disagreed while 5% strongly disagreed.
4.5.5. Research and development at Universities as affected by ISO 9001 QMS quality
issues
The respondents were asked to indicate how the following ISO 9001 quality issues have affected
Research and development at their University. The results are shown below:
20
40
20 15
5 0
5
10
15
20
25
30
35
40
45
Strongly agree Agree Not sure Disagree Strongly disagree
Pe
rce
nta
ge
Sure strategy
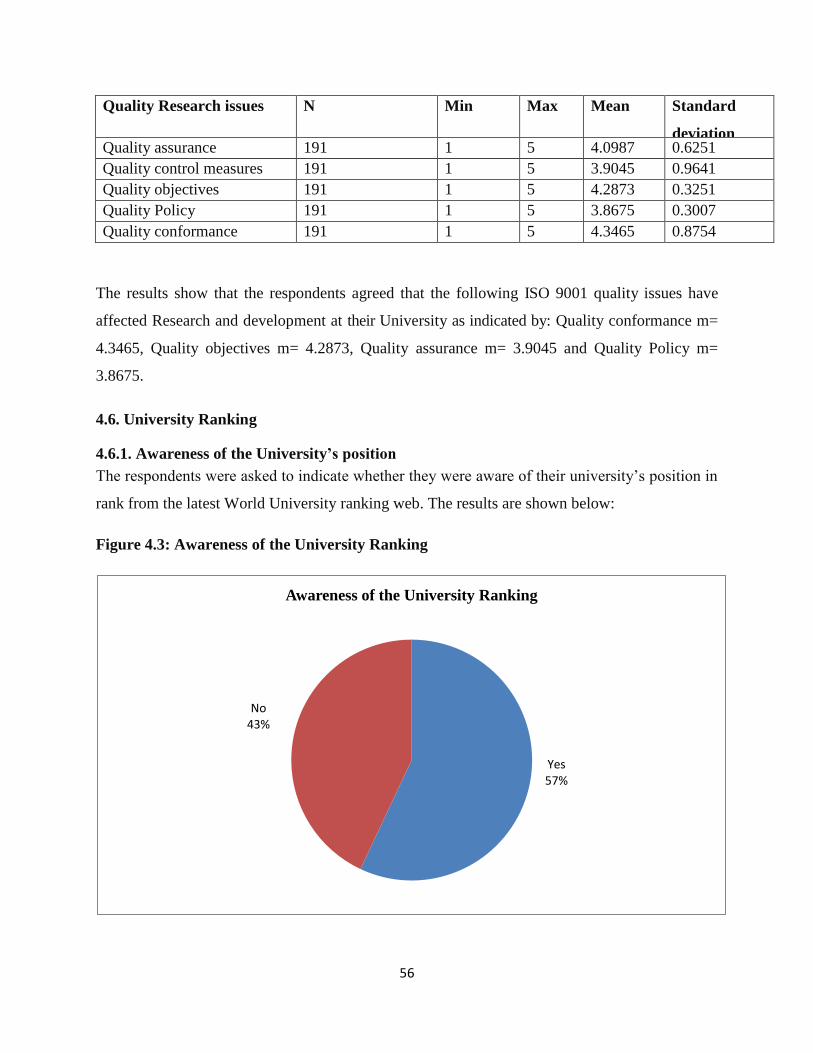
56
Quality Research issues N Min Max Mean Standard
deviation Quality assurance 191 1 5 4.0987 0.6251
Quality control measures 191 1 5 3.9045 0.9641
Quality objectives 191 1 5 4.2873 0.3251
Quality Policy 191 1 5 3.8675 0.3007
Quality conformance 191 1 5 4.3465 0.8754
The results show that the respondents agreed that the following ISO 9001 quality issues have
affected Research and development at their University as indicated by: Quality conformance m=
4.3465, Quality objectives m= 4.2873, Quality assurance m= 3.9045 and Quality Policy m=
3.8675.
4.6. University Ranking
4.6.1. Awareness of the University’s position
The respondents were asked to indicate whether they were aware of their university’s position in
rank from the latest World University ranking web. The results are shown below:
Figure 4.3: Awareness of the University Ranking
Yes 57%
No 43%
Awareness of the University Ranking
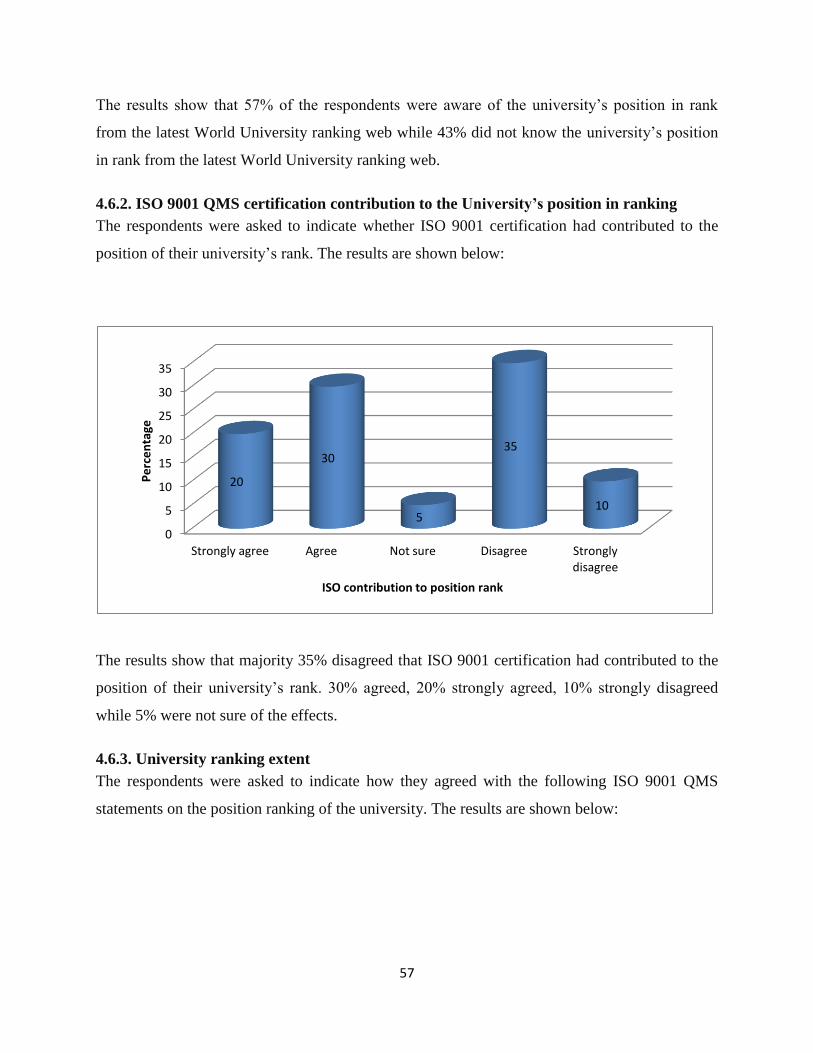
57
The results show that 57% of the respondents were aware of the university’s position in rank
from the latest World University ranking web while 43% did not know the university’s position
in rank from the latest World University ranking web.
4.6.2. ISO 9001 QMS certification contribution to the University’s position in ranking
The respondents were asked to indicate whether ISO 9001 certification had contributed to the
position of their university’s rank. The results are shown below:
The results show that majority 35% disagreed that ISO 9001 certification had contributed to the
position of their university’s rank. 30% agreed, 20% strongly agreed, 10% strongly disagreed
while 5% were not sure of the effects.
4.6.3. University ranking extent
The respondents were asked to indicate how they agreed with the following ISO 9001 QMS
statements on the position ranking of the university. The results are shown below:
0
5
10
15
20
25
30
35
Strongly agree Agree Not sure Disagree Strongly disagree
20
30
5
35
10
Pe
rce
nta
ge
ISO contribution to position rank

58
Factors in consideration
N Min Max Mean Standard
deviation
1. Being Customer focused changed the university’s
rank
191 1 5 2.3532 0.9213
2. Leadership abilities affected the retention levels and
the University ranking
191 1 5 3.6753 0.8412
3. Involvement of people and Knowledge of the
university through peers increases its credibility
191 1 5 4.0785 0.3214
4. Process approach in Selection and admission of
students process affect university rank
191 1 5 4.2643 0.5412
5. Systems approach and stronger Financial
capabilities affected the rank
191 1 5 4.5763 0.8791
6. Factual considerations and better faculty resources
e.g. class size influences the ranking
191 1 5 4.5397 0.8651
7. Continuous Improvements attracts more Alumni
giving rate and affect ranking
191 1 5 4.0653 0.3265
8. Closer relations with stakeholders increase
performance and affects the rank
191 1 5 4.3098 0.5554
9. Research output-projects and proposals influences
the rank
191 1 5 2.3987 0.4124
10. Growth in Technology ranks the university highly 191 1 5 4.3510 0.8647
The results show that the following principles were strongly agreed on University rank which is
increased by Systems approach and stronger Financial capabilities m= 4.5763 and Factual
considerations and better faculty resources e.g. class size influences the ranking m= 4.5397. they
agreed on the following factors; Closer relations with stakeholders increased performance and
affected the rank m= 4.3098; Growth in Technology ranks the university highly m= 4.3510;
Process approach in Selection and admission of students affected university rank m=4.2643;
Involvement of people and Knowledge of the university through peers increased its credibility
m= 4.0785; Continuous Improvements attracted more Alumni giving rate and affected the
ranking m= 4.0653 and Leadership abilities affected the retention levels and the University
ranking m= 3.6753. The respondents disagreed that Being Customer focused changed the
university’s rank m= 2.3532 and Research output-projects and proposals influenced the rank m=
2.3987.
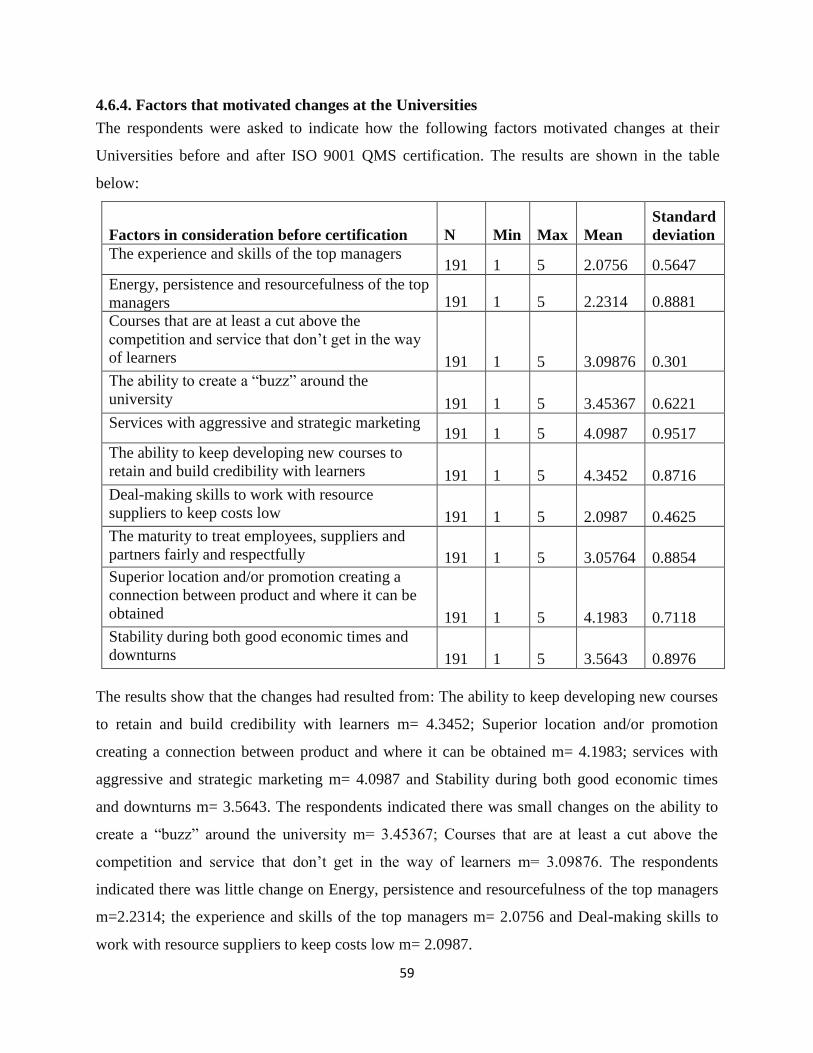
59
4.6.4. Factors that motivated changes at the Universities
The respondents were asked to indicate how the following factors motivated changes at their
Universities before and after ISO 9001 QMS certification. The results are shown in the table
below:
Factors in consideration before certification N Min Max Mean
Standard
deviation
The experience and skills of the top managers 191 1 5 2.0756 0.5647
Energy, persistence and resourcefulness of the top
managers 191 1 5 2.2314 0.8881
Courses that are at least a cut above the
competition and service that don’t get in the way
of learners 191 1 5 3.09876 0.301
The ability to create a “buzz” around the
university 191 1 5 3.45367 0.6221
Services with aggressive and strategic marketing 191 1 5 4.0987 0.9517
The ability to keep developing new courses to
retain and build credibility with learners 191 1 5 4.3452 0.8716
Deal-making skills to work with resource
suppliers to keep costs low 191 1 5 2.0987 0.4625
The maturity to treat employees, suppliers and
partners fairly and respectfully 191 1 5 3.05764 0.8854
Superior location and/or promotion creating a
connection between product and where it can be
obtained 191 1 5 4.1983 0.7118
Stability during both good economic times and
downturns 191 1 5 3.5643 0.8976
The results show that the changes had resulted from: The ability to keep developing new courses
to retain and build credibility with learners m= 4.3452; Superior location and/or promotion
creating a connection between product and where it can be obtained m= 4.1983; services with
aggressive and strategic marketing m= 4.0987 and Stability during both good economic times
and downturns m= 3.5643. The respondents indicated there was small changes on the ability to
create a “buzz” around the university m= 3.45367; Courses that are at least a cut above the
competition and service that don’t get in the way of learners m= 3.09876. The respondents
indicated there was little change on Energy, persistence and resourcefulness of the top managers
m=2.2314; the experience and skills of the top managers m= 2.0756 and Deal-making skills to
work with resource suppliers to keep costs low m= 2.0987.
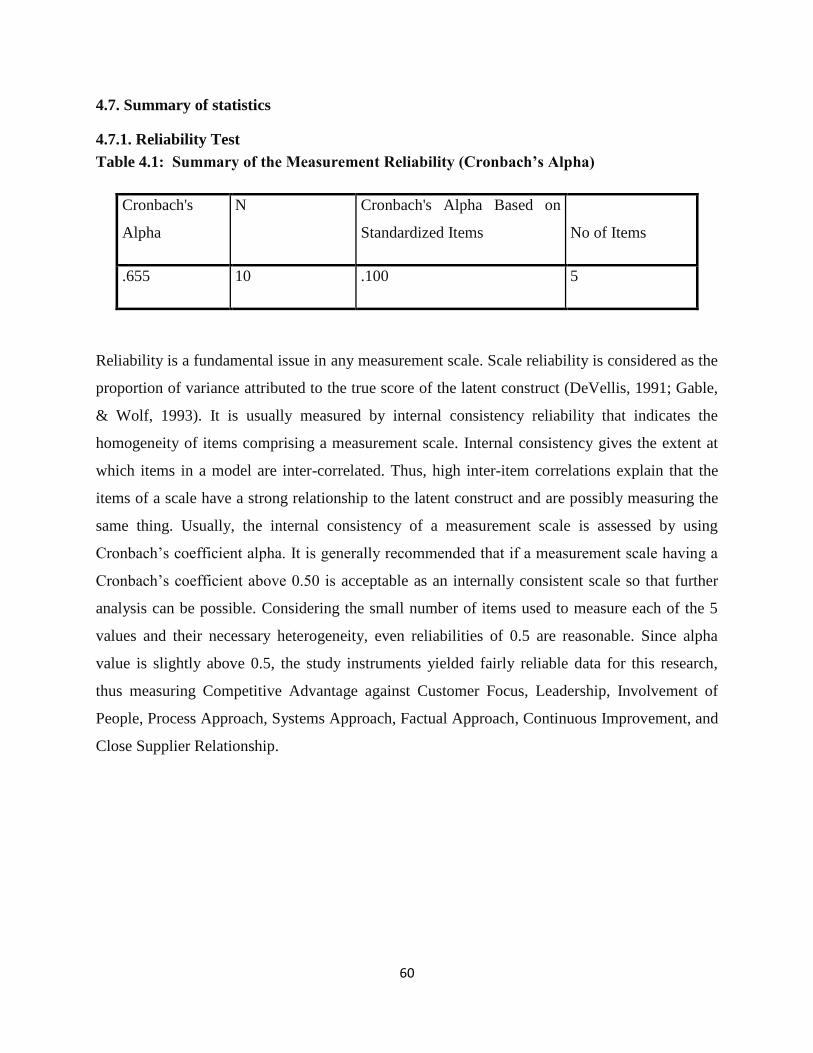
60
4.7. Summary of statistics
4.7.1. Reliability Test
Table 4.1: Summary of the Measurement Reliability (Cronbach’s Alpha)
Cronbach's
Alpha
N Cronbach's Alpha Based on
Standardized Items No of Items
.655 10 .100 5
Reliability is a fundamental issue in any measurement scale. Scale reliability is considered as the
proportion of variance attributed to the true score of the latent construct (DeVellis, 1991; Gable,
& Wolf, 1993). It is usually measured by internal consistency reliability that indicates the
homogeneity of items comprising a measurement scale. Internal consistency gives the extent at
which items in a model are inter-correlated. Thus, high inter-item correlations explain that the
items of a scale have a strong relationship to the latent construct and are possibly measuring the
same thing. Usually, the internal consistency of a measurement scale is assessed by using
Cronbach’s coefficient alpha. It is generally recommended that if a measurement scale having a
Cronbach’s coefficient above 0.50 is acceptable as an internally consistent scale so that further
analysis can be possible. Considering the small number of items used to measure each of the 5
values and their necessary heterogeneity, even reliabilities of 0.5 are reasonable. Since alpha
value is slightly above 0.5, the study instruments yielded fairly reliable data for this research,
thus measuring Competitive Advantage against Customer Focus, Leadership, Involvement of
People, Process Approach, Systems Approach, Factual Approach, Continuous Improvement, and
Close Supplier Relationship.
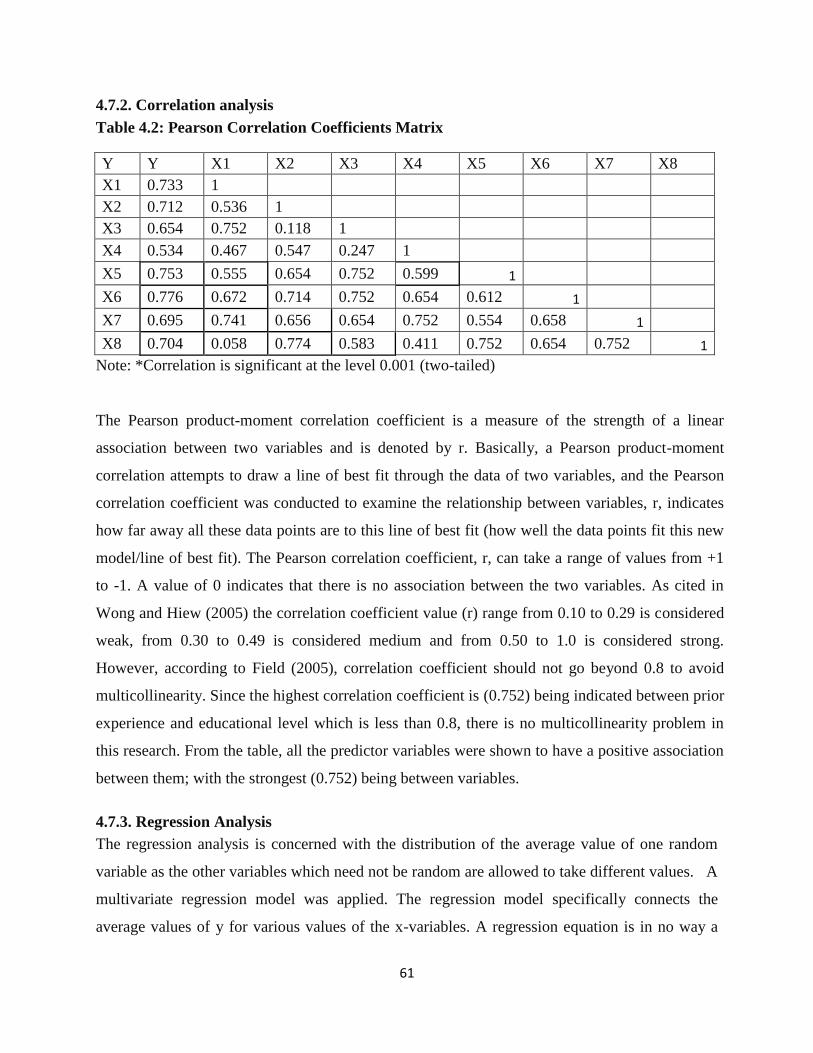
61
4.7.2. Correlation analysis
Table 4.2: Pearson Correlation Coefficients Matrix
Y Y X1 X2 X3 X4 X5 X6 X7 X8
X1 0.733 1
X2 0.712 0.536 1
X3 0.654 0.752 0.118 1
X4 0.534 0.467 0.547 0.247 1
X5 0.753 0.555 0.654 0.752 0.599 1
X6 0.776 0.672 0.714 0.752 0.654 0.612 1
X7 0.695 0.741 0.656 0.654 0.752 0.554 0.658 1
X8 0.704 0.058 0.774 0.583 0.411 0.752 0.654 0.752 1
Note: *Correlation is significant at the level 0.001 (two-tailed)
The Pearson product-moment correlation coefficient is a measure of the strength of a linear
association between two variables and is denoted by r. Basically, a Pearson product-moment
correlation attempts to draw a line of best fit through the data of two variables, and the Pearson
correlation coefficient was conducted to examine the relationship between variables, r, indicates
how far away all these data points are to this line of best fit (how well the data points fit this new
model/line of best fit). The Pearson correlation coefficient, r, can take a range of values from +1
to -1. A value of 0 indicates that there is no association between the two variables. As cited in
Wong and Hiew (2005) the correlation coefficient value (r) range from 0.10 to 0.29 is considered
weak, from 0.30 to 0.49 is considered medium and from 0.50 to 1.0 is considered strong.
However, according to Field (2005), correlation coefficient should not go beyond 0.8 to avoid
multicollinearity. Since the highest correlation coefficient is (0.752) being indicated between prior
experience and educational level which is less than 0.8, there is no multicollinearity problem in
this research. From the table, all the predictor variables were shown to have a positive association
between them; with the strongest (0.752) being between variables.
4.7.3. Regression Analysis
The regression analysis is concerned with the distribution of the average value of one random
variable as the other variables which need not be random are allowed to take different values. A
multivariate regression model was applied. The regression model specifically connects the
average values of y for various values of the x-variables. A regression equation is in no way a
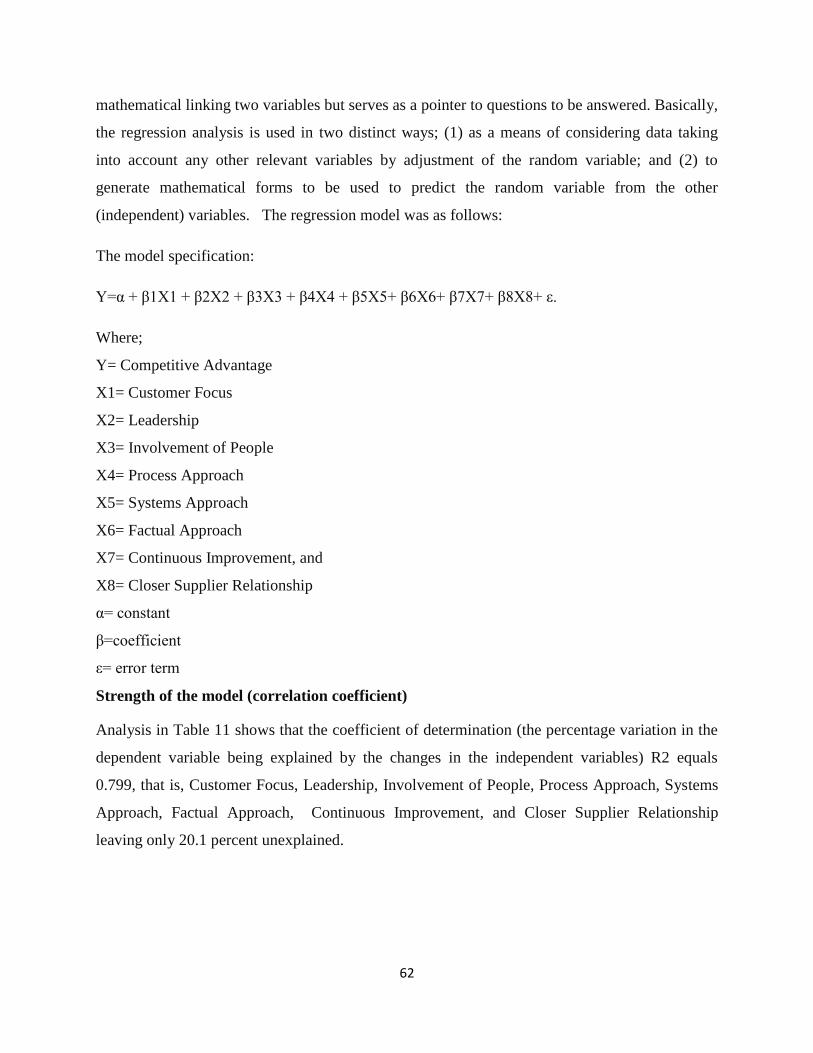
62
mathematical linking two variables but serves as a pointer to questions to be answered. Basically,
the regression analysis is used in two distinct ways; (1) as a means of considering data taking
into account any other relevant variables by adjustment of the random variable; and (2) to
generate mathematical forms to be used to predict the random variable from the other
(independent) variables. The regression model was as follows:
The model specification:
Y=α + β1X1 + β2X2 + β3X3 + β4X4 + β5X5+ β6X6+ β7X7+ β8X8+ ε.
Where;
Y= Competitive Advantage
X1= Customer Focus
X2= Leadership
X3= Involvement of People
X4= Process Approach
X5= Systems Approach
X6= Factual Approach
X7= Continuous Improvement, and
X8= Closer Supplier Relationship
α= constant
β=coefficient
ε= error term
Strength of the model (correlation coefficient)
Analysis in Table 11 shows that the coefficient of determination (the percentage variation in the
dependent variable being explained by the changes in the independent variables) R2 equals
0.799, that is, Customer Focus, Leadership, Involvement of People, Process Approach, Systems
Approach, Factual Approach, Continuous Improvement, and Closer Supplier Relationship
leaving only 20.1 percent unexplained.
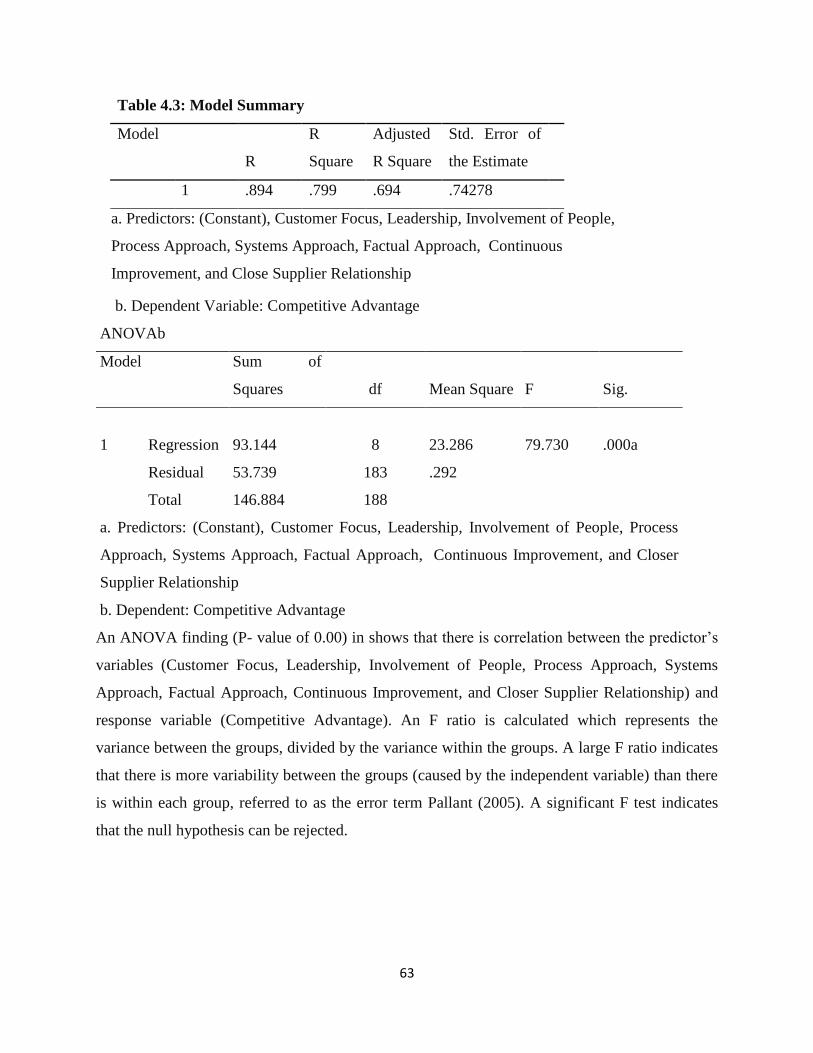
63
Table 4.3: Model Summary
Model
R
R
Square
Adjusted
R Square
Std. Error of
the Estimate
1 .894 .799 .694 .74278
a. Predictors: (Constant), Customer Focus, Leadership, Involvement of People,
Process Approach, Systems Approach, Factual Approach, Continuous
Improvement, and Close Supplier Relationship
b. Dependent Variable: Competitive Advantage
ANOVAb
Model Sum of
Squares df Mean Square F Sig.
1 Regression 93.144 8 23.286 79.730 .000a
Residual 53.739 183 .292
Total 146.884 188
a. Predictors: (Constant), Customer Focus, Leadership, Involvement of People, Process
Approach, Systems Approach, Factual Approach, Continuous Improvement, and Closer
Supplier Relationship
b. Dependent: Competitive Advantage
An ANOVA finding (P- value of 0.00) in shows that there is correlation between the predictor’s
variables (Customer Focus, Leadership, Involvement of People, Process Approach, Systems
Approach, Factual Approach, Continuous Improvement, and Closer Supplier Relationship) and
response variable (Competitive Advantage). An F ratio is calculated which represents the
variance between the groups, divided by the variance within the groups. A large F ratio indicates
that there is more variability between the groups (caused by the independent variable) than there
is within each group, referred to as the error term Pallant (2005). A significant F test indicates
that the null hypothesis can be rejected.

64
Table 4.4: Coefficients of regression equation
Coefficientsa
Model Unstandardized
Coefficients
Standardized
Coefficients
t Sig. B Std. Error Beta
1 (Constant) .240 .258 .930 .354
X1 .294 .077 .297 3.98 .001
X2 .230 .070 .188 3.90 .000
X3 .013 .062 .013 .215 .000
X4 .421 .073 .406 5.45 .000
X5 .314 .077 .297 3.78 .001
X6 .233 .070 .181 3.20 .002
X7 .213 .061 .03 .215 .001
X8 .421 .077 .406 5.44 .000
b. Dependent Variable: Competitive Advantage
Predictors: (Constant), Customer Focus, Leadership, Involvement of People, Process Approach,
Systems Approach, Factual Approach, Continuous Improvement, and Closer Supplier
Relationship. The established multiple linear regression equation becomes:
Y = 0.240 + 0.294X1 + 0.230X2 + 0.013X3 + 0.421X4 + 0.314X5 + 0.233X6 + 0.213X7 +
0.321X8
Where
Constant = 0.240, shows that if Predictors: (Constant), Customer Focus, Leadership,
Involvement of People, Process Approach, Systems Approach, Factual Approach, Continuous
Improvement, and Closer Supplier Relationship are all rated as zero, Enterprise Performance
would be 0.240
X1= 0.294, shows that one unit change in customer focus results in 0.294 units increase in.
Competitive Advantage
65
X2= 0.230, shows that one unit change in leadership results in 0.230 units increase in
Competitive Advantage
X3= 0.013, shows that one unit change in prior experience results in 0.013 units increase in
Competitive Advantage
X4= 0.421, shows that one unit change in networking results in 0.421 units increase in
Competitive Advantage
X5= 0.314, shows that one unit change in Systems Approach results in 0.314 units increase in
Competitive Advantage
X6= 0.233, shows that one unit change in Factual Approach results in 0.233 units increase in
Competitive Advantage
X7= 0.213, shows that one unit change in Continuous Improvement Close Supplier results in
0.213 units increase in Competitive Advantage
X8= 0.321, shows that one unit change in Relationship results in 0.421 units increase in
Competitive Advantage
66
CHAPTER FIVE
SUMMARY, CONCLUSIONS AND RECOMMENDATIONS
5.1. Introduction
This chapter presents summary of findings as discussed in chapter four and interpretations of the
data analysis, conclusions and recommendations based on the findings.
5.2. Summary of findings
ISO 9001 series standards provide clear guidelines for the top management of an institution or
university to improve the effectiveness of their education system. Just like the thousands of
organizations who have realized the benefits of international quality standards and embraced
them in the drive for competitiveness, there are more and more colleges and universities in the
process of seeking ISO 9001 registration in order to improve the educational quality through a
better quality management system.
Despite the growing popularity of ISO 9001 as an international quality standard, there is still in
many quarters a profound lack of knowledge of the standard. Except for those who have
substantial training in the standard, there are many misconceptions about the standard, the
purpose and its limitations. The misconceptions are most obvious in the studies carried out as
majority of the respondents did not know how ISO 9001 QMS affects their institution. There was
a stupendous lack of knowledge of the standard which gave rise to anxieties and a mimetic
approach to certification which forced the faculties into an inflexible and bureaucratic
management system. Although ISO 9001 QMS is gaining momentum in all industries including
the educational sector, the knowledge of the standard and its elements is still low. There are
many misconceptions about what the standard is and what needs to be done to secure
certification. It is because of this poor and distorted state of knowledge of the standard, the
consultants are doing brisk business assisting clients to develop quality systems that meet the
requirements. The business press, the consultants and the rather short generic standard have
engendered many half truths. The findings are presented below based on the objectives of this
study:

67
5.2.1. Students’ enrolment
The research findings show that there was high students’ enrolment after universities’ ISO 9001
QMS certification coupled with high resource management core capabilities and a low enrolment
before ISO 9001 QMS certification. In other words, ISO 9001 QMS certification directly affects
the students’ enrolment. Quality higher education is a performance indicator relevant to a
growing economy. As noted, expansion in students’ enrolment calls for bolder quality
management systems and adopting ISO 9001 QMS is a bolder initiative by certified universities.
Kenyan institutions face demand – related challenges in terms of access and equity; quality and
relevance (Republic of Kenya, 2005b) – which are greater challenges. ISO 9001 QMS
certification is one sure strategy in an endeavor to achieving quality proportional to students’
accessibility and enrolment.
5.2.2. Perception and Image
Perceive value (of ISO 9001 QMS) is an overall cognitive assessment of the utility or value of
ISO 9001 QMS certification in education. The cognitive predisposition of individuals toward
new systems and technologies has a strong bearing on their readiness to adopt and consequently,
on the success of new systems. This cognitive predisposition has been identified in many
different ways. For example, Au and Enderwick (2000) labeled it as adoption experiences and
Parasuraman (2000) called it [technology] readiness. Through direct and vicarious experiences,
people form opinions of new systems including ISO 9001 QMS. This strongly influences the
absorptive capacity of an organization with respect to new systems and technology. The more
positive the perception of ISO 9001 QMS by the academics, the more ready they will be to
accept and implement the new system.
The perception with which academics view ISO 9001 QMS impacts the general perception and
image of the university. Majority of academics are not keen on continuously training on ISO
9001 QMS even though their university had adopted the system. It remains the work of the top
management of the university to implement the standard with little support from staff a condition
that distorts information about the standard and breads negative perception about it. Those who
had attended training about ISO 9001 QMS appreciated it and their view about it had changed as
well as that of their university. Respondents indicated the need for a continuous review after

68
every three years and this could help continuous understanding and focus on the need for a
quality standard that enhances high perception and image of the universities.
5.2.3. Research and Development
Efforts of continuous improvement through defect prevention process, as presented in the series
of standards ISO 9001 QMS, helps companies achieve their objectives and meet the expectations
of their customers. Furthermore, promoting the ISO 9001 series [61] is the desire to improve
internal efficiency by reducing waste and non-value added tasks. The ISO 9001 QMS series is
seen as tangible and means that forces organizations to develop manuals and procedures that
improve organizational discipline. All these are achieved based on effective quality research and
development programs based on ISO 9001 QMS. After ISO 9001 QMS certification research and
development changed at a great extent and this helped universities to create their competitive
edge. Most respondents across the selected universities agreed that their university had a
competitive edge over others. They also noted that Closer stakeholder’ relationships that foster
Corrective and preventive measures in R&D increased the universities competitiveness. This
reinforced the idea that ISO 9001 QMS certification was actually a sure strategy for universities
to increase their competitiveness through quality conformance which respondents rated highly.
5.2.4. University Ranking
The benefits seem to be more internal than external. However, an external portrayal of express
quality is surely realized when a university competes with others and picks a higher rank as a
measure of effectiveness Shin, Toutkoushian, and Teichler (2011). It is a core benefit to the
university to be ranked. Academics have not generally been enthusiastic supporters of ISO 9001
QMS certification as it brought in unconventional and factory style audit into education. Given
the management system and culture in practice in Kenya, the academics often do not articulate
their sentiments preferring to remain silent and uninterested in the initiative. The way in which
the standard was implemented in the educational setting did not help inspire confidence in the
value of the standard. The standard calls for the processes of teaching and learning be agreed,
outlined, documented, maintained and improved. The more responsive the academics become in
adoption, training, understanding and implementation of this standard is likely to propel their
universities to higher ranks. Though the majority of respondents were aware of their university’s
69
recent ranking, a higher percentage disagreed that ISO 9001 QMS certification contributed to
their university’s ranking. With the highest mean, the respondents indicated that before
certification financial capabilities contributed more on their ranking and after certification the
ability to develop new courses and building credibility with learners were more responsible for
the changes in the ranks other than ISO 9001 QMS certification.
5.3. Conclusions
Successful organizations are distinguished by the high quality of their products, services and
processes. One reason for their success is that customers have become increasingly quality
conscious and demand such high quality standards. It is certainly true that the development and
application of a quality assurance system helps institutions to better organize and synchronize
their operations by documenting their processes, clearing out ambiguities and clearly defining
duties and responsibilities among employees and departments. This will help students/customers
derive satisfaction in the organization’s processes; service delivery and consequent increase in
customer volume/students’ enrolment. Secondly, the ever increasing internationalization of
higher education including the growth in cross-border providers has created the demand for the
mutual recognition of qualifications and higher education credits. This should be based on
certain quality standards that direct institutions towards quality research and development in
education. Therefore, a credible quality management system can enhance research and
development and help universities grow their perception and image both locally and
internationally. Finally; the universities’ students’ enrolment, change in their perception and
image, growth in research and development, and higher ranking is dependent on an effective
quality management system. There is increased awareness by customers/students about their
rights and of the value derived from educational institutions. Customers/students are demanding
good quality teaching which principally include transmission of employability skills. With this
then, there is need to worry about the relevance of the courses and programmes offered to the
market needs and the quality of delivery. In addition, other stakeholders such as government and
the public also have certain expectations of higher education institutions. Understanding of core
principles of quality underpinning the ISO 9001 QMS by the universities’ staff and continuous
updates on quality requirements will go a long way in assuring quality education that is relevant
to both students and the country.

70
5.4. Recommendations
Continual training and involvement of all staff, communication lines should always be kept open
within the institutions so that there is an ever-awareness of the goings on. It was observed that
many of the employees fail to recognize that ISO 9001 QMS implementation is a continual
process which does not end with the classes conducted by the certification team. This is mainly
because they are not subjected to further training, thus regular update and development classes
should be set-up by the certified firms. Continually seek pre and post audit advice from the
certifying body. There is a tendency among company executives and heads of institutions to
ignore consultation of the accreditation body when problems arise beyond the implementation
phase. This is perhaps a result of the desire to avoid consultation costs but certainly the costs of
erratic maintenance will outweigh those of consultation and all possible benefit will be eroded.
ISO 9001:2008 QMS certification is designed to work internally for external quality assurance.
The clauses of ISO 9001:2008 certification should clearly explain timely spans to the human
resources of the Institutions. ISO 9001:2008 Certification should be considered as the beginning
of a continuous process rather than a goal to achieve. So continuous improvement process like 5s
program, Kaizen etc should be used together with ISO 9001 QMS to improve the quality of the
Institutions. Generally, part time teachers are used to coming to take classes and don’t bother
about the ISO 9001 QMS matter which also cause less effectiveness on quality matters. The
awareness of ISO 9001:2008 certification should not be limited to limited personalities within
the organization but to all staff for instance most quality manuals of Universities are not
accessible to most workers and their availability is limited to a few. This limits the spread of
interest in quality aspects in the organization. A printed quality policy alone at notice boards is
not enough in enforcing quality understanding in universities.
The value of quality management systems, according to the ISO 9001QMS standard, depends on
the way they are implemented. The performance of quality management systems can improve, if
companies diligently adopt the new standard rather than attempt to incorporate it into the existing
quality management systems. Leadership style also influences performance. Leadership styles
that support the implementation of ISO 9001 QMS are empowerment and contingent rewards. It
suggests a knowledge creating model for ISO 9001:2008 that an organization can use to gain the
71
knowledge needed to enhance quality and performance; it also provides a prepared framework
for ordering and structuring an organization’s knowledge.
5.5 Suggestion for Further Studies
Further studies need to focus on ISO 9001 QMS acceptance and the moderating effect of the
implementation strategy in Kenya’s Universities. The more universities come to reality in
developing relevant courses to both students and the country, adopting to change is paramount.
The challenges of globalization catapulted by information technology cannot be met with quality
courses only but a more strategically oriented leadership and management systems (Avdjieva &
Wilson, 2002). Innovative changes to leadership and management systems lies at the heart of the
changes expected in the universities (Mok, 2005). ISO 9001 QMS offers innovative approaches
to ensuring quality and relevance in the ever changing global environment. Its acceptance and
implementation will create a basis on which quality in education will be sustained meeting not
only short-term interests of the institutions but long-term interests too.
72
REFERENCES
Arnoldina Pabedinskaitė and Romualdas Vitkauskas. (2011). The Implementation of
QualityManagement Principles in Lithuanian Enterprises. Department of Economics and
Management: Vol. 16. Vilnius Gediminas Technical University, Lithuania.
Au, Alan Kai-ming and Enderwick, Peter (2000). A cognitive model on attitude towards
technology adoption. Research Paper. The Journal of Managerial Psychology.
MCB UP Ltd.
Avdjieva, M., & Wilson, M. (2002). Exploring development of quality in higher education.
Managing Service Quality. Emerald Group Publishing Limited
Basu, R. (2004). Implementing quality. Cornwall: Thomson Learning.
Baranzeli .D. John. (2009). Making Government Great Again. Mapping the Road to Success
with ISO 9001:2008. ASQ Press. Milwaukee, Wisconsin.
Barney Jay. (1991). The Special Theory Forum: The Resource Based Model of the firm: Origins,
Implications, and Prospects. Journal of Management, Vol. 17.1, pp 97-98.
Bolton Andrew. (1999). Quality Management Systems for the Food Industry: A guide to ISO
9001/2. An Aspen Publication.
British Quality Foundation (2000). The Model in Practice: Using the EFQM Excellence Model
to Deliver Continuous Improvement. British Quality Foundation
Brown Graham Mark. (2008). Baldrige Award Winning Quality: How to Interpret the Baldrige
Criteria for Performance Excellence. 17th Edition. Productivity Press.
Burnes, B. (2004). Managing Change, 4th Edition, IT/Prentice-Hall, Harlow. CasadesuÂs, M.,
Heras, I. and Ochoa, C. (2000). ``The benefits of the implementation of the ISO 9000
normative. Empirical research in the Spanish companies’’, paper presented at the First
World Conference on Production and Operations Management, Seville.
Carsons E. Bryce et al. (2004). Quality Management Systems for Assisted Reprocutive
Technology. Informa Healthcare, Taylor and Francis, UK.
Chembers K. Dennis (2008). Toyota. The Corporations that changed the World). Greenwood.
Cheng, Y.C., Tam, W.M. (1997). "Multi-models of quality in education", Quality Assurance in
Education, Vol. 5 No.1, pp.22-31.
Cianfrani A.Charles and West (Jack) E. John (2009). Cracking the Case of ISO 9001:2000 for
Service. ASQ Press. Milwaukee, Wisconsin. US.

73
Cianfrani A.Charles and West (Jack) E. John (2009). Cracking the Case of ISO 9001:2000 in
Manufacturing. ASQ Quality Press. Milwaukee, Wisconsin. US.
Cianfrani A. Charles and West (Jack) John, Tsiaskal. J. Joseph (2009). ISO 9001:2008
Explained. 3rd Edition.
Cochran Craig (2011). ISO 9001 in Plain English. Paton-Professional, Chieo, California- US.
Collines Jr.W.James and Steigar Dolores Sherwood (2011). The Memory Jogger ISO 9001:2008.
Implementing a Process Approach Compliant to ISO 9001:2008 Quality Management
Standards. 4th Edition. Goal/QPC:
Cooper, D.R. and Emory, C.W. (1996). Business Research Methods, USA: Richard D. Irwin,
Inc.
Corbett, C. J., A. M. Luca, H-N Pan. (2003). Global perspectives on global standards: A 15-
economy survey of ISO 9000 and ISO 14000. ISO Management Systems (Jan-Feb).
http://www.iso.org/iso/en/iso9000-14000/articles/surveysandoverviews.html.
Cox III James and Schleier John. (2010). New Theory of Constraints Handbook. 1st edition.
McGraw-Hill Professional
Cowles, D.& Gilbreath, G. (1993). Total quality management at Virginia Commonwealth
University.Higher Education, 25(3), 281-302.
Cua, K.O., Mc Kone, K.E., Schroeder, R.G. (2001),"Relationships between implementation of
TQM, JIT, and TPM and manufacturing performance", Journal of Operations
Management, Vol. 19 pp.675-94.
Crosby B. Philips (1979). Quality is Free. The Art of Making Quality Certain. How to Manage
Quality- So that it becomes A source of Profit for your Business.1st Edition. Mcgraw-
Hill.
Day, George S. (1994). "The Capabilities of Market-Driven Organizations." Journal of
Marketing 58 (October): 37-52.
Deming, W. Edwards. (1982). "Out of the Crises," third printing, MIT CAES, Cambridge Mass.
02139.
Deming .W. Edward (2000). Out of the Crisis. The MIT Press.
Devillis, R. F. (1991). Scale Development: Theory and Applications. Newbury park, NJ: Sage.
Dick, G., Gallimore, K., Brown, J. (2002), Does ISO 9000 accreditation make a profound
difference to the way service quality is perceived and measured?, Managing Service
Quality.

74
Dobb. Fred. P. (2004). ISO 9001: 2000 Quality Registration Step-by-Step. 3rd Edition. Elsevier
Butterworth -Heineman. UK.
Dolvers Patricia Horst et al. (2002). Cracking the Case of ISO 9001:2000 for Service. ASQ
Quality Press. US.
Easton, G. S., S. L. Jarrell. (1998). The effects of Total Quality Management on corporate
Performance: An empirical investigation. Journal of Business 71(2): 253-307. EFQM
(2011). Excellence Model. Amazon Digital Services.
Engelkemeyer, S.W., (1993), “TQM in higher education”, The Centre for Quality Management
Journal, Vol. 2 No. 1, pp. 28-33.
Evans. J.R. (2008). Quality and Performance Excellence: Management, Organization, and
Strategy, 5th Edition. Thomsons. South-Western Cengage Learning. Canada.
Evans. J.R and Lindsay. W. M. (2009). The Management and the Control of Quality. 7th Edition.
Thomson South-Western. Canada.
Feigenbaum A.V.(2004). Total Quality Control. 4th Edition. Mcgraw-Hill.
Field, A. (2005). Discovering Statistics Using SPSS (2nd ed.). London: Sage.
Fitzroy. P. and Hulbert, J. (2005). Strategic Management: Creating Value in Turbulent Times.
John Wiley and Sons Inc.
Frans Van Vught. (2008). The EU Innovation Agenda: Challenges for European Higher
Education and Research. European Centre for Strategic Management of Universities
(ESMU), Belgium, and Centre for Higher Education Policy Studies (CHEPS) University
of Twente the Netherlands. Vol. 21/2.
Gable, R. K., & Wolf, M. B. (1993). Instrument Development in the Affective Domain. Boston:
Kluwer Academic.
George M. and Rowland D. (2004). The Lean Six Sigma Pocket ToolBook. Amazon
Gitlow. S. Howard. (2000). Quality Management Systems: A practical Guide; 1st Edition. CRC
Press.
Goetsch, D. L., & Davis, S. B. (2006). Quality management: Introduction to Total Quality
Management for Production, Processing, and Services. New Jersey: Pearson Prentice
Hall.
Grimes. R. Kevin (2002). IS0 9001:2000 A Practical Quality Guide Manual Explained. ASQ
Quality Press. US.
75
Grundy Tony (2003). Gurus on Business Strategy. Thorogood. London.
Hansen, N.L. (1993). Bringing total quality improvement into the college classroom. Higher
Education, 25(3), 259-79.
Harry Richard P. Rumelt & Kunin Elsa (August 5, 2003). What in the World is Competitive
Advantage? Policy Working Paper. The Anderson School at UCLA.
Hazelkorn Ellen (2011). Ranking and Reshaping of Higher Education. The battle for World-
Class Excellence. Palgrave MacMillan.
Hellsten, U., & Klefsjö, B. (2000). TQM as a management consisting of values, techniques and
tools. The TQM Magazine 12(4), 238-244.
Hendricks, K. B., V. R. Singhal. (1996). Quality awards and the market value of the firm: An
empirical investigation. Management Science 42(3): 415-436.
Hendricks, K. B., V. R. Singhal. (1997). Does implementing an effective TQM program actually
improve operating performance? Empirical evidence from firms that have won quality
awards. Management Science 43(9): 1258-1274.
Hendricks, K. B., V. R. Singhal. (2001). Firm characteristics, Total Quality Management, and
financial performance: An empirical investigation. Journal of Operations Management
19: 269-285.
Hendricks, K. B., V. R. Singhal.(2001b). The long-run stock price performance of firms with
effective TQM programs as proxied by quality award winners. Management Science
47(3): 359-368.
Hoyle David. (2009). ISO 9000: Quality Systems Handbook-Updated for the ISO 9001:2008
Standards: Using the Standards as a framework for business improvement. Elsever Ltd:
6th Edition.
Imtiaz S. Haider. (2001). ISO 9001:2000-Document Development Compliance Manual. A
Complete guide and CD-ROM. CRC Press. LLC.
International Organization for Standardization. ISO 9001-2008: Quality Management System
Requirements. 4th edition. Geneva. Switzerland: ISO, 2008. Print.
International Organization for Standardization. (2012): Quality Management Principles. ISO
Secretariat. Geneva. Switzerland: ISO, 2012-05.
ISO Certified Firms Expo 2011 manual. (2011, November 7th- 12th
) by Apex Management
Systems.

76
Institutes of Policy Analysis and Research. (2010). Demand for Regular Academic Programmes
Offered in Kenya’s Public Universities and their Relevance to the Labour Market.
Discussion Paper No. 113/2010.
Ishikawa Kaoru (1990) Introducing Quality Control. Productive Press.
Kay, John. (1993). Foundations of Corporate Success. Oxford University Press.
Kaynak Okyay (2003). International Journal of Adaptive Control and Signal Processing Special
Issue: Parameter Adaptation in Computationally Intelligent Systems Volume 17, Issue 6,
pages 395–396. John Wiley & Sons, Ltd.
Kattman Robert and Johnson Craig. F. (2003). Successful Application of Quality Systems in K-
12 Schools. ASQ Quality Education Division. US.
Keller Paul and Pyzdek(2010). The Six sigma Handbook. 3rd Edition. Mcgraw-Hill. Kemp Sid
(2005). Quality Management Demystified. Mc-Graw Hill Professional.
Kenyatta University Strategic Vision Plan, 2005-2015.
Kimtai G. and Aluvi. A (2011). A presentation on the role of ISO 9001 Certification in Kenya’s
Sugar Industry.Unpublished. Kabarak University First International Conference.
Kothari C.K (2003) Research Methodology, Methods and Techniques. New Age International.
New Delhi.
Lagrosen, S. (2005). The effects of quality management – a survey of Swedish quality in Y & L
professionals. International Journal of Operations & Production Management 25(10),
940-952.
Latham John and Vinyard John. (2011). Baldrige User Guide: Organization Diagnosis, Design
and Transformation. 5th Edition. Wiley.
Leedy Paul. D. (1997). Practical Research Planning and Designing. 6th Edition. Upper Saddle
River. New Jersey. Columbus Ohio.
Leonard Denis and McGuire Mac. (2007). The Executive Guide to Understanding and
Implementing the Baldrige Criteria: Improve Revenue and Create Organizational
Excellence. ASQ Quality Press.
Lewis, R.G. and Smith, D.H., (1994). Total Quality in Higher Education, St Lucie Press, FL.
Levine. I. David and W. Toffel. W. Michael. (2010). Quality Management and Job Quality: How
the ISO 9001Standard for Quality Management Systems Affects Employees and
Employers. Harvard Business School.
Liker Jeffrey and Franz. K. James. (2011). The Toyota way to continuous improvement: Linking
strategy to Excellence to achieve superior performance. 1st Edition. McGraw-Hill,

77
Malaysia, Faculty Science and Technology, Universiti Kebangsaan Malaysia. (2012) Journal of
Applied Sciences Research, 8(2): 1035-1040.
Magutu Peterson Obara et al. (2010, March 24,). Quality Management Practices in Kenyan
Educational Institutions: the Case of the University of Nairobi, published in the African
Journal of Business & Management (AJBUMA), Vol. 1 (2010), University of Nairobi,
School of Business, Department of Management Science, Nairobi- Kenya.
Marry Walton (1988). The Deming Management Method. SPC press.
Maurer Robert (2004). One Small Step Can Change Your Life; The Kaizen Way. Workman
Publishing Company.
Marginson, S. (2006). Dynamics of National and Global Competition in Higher Education.
Centre for Higher Education (CSHE). 52, 1-39. Australia.
Micklewright Mike and Micklewright Mike. (2010). Lean ISO 9001QMS and sustainability to
your Lean Efforts. ASQ Quality Press. US.
Mohamedbhai, G. (2003). Globalization and its Implications for Universities in Developing
Countries. In Breton, G. and Lambert, M. (eds). Universities and Globalization: Private
Linkages, Public Trust. UNESCO/Universite Laval/Economica. Paris.
Mok, Ka-ho.(2005). The quest for world-class university: Quality assurance and international
benchmarking in HongKong. Quality Assurance in Education. (Centre for East Asian
Studies, University of Bristol, Bristol, UK). Emerald Group Publishing Limited
Mola Balague Nuria (2007). Published PHD dissertation. The use ISO 9001 quality standards in
higher education institutions libraries. University of Barcelona.
Moore Geoffrey A. (1995). Inside the Tornado: Marketing Strategies from Silicon Valley's
Cutting Edge. 1st edition. Harper Business.
Mugenda Olive and Mugenda Alex (1999). Research Method: Quantitative and Qualitative
Approaches. African Centre for Technology Studies.
Muslim Nazri & Mashitoh Yaacob dan Nur Riza Suradi .(2012). The National University of
Malaysia Staff’s Perceptions of ISO9001:2008: A Study on the Effectiveness and the
Impacts on Emotion Centre for General Studies, Universiti Kebangsaan
Mwiria, K. & Ng’ethe, N. (2002). Public Universities Reform in Kenya: Documenting Changes
in the Last Decade. A Report prepared for the Rockefeller Foundation. National Council
for Tertiary Education: Handbook (199). Nairobi.
Myhrberg Valdemar Erik. (2009). A practical Field Guide for ISO 9001:2008. Spi. Edition. ASQ
Quality press.
Nanda (Vic) Vivek. (2003). ISO 9001: 2000- Achieving Compliance and Continuous
Improvement in Software Development Companies. ASQ Quality Press. Milwaukee,
Winsconsin.
78
Ohmae K. (1991). Mind of strategist: the art of Japanese business. Mcgraw-Hill. Orsingher
Chiara (2010). Assessing Quality in European Higher Education Institutions:
Peters, Tom. (2005). Dissemination, Methods and Procedures. Leadership (Tom Peters
Essentials), DK ADULT. Physica-Verlag HD. Germany.
Pallant, J. (2005). SPSS Survival Manual: A Step Guide to Data Analysis Using SPSS. for
Windows (Version 12). New York (2nd ed.). Open University Press.
Parasuraman, A., “Superior Service and Marketing Excellence: Two Sides of the Same
SuccessCoin, ”Vikalpa: The Journal for Decision Makers , Vol. 25, No. 3, July-
September 2000, pp.3-13.
Philips W. Anne. (2009). ISO 9001:2008-Internal Audits made Easy: Tools, Techniques, And
Step-by-Step guidelines for successful Internal Audits. 3rd Edition. ASQ Quality
Press. Milwaukee, Winsonsin. US.
Porter, Michael. (1998). Competitive Advantage: Creating and Sustaining Superior Performance.
Free Press; 1 edition, NY.
Porter, Michael. (1985). Competitive Advantage, The Free Press, NY.
Pun, K. F. (2002). Development of an Integrated TQM & Performance Measurement System for
self-assessment: A method. TQM. Amazon.
Pounder, J. (1999), "Institutional performance in higher education: is quality a relevant
Concept?” Quality Assurance in Education, Vol. 7 No.1/3, pp.156-63.
Rauhvargers Andrejs. (2011). Global University Rankings and their Impact. European University
Association. Belgium.
Reed R., Lemak, D.J. & Mero, N. L (2002). ‘’ When Quality Works; A premature Post Mortem
on TQM,’’ Journal Of Business Management, Vol. 6 No. 4
Republic of Kenya. (2005b). Kenya Education Sector Support programme 2005-2010:
Delivering quality education and training to all Kenyans. Nairobi: Government
Printer.
Robin Wensley. (1988). "Assessing Advantage: A Framework for Diagnosing Competitive
Superiority." Journal of Marketing 52 (April): 1-20. Academy. Robitaille Denise. (2002).
The Management Review Handbook. Paton Press. US.
Robitaille Denise. (2003). The (Almost) Painless ISO9001:2000-Transition. Paton Press.
Rosly Othman, Melissa Ng Lee Yen Abdullah (2007) “ISO standard’s implementation at private
colleges: academics and non-academics’ perspectives,” in Proc. 1st International
Conference on Educational Reform, Mahasarakham University, Thailand.
Russell J.P. and Arter Dennis. (2008). ISO Lesson Guide 2008: Pocket Guide to ISO 9001-2008,
3rd Edition. ASQ Quality Press;
79
Saloner Garth et al. (2001). Strategic Management. John Wiley & Sons Inc;
Schiefer, Gerhard. (2002). Quality management in agriculture and food: Management Principles,
system requirements, and development directions. 2. Aufl. ed. Vol. 94, 2. Bonn: ILB;
Schroeder Alice. (2008). Snowball: Warren Buffett and the Business of Life. Bentam Dell
Publishing Group;
Sharma, D. S. (2005). The association between ISO 9000 certification and financial
performance. The International Journal of Accounting 40: 151-172.
Shingeo Shingo (1987). The Sayings of Shingeo Shingo: Key Strategies for plant Improvement
(Japanese Management. Mcgraw-Hill.
Shin Jung Cheol, Toutkoushian Robert K. , Teichler Ulrich (2011). University Rankings:
Theoretical Basis, Methodology and Impacts on Global Higher Education (The Changing
Academy - The Changing Academic Profession in International Comparative
Perspective). 1st Edition, Springer.
Smith Jaynie. L. and Flanagan. G. William (2006). Creating competitive advantage: Give
customers to choose you over competitors. Crown Business.
Taguchi Genichi, Chowdhury Subir and Yuin Wu (2004). Taguchi’s Quality Engineering
Handbook. Mcgraw-Hill.
Tam, M. (2001), "Measuring quality and performance in higher education", Quality in Higher
Education, Vol. 7 No.1, pp.47-54.
Terlaak, A. A., A. A. King. (2006). The effect of certification with the ISO 9000 Quality
Management Standard: A signaling approach. Journal of Economic Behavior &
Organization 60: 579-602.
The Improvement Act (1987). USA.
The Journal of Achievement in Materials and Manufacturing Engineering (2007). Quality
Management in University Education.Vol. 37 Issue 2.
The Journal of Achievement in Materials and Manufacturing Engineering (2009). Systematic
approach to problems of Quality in Education. Vol. 24 Issue 2.
The Brazilian Journal of production and operations management (2009). Evaluation ISO
9001:2000 Certified and Non-certified organizations in Brazilian Leather Foot
Wearchain. Vol. 6 No. 2 pp. 51-73
The Catholic University of East Africa Quality Policy Statement (2011).CUEA.
http://www.cuea.edu/).
The Office of the Prime Minister. (2010). Evaluation and Performance Contracting Final Report.
The Office of the Prime Minister Strategic Plan, 2009-2012.

80
Treacy, M. F. Wiersema. (1995). The Discipline of Market Leaders, Addison-Wesley.
Tricker Ray and Sherring-Lucas Bruce. (2005). ISO 9001:2000 in Brief. 2nd
Edition.
Batterworth-Heinemann.
Tricker Ray. (2006). ISO 9001:2000: The Quality Management Process. Van Haren Publishing-
Zaltbommel.
Tricker Ray. (2010). ISO 9001:2008 for Small Businesses. 4th Edition. Elsevier Ltd. Tricker
Ray. (2002). ISO 9001:2000. Audit Procedures. 3rd Edition. Elsevier Ltd.
UNESCO (2003). Recent Developments and Future Prospects of Higher Education in Sub-
Saharan Africa. UNESCO Regional Office for Education in Africa (BREDA) and
UNESCO Harare Cluster Office. Paris.
Unesco. (2003). Measuring Education Quality, Ministerial Round table on the Quality of
Education, Unesco Institute of Statistics, Paris.
University of Nairobi (2006-2011). Staff Handbook. University of Nairobi. University of Nairobi
Quality Policy Statement (2008). University of Nairobi.
University World News. (2011). The Global Window on Higher Education Issue No. 179. nion
of Japanese Scientists and Engineers (JUSE) (2012).
The Deming Prize. http://www.juse.or.jp/e/deming/
Ward J. Arthur. Dr. (2008). ISO Certification, Coming of Age. Dorrance Publishing Co. Inc.
Wong, C. C., & Hiew, P. L. (2005). Mobile Entertainment: Review and Redefine. Paper
presented at the IEEE 4th International conference on Mobile Business, Sydney,
Australia.
World University Ranking Web (2012). Times Higher Education.
http://www.timeshighereducation.co.uk
Vavra. G. Terry. (2001). Customers Satisfaction Simplified. A Step-by-Step Guide for ISO
9001:2000 Certification. ASQ Quality Press. US.
Zairi, M. (2002). “Building World-Class Competitive Ability”, in European Business
Handbook 2002, Editor (Adam Jolly), pp. 230 – 234, Published by Kogan Page Ltd,
London, UK.

81
APPENDICES
APPENDIX I: LETTER OF INTRODUCTION
David Baraza Khalonyere
P.o Box 27747-00100, Nairobi
C/o Kenyatta University,
P.o Box 43844-00100, Nairobi.
Cell phone: 0735515797
To the Respondents,
………………………………………………………………………………………………
Dear Respondent,
Ref: Research Project
I am a Kenyatta University Student carrying out a survey on the influence of ISO 9001 Quality
Management Systems certification on the competitive advantage OF Kenya’s Universities. Your
University is selected for this survey and in this regard, I would like to ask for your help by
answering these questions.
All responses and data collected will be treated with strict confidentiality and will not be used for
other purpose(s) other than stated. This study is important to embolden and strengthen the ISO
9001 QMS certified Universities’ resolve in maintaining quality management systems that
enhance their competitive advantage. I look forward to carrying out this study in the appropriate
time with your auspicious support.
Thank you,
Yours faithfully,
Khalonyere, Baraza David,
Reg. No.: D53/PT/CTY/20818/2010
82
APPENDIX II: AUTHRIZATION LETTER

83
APPENDIX III: QUESTIONNAIRE
SECTION A: PERSONAL AND ORGANISATIONAL DETAILS
This section of the questionnaire refers to background or biographical information. The
information will allow us to compare groups of respondents. The response will remain
anonymous. Your co-operation is appreciated.
1. What is your Gender?
Female: Male:
2. What is your Job Category? Please tick (√)
Teaching Staff; Full- time Part-time
Non-Teaching: Full- time Part-time
3. How many years have you worked at the job category?
Years Below 5 6-10 11-15 16-20 21-25 26-30 Over 30
Please tick (√ )
4. How would you rate your understanding of ISO 9001 Quality Management Systems
certification standard on a scale of 1-5? (Please tick a number that best represents your
understanding)
Fully To a very great extent Moderately To very small extent Do not Understand
1 2 3 4 5
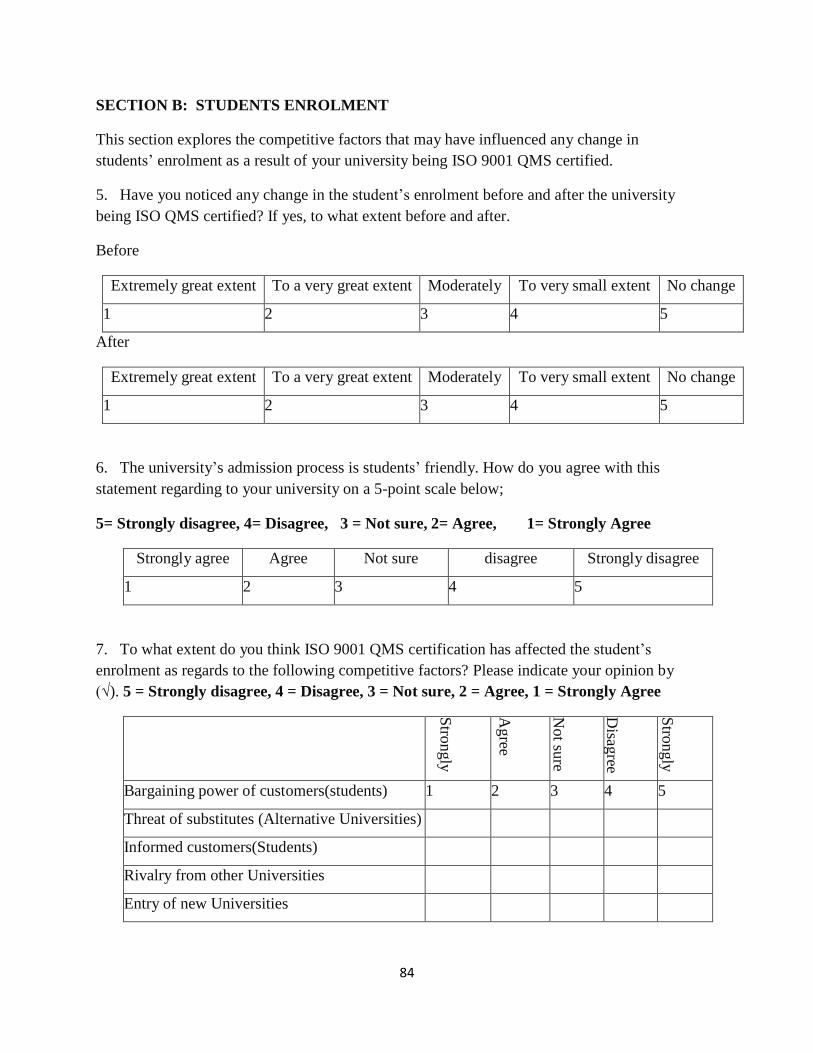
84
SECTION B: STUDENTS ENROLMENT
This section explores the competitive factors that may have influenced any change in
students’ enrolment as a result of your university being ISO 9001 QMS certified.
5. Have you noticed any change in the student’s enrolment before and after the university
being ISO QMS certified? If yes, to what extent before and after.
Before
Extremely great extent To a very great extent Moderately To very small extent No change
1 2 3 4 5
After
Extremely great extent To a very great extent Moderately To very small extent No change
1 2 3 4 5
6. The university’s admission process is students’ friendly. How do you agree with this
statement regarding to your university on a 5-point scale below;
5= Strongly disagree, 4= Disagree, 3 = Not sure, 2= Agree, 1= Strongly Agree
Strongly agree Agree Not sure disagree Strongly disagree
1 2 3 4 5
7. To what extent do you think ISO 9001 QMS certification has affected the student’s
enrolment as regards to the following competitive factors? Please indicate your opinion by
(√). 5 = Strongly disagree, 4 = Disagree, 3 = Not sure, 2 = Agree, 1 = Strongly Agree
Stro
ngly
agree
Ag
ree
Not su
re
Disag
ree
Stro
ngly
disag
ree
Bargaining power of customers(students) 1 2 3 4 5
Threat of substitutes (Alternative Universities)
Informed customers(Students)
Rivalry from other Universities
Entry of new Universities
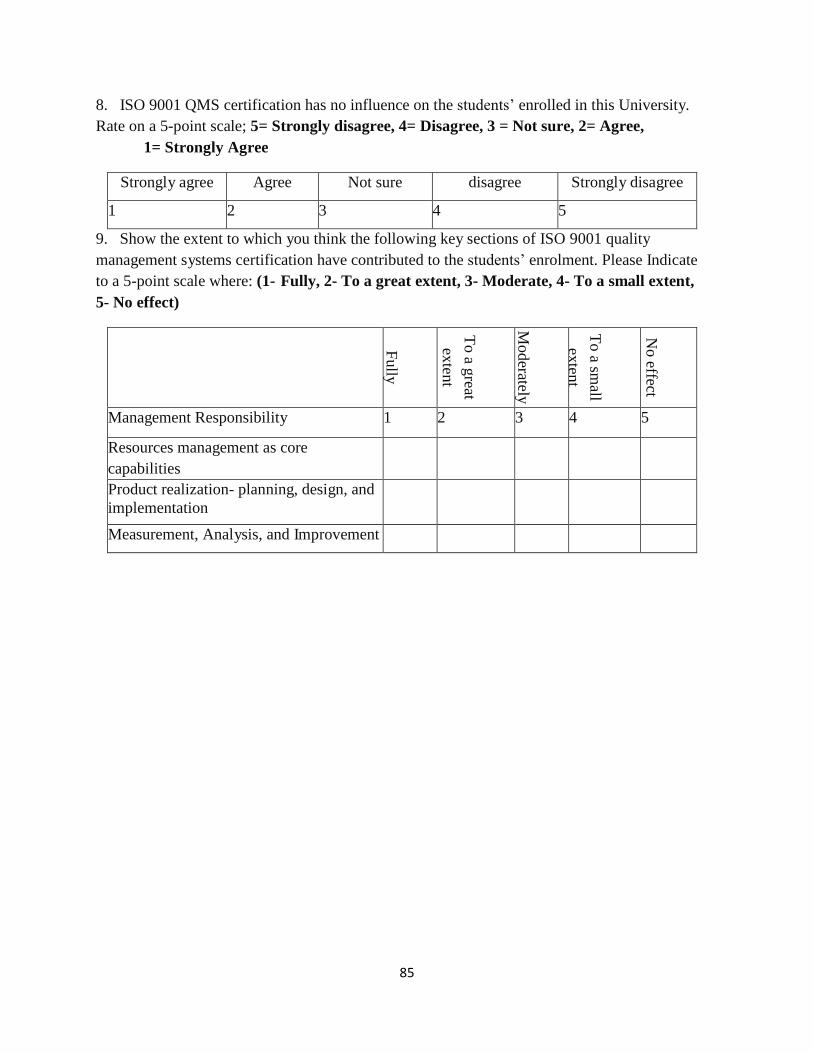
85
8. ISO 9001 QMS certification has no influence on the students’ enrolled in this University.
Rate on a 5-point scale; 5= Strongly disagree, 4= Disagree, 3 = Not sure, 2= Agree,
1= Strongly Agree
Strongly agree Agree Not sure disagree Strongly disagree
1 2 3 4 5
9. Show the extent to which you think the following key sections of ISO 9001 quality
management systems certification have contributed to the students’ enrolment. Please Indicate
to a 5-point scale where: (1- Fully, 2- To a great extent, 3- Moderate, 4- To a small extent,
5- No effect)
Fully
To a g
reat
exten
t
Moderately
y
To a sm
all
exten
t
exten
t
No effect
Management Responsibility 1 2 3 4 5
Resources management as core
capabilities
Product realization- planning, design, and
implementation
Measurement, Analysis, and Improvement

86
SECTION C: PERCEPTION AND IMAGE
This section explores the influence on your perception and image as a result of your university
being ISO 9001 QMS certified.
10. Have you attended any ISO 9001 QMS training? Yes No
If yes, to what extent do you think it has changed your view of the University’s Image.
Fully To a very great extent Moderately To very small extent No effect
1 2 3 4 5
11. How would you describe the image and perception of your university before and after
being ISO 9001 certified?
Before;
Very good Quite good Neither good or bad Quite bad Very bad
1 2 3 4 5
After:
Very good Quite good Neither good or bad Quite bad Very bad
1 2 3 4 5
12. How often is the review of the ISO 9001 QMS at your university? Please indicate (√) on
a scale of 5-points.
1 2 3 4 5
Do not know After
Every 3-6 months
After every
2 Year
After every
3 Years
After Every 5
Years
13. The Image and perception of your University has changed since it was granted ISO 9001
quality management systems certification. To what extent do you agree with this
statement on a scale of 1 to 5? Please tick (√)
Definitely Agree Agree Disagree Definitely disagree Do not Know
1 2 3 4 5

87
SECTION D: RESEARCH AND DEVELOPMENT
This section explores your views on research and development.
14. To what extent does research and development been affected at your university since ISO
9001 QMS certification as a strategy for competitiveness. Please indicate the extent of
the effect on a 5-point scale where: 5= No change, 4 = To very small extent, 3=
Moderately, 2= To a very great extent 1= extremely great extent
Before: ISO 9001 QMS certification
Extremely great extent To a very great extent Moderately To very small extent No change
1 2 3 4 5
After: ISO 9001 QMS certification
Extremely great extent To a very great extent Moderately To very small extent No change
1 2 3 4 5
15. Do you consider your university to have a competitive edge over other universities?
Yes No Do not Know
If Yes, What is its competitive strength? _______________________________
16. How important are the following principles on the competiveness of the university’s
growth in Research and development? Please give your answer using the following 5
point scale; 5 = Totally unimportant, 4 = Unimportant, 3 = Important, 2 = Very
important, 1= Totally Important
Totally
Importan
t
Very
Importan
t
Importan
t
Unim
portan
t
Totally
Unim
portan
t
1 2 3 4 5
University Leadership
Focus on the students

88
Work policy and involvement of people in R&D
Technological development in Research
Inspection and testing records and documents
Process and Systems approaches to issues
Continuous improvement
Documentation of all records and factual
approaches
Closer relationships that foster corrective and
preventive measures in R&D
17. ISO 9001 QMS certification is a sure strategy for Universities’ competitiveness in
Research and Development. How do you agree with this statement? Please indicate on
5 –point scale where; 5= strongly disagree, 4= Disagree, 3 = Not sure, 2= Agree, 1=
Strongly Agree
Strongly agree Agree Not sure disagree Strongly disagree
1 2 3 4 5
18. Indicate the extent to which Research and development at your University has been
affected by the following ISO 9001 quality issues. Please, use (√) to indicate your
answer on a scale of 5-points; (1- Fully, 2- To a very great extent, 3 – Moderately,
4- To a very small extent, 5- No effect)
Quality Research issues Fully To a Very
great extent
Moderately To very
small extent
No effect
1 2 3 4 5
Quality assurance
Quality control measures
Quality objectives
Quality Policy
Quality conformance
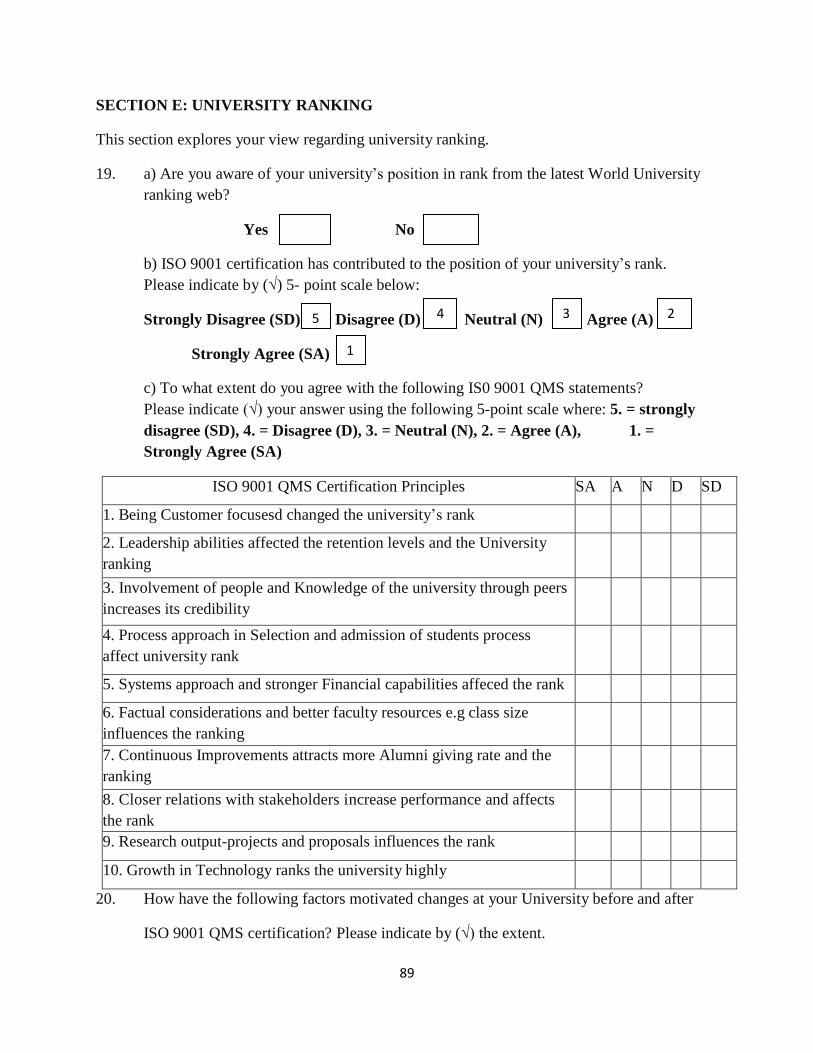
89
SECTION E: UNIVERSITY RANKING
This section explores your view regarding university ranking.
19. a) Are you aware of your university’s position in rank from the latest World University
ranking web?
Yes No
b) ISO 9001 certification has contributed to the position of your university’s rank.
Please indicate by (√) 5- point scale below:
Strongly Disagree (SD) Disagree (D) 4 Neutral (N) Agree (A)
Strongly Agree (SA)
c) To what extent do you agree with the following IS0 9001 QMS statements?
Please indicate (√) your answer using the following 5-point scale where: 5. = strongly
disagree (SD), 4. = Disagree (D), 3. = Neutral (N), 2. = Agree (A), 1. =
Strongly Agree (SA)
ISO 9001 QMS Certification Principles SA A N D SD
1. Being Customer focusesd changed the university’s rank
2. Leadership abilities affected the retention levels and the University
ranking
3. Involvement of people and Knowledge of the university through peers
increases its credibility
4. Process approach in Selection and admission of students process
affect university rank
5. Systems approach and stronger Financial capabilities affeced the rank
6. Factual considerations and better faculty resources e.g class size
influences the ranking
7. Continuous Improvements attracts more Alumni giving rate and the
ranking
8. Closer relations with stakeholders increase performance and affects
the rank
9. Research output-projects and proposals influences the rank
10. Growth in Technology ranks the university highly
20. How have the following factors motivated changes at your University before and after
ISO 9001 QMS certification? Please indicate by (√) the extent.
5
1
4 3 2
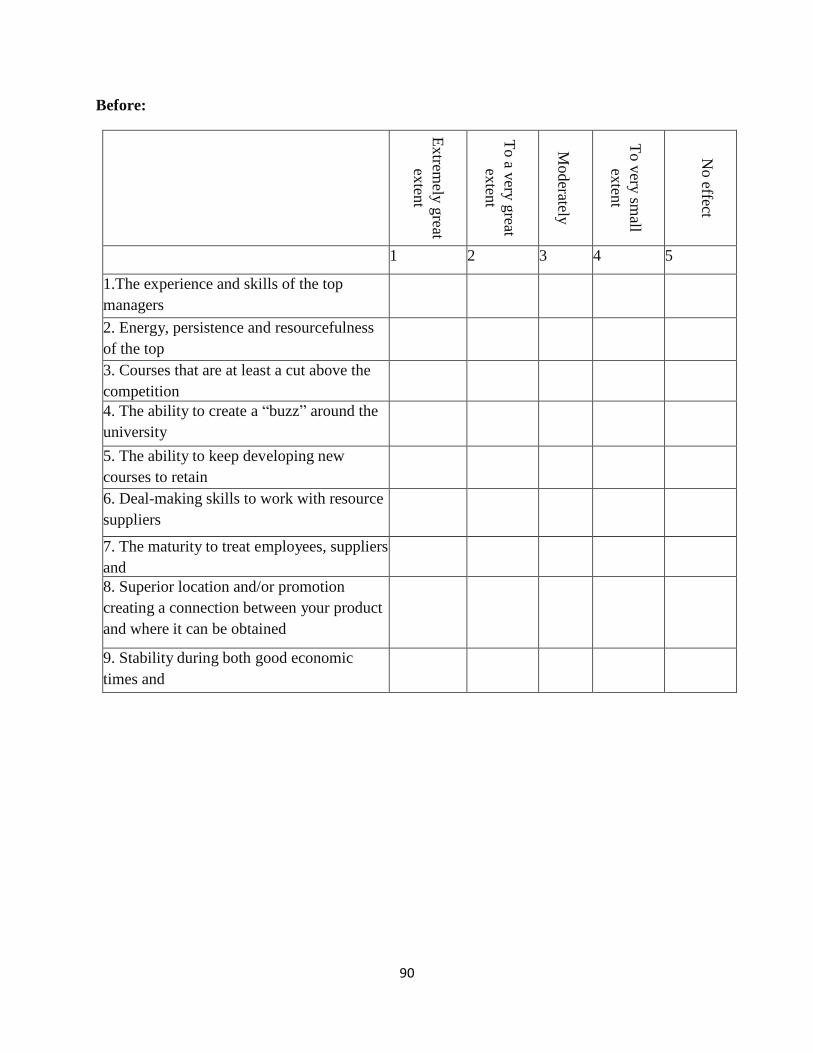
90
Before:
Extrem
ely g
reat
exten
t
exten
t
To a v
ery g
reat
exten
t
exten
t
Moderately
To v
ery sm
all
exten
t
exten
t
No effect
1 2 3 4 5
1.The experience and skills of the top
managers
2. Energy, persistence and resourcefulness
of the top
managers
3. Courses that are at least a cut above the
competition
and service that don’t get in the way of
learners
4. The ability to create a “buzz” around the
university
services with aggressive and strategic
marketing
5. The ability to keep developing new
courses to retain
and build credibility with learners
6. Deal-making skills to work with resource
suppliers
to keep costs low
7. The maturity to treat employees, suppliers
and
partners fairly and respectfully
8. Superior location and/or promotion
creating a connection between your product
and where it can be obtained
9. Stability during both good economic
times and
downturns
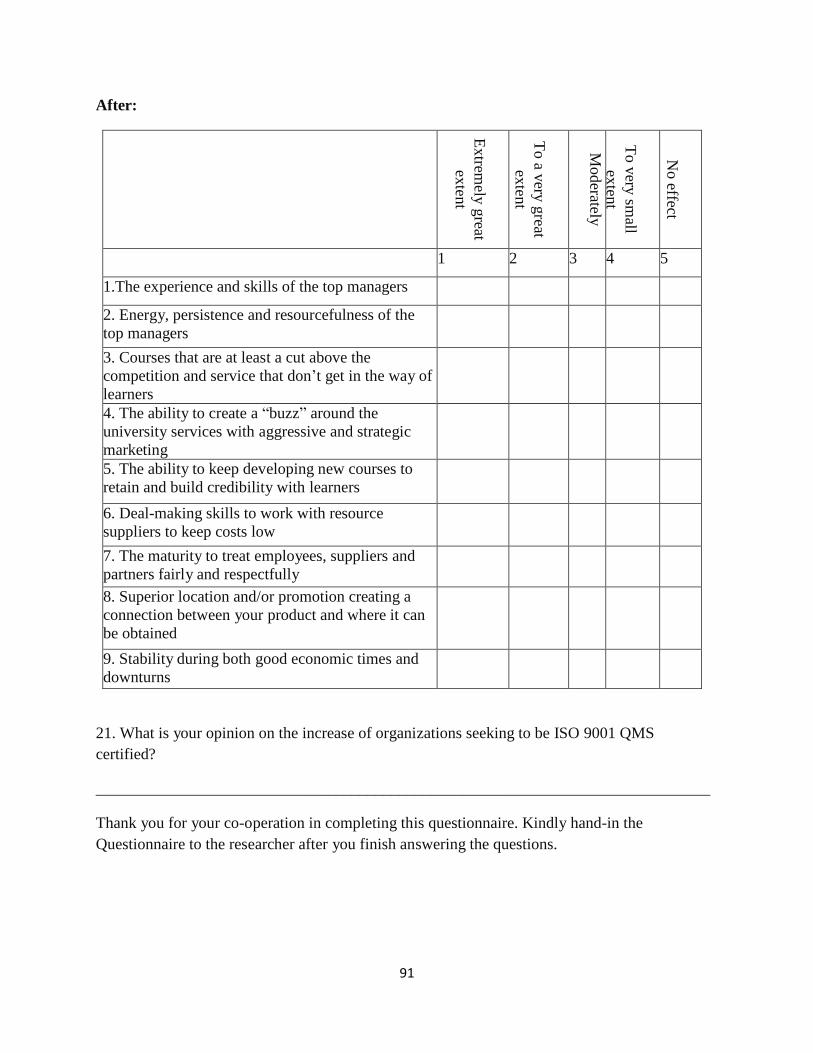
91
After:
Extrem
ely g
reat
exten
t
To a v
ery g
reat
exten
t
exten
t
Moderately
To v
ery sm
all
exten
t
exten
t
No effect
1 2 3 4 5
1.The experience and skills of the top managers
2. Energy, persistence and resourcefulness of the
top managers
3. Courses that are at least a cut above the
competition and service that don’t get in the way of
learners
4. The ability to create a “buzz” around the
university services with aggressive and strategic
marketing
5. The ability to keep developing new courses to
retain and build credibility with learners
6. Deal-making skills to work with resource
suppliers to keep costs low
7. The maturity to treat employees, suppliers and
partners fairly and respectfully
8. Superior location and/or promotion creating a
connection between your product and where it can
be obtained
9. Stability during both good economic times and
downturns
21. What is your opinion on the increase of organizations seeking to be ISO 9001 QMS
certified?
_____________________________________________________________________________
Thank you for your co-operation in completing this questionnaire. Kindly hand-in the
Questionnaire to the researcher after you finish answering the questions.
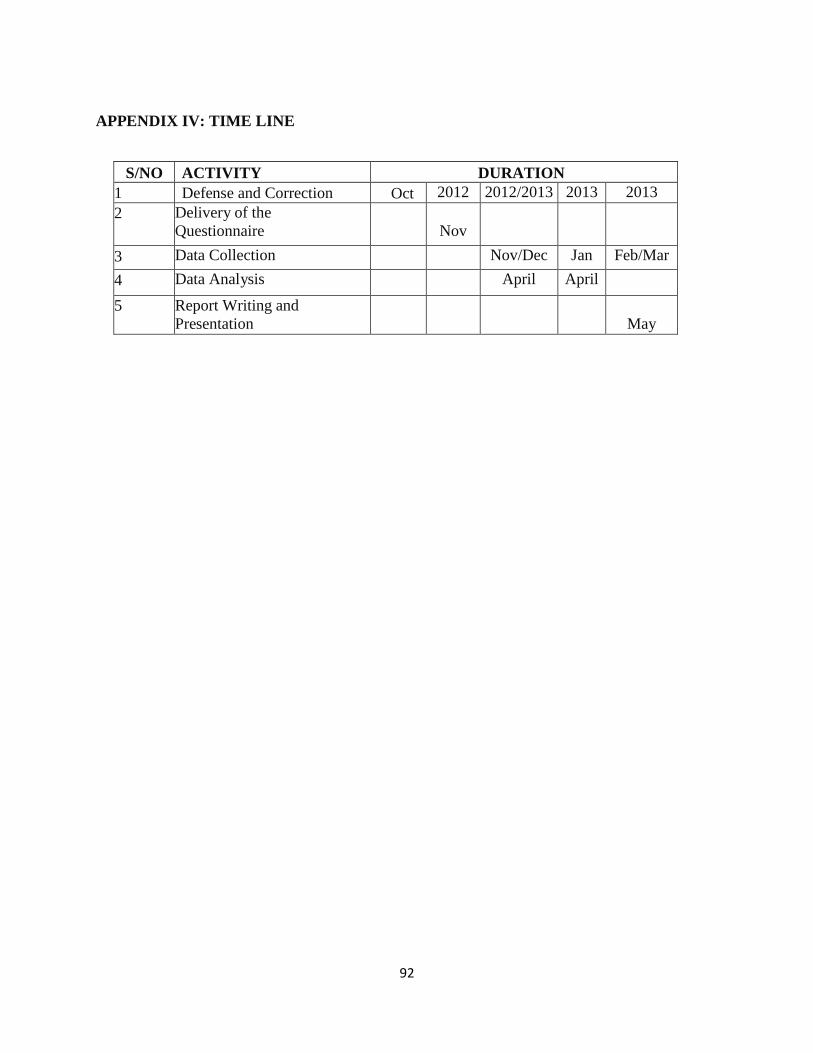
92
APPENDIX IV: TIME LINE
S/NO ACTIVITY DURATION
1 Defense and Correction Oct 2012 2012/2013 2013 2013
2
Delivery of the
Questionnaire
Nov
3 Data Collection Nov/Dec Jan Feb/Mar
4 Data Analysis April April
5 Report Writing and
Presentation
May

93
APPENDIX V: LIST OF UNIVERSITIES IN KENYA AND INSTITUTES:
1. Aga Khan University
2. Africa Nazarene University
3. Bondo University College
4. Catholic University of Eastern Africa
5. Chuka University College
6. Daystar University
7. East Africa School of Theology
8. Egerton University
9. Great Lakes University of Kisumu (GLUK)
10. Genco University
11. Gretsa University
12. Inoorero University
13. Kenyatta University
14. Moi University
15. Maseno University
16. Jomo Kenyatta University of Agriculture & Technology
17. Kimathi University College of Technology
18. Kabianga University College
19. Kenya Polytechnic University College
20. Kiambu institute of Science and Technology (KIST)
21. Kisii University College
22. Kabarak University
23. KCA University
24. Kenya Highlands Bible College
25. Kenya Methodist University (KEMU)
26. Kiriri Women's University of Science and Technology (KWUST)
27. Laikipia University College
28. Masinde Muliro University of Science & Technology
29. Mombasa Polytechnic University College
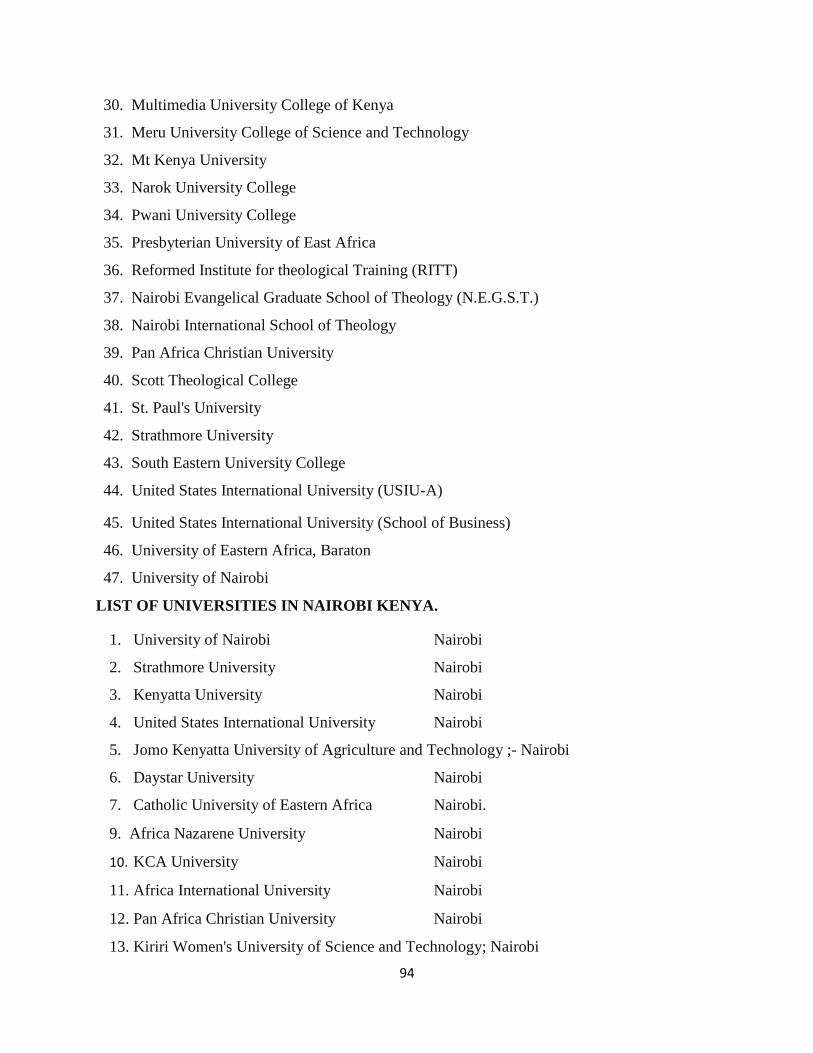
94
30. Multimedia University College of Kenya
31. Meru University College of Science and Technology
32. Mt Kenya University
33. Narok University College
34. Pwani University College
35. Presbyterian University of East Africa
36. Reformed Institute for theological Training (RITT)
37. Nairobi Evangelical Graduate School of Theology (N.E.G.S.T.)
38. Nairobi International School of Theology
39. Pan Africa Christian University
40. Scott Theological College
41. St. Paul's University
42. Strathmore University
43. South Eastern University College
44. United States International University (USIU-A)
45. United States International University (School of Business)
46. University of Eastern Africa, Baraton
47. University of Nairobi
LIST OF UNIVERSITIES IN NAIROBI KENYA.
1. University of Nairobi Nairobi
2. Strathmore University Nairobi
3. Kenyatta University Nairobi
4. United States International University Nairobi
5. Jomo Kenyatta University of Agriculture and Technology ;- Nairobi
6. Daystar University Nairobi
7. Catholic University of Eastern Africa Nairobi.
9. Africa Nazarene University Nairobi
10. KCA University Nairobi
11. Africa International University Nairobi
12. Pan Africa Christian University Nairobi
13. Kiriri Women's University of Science and Technology; Nairobi

95
14. Inoorero University Nairobi
15. Adventist University of Africa Nairobi
16. The East African University Nairobi
17. Management University of Africa Nairobi
(CUE, 2012-2013)

96
APPENDIX VI: LIST OF ISO 9001 QMS CERTIFIED UNIVERSITIES IN NAIROBI,
DEMING’S AND JURAN’S QUALITY POINTS.
1. University of Nairobi Nairobi
2. Strathmore University Nairobi
3. Kenyatta University Nairobi
4. Jomo Kenyatta University of Agriculture and Technology ;- Nairobi
5. Catholic University of Eastern Africa Nairobi.
(University Websites, 2013)
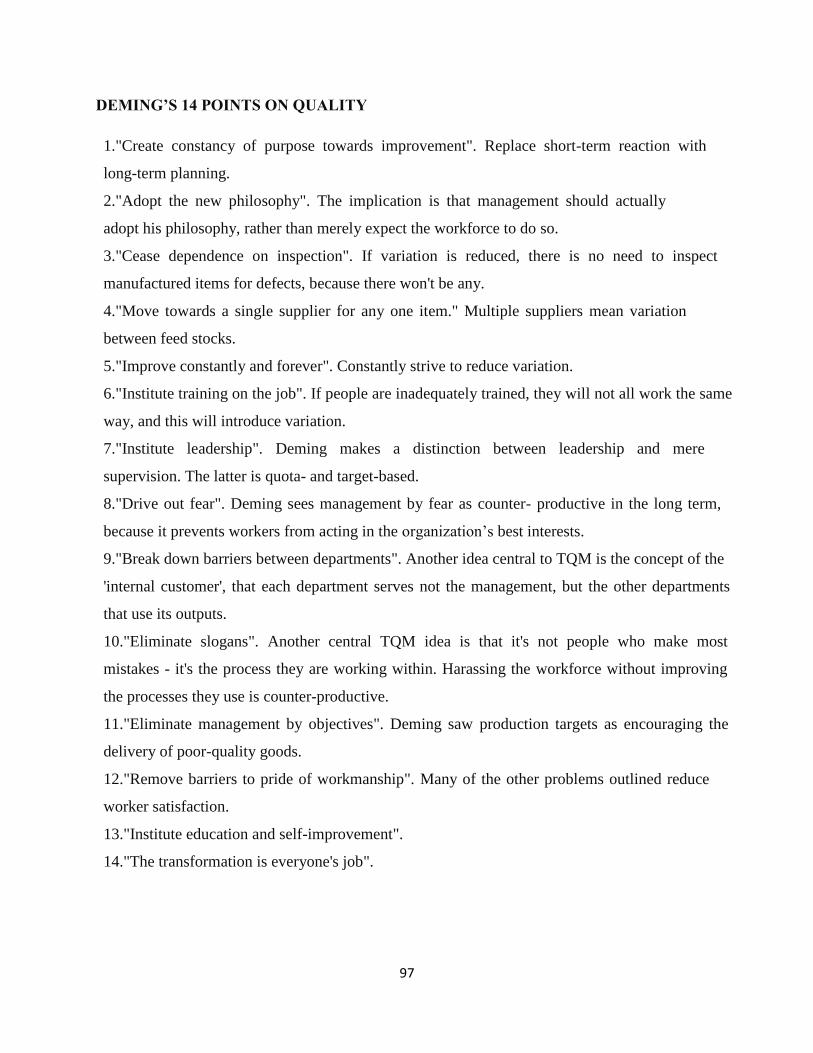
97
DEMING’S 14 POINTS ON QUALITY
1."Create constancy of purpose towards improvement". Replace short-term reaction with
long-term planning.
2."Adopt the new philosophy". The implication is that management should actually
adopt his philosophy, rather than merely expect the workforce to do so.
3."Cease dependence on inspection". If variation is reduced, there is no need to inspect
manufactured items for defects, because there won't be any.
4."Move towards a single supplier for any one item." Multiple suppliers mean variation
between feed stocks.
5."Improve constantly and forever". Constantly strive to reduce variation.
6."Institute training on the job". If people are inadequately trained, they will not all work the same
way, and this will introduce variation.
7."Institute leadership". Deming makes a distinction between leadership and mere
supervision. The latter is quota- and target-based.
8."Drive out fear". Deming sees management by fear as counter- productive in the long term,
because it prevents workers from acting in the organization’s best interests.
9."Break down barriers between departments". Another idea central to TQM is the concept of the
'internal customer', that each department serves not the management, but the other departments
that use its outputs.
10."Eliminate slogans". Another central TQM idea is that it's not people who make most
mistakes - it's the process they are working within. Harassing the workforce without improving
the processes they use is counter-productive.
11."Eliminate management by objectives". Deming saw production targets as encouraging the
delivery of poor-quality goods.
12."Remove barriers to pride of workmanship". Many of the other problems outlined reduce
worker satisfaction.
13."Institute education and self-improvement".
14."The transformation is everyone's job".

98
JOSEPH M. JURAN’S TEN STEPS TO QUALITY IMPROVEMENT
1. Start with building awareness of the need and opportunity for improvement.
2. Set realistic goals for improvement.
3. Organize to reach the goals (by method to establish a quality council, identify
problems, select projects, appoint teams, and designate facilitators).
4. Emphasis on training.
5. Solve problems by carrying out projects.
6. Progress must be reported.
7. Give recognition to anybody who achieved.
8. Communicate results with all concerned.
9. Keep score by being quantitative.
10. Maintain a regular momentum by making annual improvement part of the systems
and processes of the company.