the influence of race, sex, and social disadvantage on
TRANSCRIPT
Dow
nloadedfrom
http://journals.lww.com
/ajpmrby
BhDMf5ePH
Kav1zEoum1tQ
fN4a+kJLhEZgbsIH
o4XMi0hC
ywCX1AW
nYQp/IlQ
rHD3i3D
0OdR
yi7TvSFl4Cf3VC
1y0abggQZXdtw
nfKZBYtws=
on05/03/2021
Downloadedfromhttp://journals.lww.com/ajpmrbyBhDMf5ePHKav1zEoum1tQfN4a+kJLhEZgbsIHo4XMi0hCywCX1AWnYQp/IlQrHD3i3D0OdRyi7TvSFl4Cf3VC1y0abggQZXdtwnfKZBYtws=on05/03/2021
1
The influence of race, sex, and social disadvantage on self-reported health in
patients presenting with chronic musculoskeletal pain
Abby L. Cheng, MD1
Ethan C. Bradley, BA2
Brian K. Brady, BA3
Ryan P. Calfee, MD4
Lisa M. Klesges, PhD, MS5
Graham A. Colditz, MD, DrPH, MPH5
Heidi Prather, DO6
1Department of Orthopaedic Surgery, Division of Physical Medicine and Rehabilitation
Washington University in St. Louis School of Medicine St. Louis, MO, USA
2The Brown School at Washington University in St. Louis St. Louis, MO, USA
3Washington University in St. Louis School of Medicine St. Louis, MO, USA
4Department of Orthopaedic Surgery, Division of Hand and Microsurgery Washington
University in St. Louis School of Medicine St. Louis, MO, USA
5Department of Surgery, Division of Public Health Sciences Washington University in St. Louis
School of Medicine St. Louis, MO, USA
6Weill Cornell Medical College New York City, NY, USA
American Journal of Physical Medicine & Rehabilitation Articles Ahead of Print DOI: 10.1097/PHM.0000000000001774
Copyright © 2021 Wolters Kluwer Health, Inc. Unauthorized reproduction of this article is prohibited.
ACCEPTED

2
Corresponding author:
Abby L Cheng, MD
Campus Box 8233
660 South Euclid Avenue
St. Louis, MO 63110
Phone: 314-747-2828
Fax: 314-514-3555
Author disclosures:
Competing interests:
None of the authors have conflicts of interest or competing interests to disclose.
Funding for the project:
This study was supported by the Doris Duke Charitable Foundation and by grant K23AR074520
from the National Institute of Arthritis and Musculoskeletal and Skin Diseases (Dr. Cheng).
Neither funding body had any role in the study design; collection, analysis, or interpretation of
the data; writing of the report; or decision to submit the report for publication.
Financial benefit to the authors:
None of the authors expect financial benefit from this study or manuscript.
Copyright © 2021 Wolters Kluwer Health, Inc. Unauthorized reproduction of this article is prohibited.
ACCEPTED
3
Previous presentations:
Data reported in this manuscript have been partially presented in abstract/poster format at the
2021 Association of Academic Physiatrists (AAP) Annual Meeting. The dataset used in this
study has also been used for another manuscript that is currently under review at another journal.
The data analyses in the two manuscripts do not overlap.
Copyright © 2021 Wolters Kluwer Health, Inc. Unauthorized reproduction of this article is prohibited.
ACCEPTED

4
ABSTRACT
Objective:
To better address sociodemographic-related health disparities, this study examined which
sociodemographic variables most strongly correlate with self-reported health in patients with
chronic musculoskeletal pain.
Design:
This single-center, cross-sectional study examined adult patients followed by a physiatrist for
chronic (≥4 years) musculoskeletal pain. Sociodemographic variables considered were race, sex,
and disparate social disadvantage (measured as residential address in the worst versus best Area
Deprivation Index national quartile). The primary comparison was the adjusted effect size of
each variable on physical and behavioral health (measured by Patient-Reported Outcomes
Measurement Information System (PROMIS)).
Results:
In 1,193 patients (age 56.3±13.0 years), disparate social disadvantage was associated with worse
health in all domains assessed (PROMIS Physical Function Β -2.4 points [95%CI -3.8–-1.0],
Pain Interference 3.3 [2.0–4.6], Anxiety 4.0 [1.8–6.2], and Depression 3.7 [1.7–5.6]). Black race
was associated with greater anxiety than white race (3.2 [1.1–5.3]), and female sex was
associated with worse physical function than male sex (-2.5 [-3.5–-1.5]).
Copyright © 2021 Wolters Kluwer Health, Inc. Unauthorized reproduction of this article is prohibited.
ACCEPTED

5
Conclusion:
Compared to race and sex, social disadvantage is more consistently associated with worse
physical and behavioral health in patients with chronic musculoskeletal pain. Investment to
ameliorate disadvantage in geographically defined communities may improve health in
sociodemographically at-risk populations.
Key Words:
Socioeconomic factors; Health status disparities; Chronic pain; Musculoskeletal diseases
Copyright © 2021 Wolters Kluwer Health, Inc. Unauthorized reproduction of this article is prohibited.
ACCEPTED

6
What is Known:
Sociodemographic characteristics such as Black race, female sex, and high social disadvantage
correlate with disparities in care and worse outcomes across numerous health domains.
What is New:
Compared to race and sex, in patients with chronic musculoskeletal pain, social disadvantage is
more consistently associated with worse self-reported physical and behavioral health. However,
patients of Black race and female sex are more likely to live in socially disadvantaged
neighborhoods. The results support that strategic investment into geographically defined,
disadvantaged communities may be an efficient strategy to improve health in patients with
multiple sociodemographic risk factors.
Copyright © 2021 Wolters Kluwer Health, Inc. Unauthorized reproduction of this article is prohibited.
ACCEPTED

7
INTRODUCTION
Health outcomes are strongly influenced by sociodemographic factors.1 Patient characteristics
such as Black race, female sex, and social disadvantage correlate with worse symptom reporting,
access to care, and re-hospitalization rates in patients with a variety of medical conditions
including cardiopulmonary disease, mental health disorders, and acute and chronic pain.2-4
Disparate morbidity and mortality rates from the COVID-19 pandemic have especially
highlighted these issues.5 Multiple underlying phenomena likely contribute to sociodemographic-
driven disparities. Systemic racism, sexism, and epigenetics can all influence physical and
behavioral health, independent of income level.6-8
Furthermore, intersectional effects of
sociodemographic variables such as Black race and female sex can also exacerbate disparities.9,10
In order to design and appropriately prioritize effective interventions to address these disparities,
Penman-Aguilar et al. and Alegria et al. advocate for assessment of the relative effects of
sociodemographic variables.9 ,11
Relationships between sociodemographic variables and chronic
pain are particularly important to explore because 20% of Americans live with chronic pain that
interferes with employment, family responsibilities, and wellness,12
and disabling chronic pain
disproportionately affects socially at-risk populations.13 ,14
As the standard of care for pain
management evolves in response to the opioid crisis, new treatment guidelines should consider
ways to also mitigate the disproportionate burden of chronic pain in these select
sociodemographic groups.
The purpose of this study was to examine associations between sociodemographic variables (i.e.,
race, sex, and social disadvantage) and self-reported physical and behavioral health in patients
Copyright © 2021 Wolters Kluwer Health, Inc. Unauthorized reproduction of this article is prohibited.
ACCEPTED

8
with chronic musculoskeletal pain. The hypothesis was that, consistent with findings in other
patient populations, Black race, female sex, and social disadvantage would each independently
correlate with worse self-reported physical and behavioral health.
METHODS
This cross-sectional study analyzed electronic medical records from a single tertiary care
academic institution in St. Louis, MO, USA. The institution acts as a safety net medical center
for the surrounding urban and multi-state rural region. Study procedures were conducted in
accordance with the Declaration of the World Medical Association. University Institutional
Review Board approval was granted prior to data collection with a waiver of informed consent.
Data analysis was performed in 2019 and 2020. Reporting for this study conforms to all
STROBE guidelines (see Supplemental Checklist, Supplemental Digital Content 1,
http://links.lww.com/PHM/B282).
Study population
The study population consisted of adult patients (18 years and older) who presented to a board-
certified sports medicine physical medicine and rehabilitation physician (physiatrist) for non-
operative management of one or more chronic painful musculoskeletal disorders. The study
physiatrists exclusively manage musculoskeletal conditions, so for this study, a chronic
musculoskeletal disorder was defined as presentation multiple times to one of the eight sports
medicine physiatrists at the study institution for musculoskeletal pain in one or more body
regions. The clinical presentations had to occur at least once between January 1, 2000 –
December 31, 2011 and once between June 22, 2015 – November 1, 2017, which means all
Copyright © 2021 Wolters Kluwer Health, Inc. Unauthorized reproduction of this article is prohibited.
ACCEPTED
9
patients had pain for a minimum of four years at the time of data analysis. The first time interval
was chosen because it represents the period when the physicians accepted the transfer of care for
chronic pain management (including opioid management) for any patient. The second interval
was chosen because it captured the time when collection of Patient-Reported Outcomes
Measurement Information System (PROMIS®) measures became standard of care for all patients
presenting to the physicians. After an eligible initial presentation, eligible follow-up
presentations included visits for routine monitoring / medication refills and for pain flares. All
consecutive eligible patients were included. Pediatric patients and those with pain that resolved
to the point of not requiring follow-up were excluded from the study.
Measures
Sociodemographic variables of interest were patients’ self-reported race, biological sex, and
degree of social disadvantage, as measured by the 2018 Area Deprivation Index (ADI).4 The
ADI was developed by Singh, Kind, and colleagues to rank communities using a composite score
derived from 17 variables that quantify various domains such as residents’ income, education,
employment, and housing quality. Each 9-digit zip code is assigned an ADI national percentile
from 1 to 100, with a larger percentile representing worse social disadvantage. ADI values are
systematically missing for zip codes that do not match an ADI (e.g., if offshore) and that
represent a post office (PO) box or a business entity responsible for large volume mail delivery.
In accordance with published literature and in order to facilitate intuitive, clinically relevant data
interpretation, socially disadvantaged communities were defined as those with zip codes in the
worst ADI national quartile, and disparate social disadvantage was defined as comparison
between communities with zip codes in the most versus least disadvantaged ADI national
Copyright © 2021 Wolters Kluwer Health, Inc. Unauthorized reproduction of this article is prohibited.
ACCEPTED

10
quartiles.15
Patients’ age, use of chronic opioid therapy for pain management, and health insurance status
were also recorded because they are known to be associated with patients’ self-reported health.16
For this study, chronic opioid therapy was defined as maintaining adherence to an opioid
contract and receiving repeated opioid prescriptions of a relatively consistent dose and quantity
from the study physicians at regular time intervals, which necessitated that patients present for
in-person follow-up appointments at least every three months, report they are taking the
medication as prescribed, pass random urine drug screens at least annually, and maintain a stable
functional level without an escalating opioid dose.
The primary comparison measure was the adjusted effect size of each sociodemographic variable
(race, sex, and social disadvantage) on patients’ self-reported physical and behavioral health, as
measured by PROMIS®
.17
Patients completed the PROMIS Computer Adaptive Test (CAT)
measures prior to the physician encounter as standard of care during their clinic visits. Physical
health was quantified using PROMIS Physical Function v1.2 (later switched to v2.0) and Pain
Interference v1.1, and behavioral health was quantified with the PROMIS Anxiety v1.0 and
Depression v1.0 domains. Because PROMIS Physical Function versions 1.2 and 2.0 yield
comparable scores, the versions were combined during statistical analysis.18
Of note, the
PROMIS Anxiety domain was not collected as standard of care until ten months after
implementation of the other domains, which resulted in missing data without systematic bias.
Scores for all PROMIS domains are normalized with a mean of 50 and standard deviation of 10,
and higher scores represent more of the domain. For instance, compared to the reference
Copyright © 2021 Wolters Kluwer Health, Inc. Unauthorized reproduction of this article is prohibited.
ACCEPTED
11
population, a score of 60 on PROMIS Depression represents more (worse) depression symptoms
than average, but a score of 60 on PROMIS Physical Function represents more (better) physical
function than average. The general reference population used to standardize PROMIS scores
mirrored the race, sex, age, and education distribution reported from the 2000 United States
General Census.19
Minimum meaningful effect sizes on PROMIS scores were estimated based on published within-
group minimal clinically important differences (MCIDs) in patients with conservatively managed
musculoskeletal pain.20-22
Additionally, any effect size smaller than the standard error of
measurement for each PROMIS CAT domain at the study institution was considered to not be
clinically meaningful. Therefore, meaningful differences were defined as 2.2 points for Physical
Function, 2.0 for Pain Interference, 3.0 for Anxiety, and 3.2 for Depression.
Because race and biological sex are typically fixed variables throughout a person’s lifetime
whereas the level of social disadvantage related to a person’s local community can change, a
sub-analysis was performed to compare the proportion of patients in each ADI quartile who
identified as each race and sex.
Statistical analysis
Each PROMIS measure was modeled using multiple linear regression. Independent variables
included in each model were patients’ self-reported race (categorized as white, Black, or other),
self-reported biological sex (male or female), and disparate social disadvantage (i.e., comparison
between the most and least disadvantaged ADI national quartiles).15
Covariates included age
Copyright © 2021 Wolters Kluwer Health, Inc. Unauthorized reproduction of this article is prohibited.
ACCEPTED

12
(categorized by decade) and current chronic opioid use status (yes or no). The covariates were
chosen a priori because of their established effects on physical and behavioral health. Health
insurance status was not included as a covariate because it captures essentially the same
construct as ADI (e.g., socioeconomic status), and it does not stratify patients as effectively as
ADI. Model fits were assessed by inspection of residuals, histograms, and 1:1 plots of observed
versus modeled dependent variables. Some outliers were observed for each of the four PROMIS
measures, as determined by Cook’s D and DFFITS, so robust variants of each regression were
run with a Huber loss function. The pattern of significance did not change, so the traditional
regression model results are reported. For the sub-analysis, Pearson’s chi-square tests were
performed to compare the race and sex demographic breakdown between each ADI national
quartile. Missing data were omitted from all analyses, and p<.05 was set as the level of
significance a priori. All data analyses were performed using SAS Base v9.4 (SAS Institute, Inc.,
Cary, NC) and R (4.0.2, Vienne, Austria).
RESULTS
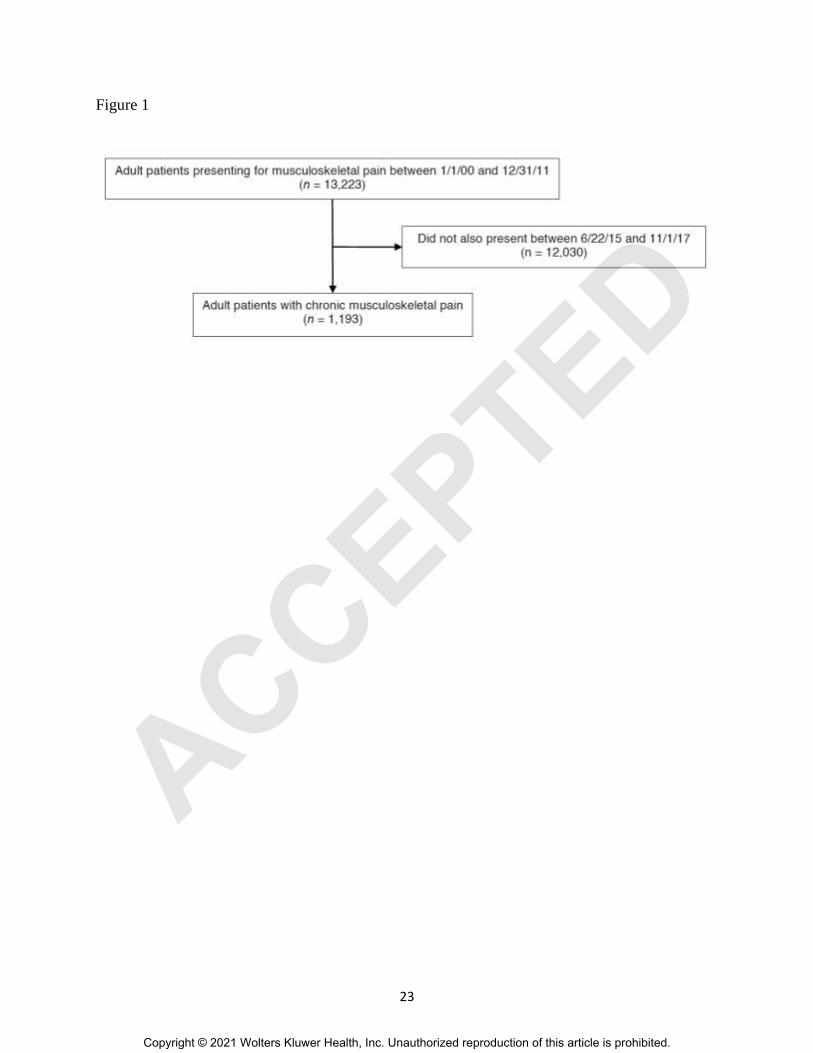
In total, 1,193 patients (mean age 56.3 ± 13.0 years) met the study criteria (Figure 1). The
majority of patients self-reported white race (981, 82.2%) and female sex (843, 70.7%), and
patients were nearly evenly distributed across all four ADI national quartiles of social
disadvantage (Table 1).
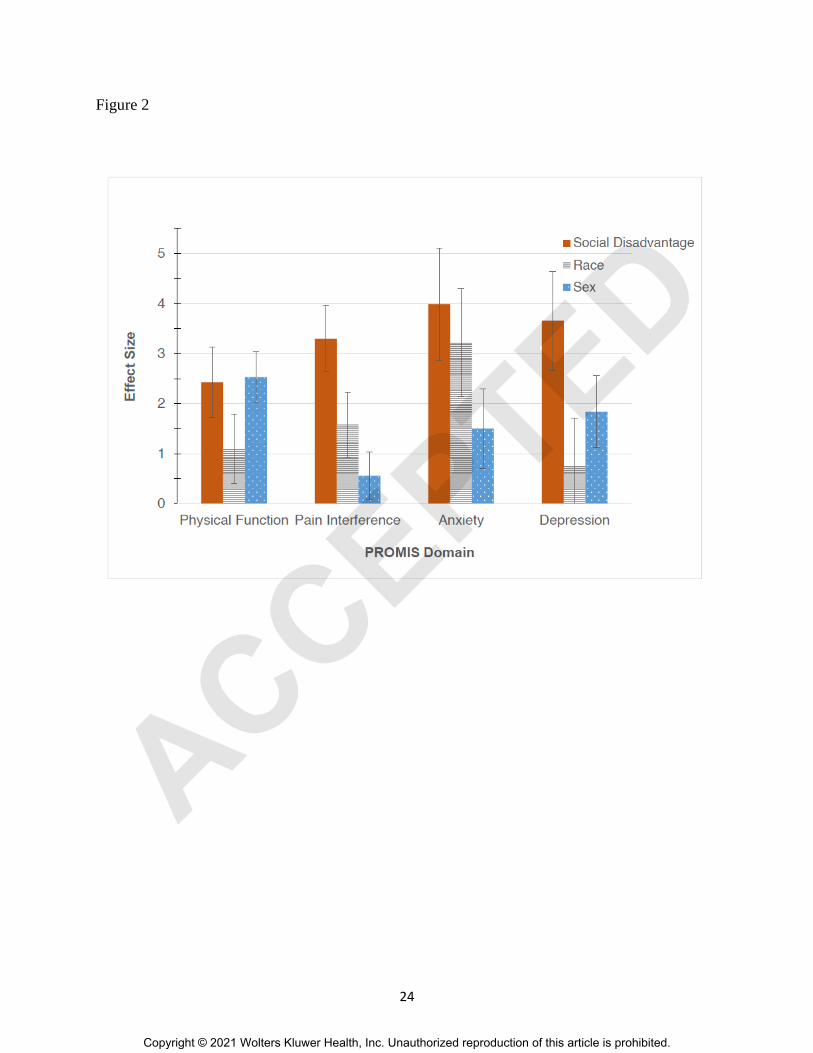
Disparate social disadvantage was independently associated with clinically meaningfully worse
self-reported physical and behavioral health in all domains assessed (PROMIS Physical Function
Β -2.4 points [95% CI -3.8 to -1.0], Pain Interference 3.3 [2.0 to 4.6], Anxiety 4.0 [1.8 to 6.2],
Copyright © 2021 Wolters Kluwer Health, Inc. Unauthorized reproduction of this article is prohibited.
ACCEPTED
13
and Depression 3.7 points [1.7 to 5.6]) (Table 2, Figure 2). Even when compared to the
intermediate national ADI quartiles (Q2 and Q3), pain interference was meaningfully worse in
communities scoring in the worst ADI quartile.
Black race was independently and meaningfully associated with greater anxiety than white race
(3.2 points [1.1 to 5.3]), and female sex was associated with worse physical function than male
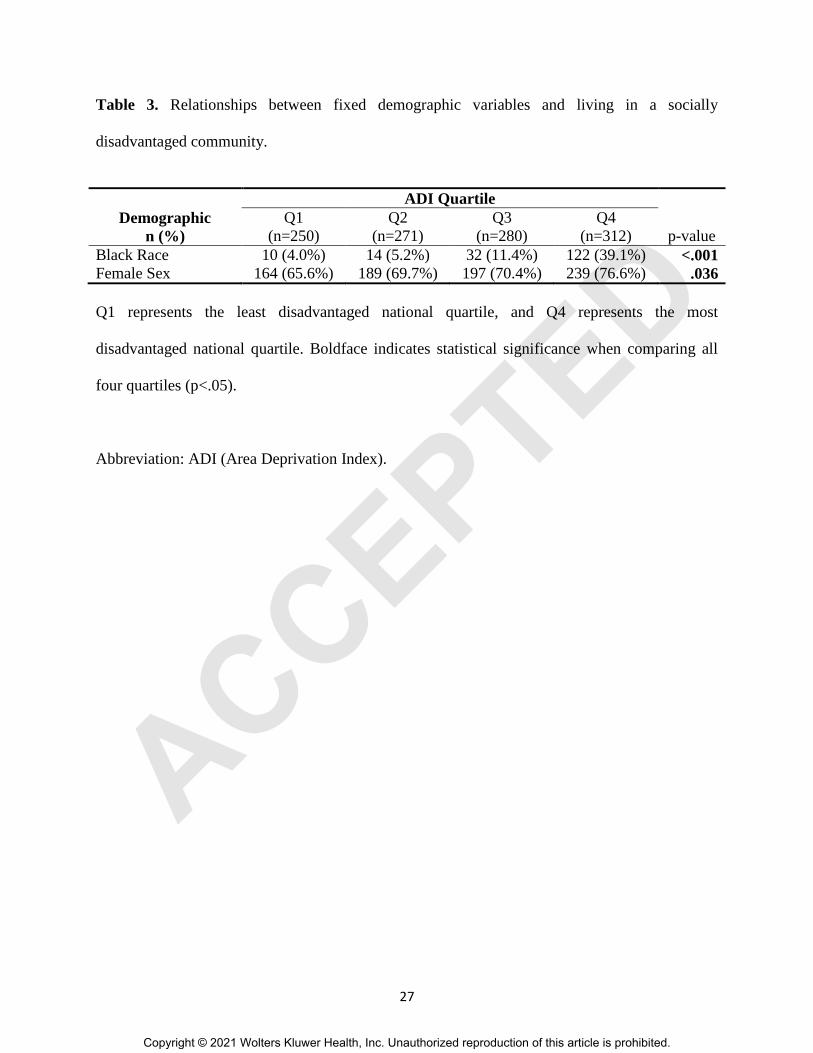
sex (-2.5 points [-3.5 to -1.5]). Furthermore, sub-analysis revealed that, compared to less
disadvantaged communities, a relatively greater proportion of Black and female patients lived in
the most disadvantaged communities (Worst ADI national quartile: 122/312 (39.1%) Black vs
Best quartile: 10/250 (4.0%) Black, p<.001; Worst quartile: 239/312 (76.6%) female vs Best
quartile: 164/250 (65.6%) female, p=.036) (Table 3).
DISCUSSION
This study examined associations between sociodemographic variables and self-reported health
in patients who presented to a physiatric practice for chronic musculoskeletal pain. Disparate
social disadvantage was the single variable consistently associated with meaningfully worse
physical and behavioral health in all domains assessed. Contrary to the study hypothesis, Black
race was only independently associated with worse anxiety symptoms, and female sex was only
independently associated with worse physical function. However, Black race and female sex
were disproportionately represented in the most disadvantaged communities.
The study findings are consistent with established literature, but they also address gaps identified
by Penman-Aguilar et al. and Alegria et al. regarding identification of which sociodemographic
Copyright © 2021 Wolters Kluwer Health, Inc. Unauthorized reproduction of this article is prohibited.
ACCEPTED
14
variables most strongly influence health and outcomes and should therefore be prioritized when
designing interventions.9 ,11 ,14
The findings build on previous work by Wright et al., which also
demonstrated that social environment is associated with both physical and behavioral health in
patients presenting for orthopedic conditions.15
In contrast to Wright’s analysis, this study
specifically focused on patients with chronic pain who were managed by non-operative
specialists. These patients are less likely than the general orthopedic population to have
spontaneous pain resolution or to be candidates for a surgical intervention, so it is possible the
psychological and long-term social burden of these patients’ musculoskeletal conditions may be
greater. Furthermore, this study incorporated race into the discussion of important
sociodemographic variables, whereas race was not a focus in Wright’s study. Because the study
institution is located in a region with an especially deep-rooted history and persistence of racial
segregation and race-related health disparities,25
associations between race and self-reported
health were particularly important to examine. Black patients are less likely to be prescribed
controlled substances, be screened for depression, or receive behavioral health care.26
The study findings can be interpreted as encouraging because, unlike a person’s race or sex,
social disadvantage can be systematically modified on a large scale. Targeted intervention to
address upstream social factors such as education, housing, employment, income support,
nutrition support, care coordination, and provider biases are effective means to improving overall
health, facilitating treatment adherence, and reducing healthcare expenditures.27 ,28
That is,
genetic and epigenetic variables may indeed play some role in health disparities,8 but based on
the study findings, strategic efforts to create opportunities and improve geographic
neighborhoods may be the most important type of intervention to achieve health equity in the
Copyright © 2021 Wolters Kluwer Health, Inc. Unauthorized reproduction of this article is prohibited.
ACCEPTED

15
chronic pain population. Even the higher anxiety levels in Black patients may be addressed by
tackling societal issues such as housing discrimination and exposure to disproportionate police
violence.29
The study results also highlight the importance of interpreting PROMIS scores within the context
of the geographic or patient population of interest. That is, during development, the PROMIS
domain scores were standardized using a population with a demographic distribution that
mirrored the 2000 United States General Census, which was 12.3% Black, 75.1% white, and
included people with a wide variety of educational levels. In contrast, the metro region around
the study institution clinic sites is 29.9% Black,30
and the distribution of this study population
was 15.6% Black. Therefore, average PROMIS Anxiety scores in the community surrounding
the study institution may be worse than a T-score of 50. Until health equity is achieved across the
entire sociodemographic spectrum, healthcare providers striving to practice personalized
medicine should consider interpreting a patient’s PROMIS scores within the context of his/her
sociodemographics, rather than simply comparing patients’ T-scores to the general U.S.
population. That is, the “average” person represented in the U.S. Census likely is not very
representative of patients in sociodemographic minorities. It is important to keep in mind that
social variables may be influencing patients’ self-reported health as much, if not more than, the
condition for which they present for medical attention.
Limitations
There are several study limitations. First, the demographic distribution required that race
categories were condensed to White, Black, and Other, and biological sex was recorded as a
Copyright © 2021 Wolters Kluwer Health, Inc. Unauthorized reproduction of this article is prohibited.
ACCEPTED

16
binary variable and could not take into account gender identity. Second, the patient population
was derived from a single department of a single institution. Nevertheless, the sample size was
large, and the study institution draws from a diverse, multi-state urban and rural catchment area.
These factors should be considered when interpreting the generalizability of the study. Third, the
variables examined in this study only accounted for a modest proportion of the variance observed
for each health measure (R2 = 0.06-0.11). This was to be expected since the purpose of the study
was to evaluate relative associations between sociodemographic variables and health, rather than
to create a prediction model or to capture all potential variables which could be influencing
health (such as more detailed features of patients’ musculoskeletal conditions). Finally, this
cross-sectional study cannot establish causality between sociodemographic variables and self-
reported health.
CONCLUSIONS
In summary, in patients presenting with chronic musculoskeletal pain, social disadvantage was
associated with worse physical function, pain interference, anxiety, and depression symptoms,
whereas Black race was only associated with more anxiety symptoms, and female sex was only
associated with worse physical function. However, patients of Black race and female sex were
more likely to live in socially disadvantaged neighborhoods. If these findings are confirmed with
prospective investigation, the results support that strategic investment to ameliorate disadvantage
in geographically defined communities may be an effective strategy to improving health in these
at-risk populations.
Copyright © 2021 Wolters Kluwer Health, Inc. Unauthorized reproduction of this article is prohibited.
ACCEPTED

17
ACKNOWLEDGMENTS
This authors thank Lee Rhea, PhD, and Matthew Schuelke, PhD (Washington University), for
their assistance with statistical analysis for this study.
Copyright © 2021 Wolters Kluwer Health, Inc. Unauthorized reproduction of this article is prohibited.
ACCEPTED
18
REFERENCES
1. Meyer PA, Penman-Aguilar A, Campbell VA, Graffunder C, O'Connor AE, Yoon PW.
Conclusion and future directions: CDC Health Disparities and Inequalities Report -
United States, 2013. MMWR Suppl 2013;62(3):184-6.
2. Mossey JM. Defining racial and ethnic disparities in pain management. Clin. Orthop. Relat.
Res. 2011;469(7):1859-70.
3. Asada Y, Whipp A, Kindig D, Billard B, Rudolph B. Inequalities in multiple health outcomes
by education, sex, and race in 93 US counties: why we should measure them all. Int J
Equity Health 2014;13:47.
4. Kind AJH, Jencks S, Brock J, et al. Neighborhood socioeconomic disadvantage and 30-day
rehospitalization: a retrospective cohort study. Ann. Intern. Med. 2014;161(11):765-74.
5. Dorn AV, Cooney RE, Sabin ML. COVID-19 exacerbating inequalities in the US. Lancet
2020;395(10232):1243-44.
6. Paradies Y, Ben J, Denson N, et al. Racism as a Determinant of Health: A Systematic Review
and Meta-Analysis. PLoS One 2015;10(9):e0138511.
7. Molix L. Sex differences in cardiovascular health: does sexism influence women's health?
Am. J. Med. Sci. 2014;348(2):153-5.
8. Horvath S, Gurven M, Levine ME, et al. An epigenetic clock analysis of race/ethnicity, sex,
and coronary heart disease. Genome Biol. 2016;17(1):171.
9. Penman-Aguilar A, Talih M, Huang D, Moonesinghe R, Bouye K, Beckles G. Measurement
of Health Disparities, Health Inequities, and Social Determinants of Health to Support the
Advancement of Health Equity. J. Public Health Manag. Pract. 2016;22 Suppl 1(Suppl
1):S33-42.
Copyright © 2021 Wolters Kluwer Health, Inc. Unauthorized reproduction of this article is prohibited.
ACCEPTED
19
10. Bey GS, Jesdale B, Forrester S, Person SD, Kiefe C. Intersectional effects of racial and
gender discrimination on cardiovascular health vary among black and white women and
men in the CARDIA study. SSM Popul Health 2019;8:100446.
11. Alegría M, NeMoyer A, Falgàs Bagué I, Wang Y, Alvarez K. Social Determinants of Mental
Health: Where We Are and Where We Need to Go. Current psychiatry reports
2018;20(11):95.
12. Dahlhamer J, Lucas J, Zelaya C, et al. Prevalence of Chronic Pain and High-Impact Chronic
Pain Among Adults - United States, 2016. MMWR. Morbidity and mortality weekly
report 2018;67(36):1001-06.
13. Janevic MR, McLaughlin SJ, Heapy AA, Thacker C, Piette JD. Racial and Socioeconomic
Disparities in Disabling Chronic Pain: Findings From the Health and Retirement Study. J.
Pain 2017;18(12):1459-67.
14. Green CR, Hart-Johnson T. The association between race and neighborhood socioeconomic
status in younger Black and White adults with chronic pain. J. Pain 2012;13(2):176-86.
15. Wright MA, Adelani M, Dy C, OʼKeefe R, Calfee RP. What is the Impact of Social
Deprivation on Physical and Mental Health in Orthopaedic Patients? Clin. Orthop. Relat.
Res. 2019;477(8):1825-35.
16. Goesling J, Lin LA, Clauw DJ. Psychiatry and Pain Management: at the Intersection of
Chronic Pain and Mental Health. Current psychiatry reports 2018;20(2):12.
17. Cella D, Yount S, Rothrock N, et al. The Patient-Reported Outcomes Measurement
Information System (PROMIS): progress of an NIH Roadmap cooperative group during
its first two years. Med. Care 2007;45(5 Suppl 1):S3-S11.
18. PROMIS Score Cut Points. Secondary PROMIS Score Cut Points 2019.
Copyright © 2021 Wolters Kluwer Health, Inc. Unauthorized reproduction of this article is prohibited.
ACCEPTED
20
http://www.healthmeasures.net/score-and-interpret/interpret-scores/promis/promis-score-
cut-points.
19. Liu H, Cella D, Gershon R, et al. Representativeness of the Patient-Reported Outcomes
Measurement Information System Internet panel. J. Clin. Epidemiol. 2010;63(11):1169-
78.
20. Lee AC, Driban JB, Price LL, Harvey WF, Rodday AM, Wang C. Responsiveness and
Minimally Important Differences for 4 Patient-Reported Outcomes Measurement
Information System Short Forms: Physical Function, Pain Interference, Depression, and
Anxiety in Knee Osteoarthritis. J. Pain 2017;18(9):1096-110.
21. Kroenke K, Yu Z, Wu J, Kean J, Monahan PO. Operating characteristics of PROMIS four-
item depression and anxiety scales in primary care patients with chronic pain. Pain Med.
2014;15(11):1892-901.
22. Chen CX, Kroenke K, Stump TE, et al. Estimating minimally important differences for the
PROMIS pain interference scales: results from 3 randomized clinical trials. Pain
2018;159(4):775-82.
23. Schalet BD, Cook KF, Choi SW, Cella D. Establishing a common metric for self-reported
anxiety: linking the MASQ, PANAS, and GAD-7 to PROMIS Anxiety. J. Anxiety
Disord. 2014;28(1):88-96.
24. Choi SW, Schalet B, Cook KF, Cella D. Establishing a common metric for depressive
symptoms: linking the BDI-II, CES-D, and PHQ-9 to PROMIS depression. Psychol.
Assess. 2014;26(2):513-27.
25. Oliveri R. Setting the stage for Ferguson: Housing discrimination and segregation in St.
Louis. Mo L Rev. 2015;80:1053.
Copyright © 2021 Wolters Kluwer Health, Inc. Unauthorized reproduction of this article is prohibited.
ACCEPTED
21
26. Hahm HC, Cook BL, Ault-Brutus A, Alegría M. Intersection of race-ethnicity and gender in
depression care: screening, access, and minimally adequate treatment. Psychiatr. Serv.
2015;66(3):258-64.
27. Taylor LA, Tan AX, Coyle CE, et al. Leveraging the Social Determinants of Health: What
Works? PLoS One 2016;11(8):e0160217.
28. Anastas TM, Miller MM, Hollingshead NA, Stewart JC, Rand KL, Hirsh AT. The Unique
and Interactive Effects of Patient Race, Patient Socioeconomic Status, and Provider
Attitudes on Chronic Pain Care Decisions. Ann. Behav. Med. 2020;54(10):771-82.
29. Bor J, Venkataramani AS, Williams DR, Tsai AC. Police killings and their spillover effects
on the mental health of black Americans: a population-based, quasi-experimental study.
Lancet 2018;392(10144):302-10.
30. Bureau USC. QuickFacts. Secondary QuickFacts.
https://www.census.gov/quickfacts/stlouiscitymissouricounty.
Copyright © 2021 Wolters Kluwer Health, Inc. Unauthorized reproduction of this article is prohibited.
ACCEPTED

22
FIGURE LEGENDS
Figure 1. Flowsheet of included patients presenting for evaluation of chronic musculoskeletal
pain between 2015 and 2017
Figure 2. Relative associations between sociodemographics and health
Caption 2. The y-axis represents the absolute value of each regression coefficient when also
controlling for age and chronic opioid status. “Social Disadvantage” depicts the comparison of
outcome measures between communities with disparate social disadvantage, which is defined as
communities in the most versus least disadvantaged national quartiles of the Area Deprivation
Index (Q4 versus Q1). “Race” depicts the comparison of Black versus white. “Sex” depicts the
comparison of female versus male. Error bars represent the standard error.
Copyright © 2021 Wolters Kluwer Health, Inc. Unauthorized reproduction of this article is prohibited.
ACCEPTED
23
Figure 1
Copyright © 2021 Wolters Kluwer Health, Inc. Unauthorized reproduction of this article is prohibited.
ACCEPTED
24
Figure 2
Copyright © 2021 Wolters Kluwer Health, Inc. Unauthorized reproduction of this article is prohibited.
ACCEPTED

25
Table 1. Sociodemographics and self-reported health of 1,193 patients evaluated for chronic
musculoskeletal pain between 2015-2017.
Mean (SD) or
n (%)
Missing (n)
Age (Years) 56.3 (13.0) 0
Female Sex 843 (70.7%) 0
Race 0
White 981 (82.2%)
Black 186 (15.6%)
Other 26 (2.2%)
ADI quartile 80
1 (Least disadvantaged) 250 (22.5%)
2 271 (24.3%)
3 280 (25.2%)
4 (Most disadvantaged) 312 (28.0%)
Insurance 171
Private 511 (51.0%)
Medicare 464 (46.3%)
Medicaid 26 (2.6%)
Other 1 (0.0%)
Chronic Opioid Use 352 (31.6%) 80
PROMIS Score
Physical Function 37.2 (7.6) 36
Pain Interference 63.7 (7.1) 40
Anxiety 55.1 (10.5) 256
Depression 50.4 (10.4) 53
Meets Clinically Significant Thresholda
Anxiety 237 (25.3%) 256
Depression 200 (17.5%) 53
a Predetermined thresholds for clinically significant behavioral health disorders are defined as
PROMIS Depression ≥ 59.9 and PROMIS Anxiety ≥ 62.3 based on established linkage tables
developed by Schalet et al.23 ,24
Abbreviations: ADI (Area Deprivation Index), PROMIS (Patient-Reported Outcomes
Measurement Information System).
Copyright © 2021 Wolters Kluwer Health, Inc. Unauthorized reproduction of this article is prohibited.
ACCEPTED

26
Table 2. Associations between sociodemographic variables and self-reported health in 1,193
patients evaluated for chronic musculoskeletal pain.
PROMIS domain n R2 Social Variable Β (SE) 95% CI p
Physical Function 993 0.108
Race = Black
Sex = Female
ADI = Q2
ADI = Q3
ADI = Q4
-1.1 (0.7)
-2.5 (0.5)
-1.0 (0.7)
-1.0 (0.7)
-2.4 (0.7)
-2.5
-3.5
-2.4
-2.4
-3.8
to 0.2
to -1.5
to 0.3
to 0.3
to -1.0
.11
< .001
.13
.13
< .001
Pain Interference 988 0.088
Race = Black
Sex = Female
ADI = Q2
ADI = Q3
ADI = Q4
1.6 (0.7)
0.6 (0.5)
2.1 (0.6)
2.2 (0.6)
3.3 (0.7)
0.3
-0.4
0.9
0.9
2.0
to 2.8
to 1.5
to 3.3
to 3.4
to 4.6
.015
.25
.001
< .001
< .001
Anxiety 808 0.066
Race = Black
Sex = Female
ADI = Q2
ADI = Q3
ADI = Q4
3.2 (1.1)
1.5 (0.8)
1.3 (1.1)
1.9 (1.1)
4.0 (1.1)
1.1
-0.1
-0.8
-0.2
1.8
to 5.3
to 3.1
to 3.4
to 3.9
to 6.2
.003
.06
.22
.08
< .001
Depression 977 0.059
Race = Black
Sex = Female
ADI = Q2
ADI = Q3
ADI = Q4
0.8 (1.0)
1.8 (0.7)
0.8 (1.0)
1.4 (0.9)
3.7 (1.0)
-1.1
0.43
-1.0
-0.5
1.7
to 2.6
to 3.2
to 2.7
to 3.2
to 5.6
.44
.01
.39
.14
< .001
A multiple linear regression model is presented for each PROMIS domain. Reference values for
the sociodemographic variables of interest include: Race=White, Sex=Male, ADI=Q1 (quartile
with the least social disadvantage). Age and chronic opioid use are also covariates in the models.
The p-value for all four models was <.001. Boldface indicates statistical significance for the
respective independent variable (p<.05).
Abbreviations: PROMIS (Patient-Reported Outcomes Measurement Information System), ADI
(Area Deprivation Index).
Copyright © 2021 Wolters Kluwer Health, Inc. Unauthorized reproduction of this article is prohibited.
ACCEPTED
27
Table 3. Relationships between fixed demographic variables and living in a socially
disadvantaged community.
ADI Quartile
Demographic
n (%)
Q1
(n=250)
Q2
(n=271)
Q3
(n=280)
Q4
(n=312) p-value
Black Race 10 (4.0%) 14 (5.2%) 32 (11.4%) 122 (39.1%) <.001
Female Sex 164 (65.6%) 189 (69.7%) 197 (70.4%) 239 (76.6%) .036
Q1 represents the least disadvantaged national quartile, and Q4 represents the most
disadvantaged national quartile. Boldface indicates statistical significance when comparing all
four quartiles (p<.05).
Abbreviation: ADI (Area Deprivation Index).
Copyright © 2021 Wolters Kluwer Health, Inc. Unauthorized reproduction of this article is prohibited.
ACCEPTED