the influence of sales strategies on customer purchase...
TRANSCRIPT
International Journal of Academic Research in Business and Social Sciences May 2014, Vol. 4, No. 5
ISSN: 2222-6990
340 www.hrmars.com
The Influence of Sales Strategies on Customer Purchase Pattern in the Telecommunication Industry in Ghana
Martin Owusu Ansah Adventist Senior High School, P. O. Box B 219, Bantama – Kumasi
Email : [email protected]
DOI: 10.6007/IJARBSS/v4-i5/859 URL: http://dx.doi.org/10.6007/IJARBSS/v4-i5/859 Abstract The purpose of the study was to examine the influence of sales strategies on customer purchase pattern in the Ghanaian Telecommunication industry. It was conducted to assess how customers are influenced by the various marketing strategies of Telecommunication companies before purchase decisions are taken. The study was an exploratory in nature. Convenient sampling technique was used in selecting 250 mobile phone users from the Business city of Kumasi. Data was collected from both primary and secondary sources. Primary data was in a form of self-administered questionnaires and interviews in eliciting information for the study while the secondary data was culled from other related works as well as information from the internet. Pilot testing of twenty questionnaires was also employed to ensure reliability and validity of the data. Qualitative and Quantitative research approaches were also adopted .A Statistical Package for Social Sciences software using Regression; Mann-Whitney U test as well as a one – way between group Analysis of Variance ( Anova ) was used in analyzing the data. It was revealed from the study that, there was a strong relationship between the strategies used by companies and their purchase pattern. Corporate social responsibility activities and Sales promotional activities were seen to be strong in influencing customers towards the purchase of Telecommunication products. The study also recommended for the Telecommunication companies to embark on corporate social responsibility as panacea for an increased in patronage of their products. The use of frequency marketing strategy in rewarding loyal customers through the giving of discounts, provision of useful information to loyal subscribers must also be adopted to increase purchase. The results also indicated some statistically significant differences between the Gender and Age groups, which can have important implications for marketing officers in the telecommunication business. Keywords: Guerilla marketing, Strategies, Telecommunication, Frequency marketing, Marketing strategy. Introduction The growth of the telecommunications industry over the past decades has been responsible for the great changes in the technology of our day to day correspondence. Information and communication technologies currently permeate every aspect of human life (Melhem & Tandon, 2009).The Telecommunication companies have changed the world entirely through

International Journal of Academic Research in Business and Social Sciences May 2014, Vol. 4, No. 5
ISSN: 2222-6990
341 www.hrmars.com
their activities from business, academia, multinational co-operations among others with far reaching impacts and benefits to all.
Ghana’s telecommunication industry was controlled mainly by the Ghana Post, Telephone and Telegraph (PTT) which was a Government owned. Between 1994 and 2000, Ghana moved from a government controlled PTT to a competitive telecom environment that allowed strong internet and mobile telecom network providers to operate as a result of deregulation of Ghana’s telecommunications sector in 1994 under the Accelerated Development Program (ADP) 1994-2000 (Addy-Nayo, 2001).The aim was to attract investments and improve competition within the communication sector and it later led to the proliferation of Telecommunication companies to Ghana coupled with the sound political atmosphere for investment and businesses.
In 2010 two fixed line and six mobile phone mobile companies were authorized to operate in Ghana of which 5 were operating, 13 satellite providers were authorized of which 8 were operating, 176 VSAT providers were authorized of which 57 were operating, and 99 public and private network operators were authorized of which 25 were operating. The authorized telecommunications companies were Mobile Telecommunication Network (MTN), Vodafone Ghana which purchased Telecom Ghana, Tigo which replaced Mobitel (Millicom International Cellular), Bhrti Airtel and Zain which acquired Western Telesystems Ltd (Westel), Glo Mobile Ghana Limited and Expresso Telecom which acquired Kasapa Telecom.
Deregulation and reduced entry barriers into the Ghanaian Telecommunication industry have led to intense competition as the number of operators swell-up to contend for market shares (Frempong, 2002). Competition among multiple mobile-cellular providers has spurred growth in the industry which has made it intense to compete in Ghana. In view of that, all the authorized companies have been embarking on serious strategies other than the traditional marketing strategies to increase their market share so as to survive in the Telecommunication industry. The market share of mobile operators in Ghana for the month of August 2013 for MTN was 46.31%, followed by Vodafone 21.21%, Tigo 13.76%, Airtel 12.24% Glo 5.92% and at the bottom was Expresso 0.57% (NCA, 2013). In 2014, MTN maintained its position as the dominant mobile operator with its subscriber base increasing from 12,968,610 to 12,986,832 as at the end of February, 2014.Vodafone’s subscriber base of 6,244,855 ending January increased to 6,413,376 in February 2014, representing 22.41% of the total market share. Tigo’s subscriber base shot up to 4,086,615 representing 14.28 % of the market share at the end of the review month. Airtel’s subscriber base at the end of February, 2014 also indicated an increase from 3,508,411 to 3,537,316 subscribers which represents 12.36% of the total market share. GLO’s market share from January ending reduced from 5.17% to 5.02% as at the end of February 2014, with a subscriber base of 1,437,580. Expresso ended the month of February, 2014 with a market share of 0.54%, as a result of a decrease in their subscriber base from 168,998 in January to 153,727 (NCA,2014).
International Journal of Academic Research in Business and Social Sciences May 2014, Vol. 4, No. 5
ISSN: 2222-6990
342 www.hrmars.com
It demonstrates how the telecommunication companies are shifting from the traditional marketing strategies to a strategy the researcher termed as Guerilla marketing –where corporate social responsibility activities, promotions, credit facilities, advertising, data base marketing, frequency marketing are all combined in reaching potential purchasers at a giving period of time. Problem Statement Traditionally, marketing strategy is a plan for pursuing the firm’s objective or how the company will apply its marketing goals within a specific market segment (Kotler, 2010; Walker, 2011). Marketing strategies have a major impact upon the efficiency and cost structure of any company. The competitive nature of companies have forced marketers, business owners, researchers, scholars in applying several dimensions to designate marketing strategies as business strategies. All of these dimensions based on marketing mix but scholars have added other variables in order to make it more meaningful (Adis, 2010). Slater et al., (2010) explained that generally, the concept of marketing strategy extensively embraces marketing mix elements, which consists of product, price, distribution and promotion and other activities. In investigating towards the strategies used by the communication companies, it was realized that, the traditional marketing strategies were not common but a Guerilla Marketing strategies like the use of corporate social responsibility activities, providing credits to customers, embarking on sales promotions, advertising, proclamation of proper service delivery in advertisement all for the purpose of letting customers to purchase their products are apparent in Ghana now. The effectiveness of the strategies employed by the telecommunication companies towards the purchase of preferred companies’ products in Ghana has necessitated this study.
Research objectives
The general objective of the study was to examine the influence of strategies on the customer purchase in the Telecommunication companies in Ghana. The specific objectives were to :
Determine the relationship between strategies and purchase pattern in the Kumasi metropolis.
Analyze customer preference to a particular Telecommunication product in the metropolis.
Examine the relationship between Gender and purchase pattern of Telecommunication products
Assess the relationship between Age groups and purchase pattern of Telecommunication products.
Research Questions The study will be guided by the following questions:
Is there a relationship between strategy and purchase pattern?
International Journal of Academic Research in Business and Social Sciences May 2014, Vol. 4, No. 5
ISSN: 2222-6990
343 www.hrmars.com
Is there a preference for a particular Telecommunication product among customers?
Is there an association between Gender and purchase pattern?
Is there a difference between age groups and purchase pattern? Significance of the study The research is expected to impact on the Academia, marketing practitioners and the general public. Academia The outcome of this study will add to the existing store of knowledge on the subject and serve as a source of reference for further research on appropriate marketing strategies towards a particular industry other than the traditional marketing strategies. Marketing practitioners This research and its findings are expected to help in decision making processes in the area of adoption and implementation of a particular strategy that will fit a particular market; it will provide a critical and analytical perspective for understanding the use of guerilla marketing and frequency marketing from the viewpoint of consumer learning behavior, consumer attitude change as well as consumer perception towards a particular service. General public It will also serve as a useful research and reference material for the general public about the activities of the Telecommunication companies. Scope of the study The scope of the study was within the Kumasi Metropolis in the Ashanti Region of Ghana where mobile telecommunication users were used. Five Telecommunication companies were employed based on their performance and frequent activities in communities and on the social media. The view points of the mobile users were used while the companies’ perspective about the subject was not considered for the purpose of the study. Methodology It talked about the procedures that were used in undertaking the entire research. They were the research design and approach, population and sample size, data sources, data collection techniques, sampling techniques, data analysis plan.
Research design and approach The purpose of the research strategy is to provide an overall plan of how to answer the research questions (Saunders et al., 2003).Yin (2003) provided five types of research strategies applicable to social science research namely: experiment, survey, archival analysis, history and case study. The study employed a survey strategy which was appropriate for seeking the opinion of the target population where the researcher designs questionnaires for data collection to answer the research questions (Cooper & Schindler, 2006) .Quantitative research approach is more useful for testing while the qualitative research is more useful for discovering (Hair et al.,2007).The study therefore employed both quantitative and qualitative research approaches based on the stated objectives to be achieved.

International Journal of Academic Research in Business and Social Sciences May 2014, Vol. 4, No. 5
ISSN: 2222-6990
344 www.hrmars.com
Population and sample size The population comprised all mobile telecom users within the Kumasi Metropolis. Two hundred and fifty respondents were selected for the study due to the cost involved in sampling all mobile users in the metropolis. Inference will be drawn from the sample to represent the entire population. Inferential studies provide analyses that may assist in predicting results across an entire population based upon data gathered from a certain sample (Howell, 2002)
Sampling Technique Convenient sampling technique was used in gathering the data for the study. It was adopted in getting the respondents at their own expediency until the required sample size was reached
Data Collection Instruments The study combined both primary data and secondary data sources. The primary data was in a form of questionnaires and interviews in eliciting information from the respondents while the secondary data was culled from other related works. Having multiple sources of data helps secure the reliability of interviews and minimize the risk of having some answers misinterpreted (Ringdal, 2001).
Pilot – testing of the instrument Pilot testing is done with slight adjustments to improve readability and clarity of questionnaire (O’Neill, 2000).Twenty of the questionnaires were pilot tested or pre-tested with twenty respondents from the Kumasi central market. Corrections were then made to the answered questionnaires until the edited questionnaires were made available to the two hundred and fifty mobile phone users at the city centre for the actual data collection.
Data Collection Procedure A period of three months ( January 2014 to March 2014 ) was used throughout the distribution and collection of the questionnaires. Self-administered and structured questionnaires were used to collect data from respondents as recommended for a large survey (Saunders et al., 2000). Questionnaires were distributed within the Kumasi metropolis. Some questionnaires were retrieved hours after their distribution while the rest were received within the three month period until all the two hundred and fifty questionnaires were received for the final analysis. Data Analysis The collected data were analyzed using charts and table to ensure easy and quick interpretation. Responses were expressed in frequencies and percentages. Statistical Package for Social Sciences (SPSS) was used in the analysis. Regression analysis, Mann-Whitney U test as well as a One-way Anova was all used as part of the data analysis.
International Journal of Academic Research in Business and Social Sciences May 2014, Vol. 4, No. 5
ISSN: 2222-6990
345 www.hrmars.com
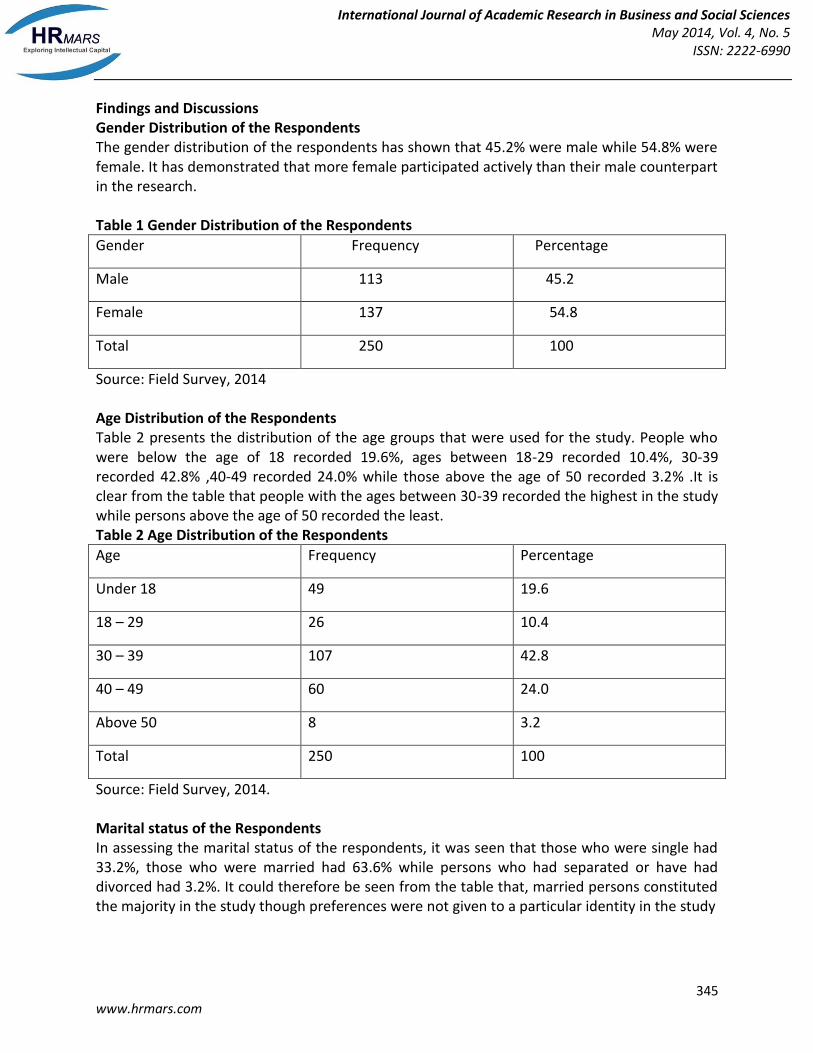
Findings and Discussions Gender Distribution of the Respondents The gender distribution of the respondents has shown that 45.2% were male while 54.8% were female. It has demonstrated that more female participated actively than their male counterpart in the research. Table 1 Gender Distribution of the Respondents
Gender Frequency Percentage
Male 113 45.2
Female 137 54.8
Total 250 100
Source: Field Survey, 2014 Age Distribution of the Respondents Table 2 presents the distribution of the age groups that were used for the study. People who were below the age of 18 recorded 19.6%, ages between 18-29 recorded 10.4%, 30-39 recorded 42.8% ,40-49 recorded 24.0% while those above the age of 50 recorded 3.2% .It is clear from the table that people with the ages between 30-39 recorded the highest in the study while persons above the age of 50 recorded the least. Table 2 Age Distribution of the Respondents
Age Frequency Percentage
Under 18 49 19.6
18 – 29 26 10.4
30 – 39 107 42.8
40 – 49 60 24.0
Above 50 8 3.2
Total 250 100
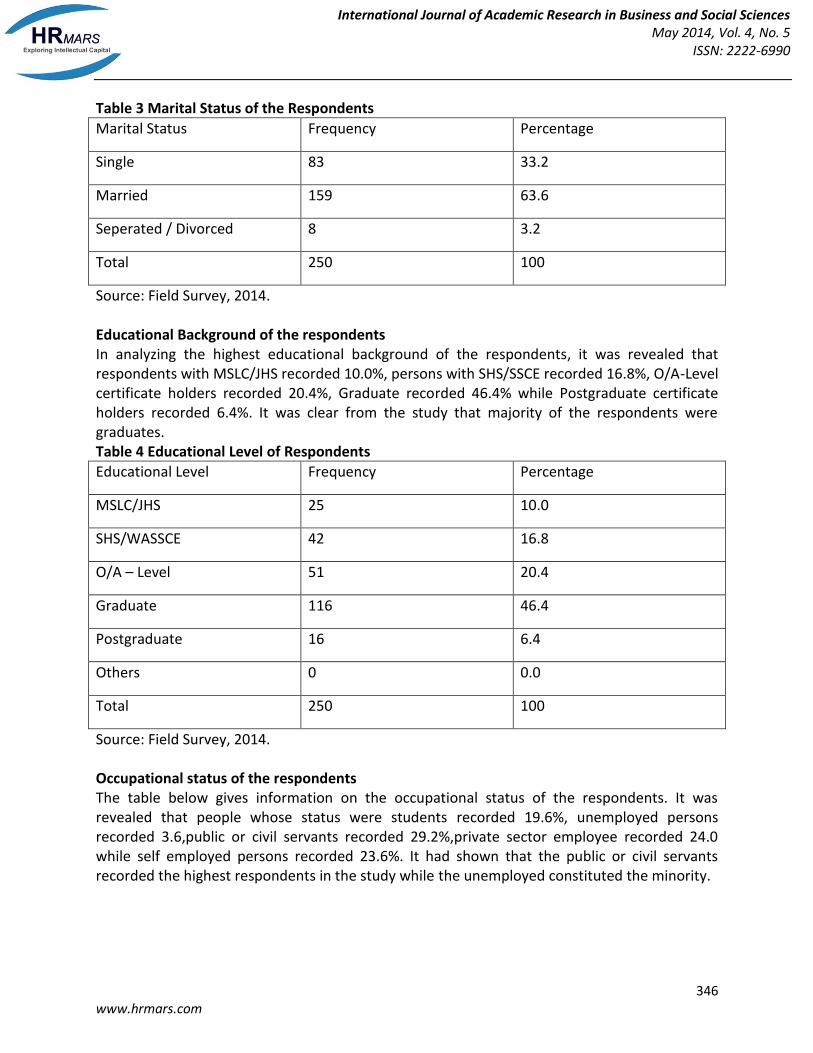
Source: Field Survey, 2014. Marital status of the Respondents In assessing the marital status of the respondents, it was seen that those who were single had 33.2%, those who were married had 63.6% while persons who had separated or have had divorced had 3.2%. It could therefore be seen from the table that, married persons constituted the majority in the study though preferences were not given to a particular identity in the study
International Journal of Academic Research in Business and Social Sciences May 2014, Vol. 4, No. 5
ISSN: 2222-6990
346 www.hrmars.com
Table 3 Marital Status of the Respondents
Marital Status Frequency Percentage
Single 83 33.2
Married 159 63.6
Seperated / Divorced 8 3.2
Total 250 100
Source: Field Survey, 2014. Educational Background of the respondents In analyzing the highest educational background of the respondents, it was revealed that respondents with MSLC/JHS recorded 10.0%, persons with SHS/SSCE recorded 16.8%, O/A-Level certificate holders recorded 20.4%, Graduate recorded 46.4% while Postgraduate certificate holders recorded 6.4%. It was clear from the study that majority of the respondents were graduates. Table 4 Educational Level of Respondents
Educational Level Frequency Percentage
MSLC/JHS 25 10.0
SHS/WASSCE 42 16.8
O/A – Level 51 20.4
Graduate 116 46.4
Postgraduate 16 6.4
Others 0 0.0
Total 250 100
Source: Field Survey, 2014. Occupational status of the respondents The table below gives information on the occupational status of the respondents. It was revealed that people whose status were students recorded 19.6%, unemployed persons recorded 3.6,public or civil servants recorded 29.2%,private sector employee recorded 24.0 while self employed persons recorded 23.6%. It had shown that the public or civil servants recorded the highest respondents in the study while the unemployed constituted the minority.

International Journal of Academic Research in Business and Social Sciences May 2014, Vol. 4, No. 5
ISSN: 2222-6990
347 www.hrmars.com
Table 5 Occupational Status of Respondents
Occupational Status Frequency Percentage
Student 49 19.6
Unemployed 9 3.6
Public/Civil Servant 73 29.2
Private Sector Employee 60 24.0
Self employed
Total
59
250
23.6
100
Source: Field Survey, 2014. Results from the one –way between group ANOVA on Ages and Purchase Pattern A one - way between group analysis of variance was conducted to explore the impact of impact of ages on purchase pattern. Participants were divided into five groups according to their ages. Group 1: Under 18; Group 2:18-29; Group 3:30-39; Group 4:40-49; Group 5:50 and above. There was a statistically significant difference at P = 0.00 which was less than 0.05 level in the purchase score for the five group of ages at F (4, 245 ) = 25.6 . Post – hoc comparison using the Tukey HSD Test indicated that the mean score for group 1:(M=1.00,SD=.000), Group 2:(M=1.00,SD=.000), Group 3:(M=1.78,SD=.705), Group 4:(M=1.43,SD=.500), Group5: (M=1.00,SD=.000). It shows that Groups 1, 2 and 5 recorded same while 3 and 4 were different; demonstrating the difference in the ages as far as purchase pattern was concerned as shown in table 6 and 7.
Table 6 A One –way between group ANOVA with Post-hoc Test
Sum of Squares Df Mean Square F Sig.
Between Groups
28.126 4 7.031 25.578 .000
Within Groups 67.350 245 .275
Total 95.476 249
International Journal of Academic Research in Business and Social Sciences May 2014, Vol. 4, No. 5
ISSN: 2222-6990
348 www.hrmars.com
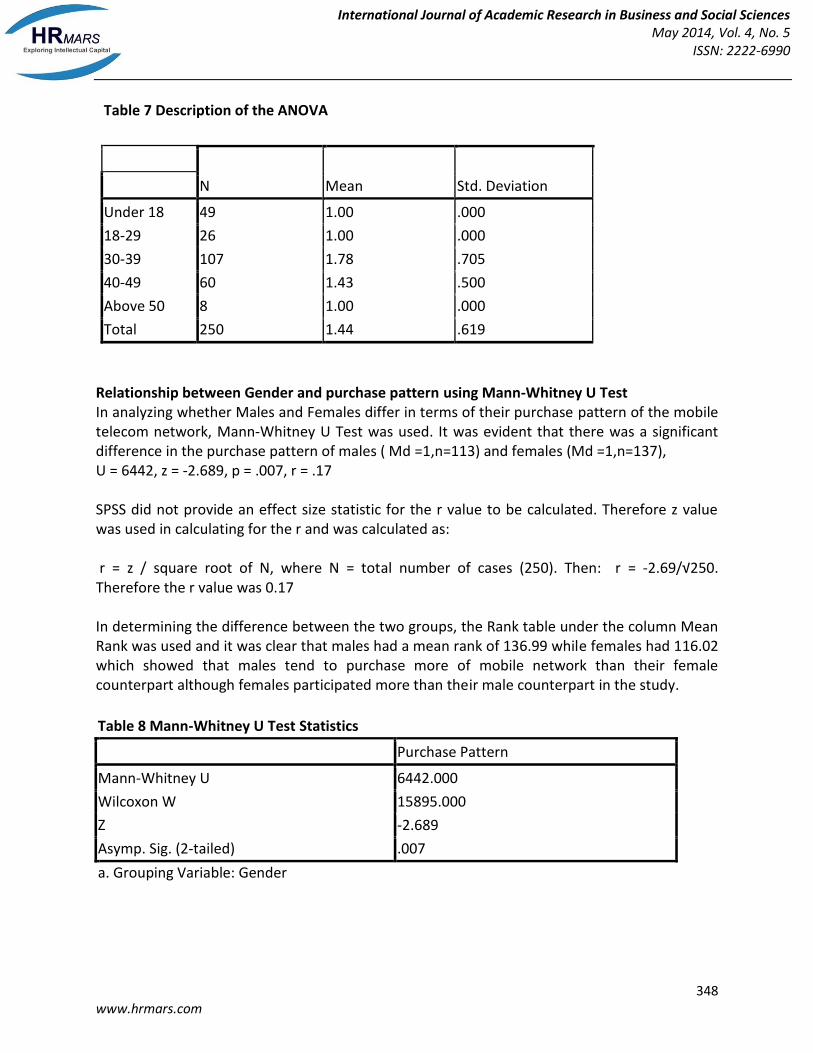
Table 7 Description of the ANOVA
N Mean Std. Deviation
Under 18 49 1.00 .000
18-29 26 1.00 .000
30-39 107 1.78 .705
40-49 60 1.43 .500
Above 50 8 1.00 .000
Total 250 1.44 .619
Relationship between Gender and purchase pattern using Mann-Whitney U Test In analyzing whether Males and Females differ in terms of their purchase pattern of the mobile telecom network, Mann-Whitney U Test was used. It was evident that there was a significant difference in the purchase pattern of males ( Md =1,n=113) and females (Md =1,n=137), U = 6442, z = -2.689, p = .007, r = .17 SPSS did not provide an effect size statistic for the r value to be calculated. Therefore z value was used in calculating for the r and was calculated as: r = z / square root of N, where N = total number of cases (250). Then: r = -2.69/√250. Therefore the r value was 0.17 In determining the difference between the two groups, the Rank table under the column Mean Rank was used and it was clear that males had a mean rank of 136.99 while females had 116.02 which showed that males tend to purchase more of mobile network than their female counterpart although females participated more than their male counterpart in the study.
Table 8 Mann-Whitney U Test Statistics
Purchase Pattern
Mann-Whitney U 6442.000
Wilcoxon W 15895.000
Z -2.689
Asymp. Sig. (2-tailed) .007
a. Grouping Variable: Gender
International Journal of Academic Research in Business and Social Sciences May 2014, Vol. 4, No. 5
ISSN: 2222-6990
349 www.hrmars.com
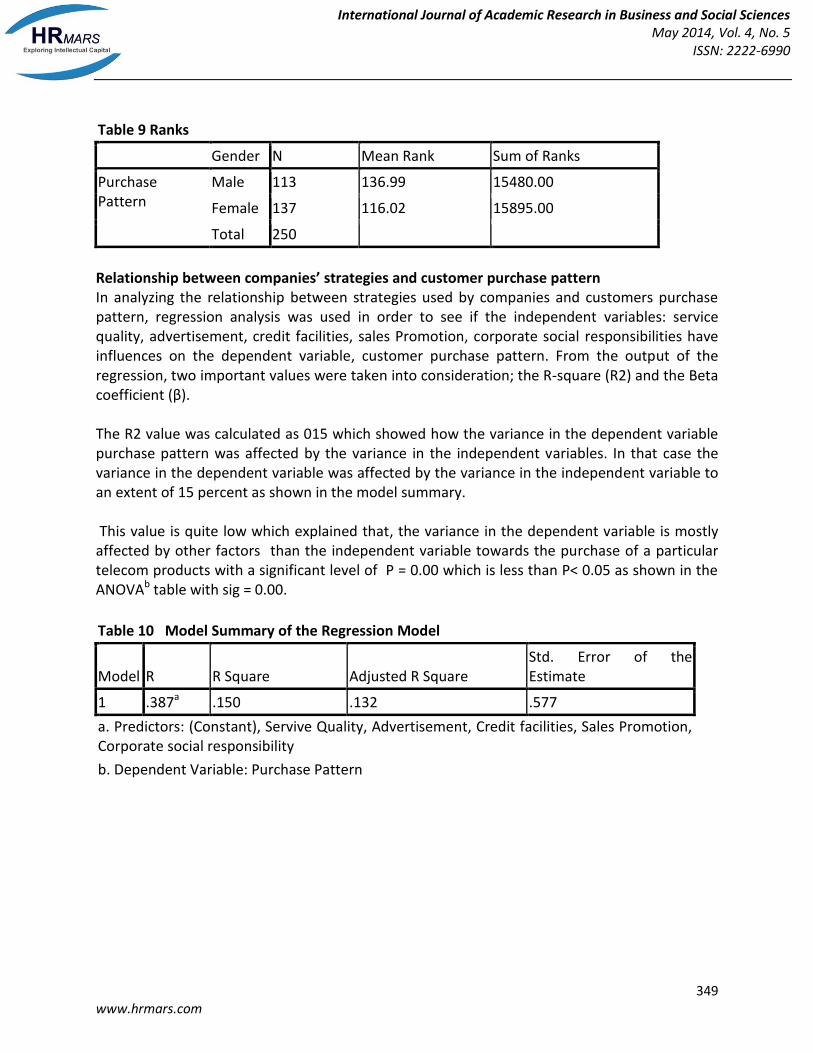
Table 9 Ranks
Gender N Mean Rank Sum of Ranks
Purchase Pattern
Male 113 136.99 15480.00
Female 137 116.02 15895.00
Total 250
Relationship between companies’ strategies and customer purchase pattern In analyzing the relationship between strategies used by companies and customers purchase pattern, regression analysis was used in order to see if the independent variables: service quality, advertisement, credit facilities, sales Promotion, corporate social responsibilities have influences on the dependent variable, customer purchase pattern. From the output of the regression, two important values were taken into consideration; the R-square (R2) and the Beta coefficient (β). The R2 value was calculated as 015 which showed how the variance in the dependent variable purchase pattern was affected by the variance in the independent variables. In that case the variance in the dependent variable was affected by the variance in the independent variable to an extent of 15 percent as shown in the model summary. This value is quite low which explained that, the variance in the dependent variable is mostly affected by other factors than the independent variable towards the purchase of a particular telecom products with a significant level of P = 0.00 which is less than P< 0.05 as shown in the ANOVAb table with sig = 0.00.
Table 10 Model Summary of the Regression Model
Model R R Square Adjusted R Square Std. Error of the Estimate
1 .387a .150 .132 .577
a. Predictors: (Constant), Servive Quality, Advertisement, Credit facilities, Sales Promotion, Corporate social responsibility
b. Dependent Variable: Purchase Pattern
International Journal of Academic Research in Business and Social Sciences May 2014, Vol. 4, No. 5
ISSN: 2222-6990
350 www.hrmars.com
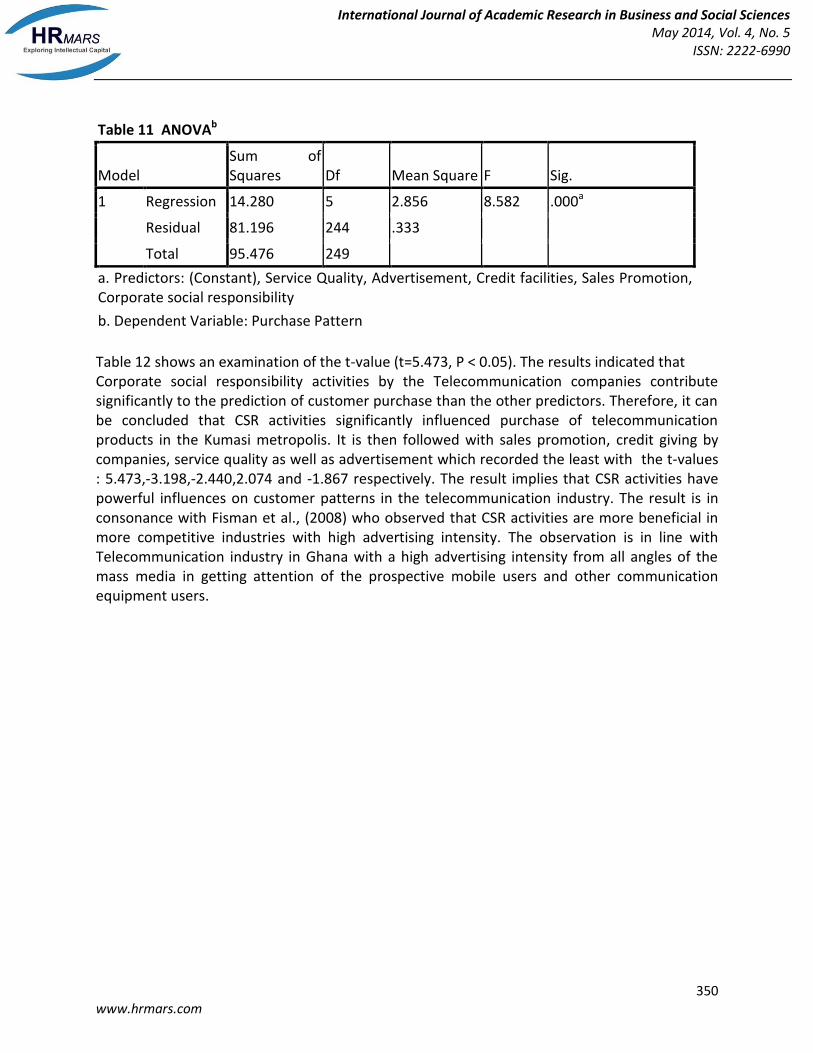
Table 11 ANOVAb
Model Sum of Squares Df Mean Square F Sig.
1 Regression 14.280 5 2.856 8.582 .000a
Residual 81.196 244 .333
Total 95.476 249
a. Predictors: (Constant), Service Quality, Advertisement, Credit facilities, Sales Promotion, Corporate social responsibility
b. Dependent Variable: Purchase Pattern
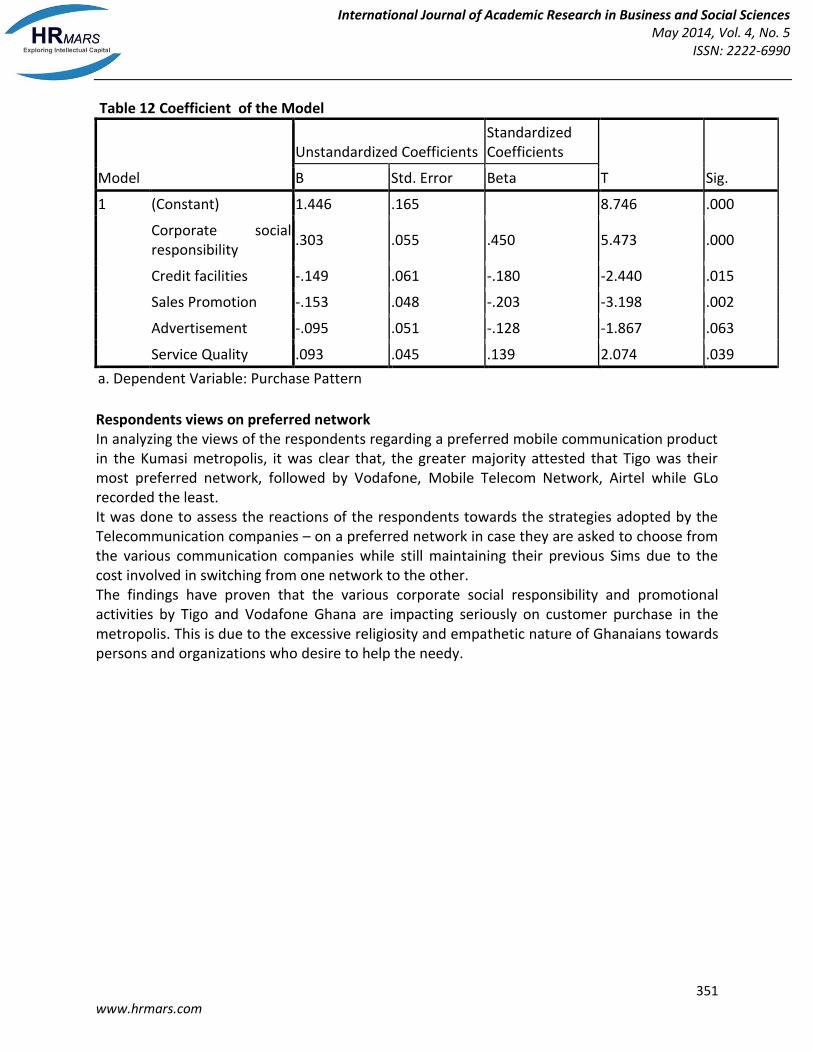
Table 12 shows an examination of the t-value (t=5.473, P < 0.05). The results indicated that Corporate social responsibility activities by the Telecommunication companies contribute significantly to the prediction of customer purchase than the other predictors. Therefore, it can be concluded that CSR activities significantly influenced purchase of telecommunication products in the Kumasi metropolis. It is then followed with sales promotion, credit giving by companies, service quality as well as advertisement which recorded the least with the t-values : 5.473,-3.198,-2.440,2.074 and -1.867 respectively. The result implies that CSR activities have powerful influences on customer patterns in the telecommunication industry. The result is in consonance with Fisman et al., (2008) who observed that CSR activities are more beneficial in more competitive industries with high advertising intensity. The observation is in line with Telecommunication industry in Ghana with a high advertising intensity from all angles of the mass media in getting attention of the prospective mobile users and other communication equipment users.
International Journal of Academic Research in Business and Social Sciences May 2014, Vol. 4, No. 5
ISSN: 2222-6990
351 www.hrmars.com
Table 12 Coefficient of the Model
Model
Unstandardized Coefficients Standardized Coefficients
T Sig. B Std. Error Beta
1 (Constant) 1.446 .165 8.746 .000
Corporate social responsibility
.303 .055 .450 5.473 .000
Credit facilities -.149 .061 -.180 -2.440 .015
Sales Promotion -.153 .048 -.203 -3.198 .002
Advertisement -.095 .051 -.128 -1.867 .063
Service Quality .093 .045 .139 2.074 .039
a. Dependent Variable: Purchase Pattern
Respondents views on preferred network In analyzing the views of the respondents regarding a preferred mobile communication product in the Kumasi metropolis, it was clear that, the greater majority attested that Tigo was their most preferred network, followed by Vodafone, Mobile Telecom Network, Airtel while GLo recorded the least. It was done to assess the reactions of the respondents towards the strategies adopted by the Telecommunication companies – on a preferred network in case they are asked to choose from the various communication companies while still maintaining their previous Sims due to the cost involved in switching from one network to the other. The findings have proven that the various corporate social responsibility and promotional activities by Tigo and Vodafone Ghana are impacting seriously on customer purchase in the metropolis. This is due to the excessive religiosity and empathetic nature of Ghanaians towards persons and organizations who desire to help the needy.

International Journal of Academic Research in Business and Social Sciences May 2014, Vol. 4, No. 5
ISSN: 2222-6990
352 www.hrmars.com
Fig 1 A diagram showing the most preferred network by the Respondents
Conclusions and Recommendations The following conclusions were drawn from the study: The relationship between sales strategies and customer purchase The study sought to find the relationship that existed between sales strategies and purchase pattern of customers. Regression model was used and it indicated that there was a relationship between them since P was equal to 0.00 which was less than 0.05. The independent variables explained 15% of the variation in the dependant variable, which showed that other factors a part from the variables used could also influence customers to make a purchase. There is the need for Telecommunication companies to employ Guerilla marketing strategies as part of their sales strategies with specific emphasis on corporate social responsibility activities

International Journal of Academic Research in Business and Social Sciences May 2014, Vol. 4, No. 5
ISSN: 2222-6990
353 www.hrmars.com
because it recorded the highest towards customers preferred activity before purchasing a particular telecommunication product. The difference in Gender and Purchase Mann-Whitney U test was used in determining the difference between Gender and Purchase pattern. It was revealed that males purchase more of mobile telecommunication products than female. The study recommends for telecommunication companies to target males in the purchase of their of products though females participated more in the study than their male counterpart. The difference in Age groups and Purchase In exploring the impact of age groups on purchase. A one-way between group ANOVA was used in analyzing the difference. There was a difference in the age groups as P < 0.05 at P= 0.00. It indicated that age: Under 18, 18 – 29 and 50 recorded same in their purchase patterns while 30 - 39 and 40 - 49 were also different in their purchase pattern which demonstrated the difference in the ages as far as purchase pattern was concerned. Telecommunication companies must target the working class that is those between the ages of 30-39 as well as 40-49, because they constituted the majority who has the purchasing power in buying communication products ranging from the Sim ( Subscriber Identification Module ) cards to other accessories Customer preference to a particular mobile network The study revealed that more people would prefer to have Tigo and Vodafone as their preferred Telecommunication networks. It was clear from the research that the CSR activities of Tigo towards the building schools, hospitals in villages were contributing factors towards the purchase of their products while the CSR activities by Vodafone Ghana especially the “Vodafone Healthline “ has also attracted a lot of people towards the purchase of Vodafone products in Ghana. Reference Slater, S, F., Hult, G, T, M., & Olson, E, M. (2010), Factors influencing the relative importance of marketing strategy creativity and marketing strategy implementation effectiveness. Industrial Marketing Management 39(4), 551-559. Walker, O. (2011), Outlines and Highlights for Marketing Strategy: A Decision Focused Approach by cram 101. Kotler, P. (2010). Principles of Marketing: A South Asian Perspective, 13/E: Pearson Education India. Adis, A, A, A. (2010), Export Performance on the Malaysian Wooden Furniture Industry: An Empirical Study. Journal of International Food and Agribusiness and Marketing 22(1-2),52-69. Melhem, S. & Nidhi T. (2009), Information and Communication Technologies for Women’s Socio-Economic Empowerment; World Bank Group Working Paper Series Howell, D. (2002).Statistical methods for Psychology Pacific Grove, CA: Duxbury.

International Journal of Academic Research in Business and Social Sciences May 2014, Vol. 4, No. 5
ISSN: 2222-6990
354 www.hrmars.com
O’Neill, D. (2000).The impact of school facilities on students achievement, behavior, attendance and teacher turnover rate at selected middle schools XIII ESC. Unpublished doctoral dissertation, Texas University, College Station, TX. Donald R., C. & Pamela S,S. (2006) Business Research Methods (9th ed.), empirical investigation, Journal of Service Research1 (2), pp. 108-28. Saunders, M, N, K. (2000) Research Methods for Business Students, 2nd Edition, Financial Times/ Prentice Hall Frempong, G. (2002). Telecommunication Reforms-Ghana’s Experience National Communication Authority. Ghana National Telecom Policy. 2005. NCA-Subscriber Base Information, 2014. Overview of the Industry Statistics (Online). Retrieved from: http://www.nca.org.gh/overviewofindustrystatistics.html (Accessed: 26 April, 2014). Ringdal, K. ( 2001). Unity and Diversity, Social Science research and qualitative methods. Oslo: Fagbokforlaget. Saunders, M., Lewis, P. & Thornhill, A. (2003), Research Methods for Business Students,3rd Edition, Harlow. Prentice Hall. Yin, R, K. (2003), Case study Research: Design and Methods 3rd Edition, Thousand Oaks, Calif, Sage Publication. Fisman R., Heal, G . & Nair, V, B. (2008), A model of corporate philanthropy. Working paper, Columbia University, New York.