the influence of school and teaching quality on...
TRANSCRIPT

Research Report DCSF-RR028
Effective Pre-school and PrimaryEducation 3-11 Project (EPPE 3-11)
The Influence of School andTeaching Quality onChildren’s Progress inPrimary School
Pam Sammons$, Kathy Sylva+, Edward Melhuish#,Iram Siraj-Blatchford*, Brenda Taggart*, Sofka Barreau* and Yvonne Grabbe*
$University of Nottingham, +University of Oxford,#Birkbeck, University of London and *Institute of Education, University of London

Effective Pre-school and Primary Education 3-11 Project(EPPE 3-11)
The Influence of School and Teaching Qualityon Children’s Progress in Primary School
Pam Sammons$, Kathy Sylva+, Edward Melhuish#, Iram Siraj-Blatchford*, Brenda Taggart*, Sofka Barreau*
and Yvonne Grabbe*
$University of Nottingham, +University of Oxford,#Birkbeck, University of London
and *Institute of Education, University of London
The views expressed in this report are the authors’ and do not necessarily reflect those of the Department for Children,Schools and Families.
© Institute of Education, University of London 2008ISBN 978 1 84775 122 5
Research Report NoDCSF-RR028

THE EPPE 3-11 RESEARCH TEAM
Principal Investigators
Professor Kathy SylvaDepartment of Educational Studies, University of Oxford00 44 (0)1865 274 008 / email [email protected]
Professor Edward MelhuishInstitute for the Study of Children, Families and Social IssuesBirkbeck University of London00 44 (0)207 079 0834 / email [email protected]
Professor Pam SammonsSchool of Education, University of Nottingham00 44 (0)115 951 4434 / email [email protected]
Professor Iram Siraj-BlatchfordInstitute of Education, University of London00 44 (0)207 612 6218 / email [email protected]
*Brenda TaggartInstitute of Education, University of London00 44 (0)207 612 6219 / email [email protected]
Research Officers
Dr Sofka BarreauInstitute of Education, University of London00 44 (0)207 612 6608 / email [email protected]
Olga CaraInstitute of Education, University of London00 44 (0)207 612 6608 / email [email protected]
Dr Helena JelicicInstitute of Education, University of London00 44 (0)207 612 6608 / email [email protected]
Rebecca SmeesInstitute of Education, University of London00 44 (0)207 612 6608 / email [email protected]
Database Manager
Dr Stephen HuntInstitute of Education, University of London00 44 (0)207 612 6608 / email [email protected]
Tracking Officer
Wesley WelcommeInstitute of Education, University of London00 44 (0)207 612 6684 / email [email protected]
*Also Research Co-ordinator
ACKNOWLEDGEMENT
The EPPE 3-11 project is a major longitudinal study funded by the Department for Children,Schools and Families (DCSF). The research would not be possible without the support and co-operation of the six Local Authorities (LAs) and the many pre-school centres, primary schools,children and parents participating in the research. We are particularly grateful to WesleyWelcomme for his contribution in preparing this report.

Contents Page numberExecutive Summary i
Introduction 1
Aims of the Analyses 1
Methods 2
Overview of the report 3
Section 1: The Sample 4
1.1 The sample of focal schools 4
1.2 The sample of children in the focal schools 4
Section 2: The Classroom Observation Instruments 8
2.1 The Instructional Environment Observation Scale (IEO, Stipek) 8
2.2 The Classroom Observation System (COS-5, Pianta) 8
2.3 Key Dimensions in Classroom Processes 10
The Instructional Environment Observation Scale (IEO, Stipek) Factors 10
The Classroom Observation System (COS-5, Pianta) Factors 11
Section 3: The Influence of Classroom Processes on Cognitive and
Social/behavioural Development 13
3.1 The Classroom Observation System for Fifth Grade (COS-5, Pianta) 13
The influence of overall Teaching quality 13
Quality of Pedagogy 14
Disorganisation 15
Attention and control 16
Child positivity 17
Positive engagement 18
3.2 Instructional Environment Observation Scale (IEO, Stipek) 18
Pedagogy in Literacy 18
Pedagogy in Numeracy 19
Subject development in Numeracy 20
3.3 Teacher Survey Results 21
Section 4: The relationship between Ofsted judgements and Cognitive and
Social/behavioural development 26
4.1 School effectiveness 26
4.2 Improvement since last inspection 27
4.3 Leadership 29
4.4 Quality of assessment 29
Summary and Conclusions 32
Classroom Processes 32
What matters in the classroom 33
What matters in the school 34
Quality matters (Ofsted Inspection Measures) 35
Other influences 35
References 37
Appendix 1: Development of models 40
Appendix 2: Results of Multilevel Analyses 44
Appendix 3: EPPE 3-11 imputation of missing data 51
Appendix 4: Teacher questionnaire - Parent and Pupil factors 52
Appendix 5: IEO (Stipek) 53
Appendix 6: The COS-5 (NICHD/Pianta) Instrument 55
Appendix 7: Training and Reliability 58
Appendix 8: Data Entry and Analysis 59
Appendix 9: Indicators of classroom behaviours using the COS-5 (Pianta)
Measures of Quality 60
Appendix 10: Indicators of classroom behaviours using the IEO (Stipek) scale 62
Appendix 11: Methodology for the social/behavioural analysis 67
Appendix 12: Effect Sizes 70
Appendix 13: EPPE Technical Papers in the series 71
Glossary of terms 73
i
Executive Summary
This report investigates the way school and classroom processes affect the cognitiveprogress and social/behavioural development of children between the ages of 6 (Year 1)and 10 (Year 5) in primary schools in England.
The research is part of the larger longitudinal study of Effective Pre-School and PrimaryEducation (EPPE 3-11) funded by the Department for Children, Schools and Families(DCSF) that is following children’s cognitive and social/behavioural development fromages 3 to 11 years. The EPPE 3-11 study investigates both pre-school and primaryschool influences on children’s attainment, progress and social/behaviouraldevelopment. This report describes the results of quantitative analyses based on a sub-sample of 1160 EPPE children across Year 1 to 5 of primary education. The researchbuilds on the earlier analyses of children’s Reading and Mathematics attainments andsocial/behavioural outcomes in Year 5 for the full EPPE 3-11 sample (see Sammons,2007a; 2007b), by investigating relationships between children’s outcomes andmeasures of classroom processes, collected through direct observation of Year 5classes in 125 focal schools chosen from the larger EPPE 3-11 data set. The analysesalso explore patterns of association between children’s outcomes and broader measuresof overall school characteristics derived from teacher questionnaires and Ofstedinspection reports for this sub-sample of schools.
Structure of the reportSection 1: Describes the sub-sample of schools in which classroom observations wereconducted; and also presents the distribution of background variables for the sub-sampleof EPPE 3-11 children and compares these to the characteristics of the larger EPPE 3-11 sample as a whole.
Section 2: Provides summary details of the two observation instruments used for theinvestigation of classroom processes and teachers’ behaviour. The two instrumentsused are the Classroom Observation System for Fifth Grade (COS-5, NICHD/Pianta2001) and the Instructional Environment Observation Scale (IEO, Stipek 1999). Theunderlying dimensions related to classroom processes are outlined and the creation ofoverall summary indicators of Teaching quality based on the two instruments described.
Section 3: Describes the results of multilevel analyses of children’s cognitive progress inReading and Mathematics between Years 1 and 5 and of development in foursocial/behavioural outcomes (Self-regulation, Hyperactivity, Pro-social and Anti-socialbehaviour) over the same period. The analyses examine the predictive power forvarious child outcomes of: an overall measure of Teaching quality, other observationalmeasures and questionnaire-derived measures of teacher perceptions of schoolpractices.
Section 4: Investigates the predictive power of various global measures of school qualitybased on Ofsted inspection judgements of school effectiveness, improvement andleadership as well as more specific measures such as quality of assessment.
The final section summarises the main results and conclusions.
ii
Key FindingsBoth teachers’ classroom practice and overall school-level factors make a significantdifference to children’s academic and social/behavioural progress during primary schoolafter controlling for the influence of child, family and home learning environment (HLE)factors. Classroom factors, (particularly overall Teaching quality and Child positivity,which combines teacher-child and peer relationships and children’s own self-reliance)and Parental support have an important influence on children’s progress in Readingbetween Year 1 and Year 5. School-level factors were relatively less important forReading. Progress in Mathematics, however, is relatively equally influenced by factorsat classroom-level (overall Teaching quality and Quality of Pedagogy) and school-level(Quality of school leadership, School communication with parents, Use of homework andschool standards). This finding is in accord with EPPE 3-11 analyses for the full samplethat indicate stronger school effects for children’s progress in Mathematics (Sammons etal., 2007a).
The influence of overall Teaching quality on Reading and Mathematics is stronger thanthe net influence of some background factors such as gender and family disadvantage(measured by eligibility for free school meals - FSM), but weaker than the influence ofEarly Years Home Learning Environment (HLE) and mothers’ qualifications.
The influence of primary schools upon Children’s social/behavioural developmentalprogress appears to operate more through school-level characteristics (significantpredictors include measures of Anti-academic ethos, Use of homework and schoolstandards and the extent of recent school Improvement since last inspection) rather thanclassroom-level factors. The exception is the observed measure of Quality of Pedagogy,which is beneficial both for reducing pupils’ Hyperactivity, and promoting their Pro-socialbehaviour and Self-regulation (e.g. concentration, self-reliance).
What matters in the classroomAn earlier report (Sammons et al., 2006) has provided a detailed analysis of the twoclassroom observation instruments used in this sub-study: Classroom ObservationSystem for Fifth Grade (COS-5, Pianta, 2001) and the Instructional EnvironmentObservation Scale (IEO, Stipek, 1999). Year 5 was chosen for observations because itavoided possible influences associated with preparations for National assessments atthe end of Key Stage 2. The initial analyses found that teachers’ and children’sobserved behaviours differed significantly across the 125 Year 5 classes observed(Sammons et al., 2006). The two observation instruments identified significant variationsin observed quality indicating that children’s educational experiences in Year 5 classesdiffered significantly with some having the benefit of higher quality experiences.
A number of important underlying dimensions of classroom processes were identifiedsuch as Quality of Pedagogy, Disorganisation, Child positivity, pupils’ Positiveengagement and the extent of Attention and control, as well as specific features ofpractice related to literacy and numeracy teaching and learning. In this report theseunderlying dimensions are tested in multilevel models of children’s progress anddevelopment to establish whether there is any evidence that variations in classroomexperiences influence children’s outcomes. In addition, global measures of overallTeaching quality were derived as a composite of the dimensions of classroom practicesmentioned above, and tested to establish whether teachers can be classified intodifferent groups, on the basis of overall teaching quality.
iii
The goal was to investigate experiences in Year 5 classes that were related to children’seducational outcomes in Year 5. Multilevel models were used to test the predictivepower of different measures of classroom processes and overall Teaching quality inrelation to children’s progress/development across Years 1 to 5. The models ofchildren’s progress control for prior attainment (or prior social behaviour) measured inYear 1 as well as a wide range of child, family and home learning environment (HLE)influences. The progress/developmental gains are measured over a four year period inprimary school. The outcomes studied include Reading and Mathematics (measured byNFER standardised tests) and four social/behavioural measures derived from teachers’ratings of individual children (covering the four dimensions of Hyperactivity, Self-regulation, Anti-social behaviour and Pro-social behaviour)1.
It was hypothesised that higher quality classroom experiences would predict better childprogress between Year 1 and Year 5. School effectiveness research has drawnattention to the importance of the classroom level in accounting for variations in studentoutcomes in many studies but such research has generally only tested limited measuresof classroom processes and usually only examined cognitive outcomes (Teddlie &Reynolds, 2000). The EPPE 3-11 research has studied a detailed set of classroommeasures obtained from observations in Year 5 and a number of different indicators ofchildren’s outcomes and thus can explore the relative strength of different features on awide range of outcomes.
Overall Teaching QualityThe results indicated that the overall measure of Teaching quality was a significant andmoderate to strong predictor of both Reading (ES=0.35) and Mathematics progress(ES=0.37) for EPPE 3-11 children in the 125 schools. These differences refer to thecontrast between the High and Low groups on the overall measure of Teaching quality.However, this overall measure did not show any clear pattern of relationships inpredicting differences in children’s social/behavioural development.
Three important conclusions can be drawn from these results. First, it is possible toclassify teachers in Year 5 classes into groups according to differences in their overallTeaching quality across a range of different dimensions of classroom behaviour andpractice.
Second, overall Teaching quality is a significant predictor of cognitive progress forchildren across the period Year 1 to Year 5. Children in schools where Year 5 overallTeaching quality was observed to be High do significantly better in both Reading andMathematics than those attending schools where Year 5 quality was observed to beLow.
Third, the overall quality of teaching as measured by the instruments had a consistentinfluence on children’s academic progress but not on children’s social/behaviouraldevelopment.
Nonetheless, more specific aspects of classroom processes were found to predict bothbetter social/behavioural development and better cognitive progress.
It is possible to use effect sizes (ES) to compare the strength of different factors such asoverall Teaching quality with that of other background influences on children’s progress.
1 For further details of the social/behavioural measures see Sammons et al., 2007b).

iv
For example, the influence of overall Teaching quality is similar in order to the netinfluences of mothers’ highest qualification level (comparing the influence of havingacademic qualifications at age 18 years versus no qualifications) and larger than the netinfluence of either gender or eligibility for FSM, for example). Further details ofbackground effects are shown in the Appendix 2 of this report. For more detailedinformation on the ES of background factors (on the full sample) see Sammons et al.,(2007a; 2007b).
Aspects of TeachingHigh levels of observed classroom Disorganisation in Year 5 (related to teachers’organisation and the behavioural climate of the classroom) were associated with poorerprogress in Reading, Mathematics and Hyperactivity.
The factor Disorganisation is related to the behavioural climate of the classroom andsupports earlier teacher and school effectiveness studies indicating that a calm andorderly climate facilitates learning and teaching. Elsewhere we have shown associationsbetween social disadvantage in the primary school intake and the level ofDisorganisation in Year 5 classes (Sammons et al., 2006). It may be harder for teachersto maintain good order in schools serving higher proportions of disadvantaged children.It may also be the case that poorer classroom practice is one contributory factor inexplaining the poorer outcomes of children in more disadvantaged communities. It islikely that both explanations play a part. Our analyses have tested and controlled for(where significant) a wide range of significant background measures, including parents’qualifications, occupations and income. The results show that, over and above suchinfluences, features of classroom experience such as Disorganisation seem to play animportant role in shaping children’s educational outcomes.
Other research (Ross & Hutchings, 2003; Darling-Hammond, 2002; Wirt et al., 2002;2003) has suggested that schools in disadvantaged settings can find it harder to recruitand retain teachers. This suggests that a stronger emphasis on promoting overall qualityof teaching and a more orderly classroom climate will be important features of initiativesto promote better educational outcomes for pupils in schools that serve above averageproportions of disadvantaged children.
While the overall Teaching quality was equally important for promoting both Reading andMathematics progress, specific features of Quality of Pedagogy in Year 5 showedstronger relationships with children’s Mathematics progress. Reviews of school andteacher effectiveness research have suggested that schools vary more in the effects onMathematics than on Reading (Scheerens and Bosker, 1997; Muijs and Reynolds,2005). These results suggest that the overall Teaching quality seems to be equallyimportant for both outcomes but that specific features of classroom processes, such asQuality of pedagogy, tend to be better predictors of children’s progress in Mathematics. Itwas also found to be important for children’s progress in terms of reducing Hyperactivity,and promoting Pro-social behaviour and Self regulation. More detailed guidance on thefeatures of Pedagogy associated with this higher quality factor may prove helpful inpromoting improvement in practice. Items in the Quality of Pedagogy factor includedrichness of instructional method, a positive climate, productive use of instructional time,the use of evaluative feedback, teacher sensitivity and lack of teacher detachment.Overall, this factor describes a classroom where teachers provide a rich learningenvironment, where pupils are challenged in their learning and provided with specificevaluative feedback on how to improve their work, as well as a positive emotionalclimate.

v
The quality of Attention and control observed in the classroom was also found to belinked with better progress in Maths and better development in Self-regulation, while themeasure of observed Child Positivity, (which involved the nature of Child-Teacherrelationships, children’s co-operative skills and their self-reliance) is a factor that relatesmore to the emotional features of classroom processes and was a predictor of betterprogress in Reading.
What matters in the schoolIn addition to classroom observation measures, the teachers of the observed classescompleted a questionnaire to explore teachers’ perceptions of different aspects ofschool/classroom processes and organisation. A number of underlying dimensions wereidentified. These were then tested in the multilevel progress models to predict childoutcomes in Year 5.
Use of homework and school standardsTeachers’ reports on the Use of homework and school standards indicated a positiverelationship with Mathematics progress although the strongest effects were for theMedium group. Higher scores on this factor were also associated with betterdevelopmental gains for Self-regulation and Pro-social behaviour. For these two aspectsof children’s social behaviour results were stronger for the High versus the Low group.The items included: teachers set homework every week for their class, most teachersmark and return homework promptly, and whether the overall standards set for pupils atthe school were perceived to be high enough.
Pupils’ agency and voiceProgress in Reading was positively linked with the factor Pupils’ agency and voice.Differences were largest between the Low and the Medium-High groups suggesting thatmoderate levels of Pupils’ agency and voice have a more positive impact on progress inReading than either Low or High levels. Self-regulation was also positively linked withthe factor on Pupils’ agency and voice. Children in schools where teachers indicatedHigh or Medium-High levels of Pupils’ agency and voice showed significantly increasedlevels of Self-regulation.
It was hypothesised that children would show positive social behaviour in schools wherepupils had greater opportunities to organise activities for themselves and their views arelistened to and accommodated, however the findings appear to suggest otherwise.Contrary to expectations, children’s Hyperactive and Anti-social behaviour wassignificantly increased in schools where teachers indicated High levels of Pupils’ agencyand voice. These schools may be responding to bad pupil behaviour by giving moreemphasis to pupils’ voice so Pupils’ agency and voice may be a constructive responseby schools seeking to counter negative behaviour. Alternatively, some moderate amountof involvement and autonomy may be optimum, and beyond a certain point, children atthis age may not respond well to high levels of autonomy because such strategies mayadversely affect the disciplinary climate. Further study of Pupil Agency and voice may beneeded to explore these associations and their impact.
Anti-academic ethosSchools with high levels of Anti-academic ethos showed significantly poorer progress inReading and Mathematics; differences were mainly between the High and Low groups.The relationships between Anti-academic ethos and the social/behavioural dimensionswere more graduated, showing a steady decrease in Pro-social behaviour and a steady
vi
increase in Hyperactive and Anti-social behaviour as a function of increasing Anti-academic ethos in the school.
Parental communication and supportTwo factors (from the teacher questionnaire): School communication with parents andParental support of their child’s learning were significant predictors of better outcomes forthe EPPE 3-11 sub-sample in Year 5.
Of the two factors, teachers’ perceptions of School communication with parents was thestronger predictor (Reading ES=0.38, Mathematics ES=0.34) with children making betterprogress in schools where teachers reported good communication (such as parentsbeing regularly informed about their child’s progress/achievements and the school beinggood at communicating its expectations of pupils to parents). This factor also predictedbetter developmental progress for Self regulation (ES=0.27) (which is strongly linked tocognitive outcomes).
Teachers’ judgements of overall Parental support of their child’s learning also showed asignificant positive relationship with pupils’ progress in Reading (ES=0.28) but not inMathematics; this factor was also found to be a strong and positive predictor of Pro-social behaviour (ES=0.38).
Overall these findings indicate that, taking account of other influences, children makebetter progress in schools where teachers reported good communication with parents inaspects such as communicating expectations of pupils to parents, or regularly informingparents about their child’s progress and achievements.
Quality matters (Ofsted inspection data from reports)In addition to investigating the impact of classroom processes based on observationaldata, further analyses were conducted to explore the predictive power of more globalindicators of school quality based on independent professional judgements of Ofstedinspectors. Earlier analyses (Sammons et al., 2006) at the school level had alreadyindicated that significant associations between observational data and inspection reportsexist for the 125 focal schools. A number of the classroom process factors derived fromthe observations were found to be positively related to Ofsted measures of schooleffectiveness, improvement and leadership. This supported the conclusion that theobserved measure of overall Teaching quality was found to be higher in schoolspreviously identified as showing better quality in terms of overall judgements of Schooleffectiveness, Improvement since last inspection and Leadership.
It was hypothesised that children in the 125 schools would make more cognitiveprogress and show more favourable social/behavioural development in the focal schoolsthat had previously been rated more favourably on the various Ofsted indicators ofquality. Ofsted measures were tested in the multilevel models of children’s outcomes inYear 5 and the results supported the hypothesis.
School effectivenessThe overall Ofsted judgement of School effectiveness was a strong predictor of betteroutcomes for the sub-sample of EPPE 3-11 children, after control for other factors (priorattainment/social behaviour and background factors). Attending a more effective school(as judged by inspectors) made a significant difference to all outcomes (Reading,Mathematics and all four social/behavioural outcomes), more strongly for Mathematics,(ES=0.41), Self-regulation (ES=0.39) and Pro-social behaviour (ES=0.37).

vii
Improvement since last inspectionThe Ofsted judgement of overall school improvement since the last inspection showed asimilar pattern to findings on overall School effectiveness; results were particularly strongfor Self-regulation (ES=0.49), Pro-social behaviour (ES=0.43), Anti-social behaviour(ES=0.31) and Mathematics (ES=0.35).
LeadershipThe Ofsted judgements related to School Leadership also showed a modest but positiverelationship with progress in Mathematics (ES=0.32), Hyperactivity (ES=-0.22) and Anti-social behaviour (ES=-0.23).
These results are of policy interest as they show that going to a higher quality school (asidentified by Ofsted) does make a significant difference to children’s cognitive andsocial/behavioural progress across the board. Children who attended more effective andimproved schools showed longer term benefits in terms of a wide range of outcomes.The results can also be seen to provide some independent support for the validity of theOfsted judgements, by confirming their predictive validity for a range of child outcomes.
Measures of social disadvantage (Free school Meals - FSM)There is evidence that the overall characteristics of pupil intake (measured by thepercentage of pupils eligible for free school meals) also influence children’s cognitiveprogress and social/behavioural outcomes (for Mathematics, Hyperactivity, Self-regulation and Anti-social behaviour comparing those in schools below the mean of thisfactor). Higher levels of social disadvantage were a predictor of poorer outcomes,controlling for all other significant child, family and HLE characteristics including theindividual child’s family income and eligibility for FSM. However, the effects aresomewhat weaker (ES range 0.23-0.29) than those found for the Ofsted measures ofschool effectiveness and improvement (ES range 0.27-0.49). Elsewhere EPPE 3-11have shown that only one of the classroom observation measures was associated withlevel of disadvantage (Sammons et al., 2006). Classroom Disorganisation was weaklynegatively associated with overall social disadvantage of pupil intake to a school (% ofpupils eligible for Free School Meals, Correlation r=0.36). These findings support otherresearch on the importance of school composition and indicate that the challenges inraising attainment are greater for schools in areas of higher disadvantage.
Conclusions and ImplicationsReviews of school and teacher effectiveness research have repeatedly pointed to theimportance of a range of school and classroom features that promote better educationaloutcomes for students; see Teddlie & Reynolds (2000), Scheerens & Bosker (1997),Sammons (2007c). These include a positive school culture, good leadership, creating apositive learning environment, high expectations and good quality teaching.
The EPPE 3-11 study is the first to combine a wide range of data that explore therelationship between detailed measures of child, family and home learning and children’sprogress (in both cognitive and social/behavioural outcomes) and link this detailedinformation to what teachers do in the classroom and measures from inspectionjudgements (Ofsted). This has enabled the exploration of the predictive power ofdifferent measures in accounting for variation in children’s progress across a range ofoutcomes.

viii
The EPPE 3-11 analyses of classroom observations show it is possible to groupteachers in Year 5 classes in terms of differences in overall Teaching quality across arange of observed dimensions of classroom behaviour and practice.
Overall Teaching quality is a significant predictor of better cognitive progress for childrenbetween Years 1 and 5, and this is particularly evident in the High and Low groups. Inother words, children in schools where Year 5 overall Teaching quality was observed tobe High do significantly better in both Reading and Mathematics progress than thoseattending schools where Year 5 teaching quality was observed to be Low.
However, overall Teaching quality was not associated with social/behavioural progress inany consistent way. It appears that the overall quality of teaching as measured by theobservations has a greater influence on children’s academic progress, than on othersocial/behavioural outcomes.
With regard to other measures, children who attended more effective and improvedschools, as measured by earlier Ofsted judgements made during regular schoolinspections, showed longer term benefits on a range of social/behavioural outcomes aswell as academic outcomes. The judgement of school leadership also showed asignificant though weaker positive influence. This supports the conclusions of schooleffectiveness research that school matters. Even when the powerful influences of child,family and home are controlled, going to a ‘better’ primary school exerts a positive netinfluence on children’s academic progress and also on social/behavioural outcomes.
In addition, the results indicate that teachers’ perceptions of a number of features of theirschools (such as school communication with parents, parental support, consistentemphasis on homework, pupil agency and voice, and anti-academic ethos) are alsosignificant predictors of children’s academic progress and social/behavioural progressfrom Year 1 to Year 5.
The EPPE 3-11 findings delineate particular aspects of teachers’ classroom practice andoverall features of schools (including inspection judgements of school quality) that havepredictive validity in terms of better child outcomes at age 10. They support conclusionsfrom previous school and teacher effectiveness studies that identify important variationsbetween teachers and schools in their effects on pupils’ progress and social/behaviouraldevelopment. In combination with the findings on teacher quality, the results point toimportant features of schools and classroom processes that help to explain differences inchildren’s outcomes and thus provide evidence on successful practice. The quality ofclassroom teaching and the overall quality of the primary school both matter, whilecontextual influences and communication with parents are also significant. We concludethat initiatives that give a stronger emphasis to promoting the overall quality of teachingand creating a more orderly classroom climate are likely to improve educationaloutcomes for all children and may be particularly important for schools with higherproportions of disadvantaged children (because these schools are more likely to havehigher levels of classroom disorder).
After taking account of other influences it is clear that the quality of classroom teachingmatters, and the overall quality of the school also matters. Children in the EPPE samplewho had the benefit of attending a primary school judged (by Ofsted) to be moreeffective and improved, showed benefits in all the outcomes studied. The results supportthe view that more effective schools tend to foster both cognitive and social/behaviouraloutcomes. The findings also provide some independent confirmation that inspection

ix
judgements of effectiveness and improvement provide useful indicators of importantfeatures of school quality that have a measurable impact on a range of pupil outcomes.Both the quality of teaching and the overall effectiveness of the school are found to besignificant predictors of better cognitive progress and social/behavioural development.Given that many studies (including EPPE 3-11) have demonstrated links betweendisadvantage (such as low SES and family income) and significantly poorer educationaloutcomes, enhancing the quality of teaching and the overall effectiveness of the schoolare likely to be particularly important for disadvantaged groups of pupils. A major reviewby Scheerens & Bosker (1997) concluded that school effects are larger for ethnicminority and disadvantaged groups (in this report the sample size does not allow detailedanalysis of school effects for specific sub-groups). Therefore improving the quality ofteaching and overall effectiveness of the school is likely to be necessary to promotebetter long term educational outcomes for disadvantaged pupils in particular. Thisconclusion is also supported by recent Ofsted findings of schools in disadvantaged areas(Ofsted, 2007).2 The EPPE 3-11 findings support the view that quality of classroompractices and overall quality of schools and their leadership make an importantdifference to children’s academic and social/behavioural progress. The results suggestthe need to reduce the variation in the quality found between classroom practices andschools processes in order to raise overall standards and promote greater equity.
This longitudinal study is the first of its kind in England (educational effectiveness) toprovide recent and robust evidence on the role of classroom influences such as teachingquality and school processes in shaping primary children’s progress and development(on a wide range of outcomes) during Key Stage 2. The strength of the findings isenhanced by the controls for the impact of other background factors.
2 See Ofsted Annual Report 2006/2007 (para. 282-284, p. 69 -70).

1
Introduction
The Effective Pre-school and Primary Education Project 3-11 (EPPE 3-11) is a large-scalelongitudinal study of the influence of pre-school and primary school on children’s cognitive andsocial/behavioural development. The study has been following children from the start of pre-school (at age 3 years plus) through to primary school entry and across Key Stage 1 (KS1) andKey Stage 2 (KS2). Over 3000 children and 141 pre-school centres were included in the firstphase of the pre-school research. Children were tracked from age 3 years to the end of KS1 inprimary school at age 7 years. During the pre-school phase the project explored the linksbetween child outcomes and pre-school setting/classroom practices and processes throughobservations. This identified the features of pre-school experiences found to be linked with morepositive developmental outcomes for young children up to age 5 years (see Sylva, 1999; Siraj-Blatchford, 2003; Sylva et al., 2006).
This follow-up phase of the longitudinal research investigates the development of the samegroup of children across KS2 of primary education (7 to 11 years). It consists of three “Tiers”.Tier 1 involves the analysis of primary school academic effectiveness across all primary schoolsin England using value added approaches measuring pupil progress for three successive cohortsacross Key Stage 2 in terms of National Assessment outcomes in English, Mathematics andScience (Melhuish et al., 2006a; 2006b). Tier 2 focuses on the academic and social/behaviouralprogress of around 2,500 individual children in the original EPPE 3-11 sample and uses theresults from Tier 1 to provide measures of primary school academic effectiveness for the schoolsattended by EPPE 3-11 children, to explore pre-school and primary school influences incombination. Tier 3 explores variations in observed classroom practices during KS2 focusing ona sub-sample of 125 schools and Year 5 classes drawn from among the 850 plus primaries inwhich the EPPE 3-11 children were located (see Sammons et al., 2006).
This paper is the second in a series reporting on the classroom observation component of thestudy (Tier 3) conducted in the Year 5 classes during the spring and summer terms of 2004 and2005. The first paper in this series provided a detailed description of the two observationinstruments used and the extent to which they identified variation between classes in differentaspects of teachers’ practice and in children’s observed responses. In addition, the first paperexplored the associations between several Ofsted measures of overall school quality andeffectiveness, and the observed measures of teachers’ behaviour and children’s responses.Further analyses linking classrooms observations to value added indicators of schooleffectiveness derived from the Tier 1 component of the research (using National assessmentdata) were also described. The results indicated that there were substantial variations inchildren’s educational experiences (as observed through the research instruments) in differentschools and classes, and that these were associated with the external measures of schoolquality and effectiveness (based on value added measures and Ofsted inspection grades).
The current paper examines patterns of association between children’s developmental progressand observed classroom behaviour focusing on the sub-sample of EPPE 3-11 children whoattended the 125 focal schools during the classroom observations period. It provides a moredetailed statistical analysis, using multilevel models to predict individual children’s developmentaltrajectories, using child, family, and home learning environment (HLE) measures as controls inaddition to prior attainment or prior social behaviour, so that the net influence of differentmeasures of classroom practice and overall indicators of school quality and climate can beexplored.
Aims of the Analyses• To link observed classroom behaviour to children’s developmental progress at age 10.• To explore the impact of classroom processes on children’s cognitive and social/behavioural
development at age 10.• To investigate the relationships between selected Ofsted measures of quality and
effectiveness and children’s cognitive and social/behavioural outcomes at age 10.

2
MethodsThis analysis focuses on a sub-sample of 1160 children in 123 focal schools that form part of alarge sample in the EPPE 3-11 study.3 We have reported on the attainment, progress andsocial/behavioural development of the full EPPE 3-11 sample at Year 5 (age 10) in separatereports (see Sammons et al., 2007a; 2007b; Melhuish et al., 2008) with a particular focus on theinfluences of child, family, HLE as well as pre- and primary school experience. Here weinvestigate in more detail the influences of classroom experience in Year 5 using observationdata collected in 125 primary schools.
For this analysis we adapt the value added multilevel models developed to study progress andsocial/behavioural development across Year 1 to Year 5 to include only statistical predictors ofthe reduced child sample so that the study of classroom measures controls for intake differences.Therefore the estimates of the effects of these classroom measures are reported net of theimpact of background influences including prior attainments (cognitive outcomes) in Year 1 orprior social behavioural development (social/behavioural outcomes).
A wide range of information has been drawn upon and used to analyse data for the full EPPE 3-11 sample for which cognitive and social/behavioural outcome data were collected in Year 5.This included standardised cognitive assessments, teachers’ assessments of social/behaviouraldevelopment, information about child, family and home learning environment (HLE)characteristics collected from parental interviews when children were recruited to the study andagain in Key Stage 1 (KS1), measures of pre-school quality and effectiveness collected duringthe first phase of the study, and independent measures of primary school academiceffectiveness derived from the Tier 1 analyses of National assessment data for successivecohorts (Melhuish et al., 2006a). A more detailed description of the information and methodsused to develop the original models can be found in Appendix 1.
Two observation instruments were used to explore variation in classroom processes: theClassroom Observation Instructional Environment Observation Scales (IEO, Stipek, 1999) andthe Classroom Observation System for Fifth Grade (COS-5, Pianta, NICHD, 2001). Theseinstruments were selected because they were devised relatively recently for the primary agegroup, cover a wide range of pupil and teacher behaviours and offered the opportunity tofacilitate comparison with research in other contexts (e.g. Galton et al., 1999; NICHD, 1998;2001).
Data from the COS-5 (Pianta) child and classroom codes and from the Literacy and Numeracyscales of the IEO (Stipek) instrument were entered into a principal components analysis withVarimax rotation to identify factors of empirically linked items. Five factors were extracted for theCOS-5 instrument accounting for seventy-six percent of the variance; and three factors wereextracted for the Literacy and Numeracy scales of the IEO instrument, explaining seventy-threepercent and seventy-six percent of the variance respectively. These factors were used in allsubsequent analysis (for further details see Sammons et al., 2006).
Classroom observation and children’s outcome data for Year 5 classes were matched with anumber of measures taken from the most recent Ofsted inspection report available for schools(from either the most recent 2003 or the earlier 2000 inspection cycle). These provided globalmeasures of inspectors’ judgements of: overall school effectiveness, the extent of improvementsince the previous inspection, the effectiveness of leadership within schools, quality of teachingand learning in Key Stage 1 and Key Stage 2, and judgements about a number of pupilmeasures such as overall patterns of exclusion, attitudes and attendance.
A teacher questionnaire was also administered by research officers to explore teachers’ viewsand perception of school policies and organization and different aspects of their practice.Responses were received from 118 Year 5 teachers (94% of the 125 focal schools).
3 Two of the 125 classes were excluded from the analyses due to insufficient data and low numbers.

3
Overview of the report
Section 1: This section describes the sample of focal schools in which classroom observationswere conducted; and also presents the distribution of background variables for the sample ofchildren attending these schools and compares these to the characteristics of the EPPE 3-11sample as a whole.
Section 2: This section provides summary details of the two observation instruments used forthe investigation of classroom processes and teachers’ behaviour. The two observationinstruments used are Pianta’s Classroom Observation System for Fifth Grade (COS-5) and theInstructional Environment Observation Scale (IEO) of Stipek. The underlying dimensions relatedto classroom processes are outlined and the creation of overall summary indicators of Teachingquality, based on the two instruments, are described.
Section 3: This section describes the results of multilevel analyses of children’s cognitiveprogress between Years 1 and 5 in Reading and Mathematics and of development in foursocial/behavioural outcomes over the same period. The analyses are used to test the predictivepower of the overall measure of Teaching quality, and of the different dimensions identified bythe two observation instruments in terms of the various child outcomes in Year 5. The resultssupport the hypothesis that better child progress and developmental outcomes are associatedwith more positive scores in terms of the observational measures. In addition a number ofmeasures derived from a questionnaire survey of the Year 5 teachers are also tested and pointto some significant relationships.
Section 4: This section investigates the predictive power of various global measures of schoolquality based on Ofsted inspection judgements of school effectiveness, improvement andleadership as well as more specific measures such as quality of assessment. The resultsindicate that children who attended a more effective or improved school show benefits across awide range of cognitive and social/behavioural outcomes.
The final section summarises the main results and conclusions.

4
Section 1: The Sample
1.1 The sample of focal schools
The project identified a purposive school sample of primary schools from amongst thoseattended by the EPPE 3-11 children to include in the observation component of the research.The criteria for sampling included indicators of schools’ effectiveness (across a range of‘effectiveness’ measures) and the number of EPPE 3-11 children enrolled.
We used the school value added ‘effectiveness’ scores obtained from the early stages of theanalysis for Tier 1 of the EPPE 3-11 project (Melhuish et al., 2006a) (described earlier in thereport). From an analysis of school value added residuals for English, Mathematics and Scienceand their associated confidence limits, schools were classified into different effectivenesscategories for the three core subjects. Schools where pupils were making significantly moreprogress than might be expected given their pupil and school intake characteristics werecategorised as relatively ‘more effective’ and those where pupil progress was significantly belowexpected as ‘less effective’ in each subject.
The EPPE 3-11 child sample spans four academic years and cohorts of children with Cohorts 2and 3 being the largest. The purposive sub-sample for this paper was selected from schoolsattended by children in these two larger cohorts. In 2004, Cohort 2 of EPPE 3-11 (1180) childrenwas in Year 5 in 483 schools. In 2005 Cohort 3 (1435) was in Year 5 in 616 schools. Schoolswhere four or more EPPE 3-11 children attended were selected so that there were approximatelyequal numbers of relatively ‘more effective’ and relatively ‘less effective’ schools in each region ofthe study. Table 1.1 presents the sample of classrooms observed and the instruments used.
Table 1.1: The Sample of classrooms
Year COS-5 (Pianta) observations IEO (Stipek) observations
2004 (Spring/Summer) 54 24
2005 (Spring/Summer) 71 69
Total 125 93
In the first year (2004) 54 schools were selected for observation using the ClassroomObservation System for Fifth Grade (COS-5, Pianta, NICHD, 2001) instrument, applying theabove criteria. An additional sub-group of 24 of these 54 schools were observed using theInstructional Environment Observation Scale (IEO, Stipek, 1999) instrument. These 24 schoolswere chosen to reflect an approximately equal number of relatively more ‘effective’ and less‘effective’ schools. In the second year (2005), 71 schools were selected using the same criteriadescribed above in which to apply both the COS-5 (Pianta) and IEO (Stipek) instruments. TheCOS-5 (Pianta) instrument was conducted in all 71 schools, making a total of 125 schools.However, due to imminent Ofsted inspections, two of the schools were unable to accommodatethe additional IEO (Stipek) visits and therefore a total of 69 schools were observed using the IEO(Stipek) instrument in the second year, making an overall total of 93 schools for this instrument.
1.2 The sample of children in the focal schools
This section provides descriptive statistics for the sample of EPPE 3-11 children in the 125 focalschools. Table 1.2 provides a brief summary of background characteristics4 for this sample.
4 To prevent loss of sample size for further analyses, missing values of number of siblings and eligibility for free schoolmeals where imputed using ‘the last observation carried forward’ method. See Appendix 3 for a description of thisimputation method.

5
Overall 1160 EPPE 3-11 children attended the 125 focal schools. This is approximately 45% ofthe total EPPE child sample. Within this sample fifty per cent of children were male, nearly threequarters were of White UK heritage, twelve per cent had English as an Additional Language(EAL) and around forty per cent of EAL children (representing 4.8% in the total sample) stillrequired EAL support at age 10. In terms of family characteristics, the majority of children(63.6%) lived with one sibling, eighteen per cent were singletons and seventeen per cent werepart of larger families with 3 siblings or more. Just under half (44%) of children had relativelyhigh scores (25+) in an index of early years home learning environment (HLE) measured in thepre-school period. A substantial minority of children (31%) were from families where scores onthe early years HLE index were relatively low (below 20 was indentified as relatively low).
About thirteen per cent of both mothers and fathers had a degree or higher degree levelqualification. The large majority, however, were educated to GCSE level or below – threequarters of mothers and fifty-six per cent of fathers (note that 21% of children were in familieswhere the father was recorded as absent and this contributed to the difference here). Low familysocio-economic status (SES) was recorded for nineteen per cent of the sample, half (49.7%)were in the medium (skilled manual or skilled non manual) group and twenty-nine per cent wereidentified as from the higher (professional) groups. Nearly a quarter of children in the sample(24%) lived in households where parents reported no earned income, while for around a fifth thefamily earned income was reported to be under £15,000 (data were collected towards the end ofKS1 when children aged around 6 years old), and twenty two percent were recorded as eligiblefor free school meals (FSM). On an index of multiple disadvantage twenty-seven percent wereidentified as of medium to high disadvantage (3+ disadvantages)5.
Overall, this sub-sample of children (1160) is not significantly different from the total sample ofEPPE 3-11 children (3172), variations in the distributions of background variables are generallywithin 2 percent, except on income. There is a notable over representation of children whosereported family earned income is either ‘none’ or lower than £15,000 (44.4% in comparison to33.2% in the total sample), although the proportional representation of children eligible for FSM isalmost identical in both samples. There is also an over representation of children whose mothersor fathers have ‘16-academic’ level of qualification (39.7% and 26.7% respectively) incomparison to the characteristics of the sample tracked at entry to primary school (35.2% and21.3%). Finally, the distributions by ‘type of pre-school’ are significantly different between thesamples; private-day nurseries, local authority day nurseries and integrated centres are greatlyunder represented in the current sub-sample.
The distributions of background variables in the sub-sample of 823 children who attended theschools in which the IEO instrument was used are broadly the same as those described abovewith the exception of ethnicity and type of pre-school attended. Within the ‘IEO’ sub-samplethere is an over representation of children of Pakistani (10.3%) and Mixed race (5.2%) origins incomparison to the characteristics of the COS-5 sub-sample (2.2% and 1.5% respectively) as wellas of the total sample of EPPE 3-11 children (2.1 and 1.3% respectively). In addition, there is anover representation of children who have attended playgroups (27.2%) and nursery classes(22.0%) relative to the COS-5 sample (24.2% and 16.9% respectively) and the total sample(19.2% and 16.4% respectively). These slight differences in sample characteristics means thatcaution should be employed in interpreting results in relation to the full PPE sample. However,the focus of these analyses is not to investigate the relative influence of measures such asethnicity or pre-school type but rather to provide statistical control for intake differences inexploring the influence of variations in teacher behaviours across the sample of 125 Year 5classes.
5 Only a small number of children had missing demographic data. The proportion of missing data generally did notexceed three percent with the exception of ‘need of EAL support’ (13%) and multiple disadvantage (6.5%).

6
Table 1.26: Characteristics of children with valid Year 5 data and classroom observationdata compared to the total sample at entry to primary school
COS-5 samplen=1160
IEO sampleN=823
Total samplen=3172
n % n % n %
Gender
Male 582 50.2 407 49.5 1636 51.6
Female 578 49.8 416 50.5 1536 48.4
Ethnicity
White UK Heritage 862 74.3 585 71.1 2295 72.4
White European Heritage 39 3.4 27 3.3 122 3.8
Black Caribbean Heritage 30 2.6 25 3.0 116 3.7
Black African Heritage 17 1.5 12 1.5 66 2.1
Indian Heritage 20 1.7 17 2.1 93 2.9
Pakistani Heritage 25 2.2 85 10.3 67 2.1
Bangladeshi Heritage 89 7.7 13 1.6 177 5.6
Mixed Heritage 17 1.5 43 5.2 40 1.3
Any Other Ethnic Minority Heritage 59 5.1 14 1.7 192 6.1
English as an Additional Language (EAL) 139 12.0 113 13.7 354 11.2
Child needs EAL support at Year 5 56 4.8 45 5.5 98 3.1
No. of siblings
No. siblings 204 17.6 132 16.0 624 19.7
1sibling 738 63.6 529 64.3 1955 61.6
2+ siblings 198 17.1 145 17.6 483 15.2
Pre-school Home Learning Environment(HLE) Index
(missing 4%)0 – 13 110 9.5 84 10.2 308 9.7
14 – 19 249 21.5 176 21.4 665 21.0
20 – 24 259 22.3 189 23.0 727 22.9
25 – 32 374 32.2 264 32.1 960 30.3
33 – 45 133 11.5 83 10.1 346 10.9
Type of Pre-School
Nursery class 274 23.6 120 14.6 588 18.5
Playgroup 281 24.2 224 27.2 609 19.2
Private day nursery 111 9.6 83 10.1 516 16.3
Local Authority day nursery 101 8.7 63 7.7 433 13.7
Nursery schools 196 16.9 181 22.0 519 16.4
Integrated (Combined) centres 37 3.2 34 4.1 191 6.0
6 All background variables used in the models were obtained from a detailed parent interview conducted on entry tothe study with the exception of maternal employment (not shown in Table 1.1) and family earned income; thesemeasures were obtained during Key Stage 1 (KS1 - 6-7 years old) through a follow up parental questionnaire.Measures of FSM eligibility and ‘Need of EAL support’ are collected yearly through the teacher completed child profile;the measure obtained for a given year is the measure used in the models for that year’s outcomes, e.g. Year 5 FSMfor Year 5 models, Year 1 FSM for Year 1 models etc.
Throughout the report the variable of family earned income is used as a measure of the income level of the family.The ‘no’ family earned income group may have income through benefits or other sources such as a pension. The ‘no’family earned income group is used as the reference group in comparisons. Family earned income is categorised into6 levels (see Table 1.2). Any reference through out the report to ‘income’ equates to family earned income.

7
Home 160 13.8 117 14.2 314 9.9
Mother’s Qualifications
None 247 21.3 179 21.7 647 20.4
Vocational 173 14.9 129 15.7 442 13.9
16 Academic 461 39.7 314 38.2 1118 35.2
18 Academic 78 6.7 49 6.0 257 8.1
Miscellaneous 9 .8 7 .9 25 .8
Degree and higher degree 156 13.4 114 13.9 533 16.8
Father’s Qualifications
None 199 17.2 144 17.5 484 15.3
Vocational 141 12.2 110 13.4 346 10.9
16 academic 310 26.7 203 24.7 676 21.3
18 academic 69 5.9 47 5.7 223 7.0
Degree or equivalent 123 10.6 90 10.9 378 11.9
Higher degree 37 3.2 28 3.4 165 5.2
Other professional/ miscellaneous 12 1.0 10 1.2 32 1.0
Father absent 246 21.2 173 21.0 757 23.9
Family Highest SES
Professional Non Manual 80 6.9 62 7.5 281 8.9
Other Professional Non manual 260 22.4 185 22.5 776 24.5
Skilled Non Manual 390 33.6 265 32.2 974 30.7
Skilled Manual 187 16.1 137 16.6 452 14.2
Semi-Skilled 170 14.7 118 14.3 406 12.8
Unskilled 29 2.5 20 2.4 79 2.5
Unemployed / Not working 24 2.1 19 2.3 88 2.8
FSM (at Year 5 or earlier)
Free School Meals 250 21.6 180 21.9 673 21.2
Salary of family
No salary 280 24.1 188 22.8 569 17.9
£ 2,500 – 17,499 235 20.3 172 20.9 485 15.3
£ 17,500 – 29,999 196 16.9 151 18.3 411 13.0
£ 30,000 – 37,499 107 9.2 73 8.9 271 8.5
£ 37,500 – 67,499 179 15.4 118 14.3 470 14.8
£ 67,500 – 132,000+ 41 3.5 33 4.0 173 5.5
No salary data 122 10.5 88 10.7 792 25.0
Total Multiple Disadvantage Index
0 (low disadvantage) 235 20.3 156 19.0 644 20.3
1 282 24.3 192 23.3 781 24.6
2 236 20.3 172 20.9 613 19.3
3 145 12.5 110 13.4 391 12.3
4 102 8.8 76 9.2 257 8.1
5 plus (high disadvantage) 85 7.3 59 7.2 213 6.7

8
Section 2: The Classroom Observation Instruments
Two observation instruments were adapted and used in the EPPE 3-11 project to obtaininformation about variation in classroom processes, including teachers’ and pupils’ classroombehaviour and experiences. These instruments were selected because they were devisedrelatively recently, they are appropriate for the primary age group (Year 5), they cover a widerange of pupil and teacher behaviours and they offered the opportunity to facilitate comparisonwith research in other contexts (e.g., NICHD, 1998; 2001). The following section provides a briefdescription of the two instruments. The COS-5 (Pianta) Observations were completed in theSpring term (2003/4 and 2004/5) and the IEO (Stipek) was conducted in the Summer term(2003/4 and 2004/5). The COS-5 (Pianta) observations were conducted across a range ofacademic subjects whereas the IEO (Stipek) focused on Literacy and Numeracy only.
2.1 The Instructional Environment Observation Scale (IEO, Stipek)
The Instructional Environment Observation Scale (IEO, see Appendix 5) was designed byProfessor Deborah Stipek, University of California, for the Centre on Organisation andRestructuring of Schools. The purpose of the IEO (Stipek, 1999) is to gather high inference,numerical indicators of the instructional environments experienced by pupils by combiningjudgements about the teachers’ teaching and pupils’ learning behaviours. In the EPPE 3-11study, the IEO was used specifically to observe both Literacy and a Numeracy hour/session inYear 5 classrooms in focal schools. These core subjects were of particular concern given thedevelopment of the National Literacy and Numeracy (later to be known as the PrimaryStrategies) Strategies. Researchers observed one complete Literacy and one completeNumeracy lesson. A brief description of this instrument is presented in Box 1.
Box 1: The IEO (Stipek) Instrument
2.2 The Classroom Observation System (COS-5, Pianta)
The Classroom Observation System (COS-5, Pianta, see Appendix 6), developed by ProfessorRobert Pianta (NICHD, 2001), was initially used by the National Institute of Child Health andHuman Development (NICHD) Study of Early Child Care and Youth Development in the USA.The instrument is divided into two main parts that include The Behavioural Coding System, which
Instructional Environment Observation Scale (IEO) (Stipek)Researchers using the IEO observed one complete Literacy and Numeracy lesson. There are 4main areas of this instrument: General Classroom Management and Climate, General InstructionScales for both subjects, plus Mathematical Instruction Scales for Numeracy, and WritingInstruction Scales for Literacy.
Literacy1. Classroom climate2. Classroom routines3. Cross-Disciplinary Connections4. Linkage to life beyond the classroom5. Social support for student learning6. Student engagement7. Reading as meaning making8. Basic skills development in the context ofreading9. Higher order thinking in writing10. Purposeful development of writing skills11. Instructional conversations.
Numeracy1. Classroom climate2. Classroom routines3. Cross-Disciplinary Connections4. Linkage to life beyond the classroom5. Social support for student learning6. Student engagement7. Use of Maths analysis8. Depth of knowledge and studentunderstanding9. Basic skill development in the context ofproblem solving10. Maths discourse and communication11. Locus of Maths authority

9
we refer to as the Frequency of Behaviour Coding System, and the Qualitative Coding System,which we refer to as the Measures of Quality Coding System. A brief description of thisinstrument is presented in Box 2.7
Box 2: The COS-5 (Pianta) instrument
7 The COS-5 (Pianta) schedule was used to study the following classroom events: 1xStart of the morning, 1xStart ofthe afternoon, 2xLiteracy sessions, 2xNumeracy sessions, 1xScience or Social Science and 1xOther academicsubject, making a total of 8 observation cycles in each school. High priority was placed on core-academic subjectsbecause of their key role in academic progress.
This instrument is divided into two main parts: The Frequency of Behaviour Coding System, and the Measures ofQuality Coding System.
The Frequency of Behaviour Coding SystemThe Frequency of Behaviour Coding System is used in the first of the two 10 minute observation segments. This partincludes the coding of child and teacher behaviours across a range of classroom and curriculum settings. For theduration of this part of the observation, a target child (TC) is observed and recorded during a sequence of ten 60second intervals (30 seconds observe, 30 seconds record) during which focus is placed upon capturing information infive general areas of the target child’s classroom behaviour and experience.The categories are:Child level setting – the classroom setting in which the target child is working:
1. Whole class2. Individual3. Large group4. Small group.
Content of target child’s activity - The nature of the activity in which the target child is engaged in including:1. Subject areas (e.g. Literacy, Numeracy, etc.),2. Sub categories within a sub area (e.g. Word-Level and Comprehension in Literacy)3. Part of Literacy and Numeracy hour as describe by the NLS (specifically adapted for use in the UK)3. Non-curricular activities such as Enrichment and Free Time.
Teacher behaviour – Interaction with the target child:1. Attending to target child (directly)2. Teaching basic skills3. Teaching analysis4. Managerial instructions5. Monitoring and checking work6. Displaying positive or negative effect and discipline.
Child academic behaviour:Type of behaviour1. Learning/performing basic skills2. Learning/performing analysis3. Collaborative work4. Requestingattention/help/information5. volunteers
Degree of involvement1. engaged2. highly engaged3. unproductive4. off task or– alternative academicbehaviour
Child social behaviour - social interactions with peers and adults in the classroom:1. Positive/neutral engagement with peers2. Negative/aggressive engagement with peers3. Positive effect towards teacher4. Negative effect towards teacher5. General disruptive behaviour.
The Measures of Quality Coding SystemThe Measures of Quality Coding System part of the observation instrument is dedicated to ten minutes continuousobservation of behaviours and characteristics of the target child, the teacher in the classroom at a more global level.This section contains two broad categories: Child Codes and Classroom Codes. Under these main headings there area number of sub-headings or constructs (behaviours, characteristics) that must be rated.
Child codes1. Positive affect2. Self-reliance3. Sociable/Co-operative with peers4. Attention5. Disruptive6. Activity level7. Child-Teacher relationship
Classroom codes1.Richness of instructional methods2. Over-control3. Chaos4. Detachment/Teacher5. Positive classroom climate6. Negative climate7. Purposeful use of instructional time8. Teacher sensitivity (Main teacher only).
Each individual item is rated on a seven-point scale (1 = very uncharacteristic and 7 = very characteristic).
10
The individual scales within the COS-5 and IEO instruments have been explored in the firstpaper in this series (see Sammons et al., 2006 for details). Overall, those analyses indicatedsignificant but relatively modest associations between the two observation instruments,suggesting that the two measure somewhat different aspects, and seem to tap into somewhatdifferent underlying dimensions of teacher and pupil behaviour and pupil responses.
2.3 Key Dimensions in Classroom Processes
Data from the COS-5 (Pianta) child and classroom codes and from the Literacy and Numeracyscales of the IEO instrument were entered into a principal components analysis with Varimaxrotation to identify factors of empirically linked items. Five factors were extracted for the COS-5instrument accounting for seventy-six percent of the variance; and three factors were extractedfor the Literacy and Numeracy scales of the IEO instrument, explaining seventy-three percentand seventy-six percent of the variance respectively. These factors were used in all subsequentanalysis.
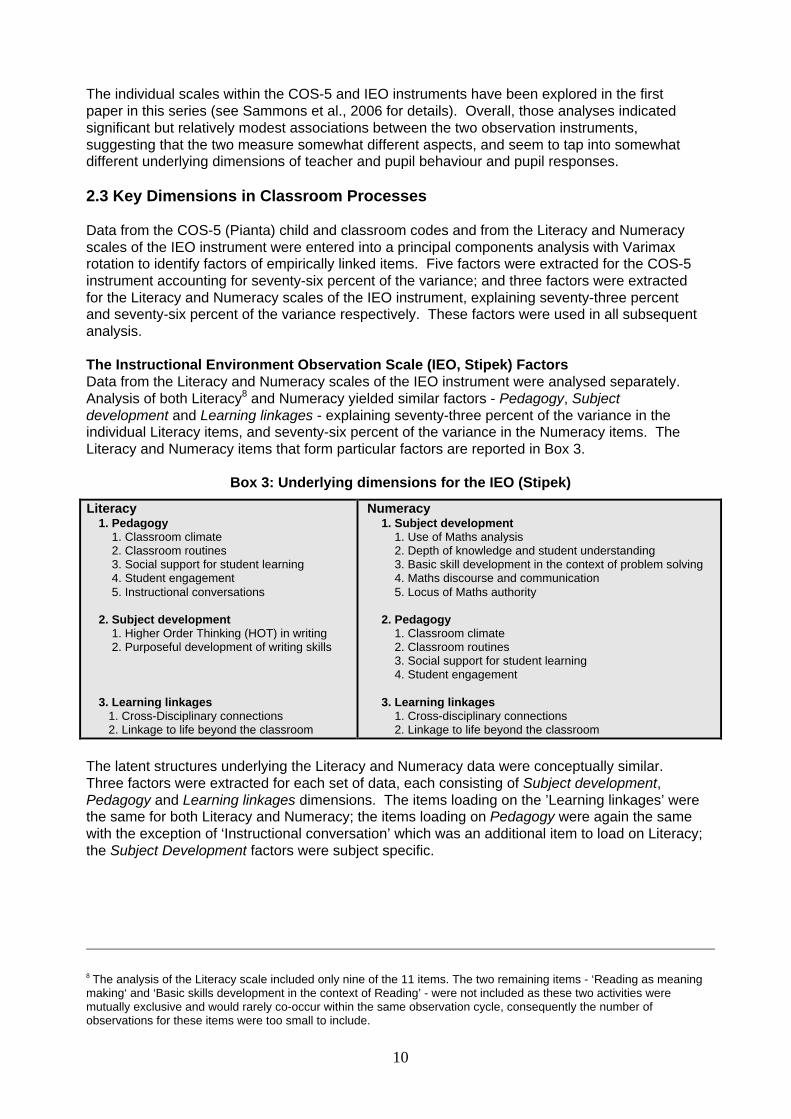
The Instructional Environment Observation Scale (IEO, Stipek) FactorsData from the Literacy and Numeracy scales of the IEO instrument were analysed separately.Analysis of both Literacy8 and Numeracy yielded similar factors - Pedagogy, Subjectdevelopment and Learning linkages - explaining seventy-three percent of the variance in theindividual Literacy items, and seventy-six percent of the variance in the Numeracy items. TheLiteracy and Numeracy items that form particular factors are reported in Box 3.
Box 3: Underlying dimensions for the IEO (Stipek)
Literacy1. Pedagogy 1. Classroom climate 2. Classroom routines 3. Social support for student learning 4. Student engagement 5. Instructional conversations
2. Subject development 1. Higher Order Thinking (HOT) in writing 2. Purposeful development of writing skills
3. Learning linkages 1. Cross-Disciplinary connections 2. Linkage to life beyond the classroom
Numeracy1. Subject development 1. Use of Maths analysis 2. Depth of knowledge and student understanding 3. Basic skill development in the context of problem solving 4. Maths discourse and communication 5. Locus of Maths authority
2. Pedagogy 1. Classroom climate 2. Classroom routines 3. Social support for student learning 4. Student engagement
3. Learning linkages 1. Cross-disciplinary connections 2. Linkage to life beyond the classroom
The latent structures underlying the Literacy and Numeracy data were conceptually similar.Three factors were extracted for each set of data, each consisting of Subject development,Pedagogy and Learning linkages dimensions. The items loading on the ’Learning linkages’ werethe same for both Literacy and Numeracy; the items loading on Pedagogy were again the samewith the exception of ‘Instructional conversation’ which was an additional item to load on Literacy;the Subject Development factors were subject specific.
8 The analysis of the Literacy scale included only nine of the 11 items. The two remaining items - ‘Reading as meaningmaking‘ and ‘Basic skills development in the context of Reading’ - were not included as these two activities weremutually exclusive and would rarely co-occur within the same observation cycle, consequently the number ofobservations for these items were too small to include.

11
The Classroom Observation System (COS-5, Pianta) FactorsData from the COS-5 child and classroom observations were analysed and five distinct factorswere identified, accounting for seventy-six percent of the variance in the 16 individual item scores(Box 4).
Box 4: Underlying Dimensions for the COS-5 (Pianta)
1. Quality of pedagogy 1. Classroom codes - Richness of instructional method 2. Classroom codes - Teacher detachment 3. Classroom codes - Positive classroom climate 4. Classroom codes - Productive use of instructional time 5. Classroom codes - Evaluative feedback 6. Classroom codes - Teacher sensitivity
2. Disorganisation 1. Child code - Disruptive 2. Classroom codes - Chaos 3. Classroom codes - Negative classroom climate
3. Child positivity 1. Child code - Self-reliance 2. Child code - Co-operative with peers 3. Child code - Child-Teacher Relationship
4. Positive engagement 1. Child code - Positive affect 2. Child code - Activity level
5. Attention and control 1. Child code - Attention 2. Classroom codes - Over control
The first factor is interpreted as representing general classroom processes and pedagogy andwas termed Quality of pedagogy. Scoring high on this dimension indicates a classroom wherethe teacher provides pupils with a rich learning environment. The focus is on learning and a ‘cando’ culture. Pupils are supported in their learning with ‘feedback’ from the teacher thatchallenges them.
‘Child’s disruptive behaviour’, ‘Chaos’ and ‘Negative climate’ formed the second factor. Thisdimension may be conceptualised as measuring the extent of classroom Disorganisation (or itsobverse) characterised by higher scores on general chaotic and negative classroom climate andpupils’ disruptive behaviour or its absence. This clustering appears to suggest that disruptivebehaviour and negative or chaotic classroom atmosphere are likely to coincide; however,whether a chaotic atmosphere in the classroom encourages disruptive behaviour or whether it isa reflection of it, is not possible to determine, it seems probable that the two would tend toreinforce each other. Scoring high on all elements in this factor was rare; nevertheless therewere a small proportion of atypical classrooms where the level of chaotic and disruptivebehaviour observed was relatively high.
Two of the three items loading on the Disorganisation factor (‘Chaos’ and ‘Negative classroomclimate’) also load (negatively) on the Quality of pedagogy factor. This suggests that while PQuality of pedagogy and Disorganisation may represent different underlying dimensions the twoconstructs are not entirely independent from each other. Disruptive behaviour may underminegood teaching practices, while poor teaching practices may promote disruptive behaviour.
‘Self-reliance’, ‘Co-operation with peers’ and ‘Child-Teacher relationships’ converged into thethird dimension, suggesting that the child who is particularly self-reliant has the social skills to co-operate with others. This dimension is referred to as Child positivity.
‘Activity level’ and ‘Child positive affect’ formed the fourth factor. We refer to this dimension asPositive engagement as this clustering indicates that children who were observed as beingoccupied also appeared to be happy.
Finally, the fifth factor to be extracted brought together ‘Attention’ and ‘Over control’ into a singledimension termed Attention and control. This is in many respects the inverse of theDisorganisation dimension where chaos and disruptive behaviour are replaced by control andattentive behaviour.

12
The COS-5 dimensions were divided into four levels of observed behaviour – below onestandard deviation (sd) of the mean (Low) within one sd below the mean (Low-Medium) withinone sd above the mean (Medium-High) and above one sd of the mean (high). Due to the smallernumber of cases for the IEO sub-sample, the IEO dimensions were divided into just three groups– the bottom 20% (Low), middle 60% (Medium) and top 20% (High). These groupings were thenused to construct a global measure of teaching/classroom quality based on the combined effectof the individual dimensions9. A global indicator of Teaching quality was created for the overallCOS-5 instrument and for Literacy and Numeracy scales of the IEO. The combined indicatorsresulted in 21 categories.
The global indicators of Teaching quality were created in three stages. First, the individualdimensions were recoded such that scores below 1 sd of the mean received a value of (-1),scores within 1 sd of the mean received a value of (0), and scores above 1 sd of the meanreceived a value of (1). The recoded variables were then summed and the resulting distributionscan be seen in table 2.1. Finally, as the extreme Low and the extreme high categories consistedof very few numbers, the bottom two and the top two categories were collapses for all threeglobal indicators to produce 5 categories representing varying levels of performance for theCOS-5 global indicator of Teaching quality and 3 categories for each of the IEO global indicatorsof quality.
Table 2.1: Distributions of the combined dimensions for each observation instrument
n of children by eachsummed category ofteacher behaviour
-3.00 -2.00 -1.00 0.00 1.00 2.00 3.00 Total
COS-5 28 156 269 295 311 84 17 1160
IEO: Literacy 0 41 167 333 193 23 0 757
IEO: Numeracy 0 3 272 281 231 21 0 808
Low Low-medium Medium Medium-High HighN= 184 N=269 N=295 N=311 N=101
COS-5 Overall Indicatorof Teaching quality(total n= 1160) 15.9% 23.2% 25.4% 26.8% 8.7%
N= 208 N/A N=333 N/A N=216IEO Overall Indicator ofTeaching quality(total n= 757) 27.5% N/A 44.0% N/A 28.5%
In the next section we explore the relationship between these classroom measures (specificfactors and the global quality indicators) and children’s progress from Year 1 to Year 5.
9 The individual (grouped) dimensions within each scale were summed up. The summation process produced 21categories which were then reduced to five categories with roughly equal numbers.

13
Section 3: The Influence of Classroom Processes onCognitive and Social/behavioural Development
In order to explore the potential influence of classroom processes on children’s developmentalprogress we conducted further analyses using ‘value added’ multilevel models. The COS-5 andthe IEO factors were entered individually into value added multilevel models developed to studychildren’s progress and social\behavioural development across Year 1 to Year 5 (see Sammonset al., 2007a; 2007b for detailed descriptions of the main analyses of developmental progress forthe whole sample). The value added models developed for the whole EPPE 3-11 sample wereadapted to include only statistical predictors of the reduced child sample in the 125 focal schoolsso that the study of classroom measures controls for intake differences (in terms of priorattainment or prior social behaviour plus any significant child, family or home learningenvironment (HLE) measures). Therefore the estimates of the effects of the classroommeasures are reported ‘net’ of the impact of background influences including prior attainments(for later Year 5 cognitive outcomes) in Year 1 or prior social behaviour (for later Year 5social/behavioural outcomes). Due to the different numbers involved we report the results forthe COS-5 factors first, as these are based on the larger sample of 1160 children. Appendix 2gives details of the models for each of the Year 5 child outcomes.
3.1 The Classroom Observation System for Fifth Grade (COS-5, Pianta)
The influence of overall Teaching qualityAn overall global measure that is an indicator of overall Teaching quality (described earlier inSection 2) was developed based on the combination of high or lower scores across the variousindividual COS-5 factors. It may be hypothesised that children will make more developmentalprogress in schools and classes where overall Teaching quality is observed to be higher. Toinvestigate this hypothesis we tested this overall quality indicator in the multilevel models ofchildren’s cognitive progress.
The overall indicator of Teaching quality was found to be a significant predictor of both Readingand Mathematics progress for the EPPE 3-11 children in the 125 focal schools. The patterns ofassociation are shown in terms of effect sizes in Figure 3.1. The comparisons are made with thebase category highest quality group. There is a clear stepped pattern for Mathematics progress,distinguishing the different quality groups, with the largest differences being found between theHigh and Medium-High group and other categories (ES=-0.35 between the highest and lowestcategories). These differences are all net of the influence of child, family and HLE measures andprior attainment in Year 1. For Reading progress there are also significant differences althoughthe pattern is less obviously stepped. The difference between the High and Low categories isequally large (ES 0.37) but it appears that there is a less obvious gradation between the threeremaining groups (Low-Medium, Medium and Medium-High where ES range from 0.15-0.22).
Two important conclusions can be drawn from these results. First, it is possible to classifyteachers in Year 5 classes in a meaningful way in terms of differences in overall Teaching qualityacross a range of different dimensions of classroom behaviour and practice based onobservations. Second, overall Teaching quality is a significant predictor of better cognitiveprogress for children across the period Year 1 to Year 5, and this is particularly evident at theextremes. In other words, children in schools where Year 5 overall Teaching quality wasobserved to be High overall, do significantly better in both Reading and Mathematics than thoseattending schools where Year 5 overall Teaching quality was observed to be Low.
In contrast to the significant patterns for cognitive progress, there were no clear patterns betweenthe different measures of children’s social/behavioural development and the overall COS-5measure of Teaching quality in Year 5 classes.

14
Figure 3.1: The effect of Overall Teaching quality on Children’s Cognitive progress (Year 1to Year 5)
In addition to exploring overall Teaching quality, we tested the associations between each of theCOS-5 factors separately and collectively. This enables us to establish whether particularfeatures of practice show a stronger link with better child outcomes than others. The results forthe overall quality measure tend to show a stronger pattern than the results for individual factors.
Quality of PedagogyThe COS-5 dimension of Quality of pedagogy was significantly associated with better progressfor children in Mathematics across Years 1 to 5. Here the main difference was between thelowest group and all other categories. The difference in effect size between the Low and highgroups was largest at ES=-0.27. Again there was almost no difference between theMedium-High and the high groups in terms of impact on children’s progress. However,there was no statistically significant relationship for Reading. This suggests that theQuality of pedagogy may be more influential for children’s progress in Mathematics. Thisfinding is in accord with much school effectiveness research that has found schooldifferences in teachers’ behaviour tend to be more marked for subjects such asMathematics.
Overall Teaching Quality
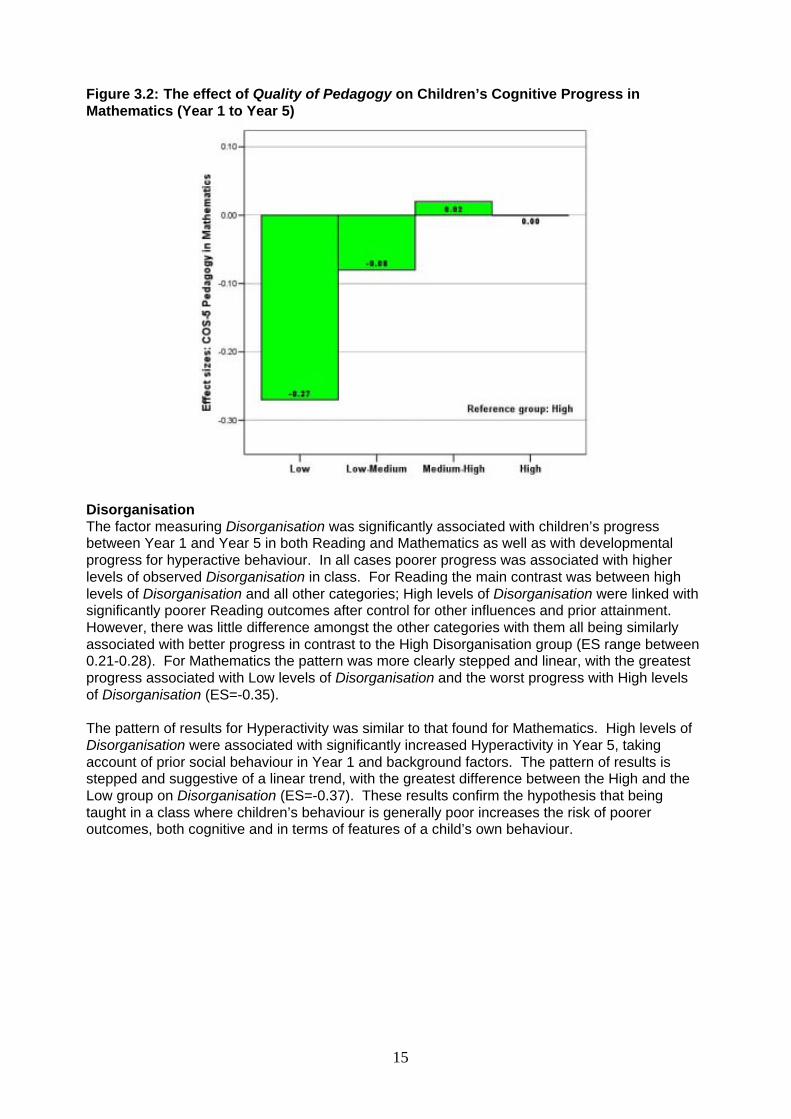
15
Figure 3.2: The effect of Quality of Pedagogy on Children’s Cognitive Progress inMathematics (Year 1 to Year 5)
DisorganisationThe factor measuring Disorganisation was significantly associated with children’s progressbetween Year 1 and Year 5 in both Reading and Mathematics as well as with developmentalprogress for hyperactive behaviour. In all cases poorer progress was associated with higherlevels of observed Disorganisation in class. For Reading the main contrast was between highlevels of Disorganisation and all other categories; High levels of Disorganisation were linked withsignificantly poorer Reading outcomes after control for other influences and prior attainment.However, there was little difference amongst the other categories with them all being similarlyassociated with better progress in contrast to the High Disorganisation group (ES range between0.21-0.28). For Mathematics the pattern was more clearly stepped and linear, with the greatestprogress associated with Low levels of Disorganisation and the worst progress with High levelsof Disorganisation (ES=-0.35).
The pattern of results for Hyperactivity was similar to that found for Mathematics. High levels ofDisorganisation were associated with significantly increased Hyperactivity in Year 5, takingaccount of prior social behaviour in Year 1 and background factors. The pattern of results isstepped and suggestive of a linear trend, with the greatest difference between the High and theLow group on Disorganisation (ES=-0.37). These results confirm the hypothesis that beingtaught in a class where children’s behaviour is generally poor increases the risk of pooreroutcomes, both cognitive and in terms of features of a child’s own behaviour.

16
Figure 3.3: The net effects of Disorganisation on Children’s Cognitive progress andsocial/behavioural development (Year 1 to Year 5)10
Attention and controlThe factor Attention and control was also found to be significantly associated with better childoutcomes for both cognitive and social/behavioural measures. The results indicate that wherelevels of classroom attention and control were observed to be high, children made more progressin Mathematics and had better Self-regulation outcomes in Year 5. The main differenceidentified distinguished the High group from all others, as can be seen in Figure 3.4. Theseresults tend to support the view that higher levels of teacher attention and a proactive approachto classroom management may help to promote better learning and assist children to becomebetter at managing their own learning behaviour (Self-regulation being the social/behaviouraloutcome most closely associated with attainment in Reading and Mathematics).
10 The Hyperactivity chart shows that children in classes that scored highly on the Disorganisation factorhad poorer developmental progress for the developmental measure Hyperactivity (increased over Years 1to 6), while those in classes with low scores for the factor Disorganisation ad the best outcomes.
Disorganisation

17
Figure 3.4: The effect of Attention and control on Children’s Cognitive progress andsocial/behavioural development (Year 1 to Year 5)
Child positivityThe factor Child positivity was found to be significantly associated with greater progress inReading over the period Year 1 to 5, after control for prior Reading attainment and backgroundcharacteristics. The pattern identified was not a clear linear trend, however, but overall indicatedthat children generally made more progress in schools where the Year 5 classroom observationsnoted the highest levels of positivity. The difference was largest (ES=-0.39) between the highestand lowest groups. However, this factor was not significantly related to any of the otheroutcomes studied.
Figure 3.5: The effect of Child positivity on Children’s progress in Reading (Year 1 to Year 5)
Attention and control

18
Positive engagementThe factor Positive engagement showed a significant association with better Pro-social behaviouroutcomes but not with any of the other outcomes studied. There were no significant differencesbetween the High and the Medium-High groups but children in both these groups showedsignificantly better Pro-social development in comparison with the Low and Low-Medium groups(difference in ES -0.21 to -0.33).
Figure 3.6: The effect of Child Positive engagement on Children’s progress in Pro-socialbehaviour (Year 1 to Year 5)
Taken together, the results suggest that it is the overall combination of teacher behaviours thatcan be used to identify differences in overall Teaching quality and provide the clearestdistinctions in terms of predicting children’s cognitive progress, rather than particular isolatedfeatures. For social behaviour, however, features related to pupil engagement and emotionalclimate seem to be more influential.
3.2 Instructional Environment Observation Scale (IEO, Stipek)
Further multilevel analyses were conducted on the sub-group of classes for which data from theIEO (Stipek) instrument was available. The IEO had been used to explore variations in teacherbehaviour specifically focussed on literacy and numeracy lessons (n of classes=93). Due to thesmaller numbers involved in this aspect of the observational study, the measures compared justthree broad groups of classes (High, Medium and Low) based on specific features of practice. Incontrast to the global indicator of overall Teaching quality developed from the COS-5 instrument,there was no clear pattern between the three groups identified from the IEO overall Teachingquality analyses.
Pedagogy in LiteracyInterestingly the measure of Pedagogy in Literacy was found to be significantly associated withbetter cognitive progress for children from Year 1 to 5 in both Reading and Mathematics, but thepattern was clearer and showed a stronger stepped pattern (suggesting a linear trend) forMathematics. The difference between the highest and lowest category was moderately large(ES=-0.45) for Mathematics but smaller (ES=-0.23) for Reading. This suggests that elements ofeffective literacy teaching measured by the IEO instrument may be associated more broadly with
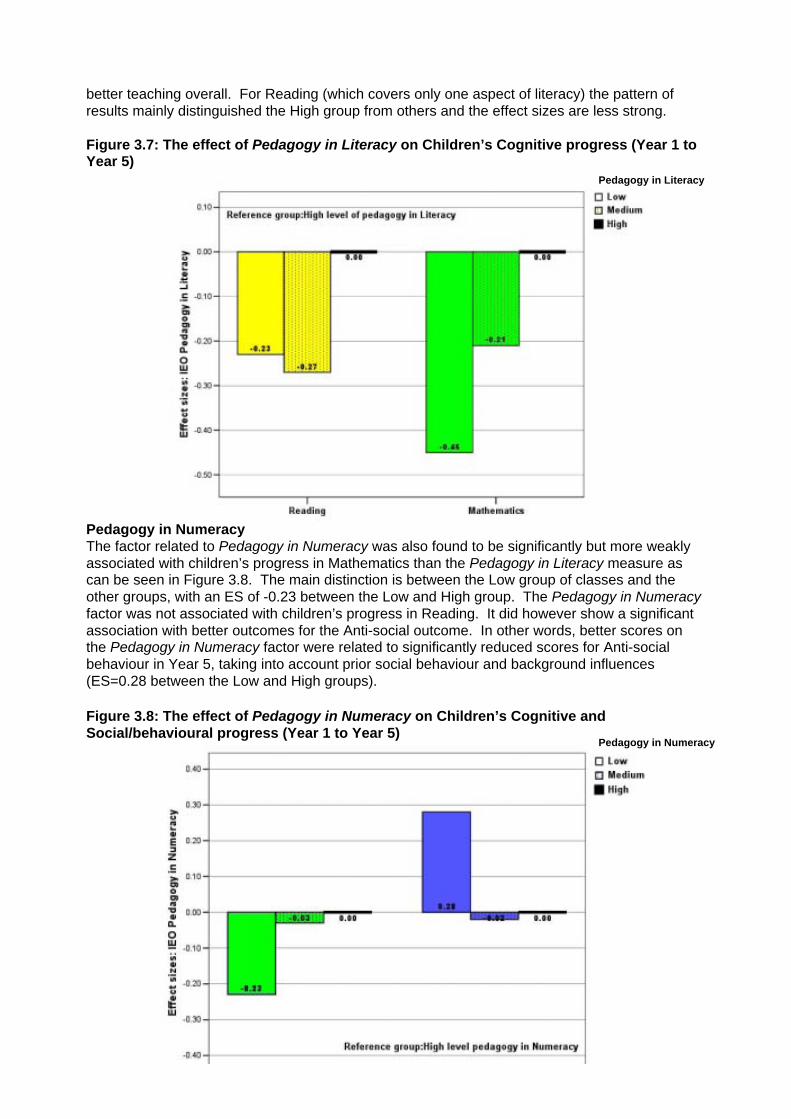
19
better teaching overall. For Reading (which covers only one aspect of literacy) the pattern ofresults mainly distinguished the High group from others and the effect sizes are less strong.
Figure 3.7: The effect of Pedagogy in Literacy on Children’s Cognitive progress (Year 1 toYear 5)
Pedagogy in NumeracyThe factor related to Pedagogy in Numeracy was also found to be significantly but more weaklyassociated with children’s progress in Mathematics than the Pedagogy in Literacy measure ascan be seen in Figure 3.8. The main distinction is between the Low group of classes and theother groups, with an ES of -0.23 between the Low and High group. The Pedagogy in Numeracyfactor was not associated with children’s progress in Reading. It did however show a significantassociation with better outcomes for the Anti-social outcome. In other words, better scores onthe Pedagogy in Numeracy factor were related to significantly reduced scores for Anti-socialbehaviour in Year 5, taking into account prior social behaviour and background influences(ES=0.28 between the Low and High groups).
Figure 3.8: The effect of Pedagogy in Numeracy on Children’s Cognitive andSocial/behavioural progress (Year 1 to Year 5)
Pedagogy in Literacy
Pedagogy in Numeracy

20
Subject development in NumeracyThe factor related to Subject development in Numeracy was not found to be significantly relatedto children’s progress in Mathematics, but was linked with better progress in Reading. The bestoutcomes for Reading were found for pupils in schools where Year 5 classes were observed asscoring highly in Subject development in Numeracy, but the worst outcomes were for the Mediumrather than the Low group. There were also differences for Hyperactivity, where the onlysignificant difference found was a contrast was between the High and Low groups (ES=-0.28);the relationship however was in the opposite direction to the one that would have been predicted(lower levels of Subject development in Numeracy being associated with decreasedHyperactivity). Here are no obvious explanations for these findings although there may be agender interaction (as boys tended to show significantly higher scores for Hyperactivity.
Figure 3.9: The effect of Subject development in Numeracy on Children’s Cognitive andSocial/behavioural progress (Year 1 to Year 5)
Table 3.1 summarises the main results from the multilevel models of children’s cognitiveprogress and social/behavioural development from Years 1 to 5 in terms of the range ofoutcomes studied. It can be seen that the differences are moderately strong in the main. Theyare also generally in the directions predicted (higher scores for the various observed measures ofquality being associated, as might be predicted, with better child outcomes taking account ofother background influences and prior attainment or prior social behaviour). The resultstherefore broadly support the view that in schools where better practice was observed there weremeasurable benefits in terms of children’s all round development.
Subject development inNumeracy

21
Table 3.1: Summary of relationships between classroom processes and children’scognitive and social/behavioural outcomes in terms of net effect sizes
Reading Mathematics HyperactivitySelf-
regulationPro-social Anti-social
COS-5 (Pianta)
Global indicator 0.37* 0.35*
Quality of pedagogy 0.27* 0.28* 0.17* 0.27*Low-Med gp
Disorganisation 0.21* 0.34* 0.37*
Child Positivity 0.39*
Positive engagement 0.33*Low-Med gp
Attention and control 0.27* 0.28*
IEO (Stipek)
Literacy
Global indicator
Pedagogy 0.23* 0.45*
Subject development
Learning linkages
Numeracy
Global indicator
Pedagogy 0.23* 0.28*
Subject development 0.32*Med gp
0.28*
Learning linkages
Reference group: High Effect sizes (ES) represent differences between the lowest and highest scoring groups unless stated otherwise
*p<0.05
3.3 Teacher Survey Results
In addition to classroom observation measures, a teacher survey was conducted to exploreteachers’ views and perceptions of different aspects of school and classroom processes andorganisation. A number of underlying dimensions were identified (see Appendix 4 for factorstructures). The 125 focal schools were divided into a number of groups ranging from Low toHigh based on the teacher’s responses for each dimension. These were then tested in themultilevel models for the various child outcomes in Year 5. Two measures related to teachers’perceptions of overall School communication with parents and the extent of overall Parentalsupport of their child’s learning were found to be significant predictors of better outcomes for theEPPE 3-11 sub-sample in Year 5. Of the two, teachers’ perceptions of School communicationwith parents, was the stronger predictor (see figures 3.10 and 3.11).
For Reading the ES between the High and Low groups for School communication with parentswas moderately strong (ES=0.38); the effect was similar for Mathematics (ES=0.34). Thisindicates that, after taking account of other influences, children make better progress in schoolswhere teachers report good communication with parents in aspects such as communicatingexpectations of pupils to parents, or regularly informing parents about their child’s progress andachievements. The factor School communication with parents also predicted betterdevelopmental progress for Self-regulation (ES=0.27) when the Low and High groups werecompared.

22
Figure 3.10: The effect of School communication with parents on Children’s Cognitive andSocial/behavioural progress (Year 1 to Year 5)
Teachers’ judgements of overall level of Parental support of their child’s learning also showed arelationship with pupils’ progress in Reading (ES=0.28, see figure 3.11); however, it showed nosignificant association with progress in Mathematics. Interestingly, Parental support of theirchild’s learning was strongly associated with children’s Pro-social behaviour, most notablybetween the High and Low groups (ES=0.38); children in schools where teachers’ judgements ofparental support were high showed significantly higher levels of Pro-social behaviour relative toall other groups.
Figure 3.11: The effect of Parental support of their child’s learning on Children’s Cognitiveand Social/behavioural progress (Year 1 to Year 5)
School communication with parents
Parental support

23
The dimension relating to teachers’ reports on the Use of homework and school standardsindicated a positive relationship with Mathematics progress although the strongest effects werefor the Medium group (ES=0.27) followed by the High group (ES=0.13). Higher scores on thisfactor were also associated with improvements in Self-regulation (ES =0.32) and Pro-socialbehaviour (ES=0.33). For these two aspects of social behaviour, results were stronger for thehigh versus the low comparison groups. The items in this factor included; whether most teachersset homework every week for their class, whether most teachers mark and return homeworkpromptly, and whether the overall standards set for pupils at the school were perceived to behigh enough.
Figure 3.12: The effect of Use of homework and school standards on Children’s Cognitiveand Social/behavioural progress (Year 1 to Year 5)
Progress in Reading was positively linked with the factor Pupils’ agency and voice (see figure3.13). This related to teachers’ responses to items on whether pupils organise activities forthemselves and whether pupils’ views are listened to and taken seriously. Differences werelargest between the Low and the Medium-High groups (ES=0.26); differences between the Lowand High groups were not significantly different from zero.
Figure 3.13: The effect of Pupils’ agency and voice on Children’s Cognitive andSocial/behavioural progress (Year 1 to Year 5)
Use of homework andschool standards
Pupils’ agency and voice

24
Overall, the findings associated with Reading seem to suggest that giving pupils a ‘voice’(listening to pupils views and giving more opportunities for pupils to organise activities) may bemost effective when done in moderation; Medium-High levels have a more positive impact onprogress in Reading than either Low or High levels.
Developmental progress for the social/behavioural outcome Self-regulation was positively linkedwith the factor on Pupils’ agency and voice. Children in schools where teachers indicated High(ES=0.27) or Medium-High (ES=0.21) levels of Pupils’ agency and voice showed significantlyincreased levels of Self-regulation. Contrary to expectations, children’s Hyperactive (ES=0.30)and Anti-social (ES=0.38) behaviour was also significantly increased in schools where teachersindicated High levels of Pupils’ agency and voice. It was expected that children would show lessnegative social behaviour in schools where their views are listened to and accommodated,however the findings appear to suggest the opposite. It may be that schools are responding tobad behaviour by giving more support to pupils’ voice, and thus rather than predicting badbehaviour, Pupils’ agency and voice may be a constructive response to negative behaviour. Or,it may be that moderation in the levels of involvement, autonomy and ‘voice’ are allowed isoptimal, and beyond a certain point, children, especially at younger ages, may not respond wellto high levels of autonomy perhaps because they may link to a poorer disciplinary climate.Further research would be required to clarify these issues.
The factor related to teachers’ perceptions of an Anti-academic ethos amongst pupils in theschool were strongly related to cognitive progress as well as to social/behavioural development(see figure 3.14).
Figure 3.14: The effect of Anti-academic ethos on Children’s Cognitive andSocial/behavioural progress (Year 1 to Year 5)
Pupils in schools in which Anti-academic ethos was perceived by teachers to be high showedsignificantly poorer progress in Reading (ES=-0.31) and Mathematics (ES=-0.37); differenceswere mainly between the High and Low groups. The relationships between Anti-academic ethosand the social/behavioural dimensions were more graduated showing a steady decrease in Pro-social behaviour (ES=-0.38, -0.28, -0.08) and a steady increase in Hyperactive (ES=0.36, 0.20,0.16) and Anti-social behaviour (ES=0.31, 0.15, 0.10) as a function of increasing Anti-academicethos in the school.
Anti-academic ethos

25
Table 3.2: Interim summary: Teachers’ perceptions and children’s cognitive andsocial/behavioural development
Reading Mathematics Hyperactivity Self-regulation Pro-social Anti-social
School communicationwith parents
0.38* 0.34* 0.27*
Parental support of theirchild’s learning
0.28* 0.38*
Use of homework andschool standards
0.27*Medium grp
0.32* 0.33*
Pupils’ agency andvoice
0.26~Med-high grp
0.30~ 0.27~ 0.38*
Anti-academic ethos 0.31~ 0.37~ 0.36* 0.38* 0.31~
Reference group: High Effect sizes represent differences between the lowest and highest scoring groups unless otherwise stated
*p<0.05;~ Just missed significance level p=0.06-0.07
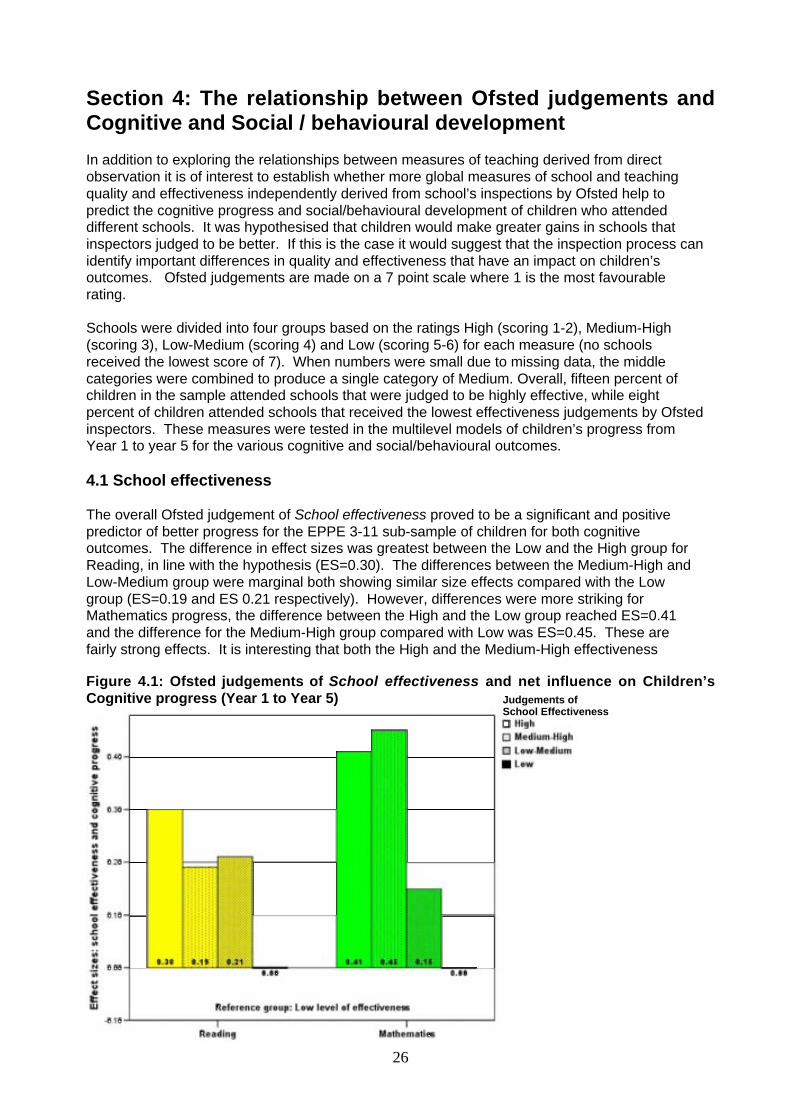
26
Section 4: The relationship between Ofsted judgements andCognitive and Social / behavioural development
In addition to exploring the relationships between measures of teaching derived from directobservation it is of interest to establish whether more global measures of school and teachingquality and effectiveness independently derived from school’s inspections by Ofsted help topredict the cognitive progress and social/behavioural development of children who attendeddifferent schools. It was hypothesised that children would make greater gains in schools thatinspectors judged to be better. If this is the case it would suggest that the inspection process canidentify important differences in quality and effectiveness that have an impact on children’soutcomes. Ofsted judgements are made on a 7 point scale where 1 is the most favourablerating.
Schools were divided into four groups based on the ratings High (scoring 1-2), Medium-High(scoring 3), Low-Medium (scoring 4) and Low (scoring 5-6) for each measure (no schoolsreceived the lowest score of 7). When numbers were small due to missing data, the middlecategories were combined to produce a single category of Medium. Overall, fifteen percent ofchildren in the sample attended schools that were judged to be highly effective, while eightpercent of children attended schools that received the lowest effectiveness judgements by Ofstedinspectors. These measures were tested in the multilevel models of children’s progress fromYear 1 to year 5 for the various cognitive and social/behavioural outcomes.
4.1 School effectiveness
The overall Ofsted judgement of School effectiveness proved to be a significant and positivepredictor of better progress for the EPPE 3-11 sub-sample of children for both cognitiveoutcomes. The difference in effect sizes was greatest between the Low and the High group forReading, in line with the hypothesis (ES=0.30). The differences between the Medium-High andLow-Medium group were marginal both showing similar size effects compared with the Lowgroup (ES=0.19 and ES 0.21 respectively). However, differences were more striking forMathematics progress, the difference between the High and the Low group reached ES=0.41and the difference for the Medium-High group compared with Low was ES=0.45. These arefairly strong effects. It is interesting that both the High and the Medium-High effectiveness
Figure 4.1: Ofsted judgements of School effectiveness and net influence on Children’sCognitive progress (Year 1 to Year 5) Judgements of
School Effectiveness
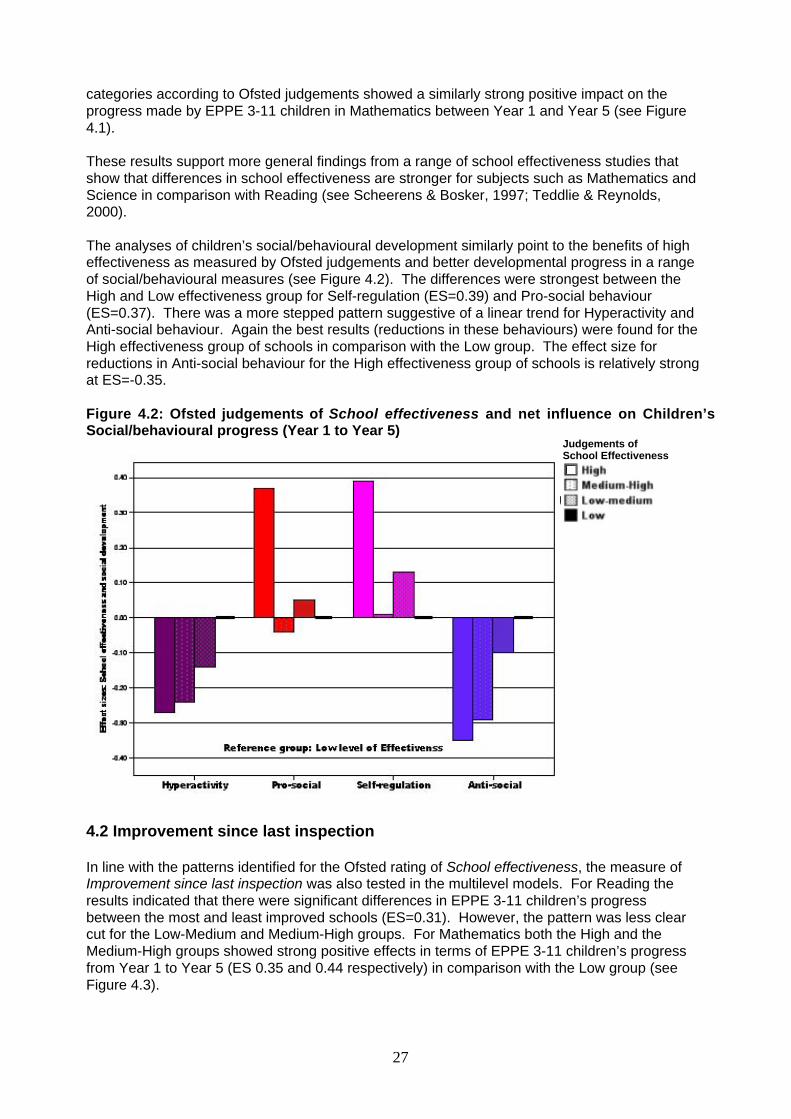
27
categories according to Ofsted judgements showed a similarly strong positive impact on theprogress made by EPPE 3-11 children in Mathematics between Year 1 and Year 5 (see Figure4.1).
These results support more general findings from a range of school effectiveness studies thatshow that differences in school effectiveness are stronger for subjects such as Mathematics andScience in comparison with Reading (see Scheerens & Bosker, 1997; Teddlie & Reynolds,2000).
The analyses of children’s social/behavioural development similarly point to the benefits of higheffectiveness as measured by Ofsted judgements and better developmental progress in a rangeof social/behavioural measures (see Figure 4.2). The differences were strongest between theHigh and Low effectiveness group for Self-regulation (ES=0.39) and Pro-social behaviour(ES=0.37). There was a more stepped pattern suggestive of a linear trend for Hyperactivity andAnti-social behaviour. Again the best results (reductions in these behaviours) were found for theHigh effectiveness group of schools in comparison with the Low group. The effect size forreductions in Anti-social behaviour for the High effectiveness group of schools is relatively strongat ES=-0.35.
Figure 4.2: Ofsted judgements of School effectiveness and net influence on Children’sSocial/behavioural progress (Year 1 to Year 5)
4.2 Improvement since last inspection
In line with the patterns identified for the Ofsted rating of School effectiveness, the measure ofImprovement since last inspection was also tested in the multilevel models. For Reading theresults indicated that there were significant differences in EPPE 3-11 children’s progressbetween the most and least improved schools (ES=0.31). However, the pattern was less clearcut for the Low-Medium and Medium-High groups. For Mathematics both the High and theMedium-High groups showed strong positive effects in terms of EPPE 3-11 children’s progressfrom Year 1 to Year 5 (ES 0.35 and 0.44 respectively) in comparison with the Low group (seeFigure 4.3).
Judgements ofSchool Effectiveness

28
Figure 4.3: Ofsted judgements of Improvement since last inspection and net influence onChildren’s Cognitive progress (Year 1 to Year 5)
The results for social/behavioural development reveal moderately strong influences of themeasure Improvement since the last inspection on all social/behavioural outcomes. Thedifferences between the High and Low categories were especially marked for Self-regulation andPro-social behaviour; the difference between the High and Low groups reached ES=0.49 forSelf-regulation and ES=0.43 for Pro-social behaviour. There was also evidence of reductions inAnti-social and Hyperactive behaviour; the differences between the groups formed a morestepped pattern suggestive of a linear trend (see Figure 4.4).
Figure 4.4: Ofsted judgements of Improvement since last inspection and net influence onChildren’s Social/behavioural progress (Year 1 to Year 5)
Judgements of Improvementsince last Inspection
Judgements of Improvementsince last Inspection
Hyperactivity Pro-social Self-regulation Anti-social
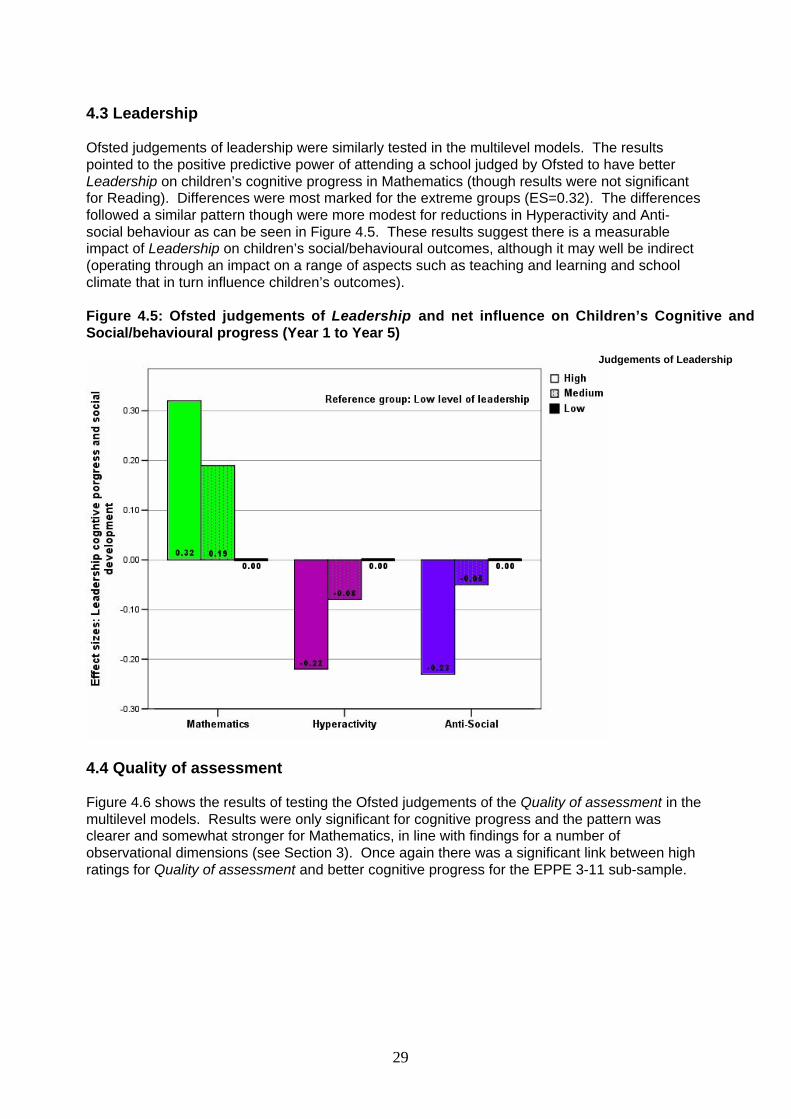
29
4.3 Leadership
Ofsted judgements of leadership were similarly tested in the multilevel models. The resultspointed to the positive predictive power of attending a school judged by Ofsted to have betterLeadership on children’s cognitive progress in Mathematics (though results were not significantfor Reading). Differences were most marked for the extreme groups (ES=0.32). The differencesfollowed a similar pattern though were more modest for reductions in Hyperactivity and Anti-social behaviour as can be seen in Figure 4.5. These results suggest there is a measurableimpact of Leadership on children’s social/behavioural outcomes, although it may well be indirect(operating through an impact on a range of aspects such as teaching and learning and schoolclimate that in turn influence children’s outcomes).
Figure 4.5: Ofsted judgements of Leadership and net influence on Children’s Cognitive andSocial/behavioural progress (Year 1 to Year 5)
4.4 Quality of assessment
Figure 4.6 shows the results of testing the Ofsted judgements of the Quality of assessment in themultilevel models. Results were only significant for cognitive progress and the pattern wasclearer and somewhat stronger for Mathematics, in line with findings for a number ofobservational dimensions (see Section 3). Once again there was a significant link between highratings for Quality of assessment and better cognitive progress for the EPPE 3-11 sub-sample.
Judgements of Leadership

30
Figure 4.6: Ofsted judgements of Quality of assessment and net influence on Children’sCognitive and Social/behavioural progress (Year 1 to Year 5)
Table 4.1 summarises the findings from the multilevel analyses testing the predictive power ofthe Ofsted ratings in multilevel models of children’s cognitive progress and social/behaviouraldevelopment. It can be seen that the overall global Ofsted judgements of School effectivenessand Improvement since last inspection have the strongest predictive power and indicate that forchildren in the EPPE 3-11 sub-sample who attended a more effective and an improving schooltheir all round social/behavioural development and their cognitive progress is likely to benefit (asmeasured by independent assessments used in the EPPE 3-11 research). Due to the relativelysmall number of schools for which inspection data were available (n=89 of 123 schools; 80%)effects needed to be strong to reach statistical significance. Some only verged on statisticalsignificance, but all were in the positive direction predicted. For comparison, the results areshown for a contextual indicator commonly included in school effectiveness research, namely thepercentage of pupils in the school eligible for free school meals (FSM) (a contextual indicator ofsocial disadvantage). Past research has suggested that, in addition to the child’s owncharacteristics, the level of social disadvantage in a school also affects progress rates, with lessprogress occurring where levels of disadvantage are higher (as measured by this indicator).
Table 4.1: Interim summary of net effect sizes: Ofsted judgements of quality andchildren’s cognitive and social/behavioural progress (Year 1 to Year 5)
Reading Mathematics Hyperactivity Self-regulation Pro-social Anti-social
School effectiveness 0.30+ 0.41* 0.27+ 0.39* 0.37~ 0.35~Improvements since lastinspection
0.31+ 0.35* 0.34~ 0.49* 0.43* 0.31*
Quality of assessment 0.28*
Leadership 0.32* 0.22~ 0.23~
Attendance
% of pupils eligible for FSM 0.23^ 0.25^ 0.25^ 0.29^
Reference group: High Effect sizes represent differences between the lowest and highest scoring groups in all cases results were more positive for
the high and less favourable for the Low group on each measure.*p<0.05 ~ Just missed significance level p=0.06-0.08^ Significant when comparing below & above the mean otherwise just misses significance levels+ Not significant but effect sizes are high and patterns are linear and in the predicted direction
Judgements of Quality ofassessment in school

31
As would be predicted from past research, there are indications that EPPE 3-11 children inprimary schools with a higher level of social disadvantage of pupil intake make somewhat lowerlevels of progress. However, it is interesting to note that the benefits of attending a moreeffective and more improved school tends to have stronger predictive power across a range ofoutcomes. This is not intended to minimise the role of social disadvantage but rather todemonstrate the importance of the overall quality of the school as measured by Ofsted inspectionjudgements.

32
Summary and Conclusions
The EPPE 3-11 study is the first large-scale longitudinal study to combine a wide range of datathat explore the relationship between detailed measures of child, family and home learningenvironment (HLE) and children’s progress (in both cognitive and social/behavioural outcomes)and to link this detailed information to what teachers do in the classroom and measures frominspection judgements (Ofsted). This has enabled the exploration of the predictive power ofdifferent measures in accounting for variation in children’s progress across a wide range ofoutcomes, both academic and social behaviour.
This report has investigated the progress and social/behavioural development of a sub-sample of1160 EPPE 3-11 children measured across Year 1 to 5 of primary education. The researchbuilds on the earlier analyses of Year 5 outcomes for the full EPPE 3-11 sample (see Sammons,2007a; 2007b) by investigating relationships between children’s progress between Year 1 andYear 5 and measures of classroom process collected through direct observation of Year 5classes in 125 focal schools chosen from the wider EPPE 3-11 data set. The analyses alsoexplore patterns of association between children’s progress and broader measures of schooleffectiveness, improvement and quality derived from Ofsted inspection reports for this sub-sample of schools. In addition, overall school characteristics have been derived from teacherquestionnaires. It should be noted that the research was not able to study children’s academicprogress across one academic year because the prior attainment measures were collected inYear 1. This may reduce the ability to identify specific teacher/class effects as children are likelyto have been taught by at least 4 different class teachers during this period. This does, however,increase the chance of identifying overall school influences.
Classroom ProcessesAn earlier report (Sammons et al., 2006) has provided a detailed analysis of the two classroomobservation instruments used in this sub-study - the Instructional Environment Observation Scale(IEO, Stipek) and the Classroom Observation System for Fifth Grade (COS-5, Pianta). Year 5was chosen for the observational component of the research because it would help to minimiseany possible influences associated with the conduct of National assessments at the end of KeyStage 2. The initial analyses found that teachers’ and children’s observed behaviours differedsignificantly across the 125 Year 5 classes studied. The two observation schedules identifiedsignificant variations in observed quality indicating that children’s educational experiences inYear 5 classes differed significantly with some benefiting from higher quality experiences. Anumber of important underlying dimensions of classroom processes were identified such asQuality of Pedagogy, Disorganisation, Child positivity, pupils’ Positive engagement and theextent of Attention and control, as well as specific features of practice related to literacy andnumeracy teaching. In this report these underlying dimensions have been tested in multilevelmodels to establish whether there is any evidence that variations in classroom experiencesinfluence children’s cognitive progress and social behavioural developmental outcomes.
It was anticipated that experiences in Year 5 classes would be most likely to show a relationshipwith outcomes measured in Year 5, after control for other influences. It should be noted, that themodels of children’s progress control for prior attainment (or prior social behaviour) measured inYear 1 using comparable instruments, as well as a wide range of child, family and home learningenvironment (HLE) influences. The progress/developmental gains are thus measured over afour year period in primary school. The outcomes studied include Reading and Mathematics(measured by NFER standardised tests) and four social/behavioural measures derived fromteachers’ ratings of individual children (Hyperactivity, Self-regulation, Anti-social behaviour andPro-social behaviour).
It was hypothesised that higher quality classroom experiences in Year 5 would predict betterchild progress and development in Year 5, taking account of the impact of prior attainment/socialbehaviour and background factors. School effectiveness research has drawn attention to theimportance of the classroom level in accounting for variations in student outcomes in many
33
studies but such research has generally only tested limited measures of classroom processesand usually only examined cognitive outcomes (Teddlie & Reynolds, 2000). This research hasstudied a more detailed set of classroom indicators and measures of children’s outcomes andthus can explore the relative strength of different features on a wide range of outcomes.
What matters in the classroomThe results indicated that the overall measure of Teaching quality derived from the COS-5instrument was a significant and moderate to strong predictor of both Reading (ES=0.37) andMathematics progress (ES=0.35) for EPPE 3-11 children in the 125 schools. These differencesrefer to the contrast between the High and Low categories on the overall measure of Teachingquality. However, this overall measure did not show any clear pattern of relationships to thesocial /behavioural outcomes.
Two important conclusions can be drawn from these results. First, it is possible to classifyteachers in Year 5 classes in a meaningful way in terms of differences in overall Teaching qualityacross a range of different dimensions of classroom behaviour and practice based onobservational evidence. Second, overall Teaching quality is a significant predictor of bettercognitive progress for children across the period Year 1 to Year 5, and this is particularly evidentat the extremes. In other words, children in schools where Year 5 overall Teaching quality wasobserved to be high overall, do significantly better in both Reading and Mathematics than thoseattending schools where Year 5 quality was observed to be low. But this was not the case forsocial/behavioural outcomes. Therefore, it appears that the overall Teaching quality asmeasured by the instruments has a greater influence on children’s academic progress, than onother outcomes.
The influence of overall Teaching quality on Reading and Mathematics is stronger than the netinfluence of some background factors such as gender and family disadvantage (measured byeligibility for free school meals - FSM), but weaker than the influence of Early Years HomeLearning Environment (HLE) and mothers’ qualifications.
Nonetheless, specific aspects of classroom processes were found to predict better cognitiveprogress and better social/behavioural development. The factor related to classroomDisorganisation was a significant predictor of poorer progress in Reading and Mathematics, forexample, and also of increased Hyperactivity (higher levels of Disorganisation being linked withsignificantly poorer outcomes). This factor is related to the behavioural climate of the classroomand supports the findings of earlier teacher and school effectiveness studies that point to theimportance of a calm and orderly climate to facilitate learning and teaching. Elsewhere we haveshown associations between the level of social disadvantage in the primary school intake and thelevel of Disorganisation in Year 5 classes (see Sammons et al., 2006). It may be harder forteachers to maintain good order in class in schools serving higher proportions of disadvantagedchildren. It may also be the case that poorer classroom practice is one contributory factor inexplaining the poorer outcomes of children in more disadvantaged communities. Quite likelyboth explanations may play a part. Our analyses have tested and controlled for (wheresignificant) a wide range of significant background measures, including parents’ qualifications,occupations and income. The results show that, over and above such influences, features ofclassroom experience such as Disorganisation seem to play an important role in shapingeducational outcomes.
Other research (Ross & Hutchings, 2003; Darling-Hammond, 2002; Wirt et al., 2002; 2003) hassuggested that schools in disadvantaged settings can find it harder to recruit and retain teachers.Given this and in the light of the findings from the EPPE 3-11 research, it is likely that a strongeremphasis on promoting overall Teaching quality and a more orderly classroom climate will beimportant features of programmes and initiatives to help promote better educational outcomes forpupils in schools that serve above average proportions of disadvantaged children.
34
While the overall Teaching quality was equally important for promoting better Reading andMathematics progress, specific features of Quality of Pedagogy showed stronger relationshipswith children’s Mathematics progress. Quality of Pedagogy It was also important for children’sprogress in terms of reducing Hyperactivity, and promoting Pro-social behaviour and Selfregulation. Reviews of school and teacher effectiveness research have suggested that schoolsvary more in the effects on Mathematics than on Reading (Scheerens and Bosker, 1997; Muijsand Reynolds, 2005). The present results suggest that the overall Teaching quality seems to beequally important for both outcomes but that specific features of classroom processes, such asQuality of pedagogy, tend to be better predictors of children’s progress in Mathematics.
The quality of Attention and control in the classroom was also found to be linked with better childoutcomes in Self-regulation and Mathematics, while Child Positivity, a factor that relates more toself-reliance, co-operation and Child-Teacher Relationship was a predictor of better outcomes forReading. In addition, the factor Positive engagement showed a significant association with betterPro-social behaviour outcomes; the contrast is between the Low (ES=-0.21) and Low-Medium(ES=-0.33) groups and the High group but the trend is not clearly linear.
In addition to classroom observation measures, a teacher questionnaire was conducted toexplore teachers’ views and perceptions of different aspects of school and classroom processesand organization. A number of underlying dimensions were identified. These dimensions weretested in the multilevel models for the various child outcomes in Year 5. Two measures relatedto teachers’ perceptions of overall School communication with parents and the extent of overallParental support of their child’s learning were found to be significant predictors of betteroutcomes for the EPPE 3-11 sub-sample in Year 5; School communication with parents was thestronger predictor.
What matters in the schoolThe factor School communication with parents predicted better progress for Reading,Mathematics and Self-regulation from Year 1 to Year 5. Teachers’ judgements of overall level ofParental support of their child’s learning showed a significant relationship with pupils’ progress inReading but not in Mathematics; this factor was also found to be a strong and positive predictorof Pro-social behaviour.
The dimension relating to teachers’ reports on the Use of homework and school standardsindicated a relationship with Mathematics progress, although the strongest effects were for theMedium group. Higher scores on this factor were also associated with better developmentalgains for Self-regulation and Pro-social behaviour. For these two aspects of children’s socialbehaviour results were stronger for the High versus the Low group.
Progress in Reading was positively linked with the factor on Pupils’ agency and voice.Differences were largest between the Low and the Medium-High groups; differences between theLow and High groups were not significantly different from zero. Overall, the findings associatedwith Reading seem to suggest that moderate levels of Pupils’ agency and voice have a morepositive impact on progress in Reading than either low or high levels.
Developmental progress for the social/behavioural outcome Self-regulation was positively linkedwith the factor on Pupils’ agency and voice. Children in schools where teachers indicated Highor Medium-High levels of Pupils’ agency and voice showed significantly increased levels of Self-regulation. Contrary to expectations, children’s Hyperactive and Anti-social (ES=0.38) behaviourwas also significantly increased in schools where teachers indicated high levels of Pupils’ agencyand voice. We would have expected children to show positive social behaviour in schools wheretheir views are listened to and accommodated, however the findings appear to suggest theopposite. It may be that schools are responding to bad behaviour by supporting pupils’ voice,thus rather than predicting bad behaviour, Pupils’ agency and voice may be a constructiveconsequence of negative behaviour. Alternatively, it may be that moderation in the levels of

35
involvement, autonomy and say pupils are allowed is crucial, especially at younger ages. Furtheranalyses are required to clarify these associations.
The factor related to teachers’ perceptions of an Anti-academic ethos amongst pupils in theschool was strongly related to cognitive progress and social/behavioural development. Schoolsin which an Anti-academic ethos was high showed significantly poorer progress in Reading andMathematics; differences were mainly between the high and low groups. The relationshipsbetween Anti-academic ethos and the social/behavioural dimensions were more graduatedshowing a steady decrease in Pro-social behaviour and a steady increase in Hyperactive andAnti-social behaviour as a function of increasing Anti-academic ethos in school.
Quality matters (Ofsted Inspection Measures)In addition to investigating the impact of classroom processes based on detailed observations byresearchers, further analyses were conducted to explore the predictive power of more globalindicators of school quality based on professional judgements of Ofsted inspectors. Earlieranalyses at the school level had already indicated that there were significant associationsbetween these two sets of measures for the 125 focal schools (see Sammons et al., 2006). Anumber of the classroom process factors derived from the observations were found to bepositively related to Ofsted measures of school effectiveness, improvement and leadership. Thissupported the conclusion that observed teaching quality tends to be higher in schools previouslyidentified as showing better quality in terms of overall judgements of School effectiveness,Improvement since last inspection and Leadership.
It was hypothesised that children in the EPPE 3-11 sub-sample would make more cognitiveprogress and show more favourable social/behavioural development in schools that were ratedmore favourably on the various Ofsted indicators of quality. Ofsted measures were tested in themultilevel models of children’s outcomes in Year 5 and the results supported the hypothesis.
The overall Ofsted measure of School effectiveness was a predictor of better outcomes for thesub-sample of EPPE 3-11 children, after control for other factors (prior attainment/socialbehaviour and background factors). Attending a more effective school (as judged by Ofstedinspectors) made a significant difference to all outcomes (Reading, Mathematics and all foursocial behavioural outcomes), particularly Mathematics, (ES=0.41), Self-regulation (ES=0.39),and Pro-social behaviour (ES=0.37). The judgement of overall school Improvement since lastinspection showed a very similar pattern; results were particularly strong for Self-regulation(ES=0.49 and Pro-social behaviour (ES=0.43). The judgements related to the school Leadershipalso showed a more modest but positive relationship with three outcomes (the strongestprediction was for Mathematics progress ES=0.32).
These results are of policy interest as they show that going to a higher quality school (asidentified by the Ofsted criteria) does make a significant difference to children’s cognitiveprogress and social/behavioural developmental across the board. Children who attend moreeffective and improved schools showed longer term benefits in terms of a wide range ofoutcomes. The results can also be seen to provide some independent support for the validity ofthe Ofsted judgements, by confirming their predictive validity in terms of a wide range ofoutcomes.
Other influencesWhere teachers reported the school was active in communication with parents, children madebetter academic progress, and showed better Self-regulation. Also where teachers reportedstrong parental support, children made better progress in Reading and Pro-social behaviour.The percentage of pupils eligible for FSM in a school was also associated with poorer children’sprogress in Mathematics, Hyperactivity, Self-regulation and Anti-social behaviour (comparingthose in schools below and above the mean on this factor). However the effects are weaker thanthose found for the Ofsted measures of school effectiveness and improvement. Elsewhere wehave shown that only one of the classroom observation measures was associated with level of

36
disadvantage (Sammons et al., 2006). Classroom Disorganisation was weakly negativelyassociated with overall social disadvantage of pupil intake to a school (% of pupils eligible forFree School Meals).
Taken together the findings from the current research provide further confirmation that there aresignificant variations in the observed quality of teaching in Year 5 classes, and that suchvariations are important predictors of children’s cognitive progress in Reading and Mathematics.Specific features of teachers’ practice and children’s responses are also predictors of bettersocial/behavioural outcomes. The overall quality of the school attended also matters. Childrenin the EPPE 3-11 sub-sample who had the advantage of attending schools independently judgedby inspectors to be more effective showed benefits in all the outcomes studied. Similarly, Ofstedinspectors’ judgements of level of school improvement since the previous inspection showed asignificant and consistent pattern in predicting better progress and developmental outcomes forthe EPPE 3-11 sub-sample. The results support the view that more effective schools tend tofoster both better cognitive and better social/behavioural outcomes. The findings indicate thatimportant educational influences (features of practice and organisation) play a significant part inshaping children’s progress and developmental outcomes, in addition to their own personal,family and home learning environment characteristics and the level of social disadvantage oftheir schools.

37
References
Darling-Hammond, L. (2002), Access to quality teaching: An analysis of inequality in California’spublic schools: Santa Clara Law Review.
DfEE. (1998), The Implementation of the National Numeracy Strategy: The final report of theNumeracy Task Force PP98/D14/34555/798/64. Suffolk: Department of Education andEmployment Publications.
DfEE. (2000), The National Literacy Strategy: Grammar for Writing DFEE 0107/2000. London:DFEE Publications.
DFES. (2001a), The National Literacy Strategy: A Framework for Teaching DfES 0500/2001.London: DFES.
DfES. (2001b), The National Literacy Strategy. Teaching writing: Support material for text levelobjectives. DfES 0532/2001. London: DfES.
Elliot, K. and Sammons, P. (2004), 'Exploring the use of effect sizes to evaluate the impact ofdifferent influences on child outcomes: possibilities and limitations, Chapter 2 '. In K. Elliot and I.Schagen (eds), What Does it Mean? The Use of Effect Sizes in Educational Research (pp. 6-24).Slough: NFER.
Galton, M., Hargreaves, L., Comber, C., Wall, D. and Pell, A. (1999), Inside the PrimaryClassroom: 20 Years On. London: Routledge.
Melhuish, E. C., Sylva, K., Sammons, P., Siraj-Blatchford, I. and Taggart, B. (2001), TheEffective Provision of Pre-School Education (EPPE) Project: Technical Paper 7 -Social/Behavioural and Cognitive Development at 3-4 Years in Relation to Family Background.London: DfEE / Institute of Education, University of London
Melhuish, E., Romaniuk, H., Sammons, P., Sylva, K., Siraj-Blatchford, I. and Taggart, B. (2006a),Effective Pre-school and Primary Education 3-11 Project (EPPE 3-11): The Effectiveness ofPrimary Schools in England in Key Stage 2 for 2002, 2003 and 2004. Full Report. London:Institute of Education, University of London. http://www.ioe.ac.uk/schools/ecpe/eppe/eppe3-11/eppe3-11pubs.htm
Melhuish, E., Romaniuk, H., Sammons, P., Sylva, K., Siraj-Blatchford, I. and Taggart, B. (2006b),Effective Pre-school and Primary Education 3-11 (EPPE 3-11): The Effectiveness of PrimarySchools in England in Key Stage 2 for 2002, 2003 and 2004, Research Brief No. RBX06-06.Nottingham: DfES Publications.
Melhuish, E., Sylva, K., Sammons, P., Siraj-Blatchford, I., Taggart, B. and Phan, M. (2008),'Effects of the Home Learning Environment and preschool center experience upon literacy andnumeracy development in early primary school.' Submitted to Journal of Social Issues, 64 157-188.
Muijs, D. and Reynolds, D. (2005), Effective Teaching. London: Sage.
NICHD Early Child Care Research Network. (1998), 'The NICHD Study of Early Child Care.'Psychiatric Times, 15, 71-72 http://www.nichd.nih.gov/od/secc/pubs.htm.
NICHD. (2001), 'Fifth Grade School Observation Procedures Manual.' NICHD Study of EarlyChild Care and Youth Development: NICHD Study of Early Child Care and Youth Development.Developed by R. Pianta.
38
Ofsted. (2007), The Annual Report of Her Majesty’s Chief Inspector of Education, Children’sServices and Skills 2006/07. London: The Stationery Office.
Pianta, R. C. (2003), A day in third grade: Classroom quality, teacher, and student behaviours.'National Institute of Child Health and Human Development Early Child Care Network. Universityof Virgina.
Pianta, R. C. (2000), Enhancing relationships between children and teachers. Washington, D.C.:American Psychological Association.
Ross, A. and Hutchings, M. (2003), Attracting, Developing and Retaining Effective Teachers inthe United Kingdom and Northern Ireland: OECD Country Background Report: Institute of PolicyStudies in Education, London Metropolitan University.
Sammons, P., Sylva, K., Melhuish, E. C., Siraj-Blatchford, I., Taggart, B., Smees, R., Dobson, A.,Jeavons, M., Lewis, K., Morahan, M. and Sadler, S. (1999), The Effective Provision of Pre-School Education (EPPE) Project: Technical Paper 2 - Characteristics of the Effective Provisionof Pre-School (EPPE) Project sample at entry to the study. London: DfEE / Institute of Education,University of London
Sammons, P., Sylva, K., Melhuish, E. C., Siraj-Blatchford, I., Taggart, B. and Elliot, K. (2002),The Effective Provision of Pre-School Education (EPPE) Project: Technical Paper 8a -Measuring the Impact of Pre-School on Children's Cognitive Progress over the Pre-SchoolPeriod. London: DfES / Institute of Education, University of London
Sammons, P., Sylva, K., Melhuish, E. C., Siraj-Blatchford, I., Taggart, B. and Elliot, K. (2003),The Effective Provision of Pre-School Education (EPPE) Project: Technical Paper 8b -Measuring the Impact of Pre-School on Children's Social/Behavioural Development over the Pre-School Period. London: DfES / Institute of Education, University of London
Sammons, P., Sylva, K., Melhuish, E. C., Siraj-Blatchford, I., Taggart, B., Elliot, K. and Marsh, A.(2004), The Effective Provision of Pre-School Education (EPPE) Project: Technical Paper 9 -Report on age 6 assessments. London: DfES / Institute of Education, University of London
Sammons, P., Sylva, K., Melhuish, E. C., Siraj-Blatchford, I., Taggart, B., Elliot, K. and Marsh, A.(2004), The Effective Provision of Pre-School Education (EPPE) Project: Technical Paper 11 -Report on the continuing effects of pre-school education at age 7. London: DfES / Institute ofEducation, University of London
Sammons, P., Taggart, B., Sylva, K., Melhuish, E. C., Siraj-Blatchford, I., Barreau, S. and Manni,L. (2006), Effective Pre-school and Primary Education 3-11 Project (EPPE 3-11): Variations inTeacher and Pupil Behaviours in Year 5 Classrooms and Associations with SchoolCharacteristics. Full Report. London: Institute of Education, University of London.http://www.ioe.ac.uk/schools/ecpe/eppe/eppe3-11/eppe3-11pubs.htm
Sammons, P., Sylva, K., Melhuish, E. C., Siraj-Blatchford, I., Taggart, B. and Grabbe, Y.(2007a). Effective Pre-school and Primary Education 3-11 Project (EPPE 3-11): Influences onChildren’s Attainment and Progress in Key Stage 2: Cognitive Outcomes in Year 5. Full Report.London: Institute of Education, University of London.http://www.ioe.ac.uk/schools/ecpe/eppe/eppe3-11/eppe3-11pubs.htm
Sammons, P., Sylva, K., Melhuish, E., Siraj-Blatchford, I., Taggart, B. and Barreau, S. (2007b),Effective Pre-school and Primary Education 3-11 Project (EPPE 3-11): Influences on Children’sDevelopment and Progress in Key Stage 2: Social/behavioural Outcomes in Year 5. ResearchReport no. DCSF-RR007. Nottingham: DfES Publications

39
Sammons P (2007c) School Effectiveness and Equity: Making connections. CfBT EducationTrust. Reading. www.cfbt/evidenceforeducation.com
Scheerens, J. and Bosker, R. (1997), The Foundations of Educational Effectiveness. Oxford:Pergamon.
Siraj-Blatchford, I., Sylva, K., Taggart, B., Sammons, P., Melhuish, E. C. and Elliot, K. (2003),The Effective Provision of Pre-School Education (EPPE) Project: Technical Paper 10 - IntensiveCase Studies of Practice across the Foundation Stage. London: DfES / Institute of Education,University of London.
Stipek, D. (1999), Instructional Environment Observation Scale. University of California:MacArthur Pathways through Middle Childhood Network.
Stipek, D. (2000, June 28 2000), Impact of School Quality on Children's School Success. Paperpresented at the Head Start's Fifth National Research Conference., Washington, DC.
Sylva, K., Siraj-Blatchford, I., Melhuish, E. C., Sammons, P., Taggart, B., Evans, E., Dobson, A.,Jeavons, M., Lewis, K., Morahan, M. and Sadler, S. (1999), The Effective Provision of Pre-School Education (EPPE) Project: Technical Paper 6 - Characteristics of the Centres in theEPPE Sample: Observation Profiles. London: DfEE / Institute of Education, University of London.
Sylva, K., Siraj-Blatchford, I., Taggart, B., Sammons, P., Melhuish, E., Elliot, K. and Totsika, V.(2006), 'Capturing Quality in Early Childhood Through Environmental Rating Scales'. EarlyChildhood Research Quarterly 21 (1), 76-92.
Teddlie, C. and Reynolds, D. (2000), The International Handbook of School EffectivenessResearch. London: RouteledgeFalmer.
Wirt, J., Choy, S., Gerald, D., Provasnik, S., Rooney, P., Watanabe, S. and Tobin, R. (2002), TheCondition of Education 2002. Washington DC: National Center for Education Statistics, U.S.Department of Education.
Wirt, J., Choy, S., Gerald, D., Provasnik, S., Rooney, P., Sen, A. and Tobin, R. (2003), TheCondition of Education 2003. Washington DC: National Center for Education Statistics, U.S.Department of Education.
40
Appendix 1: Development of models
Background information
Background information about child, parent and family characteristics, was obtained throughparent interviews conducted soon after children were recruited to the study. The parentinterviews were designed to obtain information about a child’s health and care history, details offamily structure and parents’ own educational and occupational backgrounds as well as someindications of parent-child activities and routines. Parents were assured of confidentiality andanonymity in presenting results. It should be noted, that most interviews were with children’smothers and usually took place at the child’s pre-school centre, although for some workingparents telephone interviews were found to be more convenient. All parents gave signedconsent. An excellent response rate (97%) to the interview was achieved, although in someinstances particular questions had a slightly lower rate of response (e.g. related to occupations).In most cases the parent interviews were conducted within 10 weeks of recruiting a child to thestudy, though for a small number of children in ‘hard to reach’ groups a longer time gapsometimes occurred.
Background information was again collected during KS1 using a questionnaire with a responserate of eighty-one per cent. Information obtained by the parents’ questionnaire was used toupdate various background measures such as marital status, number of siblings, employmentetc. In addition, the parents’ questionnaire was used to collect additional measures of the HLE inKey Stage 1 when children were age 6, to complement information on the pre-school HLE, suchas home computing and other activities (including Reading, play of various kinds, involvement insport, music, dance etc.).
The measurement of cognitive attainment and the problem of the measurement of progress
In contrast to the situation in the natural sciences where we can often measure thecharacteristics of objects with objective and accurate measuring instruments on absolute scales,in educational studies we are faced with the problem of the measurement of complex constructswhere measuring instruments have to be adjusted over time. Therefore it is easier to measureany physical characteristics like the height and weight of a child over years than to measureReading, Mathematics or social/behavioural development over time. To have ‘good Readingattainment’ means something different for a child at age 6 than for a child at age 10, whereas themeaning of ‘a height of 150 cm’ remains the same over years.
Cognitive ability tests have been constructed that usually consist of a set of tasks or questionsthat are adjusted (standardised) to the expected attainment of children at a certain age.Obviously the tests cannot be the same at different time points. Children achieve discretionaryscores in these tests, which are then transformed into standardised scores which are comparableirrespective of the age. A common standardisation is the use of IQ format scores, where themean is 100 and the standard deviation is 15. The advantage of the use of these scores is, thatthey are easy interpretable and comparable. This means that a child who has a score of 115 isone standard deviation above the average in this specific sample at this specific time point whilsttaking age effects into account. A child that achieves a score of 85 points is one standarddeviation below average. With these standardisation procedures, performance is alwaysmeasured relative to the norm for the sample. This has some advantages but also somedisadvantages at the same time. For example, it is fairer to children who are relatively young fortheir year (e.g. summer born pupils) but no longer provides a criterion referenced measure ofwhat children have achieved in terms of specific attainment at a particular point in time.
It also imposes some problems on the measurement of progress due to the lack of an absolutescale. If you look at standardised test scores of the same child at different time points, you canalso only obtain progress relative to the sample. For example, if a child has a score of 100 atage 6 and age 10, this means that this child has made average progress, but not that raw
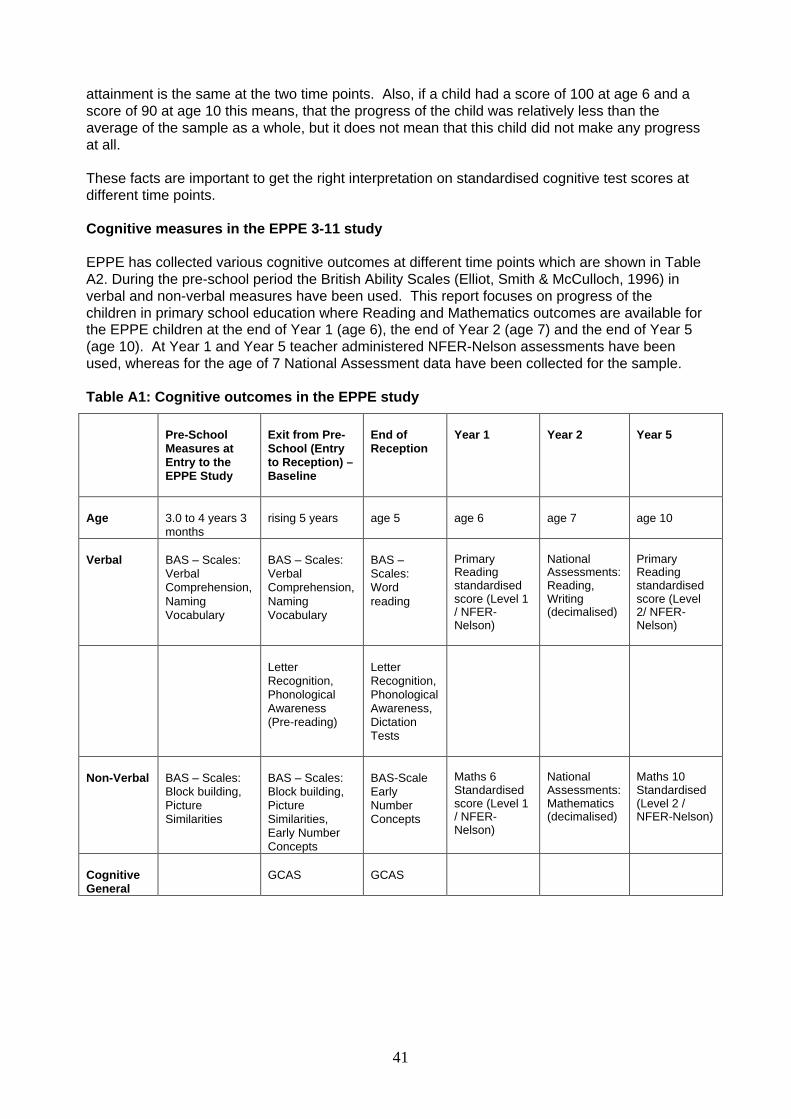
41
attainment is the same at the two time points. Also, if a child had a score of 100 at age 6 and ascore of 90 at age 10 this means, that the progress of the child was relatively less than theaverage of the sample as a whole, but it does not mean that this child did not make any progressat all.
These facts are important to get the right interpretation on standardised cognitive test scores atdifferent time points.
Cognitive measures in the EPPE 3-11 study
EPPE has collected various cognitive outcomes at different time points which are shown in TableA2. During the pre-school period the British Ability Scales (Elliot, Smith & McCulloch, 1996) inverbal and non-verbal measures have been used. This report focuses on progress of thechildren in primary school education where Reading and Mathematics outcomes are available forthe EPPE children at the end of Year 1 (age 6), the end of Year 2 (age 7) and the end of Year 5(age 10). At Year 1 and Year 5 teacher administered NFER-Nelson assessments have beenused, whereas for the age of 7 National Assessment data have been collected for the sample.
Table A1: Cognitive outcomes in the EPPE study
Pre-SchoolMeasures atEntry to theEPPE Study
Exit from Pre-School (Entryto Reception) –Baseline
End ofReception
Year 1 Year 2 Year 5
Age 3.0 to 4 years 3months
rising 5 years age 5 age 6 age 7 age 10
Verbal BAS – Scales:VerbalComprehension,NamingVocabulary
BAS – Scales:VerbalComprehension,NamingVocabulary
BAS –Scales:Wordreading
PrimaryReadingstandardisedscore (Level 1/ NFER-Nelson)
NationalAssessments:Reading,Writing(decimalised)
PrimaryReadingstandardisedscore (Level2/ NFER-Nelson)
LetterRecognition,PhonologicalAwareness(Pre-reading)
LetterRecognition,PhonologicalAwareness,DictationTests
Non-Verbal BAS – Scales:Block building,PictureSimilarities
BAS – Scales:Block building,PictureSimilarities,Early NumberConcepts
BAS-ScaleEarlyNumberConcepts
Maths 6Standardisedscore (Level 1/ NFER-Nelson)
NationalAssessments:Mathematics(decimalised)
Maths 10Standardised(Level 2 /NFER-Nelson)
CognitiveGeneral
GCAS GCAS

42
NFER-Nelson assessment scores: Standardisation procedures, reliability and internal validity
Figure A.1: Cognitive outcomes at Year 5
Co
gn
itiv
e O
utc
om
es a
t Y
ear
5
Reading
Mathematics
r = 0.68
The NFER-Nelson assessments provide a manual to transform raw test scores into agestandardised scores. However, for the EPPE sample (which is not UK representative butrelatively underachieving due to slightly higher numbers of disadvantaged children in the sample)the manual standardisation procedure does not account for variation especially found in youngerage and under average achieving groups. Therefore it has been decided to apply a complexinternal age standardisation and normalisation procedure to the cognitive outcomes in Year 1and Year 5. This resulted in approximately normally distributed outcomes which do not show acorrelation with age.
Figure A.2 shows the distribution of the standardised and normalised Reading and Mathematicsscores at Year 5. The mean of the measures is 100 with a standard deviation of 15 (IQ formatscores).
ReliabilityReliability in the psychometric sense refers to the necessary requirement for a good instrument,that an instrument should measure exactly the same if applied several times on the same subjectand should be consistent. Reliability is a necessary pre-condition for validity. However, as theremight also be changes over time in the outcome to be measured the concept of retest-reliabilityhits its borders especially in developmental studies.
For Reading we find a correlation of 0.56 between the assessments of Year 1 and Year 5, forMathematics the correlation between Year 1 and Year 5 assessments is 0.65. These resultslead to two conclusions:1. Prior cognitive attainments are fairly good predictors of later attainments.2. We can assume good retest-reliability.
Internal validityThe attainments in Reading and Mathematics in Year 1 show a correlation of 0.58 and in Year 5a correlation of 0.68. These moderate to high correlations indicate that children who do well inReading are more likely to also show high attainment in Mathematics and vice versa. Therelationship is more distinct Year 5 than in Year 1. As both measures are cognitive outcomes,these correlations are also indicators of high internal validity (in the sense of psychometricvalidity).
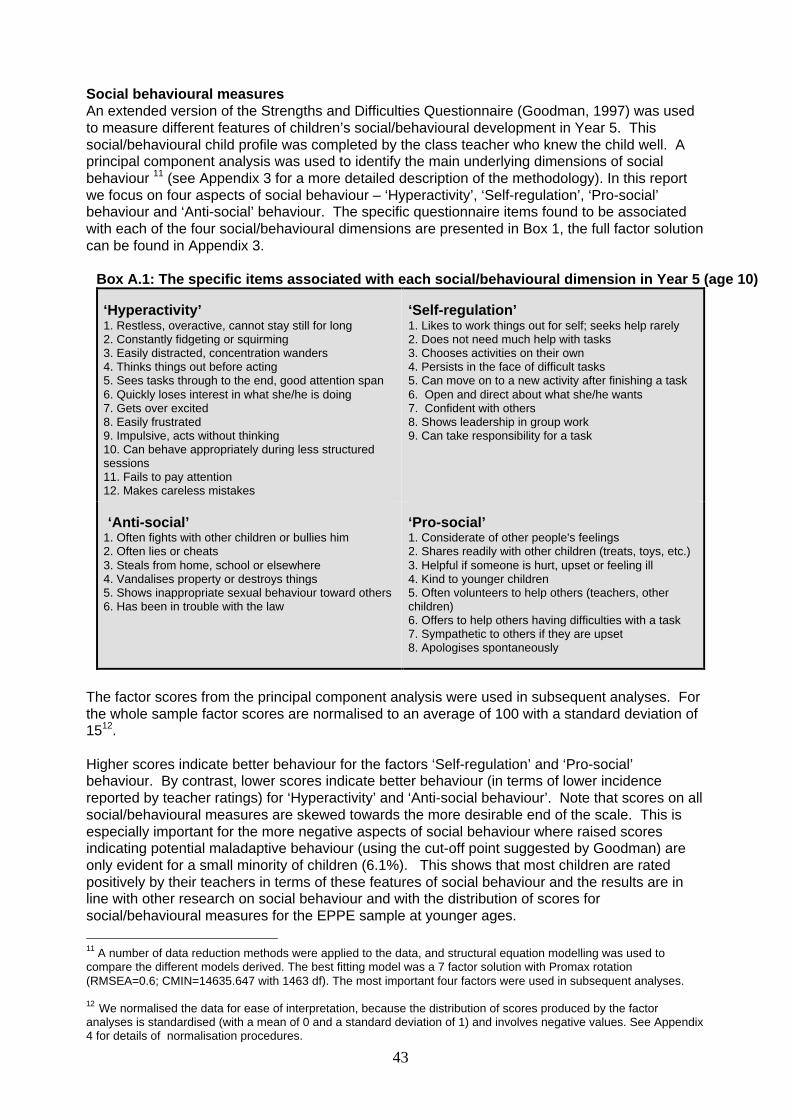
43
Social behavioural measuresAn extended version of the Strengths and Difficulties Questionnaire (Goodman, 1997) was usedto measure different features of children’s social/behavioural development in Year 5. Thissocial/behavioural child profile was completed by the class teacher who knew the child well. Aprincipal component analysis was used to identify the main underlying dimensions of socialbehaviour 11 (see Appendix 3 for a more detailed description of the methodology). In this reportwe focus on four aspects of social behaviour – ‘Hyperactivity’, ‘Self-regulation’, ‘Pro-social’behaviour and ‘Anti-social’ behaviour. The specific questionnaire items found to be associatedwith each of the four social/behavioural dimensions are presented in Box 1, the full factor solutioncan be found in Appendix 3.
Box A.1: The specific items associated with each social/behavioural dimension in Year 5 (age 10)
‘Hyperactivity’1. Restless, overactive, cannot stay still for long2. Constantly fidgeting or squirming3. Easily distracted, concentration wanders4. Thinks things out before acting5. Sees tasks through to the end, good attention span6. Quickly loses interest in what she/he is doing7. Gets over excited8. Easily frustrated9. Impulsive, acts without thinking10. Can behave appropriately during less structuredsessions11. Fails to pay attention12. Makes careless mistakes
‘Self-regulation’1. Likes to work things out for self; seeks help rarely2. Does not need much help with tasks3. Chooses activities on their own4. Persists in the face of difficult tasks5. Can move on to a new activity after finishing a task6. Open and direct about what she/he wants7. Confident with others8. Shows leadership in group work9. Can take responsibility for a task
‘Anti-social’1. Often fights with other children or bullies him2. Often lies or cheats3. Steals from home, school or elsewhere4. Vandalises property or destroys things5. Shows inappropriate sexual behaviour toward others6. Has been in trouble with the law
‘Pro-social’1. Considerate of other people's feelings2. Shares readily with other children (treats, toys, etc.)3. Helpful if someone is hurt, upset or feeling ill4. Kind to younger children5. Often volunteers to help others (teachers, otherchildren)6. Offers to help others having difficulties with a task7. Sympathetic to others if they are upset8. Apologises spontaneously
The factor scores from the principal component analysis were used in subsequent analyses. Forthe whole sample factor scores are normalised to an average of 100 with a standard deviation of1512.
Higher scores indicate better behaviour for the factors ‘Self-regulation’ and ‘Pro-social’behaviour. By contrast, lower scores indicate better behaviour (in terms of lower incidencereported by teacher ratings) for ‘Hyperactivity’ and ‘Anti-social behaviour’. Note that scores on allsocial/behavioural measures are skewed towards the more desirable end of the scale. This isespecially important for the more negative aspects of social behaviour where raised scoresindicating potential maladaptive behaviour (using the cut-off point suggested by Goodman) areonly evident for a small minority of children (6.1%). This shows that most children are ratedpositively by their teachers in terms of these features of social behaviour and the results are inline with other research on social behaviour and with the distribution of scores forsocial/behavioural measures for the EPPE sample at younger ages.
11 A number of data reduction methods were applied to the data, and structural equation modelling was used tocompare the different models derived. The best fitting model was a 7 factor solution with Promax rotation(RMSEA=0.6; CMIN=14635.647 with 1463 df). The most important four factors were used in subsequent analyses.
12 We normalised the data for ease of interpretation, because the distribution of scores produced by the factoranalyses is standardised (with a mean of 0 and a standard deviation of 1) and involves negative values. See Appendix4 for details of normalisation procedures.

44
Appendix 2: Results of Multilevel Analyses
Table A.2.1: Mathematics Contextualised value added Model*Statistically significant at 0.05 level; # Just failed to reach statistical significance at 0.05 level
MathematicsEstimate SE Effect
Size
Year 1 Mathematics 0.603* 0.024 1.83
Gender (girls compared to boys) -0.952 0.680 -0.10
Ethnic group (compared to White UK Heritage)
White European Heritage -0.962 1.743 -0.10
Black Caribbean Heritage 0.615 2.160 0.06
Black African Heritage -1.105 2.615 -0.11
Any other ethnic minority Heritage 1.736 2.801 0.18
Indian Heritage 8.608* 2.417 0.88
Pakistani Heritage -0.148 1.810 -0.02
Bangladeshi Heritage -2.550 2.731 -0.26
Mixed race -2.956# 1.575 -0.30
Mother’s highest level of qualification (compared to none)
Missing data -2.053 2.564 -0.21
Vocational 2.014* 1.149 0.21
Academic age 16 2.406* 0.956 0.25
Academic age 18 3.660* 1.504 0.37
Degree 6.139* 1.581 0.63
Higher Degree 6.040* 2.467 0.62
Other 5.421* 2.539 0.56
Father’s highest level of qualification (compared none)
Missing data 2.475 3.549 0.25
Vocational 1.402 1.225 0.14
Academic age 16 1.446 1.047 0.15
Academic age 18 2.653# 1.542 0.27
Degree 3.623* 1.506 0.37
Higher Degree 2.363 2.345 0.24
Other 1.243 3.165 0.13
Missing (father absent) 0.184 1.076 0.02
Early years HLE (compared to 0 - 13)
Missing data 5.274 2.550 0.54
14-19 0.677 1.281 0.07
20-24 3.031* 1.303 0.31
25-32 1.903 1.293 0.19
33-45 3.625* 1.570 0.37
Expressive Play (compared to very high)
Missing 0.216 1.385 0.02
Low 3.134* 1.205 0.32
Moderate 2.004* 1.014 0.21
High 1.386 0.967 0.14

45
Table A.2.2: Reading Contextualised value added Model*Statistically significant at 0.05 level; # Just failed to reach statistical significance at 0.05 level
Reading Estimate SE Effect Size
Y1 Reading 0.485* 0.026 1.32
Gender (girls compared to boys) -0.553 0.694 -0.05
Developmental problems (compared to none)
1 -2.066* 1.115 -0.19
2+ -10.964* 4.141 -1.03
Free School Meal Eligibility (FSM) (compared to not eligible) -2.006* 0.896 -0.19
Mother’s highest level of qualification (compared to none
Missing data -3.057 2.830 -0.29
Vocational 3.220* 1.208 0.30
Academic age 16 3.298* 0.976 0.31
Academic age 18 4.711* 1.571 0.44
Degree 8.846* 1.462 0.83
Higher Degree 10.149* 2.184 0.96
Other 3.118 2.642 0.29
Early years HLE (compared to 0 - 13)
Missing data 3.040 2.938 0.29
14-19 0.382 1.321 0.04
20-24 3.325* 1.338 0.31
25-32 3.534* 1.318 0.33
33-45 6.531* 1.603 0.62
TableA.2.3:Null models showing primary school and child level variance of Year 5 cognitive outcomes for the
sub-sample of children attending the focal schools
Reading
Estimate(standard
error)
Mathematics
Estimate (standarderror)
School level variance estimate (se) 25.12903(6.04) 38.310(7.90)
Child level variance (se) 180.2907(7.99) 178.808(7.97)
Intra-school correlation 0.122 0.176
Number of children 1052 1123
Number of schools 123 123

46
Table A.2.4:Contextualised value added analysis of cognitive progress from the end of Year 1 in primary
school to the end of Year 5 showing primary school and child level variance
Reading (Year 5)standardised score
Mathematics (Year 5)standardised score
Estimate (standard error) Estimate (standard error)
School level varianceestimate (se)
6.097729(2.81)11.790(3.28)
Child level variance (se) 112.5746(5.21) 95.28696(4.48)
Intra-school correlation 0.05 0.11
% Reduction in school levelvariance
75.73 69.2
% Reduction in child levelvariance
37.56 46.7
% Reduction total variance 42.23 50.7

47
Table A.2.5: ‘Hyperactivity’ Contextualised value added Model
*Statistically significant at 0.05 level; # Just failed to reach statistical significance at 0.05 level
‘Hyperactivity’Estimate SE
EffectSize
Y1 Hyperactivity 0.447* 0.027 0.07Age -0.015* 0.007 -0.14Gender (Compared to girls) -0.450* 0.053 -0.60
Behavioural problems (compared to none)
1 0.081* 0.084 0.112+ 0.612* 0.189 0.81
Mother’s highest level of qualification (compared to none)
Missing -0.254 0.222 -0.34Vocational 0.111 0.089 0.15
Academic age 16 -0.099 0.074 -0.13Academic age 18 -0.110 0.114 -0.15
other -0.230 0.301 -0.30Degree and Higher degree -0.168 0.105 -0.22
Family salary (Compared to ‘no salary’)
Missing data -0.300 0.207 -0.402,500-17,499 -0.139 0.160 -0.18
17,500-29,499 -0.354* 0.157 -0.4730,000-37,499 -0.267 0.165 -0.3537500-67,499 -0.169 0.151 -0.22
67,500-132,000+ -0.088 0.173 -0.12
Marital status (Compared to Married)
Single never married 0.172* 0.086 0.23Living with partner 0.102 0.071 0.14
Separated/Divorced 0.215* 0.090 0.29Other -0.244 0.300 -0.32
Enrichment outing (compared to very high)
Missing data 0.220 0.176 0.29Low -0.167 0.110 -0.22
Moderate -0.161* 0.096 -0.21High -0.245* 0.091 -0.32
Expressive Play (compared to very high)
Low 0.220* 0.094 0.29Moderate 0.137* 0.079 0.18
High 0.174* 0.075 0.23

48
Table A.2.6: ‘Self-regulation’ Contextualised value added models
*Statistically significant at 0.05 level; # Just failed to reach statistical significance at 0.05 level
‘Self-regulation’ Estimate SE EffectSize
Y1 Self-regulation 0.45* 0.03 0.07
Age 0.00 0.01 0.02
Gender (Compared to girls) 0.02 0.06 0.02
Behavioural problems (compared to none)
1 -0.21* 0.09 -0.262+ -0.13 0.36 -0.16
Free School Meal Eligibility (FSM) (compared to not eligible)Eligible for FSM -0.18* 0.07 -0.21
Mother’s highest level of qualification (compared to no qualifications)
Missing 0.26 0.24 0.32Vocational 0.19* 0.10 0.23
Academic age 16 0.11 0.08 0.13Academic age 18 0.16 0.13 0.20
Other 0.30 0.34 0.36Degree and Higher degree 0.28* 0.12 0.34
Father’s highest level of qualification (compared to no qualifications)
Missing -0.12 0.44 -0.14Vocational 0.10 0.10 0.12
Academic age 16 0.25* 0.09 0.30Academic age 18 0.18 0.13 0.21
Degree and 0.19 0.12 0.23Higher degree 0.23 0.18 0.28
Other -0.08 0.29 -0.09Missing (father absent) 0.30* 0.09 0.36
Family salary (Compared to ‘no salary’)
Missing data 0.0355 0.0681 0.04
2,500-17,499 0.0751 0.0675 0.08
17,500-29,499 0.2038* 0.0724 0.22
30,000-37,499 0.2282* 0.0830 0.25
37500-67,499 0.2142* 0.0762 0.23
67,500-132000+ 0.2290* 0.1033 0.25
Early years HLE (compared to 0 - 13)
Missing -0.11 0.23 -0.1314-19 0.03 0.11 0.0420-24 0.04 0.11 0.0425-32 0.09 0.11 0.1133-45 0.27* 0.13 0.33
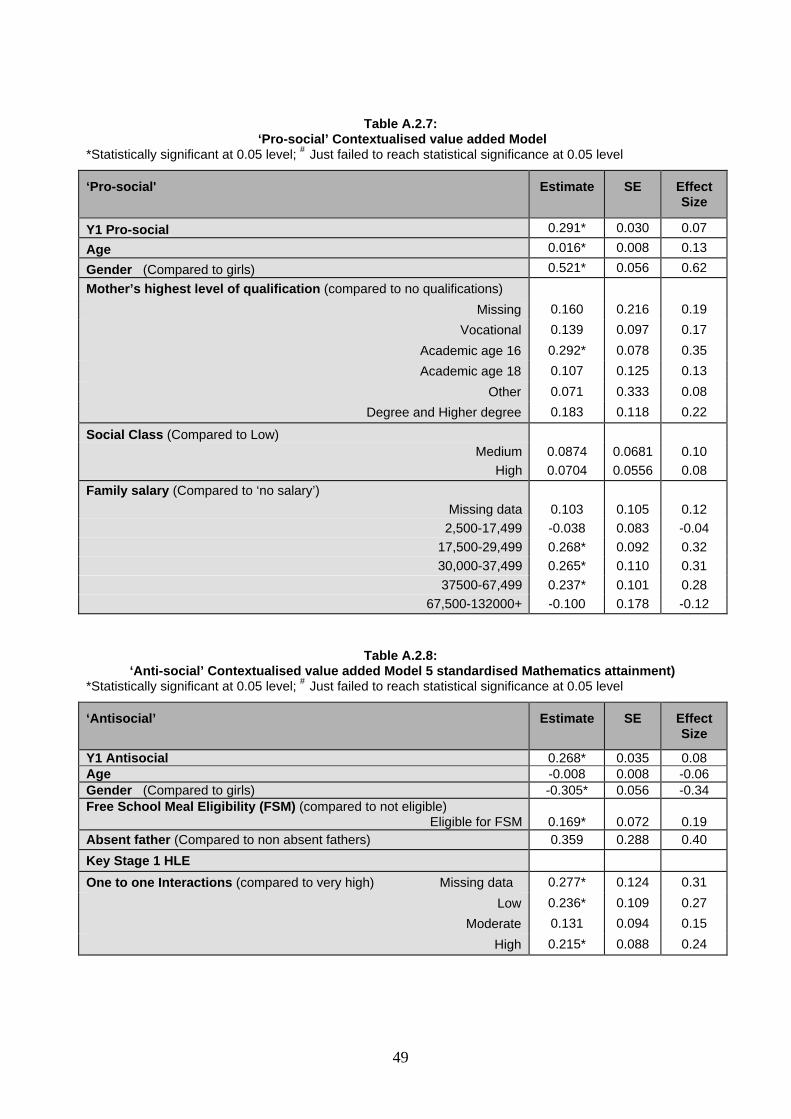
49
Table A.2.7: ‘Pro-social’ Contextualised value added Model
*Statistically significant at 0.05 level; # Just failed to reach statistical significance at 0.05 level
‘Pro-social' Estimate SE EffectSize
Y1 Pro-social 0.291* 0.030 0.07
Age 0.016* 0.008 0.13
Gender (Compared to girls) 0.521* 0.056 0.62
Mother’s highest level of qualification (compared to no qualifications)
Missing 0.160 0.216 0.19
Vocational 0.139 0.097 0.17
Academic age 16 0.292* 0.078 0.35
Academic age 18 0.107 0.125 0.13
Other 0.071 0.333 0.08
Degree and Higher degree 0.183 0.118 0.22
Social Class (Compared to Low)Medium 0.0874 0.0681 0.10
High 0.0704 0.0556 0.08
Family salary (Compared to ‘no salary’)
Missing data 0.103 0.105 0.12
2,500-17,499 -0.038 0.083 -0.04
17,500-29,499 0.268* 0.092 0.32
30,000-37,499 0.265* 0.110 0.31
37500-67,499 0.237* 0.101 0.28
67,500-132000+ -0.100 0.178 -0.12
Table A.2.8: ‘Anti-social’ Contextualised value added Model 5 standardised Mathematics attainment)
*Statistically significant at 0.05 level; # Just failed to reach statistical significance at 0.05 level
‘Antisocial’ Estimate SE EffectSize
Y1 Antisocial 0.268* 0.035 0.08Age -0.008 0.008 -0.06Gender (Compared to girls) -0.305* 0.056 -0.34Free School Meal Eligibility (FSM) (compared to not eligible)
Eligible for FSM 0.169* 0.072 0.19Absent father (Compared to non absent fathers) 0.359 0.288 0.40
Key Stage 1 HLE
One to one Interactions (compared to very high) Missing data 0.277* 0.124 0.31
Low 0.236* 0.109 0.27
Moderate 0.131 0.094 0.15
High 0.215* 0.088 0.24

50
Table A.2.9:Null model showing primary school and child level variance of Year 5 Social/ behavioural
outcomes for the sub-sample of children attending the focal schools
‘Hyperactivity’‘Self-regulation’ ‘Pro-social’ ‘Anti-social’
Estimate(standard
error13)
Estimate(standard error)
Estimate(standard
error)
Estimate(standard
error)
School level varianceestimate (se)
0.079 (0.025) 0.066 (0.023) 0.130(0.032) 0.072(0.024)
Child level variance (se) 0.910 (0.040) 0.964(0.043) 0.898(0.040) 0.840(0.037)
Intra-school correlation 0.081 0.064 0.12 0.079
Number of children 1114 1114 1114 1114
Number of schools 123 123 123 123
Table A.2.10:Contextualised value added models of social/behavioural measures at Year 5 showing primary
school and child level variance for the sub-sample of children attending the focal schools
Hyperactivity
Estimate(standard error)
Self-regulation
Estimate(standard error)
Pro-social
Estimate(standard error)
A
Estimate(standard error)
School level varianceestimate (se)
0.054(0.0218) 0.084(0.022) 0.104(0.027) 0.053(0.021)
Child level variance (se) 0.570(0.027) 0.684(0.023) 0.712(0.033) 0.786 (0.036)
Intra-school correlation 0.10 0.11 0.13 0.06
% Reduction in schoollevel variance
37.3 28.9 16.5 26.2
% Reduction in child levelvariance
20.8 29.0 21.3 6.4
% Reduction total variance 36.0 25.3 20.7 7.9
13 The standard error provides a measure of the confidence limits associated with each estimate and is used toestablish the statistical significance of the results.
51
Appendix 3: EPPE 3-11 imputation of missing data
In order to conduct analysis on as large a sample as possible from the EPPE 3-11 data, a selectnumber of variables were subject to ‘imputation’ of values where item level data were missing,either due to item or wave non-response. The imputation methods employed as was ‘lastobservation carried forward’. Specifically, the ‘last observation’ was data from the initial EPPEparent interview, conducted when the children were in pre-school, aged about three years old orin the case of most ‘Home’ children four years old.
The variables subject to imputation used in the analyses for this report were: Sibling count;Socio-economic status (SES) of mother / father.
Such data, where appropriate, was used to complete missing items from the ParentQuestionnaire conducted at Key Stage 1, when the children were age 6 to 7 years old. In eachcase the variables in the source were comparable, in terms of scale or possible item responsecategories, with those in the target. This was not the case for parents’ qualifications, and henceas yet this measure has not been subject to such imputation.
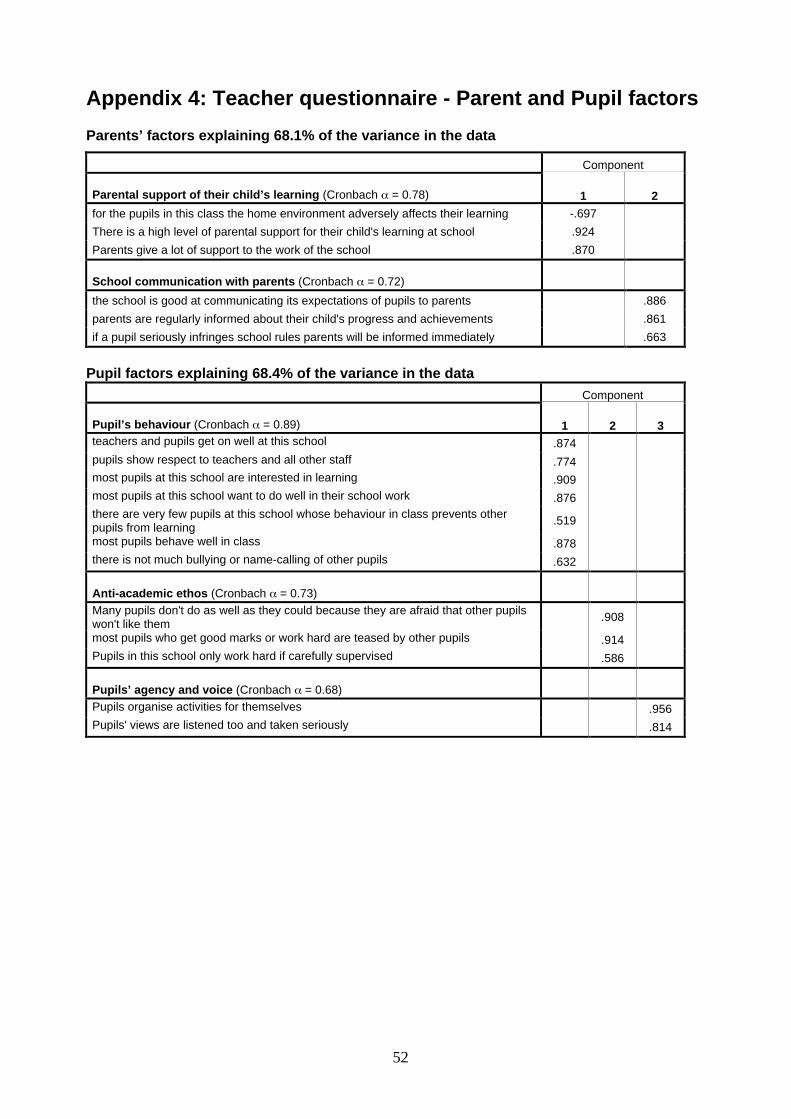
52
Appendix 4: Teacher questionnaire - Parent and Pupil factors
Parents’ factors explaining 68.1% of the variance in the data
Component
Parental support of their child’s learning (Cronbach α = 0.78) 1 2
for the pupils in this class the home environment adversely affects their learning -.697
There is a high level of parental support for their child's learning at school .924
Parents give a lot of support to the work of the school .870
School communication with parents (Cronbach α = 0.72)
the school is good at communicating its expectations of pupils to parents .886
parents are regularly informed about their child's progress and achievements .861
if a pupil seriously infringes school rules parents will be informed immediately .663
Pupil factors explaining 68.4% of the variance in the data
Component
Pupil’s behaviour (Cronbach α = 0.89) 1 2 3teachers and pupils get on well at this school .874pupils show respect to teachers and all other staff .774most pupils at this school are interested in learning .909most pupils at this school want to do well in their school work .876there are very few pupils at this school whose behaviour in class prevents otherpupils from learning
.519
most pupils behave well in class .878there is not much bullying or name-calling of other pupils .632
Anti-academic ethos (Cronbach α = 0.73)
Many pupils don't do as well as they could because they are afraid that other pupilswon't like them
.908
most pupils who get good marks or work hard are teased by other pupils .914Pupils in this school only work hard if carefully supervised .586
Pupils’ agency and voice (Cronbach α = 0.68)
Pupils organise activities for themselves .956Pupils' views are listened too and taken seriously .814
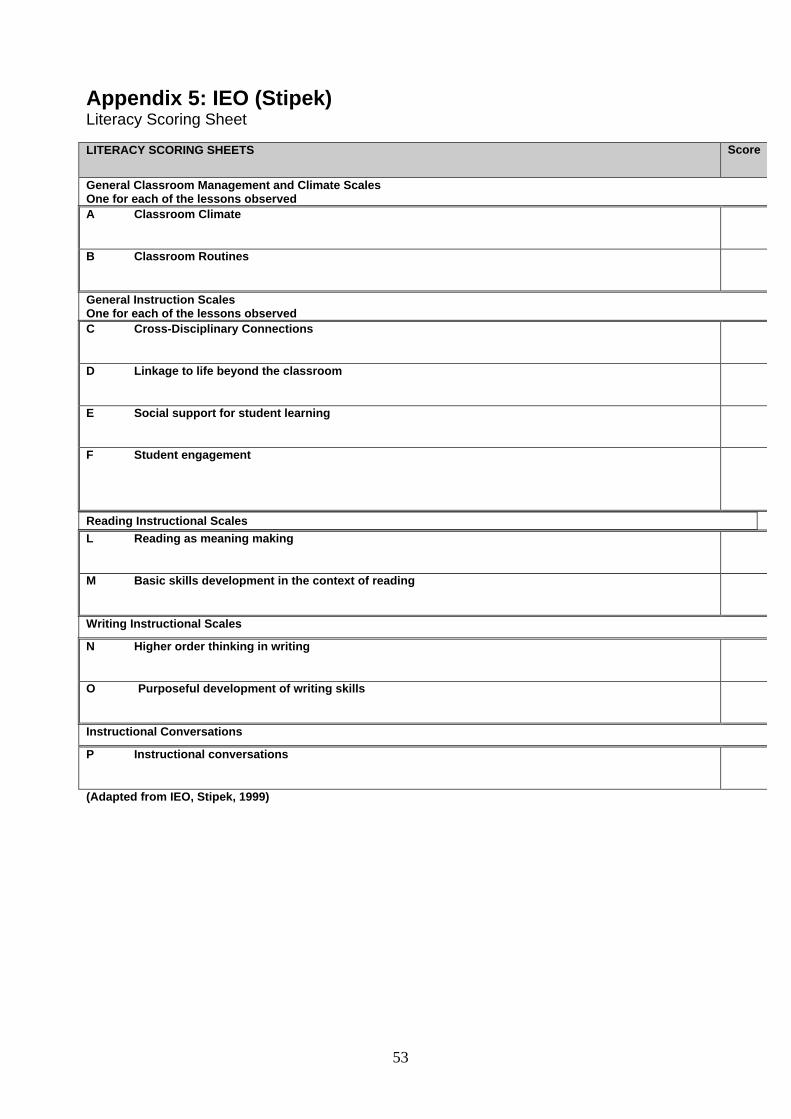
53
Appendix 5: IEO (Stipek)Literacy Scoring Sheet
LITERACY SCORING SHEETS Score
General Classroom Management and Climate ScalesOne for each of the lessons observedA Classroom Climate
B Classroom Routines
General Instruction ScalesOne for each of the lessons observedC Cross-Disciplinary Connections
D Linkage to life beyond the classroom
E Social support for student learning
F Student engagement
Reading Instructional Scales
L Reading as meaning making
M Basic skills development in the context of reading
Writing Instructional Scales
N Higher order thinking in writing
O Purposeful development of writing skills
Instructional Conversations
P Instructional conversations
(Adapted from IEO, Stipek, 1999)

54
Numeracy Scoring Sheet
NUMERACY SCORING SHEETS Score
General Classroom Management and Climate ScalesOne for each of the lessons observedA Classroom Climate
B Classroom Routines
General Instruction ScalesOne for each of the lessons observedC Cross-Disciplinary Connections
D Linkage to life beyond the classroom
E Social support for student learning
F Student engagement
Mathematical Instructional Scales
G Use of Maths analysis
H Depth of knowledge and student understanding
I Basic skill development in the context of problem solving
J Maths discourse and communication
K Locus of Maths authority
(Adapted from IEO, Stipek, 1999)

55
Appendix 6: The COS-5 (NICHD/Pianta) InstrumentFrequency of Behaviour1 CHILD-LEVEL SETTING MINUTE INTERVAL
Whole class 1 2 3 4 5 6 7 8 9 10Large group >6 1 2 3 4 5 6 7 8 9 10Small group 6 or fewer 1 2 3 4 5 6 7 8 9 10Individual 1 2 3 4 5 6 7 8 9 1011 CONTENT OF TC ACTIVITY
Literacy/Language Arts 1 2 3 4 5 6 7 8 9 10
Word-level Activities 1 2 3 4 5 6 7 8 9 10Comprehension 1 2 3 4 5 6 7 8 9 10
Part of Literacy hour 1 2 3 4* 1 2 3 4 5 6 7 8 9 10Part of Literacy hour W / S / T 1 2 3 4 5 6 7 8 9 10
Mathematics 1 2 3 4 5 6 7 8 9 10
Computation 1 2 3 4 5 6 7 8 9 10Concept Development/Problem Solving 1 2 3 4 5 6 7 8 9 10
Part of NNS O / M / P* 1 2 3 4 5 6 7 8 9 10
Science 1 2 3 4 5 6 7 8 9 10Social Science 1 2 3 4 5 6 7 8 9 10Enrichment 1 2 3 4 5 6 7 8 9 10
Computers/Technology 1 2 3 4 5 6 7 8 9 10Free time 1 2 3 4 5 6 7 8 9 10Transitions/Management/Business 1 2 3 4 5 6 7 8 9 10111 TEACHER BEHAVIOUR
Attends to TC 1 2 3 4 5 6 7 8 9 10
Teaching Basic Skills/facts 1 2 3 4 5 6 7 8 9 10Teaching Analysis/Infer/Plan 1 2 3 4 5 6 7 8 9 10
Managerial instructions 1 2 3 4 5 6 7 8 9 10Monitoring/Checking work 1 2 3 4 5 6 7 8 9 10Display Positive Affect 1 2 3 4 5 6 7 8 9 10Displays Negative Affect 1 2 3 4 5 6 7 8 9 10Disciplines 1 2 3 4 5 6 7 8 9 101V CHILD ACADEMIC BEHAVIOUR
Engaged in learning 1 2 3 4 5 6 7 8 9 10Highly Engaged 1 2 3 4 5 6 7 8 9 10Unproductive/Spaced Out /Disengaged 1 2 3 4 5 6 7 8 9 10Off-task – Alternative Academic Activity 1 2 3 4 5 6 7 8 9 10
Learning/Performing Basic Skills/Facts 1 2 3 4 5 6 7 8 9 10Learning/Performing Analysis/Inferenceetc.
1 2 3 4 5 6 7 8 9 10
Collaborative Work 1 2 3 4 5 6 7 8 9 10Requests Attention/Help/Information 1 2 3 4 5 6 7 8 9 10Volunteers 1 2 3 4 5 6 7 8 9 10
V CHILD SOCIAL BEHAVIOUR
Positive /Neutral Engagement with Peers 1 2 3 4 5 6 7 8 9 10Negative/Aggressive Engagement withPeers
1 2 3 4 5 6 7 8 9 10
Positive Affect Toward Teacher 1 2 3 4 5 6 7 8 9 10Negative Affect Toward Teacher 1 2 3 4 5 6 7 8 9 10General Disruptive Behaviour 1 2 3 4 5 6 7 8 9 10END-OF-BEHAVIOURAL RATINGS:Classroom level setting 1…..Whole, 2…..Groups, 3…..Individual, 4…..mixedTeacher suggests/offers collaborative activity ………A lot …….Somewhat ……….Never
Test/Quiz administered during any portion of observation N Y(Adapted from NICHD FSV01G5)

56
A - Measures of Quality -Child Codes
1 2 3 4 5 6 7Uncharacteristic Minimally
characteristicNormException: 5
Verycharacteristic
Extremelycharacteristic
Child code Scores should reflect global classroom observations related to TC’s point of view. Rating1 Positive Affect (1-7) 1 2 3 4 5 6 7
2 Self Reliance (1-7) 1 2 3 4 5 6 7
3 Sociable/Cooperative with Peers (1-7) 1 2 3 4 5 6 7
4 Attention (1-7) 1 2 3 4 5 6 7
5 Disruptive (1-7) 1 2 3 4 5 6 7
6 Activity Level (1-7) 1 2 3 4 5 6 7
7. Child-Teacher Relationship (1-7) 1 2 3 4 5 6 7
End-of-cycle ratings:(Adapted from NICHD FSV01G5)
General Observations on the whole class
1 The children respected by peers.1 None/Some ofthe time
2 Most of the time3 All of the time
2Children are responsible for time and materials(independence) tangible responsibility
1 None/Some ofthe time
2 Most of the time3 All of the time
3The learning intentions of the lesson/activity is clearto children
1 Not clear 2 Clear to some3 Clear to all
4Children could reflect on their learning throughreview
1 No evidence 2 Some evidence3 Very evident
5The teacher’s materials/resources were wellorganised/managed and ‘fit for purpose’
1 Not wellorganised
2 S o m eorganisation
3 Well organised
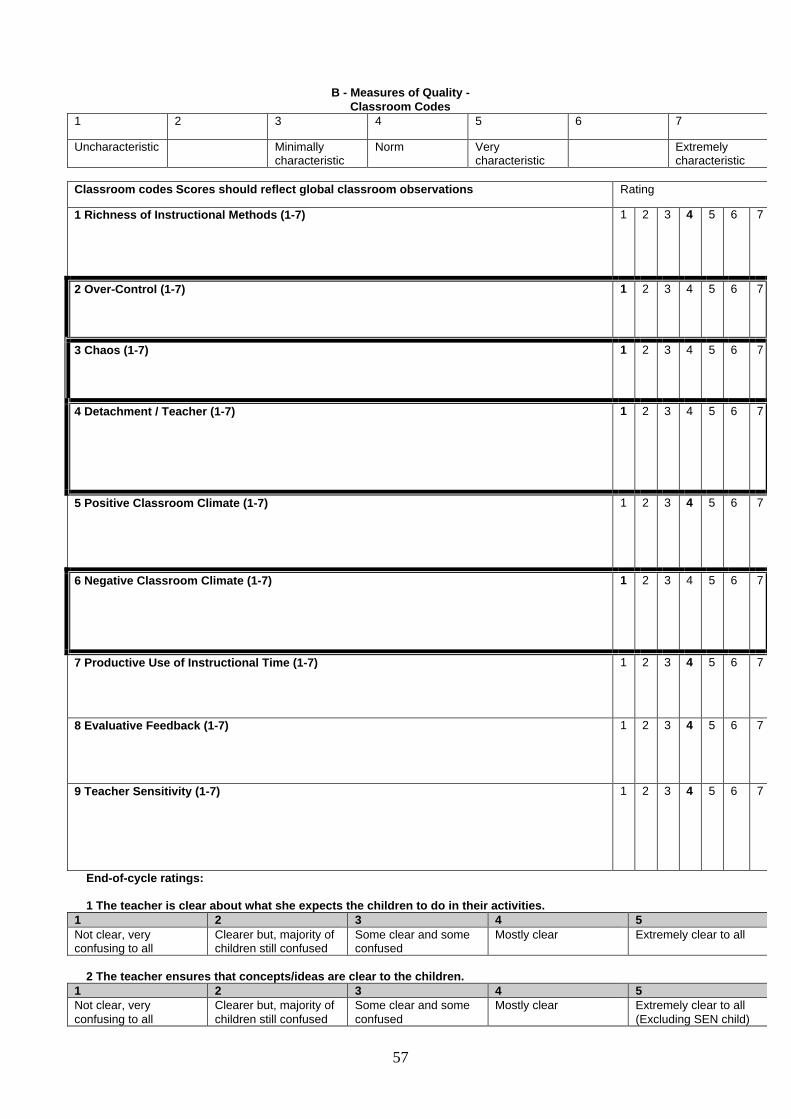
57
B - Measures of Quality -Classroom Codes
1 2 3 4 5 6 7
Uncharacteristic Minimallycharacteristic
Norm Verycharacteristic
Extremelycharacteristic
Classroom codes Scores should reflect global classroom observations Rating
1 Richness of Instructional Methods (1-7) 1 2 3 4 5 6 7
2 Over-Control (1-7) 1 2 3 4 5 6 7
3 Chaos (1-7) 1 2 3 4 5 6 7
4 Detachment / Teacher (1-7) 1 2 3 4 5 6 7
5 Positive Classroom Climate (1-7) 1 2 3 4 5 6 7
6 Negative Classroom Climate (1-7) 1 2 3 4 5 6 7
7 Productive Use of Instructional Time (1-7) 1 2 3 4 5 6 7
8 Evaluative Feedback (1-7) 1 2 3 4 5 6 7
9 Teacher Sensitivity (1-7) 1 2 3 4 5 6 7
End-of-cycle ratings:
1 The teacher is clear about what she expects the children to do in their activities.1 2 3 4 5Not clear, veryconfusing to all
Clearer but, majority ofchildren still confused
Some clear and someconfused
Mostly clear Extremely clear to all
2 The teacher ensures that concepts/ideas are clear to the children.1 2 3 4 5Not clear, veryconfusing to all
Clearer but, majority ofchildren still confused
Some clear and someconfused
Mostly clear Extremely clear to all(Excluding SEN child)
58
Appendix 7: Training and Reliability
Training
The COS-5 and IEO instruments are complex requiring intensive training to prepare researchersfor their use in Year 5 classrooms. Ten Research Assistants were recruited and all had extensiveexperience of working in primary schools both as practitioners and researchers.
A total of 12 days were needed to complete the training for both the IEO and COS-5 instruments,excluding time for researcher review of materials and classroom and video training. The trainingprogramme covered:
a) review of the documentation associated with the instrumentsb) familiarisation with definitionsc) instructions on administrationd) video training on scoringe) reviews of scoringf) individual and paired observations in naturalistic settings.
Following initial in-house and video training, the researchers then tested the instrument in thefield with both individual and paired observations. These observations were completed in Year 5classrooms of schools unrelated to the project. At each stage of the training, researchers had tocompare assessments and give justifications for their judgements. This was seen as animportant part of validating the reliability of the observations. Both the COS-5 and the IEO relyon numerical ratings and qualitative justifications.
ReliabilityChecks on inter-observer reliability were conducted at each stage of the training in order toensure consistency across coders. Final inter-observer reliability was achieved after theextensive training period. The format for reliability was video tapes of whole lessons whichobservers coded in isolation. This follows the procedures used by the NICHD for reliability. InEPPE 3-11 ten researchers coded eleven lessons for the COS-5 instrument and six lessons forthe IEO. The lessons covered Literacy, Mathematics, Geography and Start of the afternoon.
For the COS-5 instrument inter-observer reliability was available from the NICHD study (reliabilityfor the IEO was unavailable). The NICHD (2001) reported “average exact agreement with thegold-standard videotape test for the time-sampled codes, estimated by correlation with master-coders scores, was .848……..average live reliability across all global ratings, estimated usingcorrelations was .714” (NICHD, 2001, p 6). In the EPPE 3-11 reliability inter-rater agreementwas also assessed using simple correlations for comparison with the NICHD data, exactagreement with the gold standard was r=0.82- with a range of 0.75-0.87, and average exactagreement across all raters was r=0.80 with a range of 0.68 – 0.95.
In addition inter-observer agreement was assessed for each instrument using the Kappastatistics. Each observer was compared against a gold standard for each lesson type; nine pairsof comparisons were calculated for each lesson type within each instrument. The derived scoreswere then averaged across lessons and across observers for each instrument. Inter-observeragreement was high for both the COS-5 (weighted Kappa scores, 0.56 - 0.920; with a mean of0.80) and the IEO (weighted Kappa scores, 0.55 - 0.84 with a mean of 0.74) instruments.
59
Appendix 8: Data Entry and Analysis
Data EntryAs noted above, the Frequency of Behaviour Coding observations consisted of ten 60-secondintervals, which included 30-seconds of uninterrupted observation and 30 seconds of recording.Each of these intervals was entered as an individual variable receiving either a value of 1(observed) or 0 (not observed). For example, ‘Small group setting 1’ would refer to the childworking in a small group during the first minute (interval) of the 10 minute observation. Allindividual intervals within a specific code were then added together to create a single score out of10 for that code for a given cycle (e.g. If ‘Small group setting’ was observed occurring in 6 of the10 intervals, it would receive a score of 6). This procedure was applied for each of theFrequency of Behavioural Coding cycles in each school. Only the total scores for each codewere used for further analysis.
The ‘Other Pedagogical Strategies’ and the ‘Measuring of Quality Coding System’ were eachentered as a single variable which could take any value between 1 and 7, corresponding to theseven-point Likert-like rating scale on which these observations were based. Data files werethen aggregated to yield a mean score for each individual Year 5 class.
Data for the IEO were entered separately as these scales were applied once in each classroom.The IEO scales were applied in both a Literacy and Numeracy session; however the categoriesapplied in each of these subject settings were different and therefore treated as two separatescales. Each code of the Numeracy and Literacy Scale was entered as a single variable withvalues corresponding to the scales on which the observations were based (1 to 5 point Likertscale). These variables were than merged with the aggregated COS-5 codes file.
After the fieldwork was completed (Summer 2005), the Research Assistants were consulted atthe data entry stage to ensure consistency across the data. This was seen as an essential partof the Research Assistants’ role, particularly in ensuring common understandings by the dataenterers of the meanings of professional terms and descriptions.

60
Appendix 9: Indicators of classroom behaviours using theCOS-5 (Pianta) Measures of Quality
Child Codes
1 Positive AffectReflects happy mood and pleasant state of TC seen during interactions-personal contentment.Rating based on quantity and quality of behaviour.High = sparkle/radiate/smiles/laughter/enthusiasm.Mid = 4 – overall content/neutral but with engagement.Low = flat/not content/no positive mood/disengaged/glum/bored/detached.
2 Self-RelianceDisplay autonomy, responsibility, initiative, self-direction, leadership, and assertiveness.High = need little adult direction, willingness to take risks, assertive with peers.Low = lacks confidence, needs adult help before trying, dependent, passive, hesitant.
3 Sociable/Co-operative with PeersPositive engagement, seeks contact, initiates and responds to others initiationHigh = joins in – initiates talk and interaction, co-operates, sociable – shares, helps peers.Low = withdrawn, disengaged, no interest in peers, no compromise, negative engagement,stubborn, bossy, obstructive, dominate.
4 AttentionLevel of sustained, focused or directed attention to ongoing classroom activities. If unsure codemidpoint 4.High = sustained forms, tuned in, on task.Low = easily distracted, creates diversions, fidget, play aimless, disengaged, daydreams, needsteacher prompting, unfocused.
5 DisruptiveMovement up the scale will depend on the number of children and adults affected by the child’sbehaviourA score of 5 or higher would suggest an increasingly disruptive child. For instance a child thatshouts out continuously, causing the teacher to have to stop the lesson or hindering otherchildren’s capacity to work.A score of 3-4 would be recorded for the TC who has a couple, brief instances of inappropriatebehaviour that disrupts others (the more children affected the higher the score)A score of 2 would be recorded for the child who has one disruptive moment, which has nolasting effects on others and a score of 1 would be given to the child who displays no disruptivebehaviours throughout the observed lesson.This scale should not take as evidence the child that does not remain on task – but rather thedegree his behaviour effects those around him.High = does not follow rules, makes noises, calls out, taps pencil – these behaviours must annoyand disrupt others in order for a score of 5 or more.Mid = (4) a couple/few instances of inappropriate behaviour causing disruption to othersLow = compliant, not disruptive at all, can be inattentive if quiet but does not disrupt others
6 Activity levelHigh = overactive, hyper – lots of movement, not sit still, moves around.Mid = 4 = some movement but appropriate to situation so some fidget and shuffle = normal.Low = inactive passive.
7 Child-Teacher RelationshipHigh = positive response to teacher, co-operates, comply, enthusiastic response, respect, initialsteacher responses, affection seen.

61
Mid = limited interaction but child follows rules and instructions.Low = negative engaged, rejects, defiance, ignore, misbehave, argue demand, criticise
Classroom Codes
1 Richness of Instructional Methods• High = 7= range skills, hypothesis, variety, depth strategies, intellectually engaging,
thought provoking, reciprocal discussion, model explain.• Mid = no higher level thinking skills used.• Low = basic format.
2 Over-Control• High = 7 = rigid structure, regimented, driven by teacher needs and agenda not child’s
needs or interests. Little movement, whole class activities, quiet no individualisation,teacher not child talk, stifled not creative, teacher directed, not necessarily successful.
• Low = respect child autonomy and responsibility, see child as an active participant.3 Chaos
• High = noise, confusion, unruly, chaotic, cant see instruction or learning, ineffectualcontrol, misbehaviour especially during transitions, ignore sanctioned activity, disruptivebehaviour, inappropriate behaviour, rude, poor discipline.
• Low = organised, respectful, attentive, clear expectations4 Detachment/Teacher.
• Degree teacher = detached from class or child activity or child understanding or interestlevel.
• High = lack of assistance, feedback, not responding, no notice of task or poor behaviour,teacher sits as desk, lack of interest, not monitoring children’s work or behaviour.
• Low = involved and responsive and alert to child’s needs.5 Positive Classroom Climate
• Emotional and social tone of classroom respectful, safe, welcoming, friendships, happyplace.
• High = listen politely, genuine respect to teacher and child.• Low = neutral climate, flat, dysfunctional, fearful, disrespect, negative.
6 Negative Classroom Climate• Capture climate that is hostile, angry, and punitive.• High = hostile, angry, punitive, controlling, teacher angry, hostile, irritable, lacks concern.
Also consider child behaviour to each other. Shame, humiliation, sarcasm, abruptness.• Low = shows little of above
7 Productive Use of Instructional Time• How well time is managed.• High = smooth transitions, routines automised by all, good planning, preparation
materials, efficient routines when finished work, transition and management time limitedactivities for all therefore productive, no waiting, no disruption.
• Low = time wasted, little of above.8 Evaluative Feedback
• Consider frequency and quality to all class.• Should be in response to a child’s performance on a particular task or skill• Presence of embellishments (repetition of child’s skills; extension of child’s skill)• High = feedback to extend child knowledge and understanding and skills to consolidate,
reinforce, done often and dependably.• Low = perfunctory, occasional, lack of depth and information.
9 Teacher Sensitivity• High = aware of child needs, moods, interests, capabilities, uses sensitive discipline,
takes interest in child, responses facilitate child’s learning.• Low = none demonstrated.
62
Appendix 10: Indicators of classroom behaviours using theIEO (Stipek) scale
General Classroom Management and Climate Scales
A Classroom Climate: extent classroom is a place pupil’s feel safe and respected. Look athow teacher and children speak to one another, friendships amongst pupils, how rules are madeand enforced (discipline), the pace of the lesson observed, opportunity for collaboration, howdecisions are made, how individual ideas are expressed and used (accepted/rejected).HIGH: children and adults use respectful tones when speaking, smiles are shared, children, staffand visitors are made to feel welcome, friendships are visible between children, evidence ofwillingness to share and help each other, individual ideas (ways of approaching a maths questionor opinions about a book character etc) are welcomed and accepted, disagreements areacademic and not personal, teacher uses sensitive discipline and deals with the behaviour ratherthan signalling out child, children have some autonomy etc.LOW: classroom is dysfunctional, threats are overheard, disciplines are overt and personal,children are singled out when errors are made, a tendency to always promote ‘bright’ children,children show negative affect to teacher and/or to each other. There is little to no evidence ofrespect between children or between children and adults in the room. Children are verballyattacked when expressing ideas, there is screaming and evidence of annoyance in the tones ofadults and children, random acts of violence etc.
B Classroom Routines: The use of instructional time. Look at how transitions are managed bothwithin and between lessons, structure/organisation of the day, pace of the lessons, level ofpreparation of materials, how children are involved in the routine business of the day (includingstart of day, taking register, collecting money), do children manage materials etc.HIGH: the classroom resembles a ‘well oiled machine’, transitions are smooth with little to notime lost to instruction, teacher’s expectations are clear and the children understand what theyshould be doing, children are responsible for materials and involved in completing classactivities (collecting dinner money, taking register, preparing materials and they know where theyare and have access to them at all times of the day), learning assistants are available and theirrole is clearly defined etc.LOW: All or most of the transitions are chaotic, children walk around aimlessly as teacher sortsout register or other start of day activities, teacher expectations are unclear, learning assistant isused to run errands for the teacher (photocopying, putting up displays) and is therefore notavailable for the children etc.
General Instruction ScalesC Cross-Disciplinary Connections: Extent to which lesson/activity is connected to multiple subjectareas. Look for explicit and explored connections made between subjects.High: Explicit connections are made between subjects and these connections are explored bythe children. For instance, skills developed in maths are used as a tool to support learning inScience, where the skills are directly linked back to maths. Evidence where the study of onesubject enriches the study of the other. The connections are explored in depth and are used togenerate meaning and extend pupils’ understanding.LOW: Subjects are studied in isolation. Connections are either mentioned in passing or notmentioned or realised by children at all, even though connections exist.
D Linkage to life beyond the classroom: Extent to which lesson/activity is connected tocompetencies or concerns beyond the classroom. Look for attempts made to connect children’soutside lived experiences or current issues with in-school events.HIGH: students worked on at least one topic/lesson that was directly connected to their personalexperience or a contemporary/current event outside of school. The connection is made explicitand the children recognise the connection, as demonstrated through their verbal contributions.These connections are explored in depth and used in a way to create personal meaning and

63
significance in the subject. The adult helps make the skill relevant to child’s life beyond theworksheet or classroom activity. There is the creation of concrete/tangible evidence of theirattempt to understand a topic or solve the problem.LOW: there are no clear connections to anything beyond the classroom itself. All activities areapproached with the expectation of doing well in class rather than locating the relevance of theactivities outside the classroom setting. Connections between classroom skill and outsideclassroom functions are not explored or presented.
E Social support for student learning: Extent classroom learning environment is characterised byan atmosphere of high academic expectations for all students coupled with mutual respect andsupport among teacher and pupils. Look at how children are supported by teacher and eachother.HIGH: children are supported by high expectations conveyed and set by the teacher for ALLchildren. Children are encouraged to take risks, seek and explore challenges and learn fromerrors. The adults value all children and see everyone as capable of contributing. Everyone’scontributions are taken seriously and any errors are explored and used as a point of departurerather than glossed over in search of the ‘correct’ answer. All children are encouraged, not onlythe ‘strongest.’LOW: The teacher used put-downs when referring to children’s academic efforts, product overprocess, pupils interfere with each other’s efforts to learn (constant interruptions, noise level etc).In general, social support is negative. Children are discouraged to take risks because of the fearof put-downs or being laughed at. Mistakes are glossed over or ignored.
F Student engagement: To what extent are students engaged in lessons. Look for evidence ofengagement.HIGH: There is serious engagement identified by on-task behaviour, attentiveness, completion oftasks, displays of enthusiasm, initiative taken by children and accepted and extended by teacher,children contribute both in whole class and group discussions and activities. This would describethe majority of the time.LOW: For the majority of the observation children are disengaged, to the point of distraction.There is little attention and the disruption of others makes those who would like to attend to taskincapable of doing so. There is a lot of evidence of daydreaming, off-task talk and generaldisruptive behaviour. Children show little to no interest in lesson/activity.
Mathematical Instructional ScalesG Use of Maths analysis: What extent do children use maths analysis? Look for evidence ofHigher order thinking.HIGH: Involves inventing original procedures where children construct original ways to solvemaths problems and these methods are explored and tested seriously by class/teacher. Childrenalso are involved in searching for maths patterns, making maths conjectures with justifications,organising, evaluating (other pupils as well as their own strategies to see if they are valid),arguing and defending one’s work/ideas/methods and making models to representideas/answers.LOW: Thinking is restricted to mechanically recording or reporting of maths facts, rules,definitions or mechanically applying algorithms. There is a lot of receiving, reiterating, recitingand performing routine procedures. There is little or no evidence of maths analyses observed.
H Depth of knowledge and student understanding: Extent to which maths knowledge is treateddeeply in class.HIGH: Evidence of the development of relatively complex understanding of lesson’s concepts.There is evidence of the development of relatively systematic, integrated or holisticunderstandings of maths concepts. Students are seen to produce new knowledge whenconnecting maths topics to one another, when solving problems, making conjectures, justifyingtheir hypotheses and making conclusions. The teacher structures lessons so that most studentsare engaged in at least one of the following: demonstrating their understanding of the
64
problematic nature of information or ideas, demonstrating complex understanding by arriving at areasoned, supported conclusion or explain how they solved a complex problem.LOW: Knowledge is thin as concepts are treated superficially and as non-problematic (e.g. onlyone way to solve a problem etc). Children are able to present mainly fragmented pieces ofinformation. Pupils cannot or do not use knowledge to make clear distinctions, arguments, solveproblems. There is little or no attempt to make connections between maths concepts (rotememorisation). The teacher may attempt to elicit deeper understanding, but the children areunable or unwilling to respond beyond basic recitation. There is fragmentation in the way mathsknowledge is presented.
I Basic skill development in the context of problem solving: Extent to which students learn basicskills in the context of problem solving. Look for evidence of basic skills teaching and note if thisis done in isolation or in the context of solving a problem (may or may not have basis in realworld context).HIGH: Students take time out from solving problems to learn the meaning of specific terms in theproblem, how to use a particular tool, how to represent quantities symbolically, how to perform abasic skill which is then used in solving a problem. There is evidence of in depth attempt to linkbasic skills teaching within the context of problem solving. The teacher makes the link explicitand the children are able to see the link.LOW: Basic skills might simply not be taught at all. Or if they are taught, the teaching is done inisolation from problem solving. The teacher might drill children using flash cards or rapid verbalquestioning. There is often a focus on memorisation or recitation. Children are also ofteninvolved in repetitive computations (worksheets/sums) without any visible attempt to link this skilldevelopment to actual problem solving.
J Maths discourse and communication: The extent to which classroom discourse in maths isdevoted to creating or negotiating shared understandings of maths. Look for evidence of pupiltalk- is it superficial, short, and brief? Or does it contain opportunities to make meaning andfacilitate understanding?HIGH: Discourse is sustained and leads to shared understanding in this class. There isconsiderable teacher pupil and pupil-pupil discourse about maths ideas, this interaction isreciprocal and it promotes the extension of understanding towards a shared understanding ofconcepts being taught. The following MUST be in evidence in order to give the class a highscore:a. talk is about maths and includes higher order thinking (HOT) – including making distinctions,applying ideas, forming generalisations and raising questions.b. There is a sharing of ideas (not scripted as in teacher led recitation). Evidence: participantsexplain themselves or ask questions in complete sentences, when speaker responds directly tothe previous speaker’s comments/answer (expanding on each other’s ideas and explanations).c. Dialogue builds coherently to promote improved, shared understanding of math topic (similarto b)LOW: In this class, the discourse consists of mainly a lecture from teacher with recitation. Itappears the communication is scripted, where the teacher controls the destination of the lessonand ideas. There is often a question (initiated by teacher) followed by a chosen child’s responseand then a teacher feedback statement. The children are mainly engaged in reportingexperiences, facts, definitions and/or procedures. Oral equivalent of fill in the blank or shortanswer questions.
K Locus of Maths authority: Extent to which the lesson supports a shared sense of authority andresponsibility for validating students’ maths reasoning. Who is involved in validating student’smaths reasoning? * Does not measure students’ control over the content – the teacher may stilldetermine what, is important and worthwhile content wise, without lowering the ‘Locus of Mathsauthority’.HIGH: In this classroom, the teacher and the students hold each other accountable forconvincing themselves and each other that their reasoning is sound and the answers are correct.There is a shared maths authority. The teacher often answers a question with a question or

65
offers instrumental help (good scaffolding), pushing students to make their own decisions.Children turn to themselves or each other for help, before consulting the teacher.LOW: In the main, only the teacher and/or the text book are considered the legitimate source ofmaths authority. They provide the validation of correct methods, explanations and answers. Attimes there seems no one has a means of validating an answer or explanation. Children onlyaccept an answer as correct once the teacher has validated it. At times the teacher becomesannoyed when asked questions by children because s/he has an expected destination andconsiders such questions a digression. This sort of behaviour (child questioning or pupil voice) isprevented by her control of the discourse and validation of the correct response. Children turn toteacher for help, rather than each other.
Reading Instructional ScalesL Reading as meaning making: Extent to which students try to derive meaning from the textsthey read – look for evidence of children making meaning and children trying to understand thesubstance of what they are reading. H.O.T – involving text: making meaning that goes beyonddecoding words, choral reading, and recitation, memorising or applying phonics rules.HIGH: In this classroom, children are engaged in reading that involves trying to understand themeaning of the text. They are trying to guess the meaning of words based on context whenencountering unfamiliar words, using prior knowledge about a situation to help predict what willhappen next, arguing and hypothesising or looking for patterns amongst works from an author orbetween authors. There are often long discussions that emerge from issues encountered in thetext, such as the nuances of a new word. The teacher asks open ended questions that allow forspeculation and diverse responses, she encourages students to read things that interest themand lead to an atmosphere of reading as an activity of meaning making.LOW: In this classroom the children are mainly engaged in activities which require decoding,choral reading, recitation, memorisation or application of phonics rules. Skills are taught inisolation and based on low-level skills, such as decoding. There is little focus on the meaning ofwhat is being read. When reading with small groups, teacher tends to focus on decoding ratherthan content and meaning (for example corrects children misreading of words, but does notdiscuss the word’s meaning).
M Basic skills development in the context of reading: Extent to which students learn basicreading skills within the context of reading for meaning. Skills needed in order to understandwhat you read, conventions of reading: phonics, voice, tense, sentence, structure, syllabification,syntax, grammar, (rich) vocabulary, word recognition, meaning of verbs, nouns, adjectives,adverbs, pronouns and other parts of speech. * an episode of basic skills instruction does notnecessarily lead to a lowering of this score – the issue is whether the skills taught are everexplicitly stated within the activity of reading for meaning.HIGH: in this class, children take time out of reading a passage to figure out the meaning of aword, phrase, literary devices (metaphors, similes etc) based on the text (rather than looking in adictionary or the teacher providing the answer). Students have their own dictionary made up ofwords that they encounter during their reading. There are times when the teacher commences alesson with the instruction of basic skills, which then appears in the passage that is to be read.This connection is made explicit and is explored (furthering the lesson).
LOW: reading skills are taught in isolation or simply not taught at all. There are connectionsbetween the skills instruction and the texts being read but these connections are neithermentioned by the teacher nor do they seem to be recognised by the students. Connections thatare made are not explored or used to develop the lesson or understanding.
Writing Instructional ScalesN Higher order thinking in writing: Extent to which students plan for, edit, revise and otherwiseengaged in H.O.T when they write something, beyond merely practicing how to spell words, therules for grammar and filling in the blanks with pre-specified answers. *NOTE: Higher orderthinking in writing = construction of original text

66
HIGH: Children in this class try to decide on the substance of what they want the reader to read.They have an intention, a story to tell, a point to make or a message to communicate to a desiredaudience. They consider, prior to writing, how to get that point, story, message across (planning).Pupils are often engaged in creating outlines to follow or are in the process of editing andrevising work. They are using their prior knowledge or experience to help them to compose theirnew piece of writing. Teacher provides age-appropriate and skill appropriate opportunities fordifferent kinds of writing for different purposes. They provide appropriate scaffolding for students,such as supporting them to create drafts of their texts, giving substantive feedback (on ideas, notonly grammar and spelling), and encouraging the writers to share with others. Children areengaged in listening to and offering suggestions for improving their peers’ work. LOW: The children in this class are often involved in lower-order thinking, which might includeskills taught in isolation from larger enterprise of writing. Students are often found practicing anddrilling on a long list of vocabulary and spelling words but never given opportunity to use them ina substantive way. Students practice fill-in-the-blank activities without using them to actually writesomething meaningful.
O Purposeful development of writing skills: Extent to which students learn basic writing skills asthey write. A wide range of skills are needed in order to write, the conventions of writing:spelling, voice, tense, sentence, structure, syllabification, syntax, grammar, rich vocabulary etc.Writing for a purpose, a story vs. a poem vs. a memo, vs. an essay etc.HIGH: The pupils in this class take time out to correct an invented spelling while writing. Lessonsmay begin with instruction of a particular type of writing skill, such as grammar or capitalisation,but this skill is directly and explicitly linked to the activity children will be engaged in afterinstructions. Students are often seen writing new words into a personal dictionary or using thisdictionary to support their writing.LOW: Writing skills are taught in isolation as bits of information whose purpose, according to thestudents’ perspective, is vague. Sometimes, writing skills simply are not taught. There may beconnections between basic skills instruction and writing but these connections remain unexploredor unmentioned by teacher. Children are often found memorising lists of vocabulary or spellingbut never rely on this list when engaged in their own writing.
P Instructional conversations: extent which classroom conversations are devoted to creating ornegotiating shared understandings of the content. Consider both content and nature of theconversation. Look at who controls the conversation, are children actively involved or are theysimply passive respondents? Note: read bottom of page 25 for notes on this scale.HIGH: In this class there is considerable teacher-pupil and pupil-pupil interaction about the ideasof a topic, this interaction is reciprocal and promotes shared understanding. The talk in this classis about the content being studied. Children are often found making distinctions, applying ideas,forming generalisations and raising questions (beyond procedural). The conversations involve asharing of ideas and are not completely scripted or controlled by one party. This sharing isevidenced in the pupils’ explanations of themselves or in their asking of questions in completesentences and also when they respond to others directly. There is a building on from oneanother’s ideas. There are sustained explorations of content in this class.LOW: Children are often involved in simply reporting experiences, facts, definitions orprocedures. The teacher controls the conversation in this classroom. The teacher is often seenasking closed questions and the children are seen responding in short answers. Seems like a fillin the blank conversation rather than a dialogue.

67
Appendix 11: Methodology for the social/behavioural analysis
Overall, questionnaires were not returned for 651 children. Of those children for whom thequestionnaire was returned, 2079 had a complete set of scores for the social/behavioural items,i.e., a valid value for all 56 items. The remaining children (441) had one or more missing valuesin the 56-item set. For these 441 cases missing values were substituted with the child’s ownmean.
The social/behavioural instrument consists of a wide range of items (56) rated on a 3-point scale,(1 = not true; 2 = somewhat true; 3 = certainly true) some of which are measuring more adaptivesocial behaviour, e.g., ‘considerate of other peoples feelings’, and some measuring maladaptivebehaviour e.g., ‘has many fears, easily scared’. For the purpose of the missing substitutionanalysis, the items were divided into two sub-groups; of1. Adaptive (29) and2 Maladaptive behaviour (26items) and questions were substituted with the child’s mean of itemsbelonging to the same sub-group. One item was substituted with the overall mean as it wasconsidered neutral ‘gets on better with adults than with children’. The items with the missingsubstitution were then used for all subsequent factor analysis.
A number of data reduction methods were applied to the data, these included PrincipalComponents Analysis (PCA) with varimax (orthogonal) rotation and PCA with promac (opaque)rotation. The exploratory analysis yielded 8 factors explaining 54.9% of the variance with bothtypes of rotation. However, the last factor was relatively weak, i.e., with very few items loadings,consequently two further analyses were conducted forcing a 7 factor solution on the data. Theresulting analysis accounted for 53.2% of the variance. Structural equation modelling was usedto compare between the different models derived. The best fitting model was the 7 factorsolution with promac rotation (RMSEA=0.6; CMIN=14635.647 with 1463 df). The factor scoresproduced by this analysis were normalized and used in further analyses. For the whole samplethe average factor score is 100 with a standard deviation of 15. (see Appendix 3 for details onnormalization procedures).
Component
F1 – Hyperactivity scale 1 2 3 4 5 6 7
2:restless, overactive, cannot stay still for long 997
10:constantly fidgeting or squirming .995
15:easily distracted, concentration wanders .844
21:thinks things out before acting-
.47425:sees tasks through to the end, good attentionspan
-.557 .498
27:quickly loses interest in what she/he is doing .671
36:gets over excited .817
39:is easily frustrated .496 .312
45:is impulsive, acts without thinking .78750:can behave appropriately during less structuredsessions
-.468
54:fails to pay attention .751
56:makes careless mistakes .572-
.324
F2 – ‘Pro-social’ behaviour scale
1:considerate of other people's feelings .493 4:shares readily with other children (treats, toyspencils, etc.)
.445
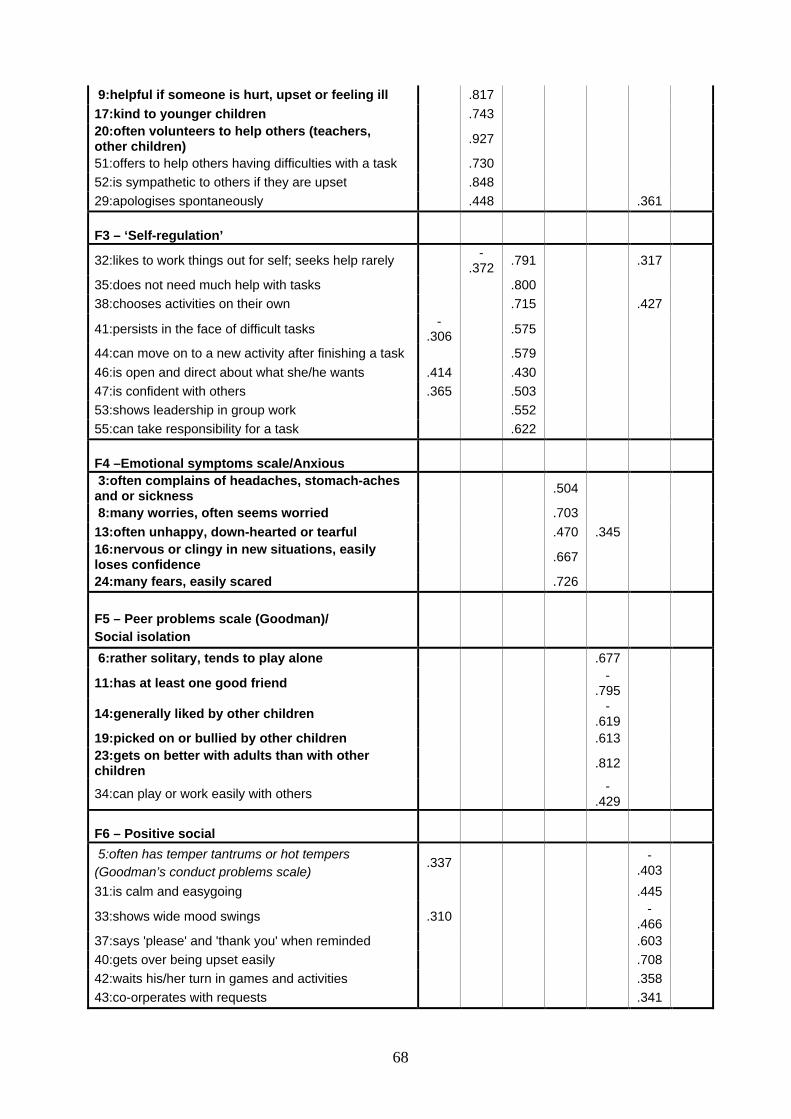
68
9:helpful if someone is hurt, upset or feeling ill .817
17:kind to younger children .74320:often volunteers to help others (teachers,other children)
.927
51:offers to help others having difficulties with a task .730
52:is sympathetic to others if they are upset .848
29:apologises spontaneously .448 .361
F3 – ‘Self-regulation’
32:likes to work things out for self; seeks help rarely-
.372.791 .317
35:does not need much help with tasks .800
38:chooses activities on their own .715 .427
41:persists in the face of difficult tasks-
.306 .575
44:can move on to a new activity after finishing a task .579
46:is open and direct about what she/he wants .414 .430
47:is confident with others .365 .503
53:shows leadership in group work .552
55:can take responsibility for a task .622
F4 –Emotional symptoms scale/Anxious 3:often complains of headaches, stomach-achesand or sickness
.504
8:many worries, often seems worried .703
13:often unhappy, down-hearted or tearful .470 .34516:nervous or clingy in new situations, easilyloses confidence
.667
24:many fears, easily scared .726
F5 – Peer problems scale (Goodman)/Social isolation
6:rather solitary, tends to play alone .677
11:has at least one good friend-
.795
14:generally liked by other children-
.61919:picked on or bullied by other children .61323:gets on better with adults than with otherchildren
.812
34:can play or work easily with others-
.429
F6 – Positive social
5:often has temper tantrums or hot tempers(Goodman’s conduct problems scale)
.337-
.403
31:is calm and easygoing .445
33:shows wide mood swings .310-
.46637:says 'please' and 'thank you' when reminded .603
40:gets over being upset easily .708
42:waits his/her turn in games and activities .358
43:co-orperates with requests .341
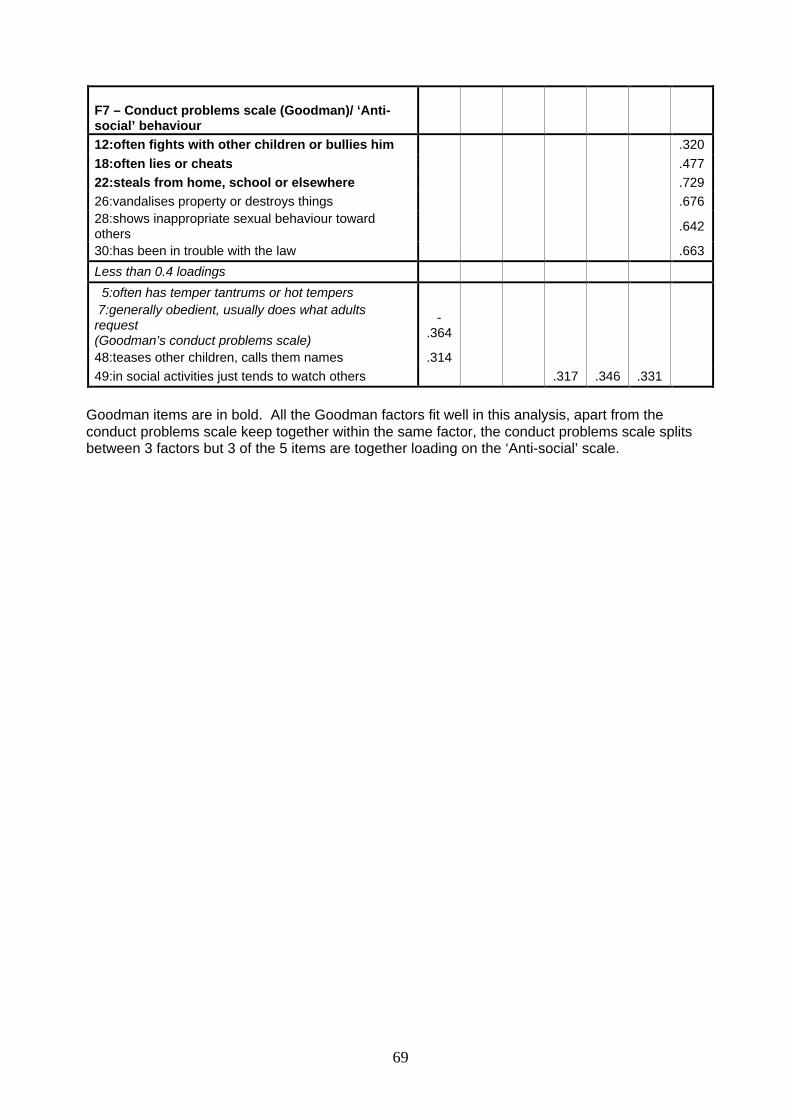
69
F7 – Conduct problems scale (Goodman)/ ‘Anti-social’ behaviour
12:often fights with other children or bullies him .320
18:often lies or cheats .477
22:steals from home, school or elsewhere .729
26:vandalises property or destroys things .67628:shows inappropriate sexual behaviour towardothers
.642
30:has been in trouble with the law .663
Less than 0.4 loadings
5:often has temper tantrums or hot tempers 7:generally obedient, usually does what adultsrequest(Goodman’s conduct problems scale)
-.364
48:teases other children, calls them names .314
49:in social activities just tends to watch others .317 .346 .331
Goodman items are in bold. All the Goodman factors fit well in this analysis, apart from theconduct problems scale keep together within the same factor, the conduct problems scale splitsbetween 3 factors but 3 of the 5 items are together loading on the ‘Anti-social’ scale.

70
Appendix 12: Effect Sizes
To illustrate the impact of different factors on attainment or social behaviour in Year 1 effect sizes(ES) were calculated. Effect sizes are most commonly used in experimental studies andessentially measure the strength of mean differences. Glass et al., (1981) define ES as:
ES = (mean of experimental group)-(mean of control group)/pooled standard deviation
Or ∆∆= XExp - XCont
_______ _______ SDpooled
Effect sizes were calculated for different child outcomes, using both the child level variance andcoefficients for predictors included in the multilevel statistical models adopting the formulaeoutlined by Tymms et al., (1997).
For categorical predictors (e.g. gender or ethnicity) the effect size was calculated as:
ES = categorical predictor variable coefficient / √child level variance
OrΔ = β1
σe
For continuous predictor variables (e.g. child age in months), the effect size describes thechange on the outcome measure produced by a change of +/-one standard deviation on thecontinuous predictor variable, standardised by the within school SD, adjusted for covariates inthe model – the level 1 SD:
Δ = 2 β1*SDx1 where x1=continuous predictor variable σe
Effect sizes can be useful for comparisons between different studies but interpretations must bemade with caution and with reference to the outcomes concerned and controls used in models(Elliot & Sammons, 2004). For further discussion of effect sizes see Coe (2002). Effect sizes forsome categorical measures in the EPPE research are large but apply to small numbers ofchildren (e.g. the very low birth weight group or specific ethnic groups).

71
Appendix 13: EPPE Technical Papers in the series
Technical Paper 1 - An Introduction to the Effective Provision of Pre-school Education (EPPE) ProjectISBN: 085473 591 7 Published: Autumn 1999 Price £8.50
Technical Paper 2 - Characteristics of the Effective Provision of Pre-School Education (EPPE) Project sample at entryto the study ISBN: 085473 592 5 Published: Autumn 1999 Price £4.00
Technical Paper 3 - Contextualising EPPE: Interviews with Local Authority co-ordinators and centre managersISBN: 085473 593 3 Published: Autumn 1999 Price £3.50
Technical Paper 4 - Parent, family and child characteristics in relation to type of pre-school and socio-economicdifferences. ISBN: 085473 594 1 Published: Autumn 1999 Price £4.00
Technical Paper 5 – Characteristics of the Centre in the EPPE Study: (Interviews)ISBN: 085473 595 X Published: Autumn 2000 Price £5.00
Technical Paper 6 - Characteristics of the Centres in the EPPE Sample: Observational ProfilesISBN: 085473 596 8 Published: Autumn 1999 Price £8.50
Technical Paper 6A - Characteristics of Pre-School EnvironmentsISBN: 085473 597 6 Published: Autumn 1999 Price £8.50
Technical Paper 7 - Social/behavioural and cognitive development at 3-4 years in relation to family backgroundISBN: 085473 598 4 Published: Spring 2001 Price £5.00
Technical Paper 8a – Measuring the Impact of Pre-School on Children’s Cognitive Progress over thePre-School Period. ISBN: 085473 599 2 Published: Autumn 2002 Price £8.50
Technical Paper 8b – Measuring the Impact of Pre-School on Children’s Social/behavioural Developmentover the Pre-School Period. ISBN: 085473 683 2 Published: March 2003 Price £8.50
Technical Paper 9 - Report on age 6 assessmentISBN: 085473 600 X Published: November 2004 Price £5.50
Technical Paper 10 - Intensive study of selected centresISBN: 085473 601 8 Published: Autumn 2003 Price £11.00
Technical Paper 11 - Report on the continuing effects of pre-school education at age 7ISBN: 085473 602 6 Published: November 2004 Price £5.50
Technical Paper 12 - The final report: Effective Pre-school EducationISBN: 085473 603 4 Published: November 2004 Price £5.50
Effective Pre-school and Primary Education 3-11 Project (EPPE 3-11): The Effectiveness of Primary Schools inEngland in Key Stage 2 for 2002, 2003 and 2004. Full Report. London: Institute of Education, University of London.http://www.ioe.ac.uk/schools/ecpe/eppe/eppe3-11/eppe3-11pubs.htm
Published: 2006
Effective Pre-school and Primary Education 3-11 (EPPE 3-11): The Effectiveness of Primary Schools in England inKey Stage 2 for 2002, 2003 and 2004, Research Brief No. RBX06-06. Nottingham: DfES Publications.
Published: 2006
Effective Pre-school and Primary Education 3-11 Project (EPPE 3-11): Influences on Children’s Attainment andProgress in Key Stage 2: Cognitive Outcomes in Year 5. Full Report. London: Institute of Education, University ofLondon. http://www.ioe.ac.uk/schools/ecpe/eppe/eppe3-11/eppe3-11pubs.htm
Published: 2007
Effective Pre-school and Primary Education 3-11 Project (EPPE 3-11) Summary Report: Influences on Children’sAttainment and Progress in Key Stage 2: Cognitive Outcomes in Year 5. Research Report No. RR828. Nottingham:DfES Publications. Published: 2007
Effective Pre-school and Primary Education 3-11 Project (EPPE 3-11): Influences on Children’s Attainment andProgress in Key Stage 2: Cognitive Outcomes in Year 5. Research Brief No. RB828. Nottingham: DfES Publications.
Published: 2007Effective Pre-school and Primary Education 3-11 Project (EPPE 3-11): Influences on Children’s Development andProgress in Key Stage 2: Social/behavioural Outcomes in Year 5. Research Report No. DCSF-RR007. Nottingham:DfES Publications. Published: 2007
72
Effective Pre-school and Primary Education 3-11 Project (EPPE 3-11): Influences on Children’s Development andProgress in Key Stage 2: Social/behavioural Outcomes in Year 5. Research Brief No. DCSF-RB007. Nottingham:DfES Publications. Published: 2007
Effective Pre-school and Primary Education 3-11 Project (EPPE 3-11): Variations in Teacher and Pupil Behaviours inYear 5 Classrooms and Associations with School Characteristics. Full Report. London: Institute of Education,University of London. http://www.ioe.ac.uk/schools/ecpe/eppe/eppe3-11/eppe3-11pubs.htm Published: 2006
Effective Pre-school and Primary Education 3-11 (EPPE 3-11) Summary Report: Variations in Teacher and PupilBehaviours in Year 5 Classes. Research Report No. 817. Nottingham: DfES Publications.
Published: 2006
Effective Pre-school and Primary Education 3-11 (EPPE 3-11): Variations in Teacher and Pupil Behaviours in Year 5Classes, Research Brief No. RB817. Nottingham: DfES Publications.
Published: 2006
Related Publications
The Early Childhood Environment Rating Scale: Revised Edition (1998). Harms, Clifford and Cryer ISBN: 08077 37518 Available from Teachers College Press. Columbia University. 1234 Amsterdam Avenue. New York. NY10027
Assessing Quality in the Early Years, Early Childhood Environment Rating Scale Extension (ECERS-E): FourCurricular Subscales (2003) Sylva, Siraj-Blatchford and Taggart (2003) Trentham Books ISBN Number: 1 85856 315 1
Price £8.99
Early Years Transition and Special Educational Needs (EYTSEN) Technical Paper 1: Special Educational Needsacross the Pre-school Period. ISBN: 085473 680 8
Published Autumn 2002 Price £8.00
EYTSEN Technical Paper 2: Special Educational Needs in the Early Primary Years: Primary school entry up to the endof Year One. ISBN: 085473 681 6
Published Summer 2004 Price £8.00
EYTSEN Technical Paper 3: Special Educational Needs: The Parents’ PerspectiveISBN: 085473 682 4 Published Summer 2004 Price £8.00
Ordering information – For EPPE PublicationsThe Bookshop at the Institute of Education. 20, Bedford Way. London WC1H OAL. Tele: 00 44 (0) 207 612 6050 Fax: 0207 6126407 e-mail: [email protected], website: www.johnsmith.co.uk/ioe or The EPPE Office. The University of London, Instituteof Education. 20 Bedford Way, London. WC1H OAL. U.K. Telephone 00 44 (0) 207 612 6219 / Fax. 00 44 (0) 207 612 6230 / e-mail [email protected] Please Note: Prices will vary according to size of publication and quantities ordered. Visit the EPPEWebsite on: http://www.ioe.ac.uk/projects/eppe.
73
Glossary of terms
Age standardised scores Assessment scores that have been adjusted to take account of thechild’s age at testing. This enables a comparison to be made between the performance of anindividual pupil, and the relative achievement of a representative sample of children in the sameage group throughout the country or, in this case, the relative achievement of the EPPE sample.
Baseline measures Assessments taken by the EPPE child at entry to the study. Theseassessment scores are subsequently employed as prior attainment measures in a value addedanalysis of pupils’ cognitive progress.
Birth weight Babies born weighing 2500 grams (5lbs 8oz) or less are defined as below normalbirth weight, foetal infant classification is below 1000 grams, very low birth weight is classified as1001-1005 grams and low birth weight is classified as 1501-2500 grams (Scott and Carran,1989).
British Ability Scales (BAS) This is a battery of assessments specially developed by NFER-Nelson to assess very young children’s abilities. The assessments used at entry to the EPPEstudy and entry to reception were:Block building - Visual-perceptual matching, especially in spatial orientation (only entry to EPPEstudy)Naming Vocabulary – Expressive language and knowledge of namesPattern construction – Non-verbal reasoning and spatial visualisation (only entry to reception)Picture Similarities – Non-verbal reasoningEarly number concepts – Knowledge of, and problem solving using pre-numerical and numericalconcepts (only entry to reception)Copying – Visual–perceptual matching and fine-motor co-ordination. Used specifically forchildren without EnglishVerbal comprehension – Receptive language, understanding of oral instructions involving basiclanguage concepts.
Centre/School level variance The proportion of variance in a particular child outcome measure(i.e. Pre-reading scores at start of primary school) attributable to differences between individualcentres/schools rather than differences between individual children.
Child background factors Child background characteristics such as age, gender, ethnicity.
Confidence intervals at the 95% level A range of values which can be expected to include the‘true’ value in 95 out of 100 samples (i.e. if the calculation was repeated using 100 randomsamples).
Contextualised models Cross-sectional multilevel models exploring children’s cognitiveattainment at entry to primary school, controlling for child, parent and home learning environmentcharacteristics (but not prior attainment).
Controlling for Several variables may influence an outcome and these variables maythemselves be associated. Multilevel statistical analyses can calculate the influence of onevariable upon an outcome having allowed for the effects of other variables. When this is donethe net effect of a variable upon an outcome controlling for other variables can be established.
Correlation A correlation is a measure of statistical association that ranges form + 1 to -1.
Duration In terms of the value added models, the duration of pre-school covers the time periodbetween date of BAS assessment at entry to the EPPE study until entry to primary school. Notethat the number of months of pre-school attended before the child entered the EPPE study is notincluded in this duration measure. A separate ‘duration’ measure of amount of time in pre-school
74
prior to entering the study was tested but was not found to be significant (note that this ‘duration’measure is confounded with prior attainment). In the contextualised models, duration of pre-school refers to the time period between entry to the target pre-school until entry to primaryschool. These duration measures provide a crude indication of length of pre-school experience.
ECERS-R and ECERS-E The American Early Childhood Environment Rating Scale (ECERS-R)(Harms et al., 1998) is based on child centred pedagogy and also assesses resources for indoorand outdoor play. The English rating scale (ECERS-E) (Sylva et al., 2003) was intended as asupplement to the ECERS-R and was developed specially for the EPPE study to reflect theDesirable Learning Outcomes (which have since been replaced by the Early Learning Goals),and more importantly the Curriculum Guidance for the Foundation Stage which at the time was intrial stage.
Educational effectiveness Research design which seeks to explore the effectiveness ofeducational institutions in promoting a range of child/student outcomes (often academicmeasures) while controlling for the influence of intake differences in child/student characteristics.
Effect sizes (ES) Effect sizes (ES) provide a measure of the strength of the relationshipsbetween different predictors and the child outcomes under study. For further discussion seeAppendix 5 and Elliot & Sammons (2004).
Family factors Examples of family factors are mother’s qualifications, father’s employment andfamily SES.
General Cognitive Ability (GCA) A measure of children’s overall cognitive ability, incorporatingnon-verbal and verbal BAS sub-scales.
Hierarchical nature of the data Data that clusters into pre-defined sub-groups or levels within asystem (i.e. young children, pre-school centres, LAs).
Home learning environment factors Measures derived from reports from parents (at interview)about what children do at home, for example, playing with numbers and letters, singing songsand nursery rhymes.
Intervention study A study in which researchers ‘intervene’ in the sample to control variablesi.e. control by setting, the adult:child ratios in order to compare different specific ratios in differentsettings. EPPE is not an intervention study in that it investigates naturally occurring variation inpre-school settings.
Intra-centre/school correlation The intra-centre/school correlation measures the extent towhich the scores of children in the same centre/school resemble each other as compared withthose from children at different centres/schools. The intra-centre/school correlation provides anindication of the extent to which unexplained variance in children’s progress (i.e. that notaccounted for by prior attainment) may be attributed to differences between centres/schools.This gives an indication of possible variation in pre-school centre/school effectiveness.
Multiple Disadvantage Based on three child variables, six parent variables, and one related tothe home learning environment which were considered ‘risk’ indicators when looked at inisolation. A child’s ‘multiple disadvantage’ was calculated by summing the number of indicatorsthe child was at risk on.
Multilevel modelling A methodology that allows data to be examined simultaneously atdifferent levels within a system (i.e. young children, pre-school centres, LAs), essentially ageneralisation of multiple regression.
75
Multiple regression A method of predicting outcome scores on the basis of the statisticalrelationship between observed outcome scores and one or more predictor variables.
Net effect The unique contribution of a particular variable upon an outcome while othervariables are controlled.
Pre-reading attainment Composite formed by adding together the scores for phonologicalawareness (rhyme and alliteration) and letter recognition.
Prior attainment factors Measures which describe pupils’ achievement at the beginning of thephase or period under investigation (i.e. taken on entry to primary or secondary school or, in thiscase, on entry to the EPPE study).
Quality Measures of pre-school centre quality collected through observational assessments(ECERS-R, ECERS-E and CIS) made by trained researchers.
Sampling profile/procedures The EPPE sample was constructed by:− Five regions (six LAs) randomly selected around the country, but being representative of urban,rural, inner city areas.− Pre-schools from each of the 6 types of target provision (nursery classes, nursery schools, localauthority day nurseries, private day nurseries, play groups and integrated centres) randomlyselected across the region.
Significance level Criteria for judging whether differences in scores between groups of childrenor centres might have arisen by chance. The most common criteria is the 95% level (p<0.05)which can be expected to include the ‘true’ value in 95 out of 100 samples (i.e. the probabilitybeing one in twenty that a difference might have arisen by chance).
Social/behavioural development A child’s ability to ‘socialise’ with other adults and childrenand their general behaviour to others.
Socio Economic Status (SES) Occupational information was collected by means of a parentalinterview when children were recruited to the study. The Office of Population Census andSurveys OPCS (1995) Classification of Occupations was used to classify mothers and fatherscurrent employment into one of 8 groups: professional I, other professional non manual II, skillednon manual III, skilled manual III, semi-skilled manual IV, unskilled manual V, never worked andno response. Family SES was obtained by assigning the SES classification based on the parentwith the highest occupational status.
Standard deviation (sd) A measure of the spread around the mean in a distribution ofnumerical scores. In a normal distribution, 68% of cases fall within one standard deviation of themean and 95% of cases fall within two standard deviations.
Total BAS score By combining 4 of the BAS sub-scales (2 verbal and 2 non-verbal) a GeneralCognitive Ability score or Total BAS score at entry to the study can be computed. This is ameasure of overall cognitive ability.
Value added models Longitudinal multilevel models exploring children’s cognitive progressover the pre-school period, controlling for prior attainment and significant child, parent and homelearning environment characteristics.
Value added residuals Differences between predicted and actual results for pre-school centres(where predicted results are calculated using value added models).
Ref: DCSF-RR028
ISBN: 978 1 84775 122 5
© Institute of Education, University of London 2008
www.dcsf.gov.uk/research
Published by the Department forChildren, Schools and Families