the influence of service quality, brand image,...
TRANSCRIPT

THE INFLUENCE OF SERVICE QUALITY, BRAND IMAGE,
PERCEIVED VALUE, TOWARDS CUSTOMER
SATISFACTION THAT EFFECT BRAND LOYALTY
(Case Study Internet Users of XL)
By
Uji Abu Tholib
NIM : 1111081200005
INTERNATIONAL PROGRAM
MANAGEMENT INTERNATIONAL
FACULTY OF ECONOMIC AND BUSINESS
SYARIF HIDAYATULLAH ISLAMIC STATE UNIVERSITY
JAKARTA
1439 H / 2018 M

ii

iii

iv

v
SHEET STATEMENT
AUTHENTICITY SCIENTIFIC WORKS
Signature below
Name : Uji Abu Tholib
Student Number : 1111081200005
Department : Marketing Management
Faculty : Economics and Business
Hereby declare that in writing this thesis, I:
1. Do not use other people’s ideas without being able to develop and account.
2. Do not do plagiarism of other people’s works.
3. Do not use other people’s works without mentioning the original source of
without the owner’s permission.
4. Do not manipulate and falsify the data.
5. Do my works by myself and will be responsible for this work.
If in the future, there will be a demand from the other side of my work, and have
been accountably proved, was indeed found evidence that I have violated the
above statement, the I am ready to be sanctioned according to rules applicable in
The Faculty of Economics and Business Syarif Hidayatullah State Islamic
University Jakarta.
This statement truly made with sincerely.
Jakarta, 29 June 2018
Uji Abu Tholib

vi
Uji Abu Tholib
Perumahan Griya Persada (D’Green)
A1 No. 03 Tambun Selatan, Bekasi 17510
+60134883042
Education
2013-2015 Northern University of Malaysia, Sintok, Malaysia
Bachelor of International Business Management
Concentration: International Business
Relevant Course : International Business, International
Management, Warehouse Management, International Marketing,
International Logistic, Cargo Insurance, Brand Management,
Service Marketing.
2011-2017 Syarif Hidayatullah State Islamic University, Jakarta,
Indonesia
Bachelor of Economics in Management (International Class)
Concentration: Marketing
Relevant Courses: Marketing Management, Principles of
Management, Financial Management, Human Resource
Management.
2008-2011 Al-Muslim Senior High School, Tambun Selatan, Indonesia
2005-2008 Islamic Boarding School Al-Ittihad, Cianjur, Indonesia
1999-2005 Mangun Jaya 05 Elementary School, Tambun Selatan, Bekasi,
Indonesia
Affiliation
Vice of President Organisasi Siswa Intra Sekolah SMA Al-
Muslim (2010-2011)
Member of Himpunan Mahasiswa Indonesia UIN Syarif Hidayatullah Jakarta (2013-2014)
Member of International Student Society UUM (2013 – Present) Indonesian Students’ Association (PPI), Universiti Utara Malaysia (Member, 2013 –Present)
Conference Participation
International Entrepreneurial Network (December, 2013)
AIESEC Language Class Global Fiesta (March, 2014) Marketing Talk : Business Ethic (April, 2014) Safety Talk : Current Issue and Challenges (April, 2014)
Career Talk by Samsung Electronic Malaysia (September, 2014)

vii
Industry Talk by Shell Business Service Centre Industry Malaysia (October, 2014)
Co-Curricular Activities
Master of Ceremony in International Student Orientation Week
2014 Event Organizer in LDK PPI held by PPI UUM (2014)
Committee in International Student Orientation Week 2014 in UUM (25/8-4/9 2014)
Skills and Other Information
Languages Advance in English, Indonesian and Malay Language
Computer MS-Office literacy
Other Skill Time Management, Leadership, Teamwork, Hard Working, Adaptability,
Responsibility.
Interest Badminton, Basketball, Entrepreneurship, Sustainability
Reference
Dr. Mohd Haniff Jedin, Head of Department in International Business, Northern University of Malaysia Tel: +60 4928 8454, Email: [email protected]
Marlin Marissa Malek Abdul Malek, Ph.D, Executive Development
Program Director, Othman Yoep Abdullah. Graduate School of Business,
Universiti Utara Malaysia Tel: +6019-5911 008, Email: [email protected]

viii
ABSTRACT
The purpose of this research is to analyze the influence of service quality,
brand image, and perceived value towards customer satisfaction that effect brand
loyalty on internet user of XL.
This type of research is quantitative. The data source of this research is
the primary data by sampling internet user of xl using accidental sampling with
100 respondents. The method of this research is path analysis and sobel test to
determine the effect of interveniing variables.
The findings of this study indicate that the effect of service quality, brand
image and perceived value on customer satisfaction and brand loyalty. For the
indirect effect produced findings that affect service quality on brand loyalty
through customer satisfaction, perceived value has effect on brand loyalty
through customer satisfaction.
Key Words: Service Quality, Brand Image, Perceived Value, Customer
Satisfaction, Brand Loyalty

ix
ABSTRAK
Penelitian ini bertujuan untuk menganalisis pengaruh kualitas jasa, citra
merek, dan persepsi nilai, terhadap kepuasan pelanggan yang mempengaruhi
loyalitas merek pada pengguna internet xl.
Jenis penelitian ini adalah kuantitatif. Sumber data penelitian ini
merupakan data primer dengan mengambil sampel pelanggan internet xl dengan
menggunakan accidental sampling sebanyak 100 responden. Penelitian ini
menggunakan metode analisis jalur dan uji sobel untuk mengetahui pengaruh
variabel intervening.
Hasil temuan dari penelitian ini menunjukkan bahwa kualitas jasa, citra
merek dan persepsi nilai berpengaruh signifikan terhadap kepuasan pelanggan dan
loyalitas merek. Untuk pengaruh tidak langsung menghasilkan temuan bahwa
kualitas jasa berpengaruh terhadap loyalitas merek melalui kepuasan nasabah, dan
persepsi nilai berpengaruh terhadap loyalitas merek melalui kepuasan nasabah.
Kata Kunci: Kualitas Jasa, Citra Merek, Persepsi Nilai, Kepuasan
Pelanggan, Loyalitas Merek

x
FOREWORD
Assalamualaikum Wr. Wb
Alhamdulillah hirabilalamin, I would say thanks to ALLAH SWT for all
his gift and bless. Best regards also to prophet Muhammad SAW for being role
model to all moslem in universe. So that I can complete this thesis to attain a
Bachelor of Economy Degree in UIN Syarid Hidayatullah Jakarta.
In the process of drafting and preparation of this thesis author realized that
thesis is far from perfect, because the perfection is only belong to ALLAH SWT,
but with effort, hard work, prayers, and never ending support given by families,
friends, girlfriends and faculty supervisor. I say thanks to the people who have
helped me in the preparation of thesis :
1. Thank you so much to my mother Sri Sundari and my father Darmuji and
my brother and sister M. Arif Ramdan Rifai, M. Adi Purnomo and Putri
Aliyya Nurhasanah that always give me support and prayers that never
stop during this time. Thanks for reminder me, helping me, caring me, and
teaching me patiently. Without prayers and support from all of you, I was
nothing in this world. Thanks for everything. I always love you all.
2. Mr. Dr. M. Arief Mufraini, Lc., MSi as Dean of the Faculty of Economics
and Business of UIN Syarif Hidayatullah Jakarta.
3. Mrs. Dr. Muniaty Aisyah, MM and Leis Suzanawaty, M.Si as my
supervisor, thank you so much for your recommendation, advice, time, and
knowledge during guide me to finish my thesis.
4. Mrs. Titi Dewi Warnida, SE., M.Si as Head program of the Faculty of
Economics and Business of UIN Syarif Hidayatullah Jakarta.
5. Mrs. Ela Patriana, MM as Secretary program of the Faculty of Economics
and Business of UIN Syarif Hidayatullah Jakarta.

xi
6. All the Lecturers and Employees of Faculty Economics and Business UIN
Syarif Hidayatullah Jakarta to teach me all of subjet about economy and
business
7. My beloved friend Muhammad Hassan, thank you so much for your big
supporting me, time, and always beside me in every moment I did my
thesis, and helping me to finish this thesis.
8. Thanks to Muhamad Iqbal Almaududi and Fahrur Rozi to give a lot of
contribution and guiding me to do this thesis. Do not ever stop to be a kind
person, your help is greatly appreciated.
9. All of my friends in International Program from batch 2011 until batch
2013. I will missed every moment we spent together and I will always
missed you guys. Keep fighting and believe that we can achieve our
dreams.
10. A lot of thanks to srs for your reminder me, support me, and thanks to
willing hear all those stories.
11. Thanks to my room mates Fajar Sugiarto, Priyo Wicaksono, Radit Dwi
Hadian, Faiz Narendra Putra for your inspiration, time, and helping me
during finish my thesis
12. Syaw Family thanks for every moment you given to me guys, I will never
forget every joke we have. Success for all of you.
13. The last but not least, my beloved wife Riva Nurazidah thank you for
everything. I really meant it from the deepest of my heart.
Finally, the author expect for any critics and suggestion that could improve
the content of this thesis, the author hopes to that the thought provoking
contributions can give benefit to the reader, hopefully this thesis could be
worthwhile for all of us. Amin
Jakarta, 29 June 2018
Uji Abu Tholib

xii
LIST OF CONTENT
ACCEPTANCE LETTER ....................................................................................... i
CERTIFICATION OF COMPREHENSIVE EXAM SHEET ............................... ii
CERTFICATION OF THESIS EXAM SHEET ................................................... iii
STATEMENT OF AUTHENTICITY SCIENTIFIC WORK .............................. iv
CURICULUM VITAE ............................................................................................ v
ABSTRACT ............................................................................................................ vi
ABSTRAK ........................................................................................................... vii
FOREWORD ...................................................................................................... viii
CONTENT ............................................................................................................ xi
LIST OF TABLE .................................................................................................. xv
LIST OF FIGURE ............................................................................................. xviii
LIST OF PICTURE ............................................................................................ xix
LIST OF ATTACHMENT .................................................................................... xx
CHAPTER I INTRODUCTION ............................................................................. 1
A. Research Backgroud ........................................................................................ 1
B. Problem Formulation ....................................................................................... 5
C. Purpose and Benefit of Research ..................................................................... 5
1. Purpose of Research ................................................................................... 5
2. Benefit of Research .................................................................................... 6
CHAPTER II LITERATURE REVIEW ................................................................. 8

xiii
A. Service Quality ................................................................................................. 8
1. Definition of Research .............................................................................. 8
2. Dimention of Service Quality ................................................................... 9
B. Brand Image ................................................................................................... 11
1. Definition of Brand Image ....................................................................... 11
2. Measurement of Brand Image .................................................................. 12
C. Perceived Value ............................................................................................. 13
1. Definition of Perceived Value ................................................................ 13
2. Meaasurement of Perceived Value ......................................................... 14
D. Customer Satisfaction .................................................................................... 15
1. Definition of Customer Satisfaction ........................................................ 15
2. Measurement of Customer Satisfaction ................................................... 20
E. Brand Loyalty ................................................................................................ 20
1. Definition of Brand Loyalty .................................................................... 20
2. Dimention of Brand Loyalty ................................................................... 22
F. Previous Research .......................................................................................... 23
G. Theoretical Framework .................................................................................. 26
H. Hypothesis ...................................................................................................... 26
CHAPTER III RESEARCH METHODOLOGY .................................................. 30
A. Scope of Research .......................................................................................... 30
B. Determine of Sample Method ........................................................................ 30
1. Population ............................................................................................... 30

xiv
2. Sample ..................................................................................................... 31
C. Data Collection Method ................................................................................. 32
1. Primary Data ............................................................................................ 32
2. Secondary Data ........................................................................................ 33
D. Data Analysis Method .................................................................................... 33
1. Validity Test ............................................................................................ 33
2. Realibility Test ........................................................................................ 33
3. Normality Test ........................................................................................ 34
4. Path Analysis .......................................................................................... 34
5. Sobel Test ................................................................................................ 38
E. Operational Variabel ...................................................................................... 39
CHAPTER IV RESULT AND ANALYSIS ......................................................... 42
A. General Overview of Research Object ........................................................... 42
1. History of XL Axiata Company .............................................................. 42
2. Vision and Corporate Culture of XL Axiata Company .......................... 43
B. Data Quality Test ........................................................................................... 44
1. Validity Test ............................................................................................ 44
a. Service Quality .............................................................................. 45
b. Brand Image .................................................................................. 46
c. Perceived Value ............................................................................. 46
d. Customer Satisfaction .................................................................... 47
e. Brand Loyalty ................................................................................ 47

xv
2. Realibility Test ........................................................................................ 47
3. Normality Test ........................................................................................ 48
a. Sub Structure I Normality Test ...................................................... 49
b. Sub Structure II Normality Test .................................................... 49
C. Profile Respondent ......................................................................................... 50
D. Analysis Result .............................................................................................. 50
1. Questionaire Analysis ............................................................................. 50
E. Path Analysis ................................................................................................. 72
1. Test Influence between Sub Variable ..................................................... 72
2. Equation of Path Analysis Sub Structure I ............................................. 74
3. Equatin of Path Analysis Sub Structure II .............................................. 75
4. Coeficient of Determination (R2) ............................................................ 77
5. Simultaneously Test ................................................................................ 81
a. Simulataneously Test of Sub Structure I ....................................... 81
b. Simultaneously Test of Sub Structure II ....................................... 82
6. Partial Test .............................................................................................. 82
a. Partial Test of Sub Structure I ....................................................... 82
b. Partial Test of Sub Structure II ...................................................... 86
7. Influence Calculation .............................................................................. 89
8. Sobel Test ................................................................................................ 90
CHAPTER V CONCLUSION AND SUGGESTION .......................................... 93
A. Conclusion ..................................................................................................... 93

xvi
B. Suggestion ...................................................................................................... 94
REFERENCES ...................................................................................................... 97
ATTACHMENTS ............................................................................................... 100
xvii
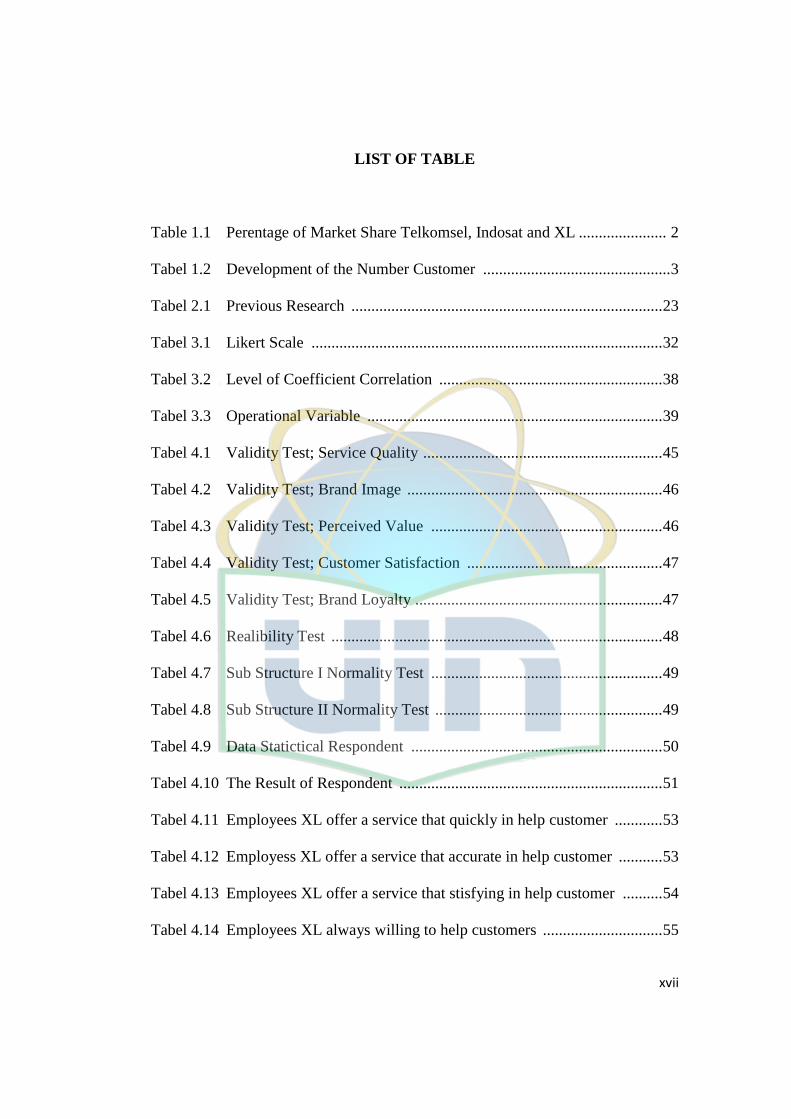
LIST OF TABLE
Table 1.1 Perentage of Market Share Telkomsel, Indosat and XL ...................... 2
Tabel 1.2 Development of the Number Customer ............................................... 3
Tabel 2.1 Previous Research .............................................................................. 23
Tabel 3.1 Likert Scale ........................................................................................ 32
Tabel 3.2 Level of Coefficient Correlation ........................................................ 38
Tabel 3.3 Operational Variable .......................................................................... 39
Tabel 4.1 Validity Test; Service Quality ............................................................ 45
Tabel 4.2 Validity Test; Brand Image ................................................................ 46
Tabel 4.3 Validity Test; Perceived Value .......................................................... 46
Tabel 4.4 Validity Test; Customer Satisfaction ................................................. 47
Tabel 4.5 Validity Test; Brand Loyalty .............................................................. 47
Tabel 4.6 Realibility Test ................................................................................... 48
Tabel 4.7 Sub Structure I Normality Test .......................................................... 49
Tabel 4.8 Sub Structure II Normality Test ......................................................... 49
Tabel 4.9 Data Statictical Respondent ............................................................... 50
Tabel 4.10 The Result of Respondent .................................................................. 51
Tabel 4.11 Employees XL offer a service that quickly in help customer ............ 53
Tabel 4.12 Employess XL offer a service that accurate in help customer ........... 53
Tabel 4.13 Employees XL offer a service that stisfying in help customer .......... 54
Tabel 4.14 Employees XL always willing to help customers .............................. 55
xviii
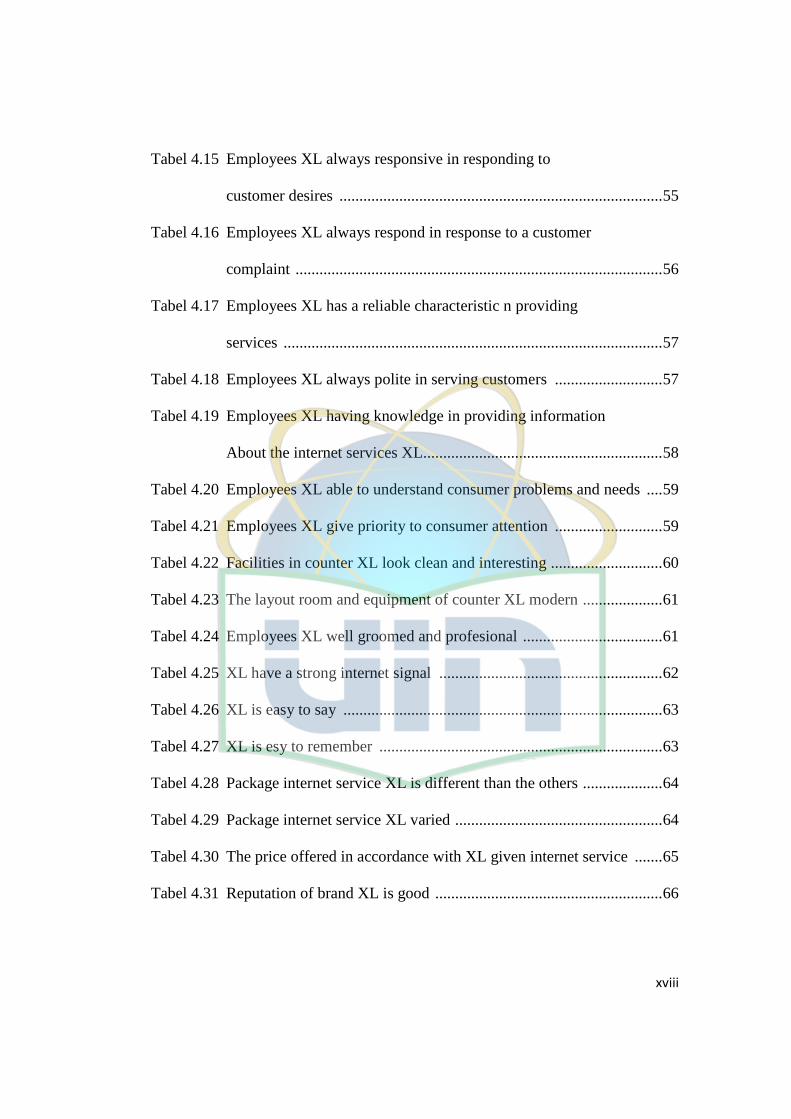
Tabel 4.15 Employees XL always responsive in responding to
customer desires ................................................................................. 55
Tabel 4.16 Employees XL always respond in response to a customer
complaint ............................................................................................ 56
Tabel 4.17 Employees XL has a reliable characteristic n providing
services ............................................................................................... 57
Tabel 4.18 Employees XL always polite in serving customers ........................... 57
Tabel 4.19 Employees XL having knowledge in providing information
About the internet services XL............................................................ 58
Tabel 4.20 Employees XL able to understand consumer problems and needs .... 59
Tabel 4.21 Employees XL give priority to consumer attention ........................... 59
Tabel 4.22 Facilities in counter XL look clean and interesting ............................ 60
Tabel 4.23 The layout room and equipment of counter XL modern .................... 61
Tabel 4.24 Employees XL well groomed and profesional ................................... 61
Tabel 4.25 XL have a strong internet signal ........................................................ 62
Tabel 4.26 XL is easy to say ................................................................................ 63
Tabel 4.27 XL is esy to remember ....................................................................... 63
Tabel 4.28 Package internet service XL is different than the others .................... 64
Tabel 4.29 Package internet service XL varied .................................................... 64
Tabel 4.30 The price offered in accordance with XL given internet service ....... 65
Tabel 4.31 Reputation of brand XL is good ......................................................... 66

xix
Tabel 4.32 The product price of internet XL in accordance with the advantage of
what i was hoping for at the time of use it ......................................... 66
Tabel 4.33 The product XL comparable to service rendered ............................... 67
Tabel 4.34 I feel satisfied with the internet service Xl which i used ................... 68
Tabel 4.35 Internet service XL fulfilled my expectation ..................................... 68
Tabel 4.36 I feel satisfied during the use internet service XL .............................. 69
Tabel 4.37 I will continue to buy the XL product ................................................ 70
Tabel 4.38 I am satisfied with the internet XL product ........................................ 70
Tabel 4.39 I am believe against the internet service XL product ......................... 71
Tabel 4.40 I would like to recommend to my friend for using the internet service
XL product ......................................................................................... 72
Tabel 4.41 Coeficient Correlation ........................................................................ 73
Tabel 4.42 Testing of relationship between sub variable ..................................... 74
Tabel 4.43 Coeficient of path analysis structure I ................................................ 75
Tabel 4.44 Coeficient of path analysis structure II .............................................. 76
Tabel 4.45 Model Summary Coeficient Determination Structure I ...................... 78
Tabel 4.46 Model Summary Coeficient Determination structure II .................... 79
Tabel 4.47 Analysis of variant sub structure I ...................................................... 81
Tabel 4.48 Analysis of variant sub structure II .................................................... 82
Tabel 4.49 Result of partial test sub structure I .................................................... 82
Tabel 4.50 The influence of service quality, brand image
And perceived value to customer satisfaction .................................... 84

xx
Tabel 4.51 Result partial test sub structure II ....................................................... 86
Tabel 4.52 Partial Test the influence of service quality, perceived value and
customer satisfaction to brand loyalty ................................................ 87

xxi
LIST OF FIGURE
Figure 2.1 Theoretical Framework ...................................................................... 26
Figure 3.1 Path Analysis ...................................................................................... 36

xxii
LIST OF PICTURE
Picture 4.1 Sub structure I illustration ............................................................. 77
Picture 4.2 Sub structure II illustration ............................................................ 79
Picture 4.3 Result of illustration sub structure I .............................................. 85
Picture 4.4 Result of illustration sub structure II ............................................. 88
Picture 4.5 Result of Path Analysis Diagram .................................................. 89

xxiii
LIST OF ATTACHEMENT
Attachment I Questionaire of Research ............................................................ 100
Attachment II Distribution Answer of Respondent ............................................ 104
Attachment III Result of Data Quality ................................................................ 116
Attachment IV Descriptive Statistic ................................................................... 124
Attachment V Result Correlation of All Variable .............................................. 132
Attachment VI Result of Path Analysis .............................................................. 133

xxiv
CHAPTER I
INTRODUCTION
A. Research Background
In the field of industrial technology in Indonesia experienced significant
development, with respect to ease of Indonesian society to have cellular
phone. The situation had an impact on the emergence of company service
providers in Indonesia, especially since the establishment of the regulatory
Act No. 36 of 1999 which contains of the prohibition of undertake work can
result in practice monopoly in telecommunication business competition,
Therefore, Telkom and Indosat company as the state owned company and the
subsidiary company of Telkom in 1980 and in 1996 Excelcomindo (XL)
became the first private company as cellular operator in Indonesia. After that,
several other private company began springing up, and competition is
becoming increasingly tight in order to get as many customers.
(www.dct.co.id)
The big three of operator, such as Telkomsel, Indosat and XL Axiata,
controlled no less than 75% of market share. Telkomsel is now hook the 125
million, 55 million of Indosat and XL is 50 million customers. At the time
2014, total income of Telkomsel, Indosat and XL reached 113.88 trillion.
Therefore, the company's mobile operators who are able to dominate the
market share in Indonesia is the third operator mentioned above and with

xxv
82.9% market share in a market that is growing fast and dynamic as well as
the market share of different status of different investments. The third major
market share of each mobile operator services providers can be seen in the
table below:
Table 1.1 Percentage of Market Share of Telkomsel, Indosat and Xl
Operator Seluler 2012 2013 2014 2015
PT. Telkomsel 45.5% 40% 30.2% 45%
PT. Indosat 21.7% 18% 16.9% 18%
PT. XL – Axiata 18.9% 19.2% 19.1% 19%
Source : Data Annual Report On Desember 31, 2015 PT. XL Axiata.
Based on the table above, it can be seen through the end of 2015 the
market share of each of these are telkomsel 45%, indosat 18% and XL -
Axiata 19%. Thus the three operators control the mobile cellular market share
in Indonesia, while four other operators only have a market share of
approximately 18%, for the three major players in 2012 untill 2014 a third
cellular operator experienced up and down. However, in 2015 Xl provider
experienced the decrease when compared to other operators, but cellular
operator Telkomsel has retained the largest market share compared to indosat
and XL Axiata.

xxvi
Based on the data that has been presented before cellular operator XL
experienced stability in market share when compared to other competitors,
however, there are other sources of data shown in the table below:
Table 1.2 Development of the Number Customers Telkomsel, Indosat dan Xl
Year
SIM CARD
Telkomsel Indosat XL
Total Of Customer
2012 212,000,000 52,000,000 45,800,000
2013 131,513,000 59,600,000 60,172,000
2014 132,700,000 59,700,000 68,500,000
2015 140,000,000 66,500,000 42,100,000
Source : http://databoks.katadata.co.id
It can be seen from the table above, the number of customers of XL has
increased over the past two years in a row, however decrease on 2015. It can
occur due to various factors, including the price offered by operators, the
quality of the signal, as well as the image of the operator itself and brand
loyalty. So, that mobile operators compete in performing a series of
promotions that occured operator customer migration.
Those phenomenon were supported by theory from (Boulding in Hasan:
2008:83), brand loyalty in consumers caused by the presence of satisfaction
and dissatisfaction against the accumulated brand is continuously despite the
existence of perception about the product quality. Therefore, many factors
can influence brand loyalty, such as; customer satisfaction, service quality
and brand image, and switching barriers (Mardalis, 2005).

xxvii
One important factor that can make customer satisfied is service
quality, marketers can increase of service quality for develop brand loyalty.
Products having the quality of low will bear the risk a customer did not
faithful. Therefore, XL company want to give service quality good from the
point of view customer and needed a system that able to link the data from
many sources, include location, information signal, and device rates
(Gregory, 2012). According to Akbar et al (2010), service quality have a
positive impact to brand loyalty and customer satisfaction which is mediating
variable the relationship between service quality and brand loyalty.
According to Shimp et al in Sangadji and Sopiah (2013:327) brand
image can regarded as a kind of associations that arise in the minds of
customer when considering a particular brand. The association siply can
appear in the form of thought or particular image that is associated with a
brand, as well as when we think about other people.
Brand Image is a set of unique association to be created of maintained
by marketers. The associations actually state what brand and promised to
consumers (Sangadji and Sopiah, 2013:327).
Satisfaction can provide some of the benefits include the relationship
between companies and customers become harmonious, became the basis for
purchase and creating customer loyalty and word of mouth recommendations
that benefit the company (Tjiptono, 2011:473).

xxviii
From the background of the above problems then important studies, in
order to gain the confidence that brand loyalty is a factor that supports the
success of a brand. According to Aaker (2004), brand loyality as one
dimension of brand equity. Therefore then the author interested in discussing
research on “The Influence Service Quality, Brand Image, and Perceived
Value towards Customer Satisfaction that effect to Brand Loyalty” (Case
Study of Internet XL user).
B. Problem Formulation
Based on the background described above, so the formulation of the
problem that will be explained in this research are:
1. Does service quality have direct relationship to customer satisfaction?
2. Does brand image have direct relationship to customer satisfaction?
3. Does perceived value have direct relationship to customer satisfaction?
4. Does service quality, brand image and perceived value have effect
customer satisfaction simultaneously?
5. Does service quality have direct relationship to brand loyalty?
6. Does perceived value have direct relationship to brand loyalty?
7. Does customer satisfaction have direct relationship to brand loyalty?
8. Does service quality, perceived value and customer satisfaction
influence brand loyalty simultaneously?
C. Purpose and Benefit of Research
1. Purpose

xxix
To be more specific, the study was undertaken in order to:
a. To analyze the direct relationship of service quality on customer
satisfaction.
b. To analyze the direct relationship of brand image on customer
satisfaction.
c. To analyze the direct relationship of brand image on customer
satisfaction.
d. To analyze the direct relationship of service quality, brand image, and
perceived value on customer satisfaction simultaneously.
e. To analyze the direct relationship of service quality on brand loyalty.
f. To analyze the direct relationship of perceived value to brand loyalty.
g. To analyze the direct relationship of customer satisfaction on brand
loyalty.
h. To analyze the direct relationship of service quality, perceived value
and customer satisfaction on brand loyalty simultaneously.
2. Benefit
This research will provide the following benefits:
a. For The Company
As the consideration for business in making decision about the
influence of service quality, perceived value, brand image and
customer satisfaction towards brand loyalty.
b. For The Research

xxx
It gives the reseacher the opportunity to gain inside knowledge in the
influence of service quality, perceived value, brand image and
customer satisfaction towards brand loyalty.
c. For Further Research
As additional reference materials in reviewing issues related to service
quality, perceived value, brand image, customer satisfaction and brand
loyalty.

xxxi
CHAPTER II
LITERATURE REVIEW
A. Service Quality
1. Definition of Service Quality
Service quality is one of important factors in order to achieve
competitive advantage. Service has variety meaning and traditionally
difficult to describe. Even more difficult were the fact how to create and
send the service to customer often hard to understand. Some expert also
define in different ways, here are the definition of Lovelock and Wright
(2005:5):
a. Service is an act or performance that had offered by one party to the
other party. Although the process might be related to the physical
product, the performance is essentially intangible and usually the result
does not have ownership to factor of production.
b. Services are economic activities that create and deliver benefits to
customers at a particular time and place, as the result of actions that
bring about desire changes in themselves or to its service recipient.
According Lovelock and Wirtz (2005:9) services are economic
activities that have offered by one party to another party, most commonly
employing time-defined performances to bring about desired result in
recipients themselves or in object or other assets for which purchasers
have responsibility.

xxxii
According to Kotler et al (2009:139) quality is the totality of features
and characteristics of a product or services that bear on its ability to satisfy
stated or implied needs.
Service is the most important element to know customer satisfaction
in consuming the product or service. Customers will compare what they
were expecting for accepted with what their truly received during the post-
purchase step of the process buying service. They had decided whether
satisfied or dissatisfied with delivering the service and results, they also
make judgment about the quality service.
If the service that received and perceived suitable with expectation, so
the service quality has a good perception and satisfied. If the services
received beyond the consumer expectations, so the service quality has a
very good perception and good quality. Whereas, if the services received is
lower than expected, then service quality has a bad perception.
From the definition above service quality that have been explained by
expert, the author can make conclusion that service quality is any kind of
activity that performed by company in order to fulfill consumer
expectations. In this case, service defined as a service that deliver by
owner such as easier, speed, relationship and politeness which shown
through attitude and character in delivering service for customer
satisfaction.
2. Dimension of Service Quality
xxxiii
The service quality may be interpreted as an attempt at fulfillment of
consumer needs and desires as well as the precision of delivery in offset
expectations of consumers (Tjiptono, 2007). Service quality can be found
by comparing the perceptions of consumers against the service received
with service expected based on service attributes a service provider
organization. If the service is received beyond the expectations of the
consumer, then the service quality was considered very good. Through the
concept of measuring service quality like this, According to Parasuraman
1988 in Tjiptono (2011:198) identify the 5 dimensions of service quality,
namely;
a. Realibility
This dimension relates to the company’s ability to provide promised
services immediately, accurate and satisfy.
b. Responsiveness
This dimension pertains to the willingness and ability of employees to
help customers and respond to their request, and inform you of when
services will be provided and ability of employees to respond the
customer complaint.
c. Assurance
This dimension relates to the behaviour of the service provider able to
cultivate consumer trust against the company and service provider
(employees) always be polite and have enough knowledge to handle

xxxiv
any questions or concerns customers.
d. Emphaty
This dimension means the company or the service provider understand
the problems of customers, acting on behalf of the customer, as well as
providing personal attention to customers.
e. Tangible
This dimension relates to appeal of physical facilities, equipment, and
material that are used the company as well as the appearance of the
service provider.
B. Brand Image
1. Definition of Brand Image
Brand image is the consumer perception about a brand, which is
reflected by the brand associations that are in the minds of consumers. In
other words, the brand association is another information node connected
to the brand node in memory and contains a brand means to consumers.
Associations come in all shapes and may reflect the characteristics of the
product or aspects independent of the product. (Keller, 2013: 76).
Brand was an important attributes from some product. Moreover,
brand was an identity to differentiate company’s product with another
product. In this case, definition of brand image has different explanation
from several expert, but all of them have a similar understanding between
each other. Here are some definition of brand image that author quotes

xxxv
from several expert:
Brand Image is a set of brand associations are formed and embedded
in the minds of consumers. Consumers are accustomed to using certain
brands tend to have the consistency of the brand image. Brand image are
perceptions and beliefs made by consumers, as reflected associate in
consumer memory (Kotler, 2009: 346).
According to Keller (2008:2) brand is a name, term, sign, symbol, or
design, or a combination of them, intended to identify the goods and
services of one seller or group of sellers and to differentiate them from
those competition.
From the definition above brand image that have been explained by
expert, the author can make conclusion that brand image is the identity of
company in order to make the customer know the differentiation between
another company.
2. Measurement of Brand Image
According to Keller (2013:77) defined the measurement of brand
image can conducted based on the aspects of a brand, namely:
a. Strength
The more deeply a person thinks about product information and relates
it to existing brand knowledge, the stronger result brand associations
will be. The strength in this case are the advantages owned by a
physical brand which not found from another brand. The advantages of

xxxvi
this brand refers to the physical attributes, so commonly as the
advantages compared to the other brand. What is included in group
strength namely; physical product, quality product, function of product
facilities, price product, and the appearance of supporting facilities to
its products.
b. Favorability
Favorable refers to the ability of the brand to be easily remember by
consumers. What is included in this category namely; brand easy to
say, the ability of brand to be remembered by consumers, or the
suitability between the impression of brand in mind of consumer with
brand image company above its brand.
c. Uniqueness
Uniqueness is the ability to differentiate a brand among other brands.
This impression arises from the unique attributes product, be a unique
impression means there is differentiation between one product to other
products. What is included in uniqueness group namely; the variation
service that usually given a product, the variation of product, and
physical appearance of product.
C. Perceived Value
1. Definition of Perceived Value
According to Kotler (2008:60) perceived value is the difference
between perspective customer evaluation of all benefit and all the cost of

xxxvii
an offering and the perceived alternatives.
According to Zeithaml (1988:14) perceived value is the consumer
overall assesment of the utility of a product based on perception of what is
received and what is given.
Perceived value is the overall assessment of the customers against the
usefulness of a product received and given by the product. Based on some
sense above, then it can be concluded that the perceived value of
customers is a customer assessment done by comparing between the
benefits to be received by the sacrifice issued to obtain a product and
services. Whereas, perceived value also mean business customers to
compare a product or service from a particular company with competitors
in terms of benefits, quality and price.
2. Measurement of Perceived Value
Customers may feel the value offered is different based on personal
values, needs, preferences and financial resources. In addition, the
perception of value can also differ according to the situation of its use. In
Ariningsih (2010:8) research carried out two marketing experts from the
University of Western Australiam Sweeney and Soutar (2001) trying to
develop 19 items the size of customer perceived value. Scale called
PERVAL (perceived value) are meant to assess the perceptions of
customers against the value of a product customers long lasting brand on
the level. The scale was developed based on the context of the retail
purchase situations to determine the values of consumption that leads to
the attitude and behavior of purchase.

xxxviii
According to Parasuraman and Grewal (2000) dimensions of
perception value consists of 3 main aspects, as follows;
a. Fair price : Price conformity and quality.
b. Brand Reputation : Brand reputation that has been in mind
customer.
c. Value for money : Advantages and Value of money paid.
Some definitions about the perceived value of the above can be
inferred by the experts that perceived value is a value comparison between
sacrifice that has been done the customer in this case is the cost in the form
of price with the benefit or utility in accordance with each customer's
expectations.
D. Customer Satisfaction
1. Definition of Customer Satisfaction
Customer satisfaction has become a central concept in business and
management discourse. The customer is the main focus in the discussion
of the satisfaction and quality of service. Therefore, the customer holds an
important role in measuring satisfaction with respect to products or
services that the company provides.
According to Tjiptono (2012:31) customer satisfaction is a situation
that to be demonstrated by the consumer when they realized that the needs
and desires as expected as well as for better fulfilled.
Customers have experience different levels of satisfaction or
dissatisfaction after they consume product or service which was suitable
xxxix
with their expectation. Because satisfaction is the emotional condition,
reaction after bought something could be anger, dissatisfaction,
aggravation, neutrality, excitement, or enjoyment. (Lovelock and Wirght,
2005:102).
In order to get customer satisfaction, companies can give an excellent
service quality. Because that things can fulfill the consumer needs and
expectations. Satisfaction is the fulfill response of customer about the
service and product. It is also a finding about the product and service
feature or the product and services itself; satisfaction is conceptualized as
an overall, customer attitude towards a service provider. Thakur and Singh
(2012)
From the definition above customer satisfaction that have been
explained by expert, the author can make conclusion that customer
satisfaction is the expectation based on what customer perceives.
2. Measurement of Customer Satisfaction
According to Estiri et al (2011) customer satisfaction is the feeling or
attitude you have when your needs as a customer are fulfilled and meeting
the customer’s expectations for key service quality attributes lead to
overall satisfaction with service. A satisfied customer will repeat the
purchase of the product and, will tell other potential customers positive
things about the service (Patterson and Spreng, 1997; Metawa and
Almossawi, 1998).

xl
According to Irawan (2008:37-50) defined the measurement of
customer satisfaction divided into 5 factors, such as;
a. Product Quality; customers satisfied after buy and use products in
fact the good quality of their products. Product quality is the driver
customer satisfaction multi dimensional. According to Lupiyoadi
(2014:175) product quality is the extent to which a product meet the
specification. Value can be measured by customer based on reliability,
durability, and performance to physical form and product image.
b. Price; for sensitive customers, usually cheap price is an important
source of satisfaction because customer will get a high value for
money. Price is the amount of money (plus some of product)
needed to obtain a number of a combination of products and
services.
c. Service quality; satisfaction with the quality of services usually
hard in imitated. Service quality is driver with many dimensions,
the concept of service quality that popular is servqual dimensions
to be equipped with 5 dimension namely; tangible, realibility,
responsiveness, assurance and empathy. Customer would be
satisfied if the service given in accordance with expected.
d. Emotional Factor; customer will feel satisfied because of the
emotional value provided by the brand of product.
e. Fee and Easiness; customer will be more satisfied when

xli
relatively easy, comfort and efisien in the product or services.
3. Method of measuring Customer Satisfaction
According to Kotler and Amstrong (2014:148) discuss several
methods to measure customer satisfaction, which are:
a. Complaint and Suggestion system
Each customer oriented service organization should provide the
widest opportunity to its customers to submit suggestion, criticism,
opinions, and their complaints. Information obtained through this
method can provide new ideas and input are valuable to the
company making it possible to react quickly and respond in
overcome the problems that arise.
b. Customer satisfaction survey
Like in this research, company can do a survey to measure
customer satisfaction using such as questioner or by phone calls to
a random sample of their customers. Through the survey,
companies will get responses and feedback directly from customers
and give a positive sign that companies pay attention to them.
Customer satisfaction survey is divided into four categories, which
are:
1) Directly report satisfaction
The respondents are being asked directly with question in
order to know if they are very satisfied, satisfied, neutral,

xlii
dissatisfied, or very dissatisfied. This survey is to used to
collect the customer opinion and needs which can give the
result called the customer satisfaction index. This customer
satisfaction index the standard of company needs to maintain.
2) Derived dissatisfaction
The question that being asked included two aspect, how high is
the customer expectation in the certain attribute, and how high
is the performance that customer’s feel of this attribute.
3) Problem analysis
The respondents are being asked to describe two things; the
problem which related with the company offer and suggestion
for improvement.
4) Importance performance analysis
The respondents are asked to rate the services according to the
customer importance and company performance in each
attributes.
c. Ghost shopping
This method use a person to pose as potential buyer to report their
findings on strong and weakness points when experience buying
the company’s and competitor’s product. Ghost shoppers also can
observe how the company and its competitors in serving customer
demands, answering customer question, and solve any problems or

xliii
customer complaints.
d. Lost customer analysis
The company contact customers who have stopped buying or
switched to another supplier to learn why this condition happened
and in order to understand and take the police to further improve or
refine.
e. Some caution in measuring customer satisfaction
The company must make a well-structured questionnaire; otherwise
the customer would face a huge questionnaire. The company must
also be able to recognize that two customers can report being
highly satisfied for two reasons. One person maybe easily satisfied
most of the time, and the other one might be hard to please but was
pleased on this occasion.
Meanwhile, according to Tjiptono (2014: 368), there are several core
concepts concerning the object measurement of customer satisfaction, such
as;
1. Overall Customer Satisfaction
There are two step in the process of measure; First, measuring of
the level of customer satisfaction product and service. Second,
evaluate and compare with the overall customer satisfaction of
product and service.
2. Conformance of Expectation

xliv
In this concepts, satisfy can be conclude by suitability or
unsuitability between customer expectation with actual
performance of product.
3. Experience satisfaction
A feeling of satisfaction experienced by customers after getting
services from an employee or product.
4. Repurchase Intent
Measure of customer satisfaction by asks whether customers are
going shopping or using company service.
E. Brand Loyalty
1. Definition of Brand Loyalty
A situation in which consumer purchase and uses the brands of their
trust as compare to brand that they do not trust. In this way consumer
shows a commitment to that brand. Brand loyalty can be measured through
positive word of mouth, satisfaction of customer, brand trust, sensitivity of
price. A degree in which consumer consistently purchase the brand
available in the product category. The loyalty to the specific brand of
consumer will remain unchanged if the brand is as long available (Rizwan,
2013).
According to Oliver (1999) the most comprehensive approach
presents brand loyalty as ‘a deeply held commitment to rebuy a preferred
product or service consistently in the future, thereby causing repetitive

xlv
same brand or same brand set purchasing, despite situational influences
and marketing efforts having the potential to cause switching behavior’.
According to Schiffman and Kanuk (2009), brand loyalty is the
consumer preferences consistently to make a purchase on the same brand
on a specific product or a specific service category. Brand loyalty is a
strong commitment to subscribe or purchase a consistent brand in the
future.
According to Aaker (2009), brand loyalty is a measure of the customer
relationship to a brand. This size is able to give an idea of the possibilities
for a customer to switch to another product especially in a brand that he
found the change, either in relation to the price or other attributes.
2. Measuring of Brand Loyalty
According to Rai et al. (2012) brand loyalty development had been
categorized into four sequential phases by Oliver (1999);
a. Cognitive loyalty
A direct way to determine the loyalty especially for habitual behavior
is to take into account the actual purchasing patterns.
b. Affective loyalty
Measurements against the satisfaction or dissatisfaction of customers a
brand is the most important indicator in brand loyalty. If the
dissatisfaction of customers to a brand, then it is generally not

xlvi
sufficient reason for customers to switch to other brands except when
there is a fairly strong attractor factor.
c. Conative loyalty
The Favorites against the brand, trust, a sense of respect or friendship
with a brand evoking the warmth and closeness in the feelings of
customers. It will be difficult for other brands to attract customers who
are in this stage. The size of these favors are a willingness to pay the
price of the more expensive to get products.
d. Action loyalty
According to Oliver (1999) in Lovelock and Wirtz (2004:352) states
that action or behavioral loyalty is the stage where behavioral
intentions get converted into actions. Behavioral loyalty has been
considered as repeat purchases frequency or proportion of purchase
and likelihood to recommend.
F. Previous Research
This previous research on this topic has been contacted by:
Table 2.1
Previous Research
No Researcher Tittle of
Research
Research Methods Research Result
Variable Method
1. Pratiwi (2015) The influence
of brand
image, brand
trust, and
customer
satisfaction
on brand
Brand
Image (X1),
Brand Trust
(X2), and
Customer
satisfaction
(X3).
Multiple
Regression
Analysis
The result of this
study showed that
brand image, brand
trust and customer
satisfaction have
significant influence
on brand loyalty

xlvii
No Researcher Tittle of
Research
Research Methods Research Result
Variable Method
loyalty (case
of samsung
smartphone).
Brand
loyalty (Y)
simultaneously.
While partially,
only customer
satisfaction has
significant influence
on brand loyalty,
whereas brand
image and brand
trust does not have
any significant
influence on brand
loyalty.
2. Keny (2015)
The
relationship
between
brand equity,
customer
satisfaction,
and brand
loyalty on
coffee shop:
study of
excelso and
starbuck
Variable
brand
equity,
Variable
customer
satisfaction
and
Variable
brand
loyalty
Structural
Equation
Modelling
(SEM)
The result of this
study showed that
the physical quality,
the ideal self-
congruence and the
lifestyle congruence
have a positive and
significant impact
on the customer
satisfaction on
excelso and
starbuck. Staff
behaviour only has
a positive and
significant impact
on the customer
satisfaction in the
excelso; whereas,
brand identification
only has a positive
and significant
impact on the
customer
satisfaction in the
starbuck. However,
in both of coffee
shop brand, the
consumer
satisfaction has a
positive and

xlviii
No Researcher Tittle of
Research
Research Methods Research Result
Variable Method
significant impact
on the brand
loyalty.
3. Nugroho
(2014)
The influence
Service
quality
towards
Customer
Satisfaction
and Customer
Loyalty(Study
of customer
Speedy
Telkom at
Kota
Surabaya)
Variable
service
quality,
Variable
Customer
Satisfaction,
and
Variable
customer
loyalty
Regression
Analysis
1. Service quality
influence of
customer
satisfaction
significantly.
2. Service quality
influence of
customer loyalty
significantly.
4. Damayanti
(2009)
The influence
of Customer
Satisfaction
towards
Brand
Loyalty of
Suzuki
Motorcycle at
CV Turangga
Mas Motor
Variable
Customer
Satisfaction
and
Variable
Brand
Loyalty
Analisis
regresi
The results stated
that there is a
relationship and a
significant positive
effect of customer
satisfaction on
brand loyalty
5. Handayani
(2015)
The influence
of Perceived
value and
Customer
satisfaction
that effect to
Brand loyalty
(Case
Provider
User)
Perceived
Value (X1),
Customer
Satisfaction
(X2).
Brand
Loyalty (Y)
Multiple
Regression
Analysis
The results indicate
that perceived value
has positive and
significant effect to
customer loyalty
and this study also
confirm if customer
satisfaction has
positive and
significant effect to
brand loyalty.
6. Thakur and
Singh (2012)
Brand image,
Customer
Satisfaction,
and Loyalty
Intention:
Brand
Image (X1)
Customer
Satisfaction
(X2)
Multiple
Regression
Analysis
The result indicate
that brand image
has positive and
significant effect to
customer

xlix
No Researcher Tittle of
Research
Research Methods Research Result
Variable Method
Study in the
Context of
Cosmetic
Product
Among the
people of
Central India
Loyalty
Intention
(Y)
satisfaction and this
study also confirm
if customer
satisfaction has
positive and
significant effect to
loyalty intention.

l
G. Theoretical Framework
Figure 2.1
Theoretical Framework
H. Hypothesis
The hypothesis is a temporary answer to the problem of research, where
the formulation of research has been expressed in the form of a question
sentence (Sugiyono, 2014: 64). The hypothesis proposed as a temporary
answer to the problems posed in this study are as follows:
Service Quality (X1) Brand Image (X2) Perceived Value (X3)
(X3)
Cust. Satisfaction (Y1)
Brand Loyalty (Y2)
Conclusion and Suggestion
Path Analysis 1. Simultaneous T test
2. Simultaneous F test
3. Correlation Test
4. Sobel Test
Data Analysis Method:
1. Validity Test
2. Realibility Test
3. Normality Test

li
1. Structural Equation 1
a. Hypothesis 1
Ho: ρx1y1 = 0, There is indirect relationship between service quality
with customer satisfaction
Ha: ρx1y1 ≠ 0, There is direct relationship between service quality with
customer satisfaction
b. Hypothesis 2
Ho: ρx2y1 = 0, There is indirect relationship between brand image with
customer satisfaction
Ha: ρx2y1 ≠ 0, There is direct relationship between brand image with
customer satisfaction
c. Hypothesis 3
Ho: ρx3y1 = 0, there is indirect relationship between perceived value
with customer satisfaction
Ha: ρx3y1 ≠ 0, there is direct relationship between perceived value with
customer satisfaction
d. Hypothesis 4
Ho: ρx1y1 = ρx2y1 = ρx3y1 = 0, there is indirect relationship between
service quality, brand image and perceived value to customer
satisfaction simultaneously.

lii
Ha: ρx1y1 = ρx2y1 = ρx3y1 ≠ 0, there is direct relaionship between
service quality, brand image and perceived value to customer
satisfaction simultaneously.
2. Structural Equation 2
a. Hypothesis 5
Ho: ρx1y2 = 0, there is indirect relationship between service quality to
brand loyalty.
Ha: ρx1y2 ≠ 0, there is direct relationship between service quality to
brand loyalty.
b. Hypothesis 6
Ho: ρx3y2 = 0, there is indirect relationship between perceived value
to brand loyalty
Ha: ρx3y2 ≠ 0, there is direct relationship between perceived value to
brand loyalty
c. Hypothesis 7
Ho: ρy1y2 = 0, there is indirect relationship between customer
satisfaction to brand loyalty
Ha: ρy1y2 ≠ 0, there is direct relationship between customer
satisfaction to brand loyalty
d. Hypothesis 8
Ho: ρx1y2 = ρx3y2 = ρy1y2 = 0, there is indirect relationship between

liii
service quality, perceived value and customer satisfaction to brand
loyalty simultaneously.
Ha: ρx1y2 = ρx3y2 = ρy1y2 ≠ 0, there is direct relationship between
service quality, perceived value and customer satisfaction to brand
loyalty simultaneously.

liv
CHAPTER III
RESEARCH METHODOLOGY
A. Scope of Research
Respondent in this research is the customer who shop in Outlet XL
Bekasi. The selection of the location of the bekasi is done with the
consideration of the writer because the population of the current congregation
is very dense which for the internet network will be very difficult to obtain
due to dense population, but with XL's excellent Internet signal quality, XL's
internet network is still affordable in very populated locations. This research
was conducted to analyze how much the influence of Service Quality (X1),
Brand Image (X2), Perceived Value (X3), to Customer Satisfaction (Y) and
Brand Loyalty (Z) as variable in the research. This research will be conduct on
october – december 2017. Field research will be held in December 2017.
B. Determine of Sample Method
1. Population
According to Sugiyono (2015:135) population is area generalization
consist of objects and subjects that have certain quality and characteristic
designed by author for learned and at the next pulled the conclusion.
Population is subject or objects which have certain qualities and
characteristics are determined by researcher. Thus the population is not
only people but also objects. Population also not only quantity but includes
all of characteristics subject or object and the population in this research is

lv
customer of XL Bekasi.
According to Malhotra (2004:314) population is the aggregate of all
the elements that share common set of characteristic and that comprise the
universe for the purpose of the marketing research problem.
2. Sample Technique
According to Sugiyono (2015:136) sample is a part of total number
and characteristic that owned by its population. According to Malhotra
(2004:314) sample as a subgroup of the elements of the population
selected for participation in the study. Element is the object about which or
from which the information is desired (Malhotra, 2009:373).
The sample technique will be used is convenience sampling.
According to Malhotra (2004:321) convenience sampling is a non-
probability sampling technique that attempts to obtain a sample of
convenient elements. Because, non-probability sampling relies on the
personal judgment of the researcher rather than chance to select the sample
elements. The researcher can arbitrarily or consciously decide what
elements to include the sample (Malhotra 2004:320)
The researcher takes 100 samples respondent, because according to
Sugiyono (2010:74) guidelines to determining sample are as follows :
a. Sample size should be between 30-500 elements.
b. If the sample is broken down further into sub-sample (Male/Female,
Elementary/Junior/High School, etc.) must be a minimum number of
sub until 30.

lvi
c. In the multivariate research (multiple linear regressions) the sample
size should be several times larger (10 times) than the number of
variables to be analyzed.
d. A simple experiment for research, with strict controls, sample size
between 10-20 elements.
The researcher takes 100 samples respondent, because according to
Sugiyono (2010:74) guidelines to determining sample are as follows
C. Data Collection Methods
1. Primary Data
Primary data is data that comes from the original source or sources of
the first that we generally refer to as a resource (Sarwono, 2012:37). The
method used to obtain primary data is that the questionnaire. The
questionnaire is a list of questions that will be used by researchers to
obtain data from the source directly through the communication process or
by asking questions. The questionnaire supposed to respondent to be filled,
the respondents in this research is the internet user of XL.
Weight rating figures questionnaire results in this study are described
in the corresponding Likert scale is a method used to measure attitudes,
opinions, and perceptions of a person or group of people about a social
phenomenon. Likert scale used to answer part of the study had five
categories of statements as presented in the table below;
Table 3.1
Likert Scale of Five Levels

lvii
No Range Weight
1 Strongly Agree (SA) 5
2 Agree (A) 4
3 Neutral (N) 3
4 Disagree (D) 2
5 Strongly Disagree (SD) 1
2. Secondary Data
Secondary data is data that has been processed by certain parties that
the data is available when we need (Sarwono, 2012: 32). This research
includes studies through all the written material (literature study) in the
form of books, literature, internet and other written sources that are
relevant to the title of the research and accountability can be verified.
D. Data Analysis Methods
1. Validity Test
Validity test used to measure whether a legitimate or valid
questionnaires. A questionnaire is said to be valid if the questions on the
questionnaire were able to reveal which will be measured by the
questionnaire. Validity test in the research done by comparing the value of
r count with r table for degree of freedom (df) = n – 2, in this case n is the
number of sample. If r count is greater than r table and the value is positive
then the grain or questions or indicators that are declared valid (Ghozali,
2013:52-53).
2. Reability Test

lviii
Reliability is often defined as the consistency and stability of data
findings. From a positivistic perspective, reliability typically is considered
to be synonymous with consistency of data produced by observation made
by different researcher at different times (Ghozali, 2013:47). Software
SPSS 21.0 provide facilities to measure reliability with statistic test of
Cronbach Alpha (α). A construct or variable is said reliable if the value of
Cronbach Alpha > 0,70 (Nunnally, 1994 in Ghozali, 2013:48).
3. Normality Test
Normality test aims to test whether in regression models, variables
bullies or residual has a normal distribution. As it known that t and F test
assumes that the residual value follows the normal distribution. When this
assumption is violated the the test statistic to be invalid for a number of
small sample (Ghozali, 2006:110). One of the test statistic that can be used
to test normality test is the residual non-parametik Kolomogrov-Smirnov.
If the magnitude of the value Kolomogrov-Smirnov is greater than the
value of asymp Sig, then Ho denied that means normal distributed residual
data (Ghozali, 2006:115).
4. Path Analysis
Path analysis first developed in the 1920s by a geneticist is Swell
Wright (Joreskog and Sorbon; Johnson & Wichern, 1992, in Riduwan and
Engkos, 2008:1). Path analysis interpreted oleh Bhornstedt (1974) in
Kusnendi (2005:1) quoted by Riduwan and Kuncoro (2008:1) if “a
technique for estimating the effect’s a set of independent variables han on

lix
a dependent caribale from a set of observed correlations, given a set of
hypothesized causal asymetric relation among the < ominant < .”
sedangkan tujuan utama path analysis is a method of measuring the direct
influence along each separate path in such a system and thus if finding the
degree to which variation of a given effect is determined by each particular
cause. The method depend on the combination of knowledge of the degree
correlation among the variables in a systemn with such knowledge as may
possessed of the causal relations (Maruyama, 1998:16) in Riduwan and
Kuncoro (2008:1). So, path analysis model use to analyze the relationship
between variable with a view to knowing the direct or indirect effects of
eksogen towards endogen.
Path analysis techniques to be used in test the size of the contribution
indicated by the coefficient on each diagram the casual relations between
variable X1 and X2 toward Y and its impact on Z. Consideration using this
analysis because between one variable with another variable have a
reliaonship.
a. Conversion flow diagram into equation
Nex step is convert the model specification into a series of
equations.
b. Structural equation
Y = ρy1x1X1 + ρy1x2X2 + ρy1x3X3 + ɛ1
Z = ρzx1X1 + ρzx3X3 + ρzy1Y1 + ɛ2

lx
Description :
X1 = Service Quality
X2 = Brand Image
X3 = Perceived Value
Y = Customer Saisfaction
Z = Brand Loyalty
Before the researchers use path analysis in the research, then the
researcher must arrange the relationship model between variables in this
case called path analysis (Sugiyono, 2007:298).
Figure 3.1
Path Analysis
Source: Primary data Processed 2016
From calculation of spss program before, will be obtained information
or result from coefficient determination (R2), simultaneous test (F test), and
ρzx3
ρzy1 Brand Loyalty
(Z)
ρzx1
ɛ2
Customer
Satisfaction (Y)
rx2x3 ρyx3
ρyx1
Service Quality
(X1)
Brand Image
(X2)
Perceived
Value (X3)
rx1x2
rx1x3
ρyx2
ɛ1

lxi
parsial test (Test T).
a. Determination Coefficient (R2)
According to Ghozali (2006:202) the coefficient of
determination ( r2) essentially measure how far the ability of
models to explain variation in the dependent variable. The value
determination of coefficient is between zero and one. The small
means that the ability of independent variables in explaining
variations in the dependent variable is very limited.
Basic weaknesses use the coefficient of determination is
based on the number of independent variables entered into the
model. Each additional one independent variable, then R2 would
increase, no matter whether these variables affect the dependent
variable is not. Therefore, in this research used is the R square that
have been adapted or adjusted R2 as adjusted for the variables used
in this research. Adjusted R2 value can rise or fail if an independent
variable added into the model.
b. Simultaneous Test (F-Test)
Simultaneously, hypothesis testing is done by using the F-test.
According Ghozali (2013: 98) test statistic F basically shows
whether independent or dependent variables included in the model
have influence together against the dependent variable or bonded.
probability is less than 0.05, then the result is significant means
there is influence of independent variables together to dependent
variable.

lxii
c. Parameter Individu Test (Partial Test)
Partially, hypothesis testing was done by t-test. According Ghozali
(2011: 98) test statistic t basically shows how far the influence of
independent variable individually in explaining the dependent
variable. Probability is less than 0.05, then the result is significant
means there is influence from independent variable individually to
dependent variable.
d. The Coefficient of Correlation
According to Priyatno (2012:100) correlation of coefficient is used
to see how strong relationship and direction between one or more
variable. Coefficient of correlation can be shown by the number of
pearson correlation. Pearson correlation ranged from zero until
one. If pearson correlation is close to the number one, it means the
relationship is getting strong. Otherwise, if pearson correlation is
close to zero then the relationship is getting weak.
Table 3.2
The Level of Coefficient Correlation
(Sugiyono, 2010:100)
Internal Coefficient Level of Relationship
0.0 - 0.25 Very Weak
>0.25 – 0.5 Weak
>0.5 – 0.75 Strong
>0.75 -1 Very Strong

lxiii
5. Sobel Test
Hypothesis testing can be done with mediation procedures
developed by Soble test (1982) and was known by sobel test. Sobel test
done by way testing the strength of the indirect influence of X to Y against
M. Indirect influence X to Y against M can be calculate with the line way
X → M (a) with the way M → Y (b) or ab. So the coefficient ab = (c-c’),
where c is the influence X towards Y without control M. Standard error
coefficient a and b written with sa and sb and the magnitude of the
standard error of indirect effect sab will be calculated with the formula, as
follows:
222222 sbsasbasabSab ++=
To test the significant of indirect influence, it is necessary to calculate the
t-value of coefficient ab with the following formula, as follows;
sab
abt =
This calculate of t-value compared with t-table value. If the
calculation of t-value more than the t-table value, then it can be concluded
to occur the influence of mediation. Sobel test assumptions require a large
number of samples, if the number of small samples, then test the soble
became less conservative (Ghozali, 2013:248-249).
E. Operational Variable
According to Sugiyono (2009:58) research operational are everything that
shaped whatever things which determined by researcher to learn and get the

lxiv
information about those things, next make a conclusion. Here are the table of
operational variable:
Table 3.3
Operational Variable
No. Variable Sub Variable Indicator Scale
1. Service Quality
(X1)
(Source:
Parasuraman., et
al (1998) in
Tjiptono,
2011:198)
(2007:198)
A. Realibility 1. Ability to provide
service quickly.
2. Ability to provide
accurate service.
3. Ability to provide
service satisfied
Likert
B. Responsiveness 4. Ability of
employees to
help customer
5. Ability of
employees to
respond the
customer request
6. Ability of
employees to
respond the
complaint
customer
C. Assurance 7. Employee can be
trusted
8. Employee always
be polite
9. Employee have
enough
knowledge
D. Empathy 10. Employee
understand the
problem of
customer

lxv
No. Variable Sub Variable Indicator Scale
11. Providing
personal attention
to customer
E. Tangibles 12. Attractive
facilities
13. Equipment
14. Appearance of
service provider
2. Brand Image
(X2)
(Source : Keller
2013:77)
A. Strengthens 1. Product Quality Likert
B. Favorable 2. Brand easy to
say
3. Brand easy to
remember
C. Uniqueness 4. The
differentiation a
brand among
other brand
5. The variation of
product
3. Perceived Value
(X3)
(Source :
Parasuraman
and Grewal
2000)
A. Fair price 1. Price conformity Likert
B. Brand
Reputation
2. Brand reputation
that has been in
mind customer
C. Value for money 3. Advantages
4. Value of money
paid
4. Customer
Satisfaction
(Y1)
(Source:
Tjiptono,
2014:368)
A. Overall
Satisfaction
1. A feeling
satisfaction to the
product given
Likert
B. Conformance of
Expectation
2. The product
given in
accordance with
expected
C. Experience
satisfaction
3. Satisfied for
using these

lxvi
No. Variable Sub Variable Indicator Scale
product
5. Brand Loyalty
(Y2)
(Source :
Rangkuti in
Kusuma, 2014)
A. Cognitive loyalty 1. Repeat purchase Likert
B. Affective loyalty 2. Satisfaction
product
C. Conative loyalty 3. Trust
D. Action loyalty 4. Recommendation

lxvii
CHAPTER IV
RESULT AND ANALYSIS
A. General Overview of Research Object
1. History of XL Axiata Company
With more than 17 years of experience operating in the Indonesian
market, PT XL Axiata Tbk. (XL) is one of the leading mobile service
providers in Indonesia. Currently, XL is considered one of the leading
providers of cellular services for Data and Telephony in Indonesia.
XL Initially starting business as a trading and general services
company established on 6 October 1989 under the name of PT
Grahametropolitan Lestari. In 1996, XL Axiata entered the
telecommunications field after obtaining a GSM 900 operating license and
officially launching its GSM services, becoming the first private company
in Indonesia to provide cellular mobile telephony services. Later on,
following a cooperation agreement with the Rajawali Group and three
foreign investors (NYNEX, AIF and Mitsui), XL Axiata name was
changed to PT Excelcomindo Pratama.
In September 2005, XL Axiata launched an Initial Public Offering
(IPO) and listed its shares on the Jakarta Stock Exchange now known as
the Indonesia Stock Exchange (IDX). At that time, XL Axiata was a
subsidiary of Indocel Holding Sdn. Bhd., which is now known as Axiata
Investment (Indonesia) Sdn. Bhd., which all shares owned by TM

lxviii
International Sdn.Bhd., (“TMI”) through TM International (L) Limited. In
2009, TMI changed its name to Axiata Group Berhad (“Axiata”) which
later in the same year PT Excelcomindo Pratama Tbk. also changed its
name to PT XLAxiata Tbk. for synergy purpose. Currently, the majority of
XL Axiata’s shares are owned by Axiata through Axiata Investments
(Indonesia) Sdn. Bhd. (66.4%) and the remaining is held by the public
(33.6%).
As a leading market player in Indonesia, XL Axiata provides services
for retail customers and offers business solutions to corporate customers
with wide network and service coverage throughout Indonesia. The
services include Data, Voice, SMS and other value added digital services.
XL Axiata operates its network on GSM 900/DCS 1800 and IMT-2000/3G
technologies.
XL Axiata also holds a Content Provider License, Internet Services
Provider (ISP), Internet Interconnection Services License, Voice Over
Internet Protocol License, Leased Line License, Money Remittance as well
as E-Money Issuer License from the Central Bank of Indonesia, which
enables XL Axiata to provide remittance service to its subscribers.
2. Vision and Corporate Culture of XL Axiata Company
a. Vision
To be a leader in providing easy-to-use mobile internet experience at
a lower price to Indonesians, with the XL brand having strong appeal

lxix
to the Emerging Middle Class segment.
b. Corporate Culture
XL’s four core values are captured in “ITS XL” which stand for;
• Uncompromising Integrity; having high ethical standards,
having no tolerance for unethical behavior.
• Team Synergy; Vigorously working together, ensuring all
processes are done to achieve a common goal.
• Simplicity; Doing our best to provide a solution that easy-to-
use and beyond customer’s expectations.
• Exceptional Performance; Always be enthusiastic in
providing the best performance.
B. Data Quality Test
Before performing the data analysis with path analysis, the researchers
tested the quality of data by performing validity and realibility test with 20
sample.
1. Validity Test
Validity test in this research is used to measure the validity of a
questionaire. Thus, the higher the validity of a measuring instrument, the
more precisely the gauge is about the target. Correlation test is used to
with using “Corrected Item Total Correlation”. As for the basis of
decision making with compare the value Rcount and Rtable, the criteria of
test as follow below:

lxx
• If r-count > r-table so the item is valid
• If r-count < r-table so the item is unvalid
Validity test done by comparing with Rcount with Rtable for degree of
freedom (df) = n-2, in this case, n is total of sample. Questionaire divided
into main factors, such as service quality (X1) with 14 questions, brand
image (X2) with 5 questions, perceived value (X3) with 4 questions,
customer satisfaction (Y1) with 3 questions and brand loyalty (Y2) with 4
questions. So the total of question is 30 questions with the total of
respondent are 20 questions at the time try out and 100 respondents after
all declared valid and reliable.
The total of sample is (n) = 20 and the magnitude of df can be
calculated 20-2 = 18 with 18 and alpha 0,05 obtained from r-table 0.44.
From the testing of validity of all items that value of Rcount greater that
0.44 is valid and can be used as reference for further research. The size of
the each validity can be seen in the table below;
a. Service Quality
Table 4.1
Validity Test: Service Quality (X1)
No Question r-count r-table Description
1 SQ 1 0,805 0.444 Valid
2 SQ 2 0,814 0.444 Valid
3 SQ 3 0,837 0.444 Valid
4 SQ 4 0,852 0.444 Valid
5 SQ 5 0,840 0.444 Valid
6 SQ 6 0,796 0.444 Valid
7 SQ 7 0,846 0.444 Valid
8 SQ 8 0,806 0.444 Valid

lxxi
No Question r-count r-table Description
9 SQ 9 0,813 0.444 Valid
10 SQ 10 0,829 0.444 Valid
11 SQ 11 0,868 0.444 Valid
12 SQ 12 0,822 0.444 Valid
13 SQ 13 0,811 0.444 Valid
14 SQ 14 0,805 0.444 Valid
Source: Primary data Output SPSS 23, 2018
From the table above, there are fourteen questions to test service
quality. It can be seen that all of the result of service quality question are
valid, because the value Sig. From each other item r-count > r-table.
b. Brand Image
Table 4.2
Validity Test: Brand Image (X2)
No Question r-count r-table Description
1 BI_1 0,630 0.444 Valid
2 BI_2 0,803 0.444 Valid
3 BI_3 0,798 0.444 Valid
4 BI_4 0,784 0.444 Valid
5 BI_5 0,795 0.444 Valid
Source: Primary data Output SPSS 23, 2018
From the table above, there are fifth question to test brand image. It
can be seen that all of the result of brand image questions are valid.
because the value Sig. From each other item r-count > r-table.
c. Perceived Value
Table 4.3
Validity Test: Perceived Value (X3)
No Question r-count r-table Description
1 PV_1 0,873 0.444 Valid
2 PV_2 0,872 0.444 Valid
3 PV_3 0,896 0.444 Valid
4 PV_4 0,907 0.444 Valid
Source: Primary data Output SPSS 23, 2018

lxxii
From the table above, there are fouth question to test perceived value.
It can be seen that all of the result of perceived value questions are valid,
because the value Sig. From each other item r-count > r-table.
d. Customer Satisfaction
Table 4.4
Validity Test: Customer Satisfaction (Y)
No Question r-count r-table Description
1 CS_1 0,856 0.444 Valid
2 CS_2 0,843 0.444 Valid
3 CS_3 0,780 0.444 Valid
Source: Primary data Output SPSS 23, 2018
From the table above, there are third questions to test customer
satisfaction. It can be seen that all of the result of customer satisfaction
question are valid, because the value Sig. From each other item r-count >
r-table.
e. Brand Loyalty
Table 4.5
Validity Test: Brand Loyalty (Z)
No Question r-count r-table Description
1 BL_1 0,799 0.444 Valid
2 BL_2 0,794 0.444 Valid
3 BL_3 0,878 0.444 Valid
4 BL_4 0,870 0.444 Valid
Source: Primary data Output SPSS 23, 2018
From the table above, there are fourth question to test brand loyalty.
It can be seen that all of the result of brand loyalty question are valid,,
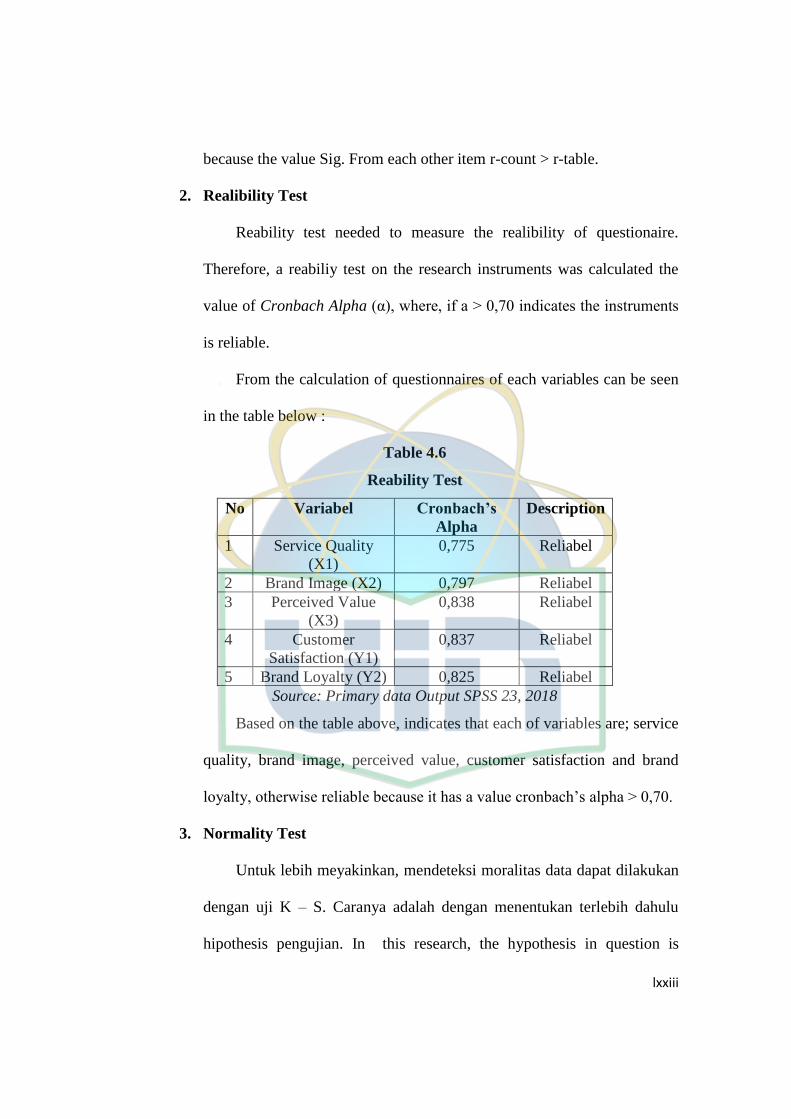
lxxiii
because the value Sig. From each other item r-count > r-table.
2. Realibility Test
Reability test needed to measure the realibility of questionaire.
Therefore, a reabiliy test on the research instruments was calculated the
value of Cronbach Alpha (α), where, if a > 0,70 indicates the instruments
is reliable.
From the calculation of questionnaires of each variables can be seen
in the table below :
Table 4.6
Reability Test
No Variabel Cronbach’s
Alpha
Description
1 Service Quality
(X1)
0,775 Reliabel
2 Brand Image (X2) 0,797 Reliabel
3 Perceived Value
(X3)
0,838 Reliabel
4 Customer
Satisfaction (Y1)
0,837 Reliabel
5 Brand Loyalty (Y2) 0,825 Reliabel
Source: Primary data Output SPSS 23, 2018
Based on the table above, indicates that each of variables are; service
quality, brand image, perceived value, customer satisfaction and brand
loyalty, otherwise reliable because it has a value cronbach’s alpha > 0,70.
3. Normality Test
Untuk lebih meyakinkan, mendeteksi moralitas data dapat dilakukan
dengan uji K – S. Caranya adalah dengan menentukan terlebih dahulu
hipothesis pengujian. In this research, the hypothesis in question is

lxxiv
Hypothesis Nol (Ho) is data is normally distributed. Ho accepted if the
value of the test greater than the significant a = 5%.
Hipothesis :
a. Ho : Data distribution is normal
b. H1 : Data distribution is not normal
Criteria of decision making with statistical Kolmogorov – Smirnov
test, such as;
a. If significant > 0,05 then the data distribution is normal
b. If significant < 0,05 then the data distribution is not normal
a. Sub – Structure 1
Table 4.7
Output Normality Test Sub – Structure 1
Tests of Normality
Kolmogorov-Smirnova Shapiro-Wilk
Statistic df Sig. Statistic df Sig.
Unstandardized Residual ,058 100 ,200* ,990 100 ,633
*. This is a lower bound of the true significance.
a. Lilliefors Significance Correction
Source : Data processing, 2018
Based on the table above, the value of Kolmogorov – Smirnov is
0,058 with signifincance 0.200. Because the value signifincance
Kolmogorov – Smirnov greater than 0.200 > 0,05 so can be concluded the
data distribution is normal.

lxxv
b. Sub – Structure 2
Table 4.8
Output Normality Test Sub – Structure 2
Tests of Normality
Kolmogorov-Smirnova Shapiro-Wilk
Statistic Df Sig. Statistic df Sig.
Unstandardized Residual ,078 100 ,141 ,975 100 ,052
a. Lilliefors Significance Correction
Source : Data processing, 2018
Based on the table above, the value of Kolmogorov – Smirnov is
0.078 with the significance 0.141. Because the value signifikan
Kolmogorov – Smirnov greater than 0.141 > 0,05 so can be concluded the
data distribution is normal.
C. Profile Respondent
Responden dari penelitian ini adalah para konsumen XL. Questioner
secara langsung disebarkan sebanyak 100 questionaire kepada responden.
Berikut ini tabel 4.9 menyajikan rangkuman informasi karakteristik responden.
Table 4.9
Data Statistical Respondent
No Keterangan Total Persentase
1 Gender
a) Male 46 46%
b) Female 54 54%
Total 100 100%
2 Age
a) <19 years 30 30%
b) 20-35 years 29 29%
c) 36–50 years 23 23%
d) >50 years 18 18%

lxxvi
Total 100 100%
3 Work
a) Student 38 38%
b) Pegawai Negri 10 10%
c) Pegawai Swasta 30 30%
d) Wiraswasta 9 9%
e) Others 13 13%
Total 100 100%
Source : Data processing, 2018
D. Analysis Result
1. Questionaire Analysis
The following are the recapitulation of the result of the answer to
100 respondents in answer to questionaire;
Table 4.10
The result of respondent
Questionaire
Item
Grade
Total
5 4 3 2 1
X1 ( Service Quality)
SQ_1 2 51 24 21 2 100
SQ_2 2 47 27 22 2 100
SQ_3 5 48 30 14 3 100
SQ_4 5 45 25 24 1 100
SQ_5 5 46 25 21 3 100
SQ_6 4 47 30 16 3 100
SQ_7 7 44 24 24 1 100

lxxvii
SQ_8 5 45 28 21 1 100
SQ_9 7 48 29 14 2 100
SQ_10 6 45 24 23 2 100
SQ__11 7 46 24 21 2 100
SQ_12 5 49 28 15 3 100
SQ_13 6 51 28 11 4 100
SQ_14 7 51 20 21 1 100
X2 (Brand Image)
BI_1 2 36 40 21 1 100
BI_2 0 30 34 34 2 100
BI_3 3 28 42 25 2 100
Questionaire
Item
Grade Total
5 4 3 2 1
BI_4 4 25 42 28 1 100
BI_5 2 31 33 34 0 100
X3 (Perceived Value)
PV_1 6 9 18 52 15 100
PV_2 12 4 15 57 12 100
PV_3 5 12 40 22 21 100
PV_4 14 5 42 19 20 100
Y (Customer Satisfaction)
CS_1 18 29 31 16 6 100

lxxviii
CS_2 23 35 15 19 8 100
CS_3 21 33 23 17 6 100
Z (Brand Loyalty)
BL_1 18 30 28 17 7 100
BL_2 24 37 12 19 8 100
BL_3 25 27 24 18 6 100
BL_4 25 29 24 16 6 100
Source : Data processing, 2018
Based on the result of the output of questionaire which has been
divided to the internet user xl respondents, then obtained the data as
follows;
Table 4.11
Employees XL offer a service that quickly in help customers
SQ_1
Frequency Percent Valid Percent
Cumulative
Percent
Valid Strongly disagree 2 2,0 2,0 2,0
Disagree 21 21,0 21,0 23,0
Neutral 24 24,0 24,0 47,0
Agree 51 51,0 51,0 98,0
Strongly Agree 2 2,0 2,0 100,0
Total 100 100,0 100,0
Source : Data processing, 2018
Based on the table 4.11 showed that 2 respondent (2%) strongly
disagree, 21 respondents (21%) disagree, 24 respondents (24%) neutral,
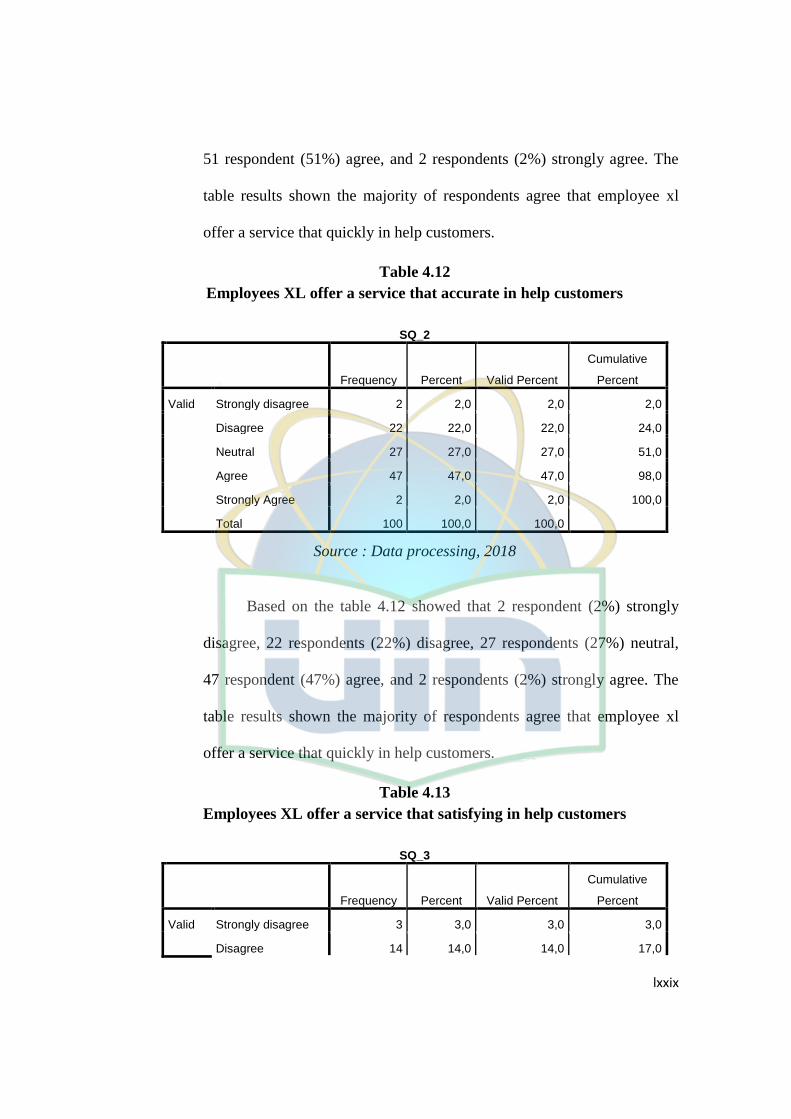
lxxix
51 respondent (51%) agree, and 2 respondents (2%) strongly agree. The
table results shown the majority of respondents agree that employee xl
offer a service that quickly in help customers.
Table 4.12
Employees XL offer a service that accurate in help customers
SQ_2
Frequency Percent Valid Percent
Cumulative
Percent
Valid Strongly disagree 2 2,0 2,0 2,0
Disagree 22 22,0 22,0 24,0
Neutral 27 27,0 27,0 51,0
Agree 47 47,0 47,0 98,0
Strongly Agree 2 2,0 2,0 100,0
Total 100 100,0 100,0
Source : Data processing, 2018
Based on the table 4.12 showed that 2 respondent (2%) strongly
disagree, 22 respondents (22%) disagree, 27 respondents (27%) neutral,
47 respondent (47%) agree, and 2 respondents (2%) strongly agree. The
table results shown the majority of respondents agree that employee xl
offer a service that quickly in help customers.
Table 4.13
Employees XL offer a service that satisfying in help customers
SQ_3
Frequency Percent Valid Percent
Cumulative
Percent
Valid Strongly disagree 3 3,0 3,0 3,0
Disagree 14 14,0 14,0 17,0

lxxx
Neutral 30 30,0 30,0 47,0
Agree 48 48,0 48,0 95,0
Strongly Agree 5 5,0 5,0 100,0
Total 100 100,0 100,0
Source : Data processing, 2018
Based on the table 4.13 showed that 3 respondent (3%) strongly
disagree, 14 respondents (14%) disagree, 30 respondents (30%) neutral,
48 respondent (48%) agree, and 5 respondents (5%) strongly agree. The
table results shown the majority of respondents agree that employee xl
offer a service that satisfying in help customers.
Table 4.14
Employees XL always willing to help customers
SQ_4
Frequency Percent Valid Percent
Cumulative
Percent
Valid Strongly disagree 1 1,0 1,0 1,0
Disagree 24 24,0 24,0 25,0
Neutral 25 25,0 25,0 50,0
Agree 45 45,0 45,0 95,0
Strongly Agree 5 5,0 5,0 100,0
Total 100 100,0 100,0
Source : Data processing, 2018
Based on the table 4.14 showed that 1 respondent (1%) strongly
disagree, 24 respondents (24%) disagree, 25 respondents (25%) neutral,
45 respondent (45%) agree, and 5 respondents (5%) strongly agree. The
table results shown the majority of respondents agree that employee xl

lxxxi
always willing to help customers.,
Table 4.15
Employees XL always responsive in responding to customers desires
SQ_5
Frequency Percent Valid Percent
Cumulative
Percent
Valid Strongly disagree 3 3,0 3,0 3,0
Disagree 21 21,0 21,0 24,0
Neutral 25 25,0 25,0 49,0
Agree 46 46,0 46,0 95,0
Strongly Agree 5 5,0 5,0 100,0
Total 100 100,0 100,0
Source : Data processing, 2018
Based on the table 4.15 showed that 3 respondent (3%) strongly
disagree, 21 respondents (21%) disagree, 25 respondents (25%) neutral,
46 respondent (46%) agree, and 5 respondents (5%) strongly agree. The
table results shown the majority of respondents agree that employee xl
always responsive in responding to customers desires.
Table 4.16
Employees XL always respond in response to a customers complaint
SQ_6
Frequency Percent Valid Percent
Cumulative
Percent
Valid Strongly disagree 3 3,0 3,0 3,0
Disagree 16 16,0 16,0 19,0
Neutral 30 30,0 30,0 49,0
Agree 47 47,0 47,0 96,0
Strongly Agree 4 4,0 4,0 100,0
Total 100 100,0 100,0
Source : Data processing, 2018

lxxxii
Based on the table 4.16 showed that 3 respondent (3%) strongly
disagree, 16 respondents (16%) disagree, 30 respondents (30%) neutral,
47 respondent (47%) agree, and 4 respondents (4%) strongly agree. The
table results shown the majority of respondents agree that employee xl
always respond in response to a customers complaint.
Table 4.17
Employees XL has a reliable characteristis in providing services
SQ_7
Frequency Percent Valid Percent
Cumulative
Percent
Valid Strongly disagree 1 1,0 1,0 1,0
Disagree 24 24,0 24,0 25,0
Neutral 24 24,0 24,0 49,0
Agree 44 44,0 44,0 93,0
Strongly Agree 7 7,0 7,0 100,0
Total 100 100,0 100,0
Source : Data processing, 2018
Based on the table 4.17 showed that 1 respondent (1%) strongly
disagree, 24 respondents (24%) disagree, 24 respondents (24%) neutral,
44 respondent (44%) agree, and 7 respondents (7%) strongly agree. The
table results shown the majority of respondents agree that employee xl has
a reliable characteristic in providing services.

lxxxiii
Table 4.18
Employees XL always polite in serving customers
SQ_8
Frequency Percent Valid Percent
Cumulative
Percent
Valid Strongly disagree 1 1,0 1,0 1,0
Disagree 21 21,0 21,0 22,0
Neutral 28 28,0 28,0 50,0
Agree 45 45,0 45,0 95,0
Strongly Agree 5 5,0 5,0 100,0
Total 100 100,0 100,0
Source : Data processing, 2018
Based on the table 4.18 showed that 1 respondent (1%) strongly disagree,
21 respondents (21%) disagree, 28 respondents (28%) neutral, 45
respondent (45%) agree, and 5 respondents (5%) strongly agree. The table
results shown the majority of respondents agree that employee xl always
polite in serving customers.
Table 4.19
Employees XL having knowledge in providing information about the
internet services XL
SQ_9
Frequency Percent Valid Percent
Cumulative
Percent
Valid Strongly disagree 2 2,0 2,0 2,0
Disagree 14 14,0 14,0 16,0
Neutral 29 29,0 29,0 45,0
Agree 48 48,0 48,0 93,0
Strongly Agree 7 7,0 7,0 100,0
Total 100 100,0 100,0
Source : Data processing, 2018

lxxxiv
Based on the table 4.19 showed that 2 respondent (2%) strongly
disagree, 14 respondents (14%) disagree, 29 respondents (29%) neutral,
48 respondent (48%) agree, and 7 respondents (7%) strongly agree. The
table results shown the majority of respondents agree that employee xl
having knowledge in providing information about the internet services xl.
Table 4.20
Employees XL able to understand consumer problems and needs
SQ_10
Frequency Percent Valid Percent
Cumulative
Percent
Valid Strongly disagree 2 2,0 2,0 2,0
Disagree 23 23,0 23,0 25,0
Neutral 24 24,0 24,0 49,0
Agree 45 45,0 45,0 94,0
Strongly Agree 6 6,0 6,0 100,0
Total 100 100,0 100,0
Source : Data processing, 2018
Based on the table 4.20 showed that 2 respondent (2%) strongly
disagree, 23 respondents (23%) disagree, 24 respondents (24%) neutral,
45 respondent (45%) agree, and 6 respondents (6%) strongly agree. The
table results shown the majority of respondents agree that employee xl
able to understand consumer problmes and needs.

lxxxv
Table 4.21
Employees XL give priority to consumer attention
SQ_11
Frequency Percent Valid Percent
Cumulative
Percent
Valid Strongly disagree 2 2,0 2,0 2,0
Disagree 21 21,0 21,0 23,0
Neutral 24 24,0 24,0 47,0
Agree 46 46,0 46,0 93,0
Strongly Agree 7 7,0 7,0 100,0
Total 100 100,0 100,0
Source : Data processing, 2018
Based on the table 4.21 showed that 2 respondent (2%) strongly
disagree, 21 respondents (21%) disagree, 24 respondents (24%) neutral,
46 respondent (46%) agree, and 7 respondents (7%) strongly agree. The
table results shown the majority of respondents agree that employee xl
give priority to consumer attention.
Table 4.22
Facilities in counter XL look clean and interesting
SQ_12
Frequency Percent Valid Percent
Cumulative
Percent
Valid Strongly disagree 3 3,0 3,0 3,0
Disagree 15 15,0 15,0 18,0
Neutral 28 28,0 28,0 46,0
Agree 49 49,0 49,0 95,0
Strongly Agree 5 5,0 5,0 100,0
Total 100 100,0 100,0
Source : Data processing, 2018
Based on the table 4.22 showed that 3 respondent (3%) strongly

lxxxvi
disagree, 15 respondents (15%) disagree, 28 respondents (28%) neutral,
49 respondent (49%) agree, and 5 respondents (5%) strongly agree. The
table results shown the majority of respondents agree that facilities in
counter Xl look clean and interesting.
Table 4.23
The layout room and equipment of counter Xl modern
SQ_13
Frequency Percent Valid Percent
Cumulative
Percent
Valid Strongly disagree 4 4,0 4,0 4,0
Disagree 11 11,0 11,0 15,0
Neutral 28 28,0 28,0 43,0
Agree 51 51,0 51,0 94,0
Strongly Agree 6 6,0 6,0 100,0
Total 100 100,0 100,0
Source : Data processing, 2018
Based on the table 4.23 showed that 4 respondent (4%) strongly
disagree, 11 respondents (11%) disagree, 28 respondents (28%) neutral,
51 respondent (51%) agree, and 6 respondents (6%) strongly agree. The
table results shown the majority of respondents agree that layout room
and equipment of counter Xl modern.

lxxxvii
Table 4.24
Employees XL well groomed and profesional
SQ_14
Frequency Percent Valid Percent
Cumulative
Percent
Valid Strongly disagree 1 1,0 1,0 1,0
Disagree 21 21,0 21,0 22,0
Neutral 20 20,0 20,0 42,0
Agree 51 51,0 51,0 93,0
Strongly Agree 7 7,0 7,0 100,0
Total 100 100,0 100,0
Source : Data processing, 2018
Based on the table 4.24 showed that 1 respondent (1%) strongly
disagree, 21 respondents (21%) disagree, 20 respondents (20%) neutral,
51 respondent (51%) agree, and 7 respondents (7%) strongly agree. The
table results shown the majority of respondents agree that the employees
xl well grommed and profesional.
Table 4.25
XL have a strong internet signal
BI_1
Frequency Percent Valid Percent
Cumulative
Percent
Valid Strongly disagree 1 1,0 1,0 1,0
Disagree 21 21,0 21,0 22,0
Neutral 40 40,0 40,0 62,0
Agree 36 36,0 36,0 98,0
Strongly Agree 2 2,0 2,0 100,0
Total 100 100,0 100,0
Source : Data processing, 2018
Based on the table 4.25 showed that 1 respondent (1%) strongly

lxxxviii
disagree, 21 respondents (21%) disagree, 40 respondents (40%) neutral,
36 respondent (36%) agree, and 2 respondents (2%) strongly agree. The
table results shown the majority of respondents neutral that XL have a
strong internet signal.
Table 4.26
XL is easy to say
BI_2
Frequency Percent Valid Percent
Cumulative
Percent
Valid Strongly disagree 2 2,0 2,0 2,0
Disagree 34 34,0 34,0 36,0
Neutral 34 34,0 34,0 70,0
Agree 30 30,0 30,0 100,0
Total 100 100,0 100,0
Source : Data processing, 2018
Based on the table 4.26 showed that 2 respondent (2%) strongly
disagree, 34 respondents (34%) disagree, 34 respondents (34%) neutral,
30 respondent (30%) agree. The table results shown the majority of
respondents neutral that XL is easy to pronounce.

lxxxix
Table 4.27
XL is easy to remember
BI_3
Frequency Percent Valid Percent
Cumulative
Percent
Valid Strongly disagree 2 2,0 2,0 2,0
Disagree 25 25,0 25,0 27,0
Neutral 42 42,0 42,0 69,0
Agree 28 28,0 28,0 97,0
Strongly Agree 3 3,0 3,0 100,0
Total 100 100,0 100,0
Source : Data processing, 2018
Based on the table 4.27 showed that 2 respondent (2%) strongly
disagree, 25 respondents (25%) disagree, 42 respondents (42%) neutral,
28 respondent (28%) agree, and 3 respondents (3%) strongly agree. The
table results shown the majority of respondents neutral that XL is easy to
remember.
Table 4.28
Package internet service XL is different than the others
BI_4
Frequency Percent Valid Percent
Cumulative
Percent
Valid Strongly disagree 1 1,0 1,0 1,0
Disagree 28 28,0 28,0 29,0
Neutral 42 42,0 42,0 71,0
Agree 25 25,0 25,0 96,0
Strongly Agree 4 4,0 4,0 100,0
Total 100 100,0 100,0
Source : Data processing, 2018

xc
Based on the table 4.28 showed that 1 respondent (1%) strongly
disagree, 28 respondents (28%) disagree, 42 respondents (42%) neutral,
25 respondent (25%) agree, and 4 respondents (4%) strongly agree. The
table results shown the majority of respondents neutral that package
internet service xl is different than the others.
Table 4.29
Package internet service XL varied
BI_5
Frequency Percent Valid Percent
Cumulative
Percent
Valid Disagree 34 34,0 34,0 34,0
Neutral 33 33,0 33,0 67,0
Agree 31 31,0 31,0 98,0
Strongly Agree 2 2,0 2,0 100,0
Total 100 100,0 100,0
Source : Data processing, 2018
Based on the table 4.29 showed that 34 respondents (34%)
disagree, 33 respondents (33%) neutral, 31 respondent (31%) agree, and 2
respondents (2%) strongly agree. The table results shown the majority of
respondents disagree that package internet service xl is varied.

xci
Table 4.30
The price offered in accordance with xl given internet service
PV_1
Frequency Percent Valid Percent
Cumulative
Percent
Valid Strongly disagree 15 15,0 15,0 15,0
Disagree 52 52,0 52,0 67,0
Neutral 18 18,0 18,0 85,0
Agree 9 9,0 9,0 94,0
Strongly Agree 6 6,0 6,0 100,0
Total 100 100,0 100,0
Source : Data processing, 2018
Based on the table 4.30 showed that 15 respondent (15%) strongly
disagree, 52 respondents (52%) disagree, 18 respondents (18%) neutral, 9
respondent (9%) agree, and 6 respondents (6%) strongly agree. The table
results shown the majority of respondents disagree that the prices offered
in accordance with xl given internet service.
Table 4.31
Reputation of brand XL is good
PV_2
Frequency Percent Valid Percent
Cumulative
Percent
Valid Strongly disagree 12 12,0 12,0 12,0
Disagree 57 57,0 57,0 69,0
Neutral 15 15,0 15,0 84,0
Agree 4 4,0 4,0 88,0
Strongly Agree 12 12,0 12,0 100,0
Total 100 100,0 100,0
Source : Data processing, 2018

xcii
Based on the table 4.31 showed that 12 respondent (12%) strongly
disagree, 57 respondents (57%) disagree, 15 respondents (15%) neutral, 4
respondent (4%) agree, and 12 respondents (12%) strongly agree. The
table results shown the majority of respondents disagree that reputation of
brand xl is good.
Table 4.32
The product price of internet xl in accordance with the advantages of what i
was hoping for at the time of use it
PV_3
Frequency Percent Valid Percent
Cumulative
Percent
Valid Strongly disagree 21 21,0 21,0 21,0
Disagree 22 22,0 22,0 43,0
Neutral 40 40,0 40,0 83,0
Agree 12 12,0 12,0 95,0
Strongly Agree 5 5,0 5,0 100,0
Total 100 100,0 100,0
Source : Data processing, 2018
Based on the table 4.32 showed that 21 respondent (21%) strongly
disagree, 22 respondents (22%) disagree, 40 respondents (40%) neutral,
12 respondent (12%) agree, and 5 respondents (5%) strongly agree. The
table results shown the majority of respondents neutral that the product
price of internet xl in accordance with the advantages of what i was
hoping for at the ime of use it.
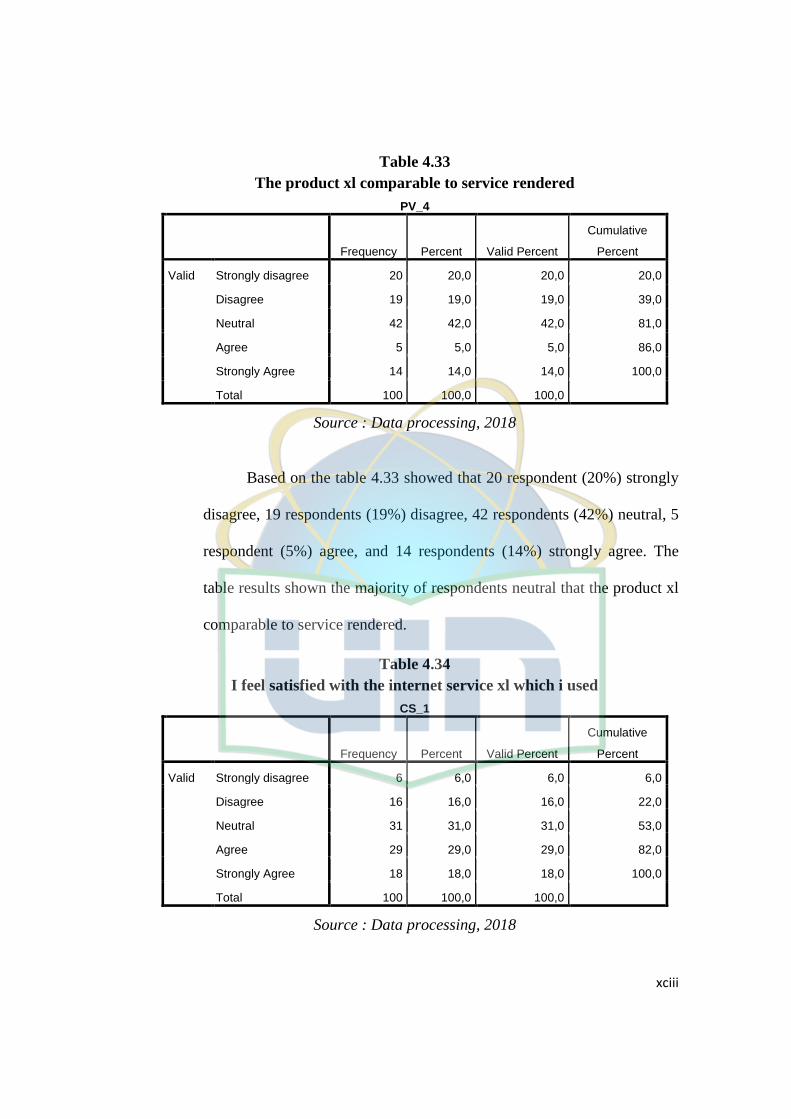
xciii
Table 4.33
The product xl comparable to service rendered
PV_4
Frequency Percent Valid Percent
Cumulative
Percent
Valid Strongly disagree 20 20,0 20,0 20,0
Disagree 19 19,0 19,0 39,0
Neutral 42 42,0 42,0 81,0
Agree 5 5,0 5,0 86,0
Strongly Agree 14 14,0 14,0 100,0
Total 100 100,0 100,0
Source : Data processing, 2018
Based on the table 4.33 showed that 20 respondent (20%) strongly
disagree, 19 respondents (19%) disagree, 42 respondents (42%) neutral, 5
respondent (5%) agree, and 14 respondents (14%) strongly agree. The
table results shown the majority of respondents neutral that the product xl
comparable to service rendered.
Table 4.34
I feel satisfied with the internet service xl which i used
CS_1
Frequency Percent Valid Percent
Cumulative
Percent
Valid Strongly disagree 6 6,0 6,0 6,0
Disagree 16 16,0 16,0 22,0
Neutral 31 31,0 31,0 53,0
Agree 29 29,0 29,0 82,0
Strongly Agree 18 18,0 18,0 100,0
Total 100 100,0 100,0
Source : Data processing, 2018

xciv
Based on the table 4.34 showed that 6 respondent (6%) strongly
disagree, 16 respondents (16%) disagree, 31 respondents (31%) neutral,
29 respondent (29%) agree, and 18 respondents (6%) strongly agree. The
table results shown the majority of respondents neutral that i feel satisfied
with the internet service xl which i used .
Table 4.35
Internet service xl fulfilled my expectations
CS_2
Frequency Percent Valid Percent
Cumulative
Percent
Valid Strongly disagree 8 8,0 8,0 8,0
Disagree 19 19,0 19,0 27,0
Neutral 15 15,0 15,0 42,0
Agree 35 35,0 35,0 77,0
Strongly Agree 23 23,0 23,0 100,0
Total 100 100,0 100,0
Source : Data processing, 2018
Based on the table 4.35 showed that 8 respondent (8%) strongly
disagree, 19 respondents (19%) disagree, 15 respondents (15%) neutral,
35 respondent (35%) agree, and 23 respondents (23%) strongly agree. The
table results shown the majority of respondents agree that internet service
xl fulfilled my expectations.

xcv
Table 4.36
I feel satisfied during the use internet service XL
CS_3
Frequency Percent Valid Percent
Cumulative
Percent
Valid Strongly disagree 6 6,0 6,0 6,0
Disagree 17 17,0 17,0 23,0
Neutral 23 23,0 23,0 46,0
Agree 33 33,0 33,0 79,0
Strongly Agree 21 21,0 21,0 100,0
Total 100 100,0 100,0
Source : Data processing, 2018
Based on the table 4.36 showed that 6 respondent (6%) strongly
disagree, 17 respondents (17%) disagree, 23 respondents (23%) neutral,
33 respondent (33%) agree, and 21 respondents (21%) strongly agree. The
table results shown the majority of respondents agree that i feel satisfied
during the use internet service Xl.
Table 4.37
I will continue to buy the XL products
BL_1
Frequency Percent Valid Percent
Cumulative
Percent
Valid Strongly disagree 7 7,0 7,0 7,0
Disagree 17 17,0 17,0 24,0
Neutral 28 28,0 28,0 52,0
Agree 30 30,0 30,0 82,0
Strongly Agree 18 18,0 18,0 100,0
Total 100 100,0 100,0
Source : Data processing, 2018

xcvi
Based on the table 4.37 showed that 7 respondent (7%) strongly
disagree, 17 respondents (17%) disagree, 28 respondents (28%) neutral,
30 respondent (30%) agree, and 18 respondents (18%) strongly agree. The
table results shown the majority of respondents agree that i will continue
to buy the Xl products.
Table 4.38
I am satisfied with the internet XL product
BL_2
Frequency Percent Valid Percent
Cumulative
Percent
Valid Strongly disagree 8 8,0 8,0 8,0
Disagree 19 19,0 19,0 27,0
Neutral 12 12,0 12,0 39,0
Agree 37 37,0 37,0 76,0
Strongly Agree 24 24,0 24,0 100,0
Total 100 100,0 100,0
Source : Data processing, 2018
Based on the table 4.38 showed that 8 respondent (8%) strongly
disagree, 19 respondents (19%) disagree, 12 respondents (12%) neutral,
37 respondent (37%) agree, and 24 respondents (24%) strongly agree. The
table results shown the majority of respondents agree that i am satisfied
with the internet Xl product.

xcvii
Table 4.39
I am believe against the internet service XL product
BL_3
Frequency Percent Valid Percent
Cumulative
Percent
Valid Strongly disagree 6 6,0 6,0 6,0
Disagree 18 18,0 18,0 24,0
Neutral 24 24,0 24,0 48,0
Agree 27 27,0 27,0 75,0
Strongly Agree 25 25,0 25,0 100,0
Total 100 100,0 100,0
Source : Data processing, 2018
Based on the table 4.39 showed that 6 respondent (6%) strongly
disagree, 18 respondents (18%) disagree, 24 respondents (24%) neutral,
27 respondent (27%) agree, and 25 respondents (25%) strongly agree. The
table results shown the majority of respondents agree that i am believe
against the internet service xl product.
Table 4.40
I would like to recommend to my friend for using the internet service XL
product
BL_4
Frequency Percent Valid Percent
Cumulative
Percent
Valid Strongly disagree 6 6,0 6,0 6,0
Disagree 16 16,0 16,0 22,0
Neutral 24 24,0 24,0 46,0
Agree 29 29,0 29,0 75,0
Strongly Agree 25 25,0 25,0 100,0
Total 100 100,0 100,0
Source : Data processing, 2018

xcviii
Based on the table 4.40 showed that 6 respondent (6%) strongly
disagree, 16 respondents (16%) disagree, 24 respondents (24%) neutral,
29 respondent (29%) agree, and 25 respondents (25%) strongly agree. The
table results shown the majority of respondents agree that i would like
recommend to my friend for using the internet service Xl product.
E. Path Analysis
1. Test Influence between Sub Variable
Dalam metode analisis jalur, untuk mencari hubungan kausal
variabel-variabel penelitian terlebih dahulu dihitung matriks kolerasi dari
variabel kualitas pelayanan, religiusitas, kepuasan nasabah, dan loyalitas
nasabah. Berikut ini adalah hasil penghitungan koefisien korelasi dengan
menggunakan software SPSS 22.0.
Table 4.41
Coeficient Correlation
Correlations
SQ BI PV CS BL
SQ Pearson Correlation 1 ,491** ,516** ,585** ,646**
Sig. (2-tailed) ,000 ,000 ,000 ,000
N 100 100 100 100 100
BI Pearson Correlation ,491** 1 ,430** ,528** ,579**
Sig. (2-tailed) ,000 ,000 ,000 ,000
N 100 100 100 100 100
PV Pearson Correlation ,516** ,430** 1 ,661** ,695**
Sig. (2-tailed) ,000 ,000 ,000 ,000
N 100 100 100 100 100
CS Pearson Correlation ,585** ,528** ,661** 1 ,964**
Sig. (2-tailed) ,000 ,000 ,000 ,000
N 100 100 100 100 100

xcix
BL Pearson Correlation ,646** ,579** ,695** ,964** 1
Sig. (2-tailed) ,000 ,000 ,000 ,000
N 100 100 100 100 100
**. Correlation is significant at the 0.01 level (2-tailed).
Source : Data processing, 2018
Based on the table above can be the value of the correlation
between variables. The correlation coefficient indicates that the
relationship between variables is positive. According to Sarwono
(2007:22) for the affinity relationship determination criteria based on :
> 0.00 – 0.25 = Very weak relationships
> 0.25 – 0.5 = Good relationship
> 0.5 – 0.75 = Strong relationship
> 0.75 – 1 = Very strong relationship
For further testing, then submitted the following hypothesis :
H0 : There is no correlations between two variables are significant
Ha : There is correlations between two variables are significant
This testing based probability test will be accepted if the significant
less than 0,05 so Ho rejected and if the significant greater than 0,05 so Ho
accepted.

c
Table 4.42
Testing of Relationship between Sub Variable
Relationship Coefisient
Corelation
Category Conclusion
Service quality (X1) with Brand
image (X2)
0.491 Good Significant
Service quality (X1) with
Perceived value (X3)
0.516 Strong Significant
Service quality (X1) with
Customer satisfaction (Y1)
0.585 Strong Significant
Service quality (X1) with Brand
Loyalty (Z)
0.646 Strong Significant
Brand Image (X2) with
Perceived value (X3)
0.430 Strong Significant
Brand Image (X2) with
Customer satisfaction (Y1)
0.528 Strong Significant
Brand Image (X2) with Brand
Loyalty (Z)
0.579 Strong Significant
Perceived value (X3) with
Customer satisfaction (Y1)
0.661 Strong Significant
Perceived value (X2) with
Brand loyalty (Z)
0.695 Strong Significant
Customer satisfaction (Y1) with
Brand loyalty (Z)
0.964 Very strong Significant
Source : Data processing, 2018
Based on the table above 4.42, all the relationship between three
varaibe have a significant relationship, because all of the value probability
less than 0,05.
2. Equation of Path Analysis Sub Structure I
In determining the effect of research variables as a whole obtained
the path coefficient of the sum of all exogenous variables to endogenous
variables. The value of path coefficient (base on estimate) service uality,
brand image and perceived value toward customer satisfaction is
processed by using software SPSS 23.0.

ci
Table 4.43
Coeficient of Path Analysis Structure I
Coefficientsa
Model
Unstandardized Coefficients
Standardized
Coefficients
t Sig. B Std. Error Beta
1 (Constant) ,758 1,086 ,699 ,487
Service Quality ,070 ,024 ,253 2,973 ,004
Brand Image ,196 ,074 ,215 2,664 ,009
Perceived Value ,320 ,060 ,437 5,320 ,000
a. Dependent Variable: Customer Satisfaction
Source : Data processing, 2018
Based on the table above 4.43, the path coefficient obtained is
ρy1x1X1 = 0.253, ρy1x2X2 = 0.215, ρy1x3X3 = 0.437. So, the equation of
path analysis as follows:
Y1 = ρy1x1X1 + ρy1x2X2 + ρy1x3X3 + ϵ1
Y1 = 0.253X1 + 0.215X2 + 0.437 X3 + ϵ1
To find the coefficient residual is with 1,00 – R square. So the
residual coefficien is: 1,00 – 0,551 = 0,449. After the residual coefficient
os obtained, the path equation as follows:
Y1 = 0.253X1 + 0.215X2 + 0.437 X3 + 0.449 ϵ1
3. Equation of Path Analysis Sub Structure II
In determining the effect of research variables as a whole obtained
the path coefficient of the sum of all exogenous variables to endogenous
variables. The value of path coefficient (base on estimate) service uality,
brand image and perceived value toward customer satisfaction is

cii
processed by using software SPSS 23.0.
Table 4.44
Coeficient of Path Analysis Structure II
Coefficientsa
Model
Unstandardized Coefficients
Standardized
Coefficients
t Sig. B Std. Error Beta
1 (Constant) -,933 ,464 -2,014 ,047
Service Quality ,042 ,012 ,111 3,583 ,001
Perceived Value ,079 ,034 ,078 2,347 ,021
Customer Satisfaction 1,164 ,048 ,847 24,012 ,000
a. Dependent Variable: Brand Loyalty
Source : Data processing, 2018
Based on the table above 4.44, the path coefficient obtained is
ρzx1X1 = 0.111, ρzx3X3 = 0.078, ρzy1Y1 = 0.847. So, the equation of path
analysis as follows:
Z = ρzx1X1 + ρzx3X3 + ρzy1Y1 + ϵ1
Y1 = 0.111X1 + 0.078X3 + 0.847 Y1 + ϵ1
To find the coefficient residual is with 1,00 – R square. So the
residual coefficien is: 1,00 – 0,942 = 0,058. After the residual coefficient
os obtained, the path equation as follows:
Y1 = 0.111X1 + 0.078X2 + 0.847 X3 + 0.058 ϵ1
4. Coefficient of Determination (R2)
a. Coefficient Determination of Sub-structure 1
Path model analysis is done with service quality (X1), brand image
(X2), perceived value (X3) against customer satisfaction (Y) for model 1.
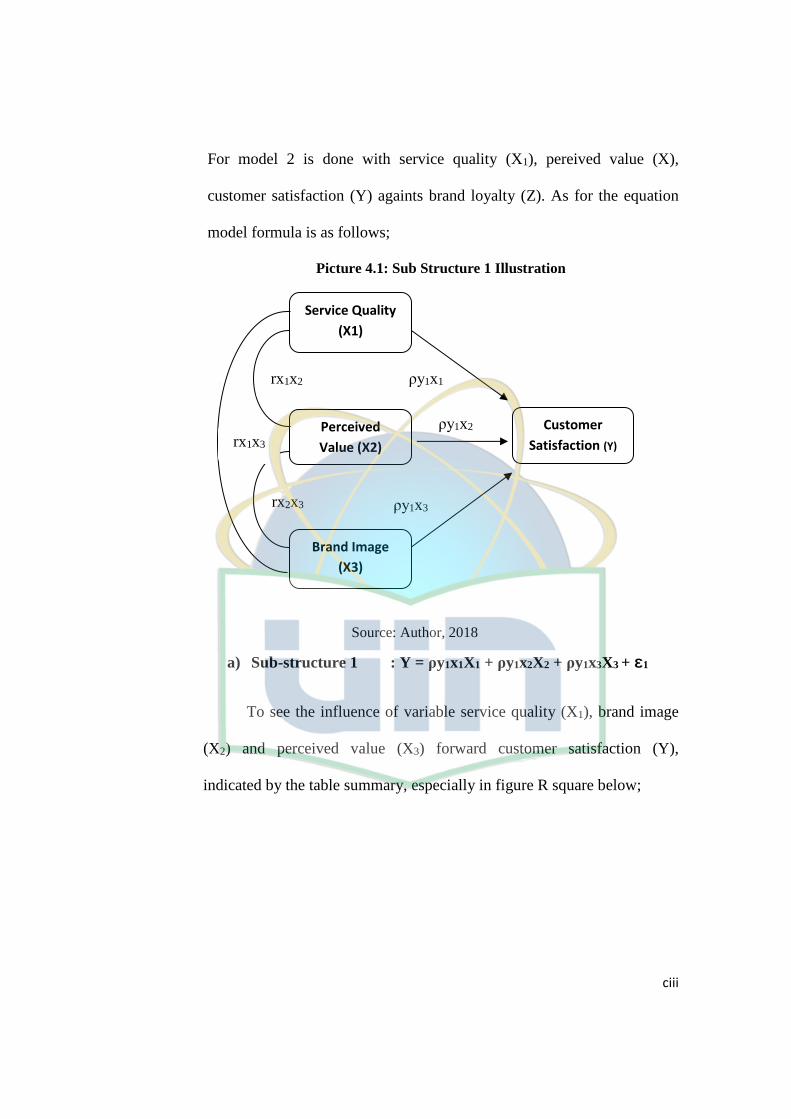
ciii
For model 2 is done with service quality (X1), pereived value (X),
customer satisfaction (Y) againts brand loyalty (Z). As for the equation
model formula is as follows;
Picture 4.1: Sub Structure 1 Illustration
Source: Author, 2018
a) Sub-structure 1 : Y = ρy1x1X1 + ρy1x2X2 + ρy1x3X3 + ɛ1
To see the influence of variable service quality (X1), brand image
(X2) and perceived value (X3) forward customer satisfaction (Y),
indicated by the table summary, especially in figure R square below;
rx2x3 ρy1x3
ρy1x1
Service Quality
(X1)
Customer
Satisfaction (Y)
Perceived
Value (X2)
Brand Image
(X3)
rx1x2
rx1x3 ρy1x2

civ
Table 4.45
Model Summaryb
Model R R Square Adjusted R
Square
Std. Error of the
Estimate
Durbin-Watson
1 .742a .551 .537 2.00706 1.888
a. Predictors: (Constant), X3, X2, X1
b. Dependent Variable: Y1
Source : Data proces sing, 2018
The magnitude number of R square is 0.551. this number is used to
see the magnitude of the influence that belongs to variable service quality,
brand image and perceived value towards customer satisfaction. The way
how to calculate the coefficient of determination by using formula;
KD = r2 x 100%
KD = 0.551 x 100%
KD = 55%
Based on the table above, the result of calculation using SPSS 21
program can be seen the adjusted R square is 0.551. it means 55%
exogenous variable service quality (X1), brand image (X2), and perceived
value (X3) to customer satisfaction (Y) as endogenous variable. While the
remainder (100% - 55% = 45 %) are affected by other variable or factors
outside this model. The probability customer satisfaction can be explained
by 55% by variables service quality, brand image and perceived value.

cv
b. Coefficient Determination of Sub-structure 2
Path model analysis done with service quality (X1), perceived
value (X3) forward customer satisfaction (Y) for model 1. For model 2
done with service quality (X1), perceived value (X3), customer
satisfaction (Y) forward brand loyalty (Z). As for the equation model
formula is as follows;
Picture 4.2: Sub Structure 1 Illustration
Source: Author, 2018
b) Sub-structure 2 : Z = ρzx1X1 + ρzx3X3 + ρzy1Y1 + ɛ2
To see the influence of variable service quality (X1), perceived
value (X3) forward customer satisfaction (Y) on brand loyalty (Z)
indicated by the table summary, especially in figure R square below;
Table 4.46
Model Summary
rx2x3 ρy1x3
ρy1x1
ρzy1
Service Quality
(X1)
Brand Loyalty
(Z)
Customer
Satisfaction (Y1)
Perceived
Value (X2)
Brand Image
(X3)
rx1x2
rx1x3 ρy1x2
ρzx1
ρzx3
ɛ1 ɛ2

cvi
Model R R Square
Adjusted R
Square
Std. Error of the
Estimate
1 ,971a ,942 ,941 ,988
a. Predictors: (Constant), Customer Satisfaction, Service Quality,
Perceived Value
Source : Data processing, 2018
The magnitude number of R square is 0.942. this number is used to
see the magnitude of the influence that belongs to variables service
quality, perceived value and customer satisfaction to brand loyalty. The
way how to calculate the coefficient of determination by using formula;
KD = r2 x 100%
KD = 0.942 x 100%
KD = 94%
Based on the table above, the result of calculation using SPSS 21
program can be seen the adjusted R square is 0.942. it means 94%
exogenous variable service quality (X1), perceived value (X3) and
customer satisfaction (Y) effect brand loyalty (Z) as endogenous variable.
While the remainder (100% - 94% = 6%) are affected by other variables
of factors outside this model. The probability brand loyalty can be
explained by 94% by variable service quality, perceived value and
customer satisfaction.
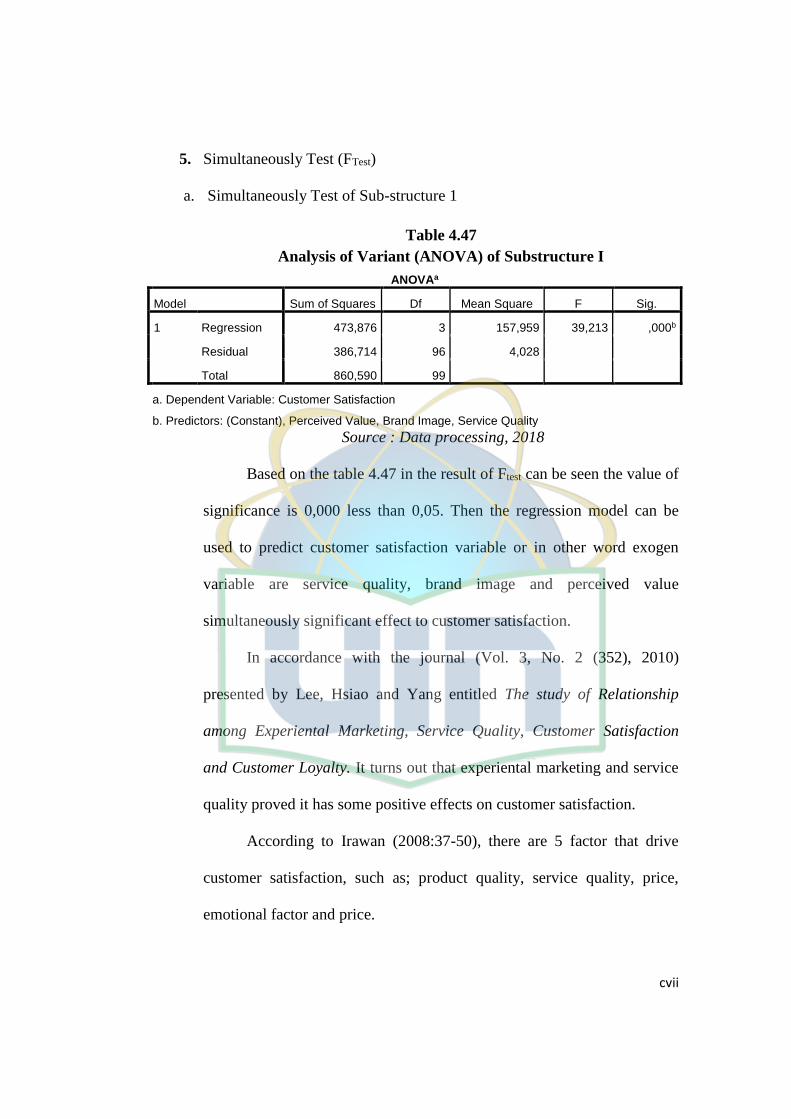
cvii
5. Simultaneously Test (FTest)
a. Simultaneously Test of Sub-structure 1
Table 4.47
Analysis of Variant (ANOVA) of Substructure I
ANOVAa
Model Sum of Squares Df Mean Square F Sig.
1 Regression 473,876 3 157,959 39,213 ,000b
Residual 386,714 96 4,028
Total 860,590 99
a. Dependent Variable: Customer Satisfaction
b. Predictors: (Constant), Perceived Value, Brand Image, Service Quality
Source : Data processing, 2018
Based on the table 4.47 in the result of Ftest can be seen the value of
significance is 0,000 less than 0,05. Then the regression model can be
used to predict customer satisfaction variable or in other word exogen
variable are service quality, brand image and perceived value
simultaneously significant effect to customer satisfaction.
In accordance with the journal (Vol. 3, No. 2 (352), 2010)
presented by Lee, Hsiao and Yang entitled The study of Relationship
among Experiental Marketing, Service Quality, Customer Satisfaction
and Customer Loyalty. It turns out that experiental marketing and service
quality proved it has some positive effects on customer satisfaction.
According to Irawan (2008:37-50), there are 5 factor that drive
customer satisfaction, such as; product quality, service quality, price,
emotional factor and price.
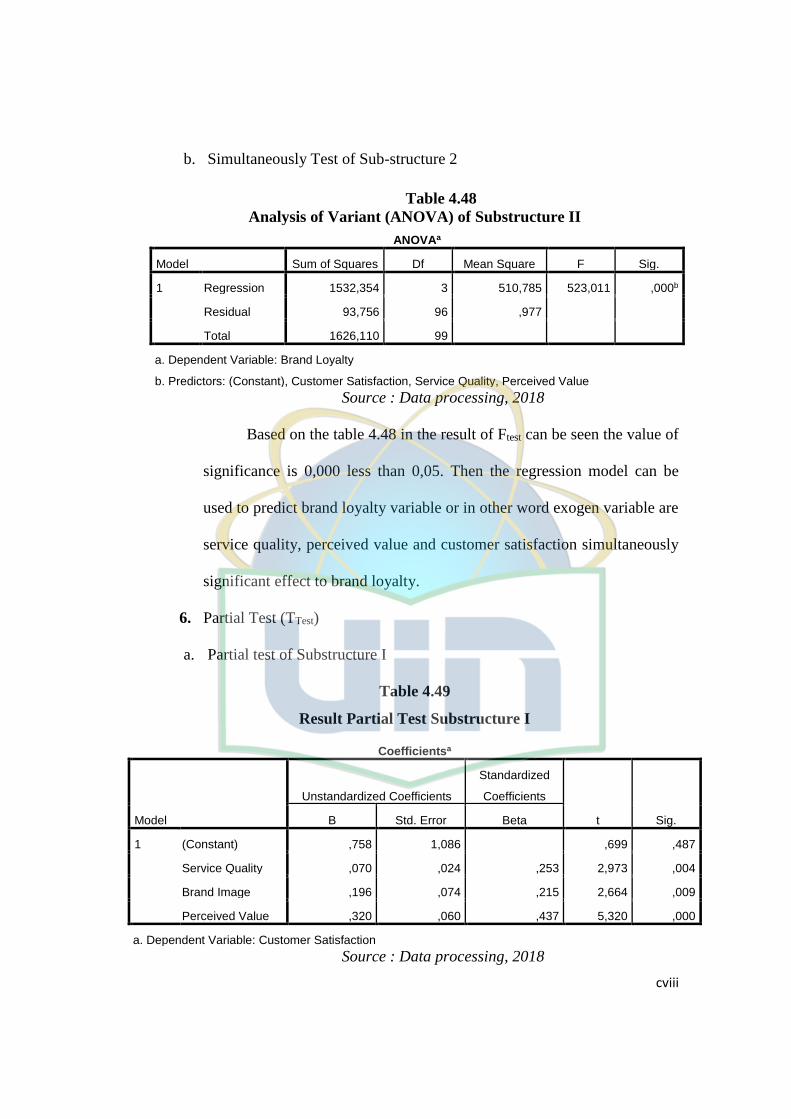
cviii
b. Simultaneously Test of Sub-structure 2
Table 4.48
Analysis of Variant (ANOVA) of Substructure II
ANOVAa
Model Sum of Squares Df Mean Square F Sig.
1 Regression 1532,354 3 510,785 523,011 ,000b
Residual 93,756 96 ,977
Total 1626,110 99
a. Dependent Variable: Brand Loyalty
b. Predictors: (Constant), Customer Satisfaction, Service Quality, Perceived Value
Source : Data processing, 2018
Based on the table 4.48 in the result of Ftest can be seen the value of
significance is 0,000 less than 0,05. Then the regression model can be
used to predict brand loyalty variable or in other word exogen variable are
service quality, perceived value and customer satisfaction simultaneously
significant effect to brand loyalty.
6. Partial Test (TTest)
a. Partial test of Substructure I
Table 4.49
Result Partial Test Substructure I
Coefficientsa
Model
Unstandardized Coefficients
Standardized
Coefficients
t Sig. B Std. Error Beta
1 (Constant) ,758 1,086 ,699 ,487
Service Quality ,070 ,024 ,253 2,973 ,004
Brand Image ,196 ,074 ,215 2,664 ,009
Perceived Value ,320 ,060 ,437 5,320 ,000
a. Dependent Variable: Customer Satisfaction
Source : Data processing, 2018

cix
This is the result to test;
a) Test the influence of service quality (X1) to customer satisfaction
(Y1)
In the variable service quality the value of significance is 0,004
less than 0,05. So the hypothesis, there is influence between
service quality with customer satisfaction (Ha accepted and Ho
rejected). Means, there is a significant influence between service
quality to customer satisfaction partially.
The result from this research was accordance with previous
research Santouridis and Trivellas (2010) with the title
“Investigating the impact of service quality and customer
satisfaction on brand loyalty in mobile telephone on Greece”. The
result of this research was indicated service quality has significant
influence to customer satisfaction.
b) Test the influence of brand image (X2) to customer satisfaction
(Y1)
In the variable brand image the value of significance is 0,009 less
than 0,05. So the hypothesis, there is influence between brand
image with customer satisfaction (Ha accepted and Ho rejected).
Means, there is a significant influence between brand image to
customer satisfaction partially.
The result of this research was accordance with previous

cx
research of Thakur and Singh (2012) with the title “Brand Image,
Customer Satisfaction, and Loyalty Intention : A study in Context
of cosmetic product among the people of central india”. The result
of this research was indicated brand image has influence to
customer satisfaction.
c) Test the influence of perceived value (X3) to customer satisfaction
(Y1)
In the variable perceived value the value of significance is 0,000
less than 0,05. So the hypothesis, there is influence between
perceived value with customer satisfaction (Ha accepted and Ho
rejected). Means, there is a significant influence between
perceived value to customer satisfaction partially.
Table 4.50
Partial Test
The Influence of Service Quality, Brand Image and Perceived Value to
Customer Satisfaction
Hypothesis Relation
between
variable
Coefficient
Sig value Conclusion
ρx1y1X1 ≠ 0 𝑋1 to 𝑌1 0.253 0.004 Ho rejected
ρx2y1X2 ≠ 0 𝑋2 to 𝑌1 0.215 0.009 Ho rejected
ρx3y1X3 ≠ 0 𝑋3 to 𝑌1 0.473 0.000 Ho rejected
Source : Data processing, 2018
Furthermore, illustration of test result path analysis for the
substructure I can be described as follows:
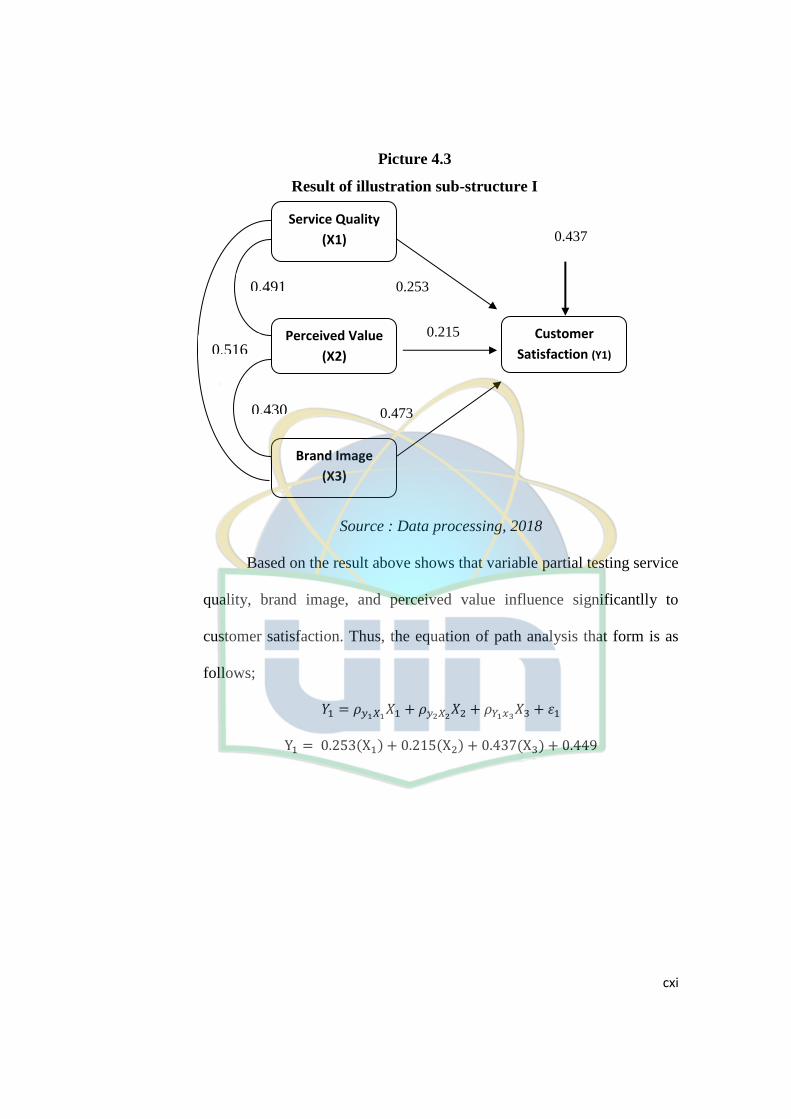
cxi
Picture 4.3
Result of illustration sub-structure I
Source : Data processing, 2018
Based on the result above shows that variable partial testing service
quality, brand image, and perceived value influence significantlly to
customer satisfaction. Thus, the equation of path analysis that form is as
follows;
𝑌1 = 𝜌𝑦1𝑋1𝑋1 + 𝜌𝑦2𝑋2
𝑋2 + 𝜌𝑌1𝑥3𝑋3 + 𝜀1
Y1 = 0.253(X1) + 0.215(X2) + 0.437(X3) + 0.449
0.430 0.473
0.253
Service Quality
(X1)
Customer
Satisfaction (Y1)
Perceived Value
(X2)
Brand Image
(X3)
0.491
0.516
0.215
0.437

cxii
b. Partial test of Substructure II
Table 4.51
Result Partial Test Substructure II
Coefficientsa
Model
Unstandardized Coefficients
Standardized
Coefficients
T Sig. B Std. Error Beta
1 (Constant) -,933 ,464 -2,014 ,047
Service Quality ,042 ,012 ,111 3,583 ,001
Perceived Value ,079 ,034 ,078 2,347 ,021
Customer Satisfaction 1,164 ,048 ,847 24,012 ,000
a. Dependent Variable: Brand Loyalty
Source : Data processing, 2018
This is the result to test;
a) Test the influence of service quality (X1) to brand loyalty (Z)
In the variable service quality the value of significance is 0,001
less than 0,05. So the hypothesis, there is influence between
service quality with brand loyalty (Ha accepted and Ho rejected).
Means, there is a significant influence between service quality to
brand loyalty partially.
b) Test the influence of perceived value (X3) to brand loyalty (Z)
In the variable perceived value the value of significance is 0,021
less than 0,05. So the hypothesis, there is influence between
perceived value with brand loyalty (Ha accepted and Ho rejected).
Means, there is a significant influence between perceived value to
brand loyalty partially.
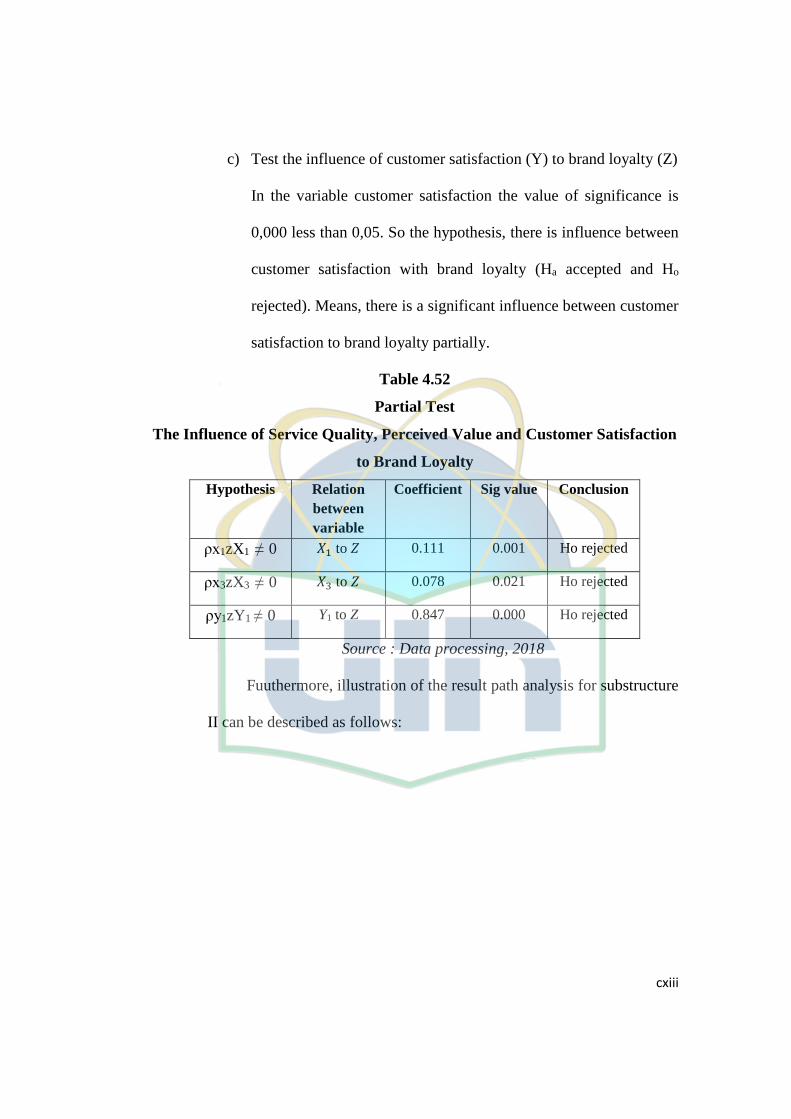
cxiii
c) Test the influence of customer satisfaction (Y) to brand loyalty (Z)
In the variable customer satisfaction the value of significance is
0,000 less than 0,05. So the hypothesis, there is influence between
customer satisfaction with brand loyalty (Ha accepted and Ho
rejected). Means, there is a significant influence between customer
satisfaction to brand loyalty partially.
Table 4.52
Partial Test
The Influence of Service Quality, Perceived Value and Customer Satisfaction
to Brand Loyalty
Hypothesis Relation
between
variable
Coefficient
Sig value Conclusion
ρx1zX1 ≠ 0 𝑋1 to 𝑍 0.111 0.001 Ho rejected
ρx3zX3 ≠ 0 𝑋3 to 𝑍 0.078 0.021 Ho rejected
ρy1zY1 ≠ 0 Y1 to Z 0.847 0.000 Ho rejected
Source : Data processing, 2018
Fuuthermore, illustration of the result path analysis for substructure
II can be described as follows:
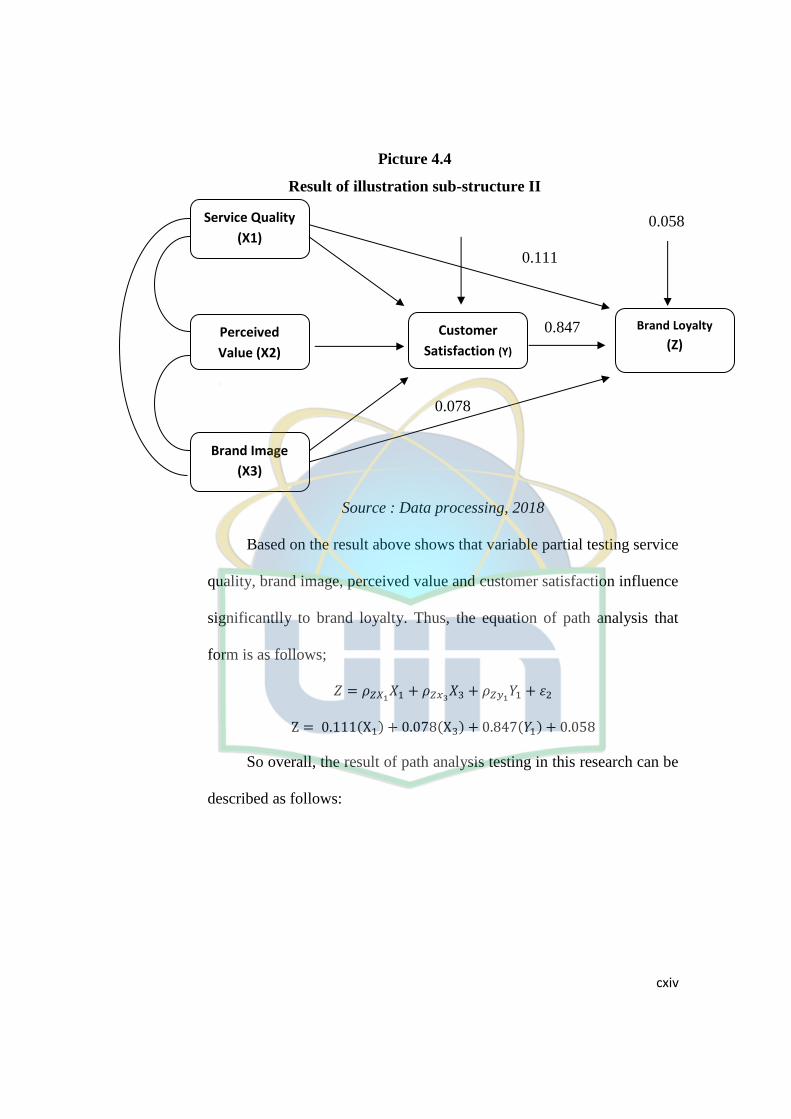
cxiv
Picture 4.4
Result of illustration sub-structure II
Source : Data processing, 2018
Based on the result above shows that variable partial testing service
quality, brand image, perceived value and customer satisfaction influence
significantlly to brand loyalty. Thus, the equation of path analysis that
form is as follows;
𝑍 = 𝜌𝑍𝑋1𝑋1 + 𝜌𝑍𝑥3
𝑋3 + 𝜌𝑍𝑦1𝑌1 + 𝜀2
Z = 0.111(X1) + 0.078(X3) + 0.847(𝑌1) + 0.058
So overall, the result of path analysis testing in this research can be
described as follows:
0.847
Service Quality
(X1)
Brand Loyalty
(Z) Customer
Satisfaction (Y)
Perceived
Value (X2)
Brand Image
(X3)
0.111
0.078
0.058

cxv
Picture 4.5
Result of Path Analysis Diagram
Source : Data processing, 2018
7. Influence Calculation
a. Direct Effect
For the calculation of direct effect, used formulas as follows:
1) The influence of variable service quality to customer
satisfaction (X1 to Y1 = 0.253)
2) The influence of variable brand image to customer satisfaction
(X2 to Y1 = 0.215)
3) The influence of variable perceived value to customer
satisfaction (X3 to Y1 = 0.473)
4) The influence of variable service quality to brand loyalty (X1
to Z = 0.111)
5) The influence of variable perceived value to brand loyalty (X3
0.430 0.473
0.253
0.847
Service Quality
(X1)
Brand Loyalty
(Y2)
Customer
Satisfaction (Y1)
Perceived
Value (X2)
Brand Image
(X3)
0.491
0.516 0.215
0.111
0.078
0.449 0.058

cxvi
to Z = 0.078)
b. Indirect Effect
For the calculation of indirect effect, used formula as follows:
1) The influence of service quality to brand loyalty through
customer satisfaction (0.253 x 0.847 = 0.214)
2) The influence of variable brand image to brand loyalty through
customer satisfaction (0.215 x 0.847 = 0.182)
3) The influence of variable perceived value to brand loyalty
through customer satisfaction (0.437 x 0.847 = 0.400)
c. Total Effect
1) The influence of variable service quality to brand loyalty
through customer satisfaction (0.253 + 0.847 = 1.1)
2) The influence of variable perceived value to brand loyalty
through customer saatisfaction (0.437 + 0.847 = 1.284)
8. Sobel Test
Sobel test is performed to calculate whether the intervening
variable in this case is customer satisfaction, able to be an instrument of
mediation independent variable and dependent variable.
As for the result of the calculation as follows;
a. The influence of service quality (X1) to brand loyalty (Z) through
customer satisfaction (Y).
Hypothesis :

cxvii
H0 : there is indirect relationship between service quality to brand
loyalty through customer satisfaction
Ha : there is direct relatioship between service quality to brand
loyalty through customer satisfaction
Where;
Z sobel = 𝑎𝑏
√(𝑏2𝑆𝐸𝑎2)+(𝑎2𝑆𝐸𝑏
2)
Z sobel = 0.253 𝑥 0.826
√(826)2 x 0.049 + (0.253)2 x 0.024)
Z sobel = 8.937 and Ttable = 1.96
Because the value tcount > ttable (8.937 > 1.96), so the conclusion is
H0 rejected and Ha accepted. So it can be concluded that there is
direct relationship between service quality to brand loyalty through
customer satisfaction.
b. The influence of perceived value (X3) to brand loyalty (Z) through
customer satisfaction (Y).
Hypothesis :
H0 : there is indirect relationship between perceived value to brand
loyalty through customer satisfaction
Ha : there is direct relationship between perceived value to brand
loyalty through customer satisfaction.
Where :
Z sobel = 𝑎𝑏
√(𝑏2𝑆𝐸𝑎2)+(𝑎2𝑆𝐸𝑏
2)
Z sobel = 0.320 𝑥 0.826
√(826)2 x 0.060 + (0.320)2 x 0.024)

cxviii
Z sobel = 5.084 and Ttable 1.96
Because the value tcount > ttable (5.084 > 1.96), so the conclusion is
H0 rejected and Ha accepted. So it can be concluded that there is
direct relationship between perceived value to brand loyalty
through customer satisfaction.
cxix
CHAPTER V
CONCLUSION AND SUGGESTION
A. Conclusions
Based on the results of analysis and discussion in the previous chapter then
obtained conclusions regarding, the influence of service quality, brand image,
and perceived value to customer satisfaction that impacts to brand loyalty.
These conclusions include are :
1. There is a direct relationship between service quality (X1) to customer
satisfaction (Y) in the amount of 0.253
2. There is a direct relationship between brand image (X2) to customer
satisfaction (Y) in the amount of 0.215.
3. There is a direct relationship between perceived value (X3) to customer
satisfaction (Y) in the amount of 0.473.
4. There is a diret relationship between service quality (X1) to brand
loyalty (Z) in the amount of 0.111.
5. There is a direct relationship between perceived value (X3) to brand
loyalty (Z) in the amount of 0.078.
6. Customer satisfaction (Y) has a significant influence to brand loyalty
(Z) in the amount of 0.847
7. Customer satisfaction (Y) mediate significantly influence of service
quality (X1) to brand loyalty (Z)
8. Customer satisfaction (Y) mediate significantly influence of perceived
value (X3) to brand loyalty (Z)
9. There are 0.449 factors that influence of customer satisfaction (Y),
0.058 factors that influence of brand loyalty (Z) beyond this research,

cxx
where is an example of another factor like brand equity, service
quality, product quality¸ after sales service, and so forth.
B. Suggestion
Based on the results of the analysis and the conclusions above, obtained
some of the implications of the results of this research, such as:
1. For company
a. Service Quality
Service is the one important things part in one company. Good
company always gives best services to customer and not only on how
we treat customer but also we assessed the facility or provide a good
atmosphere to the customer. In this research service quality has
significant influence on customer satisfaction. Based on the
respondents answer, there are several sector that XL Cooperative has
to repair the performance such as accurate, services, trust of employee,
empathy and tangible. After XL repair those sector, they need to
combine with other sector. So that, XL will improve their service
quality and the benefit is the consumer can be more loyal.
b. Brand Image
Image is one of important thing for brand, because image it likes
identity. The customer will see a good brand from image reputation.
In this conclusion, brand image has influence customer satisfaction.
XL has to think creative in checking the product quality, because the

cxxi
customer will see the quality first before they purchase the product.
Here, XL has to concern in order to get customer interesting.
c. Perceived Value
Perceived value is one of important thing for XL to maintain the
customer, because perceived values is like the identity of XL in sector
or fair price, value for money and brand reputation to compete with
anther brand. In this conclusion, perceived value has influence
customer satisfaction. Based on the respondent answer, there are
several factor sector that XL has to repair the value of XL, such as fair
price, value for money. After XL repair those sector, they can compete
with other competitor in sector of price.
d. Customer Satisfaction
Satisfaction is a factor to make a customer repurchases the product
and as one factor makes a customer loyal to the brand or product. In
this research, satisfaction of customer XL gives influence significantly
to brand loyalty. Customer satisfaction in this research gets from
service quality, brand image and perceived value. Here, customer
value and customer responses is a main factor. But, XL has to keep
the customer perception because the all customer like to give the
complaint to the XL
e. Brand Loyalty
Brand loyalty is last factor in measuring service quality, brand image,

cxxii
percceived value and customer satisfaction. In this research, brand
loyalty of XL gets from service quality, brand image and customer
satisfaction. It means, brand loyalty of XL can be affected by three
factors which is service quality, brand image and customer
satisfaction. Affective loyalty, conative loyalty and action loyalty are
main sector to be repaired, So XL Cooperative need to keep maintain
the product quality and brand of XL.
C. For Academics and Researcher
This research is expected to be one of the references in providing a new
information for students in the writing of scientific papers. And other
researchers can increase the amount of research data more, so it will produce
better data again.

cxxiii
REFERENCES
Aaker David A. “Managing Brand Equity, Capitalizing on the Value of a Brand
Name”, The Free Press, New York. 1991.
_______, “Building Strong Brands”. 1st Edition, The Free Press: New York.
1996.
Aryani, Dwi and Febrian Rosinta. “The influence of Service Quality toward
Customer Satisfaction in Shipping Customer Loyalty”, Journal,
Indonesia, 2010.
Blech, George and Michel A. Blech. “Advertising and Promotion an Integrated
Marketing Communications Perspective”. Eight edition. Mc Graw-Hill.
USA, 2009.
Fandy Tjitono. “Pemasaran Jasa”. Cetakan ke Tiga. Bayumedia Publishing.
Indonesia, 2007.
Hamid, Abdul, “Buku Panduan Penulisan Skripsi”, Cetakan Pertama, FEIS UIN
Press, Jakarta, 2007
Gede Riana, “Pengaruh Trust in a Brand terhadap Brand Loyalty pada Konsumen
Air Minum AQUA di Kota Denpasar”, BULETIN STUDI EKONOMI,
Vol.13 No. 2. 2008.
Ghozali, Imam. “Aplikasi Analisis Multivariate dengan Program SPSS”, BP
Undip, Semarang, 2011.
Kotler, Phillip and Kevin Lane Keller. “Manajemen Pemasaran”. 13 Edition.
Pearson. USA, 2009.
_______, “Marketing Management”. Pearson Edition. USA, 2012.
Keller, Kevin Lane “Strategic Brand Management”. Pearson Education. New
Jersey, 2008
Lee, Ming-Shing, Hsiao, Huey-Der dan Yang, Ming-Fen. “The Study Of The
Relationship Among Experiential Marketing, Service Quality, Customer
Satisfaction, And Customer Loyalty, International Journal of
Organizational Innovation, Vol. 3, No. 2 (352), 2010
Lovelock, Christopher., dkk, “Pemasaran Jasa Manusia, Teknologi, Strategi

cxxiv
Perspektif Indonesia”, Jilid 2, Erlangga, Jakarta, 2011.
Lovelock, Christopher & Jochen Wirtz, “Services Marketing. Peoples,
Technology, Strategy”, 7th edition, Pearson Education Limited,
England, 2011. Pada jurnal Christian Victor., dkk, 2015.
Malhotra, Naresh K. “Marketing Research” Fourth Edition. Pearson. Prentince
Hall. 2004.
Nugroho, Novemy Triyandari, “Pengaruh Kualitas Pelayanan Terhadap
Kepuasan dan Loyalitas Pelanggan (Survey pada Pelanggan Speedy
Telkom di Kota Surakarta)”, Jurnal Paradigma Vol. 12 No. 02, Agustus
2014 – Januari 2015, 2014.
Putri, Resita Widya., dkk, “Pengaruh Kualitas Pelayanan Terhadap Kepuasan
dan Loyalitas Pelanggan (Survey Pada Pelanggan Auto2000 Waru
Surabaya)”, Jurnal Administrasi Bisnis (JAB), Vol.1 No. 1 Januari
2015, Universitas Brawijaya Malang, 2015.
Rangkuti, Freddy. “Measuring Customer satisfaction” PT. Gramedia Pustaka
Utama, Jakarta, 2003.
Riduwan, and Engkos A.K. “Cara Menggunakan dan Memakai Analisis Jalur atau
Path Analysis”. Alfabeta. Bandung, 2007.
Rizwanalam, Mohammed. “Branding Through Green Marketing: A Qualitative
Approach”. International Journal, Vol. 3, 2013.
Sandjojo, Nidjo, “Metode Analisis Jalur dan Aplikasinya Edisi Revisi”, Fakultas
Ilmu Komputer Universitas Pembangunan Nasional “Veteran”, Jakarta,
2014.
Sarwono, Jonathan. “Analisa Jalur untuk Riset Bisnis dengan SPSS”, CV ANDI
OFFSET, Yogyakarta, 2007.
Sugiyono. “Metode Penelitian Bisnis (Pendekatan Kualitatif, Kuantitatif dan
R&D)”. Cetakan kedua belas. Alphabet, Jakarta, 2008
_______, “Metode Penelitian Kuantitatif Kualitatif dan R&D”, Penerbit AlfaBeta,
Bandung, 2014.
Tjiptono, Fandy, “Strategy Pemasaran”, Edisi III, Penerbit ANDI, Yogyakarta,
2008.
_______, Fandy, “Pemasaran Jasa: Prinsip, Penerapan, Penelitian”, Penerbit
ANDI, Yogyakarta, 2014.

cxxv
_______, Fandy & Gregorius Chandra, “Service, Quality, & Satisfaction”, Edisi
III, Penerbit ANDI, Yogyakarta, 2011.
Zeithaml, Valarie A, Mary Jo Bitner and Dwayne D Gremler. “Services
Marketing Integrating Customer Focus Across the Firm”. Fourth
Edition. McGraw-Hill, New York, 2006.
http://www.xl.co.id
https://xlaxiata.co.id/id
cxxvi
Attachments I : Research Questioner
RESEARCH QUESTIONER
THE INFLUENCE OF SERVICE QUALITY, BRAND IMAGE, AND
PERCEIVED VALUE TOWARD CUSTOMER SATISFACTION THAT
EFFECT ON BRAND LOYALTY
(Case Study on Internet User of XL)
Regarding to finish the program of Bachelor Degree Faculty Economics
and Business Syarif Hidayatullah State Islamic University Jakarta, who is writing
this thesis as a requirement to get Bachelor Degree of Economic :
Name : Uji Abu Tholib
NIM : 111108120005
Major : Management
Faculty: Economics and Business
I will do research about “THE INFLUENCE OF SERVICE QUALITY,
BRAND IMAGE TOWARD AND PERCCEIVED VALUE TOWARDS
CUSTOMER SATISFACTION THAT EFFECT ON BRAND LOYALTY
(Case Study on Internet User of XL)”. Therefore, I wish Mr/Mrs/Brother/Sister
are willing to fill out this questioner.
cxxvii
Screening
Before completing the questionnaire please the willingness of
Mr/Mrs/Brother/Sister to complete the checklist by marking a cross (√) in the
appropriate boxes below :
1. Do you use Internet Provider XL?
Yes No
If Yes, please proceed to the next statement.
If Not, please stop answering and stop here. Thank you for participation.
Respondent Identity
Name : ……………………………
Gender : 1. Male 2. Female
Age : 1. < 19 years 4. 51 – 65 years
2. 20 – 35 years 5. > 65 years
3. 36 – 50 years
Occupation : 1. Civil Servants 4. Students
2. Private Employee 5. Others (………)
3. Entrepreneur
Expenditure per Month: 1. < Rp 499.999
2. Rp 500.000 – Rp 999.999
3. Rp 1.000.000 – Rp 1.499.999
4. Rp 1.500.000 – Rp 1.999.999
5. > Rp 2.000.000
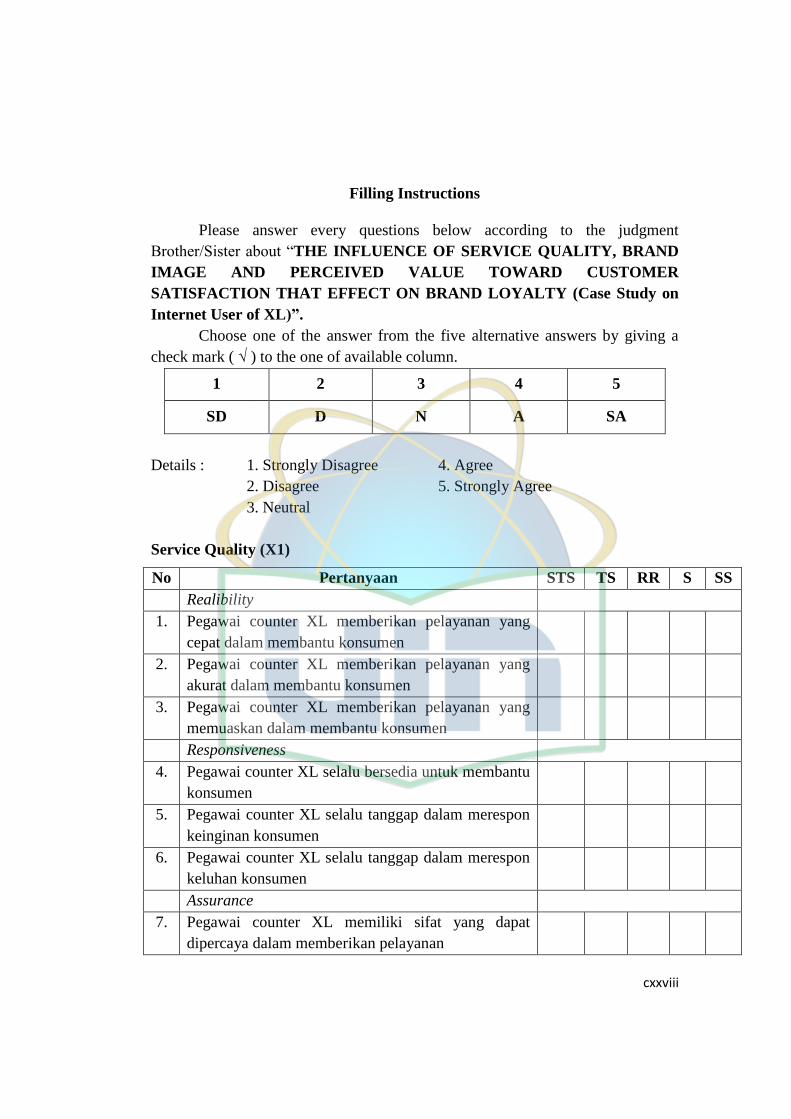
cxxviii
Filling Instructions
Please answer every questions below according to the judgment
Brother/Sister about “THE INFLUENCE OF SERVICE QUALITY, BRAND
IMAGE AND PERCEIVED VALUE TOWARD CUSTOMER
SATISFACTION THAT EFFECT ON BRAND LOYALTY (Case Study on
Internet User of XL)”.
Choose one of the answer from the five alternative answers by giving a
check mark ( √ ) to the one of available column.
1 2 3 4 5
SD D N A SA
Details : 1. Strongly Disagree 4. Agree
2. Disagree 5. Strongly Agree
3. Neutral
Service Quality (X1)
No Pertanyaan STS TS RR S SS
Realibility
1. Pegawai counter XL memberikan pelayanan yang
cepat dalam membantu konsumen
2. Pegawai counter XL memberikan pelayanan yang
akurat dalam membantu konsumen
3. Pegawai counter XL memberikan pelayanan yang
memuaskan dalam membantu konsumen
Responsiveness
4. Pegawai counter XL selalu bersedia untuk membantu
konsumen
5. Pegawai counter XL selalu tanggap dalam merespon
keinginan konsumen
6. Pegawai counter XL selalu tanggap dalam merespon
keluhan konsumen
Assurance
7. Pegawai counter XL memiliki sifat yang dapat
dipercaya dalam memberikan pelayanan

cxxix
8. Pegawai counter XL selalu sopan dalam melayani
konsumen
9. Pegawai counter XL memiliki pengetahuan dalam
memberikan informasi tentang layanan internet XL
Emphaty
10 Pegawai counter XL mampu memahami masalah dan
kebutuhan konsumen
11. Pegawai counter XL mengutamakan perhatian
konsumen
Tangible
12. Fasilitas pada counter XL terlihat bersih dan menarik
13. Tata letak ruangan dan peralatan counter XL modern
14. Pegawai counter XL berpenampilan rapi dan
profesional
Citra Merek (X2)
No Pertanyaan STS TS RR S SS
Strengthens
1. XL memiliki sinyal internet yang kuat
Favorable
2. Merek XL mudah diucapkan
3. Merek XL mudah diingat
Uniqueness
4. Paket layanan internet XL berbeda dari yang lain
5. Paket layanan internet XL bervariasi
Perceived Value (X3)
No Pertanyaan STS TS RR S SS
1. Harga yang ditawarkan sesuai dengan layanan
internet XL yang diberikan
2. Reputasi merek XL baik
3. Harga produk internet XL sesuai dengan manfaat
yang saya harapkan pada saat menggunakannya
4. Tarif produk XL sebanding dengan layanan diberikan
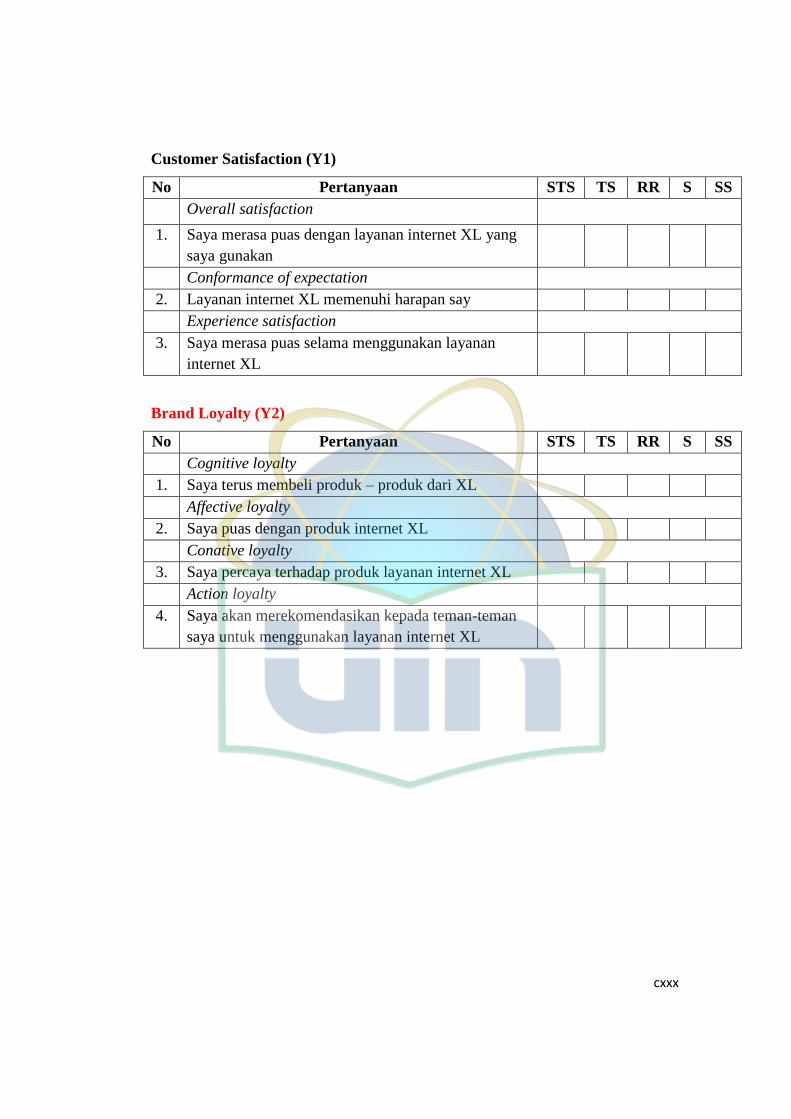
cxxx
Customer Satisfaction (Y1)
No Pertanyaan STS TS RR S SS
Overall satisfaction
1. Saya merasa puas dengan layanan internet XL yang
saya gunakan
Conformance of expectation
2. Layanan internet XL memenuhi harapan say
Experience satisfaction
3. Saya merasa puas selama menggunakan layanan
internet XL
Brand Loyalty (Y2)
No Pertanyaan STS TS RR S SS
Cognitive loyalty
1. Saya terus membeli produk – produk dari XL
Affective loyalty
2. Saya puas dengan produk internet XL
Conative loyalty
3. Saya percaya terhadap produk layanan internet XL
Action loyalty
4. Saya akan merekomendasikan kepada teman-teman
saya untuk menggunakan layanan internet XL

cxxxi
Attachments II : Result of Output SPSS 23 for Windows
A. Distribution Answer of Respondents
NO Service Quality (X1)
P1 P2 P3 P4 P5 P6 P7 P8 P9 P10 P11 P12 P13 P14
1 3 4 4 3 4 4 3 4 4 3 4 4 4 3
2 4 4 4 4 4 4 4 4 4 4 4 4 4 4
3 2 3 3 2 3 5 4 5 5 5 5 3 4 4
4 2 2 3 2 2 3 2 2 3 2 2 3 3 2
5 4 4 4 4 4 4 4 4 4 4 4 4 4 4
6 4 4 4 4 4 4 4 4 4 4 4 4 4 4
7 4 4 4 4 4 4 4 4 4 4 4 4 4 4
8 2 2 2 2 2 2 2 2 2 2 2 2 2 2
9 2 3 3 2 3 3 2 3 3 2 3 3 3 2
10 4 4 4 4 4 4 4 4 4 4 4 4 4 4
11 2 2 3 2 2 3 2 2 3 2 2 3 3 2
12 2 2 1 2 2 1 2 2 1 2 2 1 1 2
13 3 2 2 3 2 2 3 2 2 3 2 2 2 3
14 4 4 4 4 4 4 4 4 4 4 4 4 4 4
15 4 4 4 4 4 4 4 4 4 4 4 4 4 4
16 4 4 4 4 4 4 4 4 4 4 4 4 4 4
17 1 2 3 1 2 3 1 2 3 1 2 3 3 1
18 4 4 4 4 4 4 4 4 4 4 4 4 4 4
19 3 3 5 3 3 3 5 5 5 3 5 5 5 5
20 3 4 4 3 4 4 3 4 4 3 4 4 4 3
21 4 3 4 4 3 4 4 3 4 4 3 4 4 4
22 4 4 3 4 4 3 4 4 3 4 4 3 3 4
23 3 3 3 3 3 3 3 3 3 3 3 3 3 3
24 4 4 4 4 4 4 4 4 4 4 4 4 4 4
25 2 3 2 2 3 2 2 3 2 2 3 2 2 2
26 4 4 4 4 4 4 4 4 4 4 4 4 4 4
27 3 3 3 3 3 3 3 3 3 3 3 3 3 3
28 3 2 3 3 2 3 3 2 3 3 2 3 3 3
29 3 3 2 3 3 2 3 3 2 3 3 2 2 3
30 2 2 3 2 3 3 2 3 4 3 2 3 4 3
31 4 4 4 4 4 2 3 2 3 2 3 4 3 5
32 4 4 4 4 4 4 4 3 4 5 4 3 5 4
33 4 4 5 5 4 3 5 4 4 4 4 4 4 4
34 4 4 4 4 4 4 4 4 4 4 4 4 4 4
35 2 2 3 2 2 3 2 2 3 2 2 3 3 2
36 4 4 4 3 2 2 3 3 5 5 4 5 5 4
37 4 3 4 3 2 4 3 4 5 4 5 5 4 5
38 4 3 3 4 5 4 5 4 4 4 4 4 4 4

cxxxii
39 4 4 4 4 4 5 4 3 3 4 5 4 4 4
40 4 4 4 4 4 4 4 4 4 4 4 4 4 4
41 4 4 4 4 4 4 4 4 4 4 4 4 4 4
42 3 4 4 3 4 4 3 4 4 3 4 4 4 3
43 2 2 2 2 2 2 2 2 2 2 2 2 2 2
44 2 1 2 2 2 2 3 2 3 2 2 1 1 2
45 3 2 3 2 2 2 2 3 3 2 1 2 3 2
46 3 2 5 5 5 5 5 2 5 3 5 2 5 5
47 2 2 1 2 2 1 2 2 1 2 2 1 1 2
48 2 2 2 2 2 2 2 2 2 2 2 2 2 2
49 2 1 3 2 1 3 2 1 3 2 1 3 3 2
50 2 5 5 5 3 5 2 5 5 2 5 3 5 2
51 3 3 2 3 5 2 5 5 2 5 3 5 5 5
52 2 2 2 2 2 2 2 2 2 2 2 2 2 2
53 1 2 2 2 1 1 2 2 2 1 2 2 4 4
54 4 4 4 4 4 4 4 4 4 4 4 4 4 4
55 2 3 3 2 3 3 2 3 3 2 3 3 3 2
56 3 3 3 3 3 3 3 3 3 3 3 3 3 3
57 3 3 3 3 3 3 3 3 2 3 3 2 3 2
58 4 4 4 4 4 4 4 4 4 4 4 4 4 4
59 4 4 4 4 4 4 4 4 4 4 4 4 4 4
60 4 4 4 4 4 4 4 4 4 4 4 4 4 4
61 3 3 2 3 3 2 3 3 2 3 3 2 2 3
62 4 3 1 2 1 2 2 3 2 3 2 2 1 4
63 4 4 4 4 4 4 4 4 4 4 4 4 4 4
64 3 2 3 3 2 3 3 2 3 3 2 3 3 3
65 5 2 5 5 5 3 5 2 5 5 2 5 3 5
66 2 3 4 2 3 4 2 3 4 2 3 4 4 2
67 2 3 3 2 3 3 2 3 3 2 3 3 3 2
68 3 3 2 3 3 2 3 3 2 3 3 2 2 3
69 3 4 4 3 4 4 3 4 4 3 4 4 4 3
70 3 2 3 3 2 3 3 2 3 3 2 3 3 3
71 4 4 4 4 4 4 4 4 4 4 4 4 4 4
72 4 4 4 4 4 4 4 4 4 4 4 4 4 4
73 3 3 3 3 3 3 3 3 3 3 3 3 3 3
74 4 2 2 4 2 2 4 2 2 4 2 2 2 4
75 4 4 4 4 4 4 4 4 4 4 4 4 4 4
76 4 4 4 4 4 4 4 4 4 4 4 4 4 4
77 4 4 4 4 4 4 4 4 4 4 4 4 4 4
78 4 4 3 4 4 3 4 4 3 4 4 3 3 4
79 4 4 4 4 4 4 4 4 4 4 4 4 4 4
80 4 2 3 2 4 3 2 4 3 2 4 4 4 4
81 4 4 4 4 4 4 4 4 4 4 4 4 4 4
82 4 4 2 3 2 4 2 3 4 2 3 4 2 4
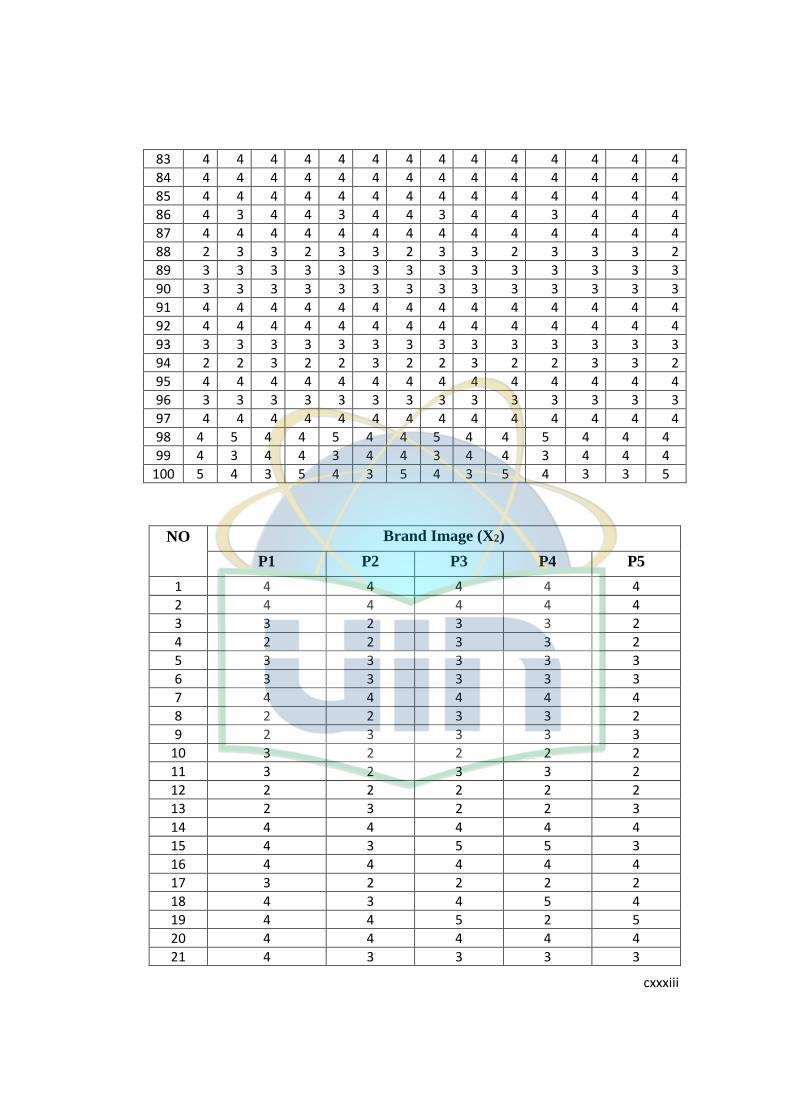
cxxxiii
83 4 4 4 4 4 4 4 4 4 4 4 4 4 4
84 4 4 4 4 4 4 4 4 4 4 4 4 4 4
85 4 4 4 4 4 4 4 4 4 4 4 4 4 4
86 4 3 4 4 3 4 4 3 4 4 3 4 4 4
87 4 4 4 4 4 4 4 4 4 4 4 4 4 4
88 2 3 3 2 3 3 2 3 3 2 3 3 3 2
89 3 3 3 3 3 3 3 3 3 3 3 3 3 3
90 3 3 3 3 3 3 3 3 3 3 3 3 3 3
91 4 4 4 4 4 4 4 4 4 4 4 4 4 4
92 4 4 4 4 4 4 4 4 4 4 4 4 4 4
93 3 3 3 3 3 3 3 3 3 3 3 3 3 3
94 2 2 3 2 2 3 2 2 3 2 2 3 3 2
95 4 4 4 4 4 4 4 4 4 4 4 4 4 4
96 3 3 3 3 3 3 3 3 3 3 3 3 3 3
97 4 4 4 4 4 4 4 4 4 4 4 4 4 4
98 4 5 4 4 5 4 4 5 4 4 5 4 4 4
99 4 3 4 4 3 4 4 3 4 4 3 4 4 4
100 5 4 3 5 4 3 5 4 3 5 4 3 3 5
NO
Brand Image (X2)
P1 P2 P3 P4 P5
1 4 4 4 4 4
2 4 4 4 4 4
3 3 2 3 3 2
4 2 2 3 3 2
5 3 3 3 3 3
6 3 3 3 3 3
7 4 4 4 4 4
8 2 2 3 3 2
9 2 3 3 3 3
10 3 2 2 2 2
11 3 2 3 3 2
12 2 2 2 2 2
13 2 3 2 2 3
14 4 4 4 4 4
15 4 3 5 5 3
16 4 4 4 4 4
17 3 2 2 2 2
18 4 3 4 5 4
19 4 4 5 2 5
20 4 4 4 4 4
21 4 3 3 3 3

cxxxiv
22 4 4 4 4 4
23 3 4 3 3 4
24 3 3 3 3 3
25 3 1 2 2 2
26 4 4 4 5 5
27 3 3 3 3 3
28 3 2 4 4 2
29 3 3 2 2 3
30 2 1 3 3 2
31 4 2 1 3 2
32 4 4 4 4 4
33 3 3 3 3 3
34 3 3 3 3 3
35 3 2 4 4 2
36 4 2 3 3 2
37 2 3 4 4 3
38 3 3 3 3 3
39 4 4 4 4 4
40 4 4 4 4 4
41 4 4 4 4 4
42 3 4 2 2 4
43 3 3 3 3 3
44 3 4 2 2 4
45 2 2 2 2 2
46 3 2 2 2 2
47 2 3 2 2 3
48 2 4 2 2 4
49 2 4 3 3 4
50 2 4 3 3 4
51 3 3 3 3 3
52 3 2 2 2 2
53 4 2 3 3 2
54 4 3 2 2 3
55 2 4 3 3 4
56 3 3 2 2 3
57 3 2 3 3 2
58 3 2 3 3 2
59 4 2 3 3 2
60 4 3 2 2 3
61 2 2 4 4 2
62 3 2 4 4 2
63 4 4 4 4 4
64 3 2 3 3 2
65 4 2 2 2 2

cxxxv
66 4 4 4 4 4
67 2 2 2 2 2
68 3 2 3 3 2
69 3 2 3 3 2
70 3 2 2 2 2
71 4 4 4 4 4
72 3 3 2 2 3
73 2 3 3 3 3
74 3 3 2 2 3
75 3 2 4 4 2
76 3 3 2 2 3
77 2 2 3 3 2
78 2 3 3 3 3
79 5 4 5 5 4
80 3 3 3 3 3
81 4 4 4 4 4
82 4 2 3 3 2
83 4 3 2 2 3
84 4 2 3 2 4
85 2 3 4 4 3
86 4 2 2 2 2
87 3 3 3 3 3
88 2 3 2 2 3
89 3 3 3 3 3
90 3 3 3 3 3
91 4 4 4 4 4
92 3 3 3 3 3
93 1 2 3 2 4
94 3 3 1 1 3
95 4 4 4 4 4
96 4 4 4 4 4
97 2 2 4 3 2
98 4 2 3 3 2
99 4 4 3 3 4
100 5 4 3 3 4
NO Perceived Value (X3)
P1 P2 P3 P4
1 3 2 3 3
2 4 5 5 5
3 2 2 2 1
4 2 5 1 2
5 3 2 3 3

cxxxvi
6 2 3 3 3
7 3 2 3 3
8 1 1 2 2
9 2 2 1 2
10 2 2 1 1
11 2 1 2 2
12 1 1 1 1
13 1 2 2 5
14 3 3 3 3
15 3 3 3 2
16 5 5 4 4
17 1 1 2 2
18 3 3 3 3
19 3 5 5 5
20 3 3 4 4
21 5 4 3 5
22 2 3 3 3
23 1 1 2 2
24 3 2 3 3
25 2 2 3 3
26 4 5 4 5
27 2 2 2 1
28 2 2 2 1
29 3 2 2 1
30 2 3 3 3
31 2 2 3 3
32 2 2 3 3
33 3 2 3 3
34 5 2 5 4
35 2 2 1 2
36 2 2 2 3
37 3 2 3 2
38 1 1 2 3
39 3 3 3 3
40 3 3 3 3
41 3 3 3 3
42 2 2 3 3
43 1 1 1 2
44 2 3 3 3
45 2 1 1 2
46 2 2 1 1
47 1 2 2 1
48 2 2 1 1
49 2 2 2 1

cxxxvii
50 2 2 2 1
51 1 2 1 3
52 1 2 1 2
53 2 2 3 3
54 4 5 4 5
55 2 2 1 1
56 2 2 1 2
57 2 2 1 2
58 2 2 3 3
59 2 2 3 3
60 2 2 3 3
61 1 2 2 3
62 2 2 3 3
63 2 2 3 3
64 1 2 1 1
65 5 4 5 4
66 3 3 3 3
67 2 2 3 3
68 2 2 2 2
69 4 5 4 5
70 2 1 2 2
71 4 5 4 5
72 2 2 2 2
73 2 1 2 3
74 2 2 1 1
75 1 2 2 1
76 2 2 1 1
77 5 4 4 5
78 2 2 1 1
79 2 2 4 4
80 3 2 1 1
81 4 5 4 5
82 2 2 3 3
83 4 5 4 5
84 3 3 3 3
85 2 2 3 3
86 1 1 2 1
87 2 2 2 2
88 2 2 1 2
89 4 5 4 5
90 2 2 3 3
91 2 2 3 3
92 5 4 5 5
93 2 2 3 3

cxxxviii
94 1 1 1 1
95 2 2 3 3
96 2 3 3 3
97 2 2 3 3
98 4 5 4 5
99 2 3 3 3
100 2 2 3 3
Customer Satisfaction (Y1)
P1 P2 P3
4 5 4
5 5 5
4 3 5
4 4 3
4 4 4
2 3 4
4 4 4
2 1 2
3 3 3
4 5 4
3 4 4
1 1 2
4 5 2
4 5 5
5 5 3
5 5 5
1 2 1
5 5 3
5 5 5
3 3 3
5 5 4
3 5 2
2 3 2
3 4 4
3 2 2
5 5 5
4 4 3
3 4 2
3 4 3
1 2 2
2 3 3
3 4 5
3 4 4

cxxxix
4 5 5
4 3 4
4 2 4
4 4 5
5 5 3
5 4 4
4 2 4
3 5 4
3 5 4
3 3 3
2 2 3
1 2 1
4 4 4
2 1 2
4 3 2
3 4 2
5 3 4
3 4 5
3 3 4
1 1 5
5 5 4
4 5 3
4 4 4
2 1 3
2 4 4
2 4 4
3 4 4
3 1 3
4 2 3
3 2 4
3 4 3
5 4 5
4 5 4
3 3 5
3 2 2
5 5 5
2 4 2
5 4 5
2 2 3
2 2 4
2 2 1
3 2 4
2 2 2
5 4 5

cxl
3 2 3
4 4 4
3 4 1
4 4 5
3 4 1
4 5 5
1 3 4
4 2 3
2 2 3
4 4 3
3 2 1
5 4 5
3 4 3
4 5 4
5 4 5
3 1 2
3 3 2
3 4 4
4 4 5
2 1 2
4 5 4
4 3 4
5 4 3
4 5 4
Brand Loyalty (Z)
P1 P2 P3 P4
4 5 4 4
5 5 5 5
4 3 5 5
4 4 3 3
4 4 4 4
2 3 4 4
4 5 5 5
2 1 2 2
3 3 3 3
4 5 4 4
3 4 4 4
1 1 2 2
4 5 2 2
4 5 5 5
5 5 5 3

cxli
5 5 5 5
1 2 1 1
5 5 3 3
5 5 5 5
4 4 3 4
5 5 4 4
3 4 3 5
2 3 2 2
3 4 4 4
3 2 2 2
5 5 5 5
4 4 3 3
3 4 2 2
3 4 3 3
1 2 2 2
2 3 3 3
3 4 5 5
3 4 4 4
4 5 5 5
4 3 4 4
4 2 4 4
4 4 5 5
5 5 3 3
5 4 5 5
4 4 5 3
3 5 4 4
3 5 4 4
1 2 3 3
2 2 3 3
1 2 1 1
4 4 4 4
2 1 2 2
4 3 2 2
3 4 2 2
3 5 2 5
3 4 5 5
2 2 2 3
1 1 5 5
5 5 4 4
4 5 3 3
4 4 4 4
2 1 3 3
2 4 4 4
2 4 4 4

cxlii
3 4 4 4
3 1 3 3
4 2 3 3
5 3 3 4
3 4 3 3
5 4 5 5
4 5 4 4
3 3 5 5
3 2 2 2
5 5 5 5
2 4 2 2
5 4 5 5
2 2 3 3
2 2 4 4
2 2 1 1
3 2 4 4
2 2 2 2
5 4 5 5
3 2 3 3
4 4 4 4
3 4 1 1
4 4 5 5
3 4 1 1
4 5 5 5
1 3 4 4
4 2 3 3
2 2 3 3
4 4 3 3
3 2 1 1
5 4 5 5
3 4 3 3
4 5 4 4
5 4 5 5
3 1 2 2
3 3 2 2
3 4 4 4
4 4 5 5
2 1 2 2
4 5 4 4
4 3 4 4
5 4 3 3

cxliii
Attachments III : Result of Data Quality
A. Validity Test
1. Service Quality

cxliv
2. Brand Image

cxlv
3. Perceived Value
4. Customer Satisfaction

cxlvi
5. Brand Loyalty
B. Realibility Test
1. Service Quality
Case Processing Summary
N %
Cases Valid 20 100,0
Excludeda 0 ,0
Total 20 100,0
a. Listwise deletion based on all variables in the
procedure.
Reliability Statistics
Cronbach's
Alpha N of Items
,920 14

cxlvii
Item-Total Statistics
Scale Mean if
Item Deleted
Scale Variance
if Item Deleted
Corrected Item-
Total Correlation
Cronbach's
Alpha if Item
Deleted
SQ_1 54,15 40,555 ,544 ,918
SQ_2 54,30 39,695 ,699 ,915
SQ_3 54,05 39,524 ,661 ,915
SQ_4 54,25 38,724 ,558 ,917
SQ_5 54,25 36,618 ,738 ,911
SQ_6 54,05 35,418 ,801 ,908
SQ_7 54,25 36,724 ,655 ,915
SQ_8 54,30 37,063 ,641 ,915
SQ_9 54,10 38,621 ,585 ,917
SQ_10 54,50 35,632 ,806 ,908
SQ_11 54,45 36,261 ,765 ,910
SQ_12 54,15 38,450 ,628 ,915
SQ_13 54,20 39,326 ,534 ,918
SQ_14 54,20 39,747 ,477 ,920
2. Brand Image
Case Processing Summary
N %
Cases Valid 20 100,0
Excludeda 0 ,0
Total 20 100,0
a. Listwise deletion based on all variables in the
procedure.
Reliability Statistics
Cronbach's
Alpha N of Items
,663 5
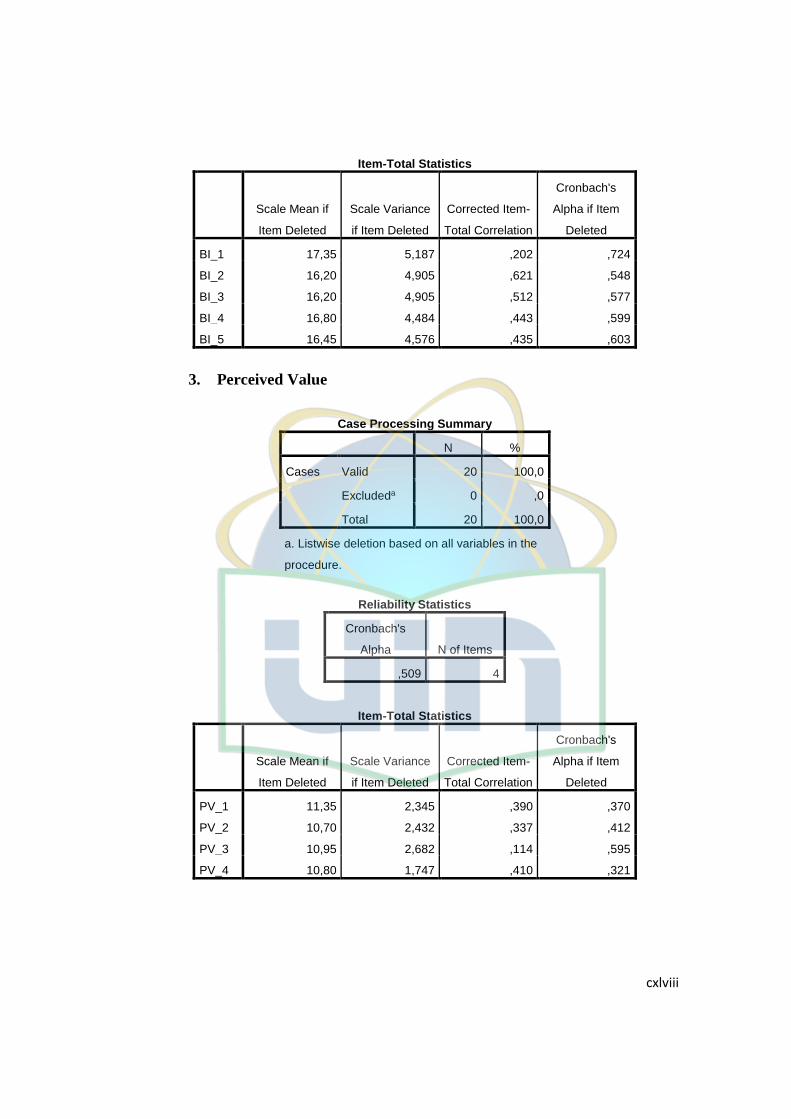
cxlviii
Item-Total Statistics
Scale Mean if
Item Deleted
Scale Variance
if Item Deleted
Corrected Item-
Total Correlation
Cronbach's
Alpha if Item
Deleted
BI_1 17,35 5,187 ,202 ,724
BI_2 16,20 4,905 ,621 ,548
BI_3 16,20 4,905 ,512 ,577
BI_4 16,80 4,484 ,443 ,599
BI_5 16,45 4,576 ,435 ,603
3. Perceived Value
Case Processing Summary
N %
Cases Valid 20 100,0
Excludeda 0 ,0
Total 20 100,0
a. Listwise deletion based on all variables in the
procedure.
Reliability Statistics
Cronbach's
Alpha N of Items
,509 4
Item-Total Statistics
Scale Mean if
Item Deleted
Scale Variance
if Item Deleted
Corrected Item-
Total Correlation
Cronbach's
Alpha if Item
Deleted
PV_1 11,35 2,345 ,390 ,370
PV_2 10,70 2,432 ,337 ,412
PV_3 10,95 2,682 ,114 ,595
PV_4 10,80 1,747 ,410 ,321

cxlix
4. Customer Satisfaction
Case Processing Summary
N %
Cases Valid 20 100,0
Excludeda 0 ,0
Total 20 100,0
a. Listwise deletion based on all variables in the
procedure.
Reliability Statistics
Cronbach's
Alpha N of Items
,497 3
Item-Total Statistics
Scale Mean if
Item Deleted
Scale Variance
if Item Deleted
Corrected Item-
Total Correlation
Cronbach's
Alpha if Item
Deleted
CS_1 6,50 1,211 ,453 ,165
CS_2 6,80 1,326 ,136 ,770
CS_3 6,60 1,411 ,438 ,246
5. Brand Loyalty
Case Processing Summary
N %
Cases Valid 20 100,0
Excludeda 0 ,0
Total 20 100,0
a. Listwise deletion based on all variables in the
procedure.

cl
Reliability Statistics
Cronbach's
Alpha N of Items
,590 4
Item-Total Statistics
Scale Mean if
Item Deleted
Scale Variance
if Item Deleted
Corrected Item-
Total Correlation
Cronbach's
Alpha if Item
Deleted
BL_1 9,70 2,432 ,322 ,558
BL_2 10,05 2,682 ,222 ,630
BL_3 9,75 2,197 ,460 ,446
BL_4 9,65 2,239 ,506 ,416
C. Normality Test
1. Normality Test Sub Structure I
Tests of Normality
Kolmogorov-Smirnova Shapiro-Wilk
Statistic df Sig. Statistic df Sig.
Unstandardized Residual ,058 100 ,200* ,990 100 ,633
*. This is a lower bound of the true significance.
a. Lilliefors Significance Correction
2. Normality Test Sub Structure II
Tests of Normality
Kolmogorov-Smirnova Shapiro-Wilk
Statistic Df Sig. Statistic df Sig.
Unstandardized Residual ,078 100 ,141 ,975 100 ,052
a. Lilliefors Significance Correction
cli
Attachments IV : Statictis Descriptive
A. Service Quality
SQ_1
Frequency Percent Valid Percent
Cumulative
Percent
Valid Strongly disagree 2 2,0 2,0 2,0
Disagree 21 21,0 21,0 23,0
Neutral 24 24,0 24,0 47,0
Agree 51 51,0 51,0 98,0
Strongly Agree 2 2,0 2,0 100,0
Total 100 100,0 100,0
SQ_2
Frequency Percent Valid Percent
Cumulative
Percent
Valid Strongly disagree 2 2,0 2,0 2,0
Disagree 22 22,0 22,0 24,0
Neutral 27 27,0 27,0 51,0
Agree 47 47,0 47,0 98,0
Strongly Agree 2 2,0 2,0 100,0
Total 100 100,0 100,0
SQ_3
Frequency Percent Valid Percent
Cumulative
Percent
Valid Strongly disagree 3 3,0 3,0 3,0
Disagree 14 14,0 14,0 17,0
Neutral 30 30,0 30,0 47,0
Agree 48 48,0 48,0 95,0
Strongly Agree 5 5,0 5,0 100,0
Total 100 100,0 100,0
SQ_4
Frequency Percent Valid Percent
Cumulative
Percent
Valid Strongly disagree 1 1,0 1,0 1,0
Disagree 24 24,0 24,0 25,0
Neutral 25 25,0 25,0 50,0
clii
Agree 45 45,0 45,0 95,0
Strongly Agree 5 5,0 5,0 100,0
Total 100 100,0 100,0
SQ_5
Frequency Percent Valid Percent
Cumulative
Percent
Valid Strongly disagree 3 3,0 3,0 3,0
Disagree 21 21,0 21,0 24,0
Neutral 25 25,0 25,0 49,0
Agree 46 46,0 46,0 95,0
Strongly Agree 5 5,0 5,0 100,0
Total 100 100,0 100,0
SQ_6
Frequency Percent Valid Percent
Cumulative
Percent
Valid Strongly disagree 3 3,0 3,0 3,0
Disagree 16 16,0 16,0 19,0
Neutral 30 30,0 30,0 49,0
Agree 47 47,0 47,0 96,0
Strongly Agree 4 4,0 4,0 100,0
Total 100 100,0 100,0
SQ_7
Frequency Percent Valid Percent
Cumulative
Percent
Valid Strongly disagree 1 1,0 1,0 1,0
Disagree 24 24,0 24,0 25,0
Neutral 24 24,0 24,0 49,0
Agree 44 44,0 44,0 93,0
Strongly Agree 7 7,0 7,0 100,0
Total 100 100,0 100,0
SQ_8
Frequency Percent Valid Percent
Cumulative
Percent
Valid Strongly disagree 1 1,0 1,0 1,0

cliii
Disagree 21 21,0 21,0 22,0
Neutral 28 28,0 28,0 50,0
Agree 45 45,0 45,0 95,0
Strongly Agree 5 5,0 5,0 100,0
Total 100 100,0 100,0
SQ_9
Frequency Percent Valid Percent
Cumulative
Percent
Valid Strongly disagree 2 2,0 2,0 2,0
Disagree 14 14,0 14,0 16,0
Neutral 29 29,0 29,0 45,0
Agree 48 48,0 48,0 93,0
Strongly Agree 7 7,0 7,0 100,0
Total 100 100,0 100,0
SQ_10
Frequency Percent Valid Percent
Cumulative
Percent
Valid Strongly disagree 2 2,0 2,0 2,0
Disagree 23 23,0 23,0 25,0
Neutral 24 24,0 24,0 49,0
Agree 45 45,0 45,0 94,0
Strongly Agree 6 6,0 6,0 100,0
Total 100 100,0 100,0
SQ_11
Frequency Percent Valid Percent
Cumulative
Percent
Valid Strongly disagree 2 2,0 2,0 2,0
Disagree 21 21,0 21,0 23,0
Neutral 24 24,0 24,0 47,0
Agree 46 46,0 46,0 93,0
Strongly Agree 7 7,0 7,0 100,0
Total 100 100,0 100,0
SQ_12

cliv
Frequency Percent Valid Percent
Cumulative
Percent
Valid Strongly disagree 3 3,0 3,0 3,0
Disagree 15 15,0 15,0 18,0
Neutral 28 28,0 28,0 46,0
Agree 49 49,0 49,0 95,0
Strongly Agree 5 5,0 5,0 100,0
Total 100 100,0 100,0
SQ_13
Frequency Percent Valid Percent
Cumulative
Percent
Valid Strongly disagree 4 4,0 4,0 4,0
Disagree 11 11,0 11,0 15,0
Neutral 28 28,0 28,0 43,0
Agree 51 51,0 51,0 94,0
Strongly Agree 6 6,0 6,0 100,0
Total 100 100,0 100,0
SQ_14
Frequency Percent Valid Percent
Cumulative
Percent
Valid Strongly disagree 1 1,0 1,0 1,0
Disagree 21 21,0 21,0 22,0
Neutral 20 20,0 20,0 42,0
Agree 51 51,0 51,0 93,0
Strongly Agree 7 7,0 7,0 100,0
Total 100 100,0 100,0
B. Brand Image
BI_1
Frequency Percent Valid Percent
Cumulative
Percent
Valid Strongly disagree 1 1,0 1,0 1,0
Disagree 21 21,0 21,0 22,0
Neutral 40 40,0 40,0 62,0
Agree 36 36,0 36,0 98,0

clv
Strongly Agree 2 2,0 2,0 100,0
Total 100 100,0 100,0
BI_2
Frequency Percent Valid Percent
Cumulative
Percent
Valid Strongly disagree 2 2,0 2,0 2,0
Disagree 34 34,0 34,0 36,0
Neutral 34 34,0 34,0 70,0
Agree 30 30,0 30,0 100,0
Total 100 100,0 100,0
BI_3
Frequency Percent Valid Percent
Cumulative
Percent
Valid Strongly disagree 2 2,0 2,0 2,0
Disagree 25 25,0 25,0 27,0
Neutral 42 42,0 42,0 69,0
Agree 28 28,0 28,0 97,0
Strongly Agree 3 3,0 3,0 100,0
Total 100 100,0 100,0
BI_4
Frequency Percent Valid Percent
Cumulative
Percent
Valid Strongly disagree 1 1,0 1,0 1,0
Disagree 28 28,0 28,0 29,0
Neutral 42 42,0 42,0 71,0
Agree 25 25,0 25,0 96,0
Strongly Agree 4 4,0 4,0 100,0
Total 100 100,0 100,0
BI_5
Frequency Percent Valid Percent
Cumulative
Percent
Valid Disagree 34 34,0 34,0 34,0
Neutral 33 33,0 33,0 67,0
Agree 31 31,0 31,0 98,0

clvi
Strongly Agree 2 2,0 2,0 100,0
Total 100 100,0 100,0
C. Perceived Value
PV_1
Frequency Percent Valid Percent
Cumulative
Percent
Valid Strongly disagree 15 15,0 15,0 15,0
Disagree 52 52,0 52,0 67,0
Neutral 18 18,0 18,0 85,0
Agree 9 9,0 9,0 94,0
Strongly Agree 6 6,0 6,0 100,0
Total 100 100,0 100,0
PV_2
Frequency Percent Valid Percent
Cumulative
Percent
Valid Strongly disagree 12 12,0 12,0 12,0
Disagree 57 57,0 57,0 69,0
Neutral 15 15,0 15,0 84,0
Agree 4 4,0 4,0 88,0
Strongly Agree 12 12,0 12,0 100,0
Total 100 100,0 100,0
PV_3
Frequency Percent Valid Percent
Cumulative
Percent
Valid Strongly disagree 21 21,0 21,0 21,0
Disagree 22 22,0 22,0 43,0
Neutral 40 40,0 40,0 83,0
Agree 12 12,0 12,0 95,0
Strongly Agree 5 5,0 5,0 100,0
Total 100 100,0 100,0
PV_4
Frequency Percent Valid Percent
Cumulative
Percent
Valid Strongly disagree 20 20,0 20,0 20,0

clvii
Disagree 19 19,0 19,0 39,0
Neutral 42 42,0 42,0 81,0
Agree 5 5,0 5,0 86,0
Strongly Agree 14 14,0 14,0 100,0
Total 100 100,0 100,0
D. Customer Satisfaction
CS_1
Frequency Percent Valid Percent
Cumulative
Percent
Valid Strongly disagree 6 6,0 6,0 6,0
Disagree 16 16,0 16,0 22,0
Neutral 31 31,0 31,0 53,0
Agree 29 29,0 29,0 82,0
Strongly Agree 18 18,0 18,0 100,0
Total 100 100,0 100,0
CS_2
Frequency Percent Valid Percent
Cumulative
Percent
Valid Strongly disagree 8 8,0 8,0 8,0
Disagree 19 19,0 19,0 27,0
Neutral 15 15,0 15,0 42,0
Agree 35 35,0 35,0 77,0
Strongly Agree 23 23,0 23,0 100,0
Total 100 100,0 100,0
CS_3
Frequency Percent Valid Percent
Cumulative
Percent
Valid Strongly disagree 6 6,0 6,0 6,0
Disagree 17 17,0 17,0 23,0
Neutral 23 23,0 23,0 46,0
Agree 33 33,0 33,0 79,0
Strongly Agree 21 21,0 21,0 100,0
Total 100 100,0 100,0

clviii
E. Brand Loyalty
BL_1
Frequency Percent Valid Percent
Cumulative
Percent
Valid Strongly disagree 7 7,0 7,0 7,0
Disagree 17 17,0 17,0 24,0
Neutral 28 28,0 28,0 52,0
Agree 30 30,0 30,0 82,0
Strongly Agree 18 18,0 18,0 100,0
Total 100 100,0 100,0
BL_2
Frequency Percent Valid Percent
Cumulative
Percent
Valid Strongly disagree 8 8,0 8,0 8,0
Disagree 19 19,0 19,0 27,0
Neutral 12 12,0 12,0 39,0
Agree 37 37,0 37,0 76,0
Strongly Agree 24 24,0 24,0 100,0
Total 100 100,0 100,0
BL_3
Frequency Percent Valid Percent
Cumulative
Percent
Valid Strongly disagree 6 6,0 6,0 6,0
Disagree 18 18,0 18,0 24,0
Neutral 24 24,0 24,0 48,0
Agree 27 27,0 27,0 75,0
Strongly Agree 25 25,0 25,0 100,0
Total 100 100,0 100,0
BL_4
Frequency Percent Valid Percent
Cumulative
Percent
Valid Strongly disagree 6 6,0 6,0 6,0
Disagree 16 16,0 16,0 22,0
Neutral 24 24,0 24,0 46,0
Agree 29 29,0 29,0 75,0

clix
Strongly Agree 25 25,0 25,0 100,0
Total 100 100,0 100,0
Attachment V : Result Correlation of All Variable
Correlations
SQ BI PV CS BL
SQ Pearson Correlation 1 ,491** ,516** ,585** ,646**
Sig. (2-tailed) ,000 ,000 ,000 ,000
N 100 100 100 100 100
BI Pearson Correlation ,491** 1 ,430** ,528** ,579**
Sig. (2-tailed) ,000 ,000 ,000 ,000
N 100 100 100 100 100
PV Pearson Correlation ,516** ,430** 1 ,661** ,695**
Sig. (2-tailed) ,000 ,000 ,000 ,000
N 100 100 100 100 100
CS Pearson Correlation ,585** ,528** ,661** 1 ,964**
Sig. (2-tailed) ,000 ,000 ,000 ,000
N 100 100 100 100 100
BL Pearson Correlation ,646** ,579** ,695** ,964** 1
Sig. (2-tailed) ,000 ,000 ,000 ,000
N 100 100 100 100 100
**. Correlation is significant at the 0.01 level (2-tailed).

clx
Attachment VI : Result of Path Analysis
A. Sub Structure I
Correlations
Service Quality Brand Image Perceived Value
Customer
Satisfaction
Service Quality Pearson Correlation 1 ,491** ,516** ,585**
Sig. (2-tailed) ,000 ,000 ,000
N 100 100 100 100
Brand Image Pearson Correlation ,491** 1 ,430** ,528**
Sig. (2-tailed) ,000 ,000 ,000
N 100 100 100 100
Perceived Value Pearson Correlation ,516** ,430** 1 ,661**
Sig. (2-tailed) ,000 ,000 ,000
N 100 100 100 100
Customer Satisfaction Pearson Correlation ,585** ,528** ,661** 1
Sig. (2-tailed) ,000 ,000 ,000
N 100 100 100 100
**. Correlation is significant at the 0.01 level (2-tailed).
Model Summary
Model R R Square
Adjusted R
Square
Std. Error of the
Estimate
1 ,742a ,551 ,537 2,007
a. Predictors: (Constant), Perceived Value, Brand Image, Service
Quality
ANOVAa
Model Sum of Squares df Mean Square F Sig.
1 Regression 473,876 3 157,959 39,213 ,000b
Residual 386,714 96 4,028
Total 860,590 99
a. Dependent Variable: Customer Satisfaction
b. Predictors: (Constant), Perceived Value, Brand Image, Service Quality

clxi
Coefficientsa
Model
Unstandardized Coefficients
Standardized
Coefficients
t Sig. B Std. Error Beta
1 (Constant) ,758 1,086 ,699 ,487
Service Quality ,070 ,024 ,253 2,973 ,004
Brand Image ,196 ,074 ,215 2,664 ,009
Perceived Value ,320 ,060 ,437 5,320 ,000
a. Dependent Variable: Customer Satisfaction
B. Sub Structure II
Correlations
Service Quality Perceived Value
Customer
Satisfaction Brand Loyalty
Service Quality Pearson Correlation 1 ,516** ,585** ,646**
Sig. (2-tailed) ,000 ,000 ,000
N 100 100 100 100
Perceived Value Pearson Correlation ,516** 1 ,661** ,695**
Sig. (2-tailed) ,000 ,000 ,000
N 100 100 100 100
Customer Satisfaction Pearson Correlation ,585** ,661** 1 ,964**
Sig. (2-tailed) ,000 ,000 ,000
N 100 100 100 100
Brand Loyalty Pearson Correlation ,646** ,695** ,964** 1
Sig. (2-tailed) ,000 ,000 ,000
N 100 100 100 100
**. Correlation is significant at the 0.01 level (2-tailed).

clxii
Model Summary
Model R R Square
Adjusted R
Square
Std. Error of the
Estimate
1 ,971a ,942 ,941 ,988
a. Predictors: (Constant), Customer Satisfaction, Service Quality,
Perceived Value
ANOVAa
Model Sum of Squares df Mean Square F Sig.
1 Regression 1532,354 3 510,785 523,011 ,000b
Residual 93,756 96 ,977
Total 1626,110 99
a. Dependent Variable: Brand Loyalty
b. Predictors: (Constant), Customer Satisfaction, Service Quality, Perceived Value
Coefficientsa
Model
Unstandardized Coefficients
Standardized
Coefficients
t Sig. B Std. Error Beta
1 (Constant) -,933 ,464 -2,014 ,047
Service Quality ,042 ,012 ,111 3,583 ,001
Perceived Value ,079 ,034 ,078 2,347 ,021
Customer Satisfaction 1,164 ,048 ,847 24,012 ,000
a. Dependent Variable: Brand Loyalty