the influence of silicate on transformation pathways of ... · the influence of silicate on...
TRANSCRIPT
The influence of silicate on transformation pathways of synthetic2-line ferrihydrite
Grzegorz Rzepa1• Gabriela Pieczara1
• Adam Gaweł1• Anna Tomczyk1
•
Ryszard Zalecki2
Received: 14 August 2015 / Accepted: 6 February 2016 / Published online: 26 February 2016
� The Author(s) 2016. This article is published with open access at Springerlink.com
Abstract In this study, a series of synthetic ferrihydrite
samples of Si/Fe molar ratios ranging from zero to 1.5 were
heated up to 1000 �C using simultaneous TG–DTA
equipment. The XRD, FTIR, SEM–EDS and magnetic
susceptibility measurements were carried out prior to and
after heating. It has been found that silicate retards ferri-
hydrite transformation to hematite and affects crystallinity
of the product. Low Si admixture in the precursor reduces
hematite crystal size severely, but the increase in average
crystal dimensions with increasing Si/Fe molar ratio was
observed. High Si content results in the formation of
hematite which exhibits a wide range of crystal habits. The
conversion of pure ferrihydrite to hematite proceeds with-
out any intermediate phase, whereas the increasing silicate
content in the pristine oxyhydroxide strongly affects the
transformation pathway. During annealing of high-Si fer-
rihydrites, the presence of two or three intermediate Fe2O3
polymorphs (gamma, epsilon and beta) was demonstrated
prior to the crystallization of final a-Fe2O3. The conditions
favoring crystallization of intermediate phases result from
progressive silica polymerization which forms separate
matrix-type phase and impedes the aggregation of iron
oxide nanoparticles.
Keywords Si-ferrihydrite � Hematite � e-Fe2O3 �b-Fe2O3 � Maghemite � Thermal transformations
Introduction
Ferrihydrite (Fe5HO8�4H2O) is a reddish-brown, poorly
ordered iron oxyhydroxide, with variable and non-stoi-
chiometric composition [1–3 and references therein]. The
structure and properties of this nanomineral are still under
debate [e.g., 4–12]. Currently two models of ferrihydrite
structure compete. According to the classic multiphase
model, Fe is exclusively octahedrally coordinated [9, 13],
while in the second, so-called akdalite model, 20 % of iron
atoms are coordinated tetrahedrally [4, 5]. Irrespective of
the model, the number of broad peaks in the XRD pattern
gives the descriptive names for the ferrihydrite varieties,
with 2-line and 6-line ferrihydrite being the most common.
Because of its low crystallinity, high surface area and
surface reactivity, ferrihydrite plays significant role in, for
example, inorganic weathering processes, biogeochemical
cycling of iron and as a scavenger of trace metals and
metalloids in various near-surface environments [1–3]. For
this reason, substantial amounts of admixtures are present
in ferrihydrite chemical composition. In nature, the most
common and well-documented impurities include silicate,
phosphate, arsenate, sulfate, calcium, aluminum and
organic compounds [e.g., 1–3, 14–16]. These ions affect
ferrihydrite composition, surface chemistry, reactivity and
sorption properties [14, 17–22]. Silicate, the most impor-
tant impurity, lowers crystallinity of this nanomineral and
modifies its morphology, magnetic ordering and solubility
Electronic supplementary material The online version of thisarticle (doi:10.1007/s10973-016-5345-6) contains supplementarymaterial, which is available to authorized users.
& Grzegorz Rzepa
1 Department of Mineralogy, Petrography and Geochemistry,
Faculty of Geology, Geophysics and Environmental
Protection, AGH University of Science and Technology,
al. A. Mickiewicza 30, 30-059 Krakow, Poland
2 Department of Solid State Physics, Faculty of Physics and
Applied Computer Science, AGH University of Science and
Technology, al. A. Mickiewicza 30, 30-059 Krakow, Poland
123
J Therm Anal Calorim (2016) 125:407–421
DOI 10.1007/s10973-016-5345-6
[15, 23–39], though the ferrihydrite structure itself is not
directly altered [30]. Reducing crystallinity has been
thought to result from the formation of soluble Fe–Si
complexes during the oxyhydroxide precipitation. Such
complexes delay the nucleation and growth of ferrihydrite
crystallites [31]. It is also likely that surface adsorption of
silicic acid occurs soon after ferrihydrite nucleation thus
impeding crystal growth [30]. A decrease in both ferrihy-
drite particle size and crystallinity with increasing content
of Si was found [17]. The opposite observation [27] sug-
gested that enhanced adsorption of silicate ions to the
ferrihydrite surface caused the increase in the nanoparticle
dimensions. These ambiguous results might result from the
character of the observed objects—Cismasu et al. [17]
noted the decrease in individual ferrihydrite particle sizes,
but the oxyhydroxide aggregates appeared more compact.
Hence, Seehra et al. [27] might observe ferrihydrite
aggregates rather than single crystallites. The character of
silica association with ferrihydrite depends on Si/Fe molar
ratio—at low values, monomeric silicate is adsorbed on the
ferrihydrite surface, whereas the high ratio promotes
polymerizing of silica to form a separate phase [19].
Therefore, at high Si contents, ferrihydrite particles are
probably embedded in a siliceous matrix containing vari-
able amounts of Fe [17]. A slight increase in specific sur-
face areas of low-Si ferrihydrites in comparison with pure
oxyhydroxide was also reported [26, 32], but high-Si fer-
rihydrites exhibited lower surface areas [22]. It may be
explained by the increasing oxyhydroxide aggregation and
the enhanced compactness of the aggregates, which per-
mitted the penetration of nitrogen molecules during BET
measurements.
Ferrihydrite is a metastable phase and a precursor of
many iron oxides and oxyhydroxides. Usually, it trans-
forms with time into stable minerals: goethite (a-FeOOH)
and/or hematite (a-Fe2O3), through dissolution–reprecipi-
tation and dehydration–rearrangement mechanisms,
respectively [1–3]. At elevated temperatures, ferrihydrite
converts into hematite but, despite many studies, the details
of the process are still controversial and seem to depend on
many factors [5, 33]. When pure oxyhydroxide is annealed,
the conversion to a-Fe2O3 appears to proceed without any
intermediates [2], but ligands adsorbed on the ferrihydrite
surface complicate the transformation pathway and inter-
mediate hydromaghemite or ferrimagnetic ferrihydrite
forms [5, 33, 34]. The transformation of ferrihydrite to
hematite is reflected by the sharp exotherm visible on DTA
(or DSC) curves at approximately 300–350 �C, though the
exact position of the peak depends on both the experi-
mental conditions and the method of synthesis. In some
cases, two [1, 35] or even three exotherms were recorded
[36]. Three different thermal patterns of ferrihydrites,
obtained by three different procedures, were argued to
reflect various proportions of so-called f-phase in the
standard multiphase structural ferrihydrite model [37].
The association of Si with ferrihydrite surface hindered
thermal transformation to hematite [16, 38–41]. This is an
effect of the formation of Fe–O–Si layer, blocking the
crystal growth sites [38]. These bonds must be broken prior
to the formation of hematite [24]. In the most compre-
hensive study on Si-ferrihydrite thermal transformations
[40], the presence of Si raised the temperature of ferrihy-
drite transformation up to 740 �C, at Si/(Si ? Fe) molar
ratio of 0.27. A clear reduction of hematite MCLs along
both c and a axes was also observed when low-Si ferri-
hydrites were annealed, whereas heating of higher-Si fer-
rihydrites resulted in less developed reduction of the
hematite dimensions. These authors concluded that some
silica could be incorporated in the hematite during heating
of low-Si ferrihydrites to 800 �C, and the Si caused
deformation of hematite structure. At higher temperature,
the Si was ejected from the structure [40]. Besides hema-
tite, amorphous silica, which recrystallizes to cristobalite at
higher temperature, has been often reported as a product of
annealing of Si-ferrihydrite-rich materials [e.g., 16, 42, 43].
The aim of this work was to determine the influence of
Si admixture in ferrihydrite on its thermal transformation
processes and the properties of the products. These issues
are important for the understanding of Si-ferrihydrite
stability in past and present geochemical systems.
Although Si-ferrihydrite was synthesized in many studies
[e.g., 18, 39, 40], relatively little is known about its prop-
erties and even less about the properties of its transfor-
mation products [40]. Also, synthetic ferrihydrites analyzed
so far exhibited usually low Si/Fe molar ratios, and the data
for higher Si/Fe ratios are scarce [44]. The reason for this is
probably a quite low silica content (up to several mass
percent) in most of natural ferrihydrites [1, 25, 45–48], but
in some environments, such as modern seafloor
hydrothermal vents, higher Si/Fe ratios (up to ca. 3) were
reported [15, 16, 49, 50]. In our study, a much wider range
of ferrihydrite Si/Fe molar ratios was applied; therefore, the
results fill the gap in the knowledge of the geologically
important silica-rich ferruginous materials. Moreover, we
present here the evidence on more complex transformation
routes of heated high-Si ferrihydrites in comparison with
low-Si ferrihydrites, because prior to the hematite crystal-
lization, epsilon and beta Fe2O3 polymorphs were
encountered. These exclusively synthetic iron oxides
[2, 51] are attractive (nano)materials for a wide range of
applications [51, 52]. This particularly applies to e-Fe2O3,
which exhibits a giant room-temperature coercive field and
the ability to absorb electromagnetic waves in gigahertz
region. Due to a number of intermediate features, e-Fe2O3
is a structural intermediate between maghemite and
hematite, stable in a narrow temperature range, and the
408 G. Rzepa et al.
123
thermally induced structural transformation of c-Fe2O3
nanoparticles to hematite is the best known process of e-
Fe2O3 preparation [51, 52]. Although e-Fe2O3 was identi-
fied previously as a transient product of Si-ferrihydrite
annealing [40], neither any explanation of its formation nor
further comment or discussion was provided. The cubic
b-Fe2O3 has been obtained by a wide range of techniques
[51, 53], but has not been encountered during heating of
ferrihydrite so far. Hence, annealing of high-Si ferrihydrite
is a new way of preparation of these rare iron oxides and is
here demonstrated to provide four Fe2O3 polymorphs,
which previously was limited solely to ferric sulfate as a
precursor.
Experimental
Sample preparation
A series of 2-line ferrihydrite samples with different Si/Fe
molar ratios of 0.00, 0.05, 0.10, 0.20, 0.50, 0.75, 1.00 and
1.50 (referred below as FHYD-000, FHYD-005, FHYD-
010 and so on), was obtained by reaction of Fe2(SO4)3 with
NaOH in the presence of Na2SiO3 at pH 8.2 [18, 23]. After
12 h of stirring, the samples were incubated for 96 h in
room temperature and then dialyzed to remove excess of
salts (SO42- and Na?), which was checked by measure-
ments of the suspension electrolytic conductivity. Finally,
the precipitates were freeze-dried using Christ Alpha 1–2
LD apparatus. In order to avoid contamination of the
samples by silica from glass, polyethylene vessels were
used for preparation of the reagents and for the synthesis
experiments. All the reagents involved in the synthesis,
supplied by Avantor Performance Materials Poland, were
of analytical grade.
Methods of sample characterization
The precipitates were characterized using X-ray powder
diffraction (XRD), infrared Fourier transform spectroscopy
(FTIR) and scanning electron microscopy (SEM). Then
simultaneous thermal analyses (STA—DTA/TG) were
performed. After heating to 1000 �C, all samples were
evaluated using XRD, FTIR and SEM–EDS. Additionally,
ferrihydrite samples were heated, using the same STA
equipment, to various temperatures selected on the basis of
the analysis of their thermal patterns. For this purpose,
heating was terminated immediately after reaching the
desired temperature and the sample was removed and
cooled in air. The samples attained temperatures below
100 �C in 1–3 min, depending on the temperature to which
they were annealed.
X-ray diffraction patterns were collected using Rigaku
SmartLab instrument equipped with a graphite monochro-
mator, rotation Cu anode, 45 kV and 200 mA generator
settings, 2�–75�2H recording range, 0.05� step size and
counting time of 1 s per step. Eliminating an influence of
instrumental parameters on peak intensities was achieved
by adjusting the primary beam value using plano-parallel
plate cut from the highly crystalline quartz specimen prior
to each analysis. The XRD patterns were evaluated by
XRAYAN software using a diffraction pattern database of
International Centre for Diffraction Data.
Scanning electron microscope analyses were carried out
in low-vacuum mode, using a FEI 200 Quanta FEG
microscope equipped with an EDS/EDAX spectrometer.
The acceleration voltage was 15–20 kV and the pressure
60 Pa. The samples were not coated with conductive layer.
Thermogravimetric (TG) and differential thermal anal-
ysis (DTA) measurements were performed applying Net-
zsch STA 449F3 Jupiter apparatus. A sample mass of ca.
50 mg was placed in an alumina crucible and heated from
20 to 1000 �C, at 10 �C min-1 in flowing (synthetic) air
(40 mL min-1). A preheated sample was used as inert
material. Simultaneous analyses of the evolved gases were
carried out using quadrupole mass spectrometer—Netzsch
QMS 403C Aeolos. The thermal patterns were collected
and processed using the Netzsch Proteus Thermal Analysis
software. Five reference substances: indium, tin, bismuth,
aluminum and gold were used for temperature calibration.
The errors of DTA and TG measurements, estimated on the
basis of repeated measurements of pure ferrihydrite, are
\1 �C and\1 mass%, respectively.
Infrared spectra were collected using Bruker Sensor 27
spectrometer in the range 400–4000 cm-1. The spectra
reported are the resultant of 64 scans at the resolution of
1 cm-1. Prior to analysis, KBr pellets were obtained by
homogenizing 200 mg of ground KBr with 4 mg of the
sample.
The magnetic susceptibility at the liquid nitrogen (77 K)
and room temperature (RT) were measured in the magnetic
field amplitude of 4.4 and 0.45 Oe, respectively, using a
standard mutual inductance bridge operating at the fre-
quency of 18.9 Hz. A Stanford SR 830 lock-in nanovolt-
meter served both as a source for the AC current for the
coil, which produced the AC magnetic field, and as a
voltmeter of the bridge. The temperature was monitored by
the Lake Shore temperature controller employing a chro-
mel-gold—0.07 % Fe thermocouple with an accuracy of
±0.05 K for this experimental setup. Voltage measurement
error was 0.1 lV at 77 K and 0.2 lV at RT, which trans-
lates into the error in magnetic susceptibility estimates of
1–2 9 10-8 m3 kg-1 and 2–4 9 10-7 m3 kg-1, respec-
tively, depending on the sample mass.
The influence of silicate on transformation pathways of synthetic 2-line ferrihydrite 409
123
Results and discussion
Properties of the initial ferrihydrites
For the discussion purposes, the samples were divided into
three groups: pure ferrihydrite (PFh), low-Si ferrihydrites
(LSFh; samples FHYD-005, FHYD-010 and FHYD-020)
and high-Si ferrihydrites (HSFh, samples FHYD-050,
FHYD-075, FHYD-100 and FHYD-150). A boundary
between the groups of Si-ferrihydrites is 0.2 Si/Fe molar
ratio, which is equal to the number of ferrihydrite
adsorption sites, estimated to be 0.2 mol mol-1 Fe [19].
SEM, XRD and FTIR studies
Electron microscopic observations show cryptocrystalline
homogenous materials obtained in all the syntheses [22].
Multiple EDS analyses of the ferrihydrites reveal that the
actual Si/Fe molar ratios are close to those which were
planned. Some sulfur impurities have been detected in
FHYD-000 and FHYD-005 samples, while the HSFh
exhibits sodium admixtures, increasing with increasing Si
content.
XRD pattern of PFh is characterized by two broad bands
at d * 2.5 and 1.50 A, typical for the oxyhydroxide [1, 2].
Increasing silicon content results in a gradual broadening
and a shift of the former toward lower two-theta angles.
Similar features, observed for both synthetic [17, 18, 27]
and natural [16, 41, 49] Si-ferrihydrites, indicate reducing
crystallinity and/or lowering crystal size.
Ferrihydrite gives broad infrared absorption maxima at
ca. 445 and 590 cm-1 (all the FTIR spectra are attached in
supplementary file), resulting from the stretching Fe–O
vibrations, and a shoulder at ca. 680–690 cm-1 [2]. The
position and intensity of the band at 445 cm-1 remains
roughly the same for all the samples, while the intensity of
the 590 cm-1 band is gradually lowered with the increasing
silica content, and in the HSFh spectra, the band is not
recognizable. Intensive bands at ca. 3400 and 1635 cm-1 are
assigned to the stretching and bending OH vibrations of the
lattice and adsorbed water, respectively [16, 54, 55]. A slight
shift of the former to higher wave numbers (up to ca.
3425 cm-1) for the highest-Si materials indicates some
reduction in bond strength [56]. For all the samples con-
taining Si, an additional band attributable to Si–O–Fe
stretching [16, 25, 41] occurs. Its shift from 930 up to
1000 cm-1 with increasing Si/Fe molar ratio indicates par-
tial silicate polymerization [25, 46]. Similar features were
reported previously [18, 27, 40]. The bands at 975, 1050 and
1123 cm-1 are caused by the formation of binuclear surface
complex between sulfate (originated from the reagent used
in the synthesis) and ferrihydrite [18]. These features were
not observed for the ferrihydrites exhibiting the Si/Fe molar
ratio higher than 0.1. A doublet at 2360–2340 cm-1, as well
as sharp peak at 668 cm-1 are related to stretching and
antisymmetric stretching of the CO2 molecule, respectively
[16], and are not an inherent feature of the samples.
Magnetic susceptibility measurements
Magnetic susceptibility (v) values at 77 K decrease from
8.05 9 10-6 m3 kg-1 for FHYD-000 to as low as 8.10 9
10-7 m3 kg-1 for FHYD-150 (Fig. 1). This is an effect of
increasing content of diamagnetic silica in the samples.
Similar lowering of magnetic susceptibility was reported
previously [20]. The RT v measurements revealed values
several times lower—from ca. 1.5 9 10-6 m3 kg-1 for
FHYD-000 to ca. 3.7 9 10-7 m3 kg-1 for FHYD-150.
Previous evaluations of 2-line ferrihydrite magnetic sus-
ceptibility provided results in the range of 1–2.7 9
10-6 m3 kg-1 [5, 20, 34, 57], and our data for PFh fit
within these limits. However, because of a relatively large
measurement error of magnetic susceptibility at RT, only
the results of low temperature measurements (77 K) are
discussed below.
Thermal studies
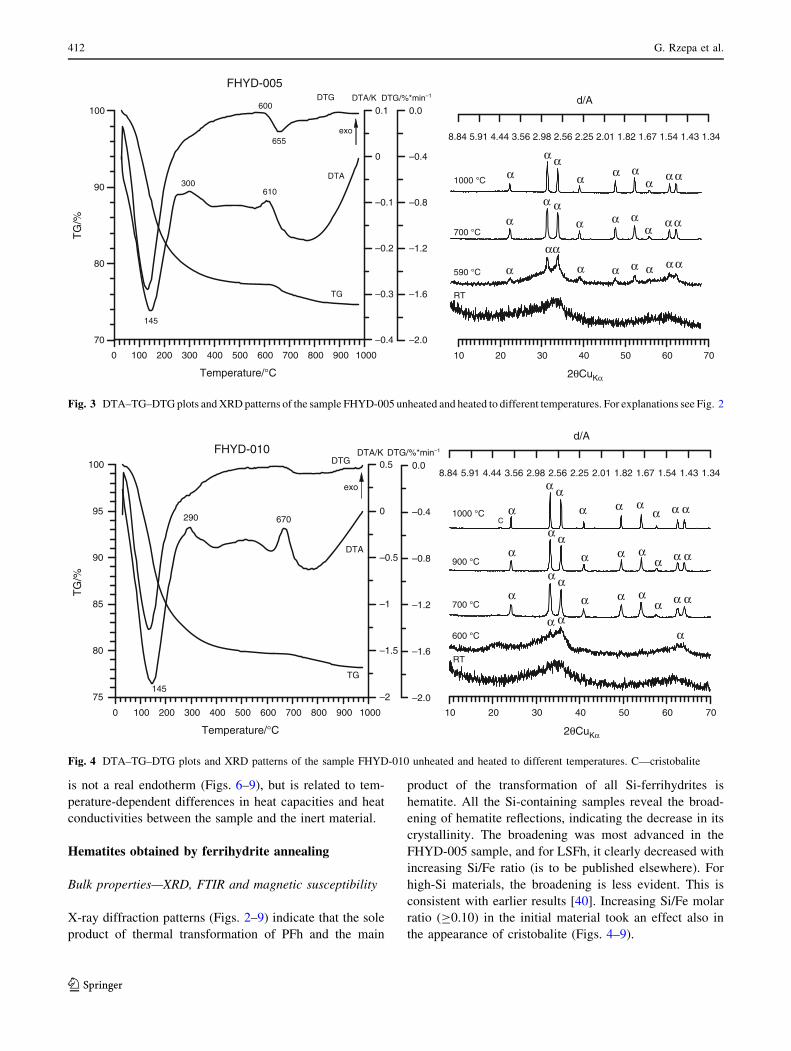
DTA curve of Si-free ferrihydrite shows typical dehydra-
tion endotherm with a maximum at 136 �C and sharp
exotherm at ca. 460 �C, related to hematite formation
(Fig. 2). Although the latter peak has been usually
observed at temperatures \400 �C [1, 2, 58], a higher-
temperature exotherm was also obtained in several studies
[37, 59–61]. A small mass loss (ca. 2.2 mass%) recorded in
the range of 600–800 �C, originates from decomposition of
relic sulfate. This additional feature is not visible on ther-
mal patterns of higher-Si materials, but very weak QMS
signal of SO2 still exists (not shown). As evidenced from
infrared spectra, sulfate ions are strongly adsorbed onto
ferrihydrite surface, hence retarding hematite crystalliza-
tion. This is reflected by the shift of transformation exo-
therm. It has been also shown recently that ferrihydrite
obtained from sulfate salts is slightly more thermally
stable than obtained from nitrate [32]. A total mass loss of
FHYD-000 is 21.28 mass% and remains similar for all the
samples studied. The losses are comparable with earlier
measurements of both synthetic [5, 17, 35, 37, 39] and
natural ferrihydrites [16, 25, 49], but are explicitly higher
than theoretical water content (*17 mass%), due to a high
amounts of physisorbed water. A bend on DTA curves of
low-Si samples at ca. 680 �C is an effect of applying pre-
heated hematite-rich sample as inert material, because this
is the Neel point of the mineral [2, 58].
410 G. Rzepa et al.
123
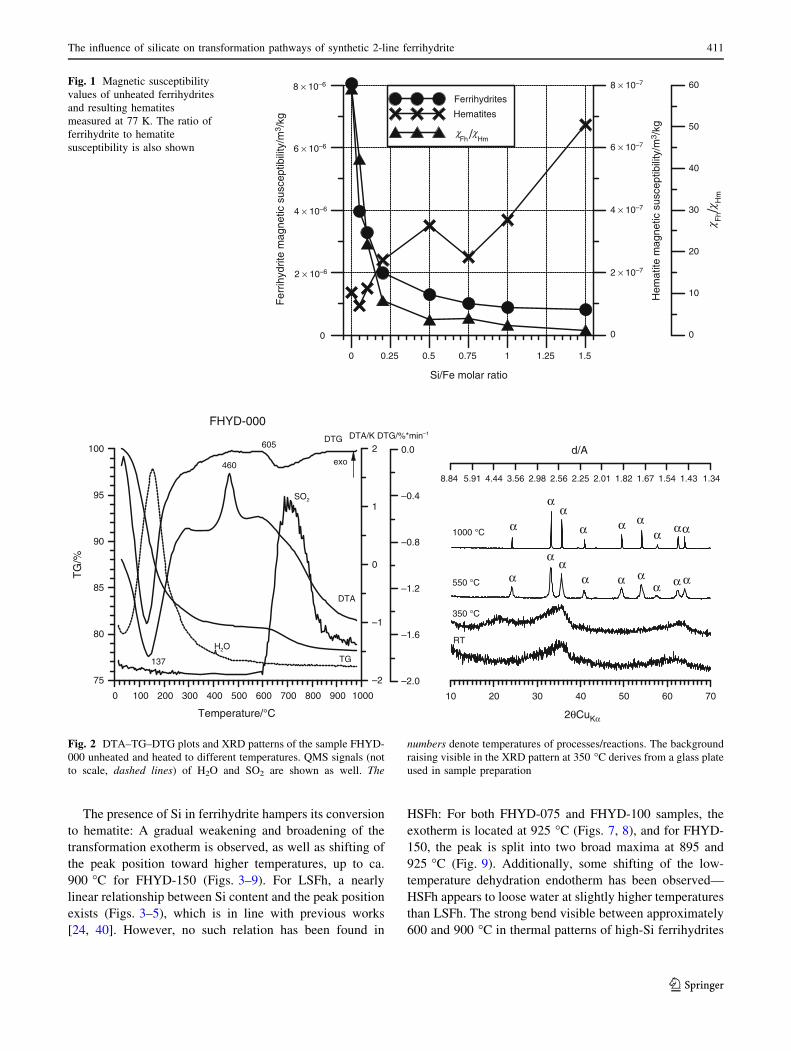
The presence of Si in ferrihydrite hampers its conversion
to hematite: A gradual weakening and broadening of the
transformation exotherm is observed, as well as shifting of
the peak position toward higher temperatures, up to ca.
900 �C for FHYD-150 (Figs. 3–9). For LSFh, a nearly
linear relationship between Si content and the peak position
exists (Figs. 3–5), which is in line with previous works
[24, 40]. However, no such relation has been found in
HSFh: For both FHYD-075 and FHYD-100 samples, the
exotherm is located at 925 �C (Figs. 7, 8), and for FHYD-
150, the peak is split into two broad maxima at 895 and
925 �C (Fig. 9). Additionally, some shifting of the low-
temperature dehydration endotherm has been observed—
HSFh appears to loose water at slightly higher temperatures
than LSFh. The strong bend visible between approximately
600 and 900 �C in thermal patterns of high-Si ferrihydrites
0 0.25 0.5 0.75 1 1.25 1.5
Si/Fe molar ratio
0
8 × 10⁻⁶
6 × 10⁻⁶
4 × 10⁻⁶
2 × 10⁻⁶
0
8 × 10⁻⁷
6 × 10⁻⁷
4 × 10⁻⁷
2 × 10⁻⁷F
errih
ydrit
e m
agne
tic s
usce
ptib
ility
/m3 /
kg
Hem
atite
mag
netic
sus
cept
ibili
ty/m
3 /kg
Ferrihydrites
Hematites
0
10
20
30
40
50
60
Fh/
Hm
Fh / Hmχ χ
χχ
Fig. 1 Magnetic susceptibility
values of unheated ferrihydrites
and resulting hematites
measured at 77 K. The ratio of
ferrihydrite to hematite
susceptibility is also shown
0 100 200 300 400 500 600 700 800 900 1000
Temperature/°C
75
80
85
90
95
100
TG
/%
–2
–1
0
1
2
–2.0
–1.6
–1.2
–0.8
–0.4
0.0
DTA/K DTG/%*min–1
exo
DTA
DTG
TG
H2O
SO2
137
605
460
FHYD-000
10 20 30 40 50 60 70
2θCuKα
8.84 5.91 4.44 3.56 2.98 2.56 2.25 2.01 1.82 1.67 1.54 1.43 1.34
d/A
RT
350 °C
1000 °C
550 °C
α
αα
α α αα αα
αα
α α αα α
α
α
Fig. 2 DTA–TG–DTG plots and XRD patterns of the sample FHYD-
000 unheated and heated to different temperatures. QMS signals (not
to scale, dashed lines) of H2O and SO2 are shown as well. The
numbers denote temperatures of processes/reactions. The background
raising visible in the XRD pattern at 350 �C derives from a glass plate
used in sample preparation
The influence of silicate on transformation pathways of synthetic 2-line ferrihydrite 411
123
is not a real endotherm (Figs. 6–9), but is related to tem-
perature-dependent differences in heat capacities and heat
conductivities between the sample and the inert material.
Hematites obtained by ferrihydrite annealing
Bulk properties—XRD, FTIR and magnetic susceptibility
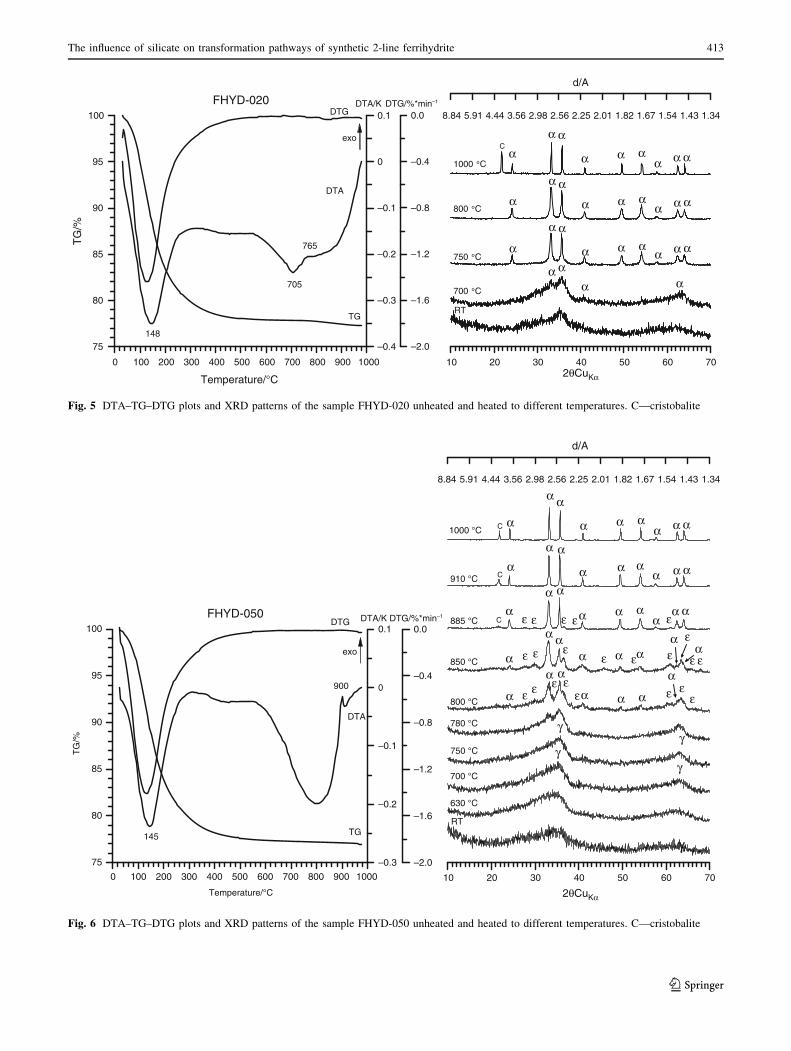
X-ray diffraction patterns (Figs. 2–9) indicate that the sole
product of thermal transformation of PFh and the main
product of the transformation of all Si-ferrihydrites is
hematite. All the Si-containing samples reveal the broad-
ening of hematite reflections, indicating the decrease in its
crystallinity. The broadening was most advanced in the
FHYD-005 sample, and for LSFh, it clearly decreased with
increasing Si/Fe ratio (is to be published elsewhere). For
high-Si materials, the broadening is less evident. This is
consistent with earlier results [40]. Increasing Si/Fe molar
ratio (C0.10) in the initial material took an effect also in
the appearance of cristobalite (Figs. 4–9).
2θCuKα
d/A
10 20 30 40 50 60 70
8.84 5.91 4.44 3.56 2.98 2.56 2.25 2.01 1.82 1.67 1.54 1.43 1.34
0 100 200 300 400 500 600 700 800 900 1000
Temperature/°C
70
80
90
100
TG
/%
–0.4
–0.3
–0.2
–0.1
0
0.1
–2.0
–1.6
–1.2
–0.8
–0.4
0.0DTA/K DTG/%*min–1
exo
DTA
DTG
TG
145
600
655
610
FHYD-005
300
RT
590 °C
700 °C
1000 °Cα
α αα α α
α αα
α
α αα α α
α αα
α
αα
α α α α αα
Fig. 3 DTA–TG–DTG plots and XRD patterns of the sample FHYD-005 unheated and heated to different temperatures. For explanations see Fig. 2
2θCuKα
d/A
10 20 30 40 50 60 70
8.84 5.91 4.44 3.56 2.98 2.56 2.25 2.01 1.82 1.67 1.54 1.43 1.34
0 100 200 300 400 500 600 700 800 900 1000
Temperature/°C
75
80
85
90
95
100
TG
/%
–2
–1.5
–1
–0.5
0
0.5
–2.0
–1.6
–1.2
–0.8
–0.4
0.0DTA/K DTG/%*min–1
exo
DTA
DTG
TG
145
670
FHYD-010
290
RT
600 °C
700 °C
1000 °C
900 °C
Cα
α αα α α
α
α
α αα α α
α
α
α αα α α
α
αα
αα
αα
α αα
Fig. 4 DTA–TG–DTG plots and XRD patterns of the sample FHYD-010 unheated and heated to different temperatures. C—cristobalite
412 G. Rzepa et al.
123
2θCuKα
d/A
10 20 30 40 50 60 70
8.84 5.91 4.44 3.56 2.98 2.56 2.25 2.01 1.82 1.67 1.54 1.43 1.34
0 100 200 300 400 500 600 700 800 900 1000
Temperature/°C
75
80
85
90
95
100
TG
/%
–0.4
–0.3
–0.2
–0.1
0
0.1
–2.0
–1.6
–1.2
–0.8
–0.4
0.0DTA/K DTG/%*min–1
exo
DTA
DTG
TG
148
705
765
FHYD-020
RT
700 oC
750 oC
1000 oC
800 oC
α
α α
α α αα α α
C
α
α α
α α αα α α
α
α α
α α αα α α
α αα α
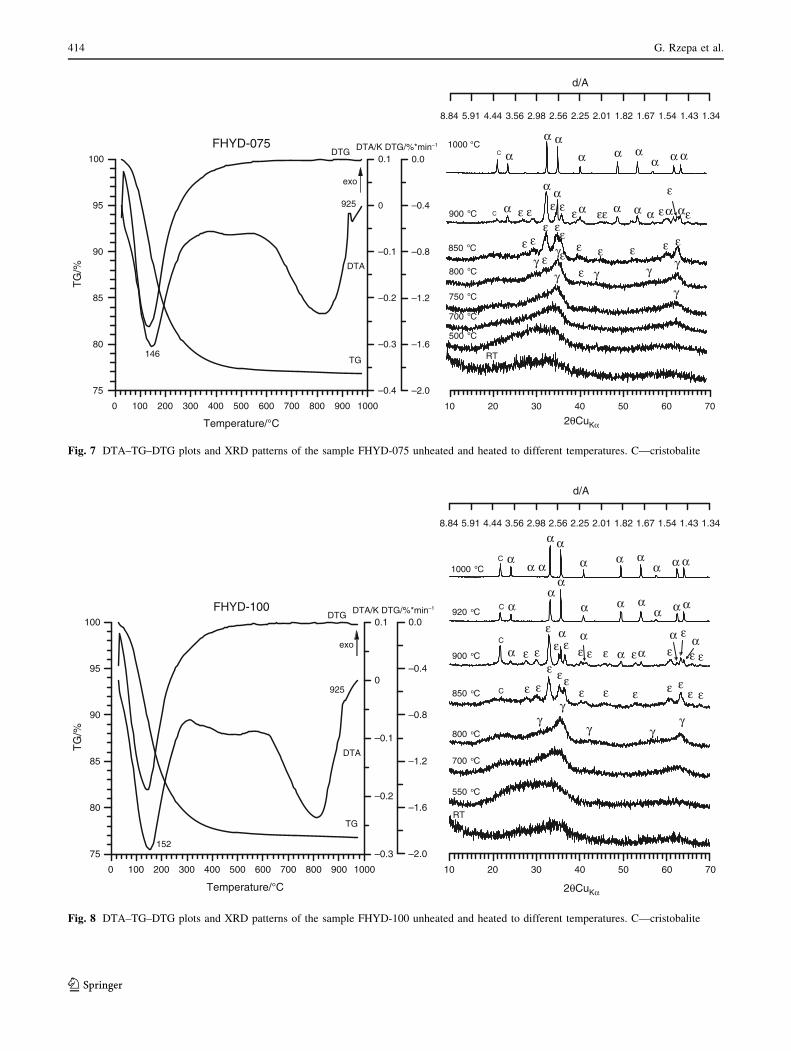
Fig. 5 DTA–TG–DTG plots and XRD patterns of the sample FHYD-020 unheated and heated to different temperatures. C—cristobalite
2θCuKα
d/A
10 20 30 40 50 60 70
8.84 5.91 4.44 3.56 2.98 2.56 2.25 2.01 1.82 1.67 1.54 1.43 1.34
0 100 200 300 400 500 600 700 800 900 1000
Temperature/°C
75
80
85
90
95
100
TG
/%
–0.3
–0.2
–0.1
0
0.1
–2.0
–1.6
–1.2
–0.8
–0.4
0.0DTA/K DTG/%*min–1
exo
DTA
DTG
TG145
900
FHYD-050
RT
630 °C
700 °C
885 °C
910 °C
1000 °C
850 °C
800 °C
750 °C
780 °C
α
α α
α α αα α αC
αα α
α α αα α αC
αα α
α α αα
α αC
α
α αα α α
αα
α
α α
α α α
γ
γ
γ
ε ε εε ε
ε
ε εε εε
γγ
α
εε ε
ε ε ε
ε ε ε ε ε
Fig. 6 DTA–TG–DTG plots and XRD patterns of the sample FHYD-050 unheated and heated to different temperatures. C—cristobalite
The influence of silicate on transformation pathways of synthetic 2-line ferrihydrite 413
123
2θCuKα
8.84 5.91 4.44 3.56 2.98 2.56 2.25 2.01 1.82 1.67 1.54 1.43 1.34
d/A
10 20 30 40 50 60 700 100 200 300 400 500 600 700 800 900 1000
Temperature/°C
75
80
85
90
95
100
TG
/%
–0.4
–0.3
–0.2
–0.1
0
0.1
–2.0
–1.6
–1.2
–0.8
–0.4
0.0DTA/K DTG/%*min–1
exo
DTA
DTG
TG146
925
FHYD-075
RT
500 oC
700 oC
900 oC
1000 °C
800 oC
750 oC
α
α αα α α
α α αC
α ε ε
α αα α α α α αC
εε ε εε ε
ε
ε εε ε
εε ε ε ε ε
εγγ
γ
γγ γ γ
εε
850 oC
ε
Fig. 7 DTA–TG–DTG plots and XRD patterns of the sample FHYD-075 unheated and heated to different temperatures. C—cristobalite
2θCuKα
d/A
10 20 30 40 50 60 70
8.84 5.91 4.44 3.56 2.98 2.56 2.25 2.01 1.82 1.67 1.54 1.43 1.34
0 100 200 300 400 500 600 700 800 900 1000
Temperature/°C
75
80
85
90
95
100
TG
/%
–0.3
–0.2
–0.1
0
0.1
–2.0
–1.6
–1.2
–0.8
–0.4
0.0DTA/K DTG/%*min–1
exo
DTA
DTG
TG
152
925
FHYD-100
RT
550 oC
700 oC
900 oC
920 oC
1000 oC
850 oC
800 oC
αα α
α αα α α
α α αC
αα
α
α α αα α αC
α ε ε
εεα
ε ε αα
αC ε
αε
ε
ε εε ε
ε εε εε
εε ε
εε
C
γγ
γ γγ
εα
ε
Fig. 8 DTA–TG–DTG plots and XRD patterns of the sample FHYD-100 unheated and heated to different temperatures. C—cristobalite
414 G. Rzepa et al.
123
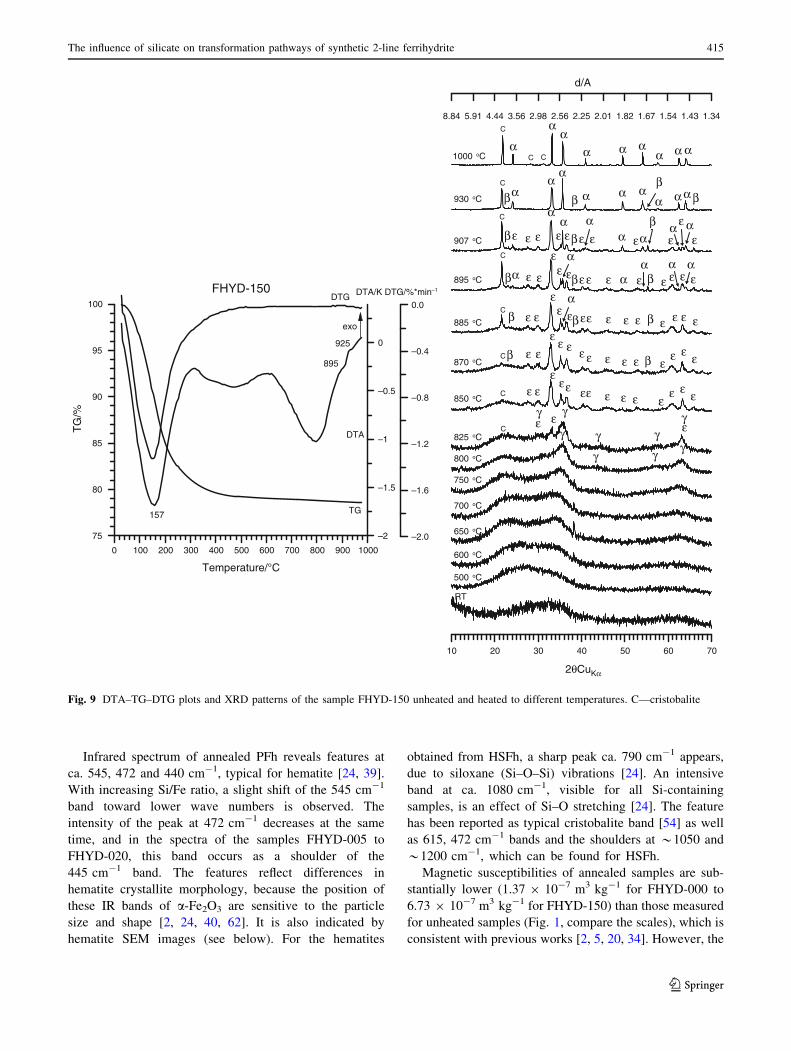
Infrared spectrum of annealed PFh reveals features at
ca. 545, 472 and 440 cm-1, typical for hematite [24, 39].
With increasing Si/Fe ratio, a slight shift of the 545 cm-1
band toward lower wave numbers is observed. The
intensity of the peak at 472 cm-1 decreases at the same
time, and in the spectra of the samples FHYD-005 to
FHYD-020, this band occurs as a shoulder of the
445 cm-1 band. The features reflect differences in
hematite crystallite morphology, because the position of
these IR bands of a-Fe2O3 are sensitive to the particle
size and shape [2, 24, 40, 62]. It is also indicated by
hematite SEM images (see below). For the hematites
obtained from HSFh, a sharp peak ca. 790 cm-1 appears,
due to siloxane (Si–O–Si) vibrations [24]. An intensive
band at ca. 1080 cm-1, visible for all Si-containing
samples, is an effect of Si–O stretching [24]. The feature
has been reported as typical cristobalite band [54] as well
as 615, 472 cm-1 bands and the shoulders at *1050 and
*1200 cm-1, which can be found for HSFh.
Magnetic susceptibilities of annealed samples are sub-
stantially lower (1.37 9 10-7 m3 kg-1 for FHYD-000 to
6.73 9 10-7 m3 kg-1 for FHYD-150) than those measured
for unheated samples (Fig. 1, compare the scales), which is
consistent with previous works [2, 5, 20, 34]. However, the
2θCuKα
d/A
10 20 30 40 50 60 70
8.84 5.91 4.44 3.56 2.98 2.56 2.25 2.01 1.82 1.67 1.54 1.43 1.34
0 100 200 300 400 500 600 700 800 900 1000
Temperature/°C
75
80
85
90
95
100
TG
/%
–2
–1.5
–1
–0.5
0
–2.0
–1.6
–1.2
–0.8
–0.4
0.0
DTA/K DTG/%*min–1
exo
DTA
DTG
TG157
925
FHYD-150
895
RT
500 oC
600 oC
650 oC
700 oC
750 oC
825 oC
870 oC
885 oC
895 oC
907 oC
930 oC
1000 oC
850 oC
800 oC
α
αα
α α αα α α
C
αα
α
α α αα α α
C
ε ε ε
αα
α
α α εα
C
β ββ
β ββ
εε εε ε
ε α
ε ε
ε
α
ε ε ε ε
C
εεεε ββ ε
ε
ε ε ε ε εC εε εε βε
α
ε
ε ε εC ε εε ε
ε
ε ε
ε ε
ε εε
ε ε
ε ε ε ε εC εεε εε
εγε
C
γγ
ε
εγ γ
γ
γγ
γ
β
ββ
β
ε
ε
ε
εβαααα
α
β
C C
Fig. 9 DTA–TG–DTG plots and XRD patterns of the sample FHYD-150 unheated and heated to different temperatures. C—cristobalite
The influence of silicate on transformation pathways of synthetic 2-line ferrihydrite 415
123
increasing Si/Fe ratio appears to increase magnetic sus-
ceptibility of the annealed product (Fig. 1).
Crystal sizes and shapes
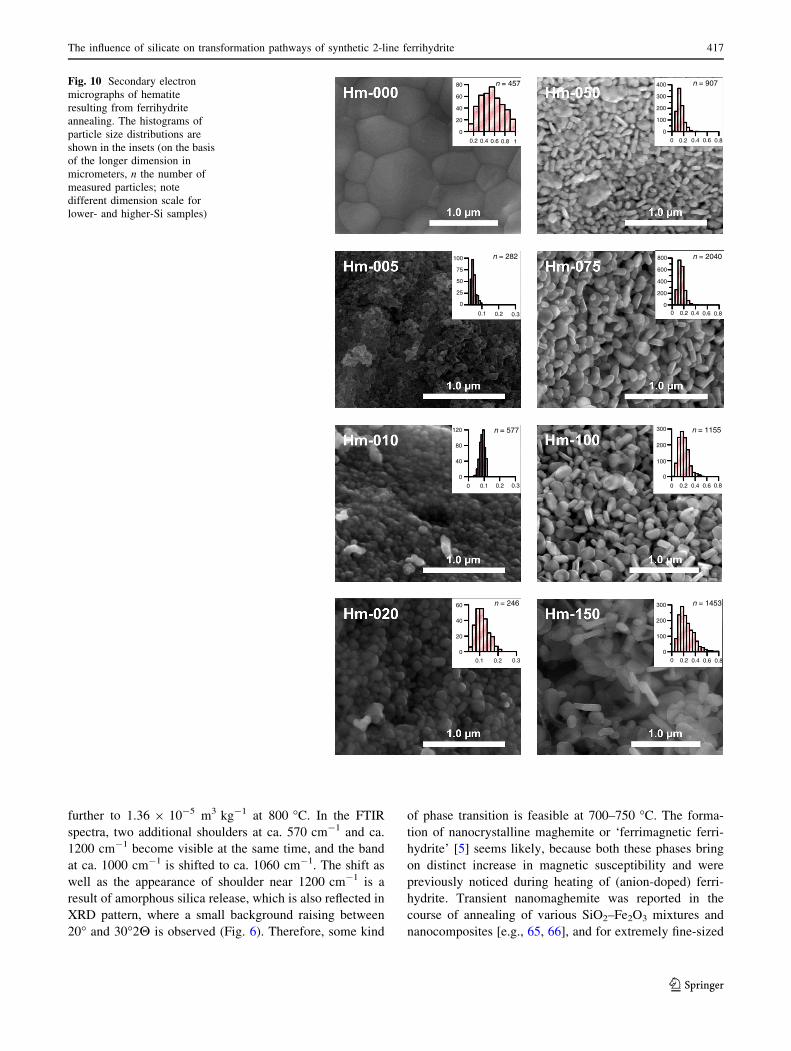
Hematite originated from heating of Si-free ferrihydrite
forms quite large (up to 1 lm in size) isometric and pris-
matic crystals (Fig. 10), which often exhibit hexagonal
shape. Such a habit is typical for the oxide crystallizing in
the absence of additives [2]. Almost identical images of
hematite obtained by heating of (carbonated) 2-line ferri-
hydrite at 1000 �C were presented previously [55]. The
oxide particles become twenty times smaller in the lowest-
silicate material (Si/Fe = 0.05) and reveal spheroidal
morphology (Fig. 10). However, hematites obtained by
annealing FHYD-010 and FHYD-020 samples are dis-
tinctly larger than those originating from FHYD-005
sample (Figs. 10, 11), which is in line with XRD results. In
higher-silicate products, the crystallites are embedded in
cryptocrystalline silica and exhibit wider range of crystal
habits—isometric grains, plates, rods and even needles
were encountered (Fig. 10). Elongated crystallites (rods
and needles) are more common in the highest-Si products,
which are reflected by the increase in average aspect ratios.
A distinct increase in the aspect ratio distribution, esti-
mated by standard deviations, evidences increasing
heterogeneity of hematite habits (Fig. 11) and suggests
various transformation routes. These findings are con-
trasting with the previous data [24] that spheroidal hematite
particles formed from Si-ferrihydrite, irrespective of the Si/
Fe molar ratio. That work, however, involved narrower
range of Si/Fe ratios (up to 0.75).
Transformation pathways
Pure ferrihydrite
PFh heated to 350 �C reveals the increase in relative
intensity and the decrease in FWHM of broad XRD peaks
(Fig. 2). Due to dehydration and dehydroxylation, the
intensities of IR bands at 3385 and 1635 cm-1 decrease.
Additionally, the band at ca. 592 cm-1 becomes less
intense and is shifted to ca. 570 cm-1. At 550 �C, highly
disordered hematite is the sole transformation product
(Fig. 2), which is evidenced by both XRD and FTIR.
However, the bands at *3400 and 1635 cm-1 as well as
*1130 and 980 cm-1, attributable to OH and SO4 vibra-
tions, respectively, are still visible in the FTIR spectra.
This is in agreement with thermal analysis, because at
550 �C, the plateau of H2O release is not yet attained and
sulfates begin to decompose only at ca. 600 �C (Fig. 2).
Therefore, the proper (stoichiometric) hematite is devel-
oped at higher temperatures [24, 40, 63]. Magnetic
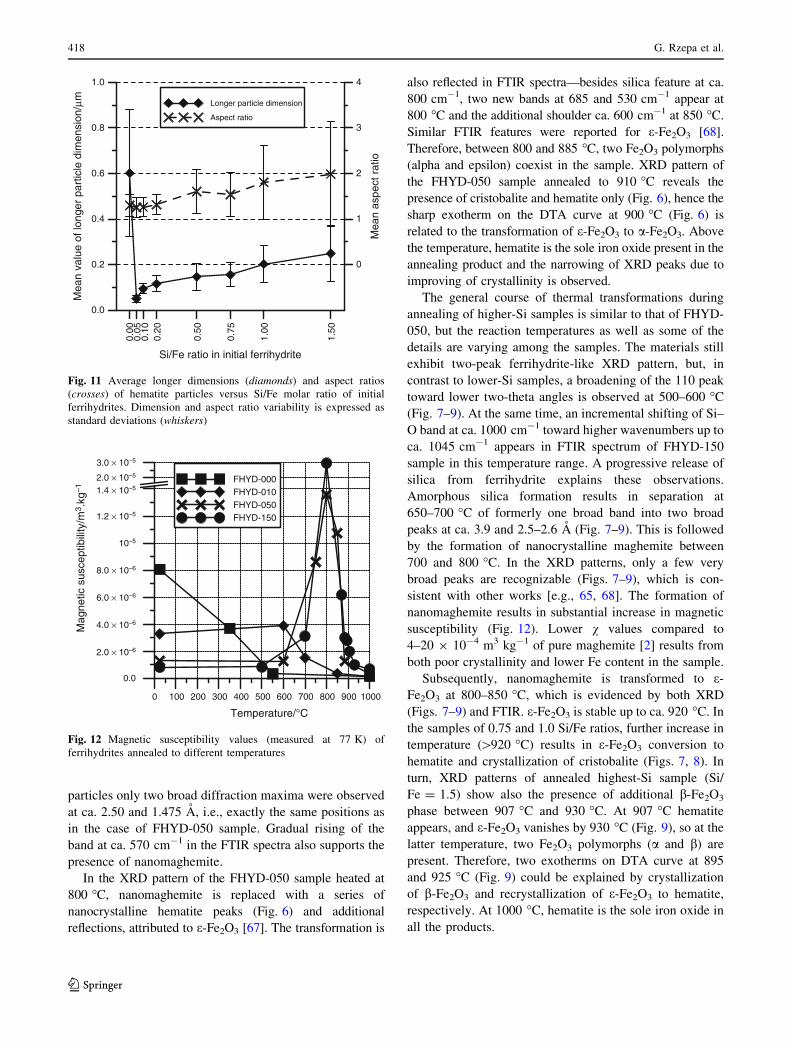
susceptibilities are gradually lowered in the temperature
range of 25–550 �C, and then, i.e., after hematite crystal-
lization, only slight further lowering is observed (Fig. 12).
Low-Si ferrihydrites (Si/Fe 0.05–0.20)
Similar LSFh transformations were found. After low-tem-
perature dehydration, gradual increase in XRD peak
intensities and gradual decrease in their widths are
observed. Up to 500 �C, no distinct phase conversion is
evidenced from XRD patterns. In FTIR spectra of FHYD-
010 sample, a shift of the 935 cm-1 band to 980 cm-1 just
before the transformation to hematite (600 �C) and to
1030 cm-1 just after the conversion (700 �C) indicates the
breakup of Si–O–Fe linkages and subsequent formation of
silica phase. In comparison with PFh, the most important
difference is the distinct increase in temperature of trans-
formation to hematite (Figs. 3–5). The just-formed a-
Fe2O3 is initially poorly crystalline, but further heating
results in the increase in crystallinity (Figs. 3–5). The
formation of cristobalite takes place at high temperatures—
in XRD patterns of FHYD-010 (Fig. 4) and FHYD-020
samples (Fig. 5) cristobalite is recognizable only at
1000 �C. This is confirmed by FTIR analysis. Interestingly,
cristobalite is not present in FHYD-005 sample (or is
below detection limit). Even at 1000 �C, only the back-
ground raising at 15–30 two-theta degrees is apparent
(which is hardly visible in Fig. 3). Similar phenomenon
observed previously during heating of relatively low-Si
ferrihydrites was linked with the formation of extremely
poorly crystalline Si–O–Fe phase [40].
Magnetic susceptibility value of the FHYD-010 sample
slightly increases (from 3.28 to 3.88 9 10-6 m3 kg-1,
measurements at 77 K) just before the conversion to hema-
tite (Fig. 12). Then it drops significantly to approximately
1.5 9 10-6 m3 kg-1, when hematite forms, and to as low as
ca. 1.5 9 10-7 m3 kg-1, after finishing of the heating.
Therefore, according to previous studies [5, 20, 33, 64],
anion-doping of ferrihydrite appears to enhance magnetic
susceptibility of dehydrated oxyhydroxide prior to its con-
version to hematite.
High-Si ferrihydrites (Si/Fe 0.50–1.50)
For the FHYD-050 sample, the transformation pathway is
similar to LSFh up to at least 600 �C—the material still
exhibits two-peak ferrihydrite-like XRD pattern (Fig. 6),
and FTIR spectrum possesses similar features as FHYD-
010 spectrum prior to transformation. X-ray diffractograms
reveal virtually no phase transformations between 600 and
750 �C (Fig. 6), but magnetic susceptibility increases by
almost order of magnitude, from ca. 1 9 10-6 m3 kg-1 at
600 �C up to 8.6 9 10-6 m3 kg-1 at 750 �C (Fig. 12) and
416 G. Rzepa et al.
123
further to 1.36 9 10-5 m3 kg-1 at 800 �C. In the FTIR
spectra, two additional shoulders at ca. 570 cm-1 and ca.
1200 cm-1 become visible at the same time, and the band
at ca. 1000 cm-1 is shifted to ca. 1060 cm-1. The shift as
well as the appearance of shoulder near 1200 cm-1 is a
result of amorphous silica release, which is also reflected in
XRD pattern, where a small background raising between
20� and 30�2H is observed (Fig. 6). Therefore, some kind
of phase transition is feasible at 700–750 �C. The forma-
tion of nanocrystalline maghemite or ‘ferrimagnetic ferri-
hydrite’ [5] seems likely, because both these phases bring
on distinct increase in magnetic susceptibility and were
previously noticed during heating of (anion-doped) ferri-
hydrite. Transient nanomaghemite was reported in the
course of annealing of various SiO2–Fe2O3 mixtures and
nanocomposites [e.g., 65, 66], and for extremely fine-sized
80
60
40
20
0
0.2 0.4 0.6 0.8 1
n = 457 n = 907
n = 2040
n = 577
n = 282
n = 1155
n = 1453n = 246
400
300
200
100
0
100 800
600
400
200
00 0.2 0.4 0.6 0.8
75
50
25
0
0.1 0.2 0.3
0.3
300
200
100
0
0 0.2 0.4 0.6 0.8
0.80.60.40.200
100
200
30060
40
20
0
0.1 0.2 0.3
0.20.10
0
40
80
120
0 0.2 0.4 0.6 0.8
Fig. 10 Secondary electron
micrographs of hematite
resulting from ferrihydrite
annealing. The histograms of
particle size distributions are
shown in the insets (on the basis
of the longer dimension in
micrometers, n the number of
measured particles; note
different dimension scale for
lower- and higher-Si samples)
The influence of silicate on transformation pathways of synthetic 2-line ferrihydrite 417
123
particles only two broad diffraction maxima were observed
at ca. 2.50 and 1.475 A, i.e., exactly the same positions as
in the case of FHYD-050 sample. Gradual rising of the
band at ca. 570 cm-1 in the FTIR spectra also supports the
presence of nanomaghemite.
In the XRD pattern of the FHYD-050 sample heated at
800 �C, nanomaghemite is replaced with a series of
nanocrystalline hematite peaks (Fig. 6) and additional
reflections, attributed to e-Fe2O3 [67]. The transformation is
also reflected in FTIR spectra—besides silica feature at ca.
800 cm-1, two new bands at 685 and 530 cm-1 appear at
800 �C and the additional shoulder ca. 600 cm-1 at 850 �C.
Similar FTIR features were reported for e-Fe2O3 [68].
Therefore, between 800 and 885 �C, two Fe2O3 polymorphs
(alpha and epsilon) coexist in the sample. XRD pattern of
the FHYD-050 sample annealed to 910 �C reveals the
presence of cristobalite and hematite only (Fig. 6), hence the
sharp exotherm on the DTA curve at 900 �C (Fig. 6) is
related to the transformation of e-Fe2O3 to a-Fe2O3. Above
the temperature, hematite is the sole iron oxide present in the
annealing product and the narrowing of XRD peaks due to
improving of crystallinity is observed.
The general course of thermal transformations during
annealing of higher-Si samples is similar to that of FHYD-
050, but the reaction temperatures as well as some of the
details are varying among the samples. The materials still
exhibit two-peak ferrihydrite-like XRD pattern, but, in
contrast to lower-Si samples, a broadening of the 110 peak
toward lower two-theta angles is observed at 500–600 �C(Fig. 7–9). At the same time, an incremental shifting of Si–
O band at ca. 1000 cm-1 toward higher wavenumbers up to
ca. 1045 cm-1 appears in FTIR spectrum of FHYD-150
sample in this temperature range. A progressive release of
silica from ferrihydrite explains these observations.
Amorphous silica formation results in separation at
650–700 �C of formerly one broad band into two broad
peaks at ca. 3.9 and 2.5–2.6 A (Fig. 7–9). This is followed
by the formation of nanocrystalline maghemite between
700 and 800 �C. In the XRD patterns, only a few very
broad peaks are recognizable (Figs. 7–9), which is con-
sistent with other works [e.g., 65, 68]. The formation of
nanomaghemite results in substantial increase in magnetic
susceptibility (Fig. 12). Lower v values compared to
4–20 9 10-4 m3 kg-1 of pure maghemite [2] results from
both poor crystallinity and lower Fe content in the sample.
Subsequently, nanomaghemite is transformed to e-
Fe2O3 at 800–850 �C, which is evidenced by both XRD
(Figs. 7–9) and FTIR. e-Fe2O3 is stable up to ca. 920 �C. In
the samples of 0.75 and 1.0 Si/Fe ratios, further increase in
temperature ([920 �C) results in e-Fe2O3 conversion to
hematite and crystallization of cristobalite (Figs. 7, 8). In
turn, XRD patterns of annealed highest-Si sample (Si/
Fe = 1.5) show also the presence of additional b-Fe2O3
phase between 907 �C and 930 �C. At 907 �C hematite
appears, and e-Fe2O3 vanishes by 930 �C (Fig. 9), so at the
latter temperature, two Fe2O3 polymorphs (a and b) are
present. Therefore, two exotherms on DTA curve at 895
and 925 �C (Fig. 9) could be explained by crystallization
of b-Fe2O3 and recrystallization of e-Fe2O3 to hematite,
respectively. At 1000 �C, hematite is the sole iron oxide in
all the products.
0.00
0.05
0.10
0.20
0.50
0.75
1.00
1.50
Si/Fe ratio in initial ferrihydrite
0.0
0.2
0.4
0.6
0.8
1.0M
ean
valu
e of
long
er p
artic
le d
imen
sion
/μm
0
1
2
3
4
Mea
n as
pect
rat
io
Longer particle dimension
Aspect ratio
Fig. 11 Average longer dimensions (diamonds) and aspect ratios
(crosses) of hematite particles versus Si/Fe molar ratio of initial
ferrihydrites. Dimension and aspect ratio variability is expressed as
standard deviations (whiskers)
0 100 200 300 400 500 600 700 800 900 1000
Temperature/°C
3.0 × 10⁻⁵
2.0 × 10⁻⁵
1.4 × 10⁻⁵
1.2 × 10⁻⁵
8.0 × 10⁻⁶
6.0 × 10⁻⁶
4.0 × 10⁻⁶
2.0 × 10⁻⁶
0.0
10–5
Mag
netic
sus
cept
ibili
ty/m
3 .kg
–1
FHYD-000FHYD-010FHYD-050FHYD-150
Fig. 12 Magnetic susceptibility values (measured at 77 K) of
ferrihydrites annealed to different temperatures
418 G. Rzepa et al.
123
The role of Si in thermal transformation
of ferrihydrite
In the case of the annealed Si-ferrihydrites, the major factor
that appears to affect both the transformation routes and the
properties of the products is Si content in pristine oxyhy-
droxide. Silicate stabilizes ferrihydrite structure and hampers
its conversion to hematite. The shifting of the transformation
reaction to higher temperatures is caused by the inhibiting
effect of silicate on rearrangement processes within ferri-
hydrite particles which are necessary for structural ordering
and conversion into the oxide [2]. For this reason, the
hematite crystallinity is distinctly decreased as well. In our
study, the lowest-Si ferrihydrite was converted into the
smallest-sized hematite, and the increasing Si content
appeared to increase the hematite particle dimensions
(Figs. 10, 11). It was previously suggested [40] that small
amounts of Si could enter the hematite structure during Si-
ferrihydrite annealing, but were ejected when higher
annealing temperature was achieved. It might be a reason for
poor crystal development when hematite originated from
conversion of low-Si ferrihydrite. Because Si is coordinated
tetrahedrally, it is hardly possible to enter the structure of
stoichiometric hematite, where all (iron) cations occupy
octahedral positions. On the other hand, initially formed
non-stoichiometric hematite is highly disordered and, as
evidenced by thermal analyses and FTIR, still contains some
hydroxyls and trace sulfates. Therefore, incorporation of
silicate in such disordered lattice appears to be more plau-
sible. When heating is prolonged to higher temperature,
hydroxyls and silicates would be ejected from the structure
and stoichiometric, but fine-crystalline hematite is formed.
Heating of HSFh runs differently, because silicate bound
to the oxyhydroxide surface is gradually polymerized and
crystallizes thus forming a kind of matrix, in which the
particles of dehydr(oxyl)ated ferrihydrite and nanomaghe-
mite are embedded. In the absence of such matrix,
maghemite always undergoes the conversion to hematite
[2, 51]. However, the matrix hampers the coalescence,
avoids the agglomeration of the particles and keeps their
sizes quite constant. Because, as it was hypothesized ear-
lier, the phase conversion of c-Fe2O3 to a-Fe2O3 takes
place once the maghemite nanoparticles reach a critical
size of 10–25 nm [51], the cristobalite-like mass would
inhibit the hematite crystallization. Therefore, an analogue
of SiO2-maghemite nanocomposite is formed, which has
been reported to enhance maghemite thermal stability and
favor its transformation to hematite via indirect mecha-
nisms [51, 69, 70]. The specific conditions that are devel-
oped allow to the formation of rare polymorphic forms
(i.e., e-Fe2O3 and b-Fe2O3), impossible to stabilize other-
wise [71]. These polymorphs exhibit different habits –
transmission electron microscopic observations (to be
presented elsewhere) reveal rods of epsilon phase and
cubes of beta phase. Further annealing of the samples
(above approximately 920–930 �C) causes the conversion
of these intermediates into hematite, and the latter can
inherit the precursor habits. For these reasons, the hema-
tites obtained during annealing of HSFh exhibit various
crystal shapes, reflected in, for example, the high vari-
ability of aspect ratios (Figs. 10, 11). However, particular
mechanisms which control b-Fe2O3 formation besides e-
Fe2O3 remain unclear. It was hypothesized recently [72]
that free energies of nanoparticles play dominant role here,
but later works showed that the character of the starting
compound and the synthesis conditions appeared to be
more important [53].
Conclusions
Our study demonstrates that silicate content retards ferri-
hydrite thermal transformation to hematite and affects
crystallinity of the latter. The properties of resulting
hematite, as well as transformation pathways, are highly
dependent on Si/Fe molar ratio. In general, higher Si/Fe
molar ratios result in more complex transformations. The
most important observations and conclusions are as
follows:
1. When Si admixture is lower than 0.2 mol mol-1 Fe,
then ferrihydrite nanoparticles are stabilized by
adsorbed silicate and the conversion to a-Fe2O3 is
hindered. Magnetic susceptibility is slightly increased
prior to the transformation, but no distinct intermediate
is formed. The crystal size of all resulting hematites is
distinctly reduced compared to the product of pure
ferrihydrite annealing, but increases with increasing Si/
Fe molar ratio.
2. When Si/Fe ratio in pristine ferrihydrite is higher,
silicate progressively polymerizes with increasing
temperature and forms a sort of matrix in which iron
compounds are embedded. The aggregation of iron
oxide nanoparticles is impeded, and the conditions
favoring crystallization of intermediate phases arise. A
distinct increase in magnetic susceptibility is observed
at the same time.
3. The intermediates include nanocrystalline maghemite,
followed by rare iron oxide polymorphs: e-Fe2O3
and—in the case of the highest-Si material—also b-
Fe2O3.
4. Hematite, which is the sole Fe2O3 polymorph at
1000 �C, can inherit the precursors’ habits, hence its
shape and size range significantly.
5. To the best of the authors’ knowledge, e-Fe2O3 and b-
Fe2O3 have not been reported yet as a result of
The influence of silicate on transformation pathways of synthetic 2-line ferrihydrite 419
123
ferrihydrite heating (besides the short mention in [40]).
Annealing of Si-ferrihydrites might therefore offer an
alternative method of obtaining these rare polymorphs.
6. This work evidences that the formation of both epsilon
and beta Fe2O3 is possible when siliceous ferrihydrites
are heated to high temperature. Because Si-rich ferric
(oxyhydro)oxide materials occur in some geological
environments (e.g., in hydrothermal systems of mid-
ocean ridges), the formation of these rare Fe2O3
polymorphs seems plausible if specific conditions are
met.
Acknowledgements This work was supported by AGH-UST
statutory grant No. 11.11.140.319. Bartosz Budzyn is acknowledged
for careful reading the manuscript. We also thank two anonymous
reviewers whose constructive comments allowed improving the
clarity of the manuscript.
Open Access This article is distributed under the terms of the Crea-
tive Commons Attribution 4.0 International License (http://creative
commons.org/licenses/by/4.0/), which permits unrestricted use,
distribution, and reproduction in any medium, provided you give
appropriate credit to the original author(s) and the source, provide a link
to the Creative Commons license, and indicate if changes were made.
References
1. Jambor JL, Dutrizac JE. Occurrence and constitution of natural
and synthetic ferrihydrite, a widespread iron oxyhydroxide. Chem
Rev. 1998;98:2549–85.
2. Cornell RM, Schwertmann U. The iron oxides: structure, prop-
erties, reactions, occurrences and uses. 2nd ed. Weinheim: Wiley;
2003.
3. Guo H, Barnard AS. Naturally occurring iron oxide nanoparti-
cles: morphology, surface chemistry and environmental stability.
J Mater Chem A. 2013;1:27–42.
4. Michel FM, Ehm L, Anato SM, Lee PL, Chupas PJ, Liu G,
Strongin DR, Schoonen MAA, Phillips BL, Parise JB. The
structure of ferrihydrite, a nanocrystalline material. Science.
2007;316:1726–8.
5. Michel FM, Barron V, Torrent J, Morales MP, Serna CJ, Boily
J-F, Liu Q, Ambrosini A, Cismasu AC, Brown GE Jr. Ordered
ferrimagnetic form of ferrihydrite reveals links among structure,
composition, and magnetism. PNAS. 2010;107:2787–92.
6. Rancourt DG, Meunier J-F. Constraints on structural models of
ferrihydrite as a nanocrystalline material. Am Mineral. 2008;93:
1412–7.
7. Maillot F, Morin G, Wang Y, Bonnin D, Ildefonse P, Chaneac C,
Calas G. New Insight into the structure of nanocrystalline ferri-
hydrite: EXAFS evidence for tetrahedrally coordinated iron(III).
Geochim Cosmochim Acta. 2011;75:2708–20.
8. Xu W, Hausner DB, Harrington R, Lee PI, Strongin DR, Parise
JB. Structural water in ferrihydrite and constraints this provides
on possible structure models. Am Mineral. 2011;96:513–20.
9. Manceau A. Critical evaluation of the revised akdalite model for
ferrihydrite. Am Mineral. 2011;96:521–33.
10. Paktunc D, Manceau A, Dutrizac J. Incorporation of Ge in fer-
rihydrite: implications for the structure of ferrihydrite. Am
Mineral. 2013;98:848–58.
11. Hiemstra T. Surface and mineral structure of ferrihydrite. Geo-
chim Cosmochim Acta. 2013;105:316–25.
12. Masina CJ, Neethling JH, Olivier EJ, Manzini S, Lodya L, Srot
V, van Aken PA. Structural and magnetic properties of ferrihy-
drite nanoparticles. RSC Adv. 2015;5:39643–50.
13. Drits VA, Sakharov BA, Salyn AL, Manceau A. Structural model
for ferrihydrite. Clay Miner. 1993;28:185–207.
14. Cismasu AC, Levard C, Michel FM, Brown GE Jr. Properties of
impurity-bearing ferrihydrite II. Insights into the surface structure
and composition of pure, Al- and Si-bearing ferrihydrite from
Zn(II) sorption experiments and Zn K-edge X-ray absorption
spectroscopy. Geochim Cosmochim Acta. 2013;119:46–60.
15. Toner BM, Berquo TS, Michel FM, Sorensen JV, Templeton AS,
Edwards KJ. Mineralogy of iron microbial mats from Loihi
Seamount. Front Microbiol. 2012;3:1–18.
16. Sun Z, Zhou H, Glasby GP, Sun Z, Yang Q, Yin Z, Li J. Min-
eralogical characterization and formation of Fe–Si oxyhydroxide
deposits from modern seafloor hydrothermal vents. Am Mineral.
2013;98:85–97.
17. Cismasu AC, Michel FM, Tcaciuc AP, Brown GE Jr. Properties
of impurity-bearing ferrihydrite III. Effects of Si on the structure
of 2-line ferrihydrite. Geochim Cosmochim Acta. 2014;133:
168–85.
18. Vempati RK, Loeppert RH. Influence of structural and adsorbed
Si on the transformation of synthetic ferrihydrite. Clays Clay
Miner. 1989;37:273–9.
19. Swedlund PJ, Webster JG. Adsorption and polymerisation of
silicic acid on ferrihydrite, and its effect on arsenic adsorption.
Water Res. 1999;16:3413–22.
20. Cabello E, Morales MP, Serna CJ, Barron V, Torrent J. Magnetic
enhancement during the crystallization of ferrihydrite at 25 and
50 �C. Clays Clay Miner. 2009;57:46–53.
21. Bolanz RM, Blass U, Ackermann S, Ciobota V, Rosch P, Tarcea
N, Popp J, Majzlan J. The effect of antimonate, arsenate and
phosphate on the transformation of ferrihydrite to goethite,
hematite, feroxyhite, and tripuhyite. Clays Clay Miner. 2013;61:
11–25.
22. Pieczara G, Rzepa G, Zych Ł. An effect of Si content on surface
properties of synthetic ferrihydrite (in Polish with English sum-
mary). In: Ratajczak T, Rzepa G, Bajda T, editors. Sorbenty
mineralne. Krakow: Wyd. AGH; 2013. p. 347–60.
23. Vempati RK, Loeppert RH, Cocke DL. Mineralogy and reactivity
of amorphous Si-ferrihydrites. Solid State Ionics. 1990;38:53–61.
24. Vempati RK, Loeppert RH, Sittertz-Bhatkar H, Burghardt RC.
Infrared vibrations of hematite formed from aqueous- and dry-
thermal incubation of Si-containing ferrihydrite. Clays Clay
Miner. 1990;38:294–8.
25. Parfitt RL, Van der Gaast SJ, Childs W. A structural model for
natural siliceous ferrihydrite. Clays Clay Miner. 1992;40:675–81.
26. Schwertmann U, Friedl J, Kyek A. Formation and properties of
continuous crystallinity series of synthetic ferrihydrites (2- to
6-line) and their relation to FeOOH forms. Clays Clay Miner.
2004;52:221–6.
27. Seehra MS, Roy P, Raman A, Manivannan A. Structural inves-
tigations of synthetic ferrihydrite nanoparticles doped with Si.
Solid State Commun. 2004;130:597–601.
28. Berquo TS, Banerjee SK, Ford RG, Penn RL, Pichler T. High
crystallinity Si-ferrihydrite: an insight into its Neel temperature
and size dependence of magnetic properties. J Geophys Res.
2007;112:B02102.
29. Dyer L, Fawell PD, Newman OMG, Richmond WR. Synthesis
and characterization of ferrihydrite/silica co-precipitates. J Coll
Interface Sci. 2010;348:65–70.
30. Dyer LG, Chapman KW, English P, Saunders M, Richmond WR.
Insight into the crystal and aggregate structure of Fe?3 oxide/
silica co-precipitates. Am Mineral. 2012;97:63–9.
420 G. Rzepa et al.
123
31. Pokrovski GS, Schott J, Farges F, Hazeman J-L. Iron (III)-silica
interactions in aqueous solution: insight from X-ray absorption
fine structure spectroscopy. Geochim Cosmochim Acta. 2003;
67:3559–73.
32. Pieczara G, Mendsaikhan N, Manecki M, Rzepa G. The effect of
synthesis method on the physicochemical properties of ferrihy-
drite and Si-doped ferrihydrite (in Polish with English summary).
Przem Chem. 2015;94:1828–31.
33. Barron V, Torrent J, de Grave E. Hydromaghemite, an interme-
diate in the hydrothermal transformation of 2-line ferrihydrite
into hematite. Am Mineral. 2003;88:1679–88.
34. Barron V, Torrent J. Evidence for a simple pathway to maghe-
mite in Earth and Mars soils. Geochim Cosmochim Acta.
2002;66:2801–6.
35. Eggleton RA, Fitzpatrick RW. New data and a revised structural
model for ferrihydrite. Clays Clay Miner. 1988;36:111–24.
36. Rhoton FE, Bigham JM, Lindbo DL. Properties of iron oxides in
streams draining the Loess Uplands of Mississippi. Appl Geo-
chem. 2002;17:409–19.
37. Liu H, Wang Y, Ma Y, Wei Y, Pan G. The microstructure of
ferrihydrite and its catalytic activity. Chemosphere. 2010;79:802–6.
38. Zhao J, Huggins FE, Feng Z, Huffman GP. Ferrihydrite: surface
structure and its effects on phase transformation. Clays Clay
Miner. 1994;42:737–46.
39. Glasauer SM, Hug P, Weidler PG, Gehring AU. Inhibition of
sintering by Si during the conversion of Si-rich ferrihydrite to
hematite. Clays Clay Miner. 2000;48:51–6.
40. Campbell AS, Schwertmann U, Stanjek H, Friedl J, Kyek A,
Campbell PA. Si incorporation into hematite by heating Si-fer-
rihydrite. Langmuir. 2002;18:7804–9.
41. Carlson L, Schwertmann U. Natural ferrihydrites in surface
deposits from Finland and their association with silica. Geochim
Cosmochim Acta. 1981;45:421–9.
42. Rzepa G, Bajda T, Gaweł A, Debiec K, Drewniak L. Mineral
transformations and textural evolution during roasting of bog iron
ores. J Therm Anal Calorim. 2016;123:615–30.
43. Hashimoto H, Fujii T, Kohara S, Nakanishi K, Yogi C, Peterlik
H, Nakanishi M, Takada J. Structural transformations of heat-
treated bacterial iron oxide. Mater Chem Phys. 2015;155:67–75.
44. Herbillon AJ. Tran Vinh An J. Heterogeneity in silicon-iron
mixed hydroxides. J Soil Sci. 1969;20:223–35.
45. Schwertmann U, Fechter H. The point of zero charge of natural
and synthetic ferrihydrite and its relation to adsorbed silicate.
Clay Miner. 1982;17:471–6.
46. Childs CW, Wells N, Downes CJ. Kokowai Springs, Mount
Egmont, New Zealand; Chemistry and mineralogy of the ochre
(ferrihydrite) deposit and analysis of the waters. J R Soc N Z.
1986;16:85–99.
47. Soma M, Seyama H, Yoshinaga N, Theng BKG, Childs CW.
Bonding state of silicon in natural ferrihydrites by X-ray photo-
electron spectroscopy. Clay Sci. 1996;9:385–91.
48. Filip J, Zboril R, Schneeweiss O, Zeman J, Cernik M, Kvapil P,
Otyepka M. Environmental applications of chemically pure nat-
ural ferrihydrite. Environ Sci Technol. 2007;41:4367–74.
49. Boyd T, Scott SD. Two-XRD-line ferrihydrite and Fe-Si-Mn
oxyhydroxide mineralization from Franklin Seamount, Western
Woodlark Basin, Papua New Guinea. Can Miner. 1999;37:973–90.
50. Pichler T, Veizer J. Precipitation of Fe(III) oxyhydroxide deposits
from shallow-water hydrothermal fluids in Tutum Bay, Ambitle
Island, Papua New Guinea. Chem Geol. 1999;162:15–31.
51. Machala L, Tucek J, Zboril R. Polymorphous transformations of
nanometric iron(III) oxide: a review. Chem Mater. 2011;23:3255–72.
52. Tucek J, Zboril R, Namai A, Ohkoshi S. e-Fe2O3: an advanced
nanomaterial exhibiting giant coercive field, milimeter-wave
ferromagnetic resonance, and magnetoelectric coupling. Chem
Mater. 2010;22:6483–505.
53. Brazda P, Kohout J, Bezdicka P, Kmjec T. a-Fe2O3 versus b-
Fe2O3: controlling the phase of the transformation product of e-Fe2O3 in the Fe2O3/SiO2 system. Cryst Growth Des.
2014;14:1039–46.
54. Mazzetti L, Thistlethwaite PJ. Raman spectra and thermal
transformations of ferrihydrite and schwertmannite. J Raman
Spectrosc. 2002;33:104–11.
55. Vallina B, Rodriguez-Blanco JD, Brown AP, Benning LG, Blanco
JA. Enhanced magnetic coercivity of a-Fe2O3 obtained from car-
bonated 2-line ferrihydrite. J Nanopart Res. 2014;16:2322.
56. Ruan HD, Frost RL, Kloprogge JT, Duong L. Infrared spec-
troscopy of goethite dehydroxylation III. FT-IR microscopy of
in situ study of the thermal transformation of goethite to hematite.
Spectrochim Acta. 2002;58:967–81.
57. Pannalal SJ, Crowe SA, Cioppa MT, Symons DTA, Sturm A,
Fowle DA. Room-temperature magnetic properties of ferrihy-
drite: a potential magnetic remanence carrier? Earth Planet Sci
Lett. 2005;236:856–70.
58. Foldvari M. Handbook of thermogravimetric system of minerals
and its use in geological practice. Occasional Papers of the
Geological Institute of Hungary, 213. Budapest: Geological
Institute of Hungary; 2011.
59. Towe KM, Bradley WF. Mineralogical constitution of colloidal
‘‘hydrous ferric oxides’’. J Coll Interface Sci. 1967;24:384–92.
60. Campbell AS, Schwertmann U, Campbell PA. Formation of
cubic phases on heating ferrihydrite. Clay Miner. 1997;32:
615–22.
61. Oliveira AC, Marchetti GS, do Carmo Rangel M. The effect of
the starting material on the thermal decomposition of iron oxy-
hydroxides. J Therm Anal Calorim. 2003;73:233–40.
62. Rendon JL, Serna CJ. IR spectra of powder hematite: effect of
particle size and shape. Clay Miner. 1981;16:357–81.
63. Peterson KM, Heaney PJ, Post JE, Eng PJ. A refined monoclinic
structure for a variety o ‘‘hydrohematite’’. Am Mineral.
2015;100:570–9.
64. Liu Q, Barron V, Torrent J, Eeckhout SG, Deng C. Magnetism of
intermediate hydromaghemite in the transformation of 2-line
ferrihydrite into hematite and its paleoenvironmental implica-
tions. J Geophys Res. 2008;113:B01103.
65. Ichiyanagi Y, Kimishima Y. Structural, magnetic and thermal
characterizations of Fe2O3 nanoparticle systems. J Therm Anal
Calorim. 2002;69:919–23.
66. Cannas C, Concas G, Gatteschi D, Musinu A, Piccaluga G,
Sangregorio C. How to tailor maghemite particle size in c-Fe2O3–
SiO2 nanocomposites. J Mater Chem. 2002;12:3141–6.
67. Tronc E, Chaneac C, Jolivet JP. Structural and magnetic
characterization of e-Fe2O3. J Solid State Chem. 1998;139:
93–104.
68. Sartoratto PPC, Caiado KL, Pedroza RC, da Silva SW, Morais
PC. The thermal stability of maghemite-silica nanocomposites:
an investigation using X-ray diffraction and Raman spectroscopy.
J Alloys Compd. 2007;434–435:650–4.
69. Zboril R, Mashlan M, Barcova K, Vujtek M. Thermally induced
solid-state syntheses of c-Fe2O3 nanoparticles and their trans-
formation to a-Fe2O3 via e-Fe2O3. Hyperfine Interact. 2002;
139(140):597–606.
70. Bukhtiyarova GA, Shuvaeva MA, Bayukov OA, Yakushin SS,
Martyanov ON. Facile synthesis of nanosized e-Fe2O3 particles
on the silica support. J Nanopart Res. 2011;13:5527–34.
71. Gich M, Roig A, Taboada E, Molins E, Bonafos C, Snoeck E.
Stabilization of metastable phases in spatially restricted fields: the
case of the Fe2O3 polymorphs. Faraday Discuss. 2007;136:345–54.
72. Sakurai S, Namai A, Hashimoto K, Ohkoshi S. First observation
of phase transformation of all four Fe2O3 phases
(c ? e ? b ? a). J Am Chem Soc. 2009;131:18299–303.
The influence of silicate on transformation pathways of synthetic 2-line ferrihydrite 421
123