the influence of social identity salience on appraisal...
TRANSCRIPT

1
UNIVERSITE DE GENEVE
FACULTE DE PSYCHOLOGIE ET
SECTION DE PSYCHOLOGIE
DES SCIENCES DE L’EDUCATION
Sous la direction de Prof. Klaus R. Scherer
THE INFLUENCE OF SOCIAL IDENTITY SALIENCE
ON APPRAISAL AND EMOTION
THESE
présentée à la faculté de Psychologie et
des Sciences de l’Education de l’Université de Genève
pour obtenir le grade de Docteur en Psychologie
par
Patricia GARCIA-PRIETO SOL CHEVALIER
(El Salvador, Australie, Suisse)
THESE N° 322
GENEVE 2003

2
ACKOWLEDGEMENTS
I would like to thank first my parents, because you always cared, because you always encouraged my curiosity and believed in me, you struggled and persevered through war and emigration because you wanted better for us. This thesis is for you.
Thank you Klaus Scherer, thank you for accepting me in your research team, know that without your support and encouragements I would have never finished. I also would like to thank Guido Gendolla, Gabriel Mugny, Susan Schneider and Vincent Yzerbyt for your precious feedback.
In Geneva, I have to thank my two research families. Thank you HEC for accepting another psychologist, I really felt at home with you. In particular, thank you Susan Schneider for your mentorship, you have marked me more thank you know. Erwan Bellard thanks for sharing 5 years of my day-to-day life, we drove each other mad with questions and ruminations about identity and diversity. I sorely miss you! Thank you Geneva Emotion Research Groups past and present. Klaus, you took care of our wine education with the same professionalism than our academic education. Blandine Mouron, you are unique! Special thanks to Tom Johnstone, Carien van Reekum, and Veronique Tran for all the wonderful conversations, the food, the wine, the beers, and the emotions we shared. Special thought for Tanja Wranik, not only have you been a great colleague and friend, but you were courageous enough to share your office with me in the last 6 months of the thesis.
Thank you to all the wonderful colleagues I had at the University of Queensland when the thesis was just an idea, and of course a very special thought for Cindy Gallois who fostered my intercultural sensibilities and convinced me that Clinical Psychology was not for me.
My friends, and my families in San Salvador, Brisbane and Geneva please forgive me for my moments of autism and selfishness during this thesis. I know you must have often wondered what was that fuss all about, is she finally done? I am so thankful that you are still talking to me.
In the end, I know that the question of identity and emotion remains for me more that just a research question. It reflects, in part, an ongoing personal struggle with determining who I am? What is home for me? How to conciliate those identities that mattered to me during my childhood and adolescence in San Salvador, El Salvador (family, social class, a female), with those that mattered after my migration to Brisbane, Australia (migrant, Latin-American, psychology student), and the ones that matter now in Geneva, Switzerland (foreigner, doctoral candidate, mother, wife)? Alexandre and Hadrien, know that you are my home. Thank you for giving me the most of you.
Last but not least, I would like to thank the program carriEre académique, financed by the Swiss Federal Program for equality between men and women and by the University of Geneva. These last 6 months of sabbatical allowed me to complete my thesis.

TABLE OF CONTENTS
CHAPTER 1 ..............................................................................................................................................................................5
INTRODUCTION AND REVIEW OF THE LITERATURE....................................................................................................................5 1.1. Introduction and overview ..........................................................................................................................................5
1.1.1. Working definition of emotion............................................................................................................................7 1.2. The cognitive appraisal approach to emotion.............................................................................................................8
1.2.1. Overview of appraisal theory and research .........................................................................................................8 1.2.2. The role of the social context in appraisal theories ...........................................................................................13 1.2.3. Evidence from cross-cultural research on emotions: The mediating role of the self-concept ...........................15
1.3. Social identity theory ................................................................................................................................................17 1.3.1. Overview of social identity theory ....................................................................................................................17 1.3.2. Working definition of “salience” ......................................................................................................................19 1.3.3. Conditions that enhance or inhibit social identity salience: The role of motivation and the social context ......19 1.3.4. Early evidence supporting the influence of social identity salience on appraisals and emotions ......................22 1.3.5. Intergroup emotion: Extending appraisal theories to intergroup contexts.........................................................26
1.4. The influence of social identity salience on Scherer’s appraisal dimensions ...........................................................31 1.4.1. Social identity salience effects on goal significance .........................................................................................31 1.4.2. Social identity salience effects on coping potential...........................................................................................33 1.4.3. Social identity salience effects on compatibility with personal standards and social norms .............................36 1.4.4. Social identity salience effects on emotion (nature and intensity) ....................................................................37
1.5. Major research questions emerging from the review of the literature......................................................................38 1.6. Overview of the research ..........................................................................................................................................39
1.6.1. Aims..................................................................................................................................................................39 1.6.2. Design...............................................................................................................................................................39 1.6.3. Hypotheses........................................................................................................................................................40
CHAPTER 2 ............................................................................................................................................................................41
FIRST EXPERIMENT.........................................................................................................................................................41 2.1. Overview...................................................................................................................................................................41
2.1.1 Overview of the hypotheses ...............................................................................................................................42 2.2. Method......................................................................................................................................................................44
2.2.1. Participants .......................................................................................................................................................44 2.2.2. Procedure, manipulations and materials............................................................................................................44
2.3. Results ......................................................................................................................................................................50 2.3.1. Overview of the analyses ..................................................................................................................................50 2.3.2. Preliminary analyses .........................................................................................................................................50 2.3.3. Manipulation checks .........................................................................................................................................52 2.3.4. Analyses of appraisal and emotion ratings........................................................................................................53
2.4. Discussion.................................................................................................................................................................64 2.4.1. The influence of social identity salience on appraisals and emotions ...............................................................64 2.4.2. Appraisal as a mediator between social identity and emotion? .........................................................................65 2.4.3. Limitations and general conclusions for this study ...........................................................................................66
CHAPTER 3 ............................................................................................................................................................................69
SECOND EXPERIMENT....................................................................................................................................................69 3.1. Overview...................................................................................................................................................................69
3.1.1. Overview of the hypotheses ..............................................................................................................................71 3.2. Method......................................................................................................................................................................76
3.2.1. Participants .......................................................................................................................................................76 3.2.2. Procedure ..........................................................................................................................................................77 3.2.3. Manipulations, materials and measures ............................................................................................................79
3.3 Results .......................................................................................................................................................................87 3.3.1. Overview of the analyses ..................................................................................................................................87 3.3.2. Preliminary analyses .........................................................................................................................................87 3.3.3. Manipulation checks .........................................................................................................................................88 3.3.4. Analyses of appraisals and emotion ratings ......................................................................................................89
3. 4. Discussion..............................................................................................................................................................117 3.4.1. Appraisal and emotion responses to other’s choice to collaborate and to compete in this PDG .....................120 3.4.2. The influence of social identity salience on appraisals ...................................................................................120 3.4.3. The influence of social identity salience on emotions.....................................................................................123 3.4.4. The potential bias of outcome (number of points gained)...............................................................................124 3.4.5. Appraisal as a mediator between social identity salience and emotion? .........................................................124 3.4.6. General conclusions ........................................................................................................................................124

CHAPTER 4 ..........................................................................................................................................................................126
THIRD EXPERIMENT......................................................................................................................................................126 4.1. Overview.................................................................................................................................................................126
4.1.1. Hypotheses......................................................................................................................................................129 4.2. Method....................................................................................................................................................................130
4.2.1. Participants .....................................................................................................................................................130 4.2.2. Procedure ........................................................................................................................................................130 4.2.3. Manipulations, materials and measures ..........................................................................................................132
4.3 Results .....................................................................................................................................................................137 4.3.1. Overview of the analyses ................................................................................................................................137 4.3.2. Preliminary analyses .......................................................................................................................................137 4.3.3. Manipulations checks......................................................................................................................................138 4.3.4. Analyses of appraisal and emotion ratings......................................................................................................140
4.4. Discussion...............................................................................................................................................................169 4.4.1. Appraisal and emotion responses to other’s choice to collaborate and to compete.........................................169 4.4.2. The influence of social identity salience on appraisal .....................................................................................172 4.4.3. The influence of social identity salience on emotions.....................................................................................173 4.4.4. The potential bias of outcome (number of points gained). ..............................................................................173 4.4.5. Appraisal as a mediator between social identity salience and emotion? .........................................................175 4.4.6. General conclusions ........................................................................................................................................175
CHAPTER 5 ......................................................................................................................................................................... 180
GENERAL DISCUSSION................................................................................................................................................ 180 5.2. Manipulating social identity salience .................................................................................................................... 185
5.2.1. The salience of meaningful social identities .................................................................................................. 185 5.2.2. The impact of context, time and ongoing interaction..................................................................................... 187 5.2.3. The impact of individual differences ............................................................................................................. 188
5.3. Inducing appraisals and emotions ......................................................................................................................... 189 5.3.1. The use of written vignettes ........................................................................................................................... 189 5.3.2. The use of the computer negotiation task and the PDG ................................................................................. 190
5.4. Measuring appraisals and emotions through self-report....................................................................................... 192 5.5. Implications ........................................................................................................................................................... 194
5.5.1. Implications for research and theory.............................................................................................................. 194 5.5.2. Practical implications..................................................................................................................................... 195
5.6. Future directions and conclusions......................................................................................................................... 196
APPENDIX A.1. SELECTED PRESS ARTICLES ON THE PROPOSED MERGER BETWEEN THE UNIVERSITIES ................................................................................................................................................................... 211
APPENDIX A.2. COLLECTIVE SELF-ESTEEM QUESTIONNAIRE ADAPTED FOR THIS STUDY (FRENCH VERSION) ............................................................................................................................................................................ 212
APPENDIX A.3. VIGNETTES, AND APPRAISAL AND EMOTION QUESTIONNAIRES ...................................... 213
APPENDIX A.4. ADDITIONAL STATISTICAL INFORMATION............................................................................... 214
A.4.1. ANALYSES OF APPRAISALS............................................................................................................................ 214 A.4.2. ANALYSES OF EMOTION RATINGS................................................................................................................ 215 A.4.3. MEDIATION ANALYSES.................................................................................................................................... 216
APPENDIX B.1. COUNTERBALANCING DESIGN ...................................................................................................... 217
APPENDIX B.2. COPIES OF WRITTEN MATERIALS ................................................................................................ 218
B.2.1. PHONE SCRIPT FOR THE EXPERIMENTER .................................................................................................... 218 B.2.2. INSTRUCTIONS FOR PARTICIPANTS IN THE HIGH SOCIAL IDENTITY CONDITION............................ 219 B.2.3. INSTRUCTIONS FOR PARTICIPANTS IN THE LOW SOCIAL IDENTITY CONDITION............................. 221 B.2.4. DESCRIPTION OF THE PORSCHE COMPANY CASE ..................................................................................... 222 B.2.5. DESCRIPTION OF THE ROLE OF THE R&D DEPARTMENT......................................................................... 223
APPENDIX B.3. MATERIALS PRESENTED IN THE COMPUTER PROGRAM ..................................................... 224
B.3.1. INTRODUCTION SCREEN 1 ............................................................................................................................... 224 B.3.2. INTRODUCTION SCREEN 2 ............................................................................................................................... 225 B.3.3. PRACTICE NEGOTIATION SCREEN 1 ............................................................................................................. 226 B.3.4. PRACTICE NEGOTIATION SCREEN 2 .............................................................................................................. 227 B.3.5. REMINDER OF RULES SCREEN........................................................................................................................ 228

B.3.6. REAL NEGOTIATION SESSION SCREEN 1...................................................................................................... 229 B.3.7. REAL NEGOTIATION SESSION SCREEN 2...................................................................................................... 230 B.3.8. REAL NEGOTIATION SESSION SCREEN 3...................................................................................................... 230
APPENDIX B.4. COMPUTERIZED QUESTIONNAIRES ............................................................................................. 232
B.4.1. APPRAISAL QUESTIONS.................................................................................................................................... 232 B.4.2. EMOTION QUESTIONS....................................................................................................................................... 233 B.4.3. SOCIAL IDENTITY MANIPULATION CHECK QUESTIONS.......................................................................... 234 B.4.5. DEMOGRAPHIC INFORMATION QUESTIONS................................................................................................ 235
APPENDIX B5. ADDITIONAL STATISTICAL INFORMATION................................................................................ 236
B.5.1. ANALYSES OF APPRAISALS............................................................................................................................. 236 B.5.2. ANALYSES OF EMOTION RATINGS (ALL CASES)........................................................................................ 241 B.5.3. ANALYSES OF POSITIVE AND NEGATIVE EMOTION VARIABLES (ALL CASES).................................. 245 B.5.4. ANALYSES OF POSITIVE AND NEGATIVE EMOTION VARIABLES (CASES WITH VALUES ABOVE 1)........................................................................................................................................................................................... 245 B.5.5. MEDIATION ANALYSES .................................................................................................................................... 248
APPENDIX C.1. THOMAS-KILMANN QUESTIONNAIRE (FRENCH VERSION) .................................................. 249
APPENDIX C.2. COPIES OF WRITTEN MATERIALS ................................................................................................ 250
C.2.1. SCRIPTS FOR THE ORAL FEEDBACK.............................................................................................................. 250 C.2.1.1. General Feedback ........................................................................................................................................... 250 C.2.1.2. Feedback for Participants in the High Social Identity Salience Condition ..................................................... 251 C.2.1.2. Feedback for Participants in the Low Social Identity Salience Condition ...................................................... 251
C.2.2. WRITTEN INSTRUCTIONS PACKAGES ........................................................................................................... 252 C.2.2.1. Instructions for Participants in the High Social Identity Salience Condition.................................................. 252 C.2.2.2. Instructions for Participants in the Low Social Identity Salience Condition................................................... 254
APPENDIX C.3. COMPUTERIZED QUESTIONNAIRES............................................................................................. 255
C.3.1. APPRAISAL QUESTIONS.................................................................................................................................... 255 C.3.2. SOCIAL IDENTITY MANIPULATION CHECK QUESTIONS.......................................................................... 257
APPENDIX C.4. ADDITIONAL STATISTICAL INFORMATION............................................................................... 258
C.4.1. ANALYSES ON APPRAISALS ............................................................................................................................ 258 C.4.2. ANALYSES ON EMOTIONS (ALL CASES)....................................................................................................... 264 C.4.3. ANALYSES ON POSITIVE AND NEGATIVE EMOTION VARIABLES (ALL CASES) ................................. 268 C.4.4. ANALYSES ON POSITIVE AND NEGATIVE EMOTION VARIABLES (CASES WITH VALUES ABOVE 1)........................................................................................................................................................................................... 269

4
CHAPTER 1
INTRODUCTION AND REVIEW OF THE LITERATURE
1.1. Introduction and overview
Cognitive appraisal theories of emotion suggest that our emotions are determined by
the cognitive evaluation or appraisal of an event that is personally relevant to us. The
results of our appraisal of the potential consequences of an event determine the
emotion we feel (Frijda, 1986; Lazarus 1991a; Ortony, Clore & Collins, 1988;
Scherer, 2001a; Smith & Ellsworth, 1985). From this perspective, there are as many
potential emotion responses to an event as there are ways of appraising it. This
approach has significantly advanced our understanding of emotion as a complex
individual process that consists of multiple components, including cognition,
physiological changes, motor expression, motivation, and subjective feelings (Frijda,
1986; Scherer, 2001a). However, despite explicit acknowledgements from appraisal
theorists that the social context can influence the emotion process (e.g., see Lazarus,
1991b) and that emotions have important social functions (e.g., Frijda & Mesquita,
1994), few studies have directly examined social context effects (for exceptions see
Jakobs, Fischer, & Manstead, 1997; Jakobs, Manstead & Fischer; 1999a, 1999b;
Kappas, 1996). Moreover, some authors maintain that current appraisal theories
remain unsatisfactory in accounting for the effects of the social context and of
ongoing interaction on the emotion process (see Manstead, 1991; Manstead &
Fischer, 2001; Parkinson, 2001; Parkinson & Manstead, 1993; Parkinson & Manstead,
1992). For these authors, appraisal researchers have been primarily concerned with
how appraisal of events relevant to us as individuals can determine the emotions we
feel as individuals, almost irrespective of the social context.
Notwithstanding, the appraisal approach to emotions provides a particularly useful
framework for the study of emotions within their social context because it
conceptualizes emotion as a process in which subjective appraisal and personal
meaning are fundamental, and allows for an unlimited range of emotion responses. In
addition, several appraisal theorists have taken the social context into account through

5
the elaboration of cognitive appraisal dimensions that help evaluate the role of
other(s) in causing the emotion-eliciting event, and that help evaluate the
compatibility of the event with social norms (for a review see Ellsworth & Scherer,
2003). Empirical research has confirmed the sensitivity of these specific appraisal
dimensions to the influence of national culture (Mesquita, 2003; Scherer, 1997).
However, appraisal theorists have paid little attention to the identification of
psychological mechanisms by which the social and cultural aspects of the context may
systematically influence these specific appraisal dimensions and the resulting
emotion.
Building on connections between Scherer’s appraisal theory of emotion (Scherer,
1984a,1984b) and social identity theory (Tajfel, 1978; Tajfel & Turner, 1979; Tajfel
& Turner, 1986) I argue that social identity salience is one of these mechanisms.
Indeed, the intergroup relations area have accumulated abundant empirical evidence
suggesting that when an individual’s social identity becomes salient in an intergroup
context it can determine cognitive focus, how information is perceived, as well as
affective and behavioral responses (for a recent review see Brown, 2000). More
importantly, researchers in the field of intergroup relations are becoming increasingly
interested in the study of intergroup emotions from the appraisal theory perspective
(Cotting, 1999; Dijker, 1987; Dijker, Koomen, van den Heueven, & Frijda, 1996;
Gordijn, Wigboldus, & Yzerbyt, 2001; Dumont, Yzerbyt, Wigboldus, & Gordijn, in
press; Mackie & Smith, 2002; Mackie, Devos & Smith, 2000; Smith, 1993; 1999;
Smith & Ho, 2002; Vanman & Miller, 1993; Yzerbyt, Dumont, Gordijn &
Wigboldus, 2002; Yzerbyt Dumont, Wigboldus & Gordijn, in press). In contrast to
existing appraisal research, these researchers are not interested in emotions
experienced as individual, but rather in emotions experienced in intergroup settings as
members of social groups and about others as members of social groups.
However, up till now, this research has concentrated on testing whether the effect of
social identity on intergroup behaviour (i.e., suggested by measures of action
tendencies) is mediated by specific emotions (e.g., anger, fear, guilt). In fact, only a
few researchers have directly tested the links between specific appraisals dimensions
and emotions intergroup contexts (for exceptions see Mackie, Devos, & Smith, 2000;

6
Dumont, Yzerbyt, Wigboldus, Gordjin, in press). Moreover, little is known about the
ways in which social identity salience might affect some of the standard appraisal
dimensions proposed by existing appraisal theories. The research in this thesis
addressed this question by testing the influence of social identity salience on those
specific appraisal dimensions (as defined by Scherer’s appraisal theory, 1984a;
1984b) that have been identified as being particularly sensitive to the effects of the
socio-cultural context.
This chapter presents brief reviews of appraisal theories of emotions and social
identity theory, including basic assumptions and relevant evidence, and a summary of
recent research into intergroup emotion that has established links between social
identity, appraisals and emotions. After discussing potential connections between
concepts from social identity theory (Tajfel & Turner, 1986) and specific appraisal
dimensions as proposed by Scherer’s (1984a, 1984b) appraisal theory, this chapter
concludes with an overview of the major research questions that emerge from the
literature and of the three experiments designed to address these questions.
1.1.1. Working definition of emotion
Given the lack of consensus on a single definition of emotion it seems essential to
establish from the outset what is meant by “emotion” throughout this work. Although
the terms moods, affect and emotions are often used interchangeably, not all affective
phenomena should be characterized as "emotions". For Davidson (1994) moods are
always present, like a background, and emotions are like "phasic perturbations" that
are imposed on this background. For Frijda (1993) emotions can be distinguished
from moods in that emotions involve a relationship to a specific object and emotion
behavior that is directed toward or away from someone or something. In addition,
emotions can also be differentiated from affective dispositions, that represent the
tendency a person will have to feel positively or negatively (Frijda, 1994). For
Scherer (2000), emotions are "episodes of coordinated changes in several components
(including at least neuro-physiological activation, motor expression, and subjective
feelings but possibly also action tendencies as well as cognitive processes) in response
to external and internal events of major significance to the organism" (p.3). This

7
research focused on studying the subjective feeling component of emotion as
measured by self-report indicators.
1.2. The cognitive appraisal approach to emotion
1.2.1. Overview of appraisal theory and research
In this section I want to do three things. First, to present a brief overview of the major
concepts and basic assumptions underlying most appraisal theories, with a focus on
Scherer's (1984a, 1984b) multi-component model of emotions, and to review some of
the supporting evidence and common critiques. Second, to discuss the role that the
social context plays in current appraisal theories. Finally, I discuss why the self-
concept emerges as a potential key mediator of the effects of the social and cultural
aspects of the context on the emotion process.
The origins of appraisal theories can be traced back to the work of Magda Arnold
(1960) who was the first author to postulate explicitly that people are continuously
evaluating or “appraising” the relevance of the environment for their well being and
that these appraisals help account for different emotions. Soon after, Richard Lazarus
(1966; 1968) made the distinction between “primary appraisal” of an event’s
implications for one's well-being and “secondary appraisal” of one's ability to cope
with the situation. Both researchers emphasized the fact that it is the personal
meaning we give to ambiguous stimuli through appraisal that determines the emotions
we feel. Since then, a growing body of appraisal theories of emotion have emerged,
each specifying a set of appraisal dimensions in an attempt to better predict the
elicitation and differentiation of emotions (Frijda, 1986; Lazarus, 1991a; Roseman,
1984, 1991; Scherer, 1984a, 1984b, 2001a; Smith & Ellsworth, 1985). Specifically, in
the 1980's four appraisal theories were developed that proposed rather similar
appraisal dimensions (Frijda, 1986; Roseman, 1984, 1991; Scherer, 1984a, 1984b;
Smith & Ellsworth, 1985). These basic appraisal dimensions have been recently
reviewed by Ellsworth and Scherer (2003) (see table 1.1 for a list of the basic
dimensions).

8
Given the high degree of convergence between different appraisal theories we will
focus on the appraisal dimensions suggested by Scherer (1984a, 1984b). When
Scherer first described his component process model of emotions (see Scherer, 1984a
and 1984b1) he proposed five appraisal dimensions or “stimulus evaluation checks”
(SEC), namely: Perceived changes in the environment (i.e., Novelty), perceived
intrinsic valence of the event (i.e., Intrinsic pleasantness), perceived significance of
the event for goals (i.e., Goal Significance), perceived control, power and adaptability
to the consequences of the event and perceived causal agent of the event (i.e., Coping
Potential /Agency) and perceived compatibility with internal self-standards and
external social norms (i.e., Compatibility with Personal Standards and Social Norms).
For Scherer these “stimulus evaluation checks” are performed in the same sequential
order, although often in an automatic and sometimes unconscious way, when
confronted with an emotion antecedent event (Scherer, 1984a, 1984b). Thus, the
different “appraisal profiles” that result from different evaluations of an event,
determine the different emotional responses to an event.
Table 1.1. Comparative overview of major appraisal dimensions (adapted from
Ellsworth & Scherer, 2003).
Frijda (1986) Roseman (1984) Scherer (1984a,b) Smith/Ellsworth
(1985) Change Familiarity
Novelty suddenness familiarity
Attentional activity
Valence Focality
Appetitive/aversive motives
Intrinsic pleasantness Goal significance
concern relevance
Pleasantness Importance
Certainty Certainty outcome probability Certainty Intent / Self-other Agency cause: agent
cause: motive Human agency
Value relevance Compatibility with standards
external internal
Legitimacy
1Although the measures of appraisal dimensions used in this thesis were based on these earlier descriptions of appraisal dimensions we should note that Scherer's theory has continued to evolve and recently (see Scherer, 2001a) the appraisal dimensions have been greatly refined.

9
The first two appraisal dimensions, novelty and intrinsic pleasantness often operate
automatically and unconsciously and determine the level of attention devoted to the
event. The other three appraisal dimensions require more complex cognitive
processing due to more elaborated schema processing, conceptual reasoning or
comparison with internal and external standards. Scherer’s (1984a, 1984b) hypothesis
is that after a fast and almost automatic evaluation of the first two appraisal
dimensions that establishes the impact of the event on the person’s general well-
being, the other appraisal dimensions are evaluated: How does the event influence my
goals? What or who caused the event? Do I have control and power over the
consequences of the event? Am I capable of adapting to its consequences? Are the
consequences of the event compatible with my personal standards and with societal
norms? Two persons can thus appraise the same event differently and have different
emotional responses. If one person evaluates the event as important to her goals and
needs and as obstructing the achievement of these goals, to be beyond her control, to
have consequences that she can cope with, but that violates societal norms of justice,
she may feel anger. If the other person was to evaluate the same event as moderately
relevant to her goals and needs, as obstructing the achievement of these goals, to be
beyond her control, and as having consequences that are difficult to adapt to, she may
feel anxiety or worry. In this sense, there are as many emotion types as there are
appraisal profiles.
Appraisal theories have received a considerable amount of empirical support from
self-report studies, particularly in terms of the predictive power of appraisal
dimensions in differentiating between emotions. In general, these studies have
induced emotions by either asking participants to imagine an event or to remember a
past experience when they experienced a particular emotion (Folkman & Lazarus,
1988; Frijda, Kuipers & ter Schure, 1989; Smith & Ellsworth, 1985); by presenting
participants with vignettes, or scenarios that correspond to predicted appraisal
dimension profiles for a particular emotion (Roseman, 1984; Smith, Haynes, Lazarus,
& Pope, 1993; Smith & Lazarus, 1993); or by studying in-vivo situations (Scherer &
Ceschi, 1997; Smith & Ellsworth, 1987). Participants are typically asked to respond to
questions about their emotions, and to questions concerning their evaluation of event
in terms of the different appraisal dimensions.

10
Nonetheless, methodological questions have been raised about the use of self-report
(Parkinson & Manstead, 1993; Parkinson, 1997; Parkinson, 2001) as in general
participants are being asked to describe both the emotion experienced and the
appraisal dimensions that corresponds to the emotion. The basic criticism is that
participants' self-reports could be more representative of their stereotypes about what
appraisals correspond to what emotions, than of the real relationship that may exist
between appraisals and emotion response. More recently, Scherer and Ellsworth
(2003) have reviewed additional criticisms of self-report methods used by appraisal
researchers including social desirability bias, the difficulty for the participant to
access the information necessary to describe processes involved in appraisal and
emotion, and the bias imposed by the use of specific appraisal question developed
from theory that may exclude other unknown appraisal dimensions.
In addition to self-report, growing numbers of researchers in the area have turned to
non-verbal measurements including motor expression and physiological responses.
Recent empirical evidence has supported the link between appraisals and other
components of emotion such as motor-expressive, including the voice (Banse &
Scherer, 1996), facial expressions (Smith & Scott 1997), and physiological responses
(van Reekum, 2000; Smith, 1989). However, as discussed by Scherer and Ellsworth
(2003) non-verbal measures also have important drawbacks, including the difficulty
in identifying reliable non-verbal indicators for emotion and appraisals (e.g.,
comparable to facial muscles as indicators of differential expressions of emotion) and
the difficulty in establishing the meaning of the different indicators. Furthermore,
these authors suggest that instead of trying to determine the best method to study
emotions, it might be more reasonable for researchers in the area as a whole to try to
use multiple methods whenever possible, but above all to chose their methods as a
function of their research question: Physiological measurements might not be the
particularly suited to study appraisals of attribution and causality.
Finally, although the question of the determination of different emotion types has
been extensively addressed, the question of emotion intensity has received less
attention by appraisal theorists (Clore, 1994b; Frijda, Ortony, Sonnemans & Clore,
1992). This is mainly due to the complexity of its multidimensional structure and the

11
resulting difficulty in operationalization and measurement (Frijda, Ortony,
Sonnemans & Clore, 1992; Sonnemans & Frijda, 1994). According to Frijda and his
colleagues (1992), emotion intensity will be a function of factors linked to the person
(i.e., individual differences in terms of emotion response threshold or in terms of
propensities for feeling certain types of emotion); the context (i.e., such as the
expectedness of the event, perceived possibilities of coping with the consequences,
support, etc.); the strength of concerns and goals at stake, and the seriousness or value
of the event in relation to these concerns and goals. More importantly, these authors
have argued that if conceptually it is assumed that the multiple components of the
emotion process (i.e., cognitive processes, action readiness, subjective feelings, and
physiological changes) contribute to the determination of it’s intensity, then we have
to take into account that: 1) the proposed components have different dimensions
reflecting the effect of emotion, 2) these dimension may sometimes vary
independently (e.g., the strength of bodily changes and the vigor of the emotional
impulse); and 3) dimensions are assessed in different ways. Therefore, they argue that
it is more appropriate and conceptually meaningful to talk about “dimensions of
emotion intensity” rather than about a unitary “emotion intensity”. In fact, Sonnemans
and Frijda (1994) have empirically demonstrated that overall intensity of emotions as
felt by subjects can vary along five relatively independent dimensions: The
recollection of the event (e.g., to what extent did the event “pop” into your mind
during the first 24 hours after the event?), the duration of the emotion, the strength of
the action tendency, the importance of bodily changes, and the importance of the
effect of the emotion on behaviors and beliefs in the long term. Edward’s research
(1998) further illustrates the complexity of the relationships between appraisals and
emotion intensity. His results revealed that there was not “one” appraisal dimension
that systematically determined emotion intensity. On the contrary, for different
emotions, different appraisal dimensions acted as “best predictor” of felt peak
amplitude (i.e., the maximum intensity reported for an emotion). For instance, for fear
it was the importance of goal obstructiveness and degree of unexpectedness, for anger
it was feeling socially superior and low self-evaluation, for joy-elation it was
importance of long-term consequences, for happiness it was extent of immediate goal
conduciveness, and for sadness it was difficulty of short term adjustment to the
situation.

12
1.2.2. The role of the social context in appraisal theories
Several authors (Manstead & Fischer, 2001; Parkinson, 2001; Parkinson & Manstead;
1992, 1993) have argued that current appraisal theories of emotion fail to account for
the influence of the social context on the elicitation of emotions in everyday social
situations. One of the major criticisms is that researchers have concentrated too much
on studying “individual” cognitive representations of emotion-antecedent events
rather than on “interpersonally distributed” cognitive representations in ongoing
relationships unfolding in a social context. For example, it is suggested that important
information is provided by the dynamic structure of the social and physical context
through implicit and explicit rules that can shape the interpretation of individuals that
occupy specific roles (Parkinson & Manstead, 1993). More recently, Parkinson (2001)
has argued that in real life, emotions often depend on the way that the people involved
through mutual negotiation represent the ongoing interpersonal situation, and often
this exchange occurs at a nonverbal level.
Manstead and Fischer (2001) have also highlighted the importance of taking into
account the influence of the presence of other people, whether real or represented, on
appraisals and emotion responses. For these authors one should consider that people
react not just to an event but also to variations in the social context in which the event
occurs. For example, thinking about how “others” may react to an event (or might
react) can help us determine norm compatibility; it can also help us cope with a
negative event, or make us feel better about a positive event; and also it can influence
our reappraisal of an event (e.g., something first appraised as a threat can be re-
appraised as positive). In addition, Manstead & Fischer (2001) propose a new
appraisal dimension called “social appraisal” expected to be quite distinct from the
existing appraisal dimensions which account for the perceived responsibility of others
(e.g., appraisal dimension of causal agency) and for the expected reactions of others
(e.g., appraisal dimension of norm compatibility). Manstead and Fischer (2001) define
“social appraisal” as “the appraisals of the thoughts, feelings and actions of other
persons in response to an emotional situation” (p. 223). Unfortunately, these authors
do not explicitly describe how this new social appraisal dimension could be integrated
with the existing appraisal dimensions, and thus it becomes difficult to judge whether

13
creating a new dimension may have some added value in accounting for the impact of
social contextual factors.
While acknowledging these authors insistence on the social aspects of appraisal,
Scherer (2001b) has questioned the need to postulate distinct social appraisal
processes, suggesting that it may be more appropriate to examine the mechanisms by
which the social context affects existing appraisal criteria models. For example, one
could examine in which way appraisal and emotion responses vary in the presence on
another person and as a function of the degree of perceived importance or closeness of
“the other” (e.g., whether the other is just another person, a significant other, or a
member of a valued social group).
In the recently published Handbook of Affective Sciences, Ellsworth and Scherer
(2003) reviewed some of the existing appraisal dimensions that are heavily involved
in evaluating the social consequences of an event. First, the authors identified those
dimensions “which are used to evaluate the compatibility of an action with the
perceived norms of a salient reference group” (Ellsworth & Scherer, 2003; p.581),
such as Scherer’s (1984a) dimensions of compatibility with external standards (e.g.,
social norms), Smith and Ellsworth’s (1985) dimension of legitimacy, and Frijda’s
(1986) dimension of value relevance. Second, they draw attention to dimensions
involved in the “evaluation of one's behaviour with reference to the self ideal, one's
social identity or self-concept” (Ellsworth & Scherer, 2003, p.581), such as Scherer’s
(1984a) dimension of compatibility with internal standards.
The important role of these more cognitively complex appraisal dimensions in
reflecting aspects of the social context is highlighted by results from cross-cultural
research on emotions. Indeed, culture is the “social factor” that has received the most
attention by appraisal researchers. In the next section this literature is briefly reviewed
(for a detailed review see Mesquita, 2003).

14
1.2.3. Evidence from cross-cultural research on emotions: The mediating role of
the self-concept
Appraisal theory postulates that if people from different cultures appraise the same
event in the same way they should experience the same emotion, but if they appraise
the same event differently they should experience different emotions (see Mesquita &
Frijda, 1992; Roseman, Dhawan, Rettek, Naidu & Thapa, 1995). For example, it has
been shown that appraisal profiles for sadness, fear and anger show a high degree of
universality (see Ekman & Friesen, 1971; Wallbott & Scherer, 1988), but there is also
evidence for sizeable cultural differences for these and other emotions in terms of
their relative frequency and intensity (Matsumoto, 1989; Mesquita & Frijda, 1992;
Scherer, 1997; Wallbott & Scherer, 1988). Scherer (1994) has proposed that across
cultures we may share universal “modal” emotions characterized by recurring
prototypical patterns of appraisals and of the corresponding subjective feelings, motor
expressions, physiological changes and action tendencies. Thus, we can expect people
in different countries to evaluate events using similar appraisal dimensions: This is
proposed to be the universal aspect of the emotion process. Nonetheless, given that
appraisal is a highly subjective process dependent on a person’s perception of goals,
causes, coping potential and norms, and given that people from different cultures have
been shown to have rather different hierarchies of goals, values and beliefs (for
examples see Hofstede, 1980; Schwartz, 1992; Triandis, 1990, 1996) we can expect
that in different cultures the same event may lead to quite different appraisals and
emotion responses (Frijda & Mesquita, 1994; Lazarus, 1991b; Mesquita, 2003;
Mesquita & Frijda, 1992; Mesquita, Frijda & Scherer, 1997).
In support of theoretical predictions (Ellsworth, 1994; Mesquita, 2003; Mesquita &
Ellsworth, 2001), it has been shown that cross-cultural differences are more likely to
emerge on the more cognitively complex appraisal dimensions such as perceived
obstacles to our goals (i.e., goal conduciveness/obstructiveness), causal attribution
structures (i.e., causal agency/responsibility), and perceptions of personal self-
standards and societal norms (i.e., compatibility with internal and external standards)
such as fairness and morality (Ellsworth, 1994; Scherer, 1997). Results of a cross-
cultural study on emotions conducted in 37 countries supported both the

15
universality of the basic appraisal dimensions and the cultural specificity of the more
cognitively complex dimensions of causal attribution (i.e., internal/external) and norm
compatibility (i.e., perceived morality) (Scherer, 1997). More recently, Mesquita
(2003) reviewed a large body of cross-cultural research on emotion that suggested that
differences on cultural models are more likely to be reflected on appraisals of causal
agency, fairness, morality, and interpersonal engagement2.
There is evidence that the self-concept plays a powerful mediating role in culture
effects on emotion. Markus and Kitayama (1991, 1994) suggest that the way the self
is “construed” in a given culture can influence appraisals of social situations and
relationships, including emotional relationships. In their words: “…emotional
experience should vary systematically with the construal of the self” (Markus &
Kitayama, 1991, p.235). They have identified two types of self-construal: Independent
and interdependent. In cultures that encourage an independent self-construal, the
individuals view the self as separate from the social context, they tend to promote
their own goals, give importance to internal attributes (e.g., abilities), and think of
others as important only for social comparison. In these cultures, individuals are more
effective if they are well able to experience, and express, and regulate ego-focused
emotions like anger, frustration, etc. In cultures that encourage an interdependent self-
construal, individuals view the self as interconnected with the social context, tend to
promote group goals, give importance to external attributes (e.g., organizational role),
and think of the relationship to others in specific contexts to define the self. In these
cultures individuals are more effective if they are well able to experience, express and
regulate other-focused emotions like sympathy, shame, etc. The work of Markus and
Kitayama (1991) is important because it makes concrete propositions about how the
self-concept is shaped by culture affecting cognition and consequently emotion
experience and expression.
Though it can be argued that the sense of “self” may not be a necessary condition for
the elicitation of emotion (for a discussion see Frijda, 2001), the self has an important 2 Mesquita (2003) has also argued that appraisal researchers need to consider how different cultures construe the concept of “appraisal” as a process of meaning making and in particular the extent to which individuals perceive appraisals to exist in the head of individuals or as experienced and negotiated in a given situation.

16
influence on different aspects of emotional experience (for a recent review see Leary,
2003). Consequently, theories that study the interaction between the social context
and the self can help us understand how the self might mediate the effect of the socio-
cultural context on the emotion process. A theory in this tradition that has high
potential in that respect is social identity theory (Tajfel & Turner, 1986). Proponents
of this theory have described when, how and why the self-concept is affected by
membership in social groups in intergroup settings and have studied the implications
for the enhancement of intergroup relations.
1.3. Social identity theory
1.3.1. Overview of social identity theory
“…the assumption is made that, however rich and complex may be the individuals’
view of themselves in relation to the surrounding world, social and physical, some
aspects of that view are contributed by the membership of certain social groups or
categories. Some of these memberships are more salient than others; and some may
vary in salience in time and as a function of social situation” (Tajfel, 1981, p.255).
In 1972 Tajfel defined social identity as “the individual’s knowledge that he belongs
to certain social groups together with some emotional and value significance to him of
this group membership” (p.292). Social identity theory proposes that in situations
involving high ingroup salience, the available cognitive representations and
stereotypes of ingroups and outgroups affect how “the self” is defined potentially
leading individuals to act like the “ingroup stereotype” in terms of attitudes, beliefs,
norms, affective reactions, and behaviours (Turner, 1982). In this view, the
individual’s behaviour toward a member of a target outgroup is suggested to be the
result of social categorization processes and stereotypical attributes implied by group
membership rather than of personality characteristics (Tajfel, 1978, p.42).
An important feature of social identity theory, is that it assumes that people have a
fundamental motivation to maintain or enhance positive social identities that boost
their self-esteem (i.e., self-enhancement motive). In intergroup contexts “…the need

17
for positive social identity motivates a search for, and the creation and enhancement
of, positive distinctiveness for one’s own group in comparison to other groups”
(Turner, 1982, p.34). In this way, social identity theory extends and adapts Festinger’s
notion of social comparison (1954) to the intergroup level. As discussed by Hogg and
Williams “…because social identity is self-evaluative and derives it’s self-evaluation
from the evaluative properties of one’s own group relative to other groups, the
intergroup social comparison is self-enhancement, not accuracy…(2000, p.87).
Another distinct feature of social identity theory is that it conceptualises the self-
concept as a cognitive structure consisting of a social identity (that includes those
aspects of the self linked to social group memberships, e.g., nationality) and a
personal identity (that includes those aspects of the self that are unique to the person,
e.g., personality) (Lorenzi-Cioldi & Doise, 1994; Tajfel & Turner, 1986; Turner,
1982). These two aspects of the self-concept are proposed to produce, independently
or together3, self-descriptions as a function of the social context (Turner, 1982).
The interpersonal self is more likely to be associated with interpersonal phenomena,
and the collective self (i.e., social identity) is more likely to be associated with
intergroup phenomena. Social identity theory maintains that intergroup phenomena
(i.e., ethnocentrims, ingroup bias, intergroup discrimination, stereotyping, etc.) occurs
only when a social identity becomes salient.
Although personal identity and social identity are often described in terms of the
differences in terms of the content of self-descriptions, Reid and Deaux (1996) have
suggested that it would be more appropriate to characterize differences in terms of
their different cognitive emphasis or focus. Personal identity enhances our cognitive
focus on the ways in which we are different from other people and thus unique,
whereas social identity enhances our cognitive focus on our commonality with an
emotionally significant social group (Reid & Deaux, 1996). Examining the conditions
under which the social identity part of the self-concept becomes salient and affects a
persons’ cognitive focus, and in which ways, seems crucial in building connections
between social identity theory and cognitive appraisal theory of emotions. After 3 The two parts of the self may be interrelated, and the extent to which they are fluid and linked over time is a matter which still needs further research (see Reid & Deaux, 1996; Hogg & Williams, 2000).
18
presenting a working definition for “salience”, the next sections review some of the
motivational and social contextual conditions that may enhance or inhibit the salience
of a social identity.
1.3.2. Working definition of “salience”
At this point, it becomes important to clarify what is meant by salience. In the
literature, distinctions have been drawn between the simple categorization into group
memberships, the process of social identification whereby individuals internalise
group memberships as part of their self-concept, and the salience of these social
identifications as a function of the situation (e.g., see McGarty, 2001). In social
cognitive terms, Higgins (2000) proposes that salience “can be used to capture the
notion that not all of the features of a stimulus receive equal attention at any point in
time. The salient features of a stimulus event are those features that draw, grab, or
hold attention relative to alternative features” (p.16). In this thesis social identity
salience, refers to a situation when the features of the self-concept that “draw, grab, or
hold” the person’s attention in defining “who they are” are derived from a particular
social group membership.
1.3.3. Conditions that enhance or inhibit social identity salience: The role of
motivation and the social context
This section presents a brief overview of some of the motivational and contextual
conditions that have been identified in the literature to enhance or inhibit social
identity salience. However, this overview does not pretend to present an exhaustive
list of motivations and contextual conditions.
Early experiments showed that the mere perception of belonging to a social category
was a sufficient condition to create social identification and intergroup behavior
(Tajfel, Flament, Billig & Bundy, 1971). As previously discussed, social
identification and the salience of social identity are not just the result of awareness of
a social group membership and social categorization processes: It is also the result of
a basic motivation to enhance self-esteem and self-representation that can be attained
19
by engaging in intergroup differentiations that reflects positively on the ingroup
(Tajfel & Turner, 1986). Yet, twenty years of research have not provided unequivocal
support for the centrality of the self-esteem hypothesis, and it has been argued that
researchers should explore of a wider range of motives (Brown, 2000; Rubin, &
Hewstone, 1998; Vignoles, Chryssochoou, & Breakwell, 2003). In fact, social
identification and social identity salience may also be affected by other motivations
such as the need to reduce uncertainty about the ingroup in relation to the outgroup
(as postulated by self-categorization theory, see Hogg and Abrams, 1993; Jetten,
Hogg, & Mullin, 2000) and the conflicting need to feel “unique” (distinctiveness) and
“similar” (inclusion) at the same time (as postulated by optimal distinctiveness theory,
see Brewer, 1991). Recent work comparing motivational theories of social
identification suggests that these different motivations (i.e., self-esteem enhancement,
uncertainty avoidance, and optimal distinctiveness) may in fact influence different
aspects of social identification (i.e., identification strength, self-stereotyping,
evaluations, and emotional attachment to groups) (Capozza, Brown, Aharpour &
Falvo, 2001). More and more, researchers in this area agree that we identify with
groups for motivations other than self-esteem enhancement (Deaux, 2000; Rubin, &
Hewstone, 1998; Vignoles, Chryssochoou, & Breakwell, 2003). Ellemers, Spears and
Doosje (2002) take this reasoning one step further to suggest that “…the motivational
implications of a particular social identity are shaped by [these] contextual
features…” (p.165). One important aspect might be the function that a social identity
membership may play in a particular social context (Deaux, 2000; Deaux, Reid,
Mizrahi & Cotting, 1999).
Social identity theory devotes considerable attention to the impact of the social
context. This theory proposes that the socio-structural aspects of the social context,
including the permeability of group boundaries and the stability and legitimacy of
group statuses, may determine whether a person defines him or herself as an
individual or in terms of their social identity (Tajfel & Turner, 1979). More recently,
self-categorization theory (that developed from social identity theory, see Hogg &
McGarty, 1990) has further argued that the more immediate aspects of the social
context can determine what aspects of a social identity become salient. In this view,
the different aspect of the same social identity may become more or less salient as a
20
function of whether they make us look good or bad in comparison to a target outgroup
in a particular situation.
Research has shown that a social identity may become salient if the ingroup has
distinctive or visible characteristics in relation to the outgroup, if there is an unequal
ratio of ingroup members compared outgroups (Randel, 2000), or if there are
perceived status and power differences between the ingroup and the outgroup in a
particular situation (see Ashforth & Mael, 1989; Brewer & Miller, 1984; Vanman &
Miller, 1993). The salience of a social identity may also be a function of how others
treat a person, as one may only become aware of a particular social identity because
others treat us as part of that social identity group (Earley & Laubach, 2001; Stone &
Colella, 1991). In fact, the salience of a social identity may also be influenced by the
importance or significance that is attached to that social identity in a particular context
by the person and by others (e.g., a social identity that is prestigious and that enhances
our self-esteem). In addition, a social identity may become salient due to existing
intergroup competition between identity groups represented in a particular context
(Ashforth & Mael, 1989; Turner, 1982).
Finally, social identity theory is a theory of intergroup relations. Consequently, most
research in this area is devoted to the identification of those factors that may help
reduce or inhibit the negative consequences of social identity processes (Brown,
1996). The increased stereotypic perception resulting from social identification in
intergroup settings has been found to increase ingroup favoritism, intergroup
competition, and negative stereotypes and distrust of outgroups, reducing the chances
of collaboration and cooperation (Brewer, 1995; Ashforth & Mael, 1989). In addition,
negative emotions like anxiety, fear and irritation have been described to accompany
intergroup contact (Dijker, 1987; Stephan & Stephan, 1989).
There is some evidence that enhancing the salience of a super-ordinate identity can
reduce or eliminate ingroup bias (Gaertner, Dovidio, Anastasio, Bachman, & Rust,
1993). In addition, crossing functional role assignments and demographic social
identity memberships in teams has also been found to reduce ingroup bias and
intergroup discrimination (Brewer & Kramer, 1985). Negative affect toward

21
outgroups has also been found to diminish by making a crossed category membership
salient (Ensari & Miller, 1998; Vanman, Kaplan & Miller, 1991). Although there is
considerable evidence showing that crossed categorizations (e.g., crossing two group
membership dimensions: double ingroup, ingroup-outgroup, outgroup-ingroup, and
double outgroup) can reduce ingroup bias, a recent meta-analysis showed that it will
depend on the definition of ingroup bias and it may accentuate the negative evaluative
bias toward the double outgroup (for a recent meta-analysis see, Mullen, Migdal, &
Hewstone, 2001).
In sum, to account for integroup phenomena social identity theory evokes cognitive
(i.e., social categorization) and motivational (i.e., self-enhancement motive) processes
that underlie social identity. Researchers have been primarily concerned with
determining the conditions that reduce the pervasive consequences of social identity
on perception, attitudes, affect and intergroup behavior in a variety of intergroup
settings. However, the influence of social identity salience on emotions has rarely
been studied. In particular, the way by which the cognitive processes and the different
motivations (beyond self-esteem enhancement) underlying social identity might
translate to specific emotion responses in intergroup contexts has yet to be clearly
explicated. In fact, adding an affective component has been identified as one of the
key challenges for future developments in social identity theory (Brown, 2000).
Appraisal theory of emotion has much to offer in this regard. The following section
reviews some of the literature that has directly or indirectly examined the influence of
social identity salience on appraisals and emotions.
1.3.4. Early evidence supporting the influence of social identity salience on
appraisals and emotions
In their 1993 review of emotion theory and research and it’s applications to
stereotyping and intergroup relations, Vanman and Miller identified three factors of
intergroup relations that may influence how cognition4 can generate emotion,
4 Vanman & Miller’s (1993) use of the term “cognition” includes appraisals, causal attributions, stereotypes, inferences and categorizations.

22
including: social categorization processes, the actions of others, and the features of
contact setting.
The first factor, social categorization processes, refers to the influence of the
increased salience of a social identity. It has been shown that the greater the
differences perceived between the ingroup and the outgroup (e.g., ethnic groups,
sexual preference groups, etc.) the more intense the negative emotions elicited by the
outgroup (see Dijker; 1987; Jackson, & Sullivan, 1989 for details). In a study on
intergroup ethnic relations in Amsterdam, Dijker, Koomen, van den Heuvel and Frijda
(1996) found that emotional reactions towards ethnic outgroups (i.e., Surinamese,
Turks & Moroccans) were not simply more negative and less positive than emotional
reactions to ethnic ingroup (i.e., people in the neighborhood). In fact their study
showed quite the opposite: it was the ingroup and not the outgroup that was associated
with more irritation. Moreover, some outgroups in their study (i.e., Surinamese)
elicited even more positive emotions than the ingroup (i.e., people in the
neighborhood). The authors explained the differences in the nature of the emotions
elicited by the ingroup and the outgroups as resulting from differences in the
antecedents participants had actually associated with the outgroups (i.e.,
ethnocentrism, general concerns, ethnic beliefs, appearance, context and alluding to
discrimination) and with the ingroup (i.e., meddlesomeness and reference to special
neighbors such as prostitutes or skinheads). In this study it is also important to note
that the ingroup was defined by the experimenters as “people in the neighborhood”,
and it is conceivable that subjects did not at all identity or feel committed to this
ingroup. In fact, based on the antecedents that participants associated with the ingroup
they may have even have re-categorized the ingroup as an outgroup. The interesting
question remains to what extent does the differences observed in emotion responses
elicited by ingroups and ougroups result from systematic differences in the more
cognitively complex appraisals? For example, one could imagine that in intergroup
contexts some appraisal dimensions like causal attribution might be particularly
important or the might be used differently when appraising ingroups and outgroups
(and their actions).
In fact, the second factor identified by Vanman and Miller (1993) goes in this

23
direction as it points to the influence of differential causal attributions we can make
about the actions of ingroups and outgroups. Research on the ingroup bias
phenomenon, has shown that we have a tendency to attribute positive outcomes to the
ingroup and negative outcomes to the outgroup (see Hewstone, 1989). Vanman and
Miller (1993) extend the ingroup bias phenomenon to propose that when attributing
actions of the outgroup that negatively affect the ingroup we should feel anger, and
when attributing actions of the ingroup that negatively affect the ingroup we should
feel remorse rather than anger. The authors conclude that feelings of reproach and
anger toward the outgroup should be more common. On the other hand, nothing
excludes the possibility of stronger anger responses toward negative acts by ingroups
than outgroups. Furthermore, whether the expression of anger toward ingroups and
outgroups occurs is likely to vary as a function of display rules (e.g. collectivistic
cultures may encourage the maintenance of ingroup cohesion and anger toward
ingroups may be less common), the status of the groups (e.g., who has the “right” to
express anger toward whom), etc.
Finally, Vanman and Miller (1993) identify the influence of the nature of the
intergroup contact. The nature of contact can vary in terms of amount of contact,
structure and nature of the task, the ratio of ingroup to outgroup members, and
relative status of the groups. In terms of amount of contact, Dijker's (1987) study
showed that increased casual contact with ethnic outgroups increases negative
emotions such as irritation, anxiety and concern. Vanman & Miller (1993)
explanation is that although it is generally believed that increased interpersonal
contact with the outgroup will increase knowledge about the other and reduce
negative stereotyping, by getting to know the other better we may also learn about
their differences and thus can feel less able to predict their behavior. In agreement
with appraisal theory proposition that anxiety can result from having little control
over the unknown (Lazarus, 1991a), Vanman and Miller (1993) conclude that this loss
of control over the other’s behavior may lead to higher anxiety.
In terms of the nature of the task, a study by Vanman, Paul, Kaplan, & Miller (1990)
showed that an interdependent tasks performed with a outgroup partner described as
deficient in the skills required to perform the task may result in negative affect as

24
measured by facial muscle activity (i.e., via electromyographic recording) but not as
measured by self-report. The authors argue that this result suggests that people may
not necessarily be aware of their negative affective responses to outgroups, although it
could also just indicate that people do not want to appear in a negative light through
self-report. Furthermore, Vanman and Miller (1993) argue that if the ratio of
outgroups to ingroups is high, it could lead to an appraisal of loss of control resulting
in emotions such as fear and anxiety. This is further complicated if one considers the
potential influence of the different status of the ingroup vs. the outgroup (see Brewer
& Miller, 1984). For example, it seems likely that high status groups may feel
resentment working with low status groups and fear and anxiety when they are the
minority.
Regrettably, few studies have addressed the question of whether the strength of the
salient social identity influences emotional intensity. Dietz-Uhler (1996) examined the
impact of social identification on the escalation of commitment and decision-making
in teams. He reported that when groups with a stronger social identity salience made
mistakes on an investment simulation game they were judged to be more “emotional”
by judges (on videotaped interactions), than groups with a weaker social identity
salience. However, no explanations were put forward as to why or how stronger social
identity salience lead to more intense perceived emotionality.
More recently, Cotting (1999) measured subjective emotion intensity reactions (i.e.,
via the Emotion Intensity Questionnaire developed by Sonnemans, 1991) as
experienced at its peak and during the whole emotion episode to vignettes describing
a negative and a positive event. The events were either the positive or the negative
results of a cancer treatment administered to another person with whom participants
shared either one or two social identity memberships (e.g., student identity and/or
gender identity). The main hypotheses were that emotion intensity of an event
happening to another person would be greater when participants shared one social
identity with the target than when they shared no identity, and would be greater when
they shared two social identities than when they shared one identity. In other words,
the more social identities the participants shared with the target person described in
the scenarios the stronger the expected emotion intensity. Only the second hypothesis

25
was partially supported by their results which showed that participants sharing two
identities with the target displayed greater opinion and behavior changes in the long
term as a result of the emotion-inducing event.
Unfortunately most of these studies measured emotion and affect as “output”
variables or as indicators of outgroup prejudice, and were not really interested in
studying emotion as a process. Nevertheless, these early studies reflect some of the
potential emotional consequences of social categorization, ingroup bias nature of
intergroup contact and strength of identification. For Vanman and Miller “If one
considers the ingroup as an extension of self and the outgroup as an extension of
other, then it is fairly easy to adapt emotion theories to intergroup settings”(1993,
p.224). The next section reviews more recent research that has attempted to extend
appraisal theories to explain emotion in intergroup contexts.
1.3.5. Intergroup emotion: Extending appraisal theories to intergroup contexts
In his 1993 article, Smith borrowed from several appraisal theories (including
Roseman, 1984; Frijda, Kuipers & ter Schure, 1989; and Scherer, 1988) to speculate
about the types of appraisal - emotion - action tendency patterns that could be relevant
to the study of emotion in intergroup relations. The intergroup emotions theory (IET)
subsequently proposed by Smith and his colleagues (Mackie, Devos & Smith, 2000)
constitutes the first attempt to adapt appraisal theories to the area of intergroup
relations. Since then a growing number of researchers have become interested in the
study of intergroup emotion (e.g., Devos, Silver, Mackie, & Smith, 2002; Dumont,
Yzerbyt, Wigboldus, & Gordijn, in press; Gordijn, Wigboldus, & Yzerbyt, 2001;
Mackie & Smith, 2002; Mackie, Devos & Smith, 2000; Smith & Ho, 2002; Yzerbyt,
Dumont, Gordijn & Wigboldus, 2002; Yzerbyt Dumont, Wigboldus & Gordijn, in
press).
For Smith (1993, 1999) social identification with the ingroup is an important aspect of
the self-concept and consequently evaluations of events linked to this social group
when comparing with an outgroup can cause emotions such as prejudice and
behaviors such as discrimination. He defines prejudice as a “social emotion” that is

26
felt when a person identifies with the ingroup (i.e. “us”), and there is a target outgroup
(i.e., “them”). In 1993, Smith first proposed that the appraisal processes that generate
social emotions such as prejudice are identical to appraisal processes proposed by
cognitive theories of emotion for individuals, with the difference that appraisal
involves aspects of social identity instead of involving only aspects of the personal
identity. The core of intergroup emotion theory is that: “Stereotypes” are appraisals of
the outgroup’s characteristics that can potentially affect the ingroup; that “prejudice”
is a social emotion experienced with respect to a social identity as an ingroup
member; and that “discrimination” is the resulting emotion driven behavior (also see
Mackie & Smith, 1998).
In 1999, Smith's position breaks away from the basic premise postulated by social
identity theory that states that self-esteem maintenance is the main motivator for
intergroup behavior. For Smith, the motivation to enhance the self-esteem targets the
self and can range only from positive to negative valence. In contrast, he argues,
prejudice is a group based emotional reaction that can involve a whole range of
emotions (fear, anger, resentment, etc.) where the target is an outgroup appraised to
have some implication for the ingroup. Therefore: “…appraisals refer to the position
of the outgroup in relation to the ingroup, just as, in emotion theories, the appraisals
that trigger emotion by definition refer to an object's or situation's implication for the
self” (Smith, 1999, p.187).
The main postulate of intergroup emotions theory (as spelled out by Smith in 1993) is
that when a social identity is salient, situations are appraised in terms of their
consequences for the ingroup, eliciting specific intergroup emotions and behavioral
intentions. This hypothesis was tested by Smith and his colleagues (Mackie, Devos &
Smith, 2000) in a series of 3 studies consisting of questionnaires that manipulated
group identification (by making salient the conflict of values between two groups),
and appraisals of ingroup strength (i.e., defined as the amount of collective support
given to the ingroup in comparison to the outgroup), and measured the impact of these
manipulations on emotions (i.e., to what extent the outgroup made them feel anger,
fear and contempt) and actions tendencies (i.e., moving away and moving against). A
Meta-Analysis of their results indicated that appraisals of the ingroup as strong (i.e.,

27
being strongly supported by the community) were systematically associated with an
increase in anger toward the outgroup, (but not associated with fear, nor with
contempt) and with a tendency to want to move against that outgroup (arguing with,
confronting, opposing, and attacking, but not away from the group). Results of these
three studies confirm that when a social identity is salient, appraisals of event in terms
of consequences for the salient ingroup lead to specific emotional responses and
action tendencies toward the outgroup.
More recently Devos and associates (Devos, Silver, Mackie, & Smith, 2002) have
reported results from two series of studies that provide further support of IET. The
first series of studies used scenarios to induce appraisals that may lead to fear
responses. Participants were asked to imagine themselves walking down a local street
at night and being unjustly accused of breaking a car's side mirror. In addition to
manipulating appraisals, the authors manipulated the social context. In the first study,
the social context was manipulated by asking participants to imagine the accuser was
either another individual, another individual from an outgroup, or a group of
individuals from the outgroup. Though the two latter conditions lead to reports of
higher weakness, appraisals were not significantly influenced by the social context
manipulations. Reported level of fear also did not vary with context. The general
pattern or results was that the weaker the participant felt, the stronger the fear and the
more they wanted to move away (but not confront, nor argue). In the second study the
social context was manipulated by asking participants to imagine they were alone or
with their ingroup, and that the accuser was either an outgroup member or a group
from the outgroup. In this study participants felt the weakest and the most afraid when
they were asked to imagine they were the only member of the ingroup confronting a
group from the outgroup. Accordingly, the weaker they felt, the more afraid they felt,
and the more they indicated wanting to move away.
In the second series of studies reported by Devos et al. (2002), participants were given
an emotion word as a cue and were asked to recall and describe a situation in when
they felt the emotion as an individual or as a group member. Participants then had to
rate the recalled episode on several appraisal dimensions, and to report their emotion
response (type and intensity), and action tendencies. With the exception of self-blame

28
related emotions, no significant differences were found between emotion situations
recalled as individuals or as a group member in terms of appraisals, emotions and
action tendencies. Finally, an interesting twist was added to the fear scenario
described in the first set of studies. In another set of conditions participants were
asked to imagine the altercation had occurred to another individual, another ingroup
member or group of ingroup members, but not including the self. Participants where
then asked how weak or strong they felt, and how much anger and fear they felt, and
what action tendencies they might feel inclined to do. Even in this condition where
participants were not personally involved, they reported high levels of fear on behalf
of other ingroup members.
Based on this perspective one can argue that individuals may experience group based
emotions toward the entire outgroup just as they can experience emotional reactions
toward individual outgroup members. For example, if an outgroup is appraised as
threatening to the ingroup, and the ingroup is appraised as more powerful than the
outgroup, the resulting emotion may be anger, the resulting action tendency may be
moving against. In contrast if the outgroup is perceived as more powerful the response
may be fear or anxiety and the resulting action tendency may be moving away from.
The research by Mackie, Devos and Smith (2000) described above confirms that in
situations of intergroup conflict, appraisals of the ingroup as strong in comparison to
the outgroup, were systematically associated with an increase in anger toward the
outgroup, and with a tendency to want to move against the outgroup. Another
example is research showing that individuals may experience malicious pleasure or
“Schadenfreude” at the suffering of another group (Leach, Spears, Branscombe &
Doosje, 2003). Schadenfreude is expected to be more common when the other group’s
misfortune occurs in a domain of interest to the ingroup, under increased threats to the
status of the ingroup, and when it is considered to be legitimate to enjoy the
misfortune of the other group (Leach, Spears, Branscombe & Doosje, 2003).
Moreover, individuals may also experience emotions toward the ingroup and toward
individual ingroup members. For example, it has been found that individuals can
experience guilt when they acknowledge that the ingroup is responsible for moral
violations (Branscombe, Doosje, & McGarty, 2002), when they are presented with

29
evidence that the ingroup has treated the outgroup unfairly in the past (Doojse,
Branscombe, Spears, Manstead, 1998), and when they hold the belief that the ingroup
has an illegitimate or immoral advantage over the outgroup (Branscombe, 1998; Iyer,
Leach, & Crosby, 2003). Other research has shown that emotional responses (e.
including sadness, failure, anger, irritation, etc.) to prejudice against one’s ingroup
are a function of how prejudice is perceived (e.g., in terms of attributions of causality,
extent to which people felt personally threatened) but also of the degree of
identification to the ingroup (McCoy & Major, 2003; Schmitt & Branscombe, 2002).
In fact, McCoy and Major (2003) have shown that it is only when prejudice against
the ingroup is salient, that people high in group identification will appraise a threat
against the ingroup as a threat to the self. Interestingly, these authors predicted and
found that the effect of ingroup identification on emotion response to prejudice was
mediated by appraisal of personal threat.
Finally, even in situations when individuals are not “personally” involved in the
event, they can experience emotions on behalf of other ingroup members as shown by
research reported by Devos et al. (2002). In addition, it has been demonstrated that
when a victim of harmful behaviour is perceived to belong to same group than the self
(i.e., ingroup), then one is more likely to feel emotion (i.e., including fear and anger)
and the corresponding action tendencies on behalf of the victim even in situations that
do not directly confront the self (Dumont, Yzerbyt, Wigboldus, & Gordijn, in press;
Gordijn, Wigboldus, & Yzerbyt, 2001; Yzerbyt, Dumont, Gordijn, & Wigboldus,
2002; Yzerbyt, Dumont, Wigboldus, & Gordijn, in press).
Taken together these studies suggest that the same emotion processes (i.e., appraisals,
emotions, action tendencies) that operate at the individual level and in interpersonal
situations might be operating in intergroup situations. However, most researchers
have focussed on testing whether the effect of social identity on intergroup behaviour
(i.e., suggested by measures of action tendencies) is mediated by specific intergroup
emotions (e.g., anger, fear, guilt). Only a few researchers have directly tested the link
between specific appraisals dimensions and intergroup emotions (for exceptions see
Mackie, Devos, & Smith, 2000; Dumont, Yzerbyt, Wigboldus, Gordjin, in press).
Surprisingly, despite the central role attributed to appraisal processes in eliciting

30
intergroup emotion, little is know about the ways in which social identity salience
might affect some of the standard appraisal dimensions proposed by appraisal
theorists. In this thesis I concentrated precisely on this issue.
1.4. The influence of social identity salience on Scherer’s appraisal dimensions
In contrast to intergroup emotion theory, the question of intergroup emotions was not
approached from the perspective of intergroup relations but from the perspective of
appraisal theories of emotion. From this angle, building connections between
appraisal theories and social identity theory (e.g. Tajfel & Turner, 1986) responds to a
concrete need in the field of emotion research, namely: To identify potential
psychological mechanisms, i.e., social identity salience, by which the social and
cultural aspects of a situation affect appraisal and emotion responses.
Based on Scherer’s (1984a, 1984b) appraisal theory, this section elaborates
preliminary propositions, which serve as a basis for the experimental hypotheses,
about how social identity salience might affects the more cognitively complex
appraisal dimensions. These correspond to those appraisal dimensions previously
identified as being particularly sensitive to the influence of social contextual factors
(Ellsworth & Scherer, 2003). By extending Scherer’s theoretical propositions for
these criteria so that self refers to oneself as a member of a salient ingroup, and the
other refers to the other as member of a target outgroup it becomes quite
straightforward to outline propositions (see table 1.2) about how emotions may be
elicited in intergroup contexts.
1.4.1. Social identity salience effects on goal significance
Proposition 1 (see table 1.2): In an interpersonal context people will tend to evaluate
the appraisal of goal conduciveness/obstructiveness in terms of their personal goals.
It is proposed that in an intergroup context and when a social identity becomes
salient, people will tend to evaluate this appraisal more in terms of the salient
ingroup goals than in terms of their personal goals.

31
Table 1. 2. Extension of Scherer's (1984a, 1984b) appraisal dimensions to explain emotions in intergroup contexts Proposition for the
interpersonal context
Self Other
Propositions for the intergroup context
When a social identity is salient5
Self = ingroup Other = outgroup
Goal Significance Conduciveness
• Evaluated in terms of
personal goals
• Evaluated in terms of
salient ingroup goals
Coping Potential Agency/Responsibility Control Power
• Evaluated in terms of
the self in relation to other(s) interpersonally
• Evaluated in terms of the
salient ingroup in relation to the target outgroup
Compatibility with personal standards and norms Personal Standards Compatibility with social norms
• Evaluated in terms of
the self in relation to ideal self
• Evaluated in terms of
the self in relation to social norms
• Evaluated in terms of the
self in relation to the salient social identity
• Evaluated in terms of the
self in relation to the salient social identity ingroup norms
Social identity salience can determine the perceived importance of ingroup vs
individual goals in intergroup contexts. Experimental research on social dilemmas has
shown that ingroup salience can influence the perception of goals, so that the goals of
the “ingroup” (i.e., the collective) become more important than individual goals
(Brewer & Kramer, 1986; Caporael, Dawes, Orbell, & vande Kragt, 1989; Kramer &
Brewer, 1984). In other words, social identity salience transforms objective goals in
such a way that greater importance is given to the goals (and outcomes) of other
ingroup members than to our own personal goals (and outcomes)(Wit & Kerr, 2002).
In fact, there is evidence suggesting that when people consider another person to
represent an integral part of their identity, not only do they feel a sense of
5 This distinction is made based on the theoretical assumption that when a social identity is salient, the personal identity becomes less salient (Turner, Oakes, Haslam, & McGarty, 1994).

32
“ownership” over the target’s outcomes (e.g., success and failure) but they can
actually have emotional reactions similar to what they would have experienced about
their own personal outcomes (McFarland, Buehler, MacKay, 2001).
Thus, when a particular social identity becomes salient, events and issues are more
likely to be appraised in terms of their conduciveness (or obstructiveness) to the goals
of the salient ingroup than just personal goals. To illustrate, imagine the only woman
professor in an otherwise all male faculty. In some contexts (faculty meetings) her
“gender social identity” may become highly salient. If she is then confronted with an
event that she appraises as obstructing women’s career advancement at the central
administration, she is more likely to have stronger negative emotional responses (such
as anger) than her male colleagues. In fact, the event might or might not be relevant to
her as an individual (as the event may not have any direct consequence for her career
advancement directly), but if her gender identity is salient the event becomes relevant
to her as a representative of women. If on the other hand, her “department social
identity” is more highly salient when this event occurs (imagine her department is
underrepresented in this faculty) she may appraise the event as obstructing women's
careers in central administration but not as obstructing staff in her department
directly, thus she may have a weaker or even no strong emotional response to that
event.
1.4.2. Social identity salience effects on coping potential
Proposition 2 (see table 1.2.): In an interpersonal context people will tend to evaluate
appraisals of causal agency/responsibility and power/control in terms of the self in
relation to other(s) interpersonally. It is proposed that in an intergroup context and
when a social identity becomes salient, people will tend to evaluate these appraisals
more in terms of the salient ingroup in relation to the target outgroup than in terms of
the self in relation to other(s) interpersonally.
When people make causal attributions about the behaviour of others, a distinction can
be made between attributions that are internal (e.g., disposition) and external (e.g.,
situational) (Kelley, 1967; Jones & Nisbett, 1972; Weiner,1986). The particularity of

33
intergroup contexts is that when people make attributions about the behaviour of
others, the internal and external attributions can also vary as a function of the social
group to which the self and the other belongs (see Deschamps, 1983; Hewstone,
1983). As discussed by Deschamps and Beauvois (1994) and Hewstone (1990), in
intergroup contexts attributions can also be based on the person’s salient social
identity and on the stereotypes and existing knowledge that are attached to that social
identity in a given situation (i.e., which are determined by the history of intergroup
relations, how these groups are structured in society, etc.).
It has been shown that when asked to explain negative acts of others in intergroup
settings, attribution of negative acts to internal factors tends to be lower for ingroup
than outgroup actors, while for positive acts the opposite is true (Taylor & Jaggi,
1974). In fact, there is some evidence that when we explain the behaviour of ingroups
and outgroups our attributions tend to be biased to favour the ingroup over the
outgroup (for a review of intergroup causal attribution research see Hewstone, 1990;
Hewstone, 1983, 1989)6. Thus, emotion responses to events obstructing ingroup’s
goals may be more negative and stronger in situations of high ingroup salience, when
one can target a clear target and responsible outgroup than, for example , when the
event is caused by the ingroup.
If we take the woman professor in the previous example, her emotion responses to
events obstructing women’s career advancement may be more negative and stronger
when her “gender social identity” is salient and when she can target a clear target and
responsible outgroup (i.e., men) than if the event is caused by her ingroup (i.e.,
women). Again, as previously argued it is also possible that events caused by
ingroups lead to stronger negative emotions. As shown by Averill’s (1982) research
6Most research on intergroup attributions has focused around the “ultimate attribution error” which was Pettigrew’s (1979) extension of the fundamental attribution error to the intergroup level. Concretely, he argued that when an outgroup member performs a negative act that is consistent with our negative stereotype we are more likely to make an internal attribution (i.e., disposition or innate factors). Furthermore, he argued that if the outgroup member performs a positive act that is inconsistent with our negative stereotype our attributions will vary depending on our perception of the event’s controllability (high/low) and our perceived locus of control of the actor (internal /external). Thus, we may attribute an outgroup positive act to: the fact that the person is an “exceptional” case (low control/internal locus); luck or a special advantage (low control/ external locus); high motivation or effort (high control/internal locus); and manipulability of the context (high control/external locus).

34
on anger, the target of anger is more often a loved one or a person you know well and
like than someone you dislike7. In addition, nothing excludes that we may feel the
same general type of emotion toward ingroups and outgroups, for instance anger, but
that the quality of anger may be different (cold or hot anger, or even blend of anger
with other emotions like disgust or pride). It also seems possible that in some
instances negative events caused by “ingroups” are perceived as so incompatible with
ingroup norms of morality and justice (or other pertinent norms in a specific situation)
that these deviant members may even be “re-categorized” as part of another outgroup
(i.e., for example sexist women) or as deviant members of the ingroup (e.g., see
research on the black sheep effect, Marques & Yzerbyt, 1988; Marques, Yzerbyt, &
Leyens, 1988).
In addition, social identity salience can influence our perception of control and power
in intergroup contexts. In the past, intergroup differences in terms of power and
control over rewards have been shown to affect ingroup phenomena (e.g., ingroup
bias, intergroup discrimination) (e.g., see Mullen, Brown & Smith, 1992; Ng, 1980,
1982; Ng & Cram, 1988; Sadchev & Bourhis, 1991). However, little is know about
how intergroup differences in terms of power, control and status may affect
intergroup appraisals and emotions. It has been suggested that in a situation of
unequal ingroup/outgroup ratio where the ingroup represents the minority and the
ingroup is under threat, social identity salience could lead to an appraisal of loss of
control over the consequences of the event, and to a feeling of anxiety (Vanman &
Miller, 1993).
Recent research by Mackie, Devos and Smith (2000) demonstrates that in a situation
of intergroup conflict, the stronger the appraised strength of the ingroup (i.e.,
operationalised in terms of increased support by the community to the ingroup) the
stronger the anger responses toward the outgroup, and the stronger the tendency to
want to move against the outgroup. Recently, Schmitt, Branscombe, Kobrynowicz,
and Owen (2002) found that the objective status of the ingroup in comparison to the
outgroup (i.e., in terms of being privileged or disadvantaged in a given social 7In fact, his survey on anger revealed that there was a positive affective relationship between the angry person and the target in over 50 % of the 140 episodes of anger studied that involved another person.

35
structure) affected perceptions of prejudice, as well as self-evaluative emotions and
measures of psychological well being. When these authors compared men and
women’s perceptions of gender discrimination, only women’s perceptions of
discriminations were negatively related to measures of psychological well-being.
In the example of the woman professor describe below, the facts that in most
universities women professors are underrepresented and that in western society
women are perceived to hold less power than men, may affect the woman professor’s
appraisal of control and power over events that hinder to women’s goal of career
advancement at her university. It would be argued here that in when appraising the
event her “gender social identity” becomes salient, her emotional reaction is more
likely to be one of anxiety than of anger. However, nothing excludes that the same
woman professor might feel angry. As shown by Averill (1982), in the majority of
situations the target of anger will be a person judged to be an equal or peer. Thus, if
she perceives the same event as being caused by another person who is her equal she
might be more likely to feel anger than anxiety.
1.4.3. Social identity salience effects on compatibility with personal standards
and social norms
Proposition 3 (see table 1.2.): In an interpersonal context people will tend to evaluate
appraisals of compatibility with internal standards and social norms in terms of the
self in relation to their personal standards and to social norms in general. It is
proposed that in an intergroup context and when a social identity becomes salient,
people will tend to evaluate these appraisal dimensions more in terms of the self in
relation to the salient social identity and to the salient ingroup norms than in terms of
the self in relation to their personal standards and to social norms in general.
Finally, social identity can influence the perceived importance of norms in intergroup
contexts. It has been suggested (Hogg & Turner, 1987) when people categorize and
define themselves as members of a group, they learn the norms of that group, and
they assign these norms to themselves in a way that their behavior may become
normative when that group identity becomes salient. Thus, when a particular social

36
identity becomes salient, events and issues are likely to be appraised in terms of their
compatibility with the particular norms of the salient ingroup as opposed to more
general societal norms. For instance, research has shown that the norms of a social
group have a strong impact of perception of fairness when the person identifies with
that social group (Terry & Hogg, 1996). For the woman in our example, when her
“gender social identity” is salient, the obstruction to women's career advancement
might be appraised more in terms of it compatibility with norms of fairness as justice
as perceived by the salient ingroup (e.g., feminist women), than with social norms as
established by society in general. In fact, there is evidence that fairness judgments are
subject to egoistic biases that favor the self in comparison to others (see Messick &
Sentis, 1983) and it has been recently suggested that similar biases may operate at the
intergroup level: Thus, a situation of higher gains for the self than for the other is
likely to be perceived as more fair when the other is an outgroup (for a discussion see
Hertel, Aarts & Zeelenberg, 2001).
1.4.4. Social identity salience effects on emotion (nature and intensity)
Building on previous research it was argued that social identity salience influences
perception of self and others in intergroup contexts in ways that may in turn influence
appraisals and emotion responses. In this way social identity salience can help explain
the types of emotions experienced as a group member and about others as group
members in intergroup contexts. In the example of the woman professor used above,
when her “gender social identity” becomes salient, the nature of her emotions are
more likely to be determined by her appraisals of events evaluated as a member of the
salient ingroup in relation to others as members of the target outgroup than by her
appraisals as an individual in relation to other individuals.
It remains to be determined how the effect of social identity salience on appraisals, as
proposed above, will in turn influence emotion intensity. It has been argued that
emotion intensity is in part affected by aspects linked to the person, the social context,
the strength of concerns/goals, and the seriousness or value of the event in relation to
the person’s concerns/goals (Frijda et al., 1992). Social identity salience may
determine the perceived importance of goals, as well as the extent to which we feel

37
we have control and power over the consequences of an event in a given context.
Therefore,
Proposition 4: It is proposed that in an intergroup context and when a social identity
becomes salient, the intensity of emotions will be stronger when events are pertinent
to aspects of the social identity that aspects of the personal identity. Moreover, the
stronger the identification to the salient ingroup the stronger the emotions felt about
events directly pertinent to the welfare of the salient ingroup.
1.5. Major research questions emerging from the review of the literature
Social identity salience is determined by those social group memberships that are
important for an individual in a particular social context at a particular time. It the
previous section it has been described how social identity salience may determine the
perceived importance of goals, who is perceived as responsible, how much control
and power the person perceives to have over consequences of the event, and what
norms are perceived as important and adopted when confronted with the event.
Moreover, it was argued that these changes in perception resulting from social
identity salience can in turn influence the way an individual evaluate an emotion-
antecedent event pertinent to that social identity. Specifically, this thesis proposes that
social identity salience may influence the use of the more cognitively complex
appraisal dimensions (as proposed by Scherer, 1984a) involved in the emotion
process, namely: goal compatibility, causal attribution, control, and norm
compatibility. Two major research questions emerge from this review
Research Question 1 : To what extent does the social identity that is salient at the
moment of an emotion-antecedent event affect the appraisal of that event, specifically
in terms of the more cognitively complex appraisal dimensions proposed by Scherer:
• To what extent is the event compatible with goals (personal, and those of the
salient ingroup)?
• To what extent is the event attributed to internal factors (personality) and/or to
social group membership factors, and to what extent is the event perceived as
being caused intentionally?

38
• To what extent are consequences of the event controllable?
• To what extent is the event and the consequences of the event compatible with
norms (social, ingroups')?
Research Question 2 : To what extent does the strength of the social identity that is
salient at the moment of an emotion-antecedent event, affect the intensity of the
emotional response to that event?
1.6. Overview of the research
1.6.1. Aims
The research reported below attempts to empirically test whether social identity
salience influences appraisals and emotion responses in intergroup contexts, to
identify through which specific appraisal dimensions this may occur, and to explore
whether the strength of social identity salience impacts on the intensity of the emotion
response.
1.6.2. Design
Three studies were designed to address these research questions, all sharing the same
experimental paradigm: social identity salience was manipulated into high and low
social identity salience conditions, both groups where then exposed to emotion
inducing events8 directly pertinent to the manipulated social identity, and self-
reported appraisals and emotion responses were measured via questionnaires.
1.6.2.2. Study 1. The salience of participants’ University of Geneva student
identity was manipulated (i.e., high and low salience conditions) in the real intergroup
context of an announced merger between the University of Geneva and the University
of Lausanne. Participants in the two social identity salience conditions were then
asked to give their appraisals and emotion responses (type and intensity) to 6 written
vignettes describing some of the negative consequences of the merger for students at
8 via vignettes in experiment 1, and via computerized interactions in experiments 2 and 3

39
the University of Geneva. This study concentrated on testing the impact of social
identity salience on anger responses and on the corresponding appraisals toward the
merger.
1.6.2.3. Studies 2 and 3. To overcome some of the methodological limitations
encountered in study 1, studies 2 and 3 were conducted with the help of a
computerized simulation of an intergroup business negotiation based on the prisoner’s
dilemma paradigm (PDG). In both studies social identity salience was manipulated,
with some enhancements made to the social identity salience manipulation between
study 2 and 3, to create high and low social identity salience conditions. The
negotiation issues were directly relevant for the interests of the manipulated ingroup
social identity in competition with a target outgroup. In fact, the negotiation strategies
played by the outgroup were pre-programmed in the computer to be either
cooperation or competition. Participants in the two social identity salience conditions
were asked to give their appraisals and emotion responses (type and intensity) to the
outgroup’s negotiation strategy.
1.6.3. Hypotheses
The review of the literature and the propositions outlined in section 1.4. lead to the
development of specific hypotheses concerning the way appraisals of the same event
in terms of goal conduciveness, causal attribution and control, and compatibility with
norms, and also emotion response (i.e., in terms of type and/or intensity) would differ
as a function of social identity salience manipulations. Since these hypotheses depend
on the specific experimental designs, they will be described and justified at the
beginning of the chapters devoted to the respective studies.

41
CHAPTER 2
FIRST EXPERIMENT
2.1. Overview In this first study, the salience of the University of Geneva student identity was
manipulated in the context of the potential merger with another Swiss University, the
University of Lausanne. An organizational merger between two previously
independent organizations is a situation that is likely to make employees pre-merger
social identities become salient potentially leading to intergroup rivalry and ingroup
bias responses (see Terry & Callan, 1998 for an illustration of intergroup bias
responses to a real organizational merger). To characterize the relevance and
emotional significance of the University of Geneva social identity for this student
population in the context of this hypothetical merger, it is important to describe
briefly aspects of the socio-political context in which this study was conducted. The
University of Geneva and the University of Lausanne are located respectively in the
cities of Geneva and Lausanne (at 45 k from each other) in the French-speaking
cantons1 of Geneva and Vaud in Switzerland. The strength of the students’ negative
emotional reactions to this potential merger after both Deans announced it was
characterized by several student demonstrations in Geneva and Lausanne and several
newspapers in both cities covered the event (See copies of selected press articles in
the Appendix A.1.). In addition, there were some intergroup tensions between the
populations of Geneva and Lausanne because a few months before this study was
carried out (August 1998) politicians in Geneva and the neighboring Canton of Vaud
had just engaged both populations on a debate around the possibility of a merger
between the Canton of Geneva and the Canton of Vaud, which implied mergers
between all their infrastructures (i.e., hospitals, universities, public schools, etc.).
Finally, it must also be said that the Geneva population had also just voted in a
1 It is important to note that Cantons in Switzerland benefit of a strong legal sovereignty which is limited only in the case of competencies that the Cantons have delegated to the Confederation. In fact, Cantons maintain a strong autonomy in the areas of education, public health, and other public interests.

42
referendum at the beginning of 1998), against the merger between their Public
Hospital and that of the Canton of Vaud2.
In this study, students at the University of Geneva with high and low identification
with their University were pre-selected and then assigned to high and low social
identity salience experimental conditions. Their self-reported appraisals and emotion
responses (in terms of type and intensity) to 6 written vignettes describing events
associated to the merger were then compared. These events were selected based on
their potential for inducing anger in this student population.
2.1.1 Overview of the hypotheses
This study concentrated on testing the impact of social identity salience conditions
(high and low) on appraisals of these vignettes in terms of appraisals of compatibility
with goals, of attribution of causality, and compatibility with social norms, and on
negative emotion responses, and in particular anger.
a) Hypotheses about appraisal pattern expected for anger in this study.
Appraisal theory predicts that anger (and in particular the hot anger that was expected
toward this merger) occurs when events are evaluated to be obstructive to goals,
caused by someone else, intentionally, to have consequences that the person can
control, and evaluated to be incompatible with self-standard and societal norms (see
Scherer, 1988). In this study, taking into account the context in which this study was
taking place and based on different press articles describing the reasons why students
opposed this merger, it was expected that social identity salience would affect these
appraisals as follows,
H1: Participants in the high social identity salience condition would rate vignettes
describing events associated to the merger as more obstructive to their goals, more as
being caused by someone else, intentionally, and more as being incompatible with
social norms of morality and justice than participants in the low social identity
salience condition.
2 In 2002, the question of the merger between these cantons came to the political spotlight again and the population of Geneva voted again against it.

43
b) Hypothesis about the impact of social identity salience condition on
emotion intensity. In the review of the literature it was proposed that the intensity of
emotions should be stronger is response to event pertinent to aspects of that social
identity. Moreover, it was proposed that the stronger the identification with the salient
ingroup the stronger the emotions felt about events directly pertinent to the welfare of
that ingroup. Thus, in this study it was expected that social identity salience would
influence the intensity of emotional response as follows,
H2: Participants in the high social identity salience condition were expected to rate
the intensity of negative emotions such as anger higher in response to the vignettes
describing events associated to the merger than participants in the low social identity
salience condition.
c) Mediation hypothesis. Finally, in the review of the literature it was
proposed that social identity salience would influence appraisal dimensions, which in
turn influence emotions in terms of type and intensity. Thus, the influence of social
identity salience on emotions is expected to be mediated by appraisal. In the spirit of
exploration, this study tested the extent to which appraisals would mediate the
relationship between social identity an emotion. Based on Baron and Kenny (1986) it
was postulated that appraisal would function as a mediator between social identity and
emotions under the following conditions: (a) variations in the levels of social identity
salience condition (high vs. low) significantly account for variations in emotion (i.e.,
path a), (b) variations in appraisals significantly account for variations is emotion
(i.e., path b), and (c) when path a and b are controlled for, a previously significant
relationship between social identity salience and emotion (i.e., path c) is no longer
significant (or at least a significant decrease is observed) . The diagram in Figure 2.1.
illustrates the formulation of the mediation hypothesis for appraisal.
Fig. 2.1. Mediation hypothesis for appraisal in the relationship between social identity salience and emotions
Social Identity Salience Independent Variable
Appraisals Mediator
Emotion Dependent Variable
a b
c
Note. c=direct effect; a b =mediated effect , and total effect = c + ab

44
2.2. Method
2.2.1. Participants
When recruited, participants were told that this study was part of a larger project
interested in students’ reactions to changes at their University and that their opinions
would contribute to an important University publication. They were informed that to
participate they would have to complete two short questionnaires over a period of 3
weeks.
A hundred and thirteen first-year psychology students (22 males and 91 females3 with
a mean age of 22 years) from the University of Geneva completed the first
questionnaire, which assessed their level of identification with the University of
Geneva. Of the initial pool of participants, 81(16 males and 65 females with a mean
age of 22 years) returned to complete the second questionnaire concerning their
appraisals and emotional responses to a series of written vignettes describing events
associated to the merger. Eight students were discarded because they did not come to
the scheduled session and the remaining students decided not to continue. Thus, a
total of 81 participants were included in the final analyses. All students received
partial course credit for their participation.
2.2.2. Procedure, manipulations and materials
The rationale for having participants first complete a questionnaire assessing their
identification with the University of Geneva was to be able to identify in the initial
pool those with a priori stronger and weaker identification with the University. The
underlying idea was to be able to create two groups of participants based on their
identification with the University and then, to match them to correspondingly high
and low social identity salience experimental conditions when they would come back
to complete the second questionnaire relating to appraisals and emotions. Specifically,
the group of participants with stronger identification was assigned to the high social
identity salience condition (i.e., designed to enhance the intergroup dimension of the
3 The male/female proportions are representative of psychology students at the university of Geneva.

45
experiment), and those with weaker identification were assigned to the low social
identity salience condition (i.e., designed to enhance the interpersonal dimension of
the experiment). In this way, it was expected that the salience of the University of
Geneva social identity would be the strongest for participants in the high social
identity salience condition and the lowest for participants in the low social identity
salience condition.
a) Questionnaire 1: Assessing identification with the University of Geneva.
Participants were welcomed as a group by the experimenter. They were reminded that
this study was part of a larger project concerning students’ reactions to changes in
their University. Participants were then requested to complete this questionnaire
individually and in silence, and were encouraged to answer all questions as honestly
as possible. In the first page of the questionnaire they were informed that they were
about to complete a questionnaire that would ask them some general questions about
themselves (such as their age, sex, etc) and about their general attitudes toward their
University. They were told that this information would help the researchers better
describe the group of participants as whole. Finally, they were told this questionnaire
was not an official university enquiry, nor was it part of an external audit.
This questionnaire actually measured participants’ collective self-esteem with regard
to the “University of Geneva social identity” using an adaptation of Luhtanen &
Crocker’s (1992) collective self-esteem questionnaire. The original collective self-
esteem scale CSS consists of 16 items divided into four subscales: private collective
self-esteem PrCS (e.g., In general, I’m glad to be a member of this group);
membership self-esteem MS (e.g., I feel a worthy member of this group); public
collective self-esteem PuCS (e.g., In general, others respect this group); and
importance to identity IS (e.g., In general, this group is an important part of my self-
image). For the purposes of this study, the original 16 English items were translated to
French and back-translated by an independent translator to check for accuracy. All
items were then adapted to make reference to the “University of Geneva student
membership” (questionnaire reproduced in Appendix A.2.). To reduce the
transparency of the scale it was decided to add 8 filler items, which asked some
general questions about student life (e.g., I find that studying in Geneva is very
pleasant). Participants responded to items using a 9-point response scale (from 1=

46
“strongly disagree” to 9 “strongly agree”). Luhtanen & Crocker (1992) report
subscale alphas in the .70’s and .80’s, and acceptable test-retest reliability (r = .68)
over a 6-week interval. In this study, the translated collective self esteem scale and
each of it subscales showed high internal consistency (alphas for CSE=.83, PrCS=.78,
MS=.63, PuCS=.79, and IS=.84). Crocker & Luhtanen (1990) have argued that the
private collective self-esteem subscale (e.g., “I feel good about the social groups I
belong to”) is the subscale that comes closest to how Tajfel defined social identity
(Tajfel, 1982). Thus, it was decided to create two groups of participants based on the
median split of the scores for this sub-scale (Median=7.75). When completing the
second questionnaire, the group of participants with private collective self esteem
scores higher than the median (N=554) were matched to the high social identity
salience condition. Accordingly, the group of participants with scores lower than the
median (N=585) were matched to the low social identity salience condition.
b) Questionnaire 2: Assessing appraisal and emotion responses to the vignettes
describing events associated to the merger. Two weeks after completing the first
questionnaire, participants came back to complete the second questionnaire
(reproduced in Appendix A.3.). Again, participants were welcomed as a group by the
experimenter and they were reminded that this study was part of a larger project
concerning students’ reactions to changes in their University. Participants were told
that in this questionnaire they would be presented with 6 written vignettes describing
several events that concerned their University. They were told that it was important
that for each vignette they responded, immediately and as honestly as possible, to
questions regarding their perceptions about the event and the emotions evoked by the
event in terms of type and intensity. Participants were then requested to complete this
questionnaire individually and in silence. The cover sheet included a sample of the
official statement made by the deans of both universities stating their position on the
proposed merger. There were two versions of the second page of the questionnaire,
one per social identity salience condition. The versions differed in terms of the
content of the written instructions as shown in Table 2.1.
4 This group included 8 males and 34 females, 38 Swiss and 4 non-Swiss, with a mean age of 23.19 years, and who had resided in Geneva for an average of 12.07 years.

47
Table 2.1. Summary of instructions in the two social identity salience conditions
High Social Identity Salience Low Social Identity Salience
To enhance the intergroup dimension of the study
-The aim of this study is to compare how students at the University of Geneva (UniGE) and students at the University of Lausanne (UniL) react to events associated to the proposed merger between the university of Geneva and the university of Lausanne. -In this study we are interested in comparing differences between University of Geneva and the University of Lausanne students. -You are about to read a series of events and for each event you will have to answer to some questions concerning you emotional reactions. -Results will be included in an important publication titled “Differences between UniGE-UniL in perceptions of events associated to the merger between UniGE and UniL”. -To make sure that this publication relies on valid information, it is extremely important that you remain honest in your answers.
To enhance the interpersonal dimension of the study
-The aim of this study is to compare how different people react to events associated to the proposed merger between the university of Geneva and the university of Lausanne. -In this study we are interested in interpersonal differences between students. -You are about to read a series of events and for each event you will have to answer to some questions concerning you emotional reactions. -Results will be included in an important publication titled “Interpersonal differences in perceptions of events associated to the merger between UniGE and UniL”. -idem
The remaining of the questionnaire was identical for both social identity salience
conditions. Participants were presented with the 6 written vignettes (i.e., presented in
random order) and for each vignette they responded to questions concerning their
appraisals and emotions about the event described. One vignette was presented per
page, and each time the vignette was positioned at the top of the page and appraisal
and emotions questions were positioned immediately below the vignette. The content
of the written vignettes was based on three sources: official documentation published
by both Universities to inform students about the proposed merger and it’s
consequences; the journals of the respective student unions; and print and television
media. Concretely, the vignettes described specific events associated to the merger
that were selected based of their potential for inducing anger in this student
population. The vignettes included the following:
5 This group included 8 males and 31 females, 32 Swiss and 7 non-Swiss, with a mean age of 22.05 years, and who had resided in Geneva for an average of 7.72 years.
48
1) Vignette 1: The merger between the canton6 of Geneva and the Canton of Vaud in
general.
2) Vignette 2: The merger between the University of Geneva and the University of
Lausanne in general.
3) Vignette 3: Courses for first year students will remain distinct and specific to each
University campus.
4) Vignette 4: Courses for students in second and third year will be shared between
the two Universities, this will imply the moving of professors and/or students.
5) Vignette 5: Postgraduate students will have to move as a function of the place
where the courses get taught.
6) Vignette 6: Courses with few students attending (low number of inscriptions) or
highly specialized will be cancelled.
c) Appraisals. Participants had to rate each vignette according to 12 appraisal
items using a 9-point response scale (from 1= “not at all” to 9= “very much”). These
items were intended to measure four major appraisal dimensions,
1) Pleasantness: extent to which the event was considered to be pleasant, and extent
to which the event was considered to be unpleasant.
2) Goal significance: extent to which the event was considered to be important,
extent to which the event helped them obtain something that they wanted, extent
to which the event got in the way of them getting something that they wanted.
3) Coping potential: extent to which the event was due to chance, extent to which the
event was caused by someone else, caused by someone else intentionally, had
consequences that the person could control or modify, and had consequences that
the person could adapt to.
4) Compatibility with norms: extent to which the event was considered to be morally
acceptable by most people, and was considered as unjust or unfair by most people.
d) Emotion response type and intensity. Participants were then asked to
characterize the emotion they felt immediately after reading the vignette by rating the
intensity for 12 emotions, 6 negative (anxiety, irritation, frustration, anger, shame,
6 Although this event does not seem to be explicitly linked to the University of Geneva social identity, it was judged to be pertinent given the socio-political context in which this social identity was embedded at the time of the study.

49
contempt), 5 positive (interest, relief, happiness, joy, pride) and surprise. All ratings
were done on a rating scale from 1= “very weak” to 9= “very strong” with the
possibility of using 0= “not at all”. The 12 emotions were presented in random order,
and an empty space was left at the end of the questionnaire to offer the possibility of
indicating other emotions not included in the list.
e) Questions concerning their demographic background. On the final page of
the questionnaire participants indicated their age, sex, number of years living in
Geneva, nationality, canton of origin, mother tongue, and faculty.
f) Manipulation check questions. On the final page, participants responded to a
question about the importance they attributed to their studies, a question about
whether they identified with the University of Geneva, and one question asking them
about whether they thought that the events presented in the vignettes could be
characterized as inducing emotion. Again all items we rated on a scale from 1= “not at
all” to 9= “very much”.
Furthermore, to check for the potential influence of other social identities that may
have become salient to participants during the study it was decided to measure the
importance (from 1= “not at all” to 9= “very much”) and valence (1= “negative” to 9=
“positive”) attributed, at the moment of the study, to a series of other group
memberships presented in random order including: sex, age, profession, country of
birth, canton of residence, canton of origin, University, faculty, and section or
department. An empty space was left at the end of the questionnaire to offer the
possibility of indicating other group memberships not appearing in the list. Upon
completion of the questionnaire participants were thanked for their participation.
50
2.3. Results
2.3.1. Overview of the analyses
The results are presented in five sections representing the different steps of the data
analyses. The first step involved all preliminary analyses. The second step consisted
of checking the effectiveness of the social identity salience manipulation. The third
step was to perform one series of ANOVAs on each of the appraisals. The fourth step
was to perform one series of ANOVAs on each of the emotions. In all ANOVAs,
social identity salience condition refers to the between subjects factor (high versus
low social identity salience). Finally in a fifth step, a series of regressions were
conducted following the analytic procedure for determining mediation as established
by Baron & Kenny (1986), to test the whether appraisal mediated the relationship
between social identity and emotion.
2.3.2. Preliminary analyses
The 6 vignettes describing events associated to the potential merger between the
Universities were rated quite differently from each other in terms of appraisal and
emotions. In this study however, the focus was not in testing the effect of type of
vignette on appraisals and emotions, but on testing the effect of social identity
salience condition irrespective of the type of event. Thus it was decided to conduct all
analyses of the reported appraisals and reported emotions averaged across the 6
vignettes presented as stimuli. Concretely, computing the means for each variable
across the 6 vignettes created new overall appraisal and emotion variables. Cell means
and standard deviation of appraisals and emotions for each vignette are reported in
Appendix A.4.1 and A.4.2.
Prior to analyses, all dependent variables were examined through various SPSS
programs for accuracy of data, missing values, and fit between the distributions and
the assumptions for the analyses. In both high and low social identity salience
conditions, missing values were identified before computing the means for appraisals
and emotions. Missing values represented less than 5% of the cases for all appraisal
and emotion variables and thus they were replaced by the mean for all cases. Each cell

51
of each analysis was then examined for outliers, normality, and homogeneity of
variance.
For appraisal variables, examination of box plots revealed some outliers in both high
and low social identity salience conditions. Since there were only one or two outliers
per variable in each condition7, it was decided to exclude these cases from further
analyses of those specific variables. Visual examination of histograms, expected
normal probability plots and detrended expected normal probability plots showed that
in the low social identity salience condition, normality was violated for appraisal of
the event being caused by other, and being caused by other intentionally. These two
variables were negatively skewed. However, once the two outliers identified for each
of these variables were deleted, the assumption of normality was no longer violated.
Finally, the assumption of homogeneity of variance (based on Levene’s statistic) was
violated for caused by other (p<.05) and caused by other intentionally (p<.001).
However, given that the discrepancies in cell sample size were small, these violations
were disregarded (following the suggestion of Tabachnick & Fidel, 1996).
For emotion variables, examination of box plots revealed some outliers for both high
and low social identity salience conditions. With the exception of two emotions, relief
and anger, all other emotions only had one or two outliers per variable in each
condition8, and thus it was decided to exclude these cases from further analyses of
those variables. Visual examination of histograms, expected normal probability plots
and detrended expected normal probability plots showed that normality was violated
7 In total 5 cases were identified as having outliers for some appraisal variables in the low social identity salience condition. One case in had an extremely high score for pleasantness, two cases had extremely low score for Caused by other, and two cases had an extremely low score for Caused by other intentionally. In total 3 cases were identified as having outliers for some appraisal variables in the high social identity salience condition: One case had an extremely low score for importance, one case had an extremely low score for consequences that the person can adapt to, and one case had an extremely low score for morally acceptable by most people.
8 In total 10 cases were identified as having some outliers for some emotion variables in the low social identity salience condition. Four cases had an extremely high score for relief, two cases had an extremely high score for happiness, and two cases had an extremely high score for pride. Two cases has an extremely high score for irritation, one case had an extremely high score for frustration, three cases had an extremely high score for anger, one case had an extremely high score for shame and two cases had an extremely high score for contempt. In total 4 cases were identified as having some outliers for some emotion variables the high social identity salience condition. One case had an extremely high score for surprise and ne case had an extremely high score for interest. One case had an extremely high score for frustration, one case had an extremely high score for shame, and two cases had extremely high score for contempt.
52
for pride, shame, and contempt but only in the low social identity salience condition.
Pride was positively skewed in the low social identity salience condition, and shame
and contempt were positively skewed in the high social identity salience condition.
These deviations from normality were a reflection of the greater number of
participants that had an emotion intensity rating equal to “0” for these emotions in
these conditions. This indicated that when reporting the emotions evoked by the
vignettes, these participants systematically reported a scale value of 0 (zero = “not at
all pertinent”) for contempt, pride, and shame. The assumption of homogeneity of
variance (based on Levene’s statistic) was violated for frustration and relief (p<.05).
Again, the discrepancies in cell sample size were small so these violations were
disregarded (Tabachnick & Fidel, 1996).
Finally, ANOVAs tested for differences between social identity salience conditions in
terms of mean age and mean number of years residing in Geneva but no significant
differences were found. Chi-square tests were used to test for differences between
these two groups in terms of the ratio of male/female and of Swiss/non Swiss
nationals and again no significant differences were found.
2.3.3. Manipulation checks
ANOVAs were conducted for the manipulation check items measuring the importance
participants attributed to their studies, whether they identified with the University of
Geneva, and whether they thought that the vignettes in general could induce emotion.
As expected, participants in the high social identity salience condition identified
significantly more with the University of Geneva (M= 6.24) than participants in the
low social identity salience condition (M=4.97), [F (1,79)= 8.06, p<.01, eta2=.09].
There were no significant differences between the groups on the extent to which they
thought the vignettes in general could induce emotion (Mhigh=6.40, Mlow=5.95), and
on the importance they attributed to their studies in general (Mhigh=8.55,
Mlow=8.46).
In addition, ANOVAs were conducted for each of the items measuring the importance
and valence attributed by participants, at the moment of the study, to other group

53
memberships that may have become salient including: sex, age, profession, country of
birth, canton of residence, canton of origin, University, faculty, and section or
department. In support of the effectiveness of the social identity salience
manipulation, participants in the high social identity salience condition rated
University group membership (Mhigh=7.17; Mlow=6.33) as significantly more
important than participants in the low social identity salience condition [F (1,79)=
5.08, p<.05, eta2=.06]. In addition, participants in the high social identity salience
condition also gave significantly higher ratings of valence to other group
memberships indirectly associated to the University identity, such as their faculty
membership (Mhigh=5.83; Mlow=4.92) [F (1,79)= 4.03, p<.05, eta2=.05], and the
membership of their specific section in the faculty (Mhigh=5.83; Mlow=4.74) [F
(1,79)= 5.73, p<.05, eta2=.07].
Interestingly, differences between social identity salience conditions also emerged for
other social group memberships. Participants in the high social identity salience
condition rated age membership as significantly more important (Mhigh=5.36;
Mlow=4.07) [F (1,79)= 5.32, p<.05, eta2=.06] and more positive (Mhigh=5.22;
Mlow=4.07 [F (1,79)= 5.25, p<.05 eta2= .06] than participants in the low social
identity salience condition. Furthermore, they also rated the nationality (Mhigh=4.95;
Mlow=3.33) [F (1,79)= 10.61, p<.05, eta2=.12], and the sex memberships
(Mhigh=4.78; Mlow=3.49) [F (1,79)= 4.75, p<.05, eta2= .06] more positively than
participants in the low social identity salience condition. However, there were no
significant differences between social identity conditions in terms of mean age, mean
number of years participants had resided in Geneva, ratio of male/female, and of
Swiss/non-Swiss nationals (these were tested when matching participants to the social
identity salience conditions, for details see the method section).
2.3.4. Analyses of appraisal and emotion ratings
2.3.4.1. Analyses of appraisals. It was predicted (H1) that participants in the
high social identity salience condition would appraise the events described by the
vignettes more as obstructive to goals, as caused by someone else and intentionally,
and more as being incompatibility with social norms of morality and justice,
compared to participants in the low social identity salience condition. ANOVAs were

54
conducted, on each of the 12 overall appraisal variables (obtained by computing the
mean for each appraisal variable across the 6 vignettes). Means and standard
deviations for overall appraisals in the two conditions, and results of the ANOVAs are
presented in Table 2.2.
Table 2.2. Mean, standard deviations for appraisals and ANOVAs results for the effect of social identity salience condition
High Social ID Low Social ID
Appraisals Mean SD Mean SD F Eta2
Pleasant 3.82 .87 3.53 .81 2.39 .03 Unpleasant 5.37 1.13 5.55 1.15 .51 .006 Important 6.57 1.18 6.56 1.22 .001 .00 Conducive 3.34 1.14 3.16 1.23 .45 .006
Obstructive 4.08 1.19 4.58 1.38 3.05+ .04 Caused by chance 2.24 1.21 2.15 1.15 .10 .001 Caused by other 6.04 2.01 6.88 1.30 4.72* .06 Caused intentionally 5.76 2.22 6.91 1.15 8.11** .09
Controllability 3.63 1.39 3.55 1.57 .06 .001 Adaptability 6.06 1.27 5.99 1.44 .06 .001 Moral 5.37 1.02 5.27 1.19 .16 .002 Unjust 4.55 1.11 4.96 1.17 2.55 .03 +p=.08. *p<.05. **p<.01. Note. Sample size ranged from Nmin=41 to Nmax=42 in the high social identity salience conditions, and from Nmin=37 to Nmax=39 in the low social identity salience condition.
Results show that contrary to expected (H1), participants in the low social identity
salience condition reported significantly higher ratings on appraisal of the event being
caused by other, and on appraisal of the event being caused intentionally. Also in
contrast to the hypothesis, participants in the low social identity salience condition
tended to report higher ratings on appraisal of the event being obstructive to goals
than participants in the low social identity salience condition, but this effect did not
reach conventional levels of statistical significance (p=.08). None of the other
appraisals were significantly affected by social identity salience condition.

55
2.3.4.2. Analyses of emotion ratings. It was predicted (H2) that participants in
the high social identity salience condition would rate the intensity of negative
emotions such as anger higher than participants in the low social identity salience
condition.
In the rating scale used to measure self-reports of emotions, participants had the
opportunity to use a scale value of “0” to indicate that an emotion was “not at all felt”.
The inclusion or exclusion of cases reporting a scale value of 0 might influence the
results for that emotion. Before conducting any analyses of emotion ratings it was
important to determine first whether the reported absence (i.e., values of 0= emotion
was not at all felt) and presence (i.e., values of 1 and above=felt the emotion to
varying degrees) of the 12 overall emotions measured in this study (obtained by
computing the mean for each emotion variable across the 6 vignettes) differed as a
function of social identity salience condition. Thus, it was decided to conduct a series
of Mann-Whitney tests by ranks on the dummy coded9 overall emotion variables.
Table 2.3. provides the results of the Mann-Whitney test including Z values and
significance. In addition, for each social identity salience condition, the percentage of
those participants reporting not to have felt the emotion at all (scale value of 0=“not at
all felt”), as well as complete cell mean and the standard deviations for participants
reporting to have felt the emotion to varying degrees (scale values ranging between
1=“weak”, 4 and 5=“moderately strong” and up to 9=“very strong”) are shown.
First, results show that the only significant difference between the groups was a
greater presence of pride being reported by participants in the high social identity
salience condition. In addition, the examination of the percentage of participants
having systematically rated 0= “not at all felt” for an emotion across the 6 vignettes
(also see Table 2.3.) revealed that more than 20% of participants in each social
identity salience condition systematically rated pride, shame and contempt as not at
all felt. Therefore it was decided to exclude these emotions from further analysis.
9 Dummy coding was done so that 1= “felt to varying degrees” and refers to mean emotion ratings above 0; and 0= “not felt” and refers to mean emotion ratings equal to 0=“not at all felt”.

56
Table 2.3. Presence and intensity of emotions in response to the vignettes
High Social Identity Low Social Identity Mann-Whitney
Test a
Emotions not felt
% (n)
emotion felt
Mean (SD)
not felt
% (n)
emotion felt
Mean (SD)
Z
Surprise 0 3.86 (1.61) 2.60 (1) 3.52 (1.57) -1.04 Interest 0 4.36 (1.70) 2.60 (1) 4.56 (2.12) -1.04 Relief 4.80 (2) 1.81 (.98) 5.70 (2) 1.22 (.52) -.08
Happiness 0 2.51 (1.21) 5.40(2) 1.74 (1.05) -1.48 Joy 4.80 (2) 2.02 (1.18) 15.40 (6) 1.58 (1.18) -1.60 Pride 23.80 (10) .99 (.78) 48.60 (18) .95 (.75) -2.10* Anxiety 0 3.46 (1.62) 2.60 (1) 3.48 (1.90) -1.04
Irritation 0 3.50 (1.70) 0 3.15 (1.30) 0 Frustration 2.40 (1) 2.12 (1.09) 7.90 (3) 2.40 (1.61) -1.10 Anger 2.40 (1) 2.44 (1.58) 5.60 (2) 1.71 (.91) -.65 Shame 53.70 (22) 1.06 (.69) 47.40 (18) .79 (.55) -.56
Contempt 27.50 (11) 1.31 (1.09) 27.00 (10) 1.05 (.81) -.06 *p<.05 .Note. Sample size ranged from Nmin=40 to Nmax=42 in the high social identity salience conditions, and from Nmin=35 to Nmax=39 in the low social identity salience condition. % not felt referred to the percentage of participants reporting a scale value of “0=not at all pertinent”, emotion felt referred to emotions felt to varying intensities. Numbers in bold indicate the 3 highest percentage of emotions not felt per group. a=Mann-Whitney Tests by Ranks were conducted for the dummy coded emotion variables so that 0=“not felt” and 1=“felt”.
In light of these results, the possibility was examined of conducting all analyses of
each emotion twice: once including all cases, and once excluding cases of participants
reporting to not have felt that emotion across the 6 vignettes. However, for the
emotions variables remaining in the analysis the number of emotions variables with
cases reporting not to feel the emotion is small, ranging from 1 to 6 cases (see Table
2.3.). Thus it was decided to only report here the results of analyses with all cases.
Means and standard deviations for emotions toward the vignettes in the two social
identity salience conditions, and results of the ANOVAs are presented in Table 2.4.
For a depiction of the cumulative mean intensities of emotion by social identity
salience condition see Figure 2.2.

57
Table 2.4. Mean, standard deviations for emotions and ANOVAs for the effect of social identity salience condition on emotions (all cases in)
High Social ID Low Social ID
Emotions Mean SD Mean SD F Eta2
Surprise 3.86 1.61 3.43 1.65 1.45 .02 Interest 4.36 1.70 4.44 2.21 .03 .000
Relief 1.72 1.03 1.15 .58 8.55** .10 Happiness 2.51 1.21 1.65 1.09 11.95** .13 Joy 1.92 1.23 1.34 1.23 4.55* .05 Anxiety 3.46 1.62 3.39 1.96 .03 .000
Irritation 3.50 1.70 3.15 1.29 .99 .01 Frustration 2.07 1.13 2.21 1.67 .21 .003 Anger 2.38 1.60 1.61 .97 6.38* .08 +p<.10. *p<.05. **p<.01. Note. Sample size ranged from Nmin=40 to Nmax=42 in the high social identity salience conditions, and from Nmin=35to Nmax=39 in the low social identity salience condition.
Social Identity Condition
low identificationhigh identification
Cum
ulat
ive
Inte
nsiti
es
30
20
10
0
Emotions
Relief
Joy
Happiness
Anger
Frustration
Anxiety
Irritation
Surprise
Interest
In support of the hypothesis (H2), participants in the high social identity salience
condition reported stronger anger10 intensity than participants in the low social
10 Conducting an ANOVA on the composite score of 3 these emotions tested the hypothesis that participants may have used labels of irritation, frustration and anger to characterize their «anger» but no significant differences were found.
Fig. 2.2. Cumulative mean emotion intensity by social identity salience condition

58
identity salience condition. This result contradicts what would be theoretically
expected based on the results on appraisals: It was participants in the low social
identity salience condition that reported higher levels of obtrusiveness to goals, of
causality by other and causality by others intentionally. Also in contrast to the
hypothesis, but in line with the results of the analyses of appraisals, participants in the
high social identity salience condition also reported significantly stronger relief,
happiness and joy11 toward the vignettes than participants in the low social identity
salience condition. None of the other mean emotion differences were significant. In
light of these unexpected and paradoxical results, it was important to determine to
whether different sub-groups of participants were giving higher ratings to anger and to
the 3 positive emotions in response to the vignettes. This hypothesis is explored
below.
First, because participants were asked to characterize their emotion responses to the
vignettes by rating a whole range of emotions, one could expect reports of emotion
blends (see Scherer & Ceschi, 1997). Figures 2.3 and 2.4 shows the cumulated
intensity of anger, relief, happiness, and joy for participants in the high and low social
identity salience conditions respectively. These Figures were constructed along the
lines of previous research on emotion blends (Scherer & Ceschi, 1997). First, cases
within each social identity salience condition were sorted from the most negative to
the most positive (i.e., anger, relief, happy, joy). Then the cumulated intensity of these
4 emotions was displayed for each participant by using a cumulative area display.
Thus, if a participant rated anger, relief, happiness and joy with a maximum intensity
of 9, the area column for that person would reach the maximum value of 30 (i.e., in
other words, 4 parts X 9 units). This sorting results in the ordering of participants,
within each social identity salience condition, from low to high overall intensity for
these 4 emotions, and also from the more positive emotion blend to the more negative
emotion blend.
11 The effect of social identity on joy was the only one to become non-significant when ANOVAs were conducted after removing cases with a mean emotion=0.

59
Participants (High ID)
78726558463322132
Inte
nsity
30
25
20
15
10
5
0
Joy
Happiness
Relief
Anger
Participants (Low ID)
7055423220111
Inte
nsity
30
25
20
15
10
5
0
Joy
Happiness
Relief
Anger
Interestingly, the first half of Figure 2.3 (from case 2 to case 46) shows a sub-group of
participants with higher ratings for relief, happiness and joy than anger. The second
half shows a sub-group of participants with higher ratings for anger than relief,
happiness and joy. This Figure also shows that for participants in the high social
identity salience condition as the ratings of anger became more intense, the ratings of
relief, happiness and joy became less intense. Fig. 2.4. shows that this is not the case
for participants in the low social identity salience condition. Examination of bivariate
correlations between anger, relief, happiness and joy within the group of participants
in the high social identity salience condition confirms that anger was not significantly
related to any of the positive emotions (r=.24 between anger and relief; r=-.15
Fig. 2.3. Ordered display of emotion
blends (anger, relief, happiness, joy)
for participants in the high social
identity salience condition (N=42)
Fig. 2.4. Ordered display of emotion
blends (anger, relief, happiness, joy)
for participants in the low social
identity salience condition (N=31)

60
between anger and happiness; and r=.05 between anger and joy), and that the 3
positive emotions were significantly and positively correlated among themselves (r=
.61, p<.001 between relief and happiness; r=.72, p<.001 between relief and joy; and
r=.82, p<.001 between happiness and joy). In contrast, for participants in the low
social identity salience condition anger was significantly and positively related to
happiness (r=.35, p<.05) and joy (r=.54, p<.01) but not to relief (r=.23). The three
positive emotions were also significantly and positively correlated among themselves
(r= .68, p<.001 between relief and happiness; r=.50, p<.001 between relief and joy;
and r=.84, p<.001 between happiness and joy). To further determine whether
potential subgroups of participants existed within each social identity salience
condition, principal component analyses (PCA) with varimax rotation were conducted
for anger, relief, happiness and joy. For participants in the high social identity salience
condition, the PCA analysis yielded a two-factor solution (i.e., one for the 3 positive
emotions and one for the negative emotion), whereas for participants in the low social
identity salience condition analysis yielded one factor solution.
To test whether the differences observed between these subgroups on anger, relief,
happiness and joy were significant it was decided to re-categorized participants in the
high social identity salience condition (N=42) into two subgroups. The sub-group of
participant that seemed to report more relief, happiness and joy were labeled “the
positive emotions subgroup” and consisted of 21 participants, (i.e., 3 males and 18
females with a mean age of 22.47 years) having resided in Geneva for an average of
8.7 years, and with 61.9% of them currently residing in the Geneva Canton. The sub-
group of participants that seemed to report more anger, were labeled the “angry
subgroup” and consisted of 21 participants (i.e., 5 males and 16 females with a mean
age of 23.90 years) having resided in Geneva for an average of 15.17 years, and with
90.5% currently residing in the Geneva Canton. ANOVAs confirmed that the “angry
subgroup” reported significantly stronger anger than the positive emotions group
(Mangry=3.72, SD=1.10; Mpositive emotions=1.05, SD=.54) [F(1, 41)=99.87,
p<.001, eta2=.71]. No significant differences were found on relief, happiness and joy.
Finally, no significant differences were found in terms of sex, age, or the number of
years having resided in Geneva. More importantly, no differences were found on any
of collective self-esteem scales.

61
Differences between these subgroups on the appraisals influenced by social identity
salience condition were also tested. As would be predicted by appraisal theory the
subgroup of participants responding with stronger anger rated appraisal of
obstructiveness to goals (Mangry=4.53, SD=.96; Mpositive emotions=3.63, SD=1.24)
[F(1, 41)=6.81, p<.05, eta2=.15], and appraisal of being caused by other
(Mangry=6.72, SD=1.89; Mpositive emotions=5.36, SD=1.94) [F(1, 41)=5.21, p<.05,
eta2=.12] significantly higher that the sub-group of participants responding with relief,
happiness and joy. No significant differences emerged for appraisal of being caused
by other intentionally.
Furthermore, appraisal and emotion ratings of participants in the high social identity
salience “angry subgroup” (N=21) were compared with those of participants in the
low social identity condition (N=39). No significant differences were found on
appraisals of obstructiveness to goals or of causality by other. However, participants
in the low social identity condition rated appraisal of causality by other intentionally
significantly higher (Mlow=6.91, SD=1.15) (Mhighangry=5.92, SD=2.33) [F(1,
57)=4.70, p<.05, eta2=.07]. Participants in the high social identity salience “angry
subgroup” rated relief (Mhighangry=1.90, SD=.98; Mlow=1.15, SD=.58) [F(1, 55)=
12.93 , p<.01, eta2=.19], and happiness (Mhighangry=2.25, SD=.80; Mlow=1.65,
SD=1.09) [F(1, 57)=4.79, p<.05, eta2=.08] significantly higher than participants in the
low social identity condition. More important, they also rated irritation
(Mhighangry=4.61, SD=1.15; Mlow=3.15, SD=1.29) [F(1, 57)=18.30, p<.001,
eta2=.25] and anger (Mhighangry=3.72, SD=1.10; Mlow=1.61, SD=.97) [F(1,
56)=57.03, p<.001, eta2=.51] significantly higher than participants in the low social
identity condition.

62
2.3.4.3. Mediation analyses. Finally, this study explored whether the effects of
social identity salience condition on emotions were mediated by appraisals. To test
this hypothesis it was decided to follow the mediation analyses procedure as
suggested by Baron and Kenny (1986). Two criteria determined the choice of
appraisal and emotion variables to be included in the analysis. First, to focus on those
appraisals and emotions that had been shown to be different in the two social identity
salience conditions by the ANOVAs. Second, to focus on testing relationships
between appraisals and emotions that made theoretical sense according to appraisal
theory of emotions. Social identity salience condition had a significant effect on
appraisals caused by other and caused by other intentionally and had an almost
significant (p=.08) effect on obtructiveness. In addition, results showed that social
identity salience condition significantly influenced anger, relief, happiness, and joy.
Thus it was decided to focus on the anger response only: anger was affected by social
identity salience condition, and theoretically it is proposed to be determined by
appraisals of obstruction to goals, caused by someone else, and caused by someone
else intentionally (Scherer, 1988).
A series of regressions were conducted to see if the effect of social identity salience
condition on anger was mediated by appraisals of obtructiveness to goals, being
caused by other, and being caused by other intentionally. In a first step, each appraisal
(obstructiveness, caused by other, caused by other intentionally) was regressed on
social identity salience condition12; in a second step, anger13 was regressed on social
identity salience condition; and in a third step, anger was regressed on social identity
salience condition and on each appraisal (entered together). The results of each
regression, including R2 and Standardized Coefficients (β), are summarized in Figure
2.3. Full results of regression analyses are presented in Appendix A.4.3.
12 In all correlational analyses social identity salience condition was dummy coded so that 1=high social identity salience condition and 0=low social identity salience condition. 13 Since there were no significant differences between social identity salience conditions on reported 0 scale values (zero= “not at all pertinent”) for Anger, and given the number of these cases was small, we decided to conduct all regression analyses of Anger with all cases.
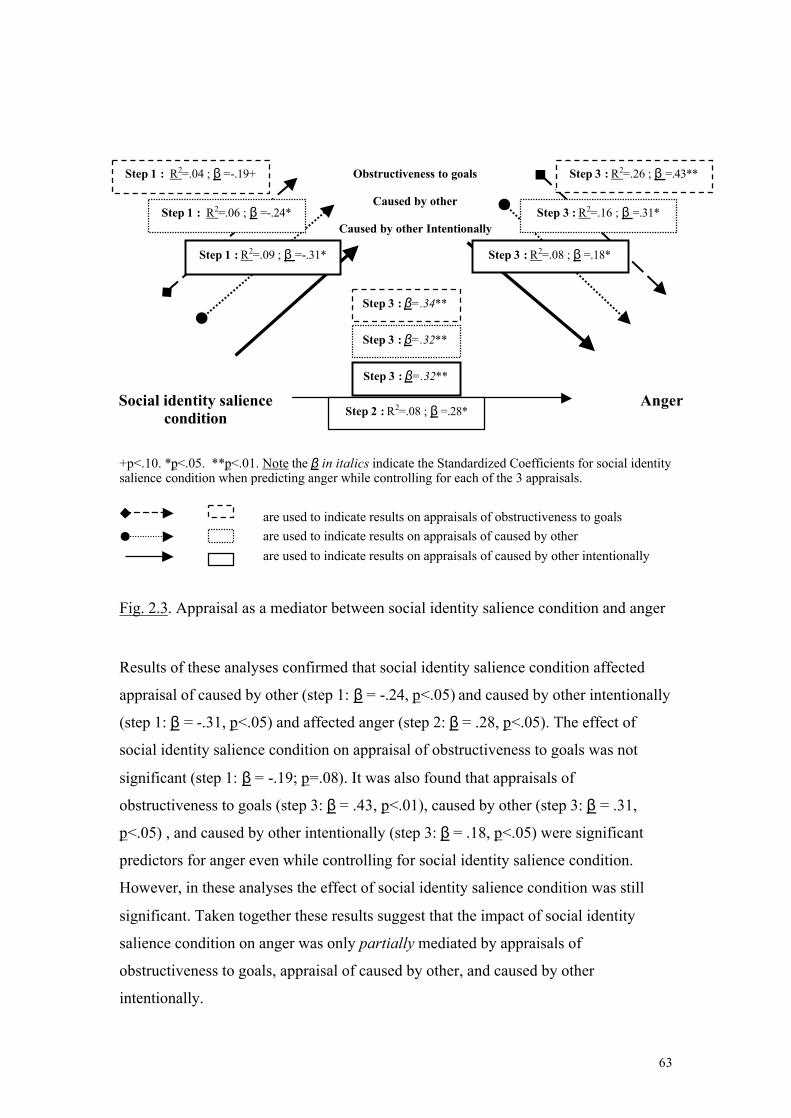
63
+p<.10. *p<.05. **p<.01. Note the β in italics indicate the Standardized Coefficients for social identity salience condition when predicting anger while controlling for each of the 3 appraisals.
are used to indicate results on appraisals of obstructiveness to goals are used to indicate results on appraisals of caused by other
are used to indicate results on appraisals of caused by other intentionally
Fig. 2.3. Appraisal as a mediator between social identity salience condition and anger
Results of these analyses confirmed that social identity salience condition affected
appraisal of caused by other (step 1: β = -.24, p<.05) and caused by other intentionally
(step 1: β = -.31, p<.05) and affected anger (step 2: β = .28, p<.05). The effect of
social identity salience condition on appraisal of obstructiveness to goals was not
significant (step 1: β = -.19; p=.08). It was also found that appraisals of
obstructiveness to goals (step 3: β = .43, p<.01), caused by other (step 3: β = .31,
p<.05) , and caused by other intentionally (step 3: β = .18, p<.05) were significant
predictors for anger even while controlling for social identity salience condition.
However, in these analyses the effect of social identity salience condition was still
significant. Taken together these results suggest that the impact of social identity
salience condition on anger was only partially mediated by appraisals of
obstructiveness to goals, appraisal of caused by other, and caused by other
intentionally.
Anger
Social identity salience condition
Obstructiveness to goals
Caused by other
Caused by other Intentionally
Step 3 : R2=.26 ; β =.43**
Step 3 : R2=.16 ; β =.31*
Step 3 : R2=.08 ; β =.18*
Step 1 : R2=.04 ; β =-.19+
Step 1 : R2=.06 ; β =-.24*
Step 1 : R2=.09 ; β =-.31*
Step 2 : R2=.08 ; β =.28*
Step 3 : β=.32**
Step 3 : β=.32**
Step 3 : β=.34**

64
2.4. Discussion
This study focused on the prediction that social identity salience influences how
events or issues pertinent to that social identity are appraised, as well as the nature and
intensity of the emotions experienced. In addition, it tested a mediation hypothesis for
appraisals in the proposed relationship between social identity salience and emotion.
In this study, participants were confronted with vignettes describing events associated
to a hypothetical merger between their University and another University. It was
tested whether students with a stronger University of Geneva social identity salience,
compared to those with a lower social identity salience, would show higher ratings on
those appraisals theoretically expected to produce anger and would report stronger
anger.
The discussion of the results is broadly organized into three sections corresponding to
our hypotheses. First, results pertaining to appraisals and emotions will be discussed
(H1 and H2), followed by results for the mediation analyses. Finally, limitations will
be outlined and general conclusions for this study will be drawn.
2.4.1. The influence of social identity salience on appraisals and emotions
This study showed that social identity salience significantly influenced appraisals
concerning attributions of being caused by other, and being caused by other
intentionally. However, results contradicted the hypothesis (H1) as it was participants
in the low social identity salience condition that rated the events associated to the
merger significantly higher in terms of being caused by other and caused by other
intentionally.
In line with the hypothesis for emotion (H2) participants in the high social identity
salience condition reported stronger anger toward the vignettes than participants in the
low social identity salience condition. Unexpectedly, they also reported stronger
positive emotions including relief, happiness and joy.

65
Taken together, results on appraisals and anger contradict the theoretical prediction
made by appraisal theory (Scherer, 1988) that anger generally occurs when events are
appraised as incompatible with goals and caused by someone else intentionally.
It was argued that these paradoxical results may have been influenced by the
existence of subgroups, within each social identity salience condition, showing
different response patterns. The qualitative interpretation of Figures 2.3 and 2.4.and
the results of additional analyses provided some support for this alternative
explanation. It seems likely that in this study the effects of social identity salience
condition on appraisals (i.e., obstructiveness to goals, being caused by other, and
being caused by other intentionally) and emotion responses (i.e., anger, relief,
happiness and joy) were confounded by the existence of two subgroups within the
high social identity salience condition. Concretely, results of these additional analyses
suggested that within the high social identity salience condition one subgroup of
participants (i.e., labeled “the angry subgroup”) appraised the vignettes as
significantly more obstructive to goals, and as being caused by the other, and reported
significantly stronger anger than the other subgroup of participants (i.e., labeled “the
positive emotions group”). It is interesting to note that when ratings of participants in
the high social identity salience “angry subgroup” were compared with those of
participants in the low social identity condition there were no significant differences
on appraisals of obstructiveness to goals, and on appraisal of causality by other. Yet,
participants in the low social identity condition still rated appraisal of causality by
other intentionally significantly higher. Finally, participants in the high social identity
salience “angry subgroup” still rated relief, and happiness significantly higher than
participants in the low social identity condition (with mild intensities), and they also
anger and irritation significantly higher (with moderate intensities).
2.4.2. Appraisal as a mediator between social identity and emotion?
As expected, appraisals (i.e., being caused by other, being caused by other
intentionally) partially mediated the relationship between social identity salience
condition and emotion (i.e., anger). These results are encouraging but the also need to
be interpreted with the extreme caution. According to Baron and Kenny ( p.1177), to
be able to accurately estimate mediation using multiple regressions there needs to be

66
no measurement error and the dependent variable should not cause the mediator. This
study relied on self-report measures of appraisals and emotions, so measurement
errors are likely to be present. In addition, the inferred direction of causality from
appraisal to emotion proposed by appraisal theory cannot be assumed from just self-
report measures (see Ellsworth & Scherer, 2002). Therefore, it cannot be excluded
that in this study these errors may have created an overestimation of the effect
between social identity salience condition and emotion. Unfortunately, this study did
not have multiple indicators for each appraisal construct and the sample is small
making it impossible to estimate the mediation paths by latent-variable structural
modeling methods. Moreover, the existence of subgroups as a confounding renders
interpretation of these results difficult.
2.4.3. Limitations and general conclusions for this study
Although the principal aim of this study was to test experimental hypotheses derived
from the review of the literature, on important underlying objective was to determine
whether the University of Geneva social identity and the hypothetical merger between
The University of Geneva and the University of Lausanne represented an intergroup
setting that could be used for other experiments. The major limitations of this study
are outlined below and some general conclusions are drawn for the next studies.
The first limitation is that the social identity salience manipulations used in this study
were inadequate for the research purposes, and this for two major reasons. First, the
rationale for manipulating the University of Geneva social identity membership in the
context of the real announced merger with another University was to attempt to
capture “real” and ongoing intergroup tensions, and thus to get closer to “real”
intergroup appraisals and emotions. But a “real” social identity membership has
greater complexity and thus it is harder to manipulate it experimentally. In this study
it cannot be excluded that the meaning that first year students gave to the University
of Geneva social identity may have been very different than the meaning given by
older students. In other words, it is possible that the target sample was missed by
selecting first year students as opposed to 2nd or 3rd year students who would have had
more of an opportunity to develop their identification with the University of Geneva.
Second, even though participants in the high social identity salience condition had

67
been pre-selected based on their higher scores on the private collective self-esteem
subscale, and even though in the manipulation check questions they had reported
significantly stronger identification with the university of Geneva (and other
memberships related to the university) these participants also reported stronger
identification to demographic membership such as age, sex and nationality which
were not manipulated in this study. On the one hand, these results could suggest
greater social desirability on the part of participants in the high social identity salience
condition. Another possibility is that the higher scores of the private collective self-
esteem scale on which participants were pre-selected and matched to the high social
identity salience condition were not accurate proxies of identification to the
University of Geneva. In fact, these participants had significantly higher scores on all
four collective self-esteem subscales. Moreover, two sub-groups of participants with
different appraisal and emotion response patterns were identified within the high
social identity salience condition. It was shown that they did not differ on any of the
Collective Self-Esteem subscales, which, Crocker & Luhtanen (1990) have claimed
are a measure of individual differences on trait collective self-esteem. Yet, it cannot
be excluded that in this study participants in the two social identity salience
conditions (and even within each social identity salience condition) may have actually
differed on other underlying dispositional factors not measured in this study (e.g.,
tendency to conform, need for belongingness, etc.). Unfortunately, this data does not
allow the examination this hypothesis.
The second limitation is that the vignettes describing the events associated to the
merger were not adequate in inducing emotion and anger in particular, and this for
two reasons. First, results on emotions clearly showed that anger was not the emotion
that best characterized participants’ emotion responses to the events associated to the
announced merger as described by the vignettes. Irrespective of social identity
salience condition, the strongest intensities were observed for interest, surprise,
anxiety or irritation. In retrospect, this study attempted to induce a hot anger response
as seen in student demonstrations and strikes before the study was conducted.
However, it is possible that it was a very particular student population expressed this
type of emotion response. Again students demonstrating were mostly older students
(2nd and 3rd years) who were more aware of what was at stake, and who were also
more actively involved in student activities. In fact, having assisted to other meetings

68
about the merger that were organized after the study was conducted, it became clear
that the people who continued to angrily demonstrate against the announced merger
belonged to student and teaching assistant unions, and to particular student political
organizations. Second, the effects of social identity salience manipulation on
appraisals may have been suppressed by the uneven quality of the 6 written vignettes
used to induce anger. Though the 6 events were selected from multiple real sources,
and reflected actual information about the merger, and were selected based on a pilot
study testing their potential for inducing anger in this student population, results
clearly showed that the vignettes were not equivalent in inducing anger. It was
expected that for participants in the high social identity salience condition, the 6
events would be generally interpreted as negative events threatening the concerns of
the manipulated ingroup (i.e., “students at the University of Geneva”). But it is
possible that the University of Geneva membership was not the most salient for these
students. It has been argued that the individual’s level of self-categorization is not
fixed, and may actually change as a function of contextual cues and across time and
situations (Brewer, 1991). In this study, one possibility is that the content of the
vignettes may have enhanced the salience of other potential ingroup membership
evoked in the vignettes (Genevan vs. Vaudois; first year students vs. postgraduate
students).
Thus, in the next studies it seemed important to identify more distinct and
experimentally controllable social identity memberships, but also events (and actors
associated to those events) to evoke appraisals and the corresponding emotions.

69
CHAPTER 3
SECOND EXPERIMENT
3.1. Overview
For the second study I created a paradigm that allowed greater experimental control
over the manipulations of social identity salience and over the events used to evoke
appraisals and induce emotion, as discussed below. The focus was on testing whether
social identity salience manipulations would affect individual’s appraisals and
emotions felt about the behavior of a target outgroup.
In this experiment, the basic cover story was that the researchers were interested in
the study of emotions during virtual business negotiations. Participants were led to
believe they would become involved in an experiment that would simulate a virtual
business negotiation between themselves and another person via the computer. The
content of the negotiation task was based on an existing business case study in which
the directors of different functional departments (e.g. research and development,
production, marketing, etc.) in a car company have to negotiate 3 strategic decisions.
In this study, all participants were assigned the role of the director of research and
development (R & D) and were lead to believe they would negotiate via the computer
with one person playing the role of the director of the production department (PROD).
The salience of participants’ R&D membership was manipulated to create a high and
low social identity salience conditions. In addition, the overall negotiation strategy
(i.e., across the 3 decisions) of the virtual “other” was manipulated to be either mostly
collaborative or mostly competitive. Participants’ appraisals and emotion responses
toward the other’s choice of negotiation strategy (i.e., to collaborate or to compete)
were measured for each of the 3 decisions negotiated. This study tested whether the
social identity salience manipulation would affect participants’ appraisals and the
corresponding subjective emotional responses to other’s choice of negotiation
strategy.
The manipulations in the high social identity salience condition were designed to
enhance the intergroup dimension of the experiment, and the manipulations in the low

70
social identity salience condition were designed to enhance the interpersonal
dimension of the experiment. To manipulate other’s choice of negotiation strategy it
was decided to create a computer program. The content of the materials used was
based on existing written materials intended for the business case study described
above. The structure of the negotiation task and the scoring matrix used to allocate
points to each party were based on the prisoner’s dilemma paradigm (for a review of
research using the PDG and other social dilemmas see Kollock, 1998; Komorita, &
Parks, 1995, 1996; Liebrand, Messick & Wilke, 1992; and Messick & Brewer, 1983).
In this paradigm players are confronted with a social dilemma and must choose
between collaboration (C) and competition (D as it is also know as defeat). The game
is played in synchronous manner so players cannot anticipate the other’s choice of
negotiation strategy and scores are determined by the combination of players’
strategies. In the classic PDG, four outcomes with different relative value are
possible: the best possible score is obtained for the player that competes if the
opponent cooperates (D/C); the next best outcome is obtained from mutual
collaboration (C/C), followed by mutual competition (D/D), the worse score is
obtained for the player that cooperates if the opponent competes (C/D)1. Thus, from
the individual’s perspective competition renders more points than collaboration
irrespective of what the other does. The dilemma lies in that individually reasonable
behavior of competition at all costs to win, leads to a situation that is unreasonable
from the perspective of the collective that ends up worse off than if everyone had
collaborated. The question that is at the core of social dilemmas is to better
understand what leads to situations of cooperation (i.e., those situations when
individual rationality shifts to collective rationality, see Kollock, 1998). Not
surprisingly, social dilemma paradigms have been of particular interest to researchers
studying the influence of social identity on competitive and cooperative behaviors
(Kramer, 1993; Kramer & Brewer, 1984). In this study, the focus was not on how
social identity salience would affect the person’s own behavior, but rather on how it
would influence appraisals and emotions felt as a member of a salient ingroup about
the other’s cooperative and competitive behavior as a member of a target outgroup.
1 Thus, the relative value of the outcomes is: DC>CC>DD>CD.

71
3.1.1. Overview of the hypotheses
a) Hypotheses about appraisal patterns and emotions expected in response to
other’s choice to collaborate or to compete. Based on earlier published predictions of
appraisal patterns for emotions (e.g., see Scherer, 1984b, 1988), predictions were
elaborated for appraisal patterns and the corresponding emotions expected for this
experiment as discussed below (a summary of these predictions is illustrated in Table
3.1.).
Table 3.1. Predictions of appraisal patterns for the emotions measured in this study
Computer collaborates Computer competes
Surprised Relieved Satisfied Happy Frustrated Irritated Angry
Goal significance Conduciveness?
Open
High
High
High
Low
Low
Low
Agency Caused by other’s personality? Caused by their group membership?
Open
?
Low
?
Low
?
Low
?
High
?
High
?
High
?
Compatibility with Standards Self (unfair/unjust?) Ingroup norms
(unfair/unjust?)
Open Open
Low Low
Low Low
Low Low
High High
High High
High High
Note. Open=different results are compatible. In the context of this negotiation task, irrespective of social identity salience condition
and overall strategy condition,
H1: The manipulation of the computer to compete was intended to evoke appraisals of
low conduciveness to goals, high causal attribution to other’s personality (i.e., higher
internal attribution of negative acts by other), and high unfairness and injustice.
Thus, other’s choice to compete was expected to induce negative emotions such as
frustration, irritation, and anger.
H2: The manipulation of the computer to collaborate was meant to induce overall
appraisals of high conduciveness to goals, low causal attributions to other’s
personality (i.e., lower internal attributions of positive acts by other), and low
unfairness and injustice. Thus, other’s choice to collaborate was expected to induce
positive emotions like relief, satisfaction, and happiness.

72
No specific propositions were made about surprise as it was considered that this
emotion might be experienced when the computer competed (i.e., negative surprise)
and when the computer collaborated (i.e., positive surprise).
b) Hypotheses about the impact of social identity salience condition on each
appraisal dimension as reported in response to other’s choice to collaborate or to
compete. Based on the propositions made in the review of the literature about the
impact of social identity salience on appraisals, it was predicted that differences
would emerge between high and low social identity salience conditions for appraisal
as follows (a summary of the predictions is found in Table 3.2.):
Table 3.2. Predictions for appraisals as a function of social identity salience condition Appraisal dimensions
Not at all
Extremely
Goal significance
Conduciveness
a b d c
Agency
Caused by other’s group membership? Caused by other’s personality?
s
Compatibility with personal standards and ingroup norms
Considered as unfair and unjust by self? Considered as unfair and unjust by other ingroup members?
Note: a=high social identity salience condition/computer competes ; b=low social identity salience condition/computer competes; c=high social identity salience condition/computer collaborates; d=low social identity salience condition/computer collaborates.
Goal significance (i.e., goal conduciveness). In the first chapter, it was
proposed that in an interpersonal situation people would tend to evaluate this appraisal

73
dimension in terms of their personal goals, whereas in an intergroup situation people
would tend to evaluate this appraisal dimension in terms of the salient ingroup goals.
In this experiment, it was expected that for participants in the high social identity
salience condition it would be more important to defend the goals of R&D department
(i.e., salient ingroup) in opposition to the goals of PROD department (i.e., target
outgroup) than for participants in the low social identity salience condition. Thus,
H3: It was hypothesized that other’s choice to compete would be appraised less as
being conducive to goals by participants in the high social identity salience condition
than by participants in the low social identity salience condition.
H4: Similarly, it was hypothesized that other’s choice to collaborate would be
appraised more as being conducive to goals by participants in the high social identity
salience condition than by participants in the low social identity salience condition.
Agency (i.e., caused by other’s personality; caused by other’s group
membership). In the first chapter, it was proposed that in an interpersonal situation
people would evaluate causal attribution appraisals in terms of the self in relation to
other(s) interpersonally, whereas in an intergroup situation people would evaluate this
appraisal dimension in terms of the salient ingroup in relation to the target outgroup.
In this experiment, it was expected that for participant in the high social identity
salience condition the attributions of causality made about other’s choice to compete
(i.e., a negative act) and to collaborate (i.e., a positive act) were more likely to be
affected by intergroup attribution biases favoring the ingroup. Accordingly, higher
internal attributions are expected when explaining negative acts by outgroups, and
lower internal attributions are expected when explaining positive acts by outgroups.
Therefore,
H5: It was hypothesized that other’s choice to compete (i.e., negative outgroup act)
would be appraised more as being caused by other’s personality (i.e., higher internal
causal factor) by participants in the high social identity salience condition than by
participants in the low social identity salience condition.
H6: Similarly, it was hypothesized that other’s choice to collaborate (i.e., positive
outgroup act) would be appraised less as being caused by the other’s personality (i.e.,
lower internal causal factor) by participants in the high social identity salience
condition than by participants in the low social identity salience condition.
74
This study also explored whether social identity salience would affect the relative use
of “other’s social group membership” as a causal factor when appraising the causality
of an outgroup’s behavior. In this experiment, because social group membership was
manipulated to be more salient for participants in the high social identity salience
condition, it was expected that they would use it more as a causal factor in general
than participants in the low social identity salience condition. Thus,
H7: It was hypothesized that other’s choice to compete and other’s choice to
collaborate (i.e., positive and negative outgroup acts) would both be appraised more
as being caused by other’s group membership (i.e., social group membership causal
factor) by participants in the high social identity salience condition than by
participants in the low social identity salience condition.
Compatibility with personal standards and norms (i.e., considered as unfair
and unjust by self; considered as unfair and unjust by other ingroup members). In the
first chapter it was proposed that in an interpersonal situation people would evaluate
this appraisal dimension in terms of the self in relation to social norms in general,
whereas in an intergroup situation people would evaluate this appraisal dimension in
terms of the self in relation to salient ingroup norms. In this experiment, there were
no explicit norms about what should be considered to be unfair or unjust (as
considered by the self and by other ingroup members). However, the manipulations in
the high social identity salience condition were designed to enhance the intergroup
competitive dimension of the experiment. Consequently, for participants in the high
social identity salience condition, perceptions of unfairness and injustice (as
considered by the self but in particular as considered by the ingroup) are more likely
to be affected by egoistic biases favoring the ingroup. Concretely,
H8: It was hypothesized that other’s choice to compete would be appraised more as
being unfair and unjust (as considered by self and particularly by other members of
the ingroup) by participants in the high social identity salience condition than
participants in the low social identity salience condition.
H9: It was hypothesized that other’s choice to collaborate would be appraised less as
being unfair and unjust (as considered by self and particularly by other members of
the ingroup) by participants in the high social identity salience condition than
participants in the low social identity salience condition.

75
c) Hypotheses about the impact of social identity salience condition on
emotion intensity as reported in response to other’s choice to collaborate or to
compete. Finally, in the first chapter it was proposed that the stronger the salience of
the identification to a social group the stronger the intensity of emotions felt about
events directly pertinent to the concerns of that social group. In this experiment,
other’s choice to compete or collaborate were events that were manipulated to be
more directly relevant for the concerns of participants in the high social identity
salience condition. Thus,
H10: It was generally expected that the reported intensity of negative (i.e., frustration,
irritation, anger) and positive emotions (i.e., relief, satisfied, happy) felt about other’s
choice to compete and to collaborate respectively, would be stronger for participants
in the high social identity salience condition than for participants in the low social
identity salience condition
c) Mediation Hypothesis. In the first chapter it was proposed that social
identity salience would influence appraisal dimensions, which in turn influence
emotions in terms of type and intensity. In this experiment, the influence of social
identity salience on positive (i.e., relief, satisfied, happy) and on negative emotions
(i.e., frustration, irritation, anger) expected in response to other’s choice to collaborate
and other’s choice to compete, is expected to be mediated by the corresponding
appraisals (see prediction of appraisal patterns for emotions in Table 3.1). Like in
study 1, appraisal is expected to function as a mediator between social identity and
emotions under the following conditions: (a) variations in the levels of social identity
salience condition (high vs. low) significantly account for variations in emotion (i.e.,
termed path a), (b) variations in appraisals significantly account for variations is
emotion (i.e., termed path b), and (c) when path a and b are controlled for, a
previously significant relationship between social identity salience and emotion (i.e.,
termed path c) is no longer significant (or at least a significant decrease is observed).
The diagram in Figure 2.1. in chapter 2 depicted the formulation of this mediation
hypothesis.
d) General predictions about the impact of overall strategy condition and time.
Although no specific hypotheses were made about how the effects of social identity
salience condition on appraisals and emotions, as hypothesized above, would differ as
a function of overall strategy condition (i.e., across the 3 decisions participants were
exposed either to a mostly collaborative strategy (i.e., decision 1=compete; decision
76
2=collaborate; decision 3=collaborate) or a mostly competitive strategy (i.e., decision
1=compete; decision 2=collaborate; decision 3=collaborate), and would change in
time across the 3 Events (i.e., participants were exposed to the 3 Events in the same
order as established by the business case materials: Event 1, followed by Event 2,
followed by Event 3), these effects were explored guided by the general prediction as
describe below,
GP1- The impact of overall strategy condition: Based on the fact that in the mostly
collaborative condition there is more collaboration and in the mostly competitive
condition there is more competition, a main effect for overall strategy condition on
appraisals and emotions was expected. The direction of these main effects was
expected to follow the hypotheses concerning appraisals and the corresponding
positive and negative emotions responses to collaboration and competition.
GP2- The impact of time: Based on the fact that in both overall strategy conditions
there was a switch in strategies between Event 1 and Event 2, followed by no change
between Event 2 and Event 3, an interaction effect between overall strategy condition
and time on appraisals and emotions was expected. In both overall strategy
conditions it was expected that the strongest change in appraisals and emotions as a
function of time would occur between Event 1 and Event 2, and that little or no
change would occur between Event 2 and Event 3.
3.2. Method
3.2.1. Participants
Ninety-one first-year psychology students from the University of Geneva (i.e., 25
males and 66 females2,with a mean age of 23 years) were recruited to participate in
this experiment. When signing up for the experiment, participants were told that this
experiment concerned the role of emotions during virtual business negotiations in
organizations. All cases were included in the analyses. All students received partial
course credit for their participation.
2 Like for study 1, these male/female proportions are representative of 1st year psychology students at the University of Geneva.

77
3.2.2. Procedure
Sessions were carried out over three weeks, 2 days per week, 4 sessions per day, 2
sessions in the morning and 2 in the afternoon. Each session lasted from 25 to 35
minutes. Up to 6 participants could participate in the same session. Participants were
randomly assigned to social identity salience condition (high or low) and to overall
strategy condition across the 3 events (mostly competitive or mostly collaborative). In
total, 23 participants were assigned to high/mostly competitive condition3, 24 were
assigned to the high/mostly collaborative condition4, 24 were assigned to low/mostly
competitive condition5, and 20 were assigned to the low/mostly collaborative
condition6. These conditions were counterbalanced between subjects (see Appendix
B.1). Furthermore, the study was designed to be double blind. Before each session, an
experimenter who did not interact with participants, had prepared the materials in the
computer lab according to the established counterbalancing design. Concretely, the 6
computers were pre-programmed to play the corresponding overall negotiation
strategy (either mostly collaborative or mostly competitive), and on each computer
desk there was the corresponding package of written instructions to manipulate
participants’ social identity salience (high or low). A second experimenter who was
completely blind to the experimental conditions to which participants were assigned
administered the experimental procedure described below.
Upon arrival to their session, the second experimenter welcomed participants in front
of the computer lab and assured them that participation was voluntary, that they could
withdraw from the experiment at any time, and that information collected during the
experiment would be confidential. They were then taken into the computer lab which
had 6 identical computer cubicles separated by divisions that did not allow
participants to see each other (see detailed description of the computer lab below). In
each cubicle the computer screens were turned off and participants were instructed to
sit down, leave computer screen turned off, proceed to read the written instructions
package that were on their computer desks, and to let the experimenter know when
they were finished reading. They were told to complete the background questionnaire 3 4 males and 19 females, 17 Swiss and 6 non-Swiss nationals, with a mean age of 22.70 years. 4 10 males and 14 females, 19 Swiss and 5 non-Swiss nationals, with a mean age of 23.42 years. 5 6 males and 18 females, 20 Swiss and 4 non-Swiss nationals, with a mean age of 24.58 years.

78
included in the package at the end of the experiment. They were then told that they
had a maximum of 10 minutes to read the materials to prepare for the negotiation
because the study was conducted with people in another lab and it was necessary to
keep strict schedules. Once all participants had read their instructions the
experimenter asked if they had any questions, addressed their questions, and asked
them to wait for 2 minutes while she made a phone call to the other lab to check if the
other participants were ready. The phone was in the same room. On the phone the
experimenter always said the same thing following a written script (copy in Appendix
B.2.1.): "We have finished reading the materials and we are ready to start the
negotiations, are you? Um hum….Ok. We are__(number of people that had showed
up for the experiment) and you? Ok. Perfect! So we are using computers number __
(computers had a clear label with a number written on them, so the numbers of the
computers being used were spelled out). Ok, so we will have computer 1 interacting
with computer 1, 2 with 2… (Until all used computers were assigned to a pair). Ok,
we'll begin the negotiation now.”
Participants were then instructed to turn on their computer screens. They were told
that the first two screens would display a general description of the business situation
and the rules of the negotiation. In addition, they were told that before starting the real
negotiations they would have the opportunity of going through 2 practice
negotiations7 with the other person to become familiar with the computer and the
rules of the negotiation. The were further informed that after the 2 practice negations
they would directly continue with the 3 real negotiations. Finally, they were asked to
start, and to please remain silent and not to communicate with the other participants
present in the lab during the negotiations. They were told that once they were finished
they had to wait until all participants were finished before leaving the room. The
experimenter sat silently in the back of the room during the experiment. At the end of
the experiment participants were asked to complete the one page demographic
questionnaire that was included in their package. After completing this, participants
were thanked for their participation and were told they would be informed about the
results of the experiment in a session organized for this purpose once the study was
6 5 males and 15 females, 16 Swiss and 4 non-Swiss nationals, with a mean age of 22.50 years 7 As shown in the counterbalancing design in Appendix B.1., the order of presentation of type of negotiation strategy used by the computer for these two test negotiations was also counterbalanced.

79
finished. Finally, they were asked to keep strict confidentiality about all details
concerning the experiment, in particular toward other fellow students.
3.2.3. Manipulations, materials and measures
a) Manipulation of social identity salience (see copy of written instruction in
French in Appendix B.2.2 and B.2.3.). The salience of the R&D department
membership was manipulated through the written instruction packages given to
participants before the started the negotiations. The instructions in the high social
identity salience condition were designed to enhance the intergroup dimension of the
experiment, and the instructions in the low social identity salience condition were
designed to enhance the interpersonal dimension of the experiment. In this way, it was
expected that the salience of the R&D social identity would be the strongest for
participants in the high social identity salience condition and the lowest for
participants in the low social identity salience condition. Table 3.3. presents a detailed
summary of the differences in instructions contained in the two social identity
salience conditions.
b)Manipulation of collaboration and competition. Irrespective of the
participant’s choice, the computer was programmed to play either competition or
collaboration. When the computer chose competition it meant that the business
decision made was in opposition to the decision favored by the department to which
participants belonged. When the computer chose collaboration it meant that the
decision made leaned toward the decision favored by the department to which
participants belonged (see copy of the operationalizations of these strategies in French
in Appendix B.3.6., B.3.7. and B.3.8.). Initially, the negotiation strategy across the 3
decision events was designed to be either only competition responses or only
collaboration responses. However, a pilot study revealed that the repetition of the
same response across the 3 events was undermining the credibility of a real “other”
person responding. Thus, to enhance realism it was decided to compromise and to
have one negotiation strategy condition that was “mostly collaborative” (the computer
competed for decision 1 and collaborated for decisions 2 and 3); and one negotiation
strategy condition that was “mostly competitive” (the computer collaborated for
decision 1, and competed for decisions 2 and 3).

80
Table 3.3. Summary of instructions in the two social identity salience conditions High Social Identity Salience Low Social Identity Salience
Aims of the Study
To enhance the ingroup vs. outgroup dimension -To better understand the role of emotions in inter-departmental (between members of two functional departments) virtual negotiations in organizations. -Researcher had constructed a computer tool to conduct negotiations between the members of two departments. -Researchers had re-created a lab simulation of a virtual negotiation based on the case of a real car company, Porsche, and that they would play a role as a virtual negotiator.
To enhance the interpersonal dimension -To better understand the role of emotions in interpersonal (between collaborators) virtual negotiations in organizations. -Researcher had constructed a computer tool to conduct negotiations between two persons. -Idem
General Instructions
-To read attentively the company case descriptions and the description of their role (once for comprehension and a second time taking notes to help them prepare for the negotiations) To enhance pertinence of the ingroup membership -To try to get into the role as much as possible during the whole negotiation -To only use the information given in the case and not to invent or add other external information.
-Idem -Not included -Idem
Specific Instructions Concerning Their Role
To enhance the ingroup vs. outgroup dimension -Told that all the other participants in this lab were also members of the "research and development" department and that each one of them would negotiate via the computers in pairs with members of the "production" department who were in another computer lab identical to the one they were in. -Told that their department had confidence in them and that their team of researchers knew that they shared the same values and objectives with them (excellence in research, to stay the number on in the automobile technology, and to continuously look for opportunities to develop new projects in the company). -Told that their department expected them to defend the objectives of their department at all costs as this was necessary to keep all employment positions and to avoid reductions to their budget.
To enhance the interpersonal dimension -Told that each one of them would negotiate via the computers in pairs with another person in another computer lab identical to the one they were in. -Not included -Not included
Note. The information on the car company and the general information about the 3 decisions that needed to be taken, as well as the technical information on their role and the positions taken by the research and development department were identical in both conditions. In total the instruction package in the high identity salience condition was 4 pages long, and 3 pages long in the low identity salience condition (see Appendix B.2.2 and B.2.3.).
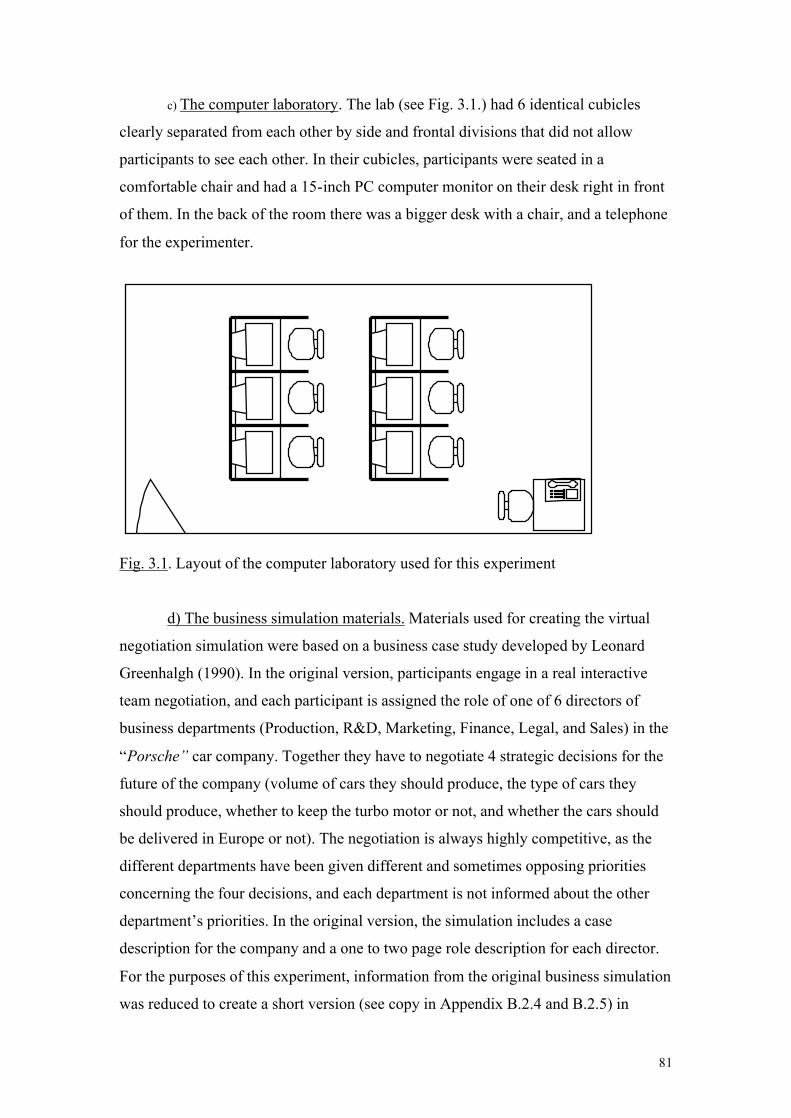
81
c) The computer laboratory. The lab (see Fig. 3.1.) had 6 identical cubicles
clearly separated from each other by side and frontal divisions that did not allow
participants to see each other. In their cubicles, participants were seated in a
comfortable chair and had a 15-inch PC computer monitor on their desk right in front
of them. In the back of the room there was a bigger desk with a chair, and a telephone
for the experimenter.
Fig. 3.1. Layout of the computer laboratory used for this experiment
d) The business simulation materials. Materials used for creating the virtual
negotiation simulation were based on a business case study developed by Leonard
Greenhalgh (1990). In the original version, participants engage in a real interactive
team negotiation, and each participant is assigned the role of one of 6 directors of
business departments (Production, R&D, Marketing, Finance, Legal, and Sales) in the
“Porsche” car company. Together they have to negotiate 4 strategic decisions for the
future of the company (volume of cars they should produce, the type of cars they
should produce, whether to keep the turbo motor or not, and whether the cars should
be delivered in Europe or not). The negotiation is always highly competitive, as the
different departments have been given different and sometimes opposing priorities
concerning the four decisions, and each department is not informed about the other
department’s priorities. In the original version, the simulation includes a case
description for the company and a one to two page role description for each director.
For the purposes of this experiment, information from the original business simulation
was reduced to create a short version (see copy in Appendix B.2.4 and B.2.5) in

82
which only two persons would conduct a virtual negotiation through the computer. In
this version only the roles of 2 directors were retained, director of production (PROD)
and director of research and development (R&D), and participants only conducted 3
strategic decisions: volume of cars they should produce, the type of cars they should
produce, and whether to keep the turbo motor or not. The business departments
retained were the ones who were in strongest opposition of priorities for these 3
decisions. Participants were always assigned the role of director of R&D department
because it was considered to be more pertinent to psychology students than the role of
director of PROD department. Table 3.4. describes the core information participants
received about each of the 3 decisions, the position of the Porsche Company, and the
positions defended by their department. No information was given about the position
of the other department. The information for the 2 practice negotiations was created
for the purposes of this experiment.
Table 3.4. Information received by participants concerning the decisions to make
Pre-test 1
Pre-test 2
DEC 1 DEC 2 DEC 3
PORSCHE
new
commercial spot?
% of 2 new colors?
Volume of cars?
30,000 to 50,000 Last year: 40,000
Type of cars?
% coupés & % cabriolets Last year: 60% and 40%
Turbo option?
Keep or oppose turbo?
Position
favored by R & D Dep’t.
Accept new spot
50% & 50%
30,000
50% coupés and 50% cabriolets
keep turbo
Position
favored by PROD. Dep’t.
Keep spot last year
100% one color
50,000
100% coupés
oppose turbo
Note. Information in bold was received by participants before the computer interaction, they were not informed on the position favored by the other department.
e) The computer program. The program was created using Microsoft’s Visual
Basics 5.0 and it was designed to simulate a real computerized exchange of
information between the participant and another person (The content of each screen in
described in Appendices C1 though to C7). The first 2 screens were purely
informative. The first screen displayed general information about the Porsche car
company, the importance of the 3 decisions to be made, and the business rationale for
why these decisions needed to be made virtually. By clicking on a continue button at

83
the bottom of the screen, participants were led to a second screen. The second screen
displayed general rules for the negotiation and explained the point allocation system.
In these written instructions participants were reminded that they represented the
R&D department and that their task was to negotiate 3 decisions with a member from
the production department. They were further told that for each negotiation they had
to chose between two basic types of negotiation strategies: “To collaborate: by
adapting one's own department objectives to meet the other department's objectives”,
or “To compete: by defending one's own department's objectives to the detriments of
the other department's objectives”. At the bottom of the second screen participants
were informed about the point allocation rules: they were told that they could chose
their strategy without communicating it to the other person, and that after having
indicated their strategy they would be informed about the other person's strategy.
They were further told that after each decision taken by both of them, they would be
informed about the number of points received by themselves and by the other which
would be determined by the strategies chosen by both of them. They were told that the
general aim of the game was to gain points to help their department save jobs and
avoid budget cuts. Participants had the possibility to click on a button to go back and
re-read the previous screen or a button to move on to the two practice decisions.
The screens that followed simulated 5 rounds of negotiation in which there was a
fake exchange of information between the participant and the other person. The first
2 rounds were the practice decisions. Immediately after the practice decisions
participants were presented with a screen that reminded them of the rules before they
engaged in the remaining 3 real business decisions. For each round participants saw
an initial screen that displayed at the top of the screen the core information for that
decision, and in the middle of the screen two identical squares positioned at the same
level describing the competitive strategy and the collaborative strategy for that
decision. Once participants had clicked on a chosen strategy, the screen was replaced
by another screen that had a dialogue box in the middle. The text displayed in this box
changed gradually in time to inform participants that: 1) their message was being sent,
2) they were waiting to receive the other’s response, 3) they were receiving the
other’s response and 4) finally gave them feedback on the type of negotiation strategy
chosen by the other, together with the number of points gained by both of them
(according to a pre-programmed allocation matrix described in detail below). To

84
increase the realism of each exchange of information, the computer was programmed
to randomly vary the number of seconds that elapsed from the moment participants
clicked on their strategy to the moment they received the last feedback on the other’s
strategy (between 5 to 10 seconds). Immediately after each round, but only for the 3
real business decisions, participants had to complete computerized questionnaires for
appraisals and emotion responses of the other’s strategy (see details below). After the
5th round, participants were asked to respond to some final questions about their role
(social identity manipulation check questions). On the last screen, participants saw a
dialogue box with gave them the global score made by themselves and by the other
and thanked them for their participation.
f) The scoring matrix. As discussed in the introduction the matrix used to
calculate points in the computer program was based on the classic prisoner’s dilemma
paradigm. Participants were confronted with 3 decisions and for each they had to
choose between two alternatives, collaboration (C) or competition (D). Since the
game was played in synchronous manner, participants could not anticipate the other’s
strategy. The score was determined by the combination of participant’s and the
computer strategies. The four possible outcomes differed in relative value so that the
best possible score was obtained when participants competed and the computer
cooperated (D/C); the next best outcome was obtained from mutual collaboration
(C/C), followed by mutual competition (D/D), the worse score was obtained when
participants cooperated while the computer competed (C/D)8. The scoring matrix used
in this experiment is illustrated in Figure 3.2. The details of the operationalizations for
other’s choice to compete and other’s choice to collaborate for each of the 3 decisions
are illustrated in Appendix B.3.6., B.3.7. and B.3.8.
8 Thus, the relative value of the outcomes is: DC>CC>DD>CD.

85
The computer program
Collaboration (C) Competition (D)
Collaboration (C)
2
2 0
3
Part
icip
ant
Competition (D)
3
0 ∗ 1
1
Fig. 3.2. Illustration of the scoring matrix used in this experiment
g) Appraisal questionnaire (see copy of questions in French in B.4.1.): The
computerized appraisal questionnaire was completed 3 times by participants, each
time immediately after obtaining information about the negotiation strategy used by
the opponent. To attempt to reduce the potential bias of their previous answers, the
questionnaire was programmed so that each appraisal question was presented and
completed in a separate screen and participants couldn’t go back to the screen
presenting the previous question or view their previous answer. Participants were
asked questions concerning the following appraisal evaluation criteria:
1) Pleasantness: extent to which the negotiation strategy chosen by the other was
considered to be pleasant or unpleasant for them (rated from 1= “unpleasant”, 4 and
5=“neutral” to 9=“pleasant”)
2) Goals significance: extent to which the negotiation strategy chosen by the other
was considered to be goal conducive for them (rated from 1= “hinders your goals”,
5=“neutral” to 9=“helps you achieve your goals”), and was considered to be important
(rated from 1= “not at all”, 4 and 5=“moderately” to 9=“very much”).
3) Coping Potential: extent to which the negotiation strategy chosen by the other was
considered to be caused by the person’s membership to the production department,
caused by the person’s personality, was intentionally directed against them, and had
consequences that they could control (all rated from 1= “not at all”, 4 and
5=“moderately” to 9=“very much”).
4) Compatibility with personal standards and ingroup norms about unfairness and
injustice: extent to which the strategy chosen by the other was considered as unfair or
unjust by the them, and considered to be unfair or unjust by other members of their
∗ Nash equilibria “any pair of strategies with the property that each player maximizes his or her payoff given what the other player does” (Ostrom , Gardner, & Walker, 1994, p.54).

86
own business department (all rated from 1= “not at all”, 4 and 5=“moderately” to
9=“very much”).
h) Emotion response type and intensity questionnaire (see copy of questions in
French in Appendix B.4.2.): The computerized emotion questionnaire was also
completed 3 times , each time it followed the appraisal questionnaire. In this
questionnaire participants were asked to characterize the emotions felt toward the
negotiation strategy used by the other, by rating the intensities of 3 positive emotions
(relief, happy, satisfied), 3 negative emotions (irritated, frustrated, and angry) and
surprise using a 9 point response scale (where 1 = “not at all”, 2 = “very weak”, 4 and
5= “moderately strong” and 9= “very strong”). Emotion labels were presented in
random order, and an empty space was left in case they wanted to indicate other
emotion labels not included in the list. Again, each emotion question was presented
and completed separately, and participants were not able to go back to see their
previous responses.
i) Social identity salience manipulation check questionnaire (see copy of
questions in French in Appendix B.4.3.): This final computerized questionnaire asked
4 questions concerning the identification participants felt to the business department
they were assigned to play in the game (all were rated from 1= “not at all” to 9 “very
much”):
1) During this simulation, to what extent were your decisions influenced by your
membership to the research and development department?
2) During this simulation, did you identify with the department of research and
development?
3) During this simulation, was it pleasant for you to belong to the research and
development department?
4) During the simulation, was it important for you to belong to the research and
development department?
j) Demographic information questions (see copy of questions in French in
Appendix B.4.5.): At the end of the experiment participants completed a one page
(paper and pen) demographics information questionnaire that was included in their
instruction package asking questions about their age, sex, nationality, canton of

87
origin, and mother tongue and 3 filler questions about whether they had work
experience, the number of years, and whether they were familiar working with
computers.
3.3 Results
3.3.1. Overview of the analyses
The results are presented in six sections representing the different steps of the data
analyses. The first step involved all the preliminary analyses. The second step
consisted of checking the effectiveness of the social identity salience manipulation.
The third and fourth steps involved the repeated measures ANOVAs conducted for
each of the appraisal and emotion variables measured across the 3 Events. Repeated
measures ANOVA was chosen to attempt to take into account the fact that these 3
Events were not independent in time (participants were exposed to the 3 Events in the
same order as established by the business case materials: Event 1, followed by Event
2, followed by Event 3). In all analyses social identity salience condition (high or low
social identity salience) and overall strategy condition (mostly competition or mostly
collaboration) were the between subjects factors, and time (Event1, Event2, and
Event3) was the within subjects factor. The fifth step involved testing whether
appraisals mediated the relationship between social identity and emotion following
the analytic procedure for determining mediation through multiple regressions as
established by Baron & Kenny (1986). Finally in a sixth step, it seemed important to
try to account for the potential bias of the information about number of points gained
by self and other on appraisals and emotions about the other’s choice of strategy.
Thus, additional analyses were conducted to explore and test for this potential bias.
3.3.2. Preliminary analyses
All dependent variables were examined through various SPSS programs for accuracy
of data, missing values, outliers and fit between the distributions and the assumptions
for the analyses. Each cell of the design (i.e., high identity/mostly collaboration; high
identity/mostly competition; low identity /mostly collaboration; low identity/mostly
competition) was examined separately for outliers and normality. Some univariate

88
outliers were identified via the visual examination of box plots, but no case was
identified as being a multivariate outlier for a given appraisal or emotion variable.
Normality of variables was checked though the visual examination of histograms,
expected normal probability plots and detrended expected normal probability plots.
Violations of normality (strong kurtosis and positive skewness) were observed for
anger. These deviations were due to the fact that the majority of participants
responded on the lower end of the response scale. Homogeneity of
variance/covariance was verified for all variables using Box-M. Violations were
observed for causal attribution to group membership, considered as unfair and unjust
by self and by other members of ingroup. Because for no variable the ratio of largest
to smallest variance approached 10:1, and the discrepancies in cell sample size were
small these violations were disregarded (following suggestions by Tabachnick and
Fidel, 2000). Finally, an ANOVA was conducted to test for differences between
conditions in terms of mean age but no significant differences were found. Chi-square
tests were used to test for differences between conditions in terms of the ratio of
male/female and of Swiss/non Swiss nationals and again no significant differences
were found.
3.3.3. Manipulation checks
To assess the effectiveness of the social identity salience manipulation, a series of
ANOVAS were conducted for the 4 items used to measure participants’ perceived
identification to the R&D department (i.e., ingroup). In these analyses social identity
salience condition and overall strategy condition were the between subjects’ factors.
As expected, there was a main effect for social identity [F(1,90)=8.13, p<.01,
eta2=.08] indicating that participants in the high social identity salience condition
identified more with R&D than participants in the low social identity salience
condition ((Mhigh=7.51, SD=1.23; Mlow=6.61, SD=2.07). There was also a
significant main effect for overall strategy [F(1,90)=3.96, p<.05, eta2=.04] and a
significant interaction between social identity and overall strategy [F(1,90)=7.18,
p<.01, eta2=.08]. As shown in Figure 3.3., there were no significant differences on
identification as a function of overall strategy for participants in the high social
identity salience condition. However, for participants in the low social identity
salience condition, identification to R&D was rated significantly higher in the mostly

89
competitive condition than in the mostly collaborative condition [F(1,43)=7.31,
p<.05, eta2=.15]. It should also be noted in the mostly collaborative condition there
were no significant differences between social identity salience conditions.
social id condition
lowhigh
Mea
n id
entif
icat
ion
to th
e R
& D
dep
artm
ent
9
8
7
6
5
4
3
2
1
opponent's strategy
compet/collab/collab
collab/compet/compet
Irrespective of the overall strategy condition, participants in the high social identity
salience condition tended to give higher ratings than participants in the low social
identity salience condition on the perceived influence of the R&D membership on
their decisions (Mhigh=7.55, SD=1.21; Mlow=6.95, SD=2.20) [F (1,90)=2.98, p=.08,
eta2=.03], and on the perceived pleasantness of the R&D membership (Mhigh= 7.00,
SD=2.06; Mlow=6.25, SD=2.40) [F (1,90)=2.73, p=.10, eta2=.03], but these
differences were not significant. There were no significant differences between
conditions on perceived importance of the R&D membership (Mhigh= 5.85,
SD=2.23; Mlow=5.68, SD=2.22). These results only offer partial support for the
effectiveness of the social identity salience manipulations. In addition results, suggest
that the fact of being exposed to more competition in the mostly competitive strategy
may have enhanced the perceived identification to R&D for participants in the low
social identity salience condition. Overall strategy did not affect any of the other
social identity salience manipulation checks.
3.3.4. Analyses of appraisals and emotion ratings
3.3.4.1. Analyses of appraisals. A series of 2 X 2 X3 (mixed design) repeated
measures ANOVAs were conducted for each of the 9 appraisals measured, namely:
Fig. 3.3. Mean identification to R&D as a
function of social identity and overall
strategy.

90
pleasantness, conduciveness, importance, causal attribution to personality, causal
attribution to social group membership, intentionality, controllability, considered as
unfair and unjust by self, and considered as unfair and unjust by other members of
ingroup. In all analyses social identity salience condition (high or low social identity
salience) and overall strategy condition (mostly competition: E1 collab, E2 compet,
E3 compet, or mostly collaboration: E1 compet, E2 collab, E3 collab) were the
between subjects factors, and time (E1, E2, and E3) was the within subjects factor.
Cell means and standard deviations for all 9 appraisals are presented in Appendix
B.4.1. This section focused on results for those appraisal dimensions for which
specific hypotheses were made. The presentation of results will be organized as
follows: 1) appraisal of conduciveness, 2) appraisal of causal attribution to personality
and appraisal of causal attribution to group membership and 3) appraisal of unfairness
and injustice as considered by self and appraisals of unfairness and injustice as
considered by other ingroup members.
1)Appraisal of conduciveness. As shown in Figure 3.4. there was a significant
main effect for overall strategy [F(1,87)=25.27, p<.001, eta2=.22] and a significant
interaction between time and overall strategy [F(1.97, 171.369)=88.23, p<.001,
eta2=.50]. In support for hypotheses (H1 and H2) these results indicate that,
irrespective of overall strategy and across events in time, the negotiation task was
successful in inducing appraisal of lower conduciveness when the computer
competed, and higher conduciveness when the computer collaborated.
TIME
E3E2E1
Mea
n co
nduc
iven
ess
9
8
7
6
5
4
3
2
1
Overall strategy
compet/collab/collab
collab/compet/compet
Fig. 3.4. Mean conduciveness
as a function of time and overall strategy.

91
As expected, differences emerged between social identity salience conditions. Results
revealed a significant interaction between time, social identity and overall strategy
[F(1.97,171.3610)=3.16, p<.05, eta2=.04]. Guided by the hypotheses (H3 and H4), it
was decided to further explore this 3-way interaction by examining how differences
between social identity salience conditions changed across events in time within each
overall strategy condition (see Figures 3.5a and 3.5b). In the mostly collaborative
condition only, the main effect for social identity salience condition was marginally
significant [F(1,42)=3.64, p=.06, eta2=.08] and there was a significant main effect for
time [F(2,42)=55.25, p<.001, eta2=.57]. There was a significant interaction between
social identity and time [F(2,42)=4.32, p<.05, eta2=.09]. Repeated contrast analyses11
confirmed that the observed differences between social identity salience conditions
changed significantly but only between Event 2 and Event 3 [F(1,42)=6.57, p<.05,
eta2=.13]. In partial support for hypothesis (H4), simple effects analysis showed that
participants in the high social identity gave higher ratings of conduciveness when the
computer collaborated, but effects were only significant for Event 3 [F(1,43)=8.18,
p<.01, eta2=.16]. Further simple effects analyses of time within each social identity
salience condition revealed that these differences were clearly due to a significant
decrease in the ratings of participants in the low social identity salience condition
between Event 2 and Event 3 [F(1,19)=6.73, p<.05, eta2=.26]. In sum, only the
hypothesis (H4) that participants in the high social identity salience condition would
give higher ratings of conduciveness to collaboration than participants in the low
social identity salience condition was supported.
TIME
E3: collabE2: collabE1: compet
Mea
n co
nduc
iven
ess
9
8
7
6
5
4
3
2
1
social id condition
low
high
9 Because of violation of sphericity the Huynh-Feldt Epsilon adjustment of df was used. 10 Because of violation of sphericity the Huynh-Feldt Epsilon adjustment of df was used.
Fig. 3.5a. Mean conduciveness
as a function of time and social identity
in the mostly collaborative condition.

92
TIME
E3:competE2:competE1:collab
Mea
n co
nduc
iven
ess
9
8
7
6
5
4
3
2
1
social id condition
high
low
2) Appraisal of causal attribution to personality. In contrast to general
predictions, there was no significant main effect for overall strategy. Counter to
hypotheses (H5 & H6), there was no main effect for social identity salience condition.
There was a significant main effect for time [F(2,87)=8.06, p<.001, eta2=.08] and a
significant interaction between time and social identity [F(2,87)=3.94, p<.05,
eta2=.04].
TIME
E3E2E1
Mea
n at
tribu
tion
to p
erso
nalit
y
9
8
7
6
5
4
3
2
1
social id condition
high
low
This interaction (see Fig. 3.6) was further explored via repeated contrast analyses12 for
time within each social identity salience condition, and via simple effects on social
identity salience condition within each on the 3 Events in time. First, the analyses
revealed that (i.e., irrespective of other’s strategy) participants in the high social
identity salience condition gave higher ratings of causal attribution to personality in
Event 1 than in Event 2 [F(1,89)=9.17, p<.01, eta2=.09] and that no significant
11 Comparing whether social identity salience condition effects changed between E1-E2 and E2-E3. 12 Comparing whether social identity salience condition effects changed between E1-E2 and E2-E3.
Fig. 3.5b. Mean conduciveness
as a function of time and social identity
in the mostly competitive condition.
Fig. 3.6. Mean attribution to personality
as a function of time and social
identity.

93
changes occurred between Event 2 and Event 3. For participants in the low social
identity salience condition, there were no differences in terms of causal attribution to
personality across Events. Second, visual examination of this interaction (see Fig.
3.6.) suggested that participants in the high social identity salience condition tended to
give higher ratings of causal attribution to personality for Event 1, but simple effects
analyses showed that these differences were not significant [F(1,89)=2.57, p=.11,
eta2=.03]. Taken together these results do not support hypotheses concerning causal
attribution to personality about other’s choice to compete and collaborate (H1, H2),
and concerning the impact of social identity salience on this appraisal (H5, H6).
Appraisal of causal attribution to social group membership. There were
significant main effects for overall strategy [F(1,87)=8.73, p<.01, eta2=.09] and time
[F(1.82, 158.3213)=3.72, p<.05, eta2=.04]. There was also a significant interaction
between time and overall strategy [F(1.82, 158.3214)=7.82, p<.001, eta2=.08]. As
illustrated in Figure 3.7. there were no significant differences in causal attributions to
social group membership in Event 1. However, in Events 2 and 3, attributions to
group membership were rated higher when the computer competed than when the
computer collaborated. None of the effects with social identity salience condition
were significant. These results do not support the hypothesis (H7) made about the
impact of social identity salience on this appraisal.
TIME
E3E2E1
Mea
n at
tribu
tion
to g
roup
mem
bers
hip
9
8
7
6
5
4
3
2
1
Overall strategy
compet/collab/collab
collab/compet/comp
13 Because of violation of sphericity the Huynh-Feldt Epsilon adjustment of df was used. 14 Because of violation of sphericity the Huynh-Feldt Epsilon adjustment of df was used.
Fig. 3.7. Mean attribution to group
membership as a function of overall
strategy.

94
3) Appraisal of incompatibility with norms of fairness and justice as
considered by self . There was a significant main effect for time [F(2,87)=3.22, p<.05,
eta2=.04] and a significant interaction between time and overall strategy
[F(2,87)=26.92, p<.001, eta2=.24]. As illustrated in Figure 3.8. and in line with
predictions, across the 3 events competition tended to be rated as more unfair and
unjust (as considered by self) than collaboration. No significant effects were found for
social identity salience condition. Thus, the hypothesis for the impact of social
identity salience on appraisals of unfairness and injustice as considered by self
(included in H8 and H9) were not supported by these results.
TIME
E3E2E1
Mea
n un
fairn
ess
and
unju
stic
e (b
y se
lf)
9
8
7
6
5
4
3
2
1
Overall strategy
compet/collab/collab
collab/compet/compet
Appraisal of incompatibility with norms of fairness and justice as considered
by other members of the ingroup. There was a significant main effect for time
[F(2,87)=3.13, p<.05, eta2=.03] and a significant interaction between time and overall
strategy [F(2,87)=31.35, p<.001, eta2=.26]. As illustrated in Figure 3.9. and as
expected (H1 and H2), irrespective of social identity salience condition and across the
3 events competition was appraised as more unfair and unjust (as considered by other
members of the ingroup) than collaboration. Thought, overall, participants in the high
social identity salience condition tended to give higher ratings to this appraisal than
participants in the low social identity salience condition (Mhigh=4.54, SD=.25;
Mlow=3.90, SD=.27) these differences were not significant [F(1,87)=3.00, p=.09,
eta2=.03]. Thus, the hypotheses for the impact of social identity salience on appraisals
of unfairness and injustice as considered by the ingroup (included in H8 and H9) were
not supported by these results.
Fig. 3.8. Mean unfairness and injustice as
considered by self as a function of time and
overall strategy

95
TIME
E3E2E1
Mea
n un
fairn
ess
and
unju
stic
e (b
y in
grou
p)
9
8
7
6
5
4
3
2
1
Overall strategy
compet/collab/collab
collab/compet/compet
3.3.4.2. Analyses of Emotions. As in study 1, in the rating scale used to
measure self-reports of emotions, participants had the opportunity to use a value of
“1” to indicate that an emotion was “not at all pertinent”. Thus, the issue of inclusion
or exclusion of cases reporting not feeling an emotion was considered. Before
conducting any analyses of emotions it was important to determine whether the
reported absence (i.e., values of 1= emotion was not at all pertinent) and presence
(i.e., values above 1=felt the emotion to varying degrees) of the 7 emotions measured
differed as a function of social identity salience condition. Thus, it was decided to
conduct a series of Mann-Whitney tests by ranks on the dummy coded emotion
variables (so that values of 1= “not at all pertinent” were recoded into 0= “not felt” ,
and values above 1 were recoded into 1= “felt to varying intensities”). Table 3.5.
provides the results of the Mann-Whitney test including Z values and significance. In
addition, for each social identity salience condition, the percentage of those
participants reporting not to have felt the emotion at all (scale value of 1=“not at all
pertinent”), as well as complete cell mean and the standard deviations for participants
reporting to have felt the emotion to varying degrees (scale values ranging between
2=“weak”, 4 and 5=“moderately strong” and up to 9=“very strong”) are shown.
Fig.3.9. Mean unfairness and injustice as
considered by ingroup as a function of time
and overall strategy

96
Table 3.5. Presence and intensity of emotions in response to collaboration and competition by social identity salience condition
High Social ID Low Social ID Mann-Whitney Test a
not felt emotion felt not felt emotion felt % M (SD) % M (SD) Z
Computer Collaborates Surprise Relief Satisfaction Happiness Frustration Irritation Anger
13.00 4.30
0 0
56.50 56.50 82.60
4.70 5.63 6.74 6.61 4.20 3.70 2.75
1.72 1.70 1.63 1.45 1.40 1.45 0.95
0 12.50 12.50 12.50 50.00 50.00 58.30
4.96 5.67 5.90 5.95 3.75 5.00 4.10
1.76 1.98 1.92 2.08 1.42 2.17 2.23
-1.60 -.26 -.91 -.06 -.88 -1.11 -2.00*
Computer Competes
EVEN
T 1
Surprise Relief Satisfaction Happiness Frustration Irritation Anger
8.30 54.20 37.50 50.00 20.80 20.80 33.30
4.04 4.18 4.00 4.42 4.95 6.00 4.87
1.78 1.89 1.77 1.89 2.33 1.94 2.03
5.00 45.00 45.00 40.00 5.00
0 10.00
4.53 3.00 3.45 3.33 5.10 5.50 4.50
1.84 1.00 1.81 1.37 1.76 1.67 1.79
Computer Collaborates Surprise Relief Satisfaction Happiness Frustration Irritation Anger
4.20 8.30 4.20 4.20 75.00 70.80 79.20
4.83 7.18 7.13 7.22 3.67 3.14 4.20
1.92 1.59 2.05 2.11 2.25 1.67 2.04
0 5.00
0 0
60.00 60.00 80.00
5.15 6.68 7.00 6.90 3.12 3.37 2.50
1.78 1.53 2.05 1.80 1.55 2.07 1.00
-.52 -1.61 -.95 -.95 -.60 -.85 -.10
Computer Competes
EVEN
T 2
Surprise Relief Satisfaction Happiness Frustration Irritation Anger
4.30 30.40 26.10 26.10 8.70 8.70 21.7
4.36 2.69 3.41 3.29 4.90 5.28 4.44
1.73 1.13 1.77 1.61 1.79 1.68 1.65
4.20 58.30 41.70 41.70 16.70 8.30 25.00
5.17 3.80 4.00 3.21 4.70 5.68 5.28
1.72 1.99 1.75 1.67 2.00 2.00 2.22
Computer Collaborates Surprise Relief Satisfaction Happiness Frustration Irritation Anger
8.30 8.30 4.20 4.20 87.50 83.30 79.20
5.68 7.04 7.48 7.09 3.33 4.00 3.60
2.23 1.99 2.00 2.29 2.31 2.45 1.67
0 10.00 5.00 5.00 65.00 60.00 65.00
5.35 6.28 6.79 6.79 2.85 4.00 3.14
2.08 1.96 2.16 1.96 1.57 2.67 1.86
-.30 -1.36 -1.24 -.67
-2.20* -2.02* -1.97*
Computer Competes
EVEN
T 3
Surprise Relief Satisfaction Happiness Frustration Irritation Anger
8.70 34.80 21.70 34.80 30.40 26.10 43.50
4.81 3.93 4.05 4.27 5.31 5.47 5.31
1.83 2.29 2.29 2.01 1.89 1.87 1.31
12.50 54.20 37.50 41.70 12.50 12.50 20.08
4.43 3.45 3.47 2.93 4.90 5.76 5.05
1.60 1.86 1.84 1.73 1.92 1.97 2.07
Note. * p<.05, ** p<.001; % not felt referred to the percentage of participants reporting a scale value of “1=not at all pertinent”, emotion felt referred to emotions felt to varying intensities. Numbers in bold indicate the 3 highest percentage of emotions not felt per cell. a=Mann-Whitney Tests by Ranks were conducted for dummy coded emotion variables so that 0=“not felt” and 1=“felt”.

97
First, results of the Mann-Whitney tests revealed significant differences between
social identity salience conditions in terms of emotions reported as “Not felt” and
those reported as “Felt”, but only for the negative emotions and only in some of the
events. Contrary to expectations, irrespective of computer’s strategy there were
significantly more participants in the low social identity salience condition that
reported feeling anger (Event 1), frustration and irritation (Events 1 and 3) to varying
intensities. The differences observed between social identity salience conditions in
Event 3 were partly due to the fact that a high percentage of participants in the high
social identity salience condition reported not feeling frustration, irritation and anger
when the computer collaborated, whereas participants in the low social identity
salience condition reported feeling these emotions to varying intensities.
Second, in support for hypotheses (H1 and H2) examination of percentages of
emotions “Not felt”15 showed that when the computer collaborated participants
reported feeling positive emotions (i.e., relief, satisfaction and happiness) to varying
degrees more than negative emotions (i.e., frustration, irritation and anger). And,
when the computer competed the reverse occurred. “Not Felt” rates for surprise were
similarly low in both social identity salience conditions. Furthermore, examination of
the actual number of participants reporting intensities above the value of 4 (i.e.,
anchored by the label of «moderate intensity») in each Event (see Figures 3.10a.,
3.10b. and 3.10c.) reveal that a greater number of participants reported positive
emotions of stronger intensity when responding to collaboration, and negative
emotions of stronger intensity when responding to competition.
In light of these results it was decided to conduct analyses including all cases and to
compare the results with the results of analyses conducted after excluding participants
not feeling the emotion.
15 Irrespective of social identity salience condition and across the 3 events
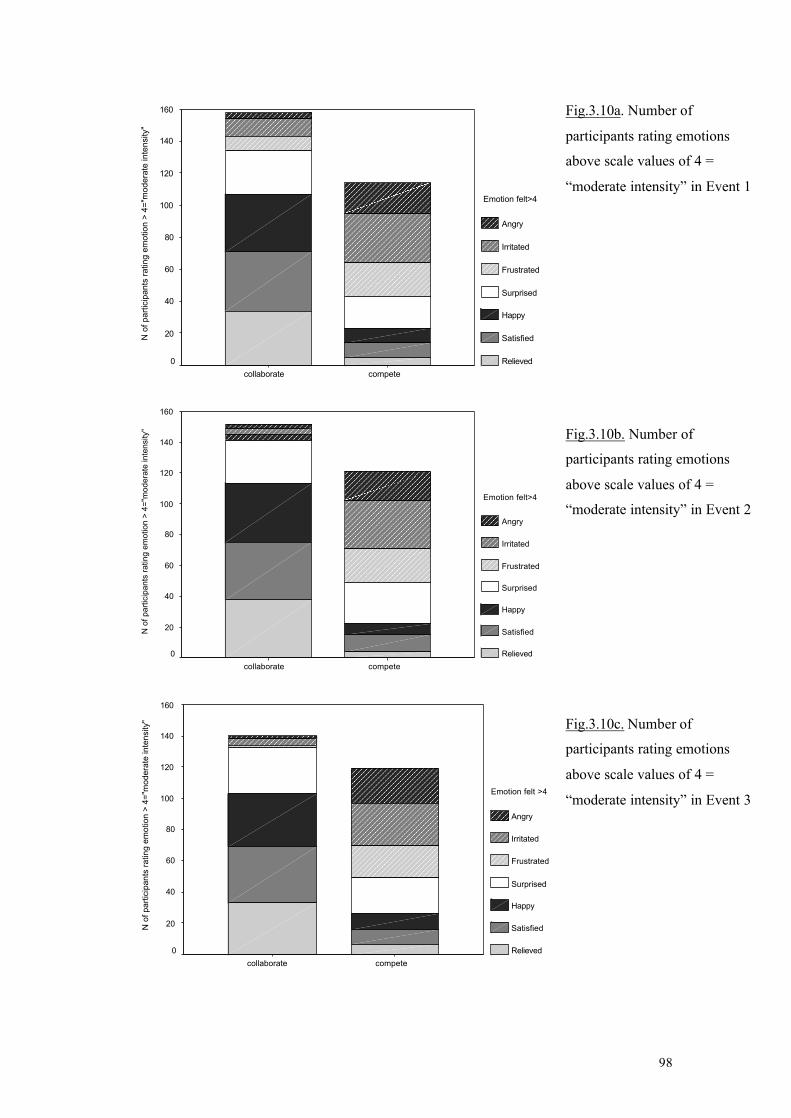
98
competecollaborate
N o
f par
ticip
ants
ratin
g em
otio
n >
4="m
oder
ate
inte
nsity
"
160
140
120
100
80
60
40
20
0
Emotion felt>4
Angry
Irritated
Frustrated
Surprised
Happy
Satisfied
Relieved
competecollaborate
N o
f par
ticip
ants
ratin
g em
otio
n >
4="m
oder
ate
inte
nsity
"
160
140
120
100
80
60
40
20
0
Emotion felt>4
Angry
Irritated
Frustrated
Surprised
Happy
Satisfied
Relieved
competecollaborate
N o
f par
ticip
ants
ratin
g em
otio
n >
4="m
oder
ate
inte
nsity
"
160
140
120
100
80
60
40
20
0
Emotion felt >4
Angry
Irritated
Frustrated
Surprised
Happy
Satisfied
Relieved
Fig.3.10a. Number of
participants rating emotions
above scale values of 4 =
“moderate intensity” in Event 1
Fig.3.10b. Number of
participants rating emotions
above scale values of 4 =
“moderate intensity” in Event 2
Fig.3.10c. Number of
participants rating emotions
above scale values of 4 =
“moderate intensity” in Event 3

99
To simplify the analyses of emotion ratings, it was decided to reduce the number of
emotion variables. Because the variables included 3 positive emotions (relief,
satisfaction and happiness), 3 negative emotions(frustration, irritation and anger), and
surprise it was decided to conduct confirmatory principal components analyses16.
Thus, for all analyses the three factor solution was preferred. The cut-off criterion to
determine the adequacy of the factors included having eigenvalues higher than 1 and
the visual inspection of the scree plot. Results, including loadings, and coefficient
alphas computed for emotions loading together, are shown on Table 3.6.
Table 3.6. Results of the Principal-Components Analysis on the 7 emotions
Factor loadings
Emotion Event 1 Event 2 Event3
Factor 1: positive emotions
Relief Satisfaction
Happiness
.90 .87 .86
(α=.94)
.92 .91 .86
(α=.96)
.86 .85 .82
(α=.96)
Factor 2: negative emotions
Frustration Irritation
Anger
.86 .80 .77
(α=.87)
.58 .91 .67
(α=.90)
.86 .80 .79
(α=.90)
Factor 3: surprise
Surprise
.99
.99
.97 The first factor included the 3 positive emotions and the second to the 3 negative
emotions. Surprise always loaded separately. Alphas calculated among the 3 positive
and among the 3 negative emotions were always extremely high. Based on these
results it was decided to combine relief, satisfaction and happiness (by computing the
mean for these 3 emotions within each Event) to a new variable called “positive
emotions”. Similarly, it was decided to combine frustration, irritation, and anger
(again by computing the mean for these 3 emotions within each Event) to a new
variable called “negative emotions”. Surprise was always analyzed separately.
16 with varimax rotation to simply factors by maximizing the variance of the loadings within factors.

100
When all cases were included in the analyses, three 2 X 2 X3 (mixed design) repeated
measures ANOVAs were conducted: One on “positive emotions”, one on “negative
emotions” and one on “surprise”. In these analyses social identity salience condition
(high or low social identity salience) and overall strategy condition (mostly
competition: E1 collab, E2 compet, E3 compet, or mostly collaboration: E1 compet,
E2 collab, E3 collab) were the between subjects factors, and time (E1, E2, and E3)
was the within subjects factor. When participants not feeling the emotion were
excluded from the analyses, the number of cases deleted per cell on “positive
emotions” and “negative emotions” variables was sometimes too high, consequently
leading to an unbalanced design. Thus, it was not possible to simply re-conduct the
repeated measures ANOVAs on this sub-sample. Therefore, it was decided to conduct
instead separate ANOVAs within each of the 3 Events in time. It should be noted that
in these analyses, social identity salience condition (high or low social identity
salience) and type of strategy (whether the computer collaborated or competed for that
specific event) were the between subjects factors. Cell means and standard deviations
are presented in Appendix B.5.2., B.5.3., and B.5.4.
The presentation of the results will be organized as follows. First, analyses with all
cases will be reported: 1) positive emotions, 2) negative emotions, and 3) surprise.
Second, analyses after participants not feeling the emotion were excluded will be
reported: 1) positive emotions, 2) negative emotions, and 3) surprise.
Analyses with all cases
1) Positive emotions. There was a significant main effect for overall strategy
[F(1,87)=36.18, p<.001, eta2=.29], and a significant interaction between time and
overall strategy [F(1.7617,153.10)=134.02, p<.001, eta2=.60] (see Fig.3.11). Taken
together these result confirm (see hypotheses H1 and H2) that, irrespective of overall
strategy and across events in time the negotiation was successful in inducing stronger
positive emotions for collaboration than for competition.
17 Because of violation of sphericity the Huynh-Feldt Epsilon adjustment of df was used.

101
TIME
E3E2E1
Mea
n in
tens
ity "p
ositi
ve e
mot
ions
"
9
8
7
6
5
4
3
2
1
Overall strategy
compet/collab/collab
collab/compet/compet
Differences emerged between social identity salience conditions in the expected
direction (H10) as suggested by a marginally significant main effect for social identity
[F(1,87)=3.68, p=.06, eta2=.04]. As illustrated in Figure 3.12., irrespective of overall
strategy, participants in the high social identity salience condition tended to give
higher intensity ratings on positive emotions (M=4.74, SD=1.57) than participants in
the low social identity salience condition (M=4.12, SD=1.47).
social id condition
lowhigh
Mea
n em
otio
n in
tens
ity
9.00
8.00
7.00
6.00
5.00
4.00
3.00
2.00
1.00
negative emotions
positive emotions
4.12
4.74
3.402.92
2) Negative emotions. There was a significant main effect for overall strategy
[F(1,87)=15.25, p<.001, eta2=.15], and a significant interaction between time and
overall strategy [F(1.6418,142.53)=86.11, p<.001, eta2=.50] (see Fig. 3.13.). Again
these result confirm (see hypotheses H1 and H2) that, irrespective of overall strategy
18 Because of violation of sphericity the Huynh-Feldt Epsilon adjustment of df was used.
Fig. 3.11. Mean intensity of positive
emotion variable as a function of time and
overall strategy.
Fig. 3.12. Mean intensity of positive and
negative emotion variables as a function of
social identity salience condition.

102
and across events in time the negotiation was successful in inducing stronger negative
emotions for competition than for collaboration. In contrast to the hypothesis (H10),
no significant differences emerged between social identity salience.
TIME
E3E2E1
Mea
n in
tens
ity fo
r neg
ativ
e em
otio
ns
9
8
7
6
5
4
3
2
1
Overall strategy
compet/collab/collab
collab/compet/compet
3) Surprise. None of the main effects were significant. In fact, the only
significant effect was an interaction between time and overall strategy [F(2, 87)=
4.61, p<.05, eta2=.05](see Fig.3.14.). No significant differences were found for social
identity salience condition.
TIME
E3E2E1
Mea
n in
tens
ity fo
r sur
pris
e
9
8
7
6
5
4
3
2
1
Overall strategy
compet/collab/collab
collab/compet/compet
Fig. 3.13. Mean intensity of negative
emotion variable as a function of
time and overall strategy
Fig. 3.14. Mean intensity of surprise
as a function of time and overall strategy
condition
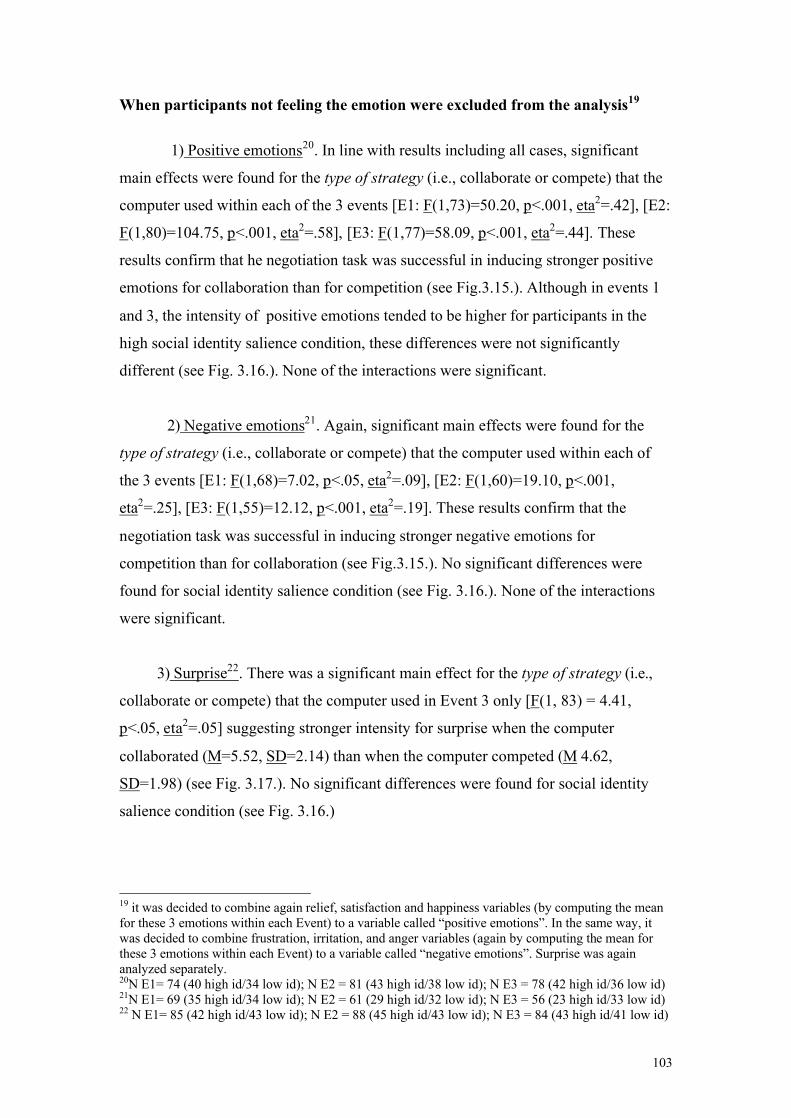
103
When participants not feeling the emotion were excluded from the analysis19
1) Positive emotions20. In line with results including all cases, significant
main effects were found for the type of strategy (i.e., collaborate or compete) that the
computer used within each of the 3 events [E1: F(1,73)=50.20, p<.001, eta2=.42], [E2:
F(1,80)=104.75, p<.001, eta2=.58], [E3: F(1,77)=58.09, p<.001, eta2=.44]. These
results confirm that he negotiation task was successful in inducing stronger positive
emotions for collaboration than for competition (see Fig.3.15.). Although in events 1
and 3, the intensity of positive emotions tended to be higher for participants in the
high social identity salience condition, these differences were not significantly
different (see Fig. 3.16.). None of the interactions were significant.
2) Negative emotions21. Again, significant main effects were found for the
type of strategy (i.e., collaborate or compete) that the computer used within each of
the 3 events [E1: F(1,68)=7.02, p<.05, eta2=.09], [E2: F(1,60)=19.10, p<.001,
eta2=.25], [E3: F(1,55)=12.12, p<.001, eta2=.19]. These results confirm that the
negotiation task was successful in inducing stronger negative emotions for
competition than for collaboration (see Fig.3.15.). No significant differences were
found for social identity salience condition (see Fig. 3.16.). None of the interactions
were significant.
3) Surprise22. There was a significant main effect for the type of strategy (i.e.,
collaborate or compete) that the computer used in Event 3 only [F(1, 83) = 4.41,
p<.05, eta2=.05] suggesting stronger intensity for surprise when the computer
collaborated (M=5.52, SD=2.14) than when the computer competed (M 4.62,
SD=1.98) (see Fig. 3.17.). No significant differences were found for social identity
salience condition (see Fig. 3.16.)
19 it was decided to combine again relief, satisfaction and happiness variables (by computing the mean for these 3 emotions within each Event) to a variable called “positive emotions”. In the same way, it was decided to combine frustration, irritation, and anger variables (again by computing the mean for these 3 emotions within each Event) to a variable called “negative emotions”. Surprise was again analyzed separately. 20N E1= 74 (40 high id/34 low id); N E2 = 81 (43 high id/38 low id); N E3 = 78 (42 high id/36 low id) 21N E1= 69 (35 high id/34 low id); N E2 = 61 (29 high id/32 low id); N E3 = 56 (23 high id/33 low id) 22 N E1= 85 (42 high id/43 low id); N E2 = 88 (45 high id/43 low id); N E3 = 84 (43 high id/41 low id)

104
6.09
6.99 6.9
3.91
3.023.28
3.533.21
3.53
4.99 5.02 5.17
2
3
4
5
6
7
8
9
positive E1 positive E2 positive E3 negative E1 negative E2 negative E3
collaborate compete
5.25 5.2
5.62
4.52 4.39
4.814.81
5.255.03
4.624.47 4.51
2
3
4
5
6
7
8
9
positive E1 positive E2 positive E3 negative E1 negative E2 negative E3
high low
Fig. 3.15. Mean intensity for positive and negative emotions (after excluding participants not
feeling the emotion) as a function of event strategy
Fig. 3.16. Mean intensity for positive and negative emotions (after excluding participants not feeling the
emotion) as a function of social identity salience condition

105
4.354.6
5.25
4.76
5.164.87
2
3
4
5
6
7
8
9
Surprise E1 Surprise E2 Surprise E3
high low
3.3.4.3. Mediation analyses. Like in the first study, it was examined whether
the effects of social identity salience condition on emotions were mediated by
appraisals. Again, we followed the mediation procedure described by Baron and
Kenny (1986). The selection of appraisal and emotion variables to be included in the
analyses was based on the same criteria established in study 1: To focus on appraisal
and emotion variables for which there was a significant social identity salience
condition effect, and to only test relationships between appraisals and emotions that
made theoretical sense according to appraisal theory of emotion.
In this experiment, results indicated that the effect of social identity salience condition
on appraisal of conduciveness was only significant in Event 3 and only in the mostly
collaborative condition. The effect of social identity salience condition on appraisal of
causal attribution to personality, irrespective of overall strategy, was significant only
in Event 1. In addition, social identity salience condition significantly affected the
intensity of positive emotions, irrespective of overall strategy and across the 3 events.
Theoretically then, it would make sense to examine whether in Event 2 and in the
mostly collaborative condition, conduciveness mediated the influence of social
identity salience on positive emotions variable. However, examination of bivariate
correlations between these variables revealed that even though social identity salience
Fig. 3.17. Mean intensity for surprise (after excluding participants not feeling the emotion) as a
function of social identity salience condition
106
condition23 was positively and significantly correlated to appraisal of conduciveness
(r=.40, p<.01), and appraisal of conduciveness was positively and significantly
correlated to the positive emotions variable (r=.81, p<.001), social identity salience
condition was not significantly related to the positive emotions variable (r=.13,
p=.40). Consequently, no further mediation analyses were conducted.
In light of the rejection of the mediation hypothesis however, it was still considered
important to explore to what extent social identity salience condition contributed to
the prediction of the reported positive emotions over and above all the appraisals
measured. Thus, it was decided to conduct hierarchical regression analyses with the 9
appraisal dimensions entered together in step 1, and social identity salience condition
added to the equation in step 2. Social identity salience condition significantly
improved prediction of positive emotions in Event 1. Results of the full model,
including all predictors are shown in Table 3.7.
The first rows show result of the hierarchical regression of the 9 appraisal items on
the positive emotions variable for the full sample (raw values from 1 to 9). The
second rows show the results of the hierarchical regressions run for participants who
felt the positive emotions(intensity values from 2 to 9). Examination of coefficients
revealed that results in both samples were similar. In both samples, results show
significant R2 for the complete equation in step 1 with the 9 appraisal dimensions, and
in step 2 when social identity salience condition was entered. More importantly, when
social identity salience condition was added to the equation, there was a significant
increase in R2 and significant beta weights were observed. Thus, adding social identity
salience condition significantly improved prediction of reported positive emotions in
Event 1. Pleasantness and conduciveness were by far the most important predictors
(and in the expected directions) for positive emotions. Betas for social identity
salience condition were positive confirming that participants in the high social
identity salience condition reported stronger positive emotions.
23 Dummy coded so that 0= low social identity salience condition, and 1=high social identity salience condition.

107
Table 3.7. Summary of hierarchical regression analyses for appraisals (step1) and social identity salience condition (step2) predicting positive emotions in Event 1 β24 R2 ∆ R2 STEP 1 Pleasant
Raw Intensity
.33**
.44**
.60**
.61**
Conducive Raw
Intensity
.44** .36**
Important Raw
Intensity
.00 -.12
Attrib. Personality Raw
Intensity
-.10 -.11
Attrib. Membership Raw
Intensity
.05 .05
Intentional Raw
Intensity
.02 -.00
Controllable Raw
Intensity
-.07 -.06
Unfair/Unjust (self) Raw
Intensity
-.16 -.15
Unfair/Unjust (ingroup) Raw
Intensity
.06 .06
STEP 2 Social Identity
Raw Intensity
.17*
.19*
.63**
.64** .03* .03*
Note. * p<.05, ** p<.001. Raw= betas for regression of appraisal dimensions on positive emotions (all cases, N=91) from 1to 9; Intensity=betas for regression of appraisal dimensions on positive emotions (after excluding participants not feeling the emotion, N=74).
24 Standardized Betas reported are those of step 2.

108
3.3.4.4 Additional analyses to explore the potential bias of number of points
gained. Immediately before completing the computerized appraisal and emotion
questionnaires, participants had received the information about the other’s choice of
strategy (i.e., to collaborate or to compete) together with information about the
number of points made by self and by the other. According to the PDG scoring
matrix, the number of points gained by participants and by the other totally are
dependent on the combination of the computer’s manipulated strategy and
participants’ own choice of strategy. Therefore, it was considered essential to explore
the potential bias on participant’s appraisal and emotion responses caused by the
information about the number of points gained by them and by the “other”25.
The number of points gained by participants (and by the “other”) could not be
included as “covariate” variables in the analyses because they did not meet the
requirement of being independent from one of the treatment variables (i.e., the
computer’s strategy). This interdependence makes interpretation of adjusted means
difficult (Tabachnick and Fidell, 1989). In fact, when designing the experiment, it had
been attempted to control for the potential bias of number of points gained by
systematically informing participant’s of a) other’s choice of strategy and b) the exact
number of points gained by themselves and by the “other”. In this way, all
participants received 1) the same type of information and 2) the information about
number of points gained was accurate. The reasoning being that if participants had
only been informed of other’s choice of strategy without giving them information
about the number of points, it could not be excluded that some participants may still
calculate (or miscalculate) the number of points. Since the computer’s strategy was
manipulated, the only variability expected in number of points gained came from
participant’s responses. In line with the PDG, the scoring matrix used in this
experiment had 4 possible outcomes for participants that have different relative values
(as described in the method section DC>CC>DD>CD). Table 3.8. summarizes the
four potential outcomes as a function of computer’s manipulated strategy and
participants’ actual choice of strategy, and describes the percentage of participants
observed in each outcome situation across the 3 events.
25 Points were calculated based on the scoring matrix as described in the method section DC=3,0 > CC=2,2 > DD=1,1 > CD=0,3.

109
Table 3.8. Percentage (and number of cases) of participants for each of the 4 relative value outcomes situation across the 3 events Participants’ Choice of Strategy Collaboration (C) Competition (D) Computer’s Strategy High Low High Low
(CD) “I win 0 points and the other 3”
(DD) “We both win 1 point”
Competition (D) Event1 Event 2 Event 3
29.2% (7) 26.1% (6) 8.7% (2)
45% (9)
33.3% (8) 4.2% (1)
70.8% (17) 73.9% (17) 91.3% (21)
55% (11)
66.7% (16) 95.8% (23)
(CC) “We both win 2 points”
(DC) “I win 3 points and the other 0”
Collaboration (C) Event1 Event 2 Event 3
34.8% (8) 16.7% (4) 4.2% (1)
33.3% (8) 30% (6) 10% (2)
65.2% (15) 83.3% (20) 95.8% (23)
66.7% (16) 70% (14) 90% (18)
Visual inspection of the percentage of participants’ responses clearly shows that
irrespective of social identity salience condition and of computer’s strategy and as
would be expected in the PDG, the dominant strategy was competition. In both social
identity salience conditions, the percentage of participants using competition
systematically increased from Event 1 to Event 3. Because competition was the
dominant strategy, the majority of participants found themselves in 2 types of
outcome situations: winning 3 points and the computer 0 points when the computer
collaborated (DC), and winning 1 point and the computer 1 point when the computer
competed (DD).
First, it was decided to run a repeated measures ANOVA on the number of points
gained by participant for each of the 3 decision events with social identity salience
condition and overall strategy condition as between subjects factors and time as the
within subjects factor. There were no significant effects for social identity salience
condition. Since the dominant strategy was competition, it was not surprising to find a
significant main effect for overall strategy [F(1,87)=190.82, p<.001, eta2=.69]. This
results indicated that number of points gained was significantly higher for participants
having played against a highly collaborative computer (compete, collab, collab)
(M=2.11, SD=0.35) than against a highly competitive computer (collab, compete,

110
compete) (M=1.43, SD=0.34). There was a significant interaction between time and
overall strategy [F(1.78,155.2626)=741.04, p<.001, eta2=.89] (see Fig. 3.18.).
Time
E3E2E1
Mea
n nu
mbe
r of p
oint
s ga
ined
by
parti
cipa
nt
3
2
1
0
Overall strategy
compet/collab/collab
collab/compet/compet
This interaction was further explored via repeated contrast analyses27 on time, which
revealed that the number of points gained changed in the expected directions between
Event 1 and Event 2 [F(1,89)=15.39, p<.001, eta2=.15]. In fact, in the mostly
collaborative condition the computer switches from competition in Event 1 to
collaboration in Event 2, and as expected number of points gained increased. In the
mostly competitive condition the computer switches from collaboration in Event 1 to
competition in Event 2, and as expected the number of points decreased. No
significant changes occurred on the number of point gained between Event 2 and
Event 3. In sum, there was little variability in participants’ choice of dominant
strategy (i.e., to compete) and thus on the number of points gained by them as a
function of social identity salience condition. Notwithstanding, even if the majority of
participants competed irrespective of their social identity salience condition, and thus
had similar number of points gained, the interesting question remains whether their
appraisal and emotion responses were different?
Unfortunately, it was statistically impossible to compare appraisal and emotion
responses of “competitors” with those of “collaborators”: across the 3 events only 1
person had systematically chosen collaboration, while 40 had systematically chosen 26 Because of violation of sphericity the Huynh-Feldt Epsilon adjustment of df was used. 27 Comparing whether social identity salience condition effects changed between E1-E2 and E2-E3.
Fig. 3.18. Mean number of points gained by participants across events.

111
competition. However, the 40 competitors were practically equally distributed
between social identity and overall strategy conditions28. Therefore by re-conducting
the analyses of the sub-sample of 40 “competitors” it became possible to test the
experimental hypotheses while “holding constant” participants own choice of strategy
and by consequence the number of points gained by self and by the “other”. Repeated
measures ANOVAS were conducted for the sub-sample of 40 competitors to test
whether any differences emerged in their appraisals and emotion responses as a
function of social identity and of overall strategy across the 3 Events in time. It was
postulated that, if number of points gained by self and other does not influence
participants’ appraisals and emotions, there should no differences between the results
of the 40 competitors and those of the full sample. The results of these analyses are
reported below and compared with those of the whole sample.
Analyses of the appraisals of “competitors”
1) Appraisal of conduciveness. The pattern of results was similar to those of
the full sample. First, there was still a significant main effect for overall strategy
[F(1,36)=16.10, p<.001, eta2=.31] and a significant interaction between time and
overall strategy [F(1.45, 52.1729)=40.26, p<.001, eta2=.53] showing again support for
hypotheses (H1 and H2) that (irrespective of overall strategy and across events in
time) the negotiation task was successful in inducing appraisal of low conduciveness
for competition and high conduciveness for collaboration. Again, in the mostly
collaborative condition only, participants in the high social identity salience condition
tended to give higher ratings of conduciveness for collaboration than participants in
the low social identity salience condition. However, these differences were not
significant. Visual examination of means reveals that the main difference between
results for the full sample (Fig. 3.5a) with that of results for competitors (Fig.3.19.),
may have been due to the fact that for competitors the ratings of participants in the
low social identity salience condition did not decrease in time (i.e., between Event 2
and Event 3).
28 high identity/mostly competes N=8; high identity/mostly collaborates N=13; low identity/mostly competes=8; low identity mostly collaborates=11. 29 Because of violation of sphericity the Huynh-Feldt Epsilon adjustment of df was used.

112
TIME
E3: collabE2: collabE1: compet
Mea
n co
nduc
iven
ess
9
8
7
6
5
4
3
2
1
social id condition
high
low
2) Appraisal of causal attribution to personality. Results were similar to those
of the full sample. First, there were still no significant main effects for overall
strategy or for social identity salience condition. Second, there was still a significant
main effect for time [F(2,72)=5.76, p<.01, eta2=.14] and a significant interaction
between time and social identity [F(2,72)=3.90, p<.05, eta2=.09] (see Fig. 3.20.). Just
like for the full sample (Fig.3.6), for competitors (Fig.3.20.) exploration of the
interaction via repeated contrast analyses30 on time showed that (i.e., irrespective of
whether other’s strategy was to collaborate or to compete) differences between social
identity salience conditions changed significantly only between Event 1 and in Event
2 [F(1,36)=6.86, p<.05, eta2=.26]. Again, these results do not support the hypotheses
(H1, H2, H5 and H6).
TIME
E3E2E1
Mea
n at
tribu
tion
to p
erso
nalit
y
9
8
7
6
5
4
3
2
1
social id condition
high
low
Fig. 3.19. Mean conduciveness
as a function of time and social identity
in the mostly collaborative condition
(N=21 competitors)
Fig.3.20. Mean attribution to personality
as a function of time and social identity
(N=40 competitors)

113
Appraisal of causal attribution to social group membership. In contrast to
results for the full sample, the main effect for overall strategy was not significant
[F(1,36)=2.70, p=.11, eta2=.07] and none of the effects for time were significant.
More interestingly, the interaction between social identity and overall strategy was
significant for the sub-sample of competitors [F(1,36)=4.02, p<.05, eta2=.10] (see
Figs. 3.21a., and 3.21b.).
TIME
E3:collabE2:collabE1:compet
Mea
n at
tribu
tion
to g
roup
mem
bers
hip
9
8
7
6
5
4
3
2
1
social id condition
high
low
In line with the hypothesis (H7), simple effects on social identity split by overall
strategy indicated that in the mostly collaborative condition (Fig.3.21a.): Participants
in the high social identity salience condition tended to make higher causal attributions
to other’s group membership (i.e., of collaboration and competition) than participants
in the low social identity salience condition. In this sample, this effect approached
significance in Event 1 [F(1,20)=3.67, p=.07, eta2=.16] and was significant in Event 2
[F(1,20)=4.22, p<.05, eta2=.18], but was not significant in Event 3. None of the social
identity simple effects were significant in the mostly competitive strategy.
30 Comparing whether social identity salience condition effects changed between E1-E2 and E2-E3.
Fig. 3.21a. Mean attribution to group
membership as a function of social identity
in the mostly collaborative condition
(N=21 competitors)
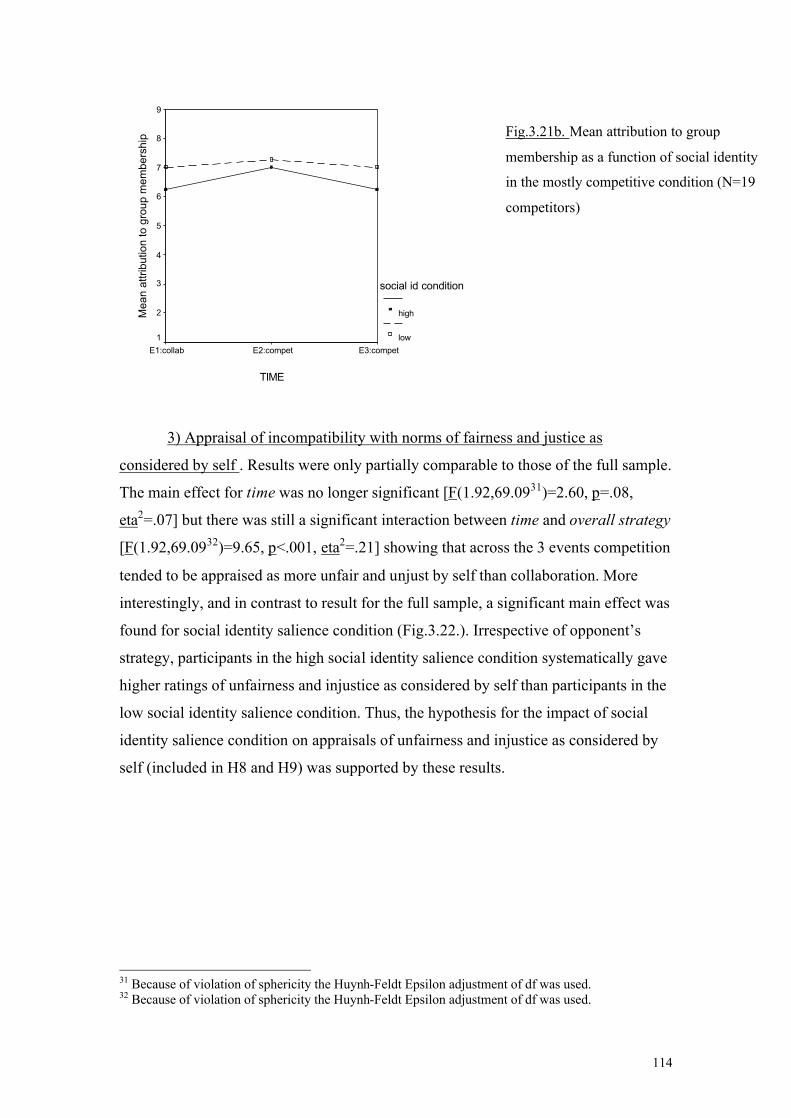
114
TIME
E3:competE2:competE1:collab
Mea
n at
tribu
tion
to g
roup
mem
bers
hip
9
8
7
6
5
4
3
2
1
social id condition
high
low
3) Appraisal of incompatibility with norms of fairness and justice as
considered by self . Results were only partially comparable to those of the full sample.
The main effect for time was no longer significant [F(1.92,69.0931)=2.60, p=.08,
eta2=.07] but there was still a significant interaction between time and overall strategy
[F(1.92,69.0932)=9.65, p<.001, eta2=.21] showing that across the 3 events competition
tended to be appraised as more unfair and unjust by self than collaboration. More
interestingly, and in contrast to result for the full sample, a significant main effect was
found for social identity salience condition (Fig.3.22.). Irrespective of opponent’s
strategy, participants in the high social identity salience condition systematically gave
higher ratings of unfairness and injustice as considered by self than participants in the
low social identity salience condition. Thus, the hypothesis for the impact of social
identity salience condition on appraisals of unfairness and injustice as considered by
self (included in H8 and H9) was supported by these results.
31 Because of violation of sphericity the Huynh-Feldt Epsilon adjustment of df was used. 32 Because of violation of sphericity the Huynh-Feldt Epsilon adjustment of df was used.
Fig.3.21b. Mean attribution to group
membership as a function of social identity
in the mostly competitive condition (N=19
competitors)

115
TIME
E3E2E1
Mea
n un
fairn
ess
and
inju
stic
e (b
y se
lf)
9
8
7
6
5
4
3
2
1
social id condition
high
low
Appraisal of incompatibility with norms of fairness and justice as considered
by other members of the ingroup. Results were comparable to those of the full sample.
First, there was still a significant interaction between time and overall strategy
[F(1.64,59.0933)=13.67, p<.001, eta2=.27] showing that irrespective of social identity
and across the 3 events, competition was appraised as more unfair and unjust as
considered by other members of the ingroup than collaboration. In line with results of
the full sample, the main effects for social identity were not significant [F(1,36)=2.63,
p=.11, eta2=.07].
Analyses of emotion ratings of “competitors”
1) Positive emotions (all cases in the competitor sub-sample N=40). Results
are comparable to those of the full sample. First, there was a still significant main
effect for overall strategy [F(1,36)=12.06, p<.001, eta2=.25], and a significant
interaction between time and overall strategy [F(1.26, 45.3834)=47.43, p<.001,
eta2=.57]. Taken together these result confirm (see hypotheses H1 and H2) that,
irrespective of overall strategy and across events in time the negotiation was
successful in inducing stronger positive emotions for collaboration than for
competition. Even though the pattern of means still suggested that participants in the
high social identity salience condition tended to give higher intensity ratings (M=4.76,
33 Because of violation of sphericity the Huynh-Feldt Epsilon adjustment of df was used. 34 Because of violation of sphericity the Huynh-Feldt Epsilon adjustment of df was used.
Fig. 3.22. Mean unfairness and injustice as
considered by self as a function of time and
social identity (N=40 competitors)

116
SD=.38, N=21) than participants in the low social identity salience condition
(M=4.28, SD=.40, N=19), differences were no longer significant.
2) Negative emotions (all cases in the competitor sub-sample N=40). Results
are comparable to those of the full sample. There was still a significant main effect for
overall strategy [F(1,36)=10.28, p<.01, eta2=.22], and a significant interaction
between time and overall strategy [F(1.26,45.5335)=34.98, p<.001, eta2=.50]. Again
these result confirm (see hypotheses H1 and H2) that, irrespective of overall strategy
and across events in time the negotiation was successful in inducing stronger negative
emotions for competition than for collaboration. Again, in contrast to the hypothesis
(H10) no significant differences between social identity salience conditions were
found.
3) Surprise (all cases in the competitor sub-sample N=40). Results are
comparable to those of the full sample. Again, none of the main effects were
significant and the only significant effect was the interaction between time and overall
strategy [F(2,72) = 3.67, p.<.05, eta2=.09].
35 Because of violation of sphericity the Huynh-Feldt Epsilon adjustment of df was used.

117
3. 4. Discussion
Like study 1, this study was aimed at testing whether the manipulation of social
identity salience influenced appraisals as well as the nature and intensity of emotions
experienced toward selected events pertinent to that identity. Again, the mediation
hypothesis for appraisals in the proposed relationship between social identity salience
and emotion was explored.
In this experiment participants engaged in a computer negotiation task with a “virtual”
other and the aim was to test whether participants in the high social identity salience
condition (i.e., primed to perceive the negotiation task as an intergroup interaction)
compared to those in the low social identity salience condition (i.e., primed to
perceive the negotiations as an interpersonal interaction), would show differences in
their appraisals and emotion responses to other’s choice to either compete or
collaborate.
The discussion of results is organized in three sections that broadly correspond to the
hypotheses. First, results pertaining to overall appraisals and emotion responses to
collaboration and competition will be discussed (H1 and H2). Second, results
concerning the impact of social identity on appraisal (H3 through to H9) and emotion
intensity (H10) will be discussed. Thirdly, the results for the test of the mediation
hypotheses for appraisal will be discussed. Finally, some general conclusions for this
study will be drawn. A summary and comparison of results of appraisals and emotions
for the sub-sample and for the 40 competitors are presented in Table 3.9.
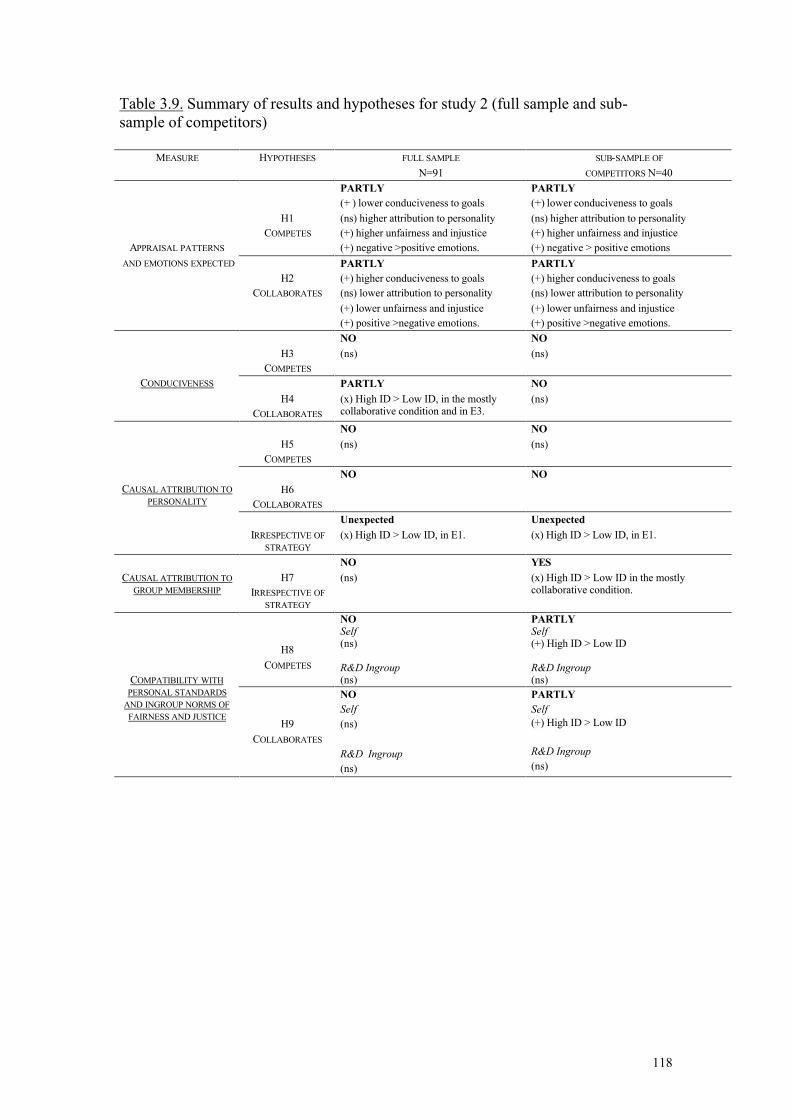
118
Table 3.9. Summary of results and hypotheses for study 2 (full sample and sub-sample of competitors)
MEASURE HYPOTHESES FULL SAMPLE N=91
SUB-SAMPLE OF COMPETITORS N=40
H1 COMPETES
PARTLY (+ ) lower conduciveness to goals (ns) higher attribution to personality (+) higher unfairness and injustice (+) negative >positive emotions.
PARTLY (+) lower conduciveness to goals (ns) higher attribution to personality (+) higher unfairness and injustice (+) negative > positive emotions
APPRAISAL PATTERNS
AND EMOTIONS EXPECTED
H2
COLLABORATES
PARTLY (+) higher conduciveness to goals (ns) lower attribution to personality (+) lower unfairness and injustice (+) positive >negative emotions.
PARTLY (+) higher conduciveness to goals (ns) lower attribution to personality (+) lower unfairness and injustice (+) positive >negative emotions.
H3
COMPETES
NO (ns)
NO (ns)
CONDUCIVENESS H4
COLLABORATES
PARTLY (x) High ID > Low ID, in the mostly collaborative condition and in E3.
NO (ns)
H5
COMPETES
NO (ns)
NO (ns)
H6
COLLABORATES
NO
NO
CAUSAL ATTRIBUTION TO PERSONALITY
IRRESPECTIVE OF
STRATEGY
Unexpected (x) High ID > Low ID, in E1.
Unexpected (x) High ID > Low ID, in E1.
CAUSAL ATTRIBUTION TO
GROUP MEMBERSHIP
H7
IRRESPECTIVE OF STRATEGY
NO (ns)
YES (x) High ID > Low ID in the mostly collaborative condition.
H8 COMPETES
NO Self (ns) R&D Ingroup (ns)
PARTLY Self (+) High ID > Low ID R&D Ingroup (ns)
COMPATIBILITY WITH PERSONAL STANDARDS
AND INGROUP NORMS OF FAIRNESS AND JUSTICE
H9 COLLABORATES
NO Self (ns) R&D Ingroup (ns)
PARTLY Self (+) High ID > Low ID R&D Ingroup (ns)

119
EMOTION INTENSITY
H10 IRRESPECTIVE OF
OVERALL STRATEGY
(all cases) YES positive emotions (+, p=.06 ) High ID > Low ID. NO negative emotions: (ns) surprise: (ns) (analyses conducted after excluding participants not feeling the emotion) NO positive emotions: (ns) NO negative emotions (ns) Surprise: (ns)
(all cases) NO positive emotions : (ns) NO negative emotions: (ns) surprise: (ns)
MEDIATION HYPOTHESIS
NO
Note: PARTLY=the hypotheses were partly supported, NO=the hypotheses were rejected, YES=the hypotheses were confirmed. Unexpected=Unexpected significant result. E1 refers to Event 1, E2 to Event 2, and E3 to Event3; (+) = indicates that the main effect for social identity salience condition was significant in the expected direction (-) indicates that the main effect for social identity salience condition was significant in the opposite direction , (ns) =indicates that the main effect for social identity salience condition was not significant (x) =indicates an interaction effect for social identity salience condition.

120
3.4.1. Appraisal and emotion responses to other’s choice to collaborate and to
compete in this PDG
The results suggest that in the context of the computerized negotiation task used in
this experiment (structured as a short PDG) and as expected, other’s choice to
compete (H1) was successful in evoking appraisals of low conduciveness to goals and
high unfairness and injustice, and in inducing stronger intensity negative emotions
such as frustration, irritation and anger. Again, in line with predictions, other’s choice
to collaborate (H2) was successful in evoking appraisals of high conduciveness and
low unfairness and injustice, and in inducing stronger intensity positive emotions such
as relief, satisfaction and happiness.
In contrast to the hypothesis however, others’ choice to compete (i.e., assumed to be
perceived as a “negative” act by other) did not lead to higher appraisals of causal
attribution due to personality (i.e., “internal” factor) than other’s choice to collaborate
(i.e., assumed to be perceives as a “positive” act by other). In fact, irrespective of
whether the computer competed or collaborated participants tended to give higher
ratings to appraisal of causal attribution to group membership than to appraisal of
causal attribution to personality. In this experimental context, this result is not
surprising since the only thing that participants knew about the other person was their
group membership. Moreover, higher rates of attribution to group membership were
reported when the computer competed than when the computer collaborated. In line
with Weiner (1986), this result may simply show that participants were more likely to
look out for causal explanations when the situation was negative.
3.4.2. The influence of social identity salience on appraisals
In response to the first research question, these results provide only partial support for
hypotheses concerning the impact of social identity salience when appraising an event
pertinent to the salient social identity, and in particular on appraisal dimensions of
goal significance (i.e., conduciveness), agency/responsibility (i.e., causal attribution to
other’s group membership), and compatibility with personal standards and ingroup
norms (i.e., unjust and unfair as considered by self, and as considered by ingroup).

121
Results of analyses conducted for all cases showed that when appraising other’s
choice to collaborate, there was some evidence (Event3) that participants in the high
social identity salience condition rated conduciveness higher than participants in the
low social identity salience condition (H4). When appraising other’s choice to
compete, no significant differences were observed between social identity salience
conditions.
When analyses were run on the sub-sample of participants who systematically
competed, a different picture emerged. When appraising other’s choice to collaborate,
participants in the high social identity condition (Event 2 in the mostly collaborative
condition) rated causal attribution to other’s PRODUCTION outgroup membership
(H7) higher than participants in the low social identity salience condition. They also
rated unfairness and injustice as considered by self 36 (H8) higher than participants in
the low social identity salience condition. When appraising other’s choice to compete,
participants in the high social identity condition (Event 1 in the mostly collaborative
condition) tended (p=.07) to rate causal attribution to other’s PRODUCTION
outgroup membership (H7) higher than participants in the low social identity salience
condition. They also rated unfairness and injustice as considered by self (H8) higher
than participants in the low social identity salience condition.
Although no specific hypotheses were made concerning how participants’ responses
may be affected by the type of overall strategy (i.e., that is whether the computer
mostly collaborated and mostly competed across the 3 events) and time (3 events), our
results show that there was a strong effect. More interestingly, the effect of social
identity salience condition on appraisal was sometimes different in the two overall
strategy conditions, and these differences sometimes changed in time.
First, the effect of social identity on appraisal of conduciveness was significant only
in the mostly collaborative condition and only in the last Event. In this condition the
computer started competing in Event 1, and then switched to collaboration for Events
2 and 3. The ratings of conduciveness for participants in both social identity salience
condition remained quite similar for the first 2 Events. The main difference between
36 It should be noted that as expected, these ratings were lower than when appraising competition.

122
social identity salience conditions occurred between Events 2 and 3, because there
was a significant decrease in the ratings of participants in the low social identity
salience condition. Why were the ratings of participants in the low social identity
condition lower in Event 3? One explanation could be that participants in the high
social identity salience condition may have been more pleasantly surprised by the fact
that the other collaborated again (if they were perceiving the interaction as an
competitive intergroup situation they would have expected the computer to switch
back to competition in Event3). Results on ratings for surprise support this
interpretation: In the mostly collaborative condition, overall ratings for surprise
increased significantly between Event 1 and Event 2, and between Event 2 and Event
3. However, for participants in the low social identity salience condition, this patterns
was slightly different and in fact the ratings of surprise actually decreased between
Events 2 and 3.
Second, the effect of social identity on appraisal of causal attribution to other’s
PRODUCTION outgroup membership was also significant only in the mostly
collaborative condition and only when analyses were run on the sub-sample of
competitors. In this experiment the intergroup dimension of the interaction and
consequently “other’s group membership” was made more salient before the
interaction only to participants in the high social identity salience condition.
However, it cannot be excluded that the salience of “other’s PRODUCTION outgroup
membership” may have become salient for participants in the low social identity
salience condition during the interaction. One interpretation may be that the fact that
these participants were systematically competing combined with greater exposure to
competition in the mostly competitive condition may have rendered “other’s
PRODUCTION outgroup membership” salient for participants in the low social
identity. This would explain why differences between social identity salience
conditions were not significantly differently in the mostly competitive condition. In
fact, this interpretation is supported by the social identity and overall strategy
interaction observed on the manipulation check question which asked participants at
the end of the negotiation to what extent they had identified to the R & D department.
For participants in the low social identity salience condition levels of identification
were the strongest in the mostly competitive condition, and in fact they were just as
high as that of participants in the high social identity salience condition.

123
Taken together results on the impact of overall strategy condition and time are a
strong reminder that social identity salience is highly dynamic, and it can change both
in terms of type and content as a function of intergroup relations and other immediate
contextual factors (Hogg, Terry & White, 1995). In this experiment it cannot be
assumed that the social identity salience manipulations (which consisted in enhancing
the intergroup dimension of the computerized negotiation task for participants in the
high social identity salience condition, and to enhance the interpersonal dimension of
these negotiations task for participants in the low social identity salience condition)
remained effective in a consistent way throughout the 3 experimental events in time.
Moreover, it cannot be assumed that the order of presentation and/or the number of
times that the “other” competed or collaborated did not affect social identity salience.
In this type of design, it becomes difficult to anticipate in which way social identity
salience might evolve, and the processes that may intervene. For example, it is
possible that participants’ social identity salience may have also been affected by the
content of the experimental events themselves, or by the other aspects of the
interaction with the virtual “other”.
3.4.3. The influence of social identity salience on emotions
In response to the second research question, these results provide little support for the
hypotheses concerning the impact of the strength of social identity salience on the
reported intensity of positive emotions, negative emotions and surprise.
When analyses were conducted for all cases, the only significant result in support for
the hypothesis (H10) was that overall participants in the high social identity salience
condition reported marginally (p=.06) stronger positive emotions than participants in
the low social identity salience condition (H10). No significant differences were
observed on negative emotions or on surprise. When analyses were run on the sub-
sample of participants who systematically competed, no significant differences were
observed on any of the emotion variables.
Despite the lack of results for the effects of social identity salience on emotions, the
computerized interaction used in this study was more successful than the vignettes
used in study 1 in inducing the intended emotions. In addition, the intensities of felt

124
emotions (after excluding participants not feeling the emotion from the analyses) are
clearly higher in this study (table 3.5) than in study 1 (table 2.3.).
3.4.4. The potential bias of outcome (number of points gained)
There were no significant differences between social identity salience conditions in
terms of the dominant strategy chosen by most participants (competition), and thus no
significant differences on the actual number of points made. Further analyses of the
sub-sample of participants who were systematically competing across the 3 events
(i.e., winning either 1 point when the computer competed, or 3 points when the
computer collaborated) revealed that results on appraisals were different than those
for the full sample. These differences may be the result of an unknown characteristic
for this sub-sample of “competitors”. But it cannot be totally excluded that these
differences reflect the bias of number of points gained by self and the other.
3.4.5. Appraisal as a mediator between social identity salience and emotion?
On the basis of the results discussed above, it can be argued that there is some support
for the effects of social identity salience condition on appraisals and on emotions
separately. However, results of the mediation analyses of the appraisal and emotion
variables selected in this study did not support the mediation hypothesis for appraisal
in the relationship between social identity and emotions. Yet, tentative exploratory
analyses confirmed the added value that social identity salience condition had over
and above appraisals in the prediction of positive emotions for the first Event.
3.4.6. General conclusions
Taken together, the results for study 2 provide some support for the influence of
social identity salience on appraisals and emotions in an intergroup experimental
setting. However, results are mitigated so further replication is needed.
It was considered that the computerized negotiation task was successful in inducing
the desired appraisal and emotion responses and that it could be maintained for a
replication. However, the efficacy of the social identity salience manipulation was not

125
obvious. First, results on the manipulation check items showed that, participants in the
high social identity salience condition reported identifying more strongly with the
“artificial” social identity that was assigned to them during the negotiation task than
participants in the low social identity salience condition. However, in the mostly
competitive condition the level of identification was equally high in both social
identity salience conditions. When considering the sub-sample of competitors, results
on appraisals showed that the expected differences on the use of “caused by other’s
group membership” did not occur in the mostly competitive condition but in the
mostly collaborative condition. Taken together these results suggest that
“competition” during the interaction (i.e., whether it was greater exposure to other’s
competition, or participants’ own competition) may have acted to enhance the
salience of other’s group membership for participants in the low social identity
salience.
The social identity salience effects on appraisals and emotions observed in this study
may become clearer if the magnitude of intergroup differences (i.e., between the
ingroup vs. the target outgroup) is enhanced for participants in the high social identity
salience condition. How can the social identity salience manipulations be adapted in
the context of this PDG experimental paradigm? One possibility is to attempt to
render the intergroup differences more real and pertinent to participants. As shown in
study 1, the experimental manipulation of the salience a real social identity in the
context of real intergroup tension proved to be a difficult and complex task. But in the
concrete case of the PDG paradigm used for this second study, the manipulation of
the salience of a real social identity might be integrated in the design without losing
the desired experimental control. This was attempted in Study 3.

126
CHAPTER 4
THIRD EXPERIMENT
4.1. Overview
This third study aimed to replicate the social identity salience effects on appraisal and
emotions obtained in study 2. The materials and the procedure used were identical to
those of study 2, and the major procedural distinction concerned methodological
adjustments made to the social identity salience manipulations to attempt to enhance
the magnitude of the social identity salience effects. The changes made were partly
based on previous experimental research on the effects of crossed categorization on
intergroup evaluations. Concretely, changes were made based on three important
considerations emerging from this literature as follows,
1) Crossing two social identities. Research on crossed categorizations has
shown that when two dimensions of social categorization that are equally important to
a person are made salient, one can expect double ingroups (ii) to be evaluated the
most favorably, crossed targets to receive intermediate evaluations (io and oi), and
double outgroups (oo) to receive the less favorable evaluations (ii>io=oi>oo) (see
Migdal, Hewstone, & Mullen, 1998; and Mullen, Migdal, & Hewstone, 2001 for
recent meta-analyses of this research). There is evidence that the magnitude of
perceived intergroup differences between double ingroups (ii) and double outgroups
(oo), inferred from ingroup bias1 measures, is greater than between a simple ingroup
(i) and outgroup (o). Therefore, it this experiment it was attempted to enhance the
magnitude of perceived intergroup differences by enhancing the salience of a double
ingroup for participants in the high social identity condition and leading them to
believe they would interact with a double outgroup.
2) Crossing the “artificial social identity” with a “real social identity”.
Research on simple categorizations has shown that “real” categorizations tend to lead 1 But, ingroup love (i.e., ingroup bias) does not necessarily mean outgroup hate (i.e., antagonism) (Brewer, 2001). Interestingly, it has been recently pointed out that the strength of emotions associated
127
to stronger intergroup bias effects than “artificial” categorizations, although results
are less conclusive for double categorizations (see Mullen, Migdal, & Hewstone,
2001). Notwithstanding, one could reasonably expect that categorization along “real”
social memberships may be more likely to induce stronger and “real” intergroup
emotions than “artificial” categorizations. This experiment attempted to enhance the
intensity of the reported emotions by crossing the “artificial” intergroup dichotomy
used in study 2, R&D department vs PROD department, with a “real” intergroup
dichotomy for this student sample, namely, Psychology students vs. Business
students. Although the intergroup competition that may exist between faculties or
groups of students at the University of Geneva might not be as strong as in American
Universities, a survey conducted among students from different faculties at the
University of Geneva (N=124) revealed that, in general, a third of the students felt
that the more time they spent in a faculty the more they shared the perspective of that
faculty, and 87% of the sample reported they felt a difference in mentality and values
between students from different faculties (Fiss & Hodgers, 1996). In this experiment,
it was considered that the group of Business students (i.e., belonging to the
Management Studies Section at the Social and Economic Sciences Faculty) was the
student group most likely to be perceived as having different values from the group of
Psychology students (i.e., belonging to the Psychology Section at the Faculty of
Psychology and Education Sciences).
3) Assuming equivalent salience for the two memberships constituting the
double ingroup (and those constituting the target double outgroup). The functional
use of a social identity is that if in a given situation one social identity is enhanced
over another, that social identity will be more salient and the other social identity will
become less accessible (Turner, Oakes, Haslam, & McGarty, 1994). However, in an
intergroup encounter people can have multiple social identities become salient
simultaneously. In the typical crossed categorization paradigm two social identities
are made salient simultaneously, and people are asked to make evaluations of the
different groups (ii, io, oi, and oo). Different patterns of evaluation outcomes have
been observed which has lead researchers to propose different membership salience
patterns (see model proposed by Crisp, Ensari, Hewstone, & Miller, 2002). For to an outgroup may be key in explaining why and when ingroup bias becomes outgroup derogation (Hewstone, Rubin, & Willin, 2002)
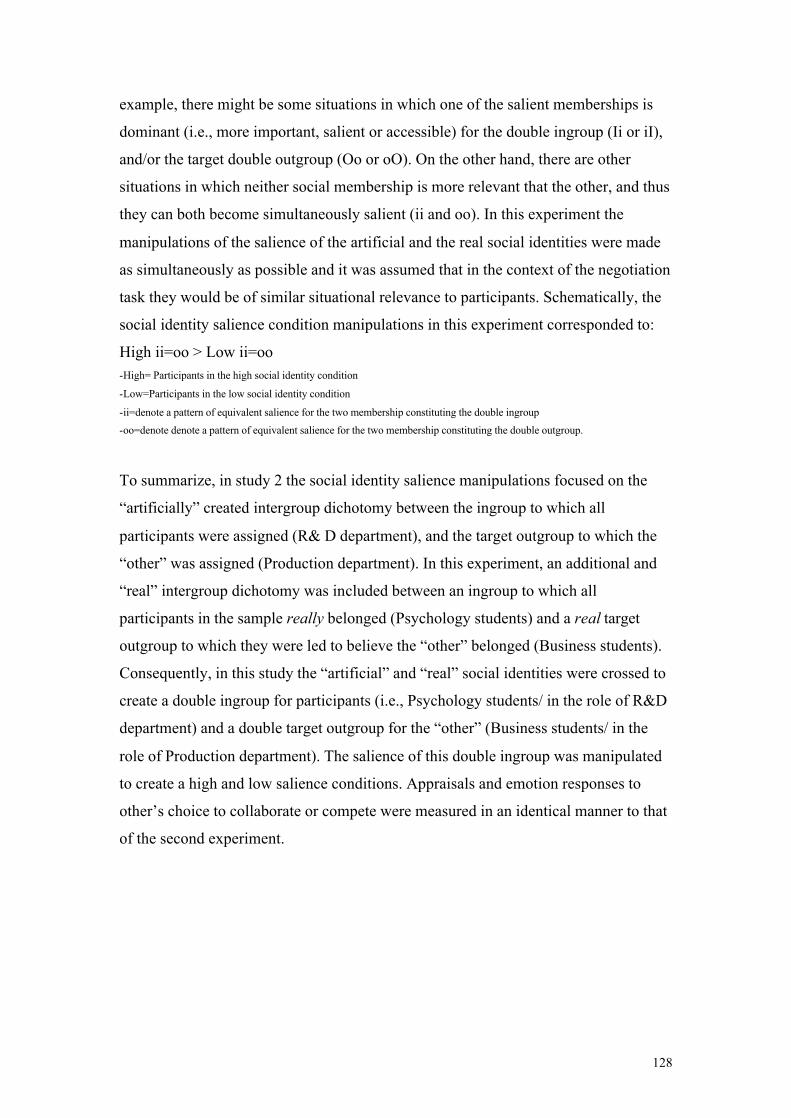
128
example, there might be some situations in which one of the salient memberships is
dominant (i.e., more important, salient or accessible) for the double ingroup (Ii or iI),
and/or the target double outgroup (Oo or oO). On the other hand, there are other
situations in which neither social membership is more relevant that the other, and thus
they can both become simultaneously salient (ii and oo). In this experiment the
manipulations of the salience of the artificial and the real social identities were made
as simultaneously as possible and it was assumed that in the context of the negotiation
task they would be of similar situational relevance to participants. Schematically, the
social identity salience condition manipulations in this experiment corresponded to:
High ii=oo > Low ii=oo
-High= Participants in the high social identity condition
-Low=Participants in the low social identity condition
-ii=denote a pattern of equivalent salience for the two membership constituting the double ingroup
-oo=denote denote a pattern of equivalent salience for the two membership constituting the double outgroup.
To summarize, in study 2 the social identity salience manipulations focused on the
“artificially” created intergroup dichotomy between the ingroup to which all
participants were assigned (R& D department), and the target outgroup to which the
“other” was assigned (Production department). In this experiment, an additional and
“real” intergroup dichotomy was included between an ingroup to which all
participants in the sample really belonged (Psychology students) and a real target
outgroup to which they were led to believe the “other” belonged (Business students).
Consequently, in this study the “artificial” and “real” social identities were crossed to
create a double ingroup for participants (i.e., Psychology students/ in the role of R&D
department) and a double target outgroup for the “other” (Business students/ in the
role of Production department). The salience of this double ingroup was manipulated
to create a high and low salience conditions. Appraisals and emotion responses to
other’s choice to collaborate or compete were measured in an identical manner to that
of the second experiment.

129
4.1.1. Hypotheses
a) Hypotheses about appraisal patterns and emotions expected in response to
other’s choice to collaborate or compete. The hypotheses derived from appraisal
theory of emotions concerning appraisal patterns and emotions expected in response
to other’s choice to collaborate and other’s choice to compete were identical to those
proposed for study 2 (see Table 3.1. and H1 and H2 in section 3.1.1.).
b) Hypotheses about the impact of social identity salience condition on
appraisals and emotions as reported in response to other’s choice to collaborate or
compete. In this study, the hypotheses about the effects of social identity salience on
appraisal (H3 to H9) and emotion intensity (H10) were the same than those elaborated
in study 2 (again see section 3.1.1.). Moreover, it was expected that the modifications
made to the social identity salience manipulations in this study, would enhance the
magnitude of the effects of social identity salience on appraisal and emotions
responses to other’s choice to collaborate and compete compared to results of study 2.
c) Mediation hypothesis. Like in study 2, in this experiment, the influence of
social identity salience on positive (i.e., relief, satisfied, happy) and on negative
emotions (i.e., frustration, irritation, anger) expected in response to other’s choice to
collaborate and other’s choice to compete, is expected to be mediated by the
corresponding appraisals (see prediction of appraisal patterns for emotions in Table
3.1 in study 2). Like in studies 1 and 2, appraisal is expected to function as a mediator
between social identity and emotions under the following conditions: (a) variations in
the levels of social identity salience condition (high vs. low) significantly account for
variations in emotion (i.e., termed path a), (b) variations in appraisals significantly
account for variations is emotion (i.e., termed path b), and (c) when path a and b are
controlled for, a previously significant relationship between social identity salience
and emotion (i.e., termed path c) is no longer significant (or at least a significant
decrease is observed) (see diagram in Figure 2.1. in chapter 2 for a depiction of the
formulation of this mediation hypothesis).

130
4.2. Method
4.2.1. Participants
Fifty-three first-year psychology students from the University of Geneva (i.e., 16 men
and 37 women2, with a mean age of 22.5 years) were recruited to participate in this
experiment. When signing up for the experiment, participants were told that this
experiment concerned the role of emotions during virtual business negotiations in
organizations. One of the participants was not enrolled in the Faculty of Psychology
and Education Sciences and thus was excluded from the analyses. Fifty-two cases
were included in the final analyses. All students received partial course credit for their
participation.
4.2.2. Procedure
When recruited, participants were told that in this experiment they would have to
participate in two experimental sessions. They were told that in the first session they
would have to complete a questionnaire on conflict management styles, and in the
second session, they would receive feedback on the results of the questionnaire and
become involved in a simulation of a virtual business negotiation.
a) Questionnaire completion session. The questionnaire completion session
was conducted approximately one week before the virtual negotiation session. On
arrival, all participants were welcomed as a group by an experimenter who reminded
them briefly of the purposes of the study and assured them of complete anonymity
and confidentiality of the results. They were told that the study was about better
understanding the role of emotions during virtual negotiations in organizations, and
that the purpose of the questionnaire was to gather some general information
concerning their general preferences for managing conflict. They were told that this
information would help the researchers better understand their behavior during the
virtual negotiations that they would conduct in the second experimental session. All
participants were then instructed to complete the questionnaire individually and in
2 Like for studies 1 and 2, these male/female proportions are representative of 1st year psychology students at the University of Geneva.

131
silence. The questionnaire took 30 minutes to complete. After completing the
questionnaire participants were thanked for their participation and asked to sign up for
the second experimental session in which would receive feedback on the results of the
questionnaire and become involved in a simulation of a virtual business negotiation.
The questionnaire completed was the “Thomas Kilman Questionnaire of Conflict
Management Styles” (for a copy of the French version used see C.1.). This
instrument, developed by Thomas and Kilman (1974), is meant to assess self-reported
individual preferences for managing conflict in terms of five types of conflict
management styles, namely: competing (e.g., I am usually firm in pursuing my goals),
accommodating (e.g., I might try to soothe the other’s feelings and preserve our
relationship), compromising (e.g., I try to find a compromise solution), collaborating
(e.g., I try to deal with all of his/her and my concerns) and avoiding (e.g., I try to do
what is necessary to avoid useless tensions). The questionnaire consists of 30 sets of
forced choice items, and each of the items describes one of the conflict management
styles (in total there are 12 items for each of the conflict management styles).
b) Feedback and business negotiation session. These experimental sessions
were carried out over 3 weeks, 2 days per week, 4 times per day, 2 in the morning and
2 in the afternoon. Like in study 2, up to 6 people could participate in the same
session. Participants had been randomly assigned to social identity salience condition
(high or low) and to overall strategy across the 3 decisions (mostly collaborative:
compete, collab, collab, or mostly competitive: collab, compete, compete). In total, 12
participants were assigned to high/mostly competitive condition3, 12 were assigned to
the high/mostly collaborative condition4, 14 were assigned to low/mostly competitive
condition5, and 14 were assigned to the low/mostly collaborative condition6. Again,
these conditions were counterbalanced across subjects in an identical manner to that
of study 2. The second experimental session actually included two parts. In the first
part, participants were welcomed as a group in a small classroom across the computer
laboratory and received false oral feedback on the results of the questionnaire
completed in the first session. After receiving the false feedback (i.e., which was
different in the two social identity conditions as discussed below) participants were 3 5 males and 7 females, 10 Swiss and 2 non-Swiss nationals, with a mean age of 22.83 years. 4 5 males and 7 females, 11 Swiss and 1 non-Swiss nationals, with a mean age of 22.27 years. 5 4 males and 10 females, 12 Swiss and 2 non-Swiss nationals, with a mean age of 21.86 years.
132
distributed the corresponding written instructions package (i.e., high or low social
identity salience conditions) and were asked, always as a group, to read it in silence.
The reason for making participants read the instruction package at this point was to
attempt to manipulate the salience of both social identities (R&D/Psychology student
vs. PROD/Business student) as simultaneously as possible. Once participants had
finished, they were immediately led to the computer laboratory that was the same one
used for study 2. In the second part of this session, participants were welcomed as a
group in front of the computer laboratory by a second experimenter who administered
the procedure for the computerized negotiations in an identical manner to study 2. The
only procedural difference was that participants had already read the written
instruction materials as discussed above. In total, the second experimental session
lasted from 45 to 55 minutes. As in study 2, the study was designed to be double
blind. Thus, the experimenter who gave the false oral feedback (i.e., first part of
experimental session 2) had pre-programmed the computers in the laboratory
according to the established counterbalancing design before the negotiation task. A
second experimenter who was completely blind to the experimental conditions to
which participants were assigned, administered the procedure of the computerized
negotiations (i.e., second part of experimental session 2). At the end of the
experiment, participants were thanked for their participation and were told they would
be informed about the results of the experiment in a session organized for this purpose
once the study was finished. Finally, they were asked to keep strict confidentiality
about all details concerning the experiment, in particular toward fellow students.
4.2.3. Manipulations, materials and measures
a) Manipulations of social identity salience. The salience of the Psychology
student (real) ingroup membership (vs. the Business student (real) target outgroup)
was manipulated through the oral information participants received as false feedback
on the questionnaire, and also through part of the written information included in the
instruction package they read individually after the feedback. To keep the oral
feedback information as constant as possible, the experimenter actually read a written
script. The experimenter told participants that the reason the feedback would be read
6 2 males and 12 females, 11 Swiss and 3 non-Swiss nationals, with a mean age of 23.15 years

133
to them was to make sure that all participants received exactly the same information.
Table 4.1a. presents a summary of the differences in oral information received by
participants as a function of social identity conditions (see copies in French in
Appendices A2).
Table 4.1a. Summary of oral information in the feedback scripts for the two social identity salience conditions
High Social Identity Salience Low Social Identity Salience General Information About The Questionnaire
-Before conducting the virtual negotiations the researchers wanted to give you some complementary information concerning the questionnaire completed during the first session. -Two American researchers, Thomas and Kilman in 1974, created the questionnaire and it is used to evaluate the choices made by people to resolve conflicts. These researchers have identified two major modes of conflict resolution: one mode that favors the importance of relationships and one mode that favors the importance of the task. Recent research on negotiations in organizations has shown that in the long term, the mode that favors relationships is the most adapted.
-Idem. -Idem
False Feedback on Results To enhance the real ingroup vs. outgroup dimension -In this study we created a mean by averaging your scores as a group of psychology students and we compared them to the scores of business students. We were somehow surprised by the results: it seems that psychology students have a conflict management style that is less oriented toward relationships than business students. These results seem to suggest that psychology students would be less adapted to conflict resolution in the long term than business students.
To enhance the interpersonal dimension -In this study we examined the mean of your scores and in general there are as many people that show a conflict management style that is oriented toward relationships than toward the task.
Information About the Membership of the Other Player To enhance the real ingroup vs. outgroup dimension -Now you will participate in a virtual negotiation, via computers, with business students who are also participating in this experiment.
To enhance the interpersonal dimension -Now you will participate in a virtual negotiation, via computers, with other students coming from various faculties and who are also participating in this study.

134
In the high social identity salience condition, the feedback was negative and was
designed to enhance intergroup competition by threatening the position of the ingroup
in comparison to the target outgroup. These participants were told that: a) recent
research had shown that a conflict negotiation style favoring relationships is the most
adapted, b) that when comparing the scores of Psychology students to Business
students, Psychology students showed a conflict management style that was less
oriented toward relationships suggesting they would also be less adapted to conflict
resolution, and c) that they would actually interact with a Business student in the
virtual negotiation. In this way, the feedback on conflict management styles was made
relevant to Psychology students (i.e., stereotypically one would expect that
Psychology students would show more orientation towards relationships than
Business students) and to the negotiation task at hand. In the low social identity
salience condition, the feedback was neutral and established no comparison between
results. Participants in this condition were simply told they would interact with other
students in the virtual negotiation.
The salience of the R&D (artificial) ingroup membership was only manipulated via
the written information included in the instruction packages in an identical manner to
that of study 2. Table 4.1b. presents a summary of the differences in written
information received by participants as a function of social identity condition (see
copies in French in Appendices A3 and A4). As discussed above, the reason for
giving the written instructions to participants immediately after the false feedback was
to attempt to enhance the salience of the double ingroup (i.e., R&D/Psychology
student) in comparison to the target double outgroup (i.e., PROD/Business student) as
simultaneously as possible.
b) Manipulation of collaboration and competition. These manipulations were
identical to those of study 2.
c) Materials. The computer laboratory, the business simulation materials, the
computer program and the scoring matrix were identical to those used in study 2.
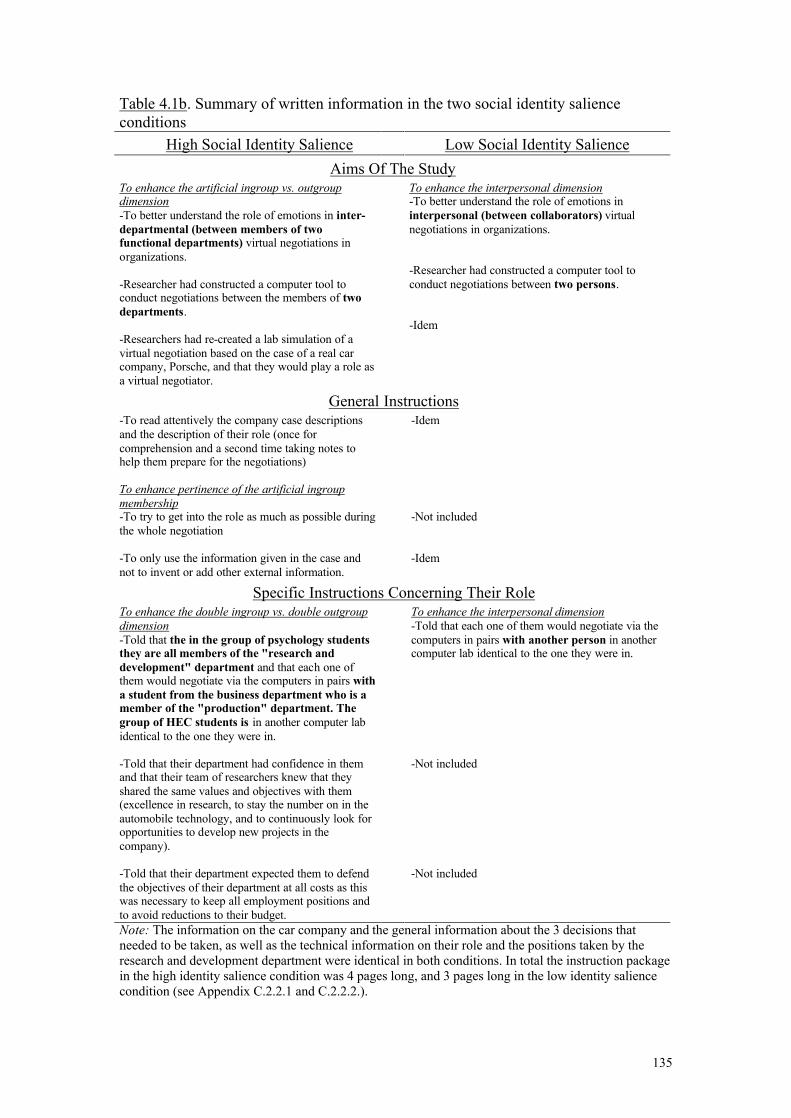
135
Table 4.1b. Summary of written information in the two social identity salience conditions
High Social Identity Salience Low Social Identity Salience Aims Of The Study
To enhance the artificial ingroup vs. outgroup dimension -To better understand the role of emotions in inter-departmental (between members of two functional departments) virtual negotiations in organizations. -Researcher had constructed a computer tool to conduct negotiations between the members of two departments. -Researchers had re-created a lab simulation of a virtual negotiation based on the case of a real car company, Porsche, and that they would play a role as a virtual negotiator.
To enhance the interpersonal dimension -To better understand the role of emotions in interpersonal (between collaborators) virtual negotiations in organizations. -Researcher had constructed a computer tool to conduct negotiations between two persons. -Idem
General Instructions -To read attentively the company case descriptions and the description of their role (once for comprehension and a second time taking notes to help them prepare for the negotiations) To enhance pertinence of the artificial ingroup membership -To try to get into the role as much as possible during the whole negotiation -To only use the information given in the case and not to invent or add other external information.
-Idem -Not included -Idem
Specific Instructions Concerning Their Role To enhance the double ingroup vs. double outgroup dimension -Told that the in the group of psychology students they are all members of the "research and development" department and that each one of them would negotiate via the computers in pairs with a student from the business department who is a member of the "production" department. The group of HEC students is in another computer lab identical to the one they were in. -Told that their department had confidence in them and that their team of researchers knew that they shared the same values and objectives with them (excellence in research, to stay the number on in the automobile technology, and to continuously look for opportunities to develop new projects in the company). -Told that their department expected them to defend the objectives of their department at all costs as this was necessary to keep all employment positions and to avoid reductions to their budget.
To enhance the interpersonal dimension -Told that each one of them would negotiate via the computers in pairs with another person in another computer lab identical to the one they were in. -Not included -Not included
Note: The information on the car company and the general information about the 3 decisions that needed to be taken, as well as the technical information on their role and the positions taken by the research and development department were identical in both conditions. In total the instruction package in the high identity salience condition was 4 pages long, and 3 pages long in the low identity salience condition (see Appendix C.2.2.1 and C.2.2.2.).

136
d) Appraisal questionnaire. The computerized appraisal questionnaire, and its
administration were almost identical to that of study 2. The only difference was that
the wording of some questions was simplified or clarified (see copy of questions in
French in C.3.1.). Moreover, because of changes made to the social identity salience
manipulations, two new appraisal questions were added. One question concerned
coping potential, and in particular the appraisal of causal attribution to social group
membership. Concretely, the new item asked participants to rate the extent to which
the strategy chosen by the other was considered to be caused by the person’s
affiliation to the Management Studies section (i.e., new “real” outgroup membership
that was also made salient). The second question concerned compatibility with norms,
and more specifically it asked participants the extent to which the strategy chosen by
the other was considered to be unfair or unjust by other members of the Psychology
section (i.e., new “real” ingroup membership that was also made salient). Again, all
questions were rated from 1= “not at all” to 9=“very much”.
e) Emotion response type and intensity questionnaire (see copy of questions in
French in Study 2 - Appendix B.4.2.). The computerized emotion questionnaire
included the same emotion labels than those used in study 2 (i.e., surprise; 3 positive
emotions: relief, happy, satisfied; and 3 negative emotions: irritated, frustrated, and
angry). Its administration was identical to that of study 2 (i.e., presented in random
order, completed 3 times and each time it followed the appraisal questionnaire).
f) Social identity salience manipulation check questionnaire (see copy of
questions in French in Appendix C.3.2.). This final computerized questionnaire kept 2
questions from study 2 concerning the identification felt toward the business
department they were assigned to play in the game (i.e., R&D (artificial) ingroup
membership), and created 2 new questions concerning the identification felt to the
Psychology section to which they belonged (i.e., Psychology student (real) ingroup
membership). Again all questions were rated from 1= “not at all” to 9 “very much”:
1) During this simulation, did you identify with the department of research and
development?
2) During the simulation, was it important for you to belong to the research and
development department?
3) During this simulation, did you identify with the Psychology section?

137
4) During the simulation, was it important for you to belong to the Psychology
section?
g) Demographic information questionnaire. This questionnaire and the paper and
pencil administration were identical to that of study 2 (see copy of questions in French
in Study 2- Appendix B.4.5.).
4.3 Results
4.3.1. Overview of the analyses
The results are presented in seven sections representing the different steps of the data
analysis. The first six were identical to those of study 2. In this study, there was an
additional step, which involved the analyses testing for differences between
appraisals, and emotions as reported in study 2 and in this study.
4.3.2. Preliminary analyses
As in study 2, for each cell of the design dependent variables were examined through
various SPSS programs for accuracy of data, missing values, outliers and fit between
the distributions and the assumptions for the analyses. Some univariate outliers were
identified via the visual examination of box plots, but no case was identified as being
a multivariate outlier for a given appraisal or emotion variable. Normality of variables
was checked though the visual examination of histograms, expected normal
probability plots and detrended expected normal probability plots. Like for results of
study 2, violations of normality (strong kurtosis and positive skewness) were observed
for anger, and again deviations were due to the fact that the majority of participants
responded on the lower end of the response scale. Homogeneity of
variance/covariance was verified for all variables using Box-M. Violations were
observed for conduciveness, causal attributions to R&D (artificial) outgroup
membership, negative emotions variable, and surprise. Because for no variable the
ratio of largest to smallest variance approached 10:1, and the discrepancies in cell
sample size were small, these violations were disregarded (as suggested by
Tabachnick and Fidel, 2000). Finally, an ANOVA was conducted to test for

138
differences between conditions in terms of mean age but no significant differences
were found. Chi-square tests were used to test for differences between conditions in
terms of the ratio of male/female and of Swiss/non Swiss nationals and again no
significant differences were found.
4.3.3. Manipulations checks
To simplify the analyses it was decided to combine the two questions related to the
R&D department (artificial) ingroup membership (by computing the means of the
perceived identification and perceived importance items7) to a new variable called
“artificial ingroup membership salience”. Similarly, it was decided to combine the
two questions related to the Psychology student (real) ingroup membership (by
computing the means of the perceived identification and perceived importance items8)
to a new variable called “real ingroup membership salience”. To assess the
effectiveness of the social identity salience manipulations, two ANOVAs were
conducted with social identity condition and overall strategy condition as between
subjects factor, one on the “artificial ingroup membership salience” variable, and one
on “real ingroup membership salience” variable.
As shown in Figure 4.1. and contrary to expectations (H1), participants in the high
social identity condition did not give higher ratings of salience to either of the ingroup
memberships manipulated than participants in the low social identity condition. In
fact, the ratings of participants in both social identity conditions were higher for the
“artificial ingroup membership salience” variable than for the “real ingroup
membership salience” variable. Thus, it cannot be asserted that the adjustments made
to the social identity manipulation were effective in inducing higher and equivalent
salience for the two ingroup memberships for participants in the high social identity
condition. Contrary to study 2, the interaction between social identity and overall
strategy on the “artificial ingroup membership salience” variable [F (1, 52)=2.82,
p=.10, eta2= .05] was not significant.
7 The two artificial membership items correlated highly with each other (r=. 66, p>.001) and not at all with the two real membership items. 8 The two real membership items correlated highly with each other (r=. 77, p>.001) and not at all with the two artificial membership items.

139
social id condition
lowhigh
Mea
n id
entif
icat
ion
and
impo
rtanc
e
9.0
8.0
7.0
6.0
5.0
4.0
3.0
2.0
1.0
Ingroup memberships
Artificial (R&D)
Real (Psychology)
3.83.5
6.46.1
In sum, in this study results for the R&D (artificial) membership do not replicate
results obtained in study 2. There was no significant main effect for social identity
condition, and no significant interaction effect of social identity and overall strategy.
Moreover, attempts to manipulate the salience of a double ingroup membership
crossing the R&D (artificial) and the Psychology student (real) memberships seem to
have failed. Schematically, if the social identity salience manipulations in this
experiment attempted to induce the following salience membership pattern , High ii >
Low ii, the salience membership pattern suggested by the results of the manipulation
check questions correspond more to High Ii=Low Ii (i.e., where the capital I denotes
the dominant salience of the R & D (artificial) ingroup membership). Thus, based on
the manipulation check results, the social identity salience manipulations did not
work. The R&D (artificial) ingroup membership emerges as the dominant salient
ingroup membership for participants in both social identity conditions. The
interpretation of results will take this results into account.
Fig. 4.1. Mean identification and importance
of the two ingroup memberships manipulated
as a function of social identity and overall
strategy conditions

140
4.3.4. Analyses of appraisal and emotion ratings
4.3.4.1. Analyses of appraisals. A series of 2 X 2 X3 (mixed design) repeated
measures ANOVAs were conducted for each of the 11 appraisals measured, namely:
pleasantness, conduciveness, importance, causal attribution to personality, causal
attribution to artificial and real outgroup memberships, intentionality, controllability,
considered as unfair and unjust by self, and considered as unfair and unjust by other
members of the artificial and real ingroups. In all analyses social identity salience
condition (high or low social identity salience) and overall strategy condition (mostly
competition: E1 collab, E2 compet, E3 compet, or mostly collaboration: E1 compet,
E2 collab, E3 collab) were the between subjects factors, and time (E1, E2, and E3)
was the within subjects factor. Cell means and standard deviations for all appraisals
are presented in Appendix C.4.1.
Like in study 2, this section focuses on results for those appraisal dimensions on
which specific hypotheses were made. The presentation of results will be organized as
follows: 1) appraisal of conduciveness, 2) appraisal of causal attribution to personality
and appraisal of causal attribution to the artificial, and real outgroup memberships and
3) appraisal of unfairness and injustice as considered by self, and appraisals of
unfairness and injustice as considered by other members of the artificial, and real
ingroups.
1) Appraisal of conduciveness. Results only partially replicate results of study
2. As shown in Figure 4.2 there was again a significant main effect for overall
strategy [F (1,48)=20.82, p<.001, eta2=. 0] and a significant interaction between time
and overall strategy [F (2, 96)=73.70, p<.001, eta2=.61]. Thus, in line with results for
study 2 and in support of the hypotheses (H1 and H2 in study 2), irrespective of
overall strategy and across events in time, the negotiation task was successful in
inducing appraisal of low conduciveness for competition, and high conduciveness for
collaboration.

141
TIME
E3E2E1
Mea
n co
nduc
iven
ess
9
8
7
6
5
4
3
2
1
Overall strategy
compet/collab/collab
collab/compet/compet
Contrary to study 2, the interaction between social identity condition and overall
strategy was not significant. Thus, this result does not replicate results of study 2 and
does not provide support of the hypothesis (H4) about the effect of social identity
salience on this appraisal.
2) Appraisal of causal attribution to personality. Again, results partially
replicate results of study 2. Contrary to general predictions made about the impact of
overall strategy on results and in line with findings for study 2, there were no
significant main effects for overall strategy. Contrary to predictions (H5 and H6),
there was no significant main effect for social identity condition. In line with results
of study 2, there was a significant main effect for time [F (2,96)=4.91, p<.01,
eta2=.09]. Time effects were further examined via repeated contrast analyses9 which
revealed an almost significant decrease in the ratings between E1 (M=4.96, SD=2.17)
and E2 (M=4.56, SD=2.34) [F (1,48)=3.67, p=.06, eta2=.07]. The decrease between
E2 and E3 was not significant (M=4.17, SD=2.45] [F (1,48)=3.67, p=.15, eta2=.04].
Contrary to findings in study 2 however, the interaction between time and social
identity was not significant. Thus, these results partly replicate the results of study 2
and do not support hypotheses concerning causal attribution to personality (H1, H2,
H5 and H6).
9 Comparing whether mean ratings changed between E1-E2 and E2-E3.
Fig. 4.2. Mean conduciveness as a function of
time and overall strategy

142
Appraisal of causal attribution to Production (artificial) social group
membership. Once more, results only partially replicate results of study 2. Similar to
study 2, there main effect overall strategy but in this study the effect was only
marginally significant [F (1,48)=3.84, p=.06, eta2=.07]. In line with results of study 2,
there was a significant main effect for time [F (2,96)=5.93, p<. 01, eta2=.11] and there
was a significant interaction between time and overall strategy [F (2,96)=9.98,
p<.001, eta2=.17]. As shown in Figure 4.3., and in line with study 2, the ratings for
causal attribution to Production (artificial) social group membership where higher
when the computer competed than when the computer collaborated. As in study 2,
none of the effects with social identity salience condition were significant. Thus,
taken together these results replicate study 2 and do not support the hypothesis made
about the impact of social identity salience on this appraisal (H7).
TIME
E3E2E1
Mea
n at
tribu
tion
to P
RO
D (a
rtific
ial)
outg
roup
mem
bers
hip 9
8
7
6
5
4
3
2
1
Overall strategy
compet/collab/collab
collab/compet/compet
Appraisal of causal attribution to Business student (real) social group
membership. There was a significant main effect for social identity [F (1,48)=5.19,
p<.05, eta2=.09], no significant main effect for overall strategy [F (1,48)=2.58, p=.11,
eta2=.05], a significant main effect for time [F (1.81,87.0310)=9.52, p<.01, eta2=.16], a
marginally significant interaction between time and overall strategy
[F(1.81,87.0311)=3.07, p=.06, eta2=.06], and a significant interaction between time,
10 Because of violation of sphericity the Huynh-Feldt Epsilon adjustment of df was used. 11 Because of violation of sphericity the Huynh-Feldt Epsilon adjustment of df was used.
Fig. 4.3. Mean attribution to production
(artificial) outgroup membership as a function
of time and overall strategy conditions

143
social identity and overall strategy [F (1.81,87.0312)=3.13, p<.05, eta2=.06]. Figures
4.4a. and 4.4b. illustrate the means of participants across the 3 events in time, as a
function of social identity condition and overall strategy condition. In the mostly
collaborative condition (see Fig. 4.4a.), repeated contrast analyses13 on time within
each social identity condition confirmed for participants in the high social identity
condition there was a significant decrease of ratings between E1 and E2 (i.e., which is
when the computer switched from competition to collaboration) [F (1,11)=10.38,
p<.01, eta2=.49] and no significant change between E2 and E3 (i.e., which in when the
computer remains in collaboration). For participants in the low social identity
condition, although there was also a tendency for a decrease between E1 and E2, only
the decrease between E2 and E3 was marginally significant [F (1,13)=4.37, p=.06,
eta2=.25]. Simple effects for social identity condition conducted within each event
revealed that participants in the low social identity condition gave significantly higher
ratings than participants in the high social identity condition only in E2 [F(1,25)=5.64,
p<.05, eta2=.19] (i.e., which is when the computer collaborated).
TIME
E3: collabE2: collabE1: compet
Mea
n at
tribu
tion
to B
usin
ess
stud
ent (
real
) out
grou
p m
embe
rshi
p
9
8
7
6
5
4
3
2
1
social id condition
high
low
12 Because of violation of sphericity the Huynh-Feldt Epsilon adjustment of df was used. 13 Comparing whether social identity salience condition effects changed between E1-E2 and E2-E3
Fig. 4.4a. Mean attribution to business student
(real) outgroup membership as a function of
time and social identity when the computer
mostly collaborated

144
TIME
E3: competE2: competE1: collab
Mea
n at
tribu
tion
to B
usin
ess
stud
ent (
real
) out
grou
p m
embe
rshi
p
9
8
7
6
5
4
3
2
1
social id condition
high
low
In the mostly competitive condition (see 4.4b.), simple effects for social identity
condition conducted within each event revealed that participants in the low social
identity condition gave significantly higher ratings than participants in the high social
identity condition but only in E1 [F (1,25)=7.43, p<.05, eta2=.24] (i.e., which is again
when the computer collaborated).
Taken together these results do not support the hypothesis that ratings of causal
attribution to the double outgroup’s social group memberships would be used more by
participants in the high social identity condition (H7). First, across social identity
conditions the ratings of causal attribution to the Business student (real) outgroup
membership were higher when the computer mostly competed. Second, across
overall strategy conditions low identifiers gave higher ratings than high identifiers.
Third, closer examination reveals that mean differences were significant for events
when the computer had collaborated (see mean differences for E2 and E3 in Fig.4.4a.,
and E1 in Fig.4.4b.). Altogether, these results seem to suggest that for low identifiers
the intergroup dichotomy of Psychology student (real) ingroup membership and the
Business student (real) outgroup memberships may have been particularly salient
when the other’s behavior was to collaborate. Finally, it should also be noted that for
participants in the high social identity condition, the only time ratings were just as
high than those of participants in the low social identity condition was in an event
when the computer competed (see means for E1, Fig. 4.4a.).
Fig.4.4b. Mean attribution to business student
(real) outgroup membership as a function of
time and social identity when the computer
mostly competed

145
3) Appraisal of incompatibility with norms of fairness and justice as
considered by self. Again, results only partially replicate results of study 2. Contrary
to study 2, the main effect for time was not significant, but in line with study 2 there
was a significant interaction between time and overall strategy [F (2,96)=19.79,
p<.001, eta2=.29]. As illustrated in Figure 4.5. and in line with predictions, across the
3 Events competition was considered as more unfair and unjust by self than
collaboration.
TIME
E3E2E1
Mea
n un
fairn
ess
and
inju
stic
e (b
y se
lf)
9
8
7
6
5
4
3
2
1
Overall strategy
compet/collab/collab
collab/compet/compet
Contrary to results for study 2, a significant main effect emerged for social identity
condition [F (1,48)=6.48, p<.05, eta2=.12], and the interaction between social identity
condition and overall strategy condition was marginally significant [F (1,48)=3.68,
p=.06, eta2=.07]. As illustrated in Figure 4.6a., in the mostly collaborative strategy,
differences between social identity conditions were not significant. Participants in
both conditions rated competition as more unfair and unjust as considered by self than
collaboration.
Fig. 4.5. Mean unfairness and injustice as
considered by self as a function of time and
overall strategy

146
TIME
E3: collabE2: collabE1: compet
Mea
n un
fairn
ess
and
inju
stic
e (b
y se
lf)
9
8
7
6
5
4
3
2
1
social id condition
high
low
TIME
E3: competE2: competE1: collab
Mea
n un
fairn
ess
and
inju
stic
e (b
y se
lf)
9
8
7
6
5
4
3
2
1
social id condition
high
low
In the mostly competitive condition, competition was also rated as more unjust and
unfair that collaboration (Fig. 4.6b.). However, simple effects indicated that there was
a significant main effect for social identity condition [F (1,24)=8.36, p<.01, eta2=.26]
indicating contrary to predictions (H8 and H9) that it was participants in the low
social identity condition that gave the higher ratings. Simple effects for social identity
condition conducted within each event showed that differences failed to reach
significance in E1 [F (1,24)=7.54, p=.07, eta2=.14], were significant in E2
[F(1,24)=8.48, p<.01, eta2=.26], and were not significant in E3 [F (1,24)=2.54, p=.12,
Fig. 4.6a. Mean unfairness and injustice as
considered by self as a function of time and
social identity when the computer mostly
collaborated
Fig. 4.6b. Mean unfairness and injustice as
considered by self as a function of time and
social identity when the computer mostly
competed

147
eta2=.10]. Thus, taken together these results replicate study 2 and do not support the
hypotheses concerning the impact of social identity salience on this appraisal (H8 &
H9).
Appraisal of incompatibility with norms of fairness and justice as considered
by other members of the R&D (artificial) ingroup. These results do no replicate
results of study 2. The only similar result was the significant interaction between time
and overall strategy [F (1.80,86.4714)=32.74, p<.001, eta2=.41]. As illustrated in
Figure 4.7., in replication of study 2 and as expected (H1 and H2), irrespective of
social identity and across the 3 events, competition was appraised as more unfair and
unjust as considered by other members of the R&D (artificial) ingroup than
collaboration.
TIME
E3E2E1
Mea
n un
fiarn
ess
and
inju
stic
e (b
y ar
tific
ial i
ngro
up)
9
8
7
6
5
4
3
2
1
Overall strategy
compet/collab/collab
collab/compet/compet
Contrary to results of study 2 however, there were significant main effects for social
identity condition [F (1,48)=7.66, p<.01, eta2=.14], and overall strategy [F
(1,48)=3.96, p<.05, eta2=.08]. As shown in Figures 4.8a. and 4.8b., and contrary to
predictions (H8 and H9) participants in the low social identity condition appraised
other’s strategies and in particular competition as more unfair and unjust as
considered by the R&D (artificial) ingroup, than participants in the high social
identity condition.
Fig. 4.7. Mean unfairness and injustice as
considered by R&D (artificial) ingroup as a
function of time and overall strategy condition

148
TIME
E3: collabE2: collabE1: compet
Mea
n un
fairn
ess
and
inju
stic
e (b
y R
&D
arti
ficia
l ing
roup
)
9
8
7
6
5
4
3
2
1
social id condition
high
low
TIME
E3: competE2: competE1: collab
Mea
n un
fairn
ess
and
inju
stic
e (b
y R
&D
arti
ficia
l ing
roup
) 9
8
7
6
5
4
3
2
1
social id condition
high
low
Appraisal of incompatibility with norms of fairness and justice as considered
by other members of the Psychology (real) ingroup. These results partially replicate
the patterns observed for appraisal of unfairness and injustice as considered by self
and the R&D (artificial) ingroup. Again there was a significant interaction between
time and overall strategy [F (2,96)=6.62, p<.01, eta2=.12]. As illustrated in Figure
4.9., as expected (H1 and H2), irrespective of social identity and across the 3 events,
competition was appraised as more unfair and unjust as considered by other members
of the ingroup than collaboration.
10. Because of violation of sphericity the Huynh-Feldt Epsilon adjustment of df was used.
Fig. 4.8a. Mean unfairness and injustice as
considered by other R&D (artificial) ingroup as
a function of time when the computer mostly
collaborated
Fig. 4.8b. Mean unfairness and injustice as
considered by other R&D (artificial) ingroup as
a function of time when the computer mostly
competed

149
TIME
E3E2E1
Mea
n un
fairn
ess
and
inju
stic
e (b
y P
scho
logy
stu
dent
real
ingr
oup)
9.0
8.0
7.0
6.0
5.0
4.0
3.0
2.0
1.0
Overall strategy
compet/collab/collab
collab/compet/compet
There were significant main effect for social identity [F (1,48)=4.71, p<.05, eta2=.09],
but the effect for overall strategy was not significant [F (1,48)=2.39, p=.13,
eta2=.05]. As shown in Figures 4.10a. and 4.10b., contrary to predictions (H8 and H9)
participants in the low social identity condition appraised other’s strategies and in
particular competition as more unfair and unjust as considered by the Psychology
students (real) ingroup, than participants in the high social identity condition.
TIME
E3: collabE2: collabE1: compet
Mea
n un
fairn
ess
and
inju
stic
e (b
y P
sych
olog
y st
uden
t rea
l ing
roup
) 9
8
7
6
5
4
3
2
1
social id condition
high
low
Fig. 4.9. Mean unfairness and injustice as
considered by other psychology students (real)
ingroup as a function of time and overall
strategy condition
Fig. 4.10a. Mean unfairness and injustice as
considered by other psychology students (real)
ingroup as a function of time when the
computer mostly collaborated
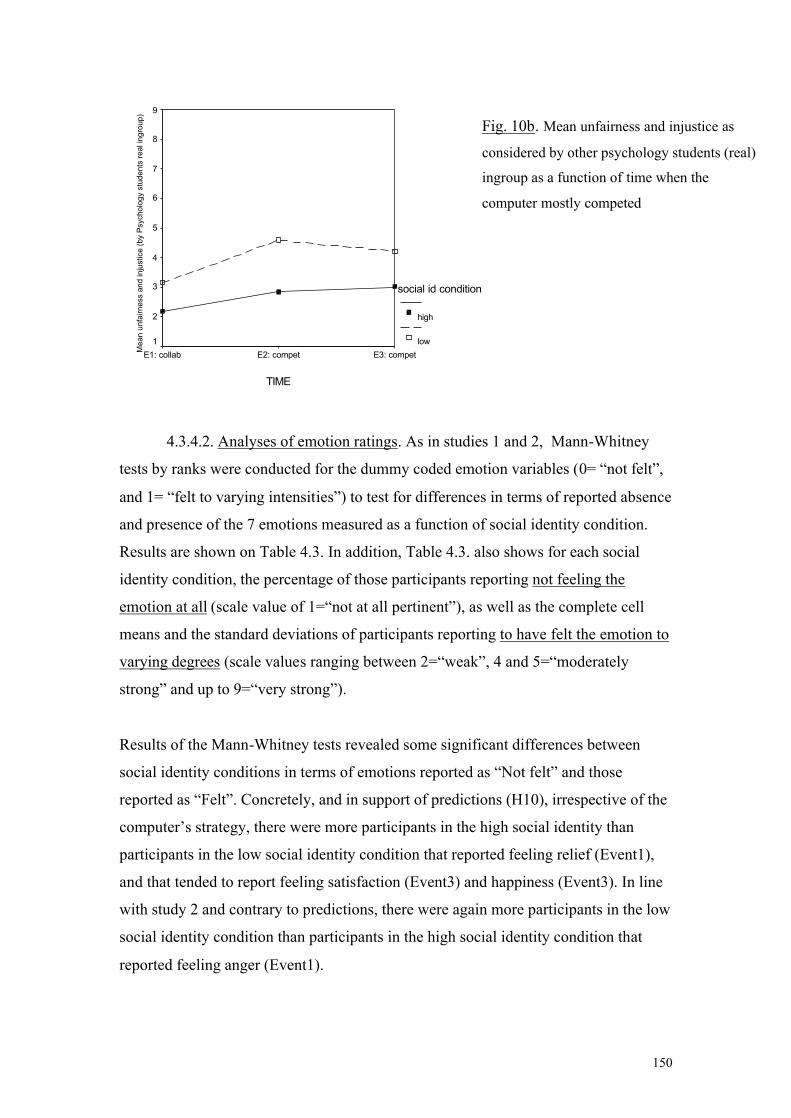
150
TIME
E3: competE2: competE1: collabMea
n un
fairn
ess
and
inju
stic
e (b
y P
sych
olog
y st
uden
ts re
al in
grou
p)
9
8
7
6
5
4
3
2
1
social id condition
high
low
4.3.4.2. Analyses of emotion ratings. As in studies 1 and 2, Mann-Whitney
tests by ranks were conducted for the dummy coded emotion variables (0= “not felt”,
and 1= “felt to varying intensities”) to test for differences in terms of reported absence
and presence of the 7 emotions measured as a function of social identity condition.
Results are shown on Table 4.3. In addition, Table 4.3. also shows for each social
identity condition, the percentage of those participants reporting not feeling the
emotion at all (scale value of 1=“not at all pertinent”), as well as the complete cell
means and the standard deviations of participants reporting to have felt the emotion to
varying degrees (scale values ranging between 2=“weak”, 4 and 5=“moderately
strong” and up to 9=“very strong”).
Results of the Mann-Whitney tests revealed some significant differences between
social identity conditions in terms of emotions reported as “Not felt” and those
reported as “Felt”. Concretely, and in support of predictions (H10), irrespective of the
computer’s strategy, there were more participants in the high social identity than
participants in the low social identity condition that reported feeling relief (Event1),
and that tended to report feeling satisfaction (Event3) and happiness (Event3). In line
with study 2 and contrary to predictions, there were again more participants in the low
social identity condition than participants in the high social identity condition that
reported feeling anger (Event1).
Fig. 10b. Mean unfairness and injustice as
considered by other psychology students (real)
ingroup as a function of time when the
computer mostly competed

151
Table 4.3. Presence and intensity of emotions in response to collaboration and competition by social identity condition
High Social ID Low Social ID Mann-Whitney Test a
not felt emotion felt not felt emotion felt % M (SD) % M (SD) Z
Computer Collaborates Surprise Relief Satisfaction Happiness Frustration Irritation Anger
0 0
8.30 8.30 66.70 66.70 100.00
4.25 5.42 7.55 6.64 3.00 4.00
0
1.86 1.88 .82 1.57 .82 2.31
0
0 0 0 0
64.30 71.40 71.40
4.36 6.07 7.07 7.00 3.60 4.50 3.00
1.50 1.38 1.98 1.66 1.52 1.00 1.41
-.66 -2.08* -.35 -1.40 -.13 -.39
-2.25* Computer Competes
EVEN
T 1
Surprise Relief Satisfaction Happiness Frustration Irritation Anger
16.70 16.70 33.30 16.70 8.30 8.30 41.70
4.80 3.30 4.88 3.60 4.36 4.91 3.86
1.93 1.06 1.46 1.43 1.86 1.92 1.35
28.60 64.30 50.00 57.10 14.30 14.30 7.10
5.30 3.20 3.14 3.67 5.58 6.00 4.69
1.95 2.17 2.19 2.16 2.50 1.65 2.06
Computer Collaborates Surprise Relief Satisfaction Happiness Frustration Irritation Anger
0 0 0 0
66.70 58.30 91.70
5.42 6.42 7.42 6.58 2.75 2.80 3.00
2.07 1.31 1.08 1.38 .96 .84 .00
7.10 0 0 0
57.10 50.00 85.70
4.23 6.14 6.93 6.79 3.17 2.57 3.00
2.20 2.28 2.16 1.85 1.60 .79 1.41
-.05 -.11 -.72 -.27 -.44 -.09 -.34
Computer Competes
EVEN
T 2
Surprise Relief Satisfaction Happiness Frustration Irritation Anger
8.30 41.70 33.30 41.70 16.70 8.30 25.00
4.91 3.57 3.88 4.71 4.70 5.27 4.11
1.87 1.72 1.96 2.29 1.57 1.90 1.69
0 42.90 50.00 35.70 14.30 14.30 21.40
5.43 3.50 3.71 3.33 5.17 6.67 5.91
2.17 1.41 1.60 1.12 2.33 1.92 2.26
Computer Collaborates Surprise Relief Satisfaction Happiness Frustration Irritation Anger
0 0 0 0
75.00 50.00 91.70
5.83 6.67 7.33 6.58 3.33 3.17 2.00
2.08 1.44 1.61 2.35 1.53 1.60 .00
21.40 14.30 14.30 7.10 42.90 50.00 57.10
5.27 5.58 6.33 6.31 3.75 4.29 4.00
1.95 2.50 2.15 2.25 2.19 2.36 2.53
-.53 -.64
-1.67+ -1.80+
-.98 -.05 -.80
Computer Competes
EVEN
T 3
Surprise Relief Satisfaction Happiness Frustration Irritation Anger
25.00 41.70 25.00 8.30 8.30 8.30 16.70
5.11 3.29 3.89 3.27 5.45 5.36 4.50
2.15 1.60 1.96 1.56 1.75 1.80 1.84
14.30 42.90 50.00 35.70 14.30 7.10 28.60
5.17 3.38 2.71 2.78 5.75 6.08 6.20
1.75 1.19 .76 .67 1.14 1.98 .92
Note. * p<.05, ** p<.001; % not felt referred to the percentage of participants reporting a scale value of “1=not at all pertinent”, emotion felt referred to emotions felt to varying intensities. Numbers in bold indicate the 3 highest percentage of emotions not felt per cell. a=Mann-Whitney Tests by Ranks were conducted for dummy coded emotion variables so that 0=“not felt” and 1=“felt”.

152
Examination of percentages of emotions “Not felt”15 are similar to those reported in
study 2 and support hypotheses (H1 and H2) showing that when the computer
collaborated participants reported feeling positive emotions (i.e., relief, satisfaction
and happiness) to varying degrees more than negative emotions (i.e., frustration,
irritation and anger). And, when the computer competed the reverse occurred. “Not
Felt” rates for surprise were similarly low when the computer collaborated and
competed in both social identity conditions with one exception. In the last event,
when the computer collaborated, “Not Felt” rates for surprise were higher for
participants in the low social identity condition (21.40%) than for participants in the
high social identity condition (0%).
Furthermore, and again in replication of results for study 2, visual examination of the
actual number of participants reporting intensities above the value of 4 (i.e., anchored
by the label of “moderate intensity”) in each Event (see Figures 4.11a., 4.11b. and
4.11c.) reveal that a greater number of participants reported positive emotions of
stronger intensity when responding to collaboration, and negative emotions of
stronger intensity when responding to competition.
In light of these results and in line with study 2, it was decided to conduct analyses of
emotion ratings including all cases, and then to compare the results with the results of
analyses of variables excluding cases when the emotion was reported as not felt.
15 Irrespective of social identity condition and across the 3 events

153
competecollaborate
N o
f par
ticip
ants
ratin
g em
otio
n >
4="m
oder
ate
inte
nsity
"
100
80
60
40
20
0
Emotion felt >4
Angry
Irritated
Frustrated
Surprised
Satisfied
Happy
Relieved
competecollaborate
N o
f par
ticip
ants
ratin
g em
otio
n >
4="m
oder
ate
inte
nsity
"
100
80
60
40
20
0
Emotions felt >4
Angry
Irritated
Frustrated
Surprised
Happy
Satisfied
Relieved
competecollaborate
N o
f par
ticip
ants
ratin
g em
otio
n >
4="m
oder
ate
inte
nsity
"
100
80
60
40
20
0
Emotions felt >4
Angry
Irritated
Frustrated
Surprised
Happy
Satisfied
Relieved
Fig.4.11a. Number of
participants rating emotions
above scale value of 4 =
“moderate intensity” in Event 1
Fig.4.11b. Number of
participants rating emotions
above scale value of 4 =
“moderate intensity” in Event 2
Fig.4.11c. Number of
participants rating emotions
above scale value of 4 =
“moderate intensity” in Event 3

154
As in study 2, it was decided to reduce the number of emotion variables. Again,
because the variables included 3 positive emotions (relief, satisfaction and happiness),
3 negative emotions(frustration, irritation and anger), and surprise it was decided to
conduct confirmatory principal components analyses16. Thus, for all analyses the three
factor solution was preferred. The cut-off criterion to determine the adequacy of the
factors included having eigenvalues higher than 1 and the visual inspection of the
scree plot. Results, including loadings, and coefficient alphas computed for emotions
loading together, are shown on Table 4.4.
Table 4.4. Results of the Principal-Components Analysis on the 7 emotions
Factor loadings
Emotion Event 1 Event 2 Event3
Factor 1: positive emotions
Relief Satisfaction
Happiness
.92 .83 .86
(α=.95)
.90 .88 .86
(α=.96)
.73 .85 .80
(α=.94)
Factor 2: negative emotions
Frustration Irritation
Anger
.88 .79 .84
(α=.91)
.84 .73 .90
(α=.95)
.83 .81 .88
(α=.93)
Factor 3: surprise
Surprise
.99
.99
.98
In replication to study 2, the first factor included the 3 positive emotions and the
second to the 3 negative emotions. Again surprise always loaded separately. Alphas
calculated among the 3 positive and among the 3 negative emotions were always
extremely high. Based on these results it was decided to combine relief, satisfaction
and happiness (by computing the mean for these 3 emotions within each Event) to a
new variable called “positive emotions”. Similarly, it was decided to combine
frustration, irritation, and anger (again by computing the mean for these 3 emotions
16 With varimax rotation to simply factors by maximizing the variance of the loadings within factors.

155
within each Event) to a new variable called “negative emotions”. Surprise was always
analyzed separately.
As in study 2, when all cases were included in the analyses, three 2 X 2 X3 (mixed
design) repeated measures ANOVAs were conducted: One on “positive emotions”,
one on “negative emotions” and one on “surprise”. In these analyses social identity
salience condition (high or low social identity salience) and overall strategy condition
(mostly competition: E1 collab, E2 compet, E3 compet, or mostly collaboration: E1
compet, E2 collab, E3 collab) were the between subjects factors, and time (E1, E2,
and E3) was the within subjects factor. As in study 2, when participants not feeling
the emotion were excluded from the analyses, the drop of cases per cell on “positive
emotions” and “negative emotions” variables was sometimes too high leading to an
unbalanced design. Thus, as in study 2 it was not possible to simply re-conduct the
repeated measures ANOVAs on this sub-sample. Therefore, it was decided to conduct
instead separate ANOVAs within each of the 3 Events in time. It should be noted that
in these analyses, social identity salience condition (high or low social identity
salience) and type of strategy condition (whether the computer collaborated or
competed for that specific event) were the between subjects factors. Cell means and
standard deviations for emotions with all cases in are presented in Appendix C.4.2.
The presentation of result will be organized as follows. First, analyses with all cases
in will be reported: 1) positive emotions, 2) negative emotions, and 3) surprise.
Second, the analyses conducted after excluding participants not feeling the emotion
will be reported: 1) positive emotions, 2) negative emotions, and 3)surprise.
Analyses with all cases
1) Positive emotions. These results only partially replicate those of study 2.
There was again a significant main effect for overall strategy [F(1,48)=16.28, p<.001,
eta2=.25], and a significant interaction between time and overall strategy
[F(2,96)=106.97, p<.001, eta2=.69] (see Fig.4.12.). Once more, result confirm (see
hypotheses H1 and H2) that, irrespective of overall strategy and across events in time
the negotiation was successful in inducing stronger positive emotions for
collaboration than for competition.

156
Although participants in the high social identity condition tended to give higher
intensity ratings on positive emotions (M=4.80, SD=.24) than participants in the low
social identity condition (M=4.22, SD=.22) in this study, differences were not
significantly different [F(1,48)=3.18, p=.08, eta2=.06] (see Fig.4.14).
TIME
E3E2E1
Mea
n in
tens
ity "p
ositi
ve e
mot
ions
"
9
8
7
6
5
4
3
2
1
Overall strategy
compet/collab/collab
collab/compet/compet
2) Negative emotions. These results partially replicated results of study 2.
There was again a significant main effect for overall strategy [F(1,48)=10.65, p<.01,
eta2=.18], and a significant interaction between time and overall strategy
[F(2,96)=54.86, p<.001, eta2=.53] (see Fig. 4.13.). Thus, once more result confirm
(see hypotheses H1 and H2) that, irrespective of overall strategy and across events in
time the negotiation was successful in inducing stronger negative emotions for
competition than for collaboration. Contrary to study 2 however, in this study
differences between social identity conditions were significant but in the opposite
direction than predicted (H10). A significant main effect for social identity
[F(1,48)=3.91, p<.05, eta2=.07] (see Fig. 4.14.), showed that participants in the low
social identity condition gave higher intensity ratings on negative emotions (M=3.52,
SD=.24) than participants in the high social identity condition (M=2.87, SD=.24).
3) Surprise. As in study 2, none of the main effects were significant. Contrary
to study 2 the time and overall strategy interaction was not significant.
Fig. 4.12. Mean intensity of positive
emotion variable as a function of time and
overall strategy condition
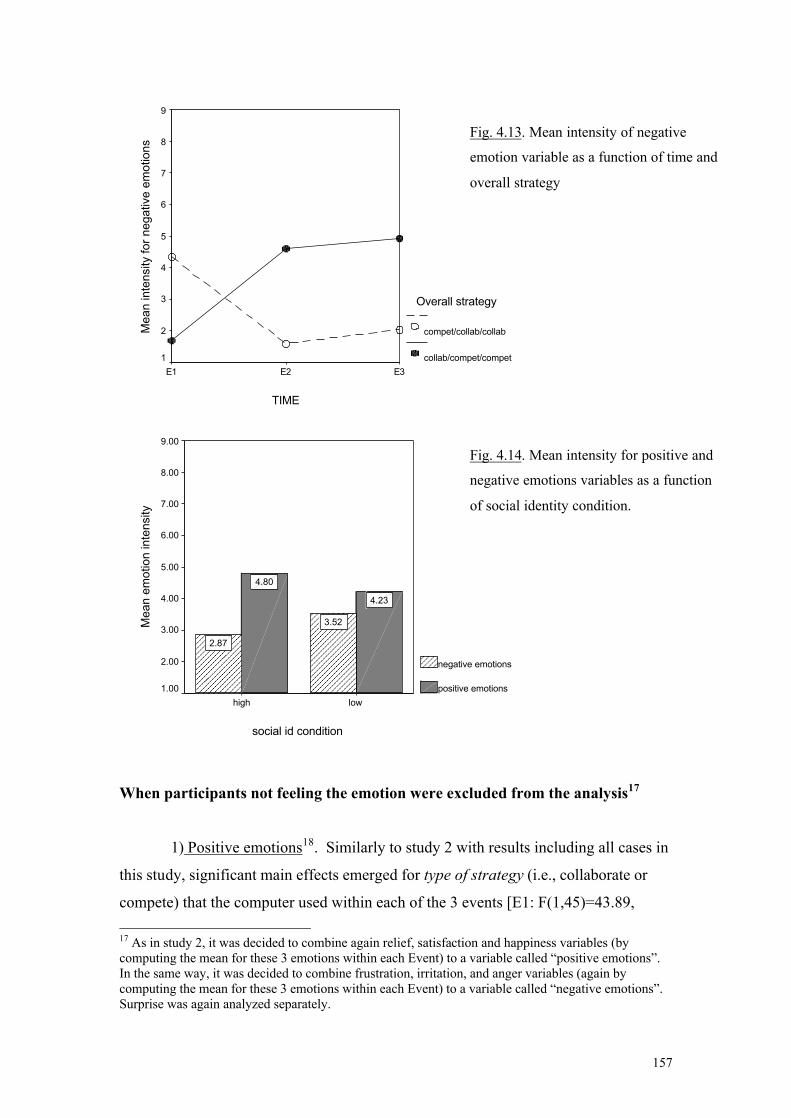
157
TIME
E3E2E1
Mea
n in
tens
ity fo
r neg
ativ
e em
otio
ns
9
8
7
6
5
4
3
2
1
Overall strategy
compet/collab/collab
collab/compet/compet
social id condition
lowhigh
Mea
n em
otio
n in
tens
ity
9.00
8.00
7.00
6.00
5.00
4.00
3.00
2.00
1.00
negative emotions
positive emotions
4.23
4.80
3.52
2.87
When participants not feeling the emotion were excluded from the analysis17
1) Positive emotions18. Similarly to study 2 with results including all cases in
this study, significant main effects emerged for type of strategy (i.e., collaborate or
compete) that the computer used within each of the 3 events [E1: F(1,45)=43.89, 17 As in study 2, it was decided to combine again relief, satisfaction and happiness variables (by computing the mean for these 3 emotions within each Event) to a variable called “positive emotions”. In the same way, it was decided to combine frustration, irritation, and anger variables (again by computing the mean for these 3 emotions within each Event) to a variable called “negative emotions”. Surprise was again analyzed separately.
Fig. 4.13. Mean intensity of negative
emotion variable as a function of time and
overall strategy
Fig. 4.14. Mean intensity for positive and
negative emotions variables as a function
of social identity condition.

158
p<.001, eta2=.52], [E2: F(1,44)=42.03, p<.001, eta2=.51], [E3: F(1,46)=49.85, p<.001,
eta2=.54] confirming the negotiation induced stronger positive emotions for
collaboration than for competition (see Fig.4.15). No other effects were significant.
2) Negative emotions19. Again in line with study 2 and with results (all cases)
in this study, these analyses also showed significant main effects for type of strategy
(i.e., collaborate or compete) that the computer used within each of the for the 3
events [E1: F(1,34)=5.66, p<.05, eta2=.16], [E2: F(1,38)=22.67, p<.001, eta2=.40],
[E3: F(1,38)=14.93, p<.001, eta2=.30] confirming that the negotiation induced
stronger negative emotions for competition than for collaboration (see Fig.4.16.). No
other effects were significant.
6.56.7
6.37
3.38
2.57
3.383.43 3.53
3.06
4.865.2
5.4
2
3
4
5
6
7
8
9
positive E1 positive E2 positive E3 negative E1 negative E2 negative E3
collaborate compete
18N E1=45 (22 high id/23low id); N E2 =44 (20 high id/24 low id); N E3 =46(23 high id/23 low id) 19N E1= 34 (16 high id/18 low id); N E2 =38 (16 high id/22 low id); N E3 = 38 (17 high id/21 low id)
Fig. 4.15. Mean intensity for positive and negative emotion variables (after participants not feeling
the emotion where excluded) as a function of event strategy

159
5.12
5.63
5.14
3.99 4.034.27
5.27 5.21
4.574.81
4.38
4.98
2
3
4
5
6
7
8
9
positive E1 positive E2 positive E3 negative E1 negative E2 negative E3
high low
3) Surprise20. Contrary to study 2, none of the effects were significant (means
are depicted in Fig. 4.17.)
4.5
5.185.52
4.75 4.855.22
2
3
4
5
6
7
8
9
Surprise E1 Surprise E2 Surprise E3
high low
20 N E1= 85 (42 high id/43 low id); N E2 = 88 (45 high id/43 low id); N E3 = 84 (43 high id/41 low id)
Fig. 4.16. Mean intensity for positive and negative emotion variables (after participants not feeling the
emotion where excluded) as a function of social identity condition
Fig. 4.17. Mean intensity for surprise (after participants not feeling the emotion where excluded) as
a function of social identity salience condition

160
4.3.4.3. Mediation analyses. In this experiment, results indicated that social
identity condition had some indirect effect through overall strategy condition and time
on appraisal of causal attribution to Business student (real) outgroup membership (i.e.,
effects in the mostly collaborative condition were significant only in E2, and in the
mostly competitive condition they were significant only in E1). Social identity
condition had a significant main effect on appraisal of unfairness and injustice as
perceived by self, by the R&D (artificial) ingroup, and by the Psychology student
(real) ingroup. There was also a significant main effect of social identity condition on
the negative emotions variable. Thus, theoretically it would make sense to examine
whether appraisal of unfairness and injustice as perceived by self, by the R&D
(artificial) ingroup, and by the Psychology student (real) ingroup mediate the effect of
social identity salience on the negative emotions variables in Events 1, 2 and 3.
However, examination of bivariate correlations revealed that social identity salience
condition21 was not significantly related to the negative emotions variable across
events (E1r=-.16, p=.25; E2 r=-.12, p=.38; E3 r=-.15, p=.28). Consequently,
mediation analyses were not conducted.
As in study 2, hierarchical regression analyses with the 11 appraisal dimensions
entered together in step 1, and social identity condition22 added to the equation in step
2 were conducted to explore to what extent social identity condition contributed to the
prediction of the reported emotions over an above appraisals. The only analysis in
which social identity condition contributed significantly was in the prediction of
positive emotions reported in Event 3. Results of the full model, including all
predictors are shown in Table 4.5. The first rows show result of the hierarchical
regression of the appraisal dimensions on the positive emotions variable for the full
sample (raw values from 1 to 9). The second rows show the results of the hierarchical
regressions only for participants reporting to have felt the positive emotions (intensity
values from 2 to 9).
21 Dummy coded so that 0= low social identity condition, and 1=high social identity condition. 22 Dummy coded so that 0= low social identity condition, and 1=high social identity condition.

161
Table 4.5. Hierarchical regression analysis summary for appraisals and social identity condition predicting positive emotions (Event 3) β23 R2 ∆ R2 STEP 1 Pleasant
Raw Intensity
.47**
.48**
.77**
.79**
Conducive Raw
Intensity
.32* .35*
Important Raw
Intensity
.09 .00
Attrib. Personality Raw
Intensity
.03 .11
Attrib. artif Outgroup Membership Raw
Intensity
.22+ .24*
Attrib. real Outgroup Membership Raw
Intensity
-.09 -.05
Intentional Raw
Intensity
.10 .11
Controllable Raw
Intensity
.01 .10
Unfair/Unjust (self) Raw
Intensity
.02 .13
Unfair/Unjust artificial Ingroup Raw
Intensity
-.33+ -.34+
Unfair/Unjust real Ingroup Raw
Intensity
.03 -.05
STEP 2 Social Identity
Raw Intensity
.16*
.18*
.79**
.82**
.02*
.03*
Note. * p<.05, ** p<.001. Raw = betas for regression of appraisal dimensions on positive emotions (raw values 1 to 9, N=52) from 1to 9; Intensity =betas for regression of appraisal dimensions on positive emotions (intensity values 2 to 9, N=46).
Examination of coefficients revealed that results in both samples were similar. In both
samples, results show strong and significant R2 for the complete equation in step 1
with the 11 appraisal dimensions, and in step 2 when social identity condition was
entered. More importantly, when social identity condition was added to the equation,
there was again a sizeable increase in R2 and significant beta weights were observed.
Thus, once more, adding social identity condition significantly improved prediction of
reported positive emotions (in this study in Event 3). In line with results for study 2,

162
pleasantness and conduciveness were by far the most important appraisal predictors
(and in the expected directions) for positive emotions. In this study, the Beta for
appraisal of causal attribution to Production (artificial) outgroup membership was
significant and loaded positive indicating higher ratings for participants in the high
social identity condition. Unexpectedly, Beta for appraisal of unfairness and injustice
as considered by the R&D (artificial) ingroup was also significant and loaded
negatively indicating higher ratings for participants in the low social identity
condition. Betas for social identity condition were positive, confirming that it was
participants in the high social identity condition that reported stronger positive
emotions.
4.3.4.4. Additional analyses to explore the potential bias of number of points
gained. As in study 2, the potential bias on participant’s appraisal and emotion
responses caused by the information received about the number of points gained by
them and by the “other” was explored. Table 4.6. summarizes the four potential
outcomes as a function of computer’s manipulated strategy and participants’ actual
choice of strategy, and describes the percentage of participants observed in each
outcome situation across the 3 events.
In line with study 2, irrespective of social identity condition and of computer’s
strategy and as would be expected in the PDG, visual inspection of the percentage of
participants’ responses clearly shows that the dominant strategy was competition. In
both social identity conditions, the percentage of participants using competition
systematically increased from Event 1 to Event 3. Therefore, again the majority of
participants found themselves in 2 types of outcome situations: winning 3 points and
the computer 0 points when the computer collaborated (DC), and winning 1 point and
the computer 1 point when the computer competed (DD).
23 Standardized Betas reported are those of step 2.

163
Table 4.6. Percentage (and number of cases) of participants for each of the 4 relative value outcomes situation across the 3 events Participants’ Choice of Strategy Collaboration (C) Competition (D) Computer’s Strategy High Low High Low
(CD) “I win 0 points and the other 3”
(DD) “We both win 1 point”
Competition (D) Event1 Event 2 Event 3
58.30% (7) 58.30% (7)
0%
57.10% (8) 34.70% (5)
0%
41.70% (5) 41.70% (5) 100% (12)
42.90% (6) 64.30% (9) 100% (14)
(CC)
“We both win 2 points” (DC)
“I win 3 points and the other 0” Collaboration (C)
Event1 Event 2 Event 3
41.70% (5) 25.00% (3) 8.30% (1)
57.10% (8) 42.90% (6) 7.10% (1)
58.30% (7) 75.00% (9) 91.70% (11)
42.90% (6) 57.10% (8) 92.90% (13)
As in study 2, a repeated measures ANOVA was run on the number of points gained
by participant for each of the 3 decision events with social identity condition and
overall strategy condition as between subjects factors and time as the within subjects
factor. Replicating results of study 2, there were no significant effects for social
identity condition. Again, given that the dominant strategy was competition there was
main effect for overall strategy indicating that mean number of points gained was
significantly higher for participants having played against a highly collaborative
computer (compete, collab, collab) (M=2.92, SD=0.27) than against a highly
competitive computer (collab, compete, compete) (M=1.00, SD=0) [F(1,48)=83.68,
p<.001, eta2=.63]. There was a significant interaction between time and overall
strategy [F(2,96)=417.77, p<.001, eta2=.90] that replicates the interaction observed in
study 2 (see Fig.4.18).
TIME
E3E2E1
Mea
n nu
mbe
r of p
oint
s ga
ined
by
parti
cipa
nt
3
2
1
0
Overall strategy
compet/collab/collab
collab/compet/compet
Fig. 4.18. Mean number of points gained by participants across events

164
However, in this study it was statistically impossible to compare appraisal and emotion
responses of the full sample with that of “competitors”. In this study only 28.30%
systematically competed (N=15; per cell: high identity/mostly competes n=4; high
identity/mostly collaborates n=3; low identity/mostly competes n=5; low
identity/mostly collaborates n=3) and not one person systematically collaborated. In
study 2, 43.85% of the sample systematically competed (N= 40; per cell: high
identity/mostly competes n=8; high identity/mostly collaborates n=13; low
identity/mostly competes n=8; low identity mostly/collaborates n=11) while only 1
person systematically collaborated.
4.3.4.5. Analyses comparing results of study 2 and study 3. These analyses
were guided by the following questions: 1) To what extent did the social identity
salience and overall strategy experimental conditions lead to different appraisal and
emotion results in study 2 than in study 3 (as predicted, see H11)? 2) Is there any
evidence that the modifications conducted for the social identity salience manipulations
between study 2 and study 3 had an effect on perception of identification? and 3) Was
the drop in the percentage of competitors observed between study 2 and study 3
significant?
Independent samples t-test were conducted to test for differences between studies on
appraisals, emotions and identification. Chi-square tests were conducted to test for
differences between studies on percentage of participants’ opting for competition and
collaboration as a function of overall strategy and social identity salience condition.
Figures 4.19a., 4.19b., and 4.20a. and 4.20b. depict cell means for each appraisal and
emotion variable (i.e., averaged across events in time). In addition, graphs depict the
means for the only social identity manipulation check question that was identical in the
two studies (i.e., “During this study, to what extent did you identify with the R&D
department?”).

165
1
2
3
4
5
6
7
8
9
identified R&D Conducive Caused byother's
personality
Caused byother's
outgroupmembership
Unfair andUnjust (Self)
Unfair andUnjust
(ingroup)
PositiveEmotions
PositiveEmotions Felt
NegativeEmotions
NegativeEmotions Felt
Surprise Surprise Felt
high ID (Study 2 n=24) high ID (Study 3 n=12)
1
2
3
4
5
6
7
8
9
Identified R&D Conducive Caused byother's
personality
Caused byother's
outgroupmembership
Unfair andUnjust (Self)
Unfair andUnjust
(Ingroup)
PositiveEmotions
PositiveEmotions Felt
NegativeEmotions
NegativeEmotions Felt
Surprise Surprise Felt
high ID (Study 2 n=23) high ID (Study 3 n=12)
Fig.4.19a. Mean identification with R&D, appraisals and emotions as reported by participants in the high social identity and mostly collaborative condition (studies 2 and 3)
Fig.4.19b. Mean identification with R&D, appraisals and emotions as reported by participants in the high social identity and mostly competitive condition (studies 2 and 3)

166
1
2
3
4
5
6
7
8
9
Identified R&D Conducive Caused byother's
personality
Caused byother's
ougroupmembership
Unfair andUnjust (Self)
Unfair andUnjust
(Ingroup)
PositiveEmotions
PositiveEmotions Felt
NegativeEmotions
NegativeEmotions Felt
Surprise Surprise Felt
low ID (Study 2 n=20) low ID (Study 3 n=14)
Fig.4.20a. Mean identification with R&D, appraisals and emotions as reported by participants in the low social identity and mostly collaborative condition (studies 2 and 3)
1
2
3
4
5
6
7
8
9
Identified R&D Conducive Caused byother's
personality
Caused byother's
outgroupmembership
Unfair andUnjust (Self)
Unfair andUnjust
(Ingroup)
PositiveEmotions
PositiveEmotions Felt
NegativeEmotions
NegativeEmotions Felt
Surprise Surprise Felt
low ID (Study 2 n=24) low ID (Study 3 n=14)
Fig.4.20b. Mean identification with R&D, appraisals and emotions as reported by participants in the low social identity and mostly competitive condition (studies 2 and 3)

167
Appraisals. For participants in the high social identity condition, there were
significant differences between studies on appraisal of causal attribution to outgroup.
In the mostly collaborative condition (see Fig. 4.19.) [t = 2.39, ptwo-tailed <.05],
participants rated this appraisal higher in study 2 (M=6.35, SD=1.57) that in this study
(M=5.05, SD=1.45). And in the mostly competitive condition (see Fig. 4.21.), [t =
2.39, ptwo-tailed <.05], participants also rated this appraisal higher in study 2 (M=6.72,
SD=.79) that in this study (M=5.55, SD=2.21). Moreover, for participants in the
mostly competitive condition (also see Fig. 4.21.) there were also significant
differences between studies on appraisal of unfairness and injustice as considered by
other ingroup members [t = 2.50, ptwo-tailed <.05]. Participants had rated this appraisal
higher in study 2 (M=4.74, SD=1.59) that in this study (M=3.33, SD=1.55). Although
participants in the mostly collaborative condition (see Fig. 4.19) also rated this
appraisal higher in study 2 (M=4.33, SD=1.93) that in this study (M=3.19, SD=1.53),
the differences were not significant [t = 1.78, ptwo-tailed =.09]. For participants in the
low social identity condition, the only significant difference occurred in the mostly
competitive condition (see Fig. 4.22.) on appraisal of unfairness and injustice as
appraised by self [t = -.2.52, ptwo-tailed <.05]. Participants rated this appraisal higher in
this study (M=4.31, SD=1.59) that in study 2 (M=2.97, SD=1.57). Although they also
rated appraisal of unfairness and injustice as considered by other ingroup members
higher in this study (again see Fig. 4.22) (M=5.24, SD=1.59) that in study 2 (M=4.18,
SD=1.90) differences were not significant [t = -1.75, ptwo-tailed =.09].
Emotions. There were no significant differences on emotions between studies.
Identification with R & D. The only significant difference between the mean
identification with R&D reported in study 2 and this study occurred for participants in
the high social identity salience and mostly collaborative condition [t = 2.59, ptwo-tailed
<.05]. This result shows that in opposition to what was expected, participants rated
identification with R&D stronger in study 2 (M=7.17, SD=1.58) than in this study
(M=5.75, SD=1.48).

168
Percentage of participants opting for collaboration and competition. The
results of Chi-square tests showed that for participants in the high social identity
condition and in the mostly competitive strategy, there was a marginally significant
drop in competition rates (study 3) in Event 2 [x2(1,35)=3.51, ptwo-tailed=.06]. None of
the other differences were significant. Figures 4.21.depict the percentage rates of
participants opting for competition as a function of overall strategy and social identity
salience condition.
0.00%
10.00%
20.00%
30.00%
40.00%
50.00%
60.00%
70.00%
80.00%
90.00%
100.00%
collab compet compet compet collab collab
High compete (study 2)High compete (study 3)Low compete (study 2)Low compete (study 3)
Fig.4.21a. Percentage of participants opting for competition as a function of overall strategy and social identity salience condition

169
4.4. Discussion
This study attempted to replicate the findings of study 2, and featured modifications to
the social identity salience manipulations aimed at enhancing the magnitude of the
effects. In this study participants in the high social identity condition were primed to
perceive the negotiation task as an intergroup interaction between a double ingroup
(R&D and psychology students) and a double outgroup (Production and Business
students). As in study 2, participants in low social identity condition were primed to
perceive the negotiations as an interpersonal interaction.
First, results pertaining to the appraisal patterns and emotions expected to
collaboration and competition (H1 and H2) are compared to those of study 2. Second,
results concerning the impact of social identity on appraisal (H3 to H9) and emotion
responses (H10) are compared to those of study 2. Thirdly, the results for the test of
the mediation hypotheses for appraisal will be discussed. Finally, some alternative
explanations are proposed for the results of this study and some general conclusions
are drawn. Table 4.7 presents a summary of the results and of the hypotheses for this
study.
4.4.1. Appraisal and emotion responses to other’s choice to collaborate and to
compete
In replication of findings in study 2, other’s choice to compete (H1) was successful
again in evoking appraisals of low conduciveness to goals and high unfairness and
injustice, and in inducing stronger intensity negative emotions such as frustration,
irritation and anger. Similarly, other’s choice to collaborate (H2) was again successful
in evoking appraisals of high conduciveness and low unfairness and injustice, and in
inducing stronger intensity positive emotions such as relief, satisfaction and
happiness. Similarly to study 2, others’ choice to compete (i.e., negative act) did not
lead to the predicted higher appraisals of causal attribution due to personality (i.e.,
internal attribution) than other’s choice to collaborate. Moreover, participants in this
study also tended to give higher ratings to appraisal of causal attribution to outgroup
memberships than to appraisal of causal attribution to personality.

170
Table 4.7. Summary of results and hypotheses for study 3 MEASURE HYPOTHESES STUDY 3
H1
COMPETES
PARTLY (+ ) lower conduciveness to goals (ns) higher attribution to personality (+) higher unfairness and injustice (+) negative emotions>positive emotions.
APPRAISAL PATTERNS
AND EMOTIONS EXPECTED
H2
COLLABORATES
PARTLY (+) higher conduciveness to goals (ns) lower attribution to personality (+) lower unfairness and injustice (+) positive emotions>negative emotions.
H3 COMPETES
NO (ns)
CONDUCIVENESS H4 COLLABORATES
NO (ns)
H5 COMPETES
NO (ns)
CAUSAL ATTRIBUTION TO PERSONALITY
H6 COLLABORATES
NO (ns)
CAUSAL ATTRIBUTION TO PRODUCTION (ARTIFICIAL) OUTGROUP MEMBERSHIP
H7
IRRESPECTIVE OF STRATEGY
NO (ns)
CAUSAL ATTRIBUTION TO
BUSINESS STUDENTS (REAL) OUTGROUP
MEMBERSHIP
H7
IRRESPECTIVE OF STRATEGY
NO (x and -) Low ID > High ID, in the mostly collaborative condition and in E2, in the mostly competitive condition and in E1.
H8 COMPETES
NO Self (- and x) Low ID > High ID, in the mostly competitive condition. R&D Ingroup (-) Low ID > High ID. Psychology Ingroup (-) Low ID >High ID
COMPATIBILITY WITH PERSONAL STANDARDS
AND INGROUP NORMS OF FAIRNESS AND JUSTICE
H9 COLLABORATES
NO Self (- and x) Low ID = High ID, in the mostly collaborative condition. R&D Ingroup (-) Low ID > High ID. Psychology Ingroup (-) Low ID >High ID

171
EMOTION INTENSITY
H10 IRRESPECTIVE OF
OVERALL STRATEGY
(all cases) NO positive emotions (ns) NO negative emotions: (-) Low ID > High ID. surprise: (ns) (analyses conducted after excluding participants not feeling the emotion) NO positive emotions: (ns) NO negative emotions (ns) Surprise: (ns)
MEDIATION HYPOTHESIS
NO
Note: PARTLY=the hypotheses were partly supported, NO=the hypotheses were rejected, YES=the hypotheses were confirmed. Unexpected=Unexpected significant result. E1 refers to Event 1, E2 to Event 2, and E3 to Event3; (+) = indicates that the main effect for social identity salience condition was significant in the expected direction (-) indicates that the main effect for social identity salience condition was significant in the opposite direction , (ns) =indicates that the main effect for social identity salience condition was not significant (x) =indicates an interaction effect for social identity salience condition.

172
4.4.2. The influence of social identity salience on appraisal
When appraising other’s choice to collaborate, findings in this study do not replicate
findings of study 2. Contrary to the hypotheses, it was participants in the low social
identity condition that reported higher ratings24 on appraisal of causal attribution to
other’s Business student (real) outgroup membership (H7), and higher ratings on
appraisals of unfairness and injustice as considered by the R&D (artificial), and
Psychology (real) ingroups (H8). What is more, analyses comparing appraisals as
reported in study 2 and study 3, showed that in the mostly collaborative condition
there were no significant differences for participants in the low social identity
condition (see Fig.4.20a.). However, for participants in the high social identity
condition (see Fig. 4.19a.), there was a significant drop in the means of study 3
compared to those of study 2 on the appraisal of causal attribution to other’s
PRODUCTION (artificial) outgroup membership.
When appraising other’s choice to compete, findings partly replicated findings of
study 2. First, in line with study 2 and contrary to the hypotheses, no differences were
observed on conduciveness (H3). Second, contrary to results of study 2 and of the
hypotheses, in this study it was participants in the low social identity condition that
reported higher ratings on appraisal of causal attribution to other’s PRODUCTION
(artificial) and Business student (real)25 outgroup membership (H7), and appraisals of
unfairness and injustice as considered by self, by the R&D (artificial) ingroup, and by
the Psychology (real) ingroup (H8). Analyses comparing appraisals as reported in
study 2 and study 3, showed that for participants in the high social identity condition
(see Fig. 4.19a.), there was a significant drop in the means of study 3 compared to
those of study 2. Specifically, this drop occurred on two of the appraisals on which
the unexpected results of study 3 emerged: Appraisal of causal attribution to other’s
PRODUCTION (artificial) outgroup membership, and appraisal of unfairness and
injustice as considered by the R&D (artificial) ingroup. More interestingly though, for
participants in the low social identity condition there was a significant increase on
24 It should be noted that as expected, these ratings were lower than when appraising competition. 25 Noting that the only time the ratings of participants in the high social identity were just as high was in an event when the computer had competed.

173
appraisal of unfairness and injustice as considered by self in study 3 compared to
study 2 (see Fig.4.20b.).
Similarly to study 2, there was some evidence that the effect of social identity
condition on appraisals changed as a function of overall strategy condition and time.
Specifically, the main effect of social identity on appraisal of causal attribution to the
Business student (real) outgroup membership showed significantly different patterns
in the two overall strategy conditions, and these patterns changed in time. In the
mostly competitive condition and across the 3 events, that ratings of participants in
the low social identity condition were higher than those of participants in the high
social identity condition. In the mostly collaborative condition, significant differences
emerged only in the last 2 events (i.e., when the computer collaborated).
4.4.3. The influence of social identity salience on emotions.
These results did not replicate results of study 2. When reporting subjective feelings
to other’s choice to collaborate, the only results in support of the hypothesis (H10)
was that there were significantly more participants in the high social identity
condition reporting to have felt happiness and satisfaction (event 3) to varying
intensities than participants in the low social identity condition.
Contrary to expectations and in contrast with findings in study 2, when reporting
subjective feelings about other’s choice to compete, participants in the low social
identity condition reported significantly stronger negative emotions than participants
in the high social identity condition (H10). There were significantly more participants
in the low social identity condition reporting to have felt anger (event 1) to varying
intensities than participants in the high social identity condition.
4.4.4. The potential bias of outcome (number of points gained).
As in study 2, when completing the appraisal and emotion questionnaires it cannot be
excluded that participants responses were biased by the information about the number
of points gained by self and the other. In replication of findings in study 2, there were
no significant differences between social identity conditions in terms of the dominant

174
strategy chosen by most participants (competition), and thus no significant differences
on the actual number of points made.
Unfortunately, in this study the low number of participants systematically competing
did not allow statistical comparisons of results of “competitors” with results for the
full sample. In study 2, it was reported that 43.85% of the sample systematically
competed (N=40). In this study, only 28.30% of the sample systematically competed
(N=15). In fact, analyses testing for differences between studies revealed a marginally
significant drop in competition rates in study 3 compared to study 2 for participants in
the high social identity condition and in the mostly competitive condition but only in
Event 2.
The overall drop observed in the number of systematic competitors could be, in part,
due to greater social desirability bias in the part of participants in study 3. In this
study, participants had to complete the conflict handling styles questionnaire before
the experiment and they were told that the researchers were interested in this
information to better understand their behavior during the negotiation task. Thus, the
cover story for the questionnaire and the content of the questionnaire may have
rendered participants in this study more aware of their choice of strategy resulting in
slightly “less competitive” behavior.
The marginally significant drop observed for participants in the high social identity
salience condition in the mostly competitive condition in Event 2, could be explained
by the nature of the information they had received as part of the false feedback: They
were told that results had shown that Business students were more oriented toward
relations in terms of conflict handling style than Psychology students. In the mostly
competitive condition, participants were exposed to other’s collaboration in Event 1,
then they had to indicate their choice of strategy in Event 2 before knowing what the
other had chosen. Thus, the fact that the other had just collaborated and the nature of
false feedback information may explain why they opted less for competition in Event
2 in this study than in study 2.

175
4.4.5. Appraisal as a mediator between social identity salience and emotion?
In this experiment, results indicated that social identity condition had some impact on
causal attribution to Business student (real) outgroup membership, and of
compatibility with norms of fairness and justice as perceived by self, and the R&D
(artificial) ingroup, by the Psychology student (real) ingroup, and on the negative
emotions variable. But bivariate correlations showed that social identity condition was
not significantly related to negative emotions. Thus exploratory mediation analyses
were not conducted for this study. However, again exploratory hierarchical regression
analyses once more confirmed the added value that social identity salience condition
can have over and above appraisals in the prediction of positive emotions (Event 3).
Taken together with results of study 1 and 2, an important consideration that emerges
from these exploratory analyses is the importance of better articulating the ways, and
the conditions under which appraisals may act as mediators between social identity
condition and emotions.
4.4.6. General conclusions
Findings in study 3 did not replicate findings in study 2. What is more, significant
results were obtained for the effect of social identity salience manipulations on
appraisals and emotions in study 3 but point into the opposite direction of predictions.
Taken together, these findings show that the social identity salience manipulations in
study 3 did not work as they were intended and may have had quite different effects
than the one that were hypothesized.
The social identity salience manipulations administered before the interaction to
participants in the high social identity salience condition in study 3 (i.e., High ii >
Low ii) attempted to enhance perception of intergroup differences compared to
manipulations used in study 2 (i.e., High i > Low i). The unexpected results on
appraisals and on emotions seem to suggest that the changes made to the social
identity manipulations in study 3 may have actually lead to a decrease in perception
of intergroup differences for participants in the high social identity salience condition.
This alternative hypothesis is supported by the results of the R&D (artificial) social
identity salience manipulation checks in study 3 (i.e., showing that High i = Low i)

176
compared to results of manipulation checks in study 2 (i.e., confirming that High i >
Low i) and by results of the Psychology student (real) social identity salience
manipulation checks in study 3 (i.e., showing also High i = Low i). Finally, analyses
comparing results of study 2 and study 3 confirmed a significant decrease in the
reported identification with R&D (artificial) membership in study 3 for participants in
the high social identity condition and in the mostly collaborative condition.
A closer examination of the actual content of the social identity manipulations
administered before the interaction to participants in the high social identity salience
condition highlight several factors that could explain the unexpected results.
Remember that in this experiment, when receiving the false feedback on the results of
the questionnaire these participants were told that: a) recent research had shown that a
conflict negotiation style favoring relationships is the most adapted, b) that when
comparing the scores of Psychology students to Business students, Psychology
students showed a conflict management style that was less oriented toward
relationships, and c) that they would actually conduct the virtual negotiation with a
Business student. In sum, the false negative feedback was meant to be interpreted as a
direct threat to the Psychology student (real) ingroup. It was assumed that this threat
would enhance perceived intergroup differences between the Psychology student
(real) ingroup and the Business student (real) outgroup in the context this experiment.
If this assumption is correct, what factors could explain the fact that the salience
Psychology vs Business student intergroup dichotomy was not enhanced?
Recent research by Mussweiler, Gabriel, and Bodenhausen (2000) has shown that
when receiving (false) feedback that one has been outperformed by another person
(e.g., a European American woman vs an Asian woman) on a relevant task people
may strategically emphasize aspects of their identity that they don’t share with the
other person (e.g., American vs Asian), making the unfavorable comparison less
relevant for self-evaluation. Moreover, these authors have shown that people with
high trait self-esteem (i.e., as measured by the Rosenberg Self-Esteem Scale, 1965)
are more likely to use this “shifting social identity” strategy than people with low self-
esteem. In one of their studies, when participants received negative feedback people
with high self-esteem focused less on the shared identity (i.e., women) and more on
the non-shared identity (American vs. Asian), and people with low self- esteem
showed the reverse pattern. In this study it is impossible to determine whether

177
interpersonal differences in self-esteem had an impact. However, one could imagine
that when participants were confronted with feedback about Psychology students
being outperformed than Business students and with the fact that they would actually
interact with a Business student, they may have shifted their focus to the R&D
ingroup membership. This could explain why, identification with the R&D (artificial)
ingroup was stronger than with the Psychology (real) student ingroup.
On the other hand, it is also possible that the modifications to the social identity
salience discussed above, may have led participants to re-categorize themselves and
the other as “students”, making the “Psychology vs Business” intergroup dichotomy
less important. In other words, it is also possible that the other may have been re-
categorized as a mixed ingroup/outgroup membership (sharing the student
membership/but not the business memberships) which could explain the reduction of
intergroup differences (see Crisp, Ensari, Hewstone & Miller, 2002 for a discussion of
contextual inclusiveness and the re-categorization effect).
In addition, theoretical work by Ellemers, Spears and Doosje (2002), has highlighted
the need to better take into account features of the context and group commitment
when studying the impact of social identity on perception, affect and behavior.
According to these authors, the impact that a direct threat to the group (e.g., in terms
of status) has on social identity and thus on cognition, affect and intergroup behavior
will vary as a function of whether the individual has high or low commitment to that
group. On the one hand, if group commitments is high, cognitively one could expect a
state of mind conducive to collective group behavior that challenges the status of the
outgroup (e.g., a tendency to emphasize similarities within the group, high levels of
self-stereotyping, etc.). Affectively, this situation might lead to more expressions of
anger (i.e., if the ingroup is perceived to be powerful) or contempt toward the
outgroup. Finally, it might lead to behavioral strategies of intergroup differentiation
that favor the ingroup (e.g., competition). On the other hand, if commitment is low,
cognitively one could expect a tendency for individuals to emphasize the differences
within the group (i.e., this could be interpreted as a way to express that group features
don’t necessarily apply to them), to have relatively low-levels of self-stereotyping,
and to shift their self-definition to another more positive identity. Affectively, this
situation may lead to a negative mood, and lower levels of self-esteem and

178
identification. Behaviorally, the responses expected is for individuals to want to leave
the group in favor of a more attractive group, to refuse to stand with the group and to
help other group members. Again in this study, it was assumed that the Psychology vs
Business student (real) intergroup dichotomy would be sufficiently relevant to this
student sample. It is possible that commitment to the Psychology ingroup was not as
high as expected, rendering the threat to Psychology students less important.
Finally, it is also possible that the manipulations were simply not perceived as a threat
to the Psychology ingroup at all. For example, participants in the high social identity
salience condition might have totally discounted the validity of the research findings
presented in the false feedback making the comparison with Business students
irrelevant.
As for the unexpected results of participants in the low social identity condition, as
discussed in study 2 it cannot be excluded that the salience of group memberships
may have also become salient for them. Because nothing in the instructions before the
negotiation made any intergroup dichotomy salient for low identifiers, or gave any
information about what to expect from the other, or gave information about whether
the relationship with the other was competitive or collaborative, it can be safely
assumed that if the other’s group memberships became salient it occurred during the
interaction. In an identical manner to study 2, in the computerized negotiation task,
participants in both social identity conditions were informed (i.e., in the second
introduction computer screen in the negotiation task) that they would be interacting
with a person that represented the Production department. In addition, in this
experiment the first time that they completed the appraisal computerized
questionnaire after Event 1 they all had to answer the following question: “To what
extent was the other’s choice of strategy was caused by his membership to the
Business faculty”. Therefore, during the interaction participants in the low social
identity condition were directly (in the case of Production outgroup membership) and
indirectly (in the case of the Business faculty membership) informed that the other
was a member of the Production department and was a Business student. It is not
impossible then, that they used this information to categorize the other person as an
outgroup. Again, results of the social identity manipulation checks showed that the
R&D (artificial) ingroup membership and the Psychology student (real) ingroup

179
membership were just as salient than for participants in the high social identity
condition (i.e., High Ii = Low Ii).
Methodologically an important consideration that emerges from studies 2 and 3 (and
also from study 1) is the difficulty to exert experimental control over the salience of a
meaningful social identity without better taking into the context, actual commitment
to the group (as suggested by Ellemers, Spears & Doosje , 2002) and interpersonal
differences (e.g., trait self-esteem, see Mussweiler, Gabriel, & Bodenhausen, 2000).
Despite the difficulties in manipulating social identity salience, findings in studies 2
and 3 offer some evidence that self-report measures of appraisals and emotions are
sensitive to experimental manipulations of social identity salience. More importantly,
when the impact of social identity salience was significant it occurred on those
appraisals that have been proposed to be more likely to be influenced by social
contextual factors.

180
CHAPTER 5
GENERAL DISCUSSION
Current cognitive appraisal theories of emotion suggest that appraisals of events or issues
relevant to us as individuals determine the emotions we feel as individuals, whether alone or
in interpersonal contexts. This work focussed on studying appraisals of events relevant to us
as members of social groups in intergroup contexts, and the consequent emotions we may feel
as members of social groups and about others as members of social groups. Based on
theoretical connections between Scherer’s (1984a, 1984b) appraisal theory of emotions and
Tajfel and Turner’s (1986) social identity theory, concrete hypotheses were elaborated to
explain how social identity salience may impact some of the more cognitively complex
appraisals dimensions believed to be involved in the emotion process and that have been
identified as being particularly sensitive to social contextual factors.
The major postulate put forth in this thesis was that when a social identity becomes salient,
appraisal dimensions of goal significance (i.e., conduciveness/ obstructiveness to goals),
coping potential (i.e., agency/responsibility, control/power), and compatibility with personal
standards and social norms (e.g. in terms of morality, justice and fairness) are no longer
evaluated just in terms of the self in relation to others as individuals, but rather in terms of the
self as a member of a salient ingroup in relation to others as members of the target outgroup.
To illustrate, imagine that you as “person A” are engaged in a heated debate with other
colleagues (i.e., person B, C, D, E, etc…) concerning the selection of a new faculty member.
You find yourself supporting a candidate that most of your colleagues are not ready to
support. Assuming that this situation is pertinent to you personally, Scherer’s cognitive
appraisal theory of emotions would predict that you may experience emotions about this
issue, and that these emotions will be determined by your appraisals of whether the issue is
conducive or obstructive to your personal goals, who you think is causing the issue, whether
you think they are doing it intentionally against you, how much control and power you feel
you have over the consequences of this issue, and the extent to which it corresponds to your
personal standards of what is moral and just, and to what most people would consider moral
and just. Now, imagine that you also happen to be “the only woman in your faculty” and that
the candidate that you are defending happens to be the only woman in the candidate pool.
Assuming that in this situation your gender identity has become salient for you, your appraisal

181
of the discussion about this issue in terms of goal conduciveness /obstructiveness is more
likely to be evaluated in terms of the goals of your salient ingroup (i.e., other women) than in
terms of your personal goals (i.e., you as person A). Similarly, your appraisals of the event in
terms of agency/responsibility, control and power are more likely to be evaluated in the terms
of the perceived and/or objective position of your salient ingroup (i.e., women) in relation to
the target outgroup (i.e., men) than in terms of yourself (i.e., person A) in relation to other(s)
(i.e., persons B, C, D, E,) interpersonally. In the same way, appraisal of the event in terms of
compatibility with personal standards is more likely to be evaluated in terms of yourself in
relation to the salient social identity (i.e., You as a woman) than of yourself in relation to an
ideal personal self (i.e., You as a fair person). Finally, your appraisals of compatibility of the
issue with social norms is more likely to be evaluated in terms of yourself in relation to the
norms of your salient ingroup (i.e., what would other women think is fair and just in this
case?) than of yourself in relation to social norms (i.e., what would most people think is fair
and just in this case?). In this thesis it was further proposed that the effect of social identity
salience on the use these appraisals should in turn influence the nature and strength of
emotion responses. When a social identity becomes salient, the intensity of emotions should
be the strongest for issues and events that are directly pertinent to aspects of the salient social
identity. Moreover, the stronger the identification with the salient ingroup, the stronger should
be the emotions felt about events directly pertinent to the welfare of that ingroup.
Three experiments were designed to test these propositions. In study 1, the focus was on anger
felt as a member of a salient ingroup that is directly threatened by the announcement of
potential merger with a target outgroup. Studies 2 and 3, examined a range of positive and
negative emotions felt as a member of a salient ingroup and about other’s behaviour as a
member of a target outgroup (i.e., collaboration and competition). In these experiments the
salience of real and artificial social identity memberships was manipulated to create a high
and low social identity salience conditions. To provoke appraisals and emotions in study 1,
written vignettes describing negative events associated to the merger were used. In studies 2
and 3, I created a computerized negotiation task (i.e., based on the PDG) in which the
behavior of the outgroup was simulated by pre-programming the computer to either act
collaborative or competitive. The major aim was to test whether differences would emerge
between social identity salience conditions on self-report measures of appraisals and emotion
responses to these stimuli, which were designed to be directly pertinent to the manipulated
social identities.

182
In study 1, unexpectedly, it was participants in the low social identity condition that rated the
negative events associated to the merger significantly higher in terms of appraisals of being
caused by other, and being caused by other intentionally (i.e., agency/responsibility).
Although participants in the high social identity condition reported significantly stronger
anger (with mild reported intensities), they also reported stronger positive emotions including
relief, happiness and joy (again with mild reported intensities). Additional analyses revealed
that these paradoxical results were in part explained by the existence of two subgroups of
respondents within the high social identity salience condition. One subgroup rated the positive
emotions stronger, and the other subgroup rated anger stronger. In support to appraisal theory,
the subgroup of participants reporting stronger anger also reported significantly higher ratings
of appraisals of obstructiveness to goals (i.e., conduciveness/obstructiveness to goals), and of
being caused by the other (i.e., agency/responsibility), than the subgroup of participants
reporting positive emotions stronger. Finally, findings of exploratory mediation analyses
showed that the effect of social identity salience on anger was only partially mediated by
appraisals of being caused by the other, and being caused by the other intentionally. Thus,
when these appraisals were controlled for, the strength of the relationship between social
identity salience and anger was not reduced.
In study 2, as hypothesized, when the outgroup was collaborative participants in the high
social identity salience condition reported significantly higher ratings of appraisal of
conduciveness (i.e., conduciveness/obstructiveness to goals) than participants in the low
social identity salience condition. Irrespective of the outgroup’s behaviour, there was a trend
for participants in the high social identity condition to report stronger positive emotions.
Interestingly, additional analyses ran on the sub-sample of participants who systematically
opted for competition revealed that participants’ own behaviour had an effect on appraisals.
When the outgroup was competitive and participants were competitive, participants in the
high social identity condition reported significantly higher ratings of appraisal of unfairness
and injustice as considered by self (i.e., compatibility with personal standards). When the
outgroup was collaborative and participants were competitive, participants in the high social
identity condition reported significantly higher ratings of appraisal of causal attribution to
outgroup’s membership (i.e., agency/responsibility), and of unfairness and injustice as
considered by self (i.e., compatibility with personal standards) (though these ratings were
lower than when the outgroup competed). In this study, the lack of significant correlations
between social identity and emotion did not permit analyses to test for mediation. However,

183
exploratory hierarchical regression analyses showed that social identity salience added to the
prediction of positive emotions over and above appraisals.
Study 3, aimed to replicate results of study 2 and featured some modifications to enhance the
efficacy of the social identity salience manipulations. Results showed that the manipulation
did not work as expected, and the effects of social identity salience found in study 2 were not
replicated. In this study, when the outgroup was collaborative, it was participants in the low
social identity salience condition that reported significantly higher ratings of appraisal of
being caused by the outgroup’s membership (i.e., agency/responsibility), and on appraisals of
unfairness and injustice as considered by the ingroup (i.e., compatibility with ingroup norms),
than participants in the high social identity salience condition. Similarly, when the outgroup
was competitive, it was participants in the low social identity salience condition that reported
significantly higher ratings of appraisal of being caused by the outgroup’s memberships (i.e.,
agency/responsibility), and on appraisals of unfairness and injustice as considered by the
ingroups (i.e., compatibility with ingroup norms), than participants in the high social identity
salience condition. Moreover, irrespective of the outgroup’s behaviour, it was participants in
the low social identity salience condition that reported significantly stronger anger. As in
study 2, the lack of significant correlations between social identity and emotion did not permit
analyses to test for mediation. Yet, again exploratory hierarchical regression analyses showed
that social identity salience added to the prediction of positive emotions over and above
appraisals
Comparisons of results obtained in study 2 and study 3 revealed no significant differences in
terms of emotion ratings. However, significant differences were found in terms of
identification with the R&D ingroup, and in terms of those appraisals that made reference to
ingroup or outgroup memberships. For participants in the high social identity condition,
irrespective of the outgroup’s behaviour appraisal of causal attribution to outgroup’s
membership (i.e., agency/responsibility) was rated lower in study 3 compared to study 2. It
was also observed that when the outgroup’s behaviour was competitive, appraisal of
unfairness and injustice as considered by the ingroup (i.e., compatibility with ingroup norms)
was rated lower in study 3 compared to study 2. Finally, when the outgroup’s behaviour was
collaborative, identification with R&D was rated lower in study 3 compared to study 2. For
participants in the low social identity condition, overall no significant differences were
observed for ratings of identification with R&D, and when the outgroup’s behaviour was

184
collaborative no significant differences were observed in terms of appraisals. It was when the
outgroup’s behaviour was competitive that appraisal of unfairness and injustice as considered
by self (i.e., compatibility with personal standards) was rated significantly higher in study 3
than in study 2.
Changes made to the manipulations of social identity salience in study 3 compared to those
used in study 2 were supposed to enhance the magnitude of perceived intergroup differences
for participants in the high social identity condition. Contrary to expectations, results of study
3 suggested that the new manipulations may have reduced the magnitude of perceived
intergroup differences. Assuming this hypothesis is correct, the significant drop in the ratings
(in terms of appraisals that made reference to group memberships and of identification to
R&D) of study 3 compared to study 2 observed for participants in the high social identity
condition make sense. For participants in the low social identity condition however, the
significant increase in the ratings (in terms of appraisal of unfairness and injustice) of study 3
compared to study 2 could be due to the a combination of factors: First, this difference was
significant when the outgroup was acting competitively and second, in study 3 participants
knew that the other was a business student because of the wording of the appraisal question.
As a whole, results of these studies do not offer clear support for the experimental hypotheses
concerning the impact of social identity salience (as manipulated in these studies) on
appraisals and emotions (as induced by vignettes and the computerized negotiation task and as
measured by self-report). At best, results offer some direct and indirect evidence that self-
report measures of appraisals and emotions are sensitive to experimental manipulations of
social identity salience. In the three studies, difficulties were encountered with the social
identity salience manipulations. In addition, difficulties were also encountered with the
induction of appraisals and emotions via vignettes in study 1, leading to the development of a
computer program in studies 2 and 3. Moreover, all measures of appraisals and emotion relied
on self-report measures, which have well-known limitations. The next section outlines some
of the major theoretical and methodological issues that emerged in manipulating social
identity salience and in inducing and measuring appraisals and emotions, and offers some
alternative explanations for the unexpected findings.

185
5.2. Manipulating social identity salience
5.2.1. The salience of meaningful social identities
In the three studies preference was given to manipulating the salience of meaningful (real and
artificial) social identities as opposed to minimal group identities. I assumed that if the social
identities that were made salient were socially meaningful, it would enhance the general
implication of participants in the experiments, in turn facilitating the induction of stronger
emotions and of the corresponding appraisals. Ironically, a major drawback of using
meaningful social identities is that they are by definition subjective. And, the subjective
meaning that participants attribute to social identities in experimental settings may not
correspond to the meaning attributed by the researchers (for a critical discussion of this issue
see Antaki, Condor and Levine, 1996). More important, Brown (2000) has recently argued
that social identity theory has not sufficiently accounted for the fact that different social
groups may serve different identity functions, and that the social identification with different
groups may have quite different meanings for different people in different contexts (also see
Brown & Williams, 1984; Hogg & Williams, 2000). To cite Brown (2000), “It seems to me
important to incorporate [these] central dimensions of group diversity and no longer assume
that a group is a group is a group as far as key psychological mechanisms are concerned”
(p.761). For example, research by Deaux, Reid, Mizrahi, and Ethier (1995) has shown that
when asked to sort a whole range of social identities1 in terms of perceived similarity, five
social identity “classes” emerged and people clearly associated different traits to the different
classes. These social identity classes included: Personal relationships (e.g. Wife, Mother,
Friend), professional (e.g., Psychologist, Student), political affiliations (e.g. Socialist,
Feminist), ethnic/religious (e.g., Hispanic, Catholic), and stigmatised groups (e.g., Alcoholic,
Fat Person). In the experiments presented in this thesis, if discrepancies occurred between the
meaning that myself (as an experimenter and a psychology student) attributed to the social
identities that were made salient, and the actual meaning that may have been attributed by
participants (all first year psychology students), then it is possible that the stimuli developed
to induce appraisals and emotions did not work as intended.
1 These social identities were produced via spontaneous self-reports.

186
In Study 1, the intergroup dichotomy that was made salient was real for participants, namely:
Between the University of Geneva vs. University of Lausanne in the context of the
hypothetical merger between the two Universities. Despite the fact that participants in the
high social identity condition had been pre-selected based on their actual identification with
the University of Geneva (based on their higher scores on the private collective self-esteem
subscale), and even though in the manipulation check questions they had reported
significantly stronger identification with the University of Geneva (and with other
memberships related to the University), their appraisals and emotion responses only partially
corresponded to the type that were hypothesized. The possibility was evoked in the discussion
of study 1, that results were influenced by the fact that the sample consisted of first year
students. In contrast to second or third year students, first year students may not have had the
opportunity to develop their identification with the University of Geneva. In other words, the
meaning first year students attributed to the University of Geneva identity may have not
corresponded to the meaning that older students, or myself as a researcher and as a doctoral
student, attributed to this identity in the context of the potential merger. In general, it may be
that the salience of larger scale memberships such as “Gender” or “Nationality” can have a
much stronger impact on appraisals and emotion than that the salience of “University
student”. In fact, in study 1 there was some evidence that some of the other memberships that
were not at all associated to the university (e.g., including age, nationality, and sex) were also
rated as being highly important and positive in the context of the study. In addition, it has
been empirically shown that that University identification can vary as a function of the status
of different demographic sub-groups of students, so that it is perceived as being less central
by minority status students (i.e., South Asian, Asian, Native Canadian) than by majority status
students (i.e., White) (Cameron, 1999). Students at the University of Geneva (and/or their
parents) come to different countries, but they also come from different Cantons in Switzerland
which may differ in terms of size, language, political status, etc (e.g., see Kreis, 1994).
Despite the fact that no significant differences were found between social identity conditions
in terms of the ratio of male/female students and Swiss/non-Swiss nationals, and in terms of
mean age and mean number of years residing in Geneva, it is not impossible that other aspects
of their diversity could have influenced the effectiveness of the social identity salience
manipulations.
In study 2, the intergroup dichotomy that was made salient was artificial: That of the R&D
department vs. the PRODUCTION department. These were assigned roles in the context of

187
the simulation of a virtual business negotiation. In this way, it was hoped to exert greater
control over the content and hopefully the meaning of the social categories in the context of
experimental task. However, results of the social identity salience manipulation checks
revealed that the outgroup’s behaviour may have had an impact (e.g., it was when the
outgroup’s behaviour was competitive that there were no differences in terms of identification
with the R&D). In addition, participants’ own behaviour also may have had an impact (e.g., it
was when the outgroup’s behaviour was competitive and participants’ own behaviour was
competitive, that there were no differences in terms of appraisal of being caused by other’s
PRODUCTION outgroup membership).
In study 3, in was hoped that the effects of social identity salience on appraisals and emotions
would become clearer if the magnitude of the intergroup differences were enhanced. This was
attempted by crossing an additional and real intergroup dichotomy for participants, namely:
R&D/Psychology students vs. PRODUCTION/Business students. Manipulation check items
showed no significant differences between social identity salience conditions. What is more,
for participants in both social identity condition identification with the R&D department was
clearly dominant in comparison to identification with the Psychology student section. Results
on appraisals and emotion showed that it was participants in the low social identity condition
that were responding in the way that participants in the high social identity condition were
expected to respond. In fact, results were suggesting that the social identity salience
manipulations could have had the opposite effect (i.e., reducing perceived intergroup
differences for participants in the high social identity condition, and enhancing perceived
intergroup differences for participants in the low social identity salience condition). As in
study 2, additional analyses revealed that participants’ own behaviour and the interaction with
the outgroup’s behaviour may have affected identification with the ingroup. In the discussion
of study 3, the content of the manipulations and its administration were examined closely and
several factors were identified that could have potentially lead to these unexpected results.
5.2.2. The impact of context, time and ongoing interaction
In studies 2 and 3, it was clear that time had had an effect on social identity salience, just as
did participants’ own choice of behaviour and the actual interaction with the pre-programmed
behaviours of the outgroup. In the discussion of study 2, it was stated that it could not be
assumed that the manipulations of social identity salience administered before the negotiation

188
task remained effective and consistent throughout the 3 negotiation Events. In criticizing
standard methods used in social identity research, Antaki, Condor and Levine (1996) have
appropriately pointed out that “ the research setting, and the various actions which take place
within it, is usually described as if it were a single definable “context”, a “moment” within
which the time can be assume to have stood still […]. As a consequence, analysts assume that
any aspect of social identity will be (or in hindsight, has been) uniformly “salient” or “not
salient” throughout the duration of the experiment.” (p.477). One way to overcome this
methodological problem would be to include measures of indicators that have been found to
accurately reflect the effect of social identity salience (e.g., ingroup bias) at selected points of
the interaction. However, any attempts to capture changes in salience that may occur “online”
will share the same methodological problems encountered by emotion psychologist when
trying to capture appraisal and emotion changes “online”. Another interesting possibility to
study the impact of context and time is longitudinal research as conducted by Ethier and
Deaux (1994). In their study they examined changes in the Hispanic2 social identity of
students at two Ivy League Universities over their first year, and they found that identification
and response to threats of the ingroup depended on the initial strength of participants’
identification to the Hispanic social identity.
5.2.3. The impact of individual differences
Another major issue that emerged from the results of study 1, but also studies 2 and 3,
concerns the individual differences that may underlie social identity salience processes.
Though individual differences were not addressed in this thesis, additional analyses conducted
in study 1 revealed the existence of two subgroups of participants within the high social
identity condition showing different appraisal and emotion response patterns. In studies 2 and
3 there was some indirect evidence that participants may have differed in terms of their
tendency to “compete”. In study 2, it was shown that the effects of social identity salience
condition on appraisals were different when analysing the sub-sample of participants
systematically opting for competition. Several authors have examined the role of dispositional
factors in intergroup processes, including trait self-esteem (as shown by Mussweiler, Gabriel,
& Bodenhausen, 2000; and also by Seta & Seta, 1996), situated goals and motives, and needs
for security and self-enhancement (e.g., as shown by research on basking in reflected glory by
2 Students who claimed the Hispanic identity also used terms like Latino, Chicana, Puerto Rican, Mexican-American to describe themselves.

189
Cialdini, Borden, Thorne, Walker, Freeman, & Sloan, 1976; or by research by Simon,
Pantaleo, & Mummendey, 1995). In his recent critical review of social identity theory, Brown
(2000) has reminded us of the importance in recognizing that “there may be both group and
individual differences in the propensity to engage in intergroup comparisons” (p.762). In fact,
in future research it would be important to assess people’s general orientation to interpersonal
and intergroup comparisons by using instruments such as the one developed by Brown and his
associates (Brown, Hinkle, Ely, Fox-Cardamone, Maras & Taylor, 1992) assessing
individualist–collectivist and autonomous–relational orientations, or the one developed by
Gibbons and Buunk (1999) assessing social comparison orientation.
5.3. Inducing appraisals and emotions
5.3.1. The use of written vignettes
In study 1, it is clear that the effects of social identity salience on appraisals influenced by the
uneven quality of the written vignettes used to induce emotion. As discussed in study 1, even
though the 6 events were selected from multiple real sources, and reflected actual information
about the merger, and were selected based on a pilot study testing their potential for inducing
anger in this student population, results clearly showed that they were not equivalent with
respect to their capacity to induce anger. What is more, the lack of results may simply be due
to actual use of vignettes as stimuli. Parkinson and Manstead (1993) have written a thorough
account of the different methodological limitations of vignettes in appraisal research. In their
words “the vignette approach translates the real-time multilevel emotion episode into a verbal
text to be decoded and assumes that individuals carry out this same translation whenever they
get emotional” (p.321). Because I fundamentally agree with the arguments developed by these
authors, I will not defend here the advantages of using vignettes. But, I will justify their use in
study 1 because this study was also intended as a pilot to determine to what extent the issues
of the hypothetical merger between the Universities could be used in other experiments.
Consequently, the use of vignettes was abandoned after the first study to favour the
development of an experimental simulation. First, it was hoped an experimental simulation
would help achieve greater experimental control over the manipulations of social identity
salience, and second, it was hoped that it would be a more reliable method of inducing
specific appraisals and emotions, and also emotions of stronger intensity.

190
5.3.2. The use of the computer negotiation task and the PDG
Results of study 2 and 3 confirmed that the experimental simulation of a computerized
negotiation task (structured as a 3-trial Prisoner’s Dilemma Game) was successful in evoking
specific appraisal and emotion responses expected in response to outgroup’s competitive and
collaborative behavior. In both studies, results confirmed that outgroup’s competitive
behavior evoked appraisals of low conduciveness to goals and high unfairness and injustice,
and induced strong intensity negative emotions (i.e., frustration, irritation and anger), and
outgroup’s collaborative behavior evoked appraisals of high conduciveness and low
unfairness and injustice, and induced strong intensity positive emotions (i.e., relief,
satisfaction and happiness).
This is to my knowledge, the first empirical evidence of appraisal and emotion responses
induced via a computerized PDG simulation. The two-person PDG used in these studies offer
an interesting experimental simulation to study appraisal and emotions in general, but it is
particularly interesting if one wants to study the effects of social interaction on appraisal and
emotion. First, it represents a situation in which each player knows exactly how the partner
has acted (competed or collaborated), second, if one player chooses to compete it has direct
consequences for the partner, and finally, because each player has control over the outcomes
of the partner, each player can try to shape the other’s behaviour (see Kollock, 1998). For
emotion researchers, this situation gives relative control over the emotion-eliciting event (e.g.,
by varying the responses of one player, or by varying the characteristics of one or both
players) and also gives some control over the level of implication of participants (e.g., by
varying the range of potential outcomes, by varying the value of the incentives at stake, etc.).
In addition, appraisals and emotion responses can be measured during the interaction
(subjectively, but one can envisage more objective indicators), and potentially one can assess
action tendencies and actual behavioural responses (i.e., choice to compete or collaborate, or
other behavioural indicators such as whether they would like to work with the other in the
future, etc.).
The PDG used in studies 2 and 3 studies attempted to better control the emotion-eliciting
event by defining it as the other’s behaviour (collaborative or competitive), and it was
expected that it would induce the corresponding appraisals and emotions in participants. The
PDG consisted of 3 trials (3 negotiations with the outgroup), participants received trial-by-

191
trial feedback about outcomes (after simultaneously responding with the pre-programmed
outgroup), and participants also responded trial-by-trial to questions about their appraisals and
emotions felt about the outgroup’s behaviour. The reason for only having 3 trials was to avoid
the possibility that participants would become bored or tired by having to complete too many
self-report appraisals and emotion questionnaires.
One of the major difficulties encountered by using this PDG was that a pilot study had shown
that having a pre-programmed computer systematically competing or systematically
collaborating undermined the realism of interacting with a real person in another lab. This
lead to the creation of the mostly collaborative and the mostly competitive conditions. The
drawback of this intermediate solution was the introduction of a potential confounding,
namely, that the carry over effect of the computer starting with competition and then
switching to collaboration (likely to be appraised positively) may be different than starting
with collaboration and then switching to competition (likely to be appraised negatively). It the
analyses it was attempted to take this into account by conducting statistical analyses that
allowed the examination of effects of time. But it is also possible that participants did simply
not believe the cover story that they were interacting with another person. Unfortunately, this
was not verified at the end of each experimental session. It was felt that asking students
directly whether they believed there was another real person (e.g., did you think there was
another student in another room manipulating what was on the computer screen? Did you
think your partner’s responses were completely programmed?) could be counteractive in the
context of these studies. These questions might actually lead participants to think that it was
not a real interaction with the risk that they would then tell other students that had not yet
participated in the study. In retrospect, a more indirect question could have been asked, for
example they could have been asked to write a message for the other, or direct questions
could have been asked in the debriefing sessions conducted at the end of the experiments.
Interestingly, research comparing cooperation responses in a 6-trial PDG interaction with
either another person, a computer with a human face-voice, a computer with a human voice,
or just a computer (text only), has shown that social identity processes can still affect
cooperation responses even when participants knew the other was just a computer (Kiesler,
Waters, & Sproull, 1996).
Another difficulty consisted of the potential bias of trial-by-trial feedback on outcomes (i.e.,
number of points gained by self and by the outgroup). In study 2 it was argued that outcomes

192
could not be included as “covariate” variables in the analyses because they did not meet the
requirement of being independent from one of the treatment variables (i.e., the computer’s
strategy) making interpretation of adjusted means difficult (Tabachnick and Fidell, 1989). It
was attempted to control for this potential bias by systematically informing participants of
other’s choice of strategy and the exact number of points gained by them and by the “other”.
In this way, it was ensured that all participants received the same type of information and the
information about number of points gained was accurate. Thus, the information about
outcomes was kept as “constant” as possible, with the only variability coming from
participants’ own responses. In study 2, it was possible to conduct additional analyses on
appraisals and emotions while controlling for participants’ own responses. This was done by
focussing only on those participants that had systematically competed. Differences emerged
on appraisals as a function of social identity condition, and these effects were different than
when analysing the full sample. These results could be interpreted as an indication that
information about outcomes biased the results. But, it may be that participants who
systematically competed differed on some dispositional orientation to compete.
5.4. Measuring appraisals and emotions through self-report
Several criticisms have been made about the use of self-report in measuring appraisals and
emotions as discussed in the first chapter. This section will not repeat these criticisms (see
Parkinson and Manstead, 1992 for a good review of the limitations of self-report; also see
Schorr, 2001 for a more general discussion of subjective measurement in appraisal research).
Conversely, I will focus here on some of the problems encountered with the standard
appraisal items used in study 1, and with the adjustments made to standard appraisal items in
studies 2 and 3 which, attempted to better capture “the particularities” of appraisals in
intergroup contexts. Then, problems encountered with self-report measures of emotions will
be addressed.
Study 1 tested whether, for participants in the high social identity salience condition,
appraisals would be evaluated in terms of the self as member of the University of Geneva
(i.e., salient referent “ingroup”) in relation to students from the University of Lausanne (i.e.,
the target “outgroup”). However, the appraisal items used corresponded to the standard
appraisal questions that were originally conceived to capture appraisals in individuals alone or
in interpersonal contexts. None of the appraisal items used in study 1 made reference to the

193
University of Geneva or the University of Lausanne. Above all, this choice was made to
ensure content validity: These are the standard items that have been developed and validated
over the years by researchers working on Scherer’s appraisal theory. In designing the other
studies however, it was thought that the predictive value of self-report measures of appraisals
in intergroup context could gain if adjustments were made to refer to the ingroup and the
target outgroup on specific appraisals.
Adjustments were envisaged in studies 2 and 3 on those appraisal items that help evaluate the
role of other(s) in Scherer’s theory, namely appraisals of agency/responsibility. For example,
the items asking to what extent the emotion-inducing event was caused by the other(s), was
reworded to make specific reference to the other as a member of the salient reference
outgroup. Similarly, adjustments were made on those items that help evaluate the social
consequences of the situation in Scherer’s appraisal of compatibility of with social norms.
Thus, the item asking to what extent the event corresponded to the what most people would
consider to be unjust or unfair was reworded to refer to the standards of justice and fairness as
considered by the salient reference ingroup. It should be noted that the majority of social
identity salience effects on appraisals that were significant, whether expected or unexpected,
occurred on appraisal dimensions of agency/responsibility and of compatibility with social
norms. The major disadvantage of these adjustments was that the references to ingroup or the
target outgroup in these appraisal items may have rendered these memberships also salient
also participant in the low social identity condition. In retrospect, this problem could have
been avoided by keeping the standard appraisal items identical to those used in study 1, but by
telling participants in the high social identity salience condition to respond to the appraisal
questions as a member or the ingroup in relation to the other as a member of the target
outgroup, and by telling participant in low social identity salience condition to complete the
questions as individuals (emphasizing the importance of their own personal perception).
Problems were also encountered with the measurement of emotion ratings. In the three studies
a selected range of positive and negative emotions were measured. To characterize their
responses participants were asked to rate all emotions on scales that: a) had one value (e.g., 1)
that could be used to indicate that they did not feel the emotion; b) had a whole range of
values (e.g., 2 to 9) that could be used to indicate the relative intensity of the emotion
experience. Consequently, the information reflected by the raw ratings (e.g., scale from 1 to 9)
confounds the issues of whether the participant has experienced the emotion or not, and the

194
intensity of the emotion experience. Because in study 2 and 3 emotions were measured
repeatedly it was important to have a balanced design. This made it impossible to just
concentrate of those emotions that were rated as experienced to varying intensities across the
3 events in time. For example a person may have rated anger as not at all pertinent in response
to the first event, and then rated experiencing anger to varying degrees of intensity in response
to events 2 and 3. Therefore, to provide the most complete picture of emotion responses the
solution adopted was to conduct the analyses of the raw ratings and then to compare the
results to analyses ran after deleting those cases where participants indicated not feeling the
emotion.
5.5. Implications
5.5.1. Implications for research and theory
This thesis has implications for the field of intergroup relations and for the field of emotion.
First, the research joins the growing body of research on intergroup emotions (particularly
work based on intergroup emotions theory (IET) as proposed by Smith, 1993; Mackie, Devos,
& Smith, 2000) and in this way contributes to the development of a more integrated view of
the cognitive and affective factors underlying intergroup behaviour. As discussed in the
review of the literature, research based on IET has demonstrated that emotional experiences
are just as intense in those situations were participants felt emotions as a group member than
when the felt emotions as individuals (Mackie, Devos & Smith, 2000; Mackie, Silver &
Smith, 2000; Devos, Silver, Mackie, & Smith, in press). In his 1993 article, Smith borrowed
from several appraisal theories (including Roseman, 1984; Frijda, Kuipers & ter Schure,
1989; and Scherer, 1988) to speculate about the types of appraisal, emotion, and action
tendency patterns that could be relevant in intergroup contexts. In this sense, IET is the first
attempt to extend and integrate appraisal theories in general to the intergroup relations
domain.
In a complementary manner to IET, the work in this thesis attempted to extrapolate from
Scherer’s existing theoretical predictions to offer predictions about appraisals and emotions in
intergroup contexts. Differently to IET however, the question of intergroup emotions was
approached from the appraisal theory of emotions perspective. From this angle, building
connections between existing appraisal theories of emotion and social identity theory also

195
responds to a concrete need in the field of emotion research, namely: To identify some of
potential mechanisms by which social contextual factors may affect appraisal and emotion.
Therefore, a unique contribution of this work lies in articulating how social identity salience
may be one of the potential social contextual factors that impacts on appraisals and emotions.
Again differently to IET, the propositions in this thesis were developed by focussing on those
specific appraisal dimensions that had been previously identified in the appraisal literature as
being particularly sensitive to social contextual factors (i.e., in particular to national culture)
including conduciveness/obstructiveness to goals; agency/responsibility, and compatibility
with personal standards and social norms. The logic then was to develop why, how, and under
which condition social identity salience would affect these specific appraisals.
Empirically, the results failed to support most of the experimental hypotheses related to the
influence of social identity salience on appraisal and emotion. It was argued that the lack of
results could have been cause by the methodological limitations of the social identity salience
manipulations used in these experiment. Therefore, I will not speculate here about the
implications of those results involving social identity salience that were significant but
unexpected. Yet, as previously discussed, some of the significant results offer direct and
indirect evidence that self-report measures of appraisals and emotions are sensitive to
experimental manipulations of social identity salience. Finally, a methodological implication
of this thesis is that the PDG computerized simulation used study 2 and 3 offers an interesting
alternative to study appraisals and emotions.
5.5.2. Practical implications
The practical implications of studying intergroup emotions for issues of prejudice and
discrimination have been widely developed by IET, but also by social identity theorists (see
Brown, 2000). A direct implication is to better differentiate the conditions that lead to specific
cognitive (i.e., stereotypes), emotional (i.e., feelings) and behavioural (i.e., discrimination)
responses toward different outgroups in real intergroup settings. But also, and this is quite
novel, the study of intergroup emotions also advances knowledge about emotions experienced
toward ingroups. In this way, behavioural and emotion responses (positive and negative3)
3 An interesting intergroup emotion is Malicious Pleasure or “Schadenfreude” experienced at the suffering of another group, which is distinguishable from an emotion like pride about the ingroup, and anger toward the outgroup, as studied by Leach, Spears, Brascombe & Doosje, 2003.

196
observed in real life intergroup settings can be linked to specific appraisal patterns or
viewpoints about real life issues and events. The most important longer-term implication of
studying intergroup emotions is the promise of new theories and models of prejudice and
discrimination that can foster more effective prevention and intervention programs.
In addition, the study of intergroup emotions has much to offer to organizational settings.
Despite growing recognition gained by social identity theory in organizational studies (e.g.,
Albert, Ashforth, & Dutton, 2000; Haslam, 2001; Haslam, Eggins & Reynolds, 2003; Hogg &
Terry, 2001) and despite the success enjoyed by the study of emotions in the workplace (e.g.
see Ashkanasy, Haertel & Zerbe, 2000, and Barsade, Brief & Spataro, 2003) little is known
about the role of intergroup emotions in organizational settings. Organizations are abundant
with complex intergroup situations in which multiple social categories may become salient to
individuals (Haslam, Eggins & Reynolds, 2003). For example, the ways in which these
multiple social identities become salient in teams and impact on team members’ appraisals
and emotions may help understand how employees’ experience of diversity may affect team
performance (Garcia-Prieto, Bellard & Schneider, 2003). The study of intergroup emotions
will also have important practical implication for the understanding and management of
organizational mergers and acquisition. It has been shown that in the case of a merger,
employees pre-merger organizational identities are likely to become salient (Terry & Callan,
1998) and that the lower the status of the pre-merger organizational identity the stronger the
negative responses toward the new merged organization (Terry & O’Brien, 2001).
Understanding the impact that the salience and status of pre-merger identities (e.g. Swiss
airline and Cross-air) can have on appraisals of events and issues considered as strategic for
the new merged organization and thus on emotional responses might help managers better
prepare mergers and anticipate reactions to the new merged organization (e.g. Swiss).
5.6. Future directions and conclusions
Efforts to get closer to the true relationships between social identity salience, appraisal and
emotions will inevitably lead to more complex theoretical models and research designs.
One of the key challenges for scholars working on intergroup emotions will be the
development of theoretical models that integrate the processes involved in appraisal and
emotions and the processes involved in social identity salience while taking into account the

197
aspects of the social context. As pointed out by Parkinson (2001), the appraisal and emotion
process as ongoing in context has been best articulated in the models proposed by Scherer,
(e.g., 1984) and Frijda (e.g., 1986). Scherer’s model proposes appraisal as a continuously
updating sequence of checks that can adapt to the ongoing situation, and Frijda’s model
proposes that action tendencies can be modified to become specific responses as a function of
information coming from the situation. In the field of social identity research, a recent
example of a model that has attempted to integrate the different issues includes the taxonomy
of situations proposed by Ellemers, Spears and Doosje (2002) which makes concrete
propositions about the impact of social contextual and motivational aspects of social identity
on cognition, affect and behaviour.
Given the inherent importance of motivation for the study of appraisal and emotion in general
(e.g., need for affiliation as studied by Griner & Smith, 2002), future research into the
different motivational determinants of social identity seems of primary importance for the
study of intergroup emotions. Motivation was not a major concern of this thesis. In retrospect
it should have been. The reason why people identify with a social group in a given context, is
likely to affect the way in which social identity salience in turn impacts on appraisals and
emotions experienced as a group member and about others as group members. In the review
of the literature it was discussed how the primacy of “self-esteem enhancement” as a
fundamental motivation in social identification has been increasingly questioned, leading to
the exploration of a wider range of motives (Brown, 2000; Rubin, & Hewstone, 1998;
Vignoles, Chryssochoou, & Breakwell, 2003). The study of different motivations underlying
social identity (including self-esteem enhancement as proposed by social identity theory,
reducing intergroup uncertainty as proposed by self-categorization theory, and the need to feel
unique and different as proposed by optimal distinctiveness theory) as well as the study of
their functionality in a given context (e.g., self-insight, intergroup comparisons, cohesion,
collective self-esteem, interpersonal comparisons, social interaction opportunities, and
romantic relationships as identified by Deaux et al. 1999), will be crucial in the development
of theories of intergroup emotion.

200
REFERENCES Albert, S., Ashforth, B. & Dutton, J.E. (2000). Organizational identity and identification:
Charting new waters and building new bridges. Academy of Management Review, 25, 13-17.
Antaki, C., Condor, S. & Levine, M. (1996). Social identities in talk: Speaker’s own orientations. British Journal of Social Psychology, 35, 473-492.
Arnold, M. (1960). Emotion and Personality (Vol.1). Psychological aspects. New York: Columbia University Press.
Ashforth, B. & Mael, F. (1989). Social identity theory and the organization. Academy of Management Review, 14, 20-39.
Ashkanasy, Neal M., Haertel, C.E, & Zerbe, W.J. Emotions in the workplace: Research, theory, and practice. Westport, CT, US: Quorum Books/Greenwood Publishing Group,
Averill, J. (1982). Anger as experienced by the angry person: Responses and consequences. In J. Averill, Anger and aggression: An essay on emotion (pp. 159-183). New York: Springer-Verlag.
Banse, R. & Scherer, K.R. (1996). Acoustic profiles in vocal emotion expression. Journal of Personality and Social Psychology, 70, 614-636.
Barsade, S.G., Brief, A.P. & Spataro, S.E. (2003). The affective revolution in organizational behavior: The emergence of a paradigm. In Greenberg, Jerald(Ed.) Organizational behavior: The state of the science (2nd ed.) (pp. 3-52). Mahwah, NJ, US: Lawrence Erlbaum.
Branscombe, N.R. (1998).Thinking about one’s gender group privileges and disadvantages: Consequences for well-being in women and in men. British Journal of Social Psychology, 37, 167-184.
Brascombe, N.R. & Doosje, B. & McGarty, C. (2002). Antecedents and consequences of collective guilt. In Mackie D.M. & Smith E.R. (Eds.), From prejudice to intergroup emotions: Differentiated reactions to social groups. Philadelphia, PA: Psychology Press.
Brewer, M.B. (1991). The social self: On being the same and different at the same time. Personality and Social Psychology Bulletin, 17, 475-482.
Brewer, M.B. (1995). Managing diversity: The role of social identity. In S. E. Jackson & M. N. Ruderman (Eds.), Diversity in work teams (pp. 47-68). Washington: American Psychological Association.
Brewer, M.B. (2001). Ingroup identification and intergroup conflict: When does ingroup love become outgroup hate? In R. Ashmore, L. Jussim, & D. Wilder (Eds.), Social identity, intergroup conflict, and conflict reduction. New York.
Brewer, M.B. & Kramer, R. (1985). The psychology of intergroup attitudes and behavior. Annual Review of Psychology, 36, 219-243.
Brewer, M.B. & Kramer, R. (1986). Choice behavior in social dilemmas: effects of social identity, group size, and decision framing. Journal of Personality and Social Psychology, 50, 543-549.
Brewer, M.B. & Miller, N. (1984). Beyond the contact hypothesis: Theoretical perspectives on desegregation. In N. Miller, & M.B. Brewer (Eds.), Groups in contact: The psychology of desegregation (pp. 281-302). Orlando, FL: Academic Press.
Brown, R. (1996). Tajfel's contribution to the reduction of intergroup conflict. In W.P. Robindon (Ed.), Social groups and identities: developing the legacy of Henri Tajfel (pp. 169-189). Oxford: Butterworth-Heinemann.
Brown, R. (2000). Social identity theory: Past achievements, current problems and future challenges. European Journal of Social Psychology, 30, 745-778.
Brown, R., Hinkle, S., Ely, P.G., Fox-Cardamone, L., Maras, P., & Taylor, L.A. (1992). Recognizing group diversity: Individualist-collectivist and autonomous-relational social orientations and their implications on intergroup process. British Journal of Social Psychology, 31, 327-342.

201
Cameron, J.E. (1999). Social identity and the pursuit of possible selves: Implications for the psychological well-being of university students. Group Dynamics: Theory, Research, and Practice, 3, 179-189.
Capozza, D., Brown, R., Aharpour, S., & Falvo, R. (2001). A comparison of motivational theories of identification. Paper presented at the Small Group Meeting of the European Association of Experimental Social Psychology, Social Identity: Motivational, Emotional and Cultural Aspects. Villasimius (Cagliary, Italy) 6-7 September.
Carporael, L.R., Dawes, R.M., Obrell, J.M., & van de Kragt, A. (1989). Selfishness examined: Cooperation in the absence of egoistic incentives. Behavioral and Brain Sciences, 12, 683-739.
Cialdini, R, Borden, R., Thorne, A., Walker, M., Freeman, S. & Sloan, L. (1976). Basking in reflected glory: Three (football) field studies. Journal of Personality and Social Psychology, 34, 366-375.
Clore, G.L. (1994a). Why emotions require cognition. In P. Ekman & R. Davidson (Eds.), The nature of emotion (pp. 181-191). Oxford: Oxford University Press.
Clore, G.L. (1994b). Why emotions vary in intensity. In P. Ekman & R. Davidson (Eds.), The nature of emotion (pp. 386-393). Oxford: Oxford University Press.
Cotting, D. (1999). Affective consequences of social identification. Unpublished paper, presented at the 11th annual American Psychological Society Convention, Denver.
Crisp, R., Ensari, N., Hewstone, M., & Miller, N. (2002). A dual-route model of crossed categorization effects. In W. Stroebe and M. Hewstone (Eds.), European Review of Social Psychology, Vol. 13 (pp.35-73). East Sussex: Psychology Press.
Crocker, J., & Luhtanen, R. (1990). Collective self-esteem and ingroup bias. Journal of Personality and Social Psychology, 58, 60-67.
Davidson, R. (1994). On emotion, mood and related affective constructs. In P. Ekman & R. Davidson (Eds.), The nature of emotion (pp. 51-55). Oxford: Oxford University Press
Deaux, K. (2000). Models, meaning and motivations. In D. Capozza & R. Brown (Eds.), Social identity processes: Trends in theory and research (pp.1-14). London: Sage.
Deaux, K., Reid, A., Mizrahi, K., Cotting, D. (1999). Connecting the person to the social: The functions of social identification. In T. Tyler, R. Kramer et al. (Eds.), The psychology of the social self: Applied social research (pp. 91-113). Mahwah, NJ: Lawrence Erlbaum Associates.
Deaux, K., Reid, A., Mizrahi, K., & Ethier, K.A. (1995). Parameters of social identity. Journal of Personality and Social Psychology, 68, 280-291.
Deschamps, J. C. (1983). Social attribution. In J. Jaspars, F. D. Finchman, & M. Hewstone (Eds.), Attribution theory and research: Conceptual, developmental and social dimensions (pp.223-240). London: Academic Press.
Deschamps, J.C. & Beauvois, J.L (1994). Attributions intergroupes. In R. Bourhis & J.P Leyens (Eds.), Stéréotypes, discrimination et relations intergroupes (pp. 97-126). Liège : Mardaga.
Devos, T., Silver, L.A., Mackie, D.M., & Smith, E.R. (2002). Experiencing intergroup emotions. In Mackie D.M. & Smith E.R. (Eds.), From prejudice to intergroup emotions: Differentiated reactions to social groups. Philadelphia, PA: Psychology Press.
Dietz-Uhler, B. (1996). The escalation of commitment in political decision-making groups: A social identity approach. European Journal of Social Psychology, 26, 611-629.
Dijker, A.J. (1987). Emotional reactions to ethnic minorities. European Journal of Social Psychology, 17, 305-325.
Dijker, A.J., Koomen, W., van den Heuvel, H., & Frijda, N.H. (1996). Perceived antecedents of emotional reactions in inter-ethnic relations. British Journal of Social Psychology, 35, 313-329.
Doosje, B., Brascombe, N.R., Spears, R & Manstead, A.S.R. (1998). Guilty by association: When one’s group has a negative history. Journal of Personality and Social Psychology, 75, 872-886.

202
Dumont, M., Yzerbyt, V. Y., Wigboldus, D., & Gordijn, E. (in press). Social categorization and fear reactions to the September 11th terrorist attacks. Personality and Social Psychology Bulletin.
Earley, P.C. & Laubach, E. (2001). Creating hybrid team cultures: An empirical test of transnational team functioning. Academy of Management Journal, 43, 26-50.
Edwards, P. (1998). Etude empirique de déterminants de la différentiation des émotions et de leur intensité. Unpublished doctoral dissertation, Department of Psychology, University of Geneva.
Ekman, P. & Friesen, W. (1971). Constants across cultures in the face an emotion. Journal of Personality and Social Psychology, 17, 124-129.
Ellemers, N., Spears, R. & Doosje, B. (2002). Self and social identity. Annual Review of Psychology, 53, 161-186.
Ellsworth, P. (1994). Sense, culture and sensibility. In S. Kitayama & M. R. Markus (Eds.), Emotion and culture: Empirical studies of mutual influence (pp. 23-50). Washington, DC: American Psychological Association.
Ellsworth, P. & Scherer, K.R. (2003). Appraisal processes in emotion. In R.J. Davidson, H. Goldsmith, & K.R. Scherer (Eds.), Handbook of the affective sciences (pp. 572-595). New York and Oxford: Oxford University Press.
Ensari, N. & Miller, N. (1998). Effect of affective reactions by an out-group on preferences for crossed categorization discussion partners. Journal of Personality and Social Psychology, 75, 1503-1527.
Ethier, K. & Deaux, K. (1994). Negotiating social identity when contexts change: Maintaining identification and responding to threat. Journal of Personality and Social Psychology, 67, 243-251.
Festinger, L. (1954). A theory of social comparison. Human Relations, 7, 117-140. Fiss, J. & Hodgers, A. (1997). Conscience de sa faculté: Regards sur soi, regards sur les
autres. Courants : Le Journal des Etudiants de l’Université de Genève, Numéro 96, 32-33.
Folkman, S. & Lazarus, R.S. (1988). Coping as a mediator of emotion. Journal of Personality and Social Psychology, 54, 466-475.
Frijda, N.H. (1986). The emotions. Cambridge: Cambridge University Press. Frijda, N.H. (1993). Moods, emotion episodes and emotions. In M. Lewis & J. M. Haviland
(Eds.), Handbook of emotions (pp. 381- 403). New York: The Guildford Press. Frijda, N.H. (1994). Emotions require cognition, even if simple ones. In P. Ekman & R.
Davidson (Eds.), The nature of emotion (pp. 197-202). Oxford: Oxford University Press.
Frijda, N.H. (2001). The self and emotion. In H. Bosma & S. Kunnen (Eds.), Identity and emotion (pp. 39-57). Cambridge: Cambridge University Press.
Frijda, N.H., Kuipers, P., & ter Schure, E. (1989). Relations among emotion, appraisal and emotional action readiness. Journal of Personality and Social Psychology, 57, 212-228.
Frijda, N.H., & Mesquita, B. (1994). The social roles and functions of emotions. In S. Kitayama & M. R. Markus (Eds.), Emotion and culture: Empirical studies of mutual influence (pp. 51-87). Washington, DC: American Psychological Association.
Frijda, N.H., Ortony, A. Sonnemans, J. & Clore, G.L. (1992). The complexity of intensity: Issues concerning the structure of emotion intensity. In M.S. Clark (Ed.), Emotion: Review of personality and social psychology (pp. 60-89). Newbury Park, CA: SAGE.
Gaertner, S.L., Dovidio, J.F., Anastasio, A., Bachman, B. & Rust, M. (1993). The common ingroup identity model. Recategorization and the reduction of the intergroup bias. European Review of Social Psychology, 4, 1-26.
Garcia-Prieto, P., Bellard, E. & Schneider, S.C. (2003). Experiencing diversity, conflict and emotions in teams. The Journal of Applied Psychology: An International Review: Special issue on Workforce Diversity in An International Context, 52, 413-440.
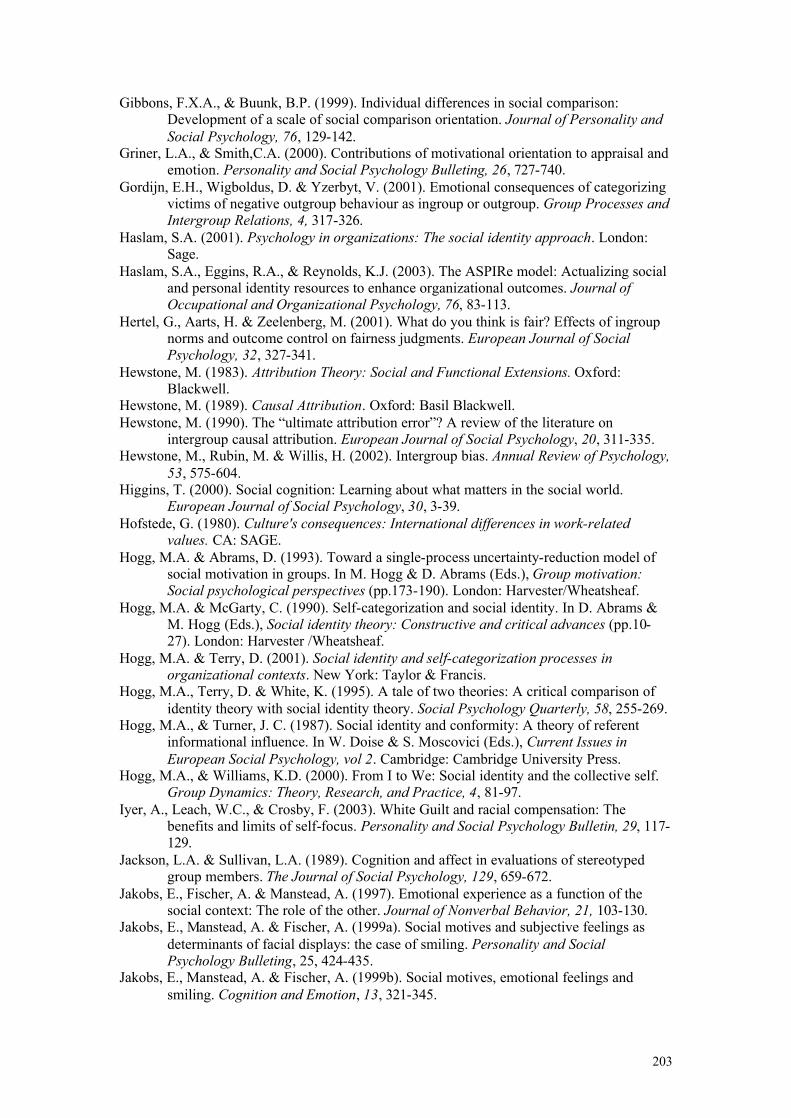
203
Gibbons, F.X.A., & Buunk, B.P. (1999). Individual differences in social comparison: Development of a scale of social comparison orientation. Journal of Personality and Social Psychology, 76, 129-142.
Griner, L.A., & Smith,C.A. (2000). Contributions of motivational orientation to appraisal and emotion. Personality and Social Psychology Bulleting, 26, 727-740.
Gordijn, E.H., Wigboldus, D. & Yzerbyt, V. (2001). Emotional consequences of categorizing victims of negative outgroup behaviour as ingroup or outgroup. Group Processes and Intergroup Relations, 4, 317-326.
Haslam, S.A. (2001). Psychology in organizations: The social identity approach. London: Sage.
Haslam, S.A., Eggins, R.A., & Reynolds, K.J. (2003). The ASPIRe model: Actualizing social and personal identity resources to enhance organizational outcomes. Journal of Occupational and Organizational Psychology, 76, 83-113.
Hertel, G., Aarts, H. & Zeelenberg, M. (2001). What do you think is fair? Effects of ingroup norms and outcome control on fairness judgments. European Journal of Social Psychology, 32, 327-341.
Hewstone, M. (1983). Attribution Theory: Social and Functional Extensions. Oxford: Blackwell.
Hewstone, M. (1989). Causal Attribution. Oxford: Basil Blackwell. Hewstone, M. (1990). The “ultimate attribution error”? A review of the literature on
intergroup causal attribution. European Journal of Social Psychology, 20, 311-335. Hewstone, M., Rubin, M. & Willis, H. (2002). Intergroup bias. Annual Review of Psychology,
53, 575-604. Higgins, T. (2000). Social cognition: Learning about what matters in the social world.
European Journal of Social Psychology, 30, 3-39. Hofstede, G. (1980). Culture's consequences: International differences in work-related
values. CA: SAGE. Hogg, M.A. & Abrams, D. (1993). Toward a single-process uncertainty-reduction model of
social motivation in groups. In M. Hogg & D. Abrams (Eds.), Group motivation: Social psychological perspectives (pp.173-190). London: Harvester/Wheatsheaf.
Hogg, M.A. & McGarty, C. (1990). Self-categorization and social identity. In D. Abrams & M. Hogg (Eds.), Social identity theory: Constructive and critical advances (pp.10-27). London: Harvester /Wheatsheaf.
Hogg, M.A. & Terry, D. (2001). Social identity and self-categorization processes in organizational contexts. New York: Taylor & Francis.
Hogg, M.A., Terry, D. & White, K. (1995). A tale of two theories: A critical comparison of identity theory with social identity theory. Social Psychology Quarterly, 58, 255-269.
Hogg, M.A., & Turner, J. C. (1987). Social identity and conformity: A theory of referent informational influence. In W. Doise & S. Moscovici (Eds.), Current Issues in European Social Psychology, vol 2. Cambridge: Cambridge University Press.
Hogg, M.A., & Williams, K.D. (2000). From I to We: Social identity and the collective self. Group Dynamics: Theory, Research, and Practice, 4, 81-97.
Iyer, A., Leach, W.C., & Crosby, F. (2003). White Guilt and racial compensation: The benefits and limits of self-focus. Personality and Social Psychology Bulletin, 29, 117-129.
Jackson, L.A. & Sullivan, L.A. (1989). Cognition and affect in evaluations of stereotyped group members. The Journal of Social Psychology, 129, 659-672.
Jakobs, E., Fischer, A. & Manstead, A. (1997). Emotional experience as a function of the social context: The role of the other. Journal of Nonverbal Behavior, 21, 103-130.
Jakobs, E., Manstead, A. & Fischer, A. (1999a). Social motives and subjective feelings as determinants of facial displays: the case of smiling. Personality and Social Psychology Bulleting, 25, 424-435.
Jakobs, E., Manstead, A. & Fischer, A. (1999b). Social motives, emotional feelings and smiling. Cognition and Emotion, 13, 321-345.

204
Jetten, J., Spears, R. & Manstead, A.R. (1996). Intergroup norms and intergroup discrimination: Distinctive self-categorization and social identity effects. Journal of Personality and Social Psychology, 71, 1222-1233.
Jetten, J., Spears, R. & Manstead, A.R. (1997). Strength of identification and intergroup differentiation: The influence of group norms. European Journal of Social Psychology, 27, 603-609
Jetten, J., Hogg, M.A., & Mullin, B. (2000). In-group variability and motivation to reduce subjective uncertainty. Group Dynamics: Theory, Research, and Practice, 4, 184-198.
Jetten, J., Postmes, T., McAuliffe, B.J. (2002). “We are all individuals“: Group norms of individualism and collectivism, levels of identification and identity threat. European Journal of Social psychology, 32, 189-207.
Jones, E.E., & Nisbett, R.E. (1972). The actor and the observer: divergent perceptions of the causes of behavior. In E.E. Jones, D.E. Kanouse, H.H. Kelley, R.E. Nisbett, S. Valins, & B. Weiner (Eds.), Attribution: Perceiving causes of behavior (pp. 79-94).. Morristown, NJ: General Learning Press.
Kappas, A. (1996). The sociality of appraisals: Impact of social situations on the evaluation of emotion antecedent events and physiological and expressive reactions. In N.H. Frijda (Ed.), Proceedings of the Ninth Conference of The International Society for Research on Emotions (pp.116-120). Toronto: International Society for Research on Emotions.
Kelley, H.H. (1967). Attribution theory in social psychology. In L. Levine (Ed.), Nebraska Symposium on Motivation (pp.192-238). Lincoln: University of Nebraska Press.
Keltner, D. Gruendfel, D. & Anderson, C. (2003). Power, approach, and inhibition. Psychological Review, 110, 265-284.
Kiesler, S., Waters, K., Sproull, L. (1996). A prisoner’s dilemma experiment on cooperation with people and human-like computers. Journal of Personality and Social Psychology, 70, 47-65.
Kollock, P. (1998). Social dilemmas: The anatomy of cooperation. Annual Review of Sociology, 24, 183-214.
Komorita, S.S., Parks, C.D. (1996). Social dilemmas. Boulder, CO: West view. Komorita, S.S., & Parks, C.D. (1995). Interpersonal relations: Mixed-motive interaction.
Annual Review of Psychology, 46, 183-207. Kramer, R.M. (1983). Cooperation and organizational identification. In J.K. Murnighan (Ed.),
Social psychology in organizations: Advances in theory and practice (pp. 244-268). Englewood Cliffs, NJ: Prentice-Hall.
Kramer, R.M., & Brewer, M.B. (1984). Effects of group identity on resource use in a simulated commons dilemma. Journal of Personality and Social Psychology, 46, 1044-1057.
Kreis, G. (1994). La Suisse chemin faisant. Raport de synthèse du programme national de recherche 21 “Pluralisme culture et identité nationale”. Lausanne : L’Age d’Homme.
Lazarus, R.S. (1966). Psychological stress and the coping process. New York: McGraw Hill. Lazarus, R.S. (1968). Emotions and adaptation: Conceptual and empirical relations. In W.J.
Arnold (Ed.), Nebraska Symposium on Motivation, Vol. 16 (pp.175-270). Lincoln: University of Nebraska Press.
Lazarus, R.S. & Folkman, S. (1984). Stress, appraisal, and coping. New York: Springer-Verlag.
Lazarus, R.S. (1991a). Progress on a cognitive-motivational-relational theory of emotion. American Psychologist, 46, 819-34.
Lazarus, R.S. (1991b). Social Influence. Emotion and adaptation. New York, Oxford: Oxford University Press.
Leary, M. (2003). The self and emotion: The role of self-reflection in the generation and regulation of affective experience. In R.J. Davidson, H. Goldsmith, & K.R. Scherer (Eds.), Handbook of the affective sciences (pp. 611-636). New York and Oxford: Oxford University Press.

205
Leach, C.W., Spears, R., Brascombe, N.R., & Doosje, B. (2003). Malicious Pleasure: Schadenfreude at the suffering of another group. Journal of Personality and Social Psychology, 84, 932-943.
Liebrand, W.B.G., Messick, D.M, & Wilke, H.A.M. (1992). Social dilemmas: Theoretical issues and research findings. Pergamon: New York.
Lorenzi-Cioldi, F., & Doise, W. (1994) Identité sociale et identité personnelle. In R.Y. Bourhis & J.P. Leyens (Eds.), Stéréotypes, discrimination et relations intergroupes (pp. 69-96). Liège: Mardaga.
Luhtanen, R., & Crocker, J. (1992). A collective self-esteem scale: Self-evaluation of one's social identity. Personality and Social Psychology Bulletin, 18, 302-318.
Mackie, D.M., Devos, T. & Smith E.R. (2000). Intergroup emotions: Explaining offensive action tendencies in an intergroup context. Journal of Personality and Social Psychology, 79, 602-616.
Mackie, D.M. & Smith, E.R. (2002). From prejudice to intergroup emotions: Differentiated reactions to social groups. Philadelphia, PA: Psychology Press.
Mackie, D.M. & Smith, E.R. (1998). Intergroup relations: Insights from a theoretically integrative approach. Psychological Review, 105, 499-529.
Manstead, A. (1991). Emotions in social life. Cognition and Emotion, 5, 353-362. Manstead, A., & Fischer, A. (2001). Social Appraisal: The social world as object of and
influence on appraisal processes. In K.R. Scherer, A. Schorr, & T. Johnstone, (Eds.), Appraisal processes in emotion: Theory, methods, research (pp.221-232). New York and Oxford: Oxford University Press.
Markus, M. R., & Kitayama, S. (1991). Culture and the self: Implications for cognition, emotion, and motivation. Psychological Review, 98, 224-253.
Markus, M. R., & Kitayama, S. (1994). The cultural construction of self and emotion: Implications for social behavior. In S. Kitayama & M. R. Markus (Eds.), Emotion and culture: Empirical studies of mutual influence (pp. 89-130). Washington, DC: American Psychological Association.
Marques, J. & Yzerbyt, V. (1988). The black sheep effect : Judgemental extremity towards ingroup members in inter- and intra- group situations. European Journal of Social Psychology, 18, 287-292.
Marques, J., Yzerbyt, V. & Leyens, J. (1988). The « black sheep effect » : Extremity of judgements toward ingroup and outgroup members as a function of group identification. European Journal of Social Psychology, 18, 1-16.
Matsumoto, D. (1989). Cultural influences on the perception of emotion. Journal of Cross-Cultural Psychology, 20, 92-105.
McAuliffe, B., Jetten, J., Horsney, M., Hogg, M.A. (2003). Individualist and collectivist norms: When it’s ok to go your own way. European Journal of Social Psychology, 33, 57-70.
Mcoy, S.K., & Major, B. (2003). Group identification moderates emotional responses to perceived prejudice. Personality and Social Psychology Bulletin, 29, 1005-1017.
McFarland, C., Buehler, R., & McKay, L. (2001). Affective responses to social comparisons of extremely close others. Social Cognition, 19, 547-586.
McGarty, C. (2001). Social identity theory does not maintain that identification produce bias, and self-categorization theory does not maintain that salience is identification: Two comments on Mummendey, Klink and Brown. British Journal of Social Psychology, 40, 173-176.
Mesquita, B. (2003). Emotions as dynamic cultural phenomena. In R.J. Davidson, H. Goldsmith, & K.R. Scherer (Eds.), Handbook of the affective sciences (pp. 871-890). New York and Oxford: Oxford University Press.
Mesquita, B. & Ellsworth, P. (2001). The role of culture in appraisal. In K.R. Scherer, A. Schorr, & T. Johnstone, (Eds.), Appraisal processes in emotion: Theory, methods, research (pp. 233-248). New York and Oxford: Oxford University Press.
Mesquita, B., & Frijda, N. (1992). Cultural variations in emotions: A review. Psychological Bulletin, 112, 179-204.
206
Mesquita, B., Frijda, N. & Scherer, K.R. (1997). Culture and emotion. In J.E. Berry, P.B. Dasen, & T.S. Saraswathi (Eds.), Handbook of cross-cultural psychology: Basic processes and developmental psychology, Vol.2 (pp.255-297). Boston: Allyn & Bacon.
Messick, D.M., & Brewer, M. (1983). Solving social dilemmas: A review. In L. Wheeler& P. Shaver (Eds.), Review of personality and social psychology, Vol. 4, (pp.11-44). Beverly Hills, CA: Sage.
Messick, D.M., & Sentis, K.P. (1983). Fairness, preference and fairness biases. In D.M. Messick & K.S. Cook (Eds.), Equity theory: Psychological and sociological perspectives (pp. 61-94). Praeger: New York.
Migdal, M., Hewstone, M. & Mullen, B. (1998). The effects of crossed categorization on intergroup evaluations: A meta–analysis. British Journal of Social Psychology, 37, 303-324.
Mikula, G., Scherer, K.R., & Athenstaedt, U. (1998). The role of injustice in the elicitation of differential emotional reactions. Personality and Social Psychology Bulletin, 24, 769-783.
Mullen, B., Brown, R., & Smith, C. (1992). Ingroup bias as a function of salience, relevance and status: An integration. European Journal of Social Psychology, 22, 103-122.
Mullen, B., Migdal, M.J., & Hewstone, M. (2001). Crossed categorization versus simple categorization and intergroup evaluations: a meta-analysis. European Journal of Social Psychology, 31, 721-736.
Mussweiler, T. Gabriel, S. & Bodenhausen, G.V. (2000). Shifting social identities as a strategy for deflecting threatening social comparisons. Journal of Personality and Social Psychology, 79, 398-409.
Ng, S.H. (1980). The social psychology of power. European Monograph in Social Psychology, 21. London: Academic Press.
Ng, S.H. (1982). Power and intergroup discrimination. In H. Tajfel, (Ed.), Social identity and intergroup relations. Cambridge: Cambridge University Press.
Ng, S.H. (1984). Power and intergroup discrimination. In H. Tajfel, (Ed.) The social dimension: European developments in social psychology. Cambridge: Cambridge University Press.
Ng, S.H., & Cram, F. (1988). Intergroup bias by defensive and offensive groups in majority and minority conditions. Journal of Personality and Social Psychology, 55, 749.757.
Ortony, A., Clore, G. L., & Collins, A. (1988). The cognitive structure of emotions. New York: Cambridge University Press.
Parkinson, B. (1997). Untangling the appraisal emotion connection. Personality and Social Psychology Review, 1, 62-79.
Parkinson, B. (2001). Putting appraisal in context. In K.R. Scherer, A. Schorr, & T. Johnstone, (Eds.), Appraisal processes in emotion: Theory, methods, research (pp. 173-186). New York and Oxford: Oxford University Press.
Parkinson, B., & Manstead, A. (1992). Appraisal as a cause of emotion. In M.S. Clark (Ed.), Emotion: Review of personality and social psychology, Vol.13 (pp. 12-149). Newbury Park, CA : SAGE.
Parkinson, B., & Manstead, A. (1993). Making sense of emotion in social stories and social life. Cognition and Emotion, 7, 295-323.
Pettigrew, T.F. (1979). The ultimate attribution error: Extending Allport’s cognitive analysis of prejudice. Personality and Social Psychology Bulletin, 5, 461-476.
Randel, A. E.(2000). How do members of groups diverse on multiple dimensions conceptualize one another? Social contextual triggers and work group conflict implications of identity salience. Paper presented at the Academy of Management Meetings. Toronto, 4-9 August.
Randel, A.E. (2002). Identity salience: A moderator of the relationship between group gender composition and work group conflict. Journal of Organizational Behaviour, 23, 749-766.

207
Reid, A., & Deaux, K. (1996). Relationship between social and personal identities: Segregation or integration ? Journal of Personality and Social Psychology, 71, 1084-1091
Roseman, I. (1984). Cognitive determinants of emotion: A structural theory. In P. Shaver (Ed.), Review of Personality and Social Psychology, Vol. 5 (pp.11-36). Beverly Hills, CA: SAGE.
Roseman, I. (1991). Appraisal determinants of discrete emotions. Cognition and Emotion, 5, 161-200.
Roseman, I., Dhawan, N., Rettek, S. I., Naidu, R. K., & Thapa, K. (1995). Cultural differences and cross-cultural similarities in appraisals and emotional responses. Journal of Cross-Cultural Psychology, 26, 23-48.
Rubin, M. & Hewstone, M. (1998). Social identity theory’s self-esteem hypothesis: A review and some suggestions for clarification. Personality and Social Psychological Review, 2, 40-62.
Sachdev, I. & Bourhis, R.Y. (1991). Power and status differentials in minority and majority group relations. European Journal of Social Psychology, 21, 1-24.
Scherer, K. (1984a). Emotion as a multicomponent process: A model and some cross-cultural data. In P. Shaver (Ed.), Review of personality and social psychology, Vol. 5 (pp. 37-63). Beverly Hills, CA: SAGE.
Scherer, K. (1984b). On the nature and the function of emotion: A component process approach. In K. R. Scherer & P. Ekman (Eds.), Approaches to emotion (pp.293-317). Hillsdale, NJ: Erlbaum.
Scherer, K. R. (1988). Criteria for emotion-antecedent appraisal: A review. In V. Hamilton, G. H. Bower, & N. Frijda (Eds.), Cognitive perspectives on emotion and motivation (pp. 89-126). Dordrecht: Kluwer
Scherer, K.R. (1994). Toward a concept of “modal emotions”. In P. Ekman, & R.J. Davidson (Eds.), The nature of emotion: Fundamental questions (pp. 25-31). Oxford: Oxford University Press.
Scherer, K.R. (1997). The role of culture in emotion-antecedent appraisal. Journal of Personality and Social Psychology, 73 , 902-922.
Scherer, K.R.(1999). On the sequential nature of the appraisal processes: Indirect evidence from a recognition task. Cognition and Emotion, 13, 763-793.
Scherer, K.R. (2000). Psychological models of emotion. In J. Borod (Ed.), The neuropsychology of emotion (pp.137-162). Oxford/New York: Oxford University Press.
Scherer, K. R. (2001a). Appraisal considered as a process of multi-level sequential checking. In K. R. Scherer, A. Schorr, & T. Johnstone (Eds.), Appraisal processes in emotion: Theory, methods, research (pp. 92-120). New York and Oxford: Oxford University Press.
Scherer, K.R. (2001b). The nature and study of appraisal: A review of issues. In K.R. Scherer, A. Schorr, & T. Johnstone (Eds.), Appraisal processes in emotion: Theory, methods, research (pp. 369-391). New York and Oxford: Oxford University Press.
Scherer, K.R. & Ceschi, G. (1997). Lost luggage: A field study of emotion- antecedent appraisal. Motivation and Emotion, 21, 211-235.
Schmitt, M.T. & Branscombe, N.R. (2002). The internal and external causal loci of attributions to prejudice. Personality and Social Psychology Bulletin, 28, 620-628.
Schmitt, M.T., Branscombe, N.R., Kobrynowicz, D. & Owen, S. (2002). Perceiving discrimination against one’s gender group has different implications for well-being in women and men. Society for Personality and Social Psychology, 28, 197-210.
Schorr, A. (2001) Subjective measurement in appraisal research: Present state and future perspectives. In K. R. Scherer, A. Schorr, & T. Johnstone (Eds.), Appraisal processes in emotion: Theory, methods, research (pp. 331-349). New York and Oxford: Oxford University Press
Seta, J.J, & Seta, C.E. (1996). Big fish in small ponds: A social hierarchy analysis of intergroup bias. Journal of Personality and Social Psychology, 71, 1210-1221.

208
Simon, B., Pantaleo, G. & Mummendey, A. (1995). Unique individual or interchangeable group member ? The accentuation of intragroup differences versus similarities as an indicator of the individual self versus the collective self. Journal of Personality and Social Psychology, 68, 106-119.
Smith, C.A.(1989). Dimensions of appraisal and physiological response in emotion. Journal of Personality and Social Psychology, 56, 339-353.
Smith, C.A., & Ellsworth, P. (1985). Patterns of cognitive appraisal in emotion. Journal of Personality and Social Psychology, 48, 813-838.
Smith, C.A., & Ellsworth, P. (1987). Patterns of appraisal and emotion related to taking an exam. Journal of Personality and Social Psychology, 52, 475-488.
Smith, C.A., Haynes, K.N., Lazarus, R.S., & Pope, L.K. (1993). In search of the “hot” cognitions: Attributions, appraisals and their relation to emotion. Journal of Personality and Social Psychology, 65, 916-929.
Smith, C.A. & Lazarus, R.S. (1993). Appraisal components, core relational themes, and the emotions. Cognition and Emotion, 7, 233-269.
Smith, C.A. & Scott, H.S. (1997). A componential approach to the meaning of facial expressions. In J.A. Russel & J..M. Fernadez-Dols (Eds.), The psychology of facial expressions: Studies in emotion and social interaction (pp. 229-254). Cambridge and New York: Cambridge University Press.
Smith, E.R. (1993). Social identity and social emotions : Toward a new conceptualization of prejudice. In D.M. Mackie & D.L. Hamilton (Eds.), Affect cognition and stereotyping : interactive processes in group perception (pp. 297- 315). New York : Academic Press.
Smith, E.R. (1999). Affective and cognitive implications of a group becoming part of the self: New models of prejudice and of the self-concept. In D. Abrams & M. Hogg (Eds.) Social identity and social cognition (pp. 183-196). Malden, MA,: Blackwell Publishers.
Smith, E.R. & Henry, S. (1996). An ingroup becomes part of the self: Response time evidence. Personality and Social Psychology Bulletin, 22, 635-642.
Smith, E.R. & Ho, C. (2002). Prejudice as intergroup emotion: Integrating relative deprivation and social comparison explanations of prejudice. In I. Walker and H. Smith (Eds.) Relative deprivation: Specification, development, and integration (pp. 332-348). New York, NY, US: Cambridge University Press.
Sonnemans, J. (1991). Structure and determinants of emotional intensity. Doctoral dissertation, Amsterdam University, Department of Psychology.
Sonnemans, J. & Frijda, N.H. (1994). The structure of subjective emotional intensity. Cognition and Emotion, 8, 329-350.
Stephan, W.G., & Stephan, C.W. (1989). Antecedents of intergroup anxiety in Asian- Americans and Hispanics-Americans. International Journal of Intercultural Relations, 13, 203-219.
Stone, D.L., & Colella, A. (1996). A model of factors affecting the treatment of disabled individuals in organizations. Academy of Management Review, 21, 352-401.
Schwartz, S.H. (1992). Universals in the structure and content of values. In M.O. Zanna (Ed.) Advances in Experimental Social Psychology (vol25, pp.1-65). New York: Guildford.
Tajfel, H. (1972). La categorization sociale [social categorization]. In S. Moscovici (Ed.) Introduction à la psychologie sociale (Vol.1 , pp.272-302). Paris : Larousse.
Tajfel, H. (1978). Differentiation between social groups: Studies in the social psychology of intergroup relations. London: Academic Press.
Tajfel, H. (1981). Human groups and social categories: Studies in social psychology. Cambridge: Cambridge University Press.
Tajfel, H. (1982). Social psychology of intergroup relations. Annual Review of Psychology, 33, 1-39.
Tajfel, H., Flament, C., Billig, M.G., & Bundy, R.P. (1971). Social categorization and intergroup behavior. European Journal of Social Psychology, 1, 149-178.
209
Tajfel, H., & Turner, J. C. (1979). An integrative theory of intergroup conflict. In W.G. Austin, & S. Worschel (Eds.), The social psychology of intergroup relations (pp.33-47).. Belmont, CA: Wadsworth.
Tajfel, H., & Turner, J. C. (1986). The social identity theory of intergroup behaviour. In S. Worschel & W. G. Austin (Eds.), Psychology of intergroup relations (pp. 7-24). Chicago: Nelson Hall.
Taylor, D. M., & Jaggi, V. (1974). Ethnocentrism and causal attribution in a S. Indian context. Journal of Cross-cultural Psychology, 5, 162-171.
Terry, D.J. & Callan, V. (1998). In-group bias in response to an organizational merger. Group Dynamics: Theory, Research, and Practice, 2, 67-81.
Terry, D. J. & Hogg, M.A. (1996). Group norms and the attitude-behavior relationship: A role for group identification. Personality and Social Psychology Bulletin, 22, 776-793.
Terry, D.J. & O’Brian, A.T. (2001). Status, legitimacy, and ingroup bias in the context of an organizational merger. Group Processes and Intergroup Relations, 4, 271-289
Triandis, H. C. (1990). Cross-cultural studies on individualism and collectivism. In J. Berman (Ed.), Nebraska symposium on motivation (pp. 41-133). Lincoln: University of Nebraska Press.
Triandis, H. (1996). The psychological measurement of cultural syndromes. American Psychologist, 51, 407-415.
Turner, J.C. (1982). Towards a cognitive redefinition of the social group, in H. Tajfel (Ed.), Social identity and intergroup relations (pp. 15-40). Cambridge : Cambridge University Press.
Turner, J.C. (1984). Social identification and psychological group formation. In H. Tajfel (Ed.), The social dimension, Vol.2. Cambridge: Cambridge University Press.
Turner, J.C, Hogg, M.A., Oakes, P., Reicher, S., & Wetherell, M. (1987). Rediscovering the social group: A self-categorization theory. Oxford, England: Basil Blackwell.
Turner, J.C, Oakes, P., Haslam, S.A., & McGarty, C. (1994). Self and collective: Cognition and social context. Personality and Social Psychology Bulletin, 20, 454-463.
van Reekum, C. (2000). Levels of processing in appraisal: Evidence from computer game generated emotions. Unpublished doctoral dissertation, Department of Psychology and Education Sciences, The University of Geneva.
Vanman, E.J., Kaplan, D.L., & Miller, N. (1991). Facial EMG activity and bias between social groups: a replication and extension. [meeting abstract] Psychophysiology, 28, S59.
Vanman, E.J., & Miller, N. (1993). Applications of emotion theory and research to stereotyping and intergroup relations. In D.M. Mackie & D.L Hamilton (Eds.), Affect, cognition and stereotyping: interactive processes in group perception (pp. 297-315). San Diego: Academic Press.
Vanman, E.J., Paul, B.Y., Kaplan, D.L., & Miller, N. (1990). Facial electromyography differentiates racial bias in imagined cooperative settings. [meeting abstract] Psychophysiology, 27, S63.
Vignoles, V.L., Chryssochoou, X. & Breakwell, G.M. (2003). Evaluating models of identity motivation: Self-esteem is not the whole story. Self and Identity, 1, 201-218.
Wallbott, H.G., & Scherer, K.R. (1988). How universal and specific is emotion experience? Evidence from 27 countries. In Scherer, K.R. (Ed.), Facets of emotions (pp. 31-56). Hillsdale, NJ: Lawrence Erlbaum.
Weiner, B. (1985). An attributional theory of achievement motivation and emotion. Psychological Review, 92, 548-573.
Weiner, B. (1986). An attributional theory of motivation and emotion. New York, NY: Springer-Verlag.
Wherle, T. Kaiser, S., Schmidt, S. & Scherer, K.R. (2000). Studying dynamic models of facial expression of emotion using synthetic animated faces. Journal of Personality and Social Psychology, 78, 105-119.

210
Wit, A.P., & Kerr, N.L. (2002). “Me versus just us versus us all” categorization and cooperation in nested social dilemmas. Journal of Personality and Social Psychology, 83, 616-637.
Yzerbyt, V. Y., Dumont, M., Gordijn, E. & Wigboldus, D.(2002). Intergroup emotions: The impact of self-categorization on reactions to victims. In Mackie D.M. & Smith E.R. (Eds.), From prejudice to intergroup emotions: Differentiated reactions to social groups. Philadelphia, PA: Psychology Press.
Yzerbyt, V. Y., Dumont, M., Wigboldus, D., & Gordijn, E. (in press). I feel for us : Preferences may well need categorization. British Journal of Social Psychology.

Appendix A.1. Selected Press Articles on the Proposed Merger Between the Universities
[not available online]
211

Appendix A.2. Collective Self-Esteem Questionnaire Adapted for this Study (French Version)
[not available online]
212

Appendix A.3. Vignettes, and Appraisal and Emotion Questionnaires
[not available online]
213

Appendix A.4. Additional Statistical Information
A.4.1. Analyses of Appraisals
Table A.4.1.1.Means and standard deviations of appraisals as a function of vignette
Vignette 1 Vignette 2 Vignette 3 Vignette 4 Vignette 5 Vignette 6
Appraisal M SD M SD M SD M SD M SD M SD
Pleasant High (N=42) 3.76 2.39 5.28 2.15 7.00 1.97 2.43 1.62 2.62 1.67 1.83 1.64 Low (N=38) 4.05 2.18 4.89 1.67 6.95 2.33 1.87 1.30 2.08 1.36 1.34 .78
Unpleasant High (N=42) 4.74 2.99 3.62 2.52 2.38 1.99 6.78 2.31 6.83 1.87 7.86 1.62 Low (N=39) 4.29 2.29 3.87 2.25 2.61 2.36 7.20 2.07 7.23 1.75 8.08 1.36
Important High (N=41) 5.27 2.78 5.95 1.51 7.18 2.06 6.78 2.32 6.54 2.38 7.73 1.61 Low (N=39) 4.74 2.64 5.23 2.25 7.33 1.78 7.20 1.93 7.33 1.46 7.53 1.63
Conducive High (N=42) 2.57 1.85 4.14 2.10 5.33 2.93 3.00 2.29 2.83 1.92 2.14 2.12 Low (N=39) 2.99 2.06 3.74 1.81 5.61 2.91 2.23 1.83 2.74 2.11 1.64 1.35
Obstructive High (N=42) 3.26 2.81 2.98 2.19 2.12 1.52 4.90 2.69 4.59 2.82 6.64 2.64 Low (N=39) 3.39 2.50 3.15 2.22 2.49 1.94 5.61 2.48 5.49 2.55 7.36 2.12
Caused by chance High (N=42) 2.21 1.76 2.02 1.57 2.59 2.01 2.33 1.69 2.40 1.96 1.86 1.63 Low (N=39) 2.11 1.58 2.18 1.68 2.02 1.74 2.61 1.94 2.38 1.90 1.61 1.41
Caused by other High (N=42) 6.19 2.47 5.71 2.31 5.57 2.76 5.98 2.53 5.97 2.26 6.81 2.30 Low (N=37) 6.46 1.89 6.37 2.29 6.59 2.09 7.08 1.46 7.24 1.52 7.51 1.46
Intentionally High (N=42) 6.14 2.57 5.38 2.36 5.64 2.87 5.31 2.78 5.19 2.82 6.91 2.44 Low (N=37) 6.65 1.99 6.92 1.88 6.88 1.73 6.84 1.72 6.76 2.05 7.43 1.85
Controllability High (N=42) 3.29 2.17 3.81 1.89 4.74 2.77 3.80 2.13 3.48 2.05 2.68 1.70 Low (N=39) 3.47 2.32 3.72 2.43 4.69 2.59 3.49 2.28 3.46 2.14 2.49 1.83
Adaptability High (N=41) 6.17 2.19 6.85 1.60 7.78 1.94 5.22 2.35 5.63 2.24 4.73 2.41 Low (N=39) 6.68 1.78 6.77 1.78 7.35 1.99 5.77 2.30 5.67 2.29 3.72 2.17
Moral High (N=41) 5.23 2.05 6.70 1.54 7.59 1.43 4.62 1.93 4.80 2.16 3.29 2.08 Low (N=39) 5.57 2.10 6.72 1.75 7.20 1.79 4.72 2.08 5.00 1.95 2.43 1.71
Unjust High (N=42) 4.54 2.21 3.22 1.52 5.13 2.26 5.03 2.34 2.69 1.91 6.71 2.29 Low (N=39) 4.55 1.89 3.64 1.86 5.56 2.19 5.36 2.03 3.23 2.55 7.41 2.18
214

A.4.2. Analyses of Emotion Ratings
Table A.4.2.1.Means and standard deviations of emotions (all cases) as a function of vignette
Vignette 1 Vignette 2 Vignette 3 Vignette 4 Vignette 5 Vignette 6
Emotion M SD M SD M SD M SD M SD M SD
Surprise High (N=41) 3.87 3.12 3.49 2.54 2.51 2.29 3.95 2.71 3.78 2.66 5.58 2.82 Low (N=39) 3.66 2.76 3.78 2.42 2.05 2.60 3.46 2.68 3.67 2.81 4.69 3.17
Interest High (N=41) 3.68 2.76 5.51 2.16 6.05 2.58 3.83 2.70 3.44 2.55 3.63 3.55 Low (N=39) 4.10 3.01 4.43 2.40 5.54 2.87 3.67 2.84 3.72 2.68 5.18 3.32
Relief High (N=42) .95 1.62 1.76 1.98 5.88 2.92 .50 .99 .74 1.40 .50 1.48 Low (N=35) .43 1.03 .88 1.51 5.02 3.08 .23 .81 .31 .99 .00 .00
Happiness High (N=42) 2.12 2.15 4.02 2.26 5.69 2.87 1.36 1.83 1.45 1.90 .42 1.35 Low (N=37) 1.48 2.27 2.16 2.30 4.86 3.16 .43 .83 .84 1.30 .11 .31
Joy High (N=42) 1.38 1.89 2.88 2.30 4.64 3.23 1.05 1.62 1.28 1.85 .31 1.26 Low (N=39) 1.31 1.92 1.90 2.39 3.33 3.10 .51 1.27 .85 1.44 .13 .52
Pride High (N=42) .71 1.40 1.50 1.80 1.69 2.68 .21 .61 .33 .72 .07 .26 Low (N=37) .56 1.30 .92 1.67 .86 1.81 .19 .74 .40 1.21 .00 .00
Anxiety High (N=42) 3.21 2.81 2.93 2.70 .71 1.23 4.88 2.59 4.52 2.52 4.48 2.73 Low (N=39) 2.56 2.83 2.20 2.59 1.05 1.80 4.77 2.93 4.23 2.63 5.54 2.74
Irritation High (N=42) 2.88 3.19 2.43 2.68 .55 .89 4.52 2.87 4.31 4.88 6.28 2.57 Low (N=37) 1.30 1.93 1.27 1.91 1.00 1.76 4.73 2.62 4.13 2.77 6.49 2.21
Frustration High (N=41) 1.05 1.85 1.50 1.90 .44 1.00 2.12 2.74 2.05 2.51 5.27 2.72 Low (N=38) .82 1.89 .97 1.96 .76 1.87 2.71 2.91 2.89 2.87 5.13 3.19
Anger High (N=42) 1.59 2.69 1.33 2.03 .31 .90 3.28 2.97 2.52 2.76 5.26 2.68 Low (N=36) .28 .78 .17 .51 .33 1.04 2.28 2.48 1.89 2.13 4.72 2.99
Shame High (N=41) .15 .57 .17 .59 .02 .16 .22 .76 .27 .92 2.12 2.90 Low (N=38) .06 .23 .00 .00 .13 .81 .16 .97 .00 .00 2.16 2.79
Contempt High (N=40) .22 .77 .42 1.45 .25 .84 1.10 2.23 .75 1.84 2.97 3.10 Low (N=37) .28 1.04 .28 .84 .22 .82 .54 1.24 .57 1.24 2.70 3.10
215

A.4.3. Mediation Analyses Table A.4.3.1. Regression analyses in step 1 (social identity predicting appraisals)
Variable R2 B SEB Beta
DV: Obstructivenessa
Social Identity Condition .04+ -.50 .29 -.19*
DV: Caused by Otherb
Social Identity Condition .06 -.84 .39 -.24*
DV: Caused by Other Intentionallyc
Social Identity Condition .09 -1.15 .40 -.31* +p<.10. *p<.05. **p<.01. Note. a N=81; b N=79; c N=79.
Table A.4.3.2. Regression analyses in step 2 (social identity predicting anger)
Variable R2 B SEB Beta
Social Identity Condition .08* -.77 .31 -.28* +p<.10. *p<.05. **p<.01. Note. N=78
Table A.4.3.3. Regression Analyses in steps 3 and 4 (social identity and appraisals predicting anger)
Variable R2 B SEB Beta
Social Identity Conditiona .26 .94 .28 .34**
Obstructiveness .49 .11 .43**
Social Identity Conditionb .16 .89 .30 .32**
Caused by Other .25 .08 .31*
Social Identity Conditionc .08 .89 .33 .32**
Caused by Other Intentionally .14 .09 .18* +p<.10. *p<.05. **p<.01. Note. a N=78; b N=76; c N=76.
216

Appendix B.1. Counterbalancing Design
Participant’s Social identity condition
Computer’s responses to decisions 1,2 & 3
Computer’s responses to pre-test decisions
1 & 2
Computer number
1 2 3
[Strategy 1] case 1=compete
case 2=collaborate
4 5 6
1 2 3
High collaboration
[Strategy 1] case 1=compete
case 2=collaborate case 3=collaborate
[Strategy 2] case 1=collaborate case 2=compete
4 5 6
1
2 3
[Strategy 1] case 1=compete
case 2=collaborate
4 5 6
1
2 3
High social identity salience
Low collaboration
[Strategy 2] case 1=Collaborate case 2=Compete case 3=Compete
[Strategy 2] case 1=collaborate case 2=compete
4 5 6
1 2 3
[Strategy 1] case 1=compete
case 2=collaborate
4 5 6
1 2 3
High collaboration
[Strategy 1] case 1=compete
case 2=collaborate case 3=collaborate
[Strategy 2] case 1=collaborate case 2=compete
4 5 6
1
2 3
[Strategy 1] case 1=compete
case 2=collaborate
4 5 6
1
2 3
Low social identity salience
Low collaboration
[Strategy 2] case 1=Collaborate case 2=Compete case 3=Compete
[Strategy 2] case 1=collaborate case 2=compete
4 5 6
217

Appendix B.2. Copies of Written Materials
B.2.1. Phone Script for the Experimenter 1. nous avons terminé de lire les matériels, et nous sommes prêts à commencer les négociations , vous aussi ?
Um hum…Ok.
2. nous sommes :____, et vous : ____ ? Ok, parfait !
3. Alors nous utilisons ordinateurs 1,2,3,4,5,6, ok,
4. Toi ? d’accord, alors je note : 1 ira avec 1, 2 avec 2, 3 avec 3, 4 avec 4 et 5 avec 5, 6 avec 6 d’accord. ».
5. Merci, on va commencer maintenant
218

B.2.2. Instructions for Participants in the High Social Identity Condition
But de l’étude :
Le but de cette étude est de mieux comprendre la prise de décision et les réactions émotionnelles lors des négociations virtuelles interdépartementales (par ex. entre les membres de départements fonctionnels différents) dans les entreprises.
Pour cette étude, nous avons construit un outil informatique qui permet de réaliser des négociations virtuelles entre deux membres de départements fonctionnels différents (par ex. entre une personne qui travaille dans le département de marketing et une personne qui travaille dans le département de finances).
Pour essayer de récréer en laboratoire une simulation suffisamment proche de la réalité d’une négociation virtuelle en entreprise, nous avons élaboré un jeux de négociation basé sur les cas d’une vraie entreprise. Il s’agit du constructeur de voitures Porsche, et vous aurez l’occasion de jouer un rôle en tant que négociateur dans une négociation virtuelle.
Instructions générales :
1. Lire attentivement le cas Porsche et la description de votre rôle que je vais vous distribuer.
Une première fois pour avoir une idée générale de la simulation, et une deuxième fois en prenant des notes concernant les objectifs que vous devez atteindre lors de la négociation.
2. Essayez de vous mettre dans la peau de votre personnage et de rester dans votre rôle durant
toute la négociation. 3. Utilisez les données fournies dans le cadre du cas et ne rajoutez pas d’autres informations
219
Instructions concernant votre rôle :
Dans ce groupe vous êtes tous des membres du département de « Recherche et Développement ». Chacun d’entre vous va participer via des ordinateurs à une négociation par paires avec un représentant du département « Production ». Le groupe des représentants du département « Production » se trouvent eux dans un autre laboratoire identique à celui ci. Sachez que le département « Recherche et Développement » vous accorde toute sa confiance. Vos chercheurs savent que vous partagez tous les mêmes valeurs et objectifs :
t
• l’excellence dans la recherche • rester le numéro un dans la technologie automobile • chercher continuellement des occasions pour développer des nouveaux proje s au
sein de Porsche. Le département « Recherche et Développement » compte sur vous pour défendre à tout prix ses objectifs, mais surtout ils comptent sur vous pour les aider à sauvegarder des postes et pour éviter des réductions au budget du département. Par conséquent il est dans votre intérêt de gagner le plus de points possibles lors de ce jeu de négociation.
220

B.2.3. Instructions for Participants in the Low Social Identity Condition
But de l’étude :
Le but de cette étude est de mieux comprendre la prise de décision et les réactions émotionnelles lors des négociations virtuelles interpersonnelles (c-à-d. entre collaborateurs) dans les entreprises.
Dans le cadre de cette étude, nous avons construit un outil informatique qui permet de réaliser des négociations virtuelles entre deux personnes.
Pour essayer de récréer en laboratoire une simulation suffisamment proche de la réalité d’une négociation virtuelle en entreprise, nous avons élaboré un jeux de négociation basé sur les cas d’une vraie entreprise. Il s’agit du constructeur de voitures Porsche, et vous aurez l’occasion de jouer un rôle en tant que négociateur dans une négociation virtuelle.
Instructions générales :
1. Lire attentivement le cas Porsche et la description de votre rôle que je vais vous distribuer.
Une première fois pour avoir une idée générale de la simulation, et une deuxième fois en prenant des notes concernant les objectifs que vous devez atteindre lors de la négociation.
2. Utilisez les données fournies dans le cadre du cas et ne rajoutez pas d’autres informations
Instructions concernant votre rôle :
Chacun d’entre vous va participer à une négociation via l’ordinateur par paires avec une autre personne qui se trouve dans un autre laboratoire identique à celui ci.
221

B.2.4. Description of The Porsche Company Case
Informations sur la compagnie PORSCHE Chaque année, Porsche doit élaborer une stratégie de commercialisation pour sa
gamme 911 de modèles de voitures Sport.
Votre mission est d’élaborer une stratégie de produits pour l’année suivante. Celle-ci doit porter sur le volume de production, la ligne de carrosserie, et l’option moteur Turbo. 1. Volume de production : Chaque année, l’usine Porsche ne peut produire plus de 50'000
Carrera répondant aux normes américaines. Le volume idéal est de 30'000 ; en dessous de 30'000, il est difficile de tirer pleinement parti des économies d’échelle. L’an dernier, Porsche a produit 40'000 Carrera.
2. Ligne de carrosserie : La gamme de Carrera comporte deux modèles différents : les coupés
(deux portes à toit de tôle inamovible) et les cabriolets (décapotables à capote en matière souple). L’an dernier, les modèles se répartissaient de la façon suivante : 60% de coupés et 40% de cabriolets.
3. Option moteur Turbo : Porsche a élaboré la 911 Turbo à la fin des années 70 et a commercialisé, sous le nom de 930, une très petite quantité de modèles de sport. La 930 est abandonnée en 1979 pour des raisons techniques liées au moteur turbo. Aujourd’hui les problèmes techniques liés au Turbo sont résolus, et Porsche prend conscience qu’il est temps de réintroduire l’option Turbo sur la Porsche Carrera.
222

B.2.5. Description of The Role of the R&D Department Informations sur votre rôle
Représentant du département de Recherche et Développement
Vos positions : 1. Volume de production : Vous voulez que la compagnie baisse l’actuelle production de 40’000
Porsche Carrera par année à un chiffre de 30’000 pour l’année prochaine. Pour diverses raisons, le Porsche Carrera est un modèle en bout de course. Vous espérez que la compagnie commence à réduire progressivement la production pour vous laisser évoluer vers d’autres projets. Mais vous avez également un autre motif pour vouloir réduire le nombre de Carrera produites: vous souhaitez libérer une des chaînes de fabrication Carrera pour que la recherche-développement puisse en disposer pour fabriquer des voitures de compétition. Il est plus facile de fidéliser la clientèle en gagnant des courses qu’en persistant à produire un modèle dépassé ! 2. Le design de la carrosserie : Vous recommandez que Porsche fabrique 50% de "coupés" et
50% de "cabriolets". Vous avez constitué un bon groupe de chercheurs spécialisés dans les cabriolets que vous ne voulez pas perdre pour deux raisons. D'une part, cela se traduirait par une diminution importante de votre budget, et d'autre part - mais cela personne d’autre ne le sait - ces chercheurs passent une bonne part de leur temps sur le programme de course automobiles, domaine où leurs améliorations en recherche sont capitales. 3. Option Turbo : Vous êtes très favorable à l’installation de l’option moteur Turbo sur la
Porsche Carrera. Porsche est ce qui se fait de mieux dans l’industrie automobile et le turbocompresseur estce qui ce fait de mieux en matière de technologie. Par conséquent Saab, Nissan, GM, Ford et Chrysler ont tous des modèles turbo. Il est gênant que Porsche n’en ait pas, surtout si l’onconsidère que tous les véhicules de course Porsche sont pourvus de turbocompresseur. Vous devez encourager la dynamique de la recherche dans ce domaine. Le programme de courseautomobile occupe largement tous les chercheurs chargés de recherche sur le turbo. Par conséquent vous devez garder ce groupe pour qu’il travaille sur des applications destinées à la production de voitures individuelles. Une option turbo sur la Carrera justifierait que vous gardiez tous les membres de ce groupe.
223

Appendix B.3. Materials Presented in the Computer Program
B.3.1. Introduction Screen 1
PORSCHE USA – SIMULATION D'UNE NÉGOCIATION VIRTUELLE La compagnie Porsche est composée de collaborateurs des départements suivants :
• Recherche et Développement • Production • Affaires Juridiques et Conseil d'Administration • Marketing • Ventes • Finances
Le président de Porsche est conscient que vous avez tous des emplois du temps extrêmement chargés, et que pour cette raison il est de plus en plus difficile d'organiser des réunions auxquelles tout le monde puisse assister. Le Président tient donc absolument à ce que les membres des différents départements se réunissent sans lui et négocient leurs décisions "virtuellement" (via ordinateur). La mission de votre département "Recherche et Développement" est de négocier une stratégie de produits pour l'année 2001 avec le département "Production". Ces trois décisions concernent :
1. Le volume total de la production 2. Le design de la carrosserie 3. Les options disponibles (moteur Turbo)
224

B.3.2. Introduction Screen 2
INSTRUCTIONS POUR LES NÉGOCIATIONS
Vous représentez le département "Recherche et Développement" et vous allez participer à des négociations virtuelles (via ordinateur) avec un représentant du département "Production". Vous allez conduire ces négociations par paires. Pour chaque prise de décision vous aurez deux choix:
• La collaboration: trouver un compromis entre les objectifs de votre département et les objectifs de l'autre département.
• La compétition: défendre les objectifs de votre département par rapport aux objectifs de l'autre département.
Le règles du jeu de négociation: 1. Chacun d'entre vous devra tout d'abord choisir sa stratégie, sans la communiquer à
l'autre personne. 2. Après avoir indiqué votre stratégie, vous serez informé de la stratégie de l'autre
personne. 3. Après chaque tour du jeu, vous recevrez un nombre de points qui sera déterminé par
la combinaison des stratégies choisies par vous et par l'autre joueur. Le but du jeu est d'accumuler le plus de points possibles pour sauvegarder des postes de travail et pour éviter une diminution importante de votre budget. Les points seront distribués comme suit: + Si vous et l'autre joueur choisissez de COLLABORER:
Vous obtenez 2 points tous les deux + Si l'un de vous choisit de COLLABORER mais l'autre choisit la COMPÉTITION:
Celui qui a opté pour la collaboration obtient 0 point, et celui qui a opté pour la compétition obtient 3 points.
+ Si vous et l'autre joueur choisissez la COMPÉTITION: Vous obtenez 1 point tous les deux
+ Le nombre maximum de points est 9 .
Avant de commencer les vraies négociations, vous allez conduire deux négociations "test" pour vous familiariser avec le jeu!
225

B.3.3. Practice Negotiation Screen 1
NÉGOCIATIONS TEST -1-
" NOUVEAU SPOT PUBLICITAIRE " Porsche voudrait introduire un nouveau spot publicitaire. • Votre département "Recherche et Développement" voudrait accepter le nouveau spot. • Le département "Production" voudrait garder le spot de l'an dernier.
QUEL EST VOTRE CHOIX?
Une stratégie de COLLABORATION :
laisser tomber le nouveau spot.
Une stratégie de COMPÉTITION :
accepter le nouveau spot.
Cette stratégie reflète votre intention d'adapter les objectifs de votre
département aux objectifs de l'autre département.
Cette stratégie reflète votre intention de défendre les objectifs de votre
département au détriment des objectifs de l'autre département.
226

B.3.4. Practice Negotiation Screen 2
NÉGOCIATIONS TEST -2- " CHOIX DES COULEURS "
L'année prochaine Porsche veut introduire deux couleurs différentes: le gris anthracite et le rouge bordeaux. La compagnie doit décider quel pourcentage des voitures seront grises et quel pourcentage seront rouges. • Votre département "Recherche et Développement" voudrait produire 50% de voitures grises et
50% de rouges. • Le département "Production" voudrait produire 100% de voitures grises.
QUEL EST VOTRE CHOIX?
Une stratégie de COLLABORATION : produire 70% de voitures grises et 30%
de rouges.
Une stratégie de COMPÉTITION : produire 50% de voitures grises et 50%
de rouges. Cette stratégie reflète votre intention
d'adapter les objectifs de votre département aux objectifs de l'autre
département.
Cette stratégie reflète votre intention de défendre les objectifs de votre
département au détriment des objectifs de l'autre département.
227

B.3.5. Reminder of Rules Screen
RAPPEL DES REGLES
Vous continuerez à négocier par paires avec le représentant du département "Production". Nous vous rappelons que les 3 décisions stratégiques à prendre concernent :
1. Le volume total de la production 2. Le design de la carrosserie 3. Les options disponibles (moteur Turbo)
Pour chaque prise de décision vous devrez choisir entre:
• La collaboration: trouver un compromis entre les objectifs de votre département et les objectifs de l'autre département.
et • La compétition: défendre les objectifs de votre département par rapport aux
objectifs de l'autre département.
L'allocation des points: Le but du jeu est d'accumuler le plus de points possibles pour sauvegarder des postes de travail et pour éviter une diminution importante de votre budget. + Si vous et l'autre joueur choisissez de COLLABORER:
Vous obtenez 2 points tous les deux + Si l'un de vous choisit de COLLABORER mais l'autre choisit la COMPÉTITION:
Celui qui a opté pour la collaboration obtient 0 point, et celui qui a opté pour la compétition obtient 3 points.
+ Si vous et l'autre joueur choisissez la COMPÉTITION: Vous obtenez 1 point tous les deux
+ Le nombre maximum de points est 9 .
228

B.3.6. Real Negotiation Session Screen 1
NÉGOCIATIONS STRATÉGIQUE -1- : " LE VOLUME TOTAL DE LA PRODUCTION "
Chaque année, l'usine Porsche ne peut produire plus de 50'000 Porsche Carreras répondant aux normes américaines. Le volume idéal est de 30'000 ; en dessous de 30'000, il est difficile de tirer pleinement partie des économies d'échelle. L'an dernier, Porsche a produit 40'000 Carreras. • Votre département "Recherche et Développement" voudrait produire 30'000 Porsche
Carreras. • Le département "Production" voudrait produire 50'000 Porsche Carreras.
QUEL EST VOTRE CHOIX?
Une stratégie de COLLABORATION : décider de produire 40,000 Carreras.
Une stratégie de COMPÉTITION : décider de produire 30,000 Carreras.
Cette stratégie reflète votre intention d'adapter les objectifs de votre
département aux objectifs de l'autre département.
Cette stratégie reflète votre intention de défendre les objectifs de votre
département au détriment des objectifs de l'autre département.
The Scoring Matrix Used for Decision 1: Volume of Cars.
Computer Production Department
Collaboration Produce 40,000
Competition Produce 50,000
Collaboration Produce 40,000
2
2 0
3
Parti
cipa
nt
R&
D
Competition Produce 30,000
3
0 1
1
229

B.3.7. Real Negotiation Session Screen 2
NÉGOCIATIONS STRATÉGIQUE - 2- " LE DESIGN DE LA CARROSSERIE "
La gamme des Porsche Carreras comporte deux modèles différents : les Coupés (deux portes à toit en tôle inamovible), et les Cabriolets (décapotables à capote en matière souple). L'an dernier, les modèles se répartissaient de façon suivante : 60% de Coupés et 40% de Cabriolets. • Votre département "Recherche et Développement" voudrait produire 50% de Coupés et 50%
de Cabriolets. • Le département "Production" voudrait produire 100% de Coupés.
QUEL EST VOTRE CHOIX?
Une stratégie de COLLABORATION : décider de fabriquer 70% de Coupés et
30% de Cabriolets.
Une stratégie de COMPÉTITION : décider de fabriquer 50% de Coupés et
50% de Cabriolets. Cette stratégie reflète votre intention
d'adapter les objectifs de votre département aux objectifs de l'autre
département.
Cette stratégie reflète votre intention de défendre les objectifs de votre
département au détriment des objectifs de l'autre département.
The Scoring Matrix Used for Decision 2: Type of Cars.
Computer Production Department
Collaboration Produce 70% coupés and
30% cabriolets
Competition Produce 100% coupés
Collaboration Produce 70% coupés and 30% cabriolets
2
2 0
3
Parti
cipa
nt
R&
D
Competition Produce 50% coupés and
50% cabriolets
3
0 1
1
B.3.8. Real Negotiation Session Screen 3
NÉGOCIATIONS STRATÉGIQUE -3- " LES OPTIONS DISPONIBLES (moteur Turbo) "
230

Le turbomoteur augmente considérablement la puissance du moteur en comprimant le mélange air-essence qui entre dans la chambre de combustion. Cela lui donne les avantages d'un moteur plus puissant sans ses inconvénients (poids et frottement de l'air plus importants). • Votre département "Recherche et Développement" voudrait garder l'option Turbo. • Le département "Production" s'oppose à l'option Turbo.
QUEL EST VOTRE CHOIX?
Une stratégie de COLLABORATION : décider de laisser tomber l'option Turbo.
Une stratégie de COMPÉTITION : décider de garder l'option Turbo.
Cette stratégie reflète votre intention d'adapter les objectifs de votre
département aux objectifs de l'autre département.
Cette stratégie reflète votre intention de défendre les objectifs de votre
département au détriment des objectifs de l'autre département.
The Scoring Matrix Used for Decision 3: Turbo Option.
Computer Production Department
Collaboration Keep the turbo
Competition Against the turbo
Collaboration Give up the turbo
2
2 0
3
Parti
cipa
nt
R&
D
Competition Keep the turbo
3
0 1
1
231

Appendix B.4. Computerized Questionnaires
B.4.1. Appraisal Questions
Voici un questionnaire concernant votre interprétation des réponses de l'autre joueur Dans quelle mesure, la stratégie de négociation choisie par l'autre vous est… Désagréable Neutre Agréable 1 2 3 4 5 6 7 8 9
Vous empêche Vous aide d'obtenir a obtenir quelque chose Vous est neutre quelque chose 1 2 3 4 5 6 7 8 9 Dans quelle mesure, la stratégie de négociation choisie par l'autre est quelque chose qui… a de l'importance pour vous ? Pas du tout Moyennement Extrêmement 1 2 3 4 5 6 7 8 9 est causé par son appartenance au département de production ? Pas du tout Moyennement Extrêmement 1 2 3 4 5 6 7 8 9 est le reflet de sa personnalité ? Pas du tout Moyennement Extrêmement 1 2 3 4 5 6 7 8 9 est dirigé intentionnellement contre vous ? Pas du tout Moyennement Extrêmement 1 2 3 4 5 6 7 8 9 est contrôlable ? Pas du tout Moyennement Extrêmement 1 2 3 4 5 6 7 8 9 est considéré comme inéquitable ou injuste par vous ? Pas du tout Moyennement Extrêmement 1 2 3 4 5 6 7 8 9 serait consideré comme inéquitable ou injuste par les autres membres de votre département? Pas du tout Moyennement Extrêmement 1 2 3 4 5 6 7 8 9
232

B.4.2. Emotion Questions Voici un questionnaire concernant vos sentiments par rapport aux réponses de l'autre joueur Dans quelle mesure, la stratégie de négociation choisie par l'autre vous a provoqué l'émotion suivante: Surpris ? Pas du tout Très faiblement Moyennement Très fortement 1 2 3 4 5 6 7 8 9 Soulagé ? Pas du tout Très faiblement Moyennement Très fortement 1 2 3 4 5 6 7 8 9 Satisfait ? Pas du tout Très faiblement Moyennement Très fortement 1 2 3 4 5 6 7 8 9 Content ? Pas du tout Très faiblement Moyennement Très fortement 1 2 3 4 5 6 7 8 9 Irrité ? Pas du tout Très faiblement Moyennement Très fortement 1 2 3 4 5 6 7 8 9 Frustré ? Pas du tout Très faiblement Moyennement Très fortement 1 2 3 4 5 6 7 8 9 En colère ? Pas du tout Très faiblement Moyennement Très fortement 1 2 3 4 5 6 7 8 9 Autre émotion ? (indiquez laquelle) :________________________
233

B.4.3. Social Identity Manipulation Check Questions Voici un questionnaire sur le rôle que vous avez eu dans ce jeu Réfléchissez un moment au département que vous représentiez dans cette négociation... Dans quelle mesure vos décisions ont été influencées par votre appartenance/au département de Recherche et développement? Pas du tout Tout à fait 1 2 3 4 5 6 7 8 9 Vous êtes-vous identifié au département de recherche et développement? Pas du tout Tout à fait 1 2 3 4 5 6 7 8 9 Pour vous, le fait d'appartenir au département de recherche et développement était agréable? Pas du tout Tout à fait 1 2 3 4 5 6 7 8 9 Pour vous, le fait d'appartenir au département de recherche et développement était important? Pas du tout Tout à fait 1 2 3 4 5 6 7 8 9
234

B.4.5. Demographic Information Questions
Participant # :_____________
INFORMATIONS GENERALES
1. Age : ____
2. Sexe : M F
3. Nationalité : __________________
4. Langue maternelle : __________________
5. Quelle est votre faculté :
FAPSE SES LETTRES DROIT oAutre faculté : ____________________ 1. Avez-vous déjà travaillé ?
Oui Non 2. Si OUI, pour combien de temps ? (en mois ou années) : _______ 3. Avez-vous l’habitude de travailler avec des ordinateurs? o pas du tout o un peu o assez o beaucoup
Merci de votre participation !
235

Appendix B5. Additional Statistical Information
B.5.1. Analyses of Appraisals Table 5.1.1.Means and Standard Deviations for Unpleasantess/Pleasantness as a Function of Overall Strategy and Social Identity Condition across Events in Time Computer’s Overall
Strategy Social
Identity Pleasant
T 1 Pleasant
T 2 Pleasant
T 3
Mostly Collaborates
Competes Collaborates Collaborates
High M
SD
3.46
1.64
7.46
1.74
7.25
2.11
Low M
SD
3.70
1.03
7.15
1.22
5.85
2.60
Mostly
Competes
Collaborates Competes Competes
High M
SD
6.26
1.51
3.74
1.51
3.48
1.90
Low M
SD
5.87
2.29
3.17
1.81
3.42
2.02
Table 5.1.2. Means and Standard Deviations for Conduciveness as a Function of Overall Strategy and Social Identity Condition across Events in Time Computer’s Overall
Strategy Social
Identity Conducive
T 1 Conducive
T 2 Conducive
T 3
Mostly Collaborates
Competes Collaborates Collaborates
High M
SD
2.83
1.81
7.29
2.03
7.54
2.15
Low M
SD
3.15
1.31
6.95
1.90
5.45
2.70
Mostly
Competes
Collaborates Competes Competes
High M
SD
6.22
1.78
3.26
2.00
3.30
2.26
Low M
SD
5.87
2.13
3.08
1.91
3.37
2.14
236
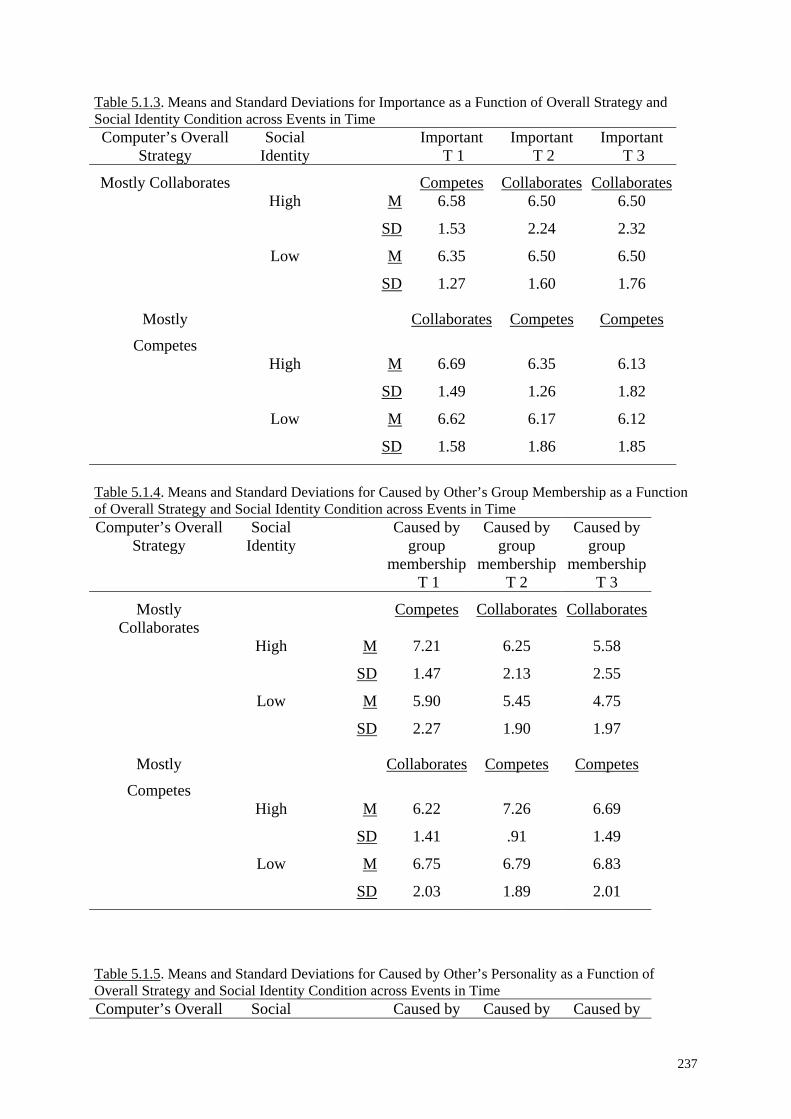
Table 5.1.3. Means and Standard Deviations for Importance as a Function of Overall Strategy and Social Identity Condition across Events in Time Computer’s Overall
Strategy Social
Identity Important
T 1 Important
T 2 Important
T 3
Mostly Collaborates Competes Collaborates Collaborates High M
SD
6.58
1.53
6.50
2.24
6.50
2.32
Low M
SD
6.35
1.27
6.50
1.60
6.50
1.76
Mostly
Competes
Collaborates Competes Competes
High M
SD
6.69
1.49
6.35
1.26
6.13
1.82
Low M
SD
6.62
1.58
6.17
1.86
6.12
1.85
Table 5.1.4. Means and Standard Deviations for Caused by Other’s Group Membership as a Function of Overall Strategy and Social Identity Condition across Events in Time Computer’s Overall
Strategy Social
Identity Caused by
group membership
T 1
Caused by group
membership T 2
Caused by group
membership T 3
Mostly Collaborates
Competes Collaborates Collaborates
High M
SD
7.21
1.47
6.25
2.13
5.58
2.55
Low M
SD
5.90
2.27
5.45
1.90
4.75
1.97
Mostly
Competes
Collaborates Competes Competes
High M
SD
6.22
1.41
7.26
.91
6.69
1.49
Low M
SD
6.75
2.03
6.79
1.89
6.83
2.01
Table 5.1.5. Means and Standard Deviations for Caused by Other’s Personality as a Function of Overall Strategy and Social Identity Condition across Events in Time Computer’s Overall Social Caused by Caused by Caused by
237

Strategy Identity personality T 1
personality T 2
personality T 3
Mostly Collaborates
Competes Collaborates Collaborates
High M
SD
5.37
1.93
4.21
2.12
4.12
2.07
Low M
SD
5.05
1.90
4.55
2.19
4.45
2.33
Mostly
Competes
Collaborates Competes Competes
High M
SD
5.35
1.87
4.48
1.90
4.39
1.85
Low M
SD
4.37
2.35
4.71
2.23
4.42
2.53
Table 5.1.6.Means and Standard Deviations for Caused by Other Intentionally as a Function of Overall Strategy and Social Identity Condition across Events in Time Computer’s Overall
Strategy Social
Identity Caused
intentionally T 1
Caused intentionally
T 2
Caused intentionally
T 3
Mostly Collaborates
Competes Collaborates Collaborates
High M
SD
2.50
1.82
2.33
1.88
2.00
1.79
Low M
SD
2.75
1.71
1.95
1.35
1.65
.93
Mostly
Competes
Collaborates Competes Competes
High M
SD
2.26
1.68
2.48
1.38
2.52
1.62
Low M
SD
1.75
.85
2.29
1.52
2.33
1.81
238

Table 5.1.7. Means and Standard Deviations for Controllability as a Function of Overall Strategy and Social Identity Condition across Events in Time
Computer’s Overall Strategy
Social Identity
Controllability T 1
Controllability T 2
Controllability T 3
Mostly Collaborates
Competes Collaborates Collaborates
High M
SD
5.58
2.08
5.29
2.37
5.29
2.47
Low M
SD
4.60
1.82
5.15
1.87
5.25
2.29
Mostly
Competes
Collaborates Competes Competes
High M
SD
5.13
1.96
4.35
1.99
4.17
2.10
Low M
SD
5.29
1.85
4.83
1.83
4.54
1.84
Table 5.1.8. Means and Standard Deviations for Considered as Unfair/Unjust by Self as a Function of Overall Strategy and Social Identity Condition across Events in Time
Computer’s Overall Strategy
Social Identity
Unfair/Unjust Self T 1
Unfair/Unjust Self T 2
Unfair/Unjust Self T 3
Mostly Collaborates
Competes Collaborates Collaborates
High M
SD
4.71
2.25
3.21
2.17
2.25
1.94
Low M
SD
4.00
1.30
2.35
1.75
2.50
1.96
Mostly
Competes
Collaborates Competes Competes
High M
SD
2.74
1.36
3.56
1.70
3.83
2.04
Low M
SD
2.42
1.21
3.33
2.24
3.17
2.08
239

Table 5.1.9. Means and Standard Deviations for Considered as Unfair/Unjust by Ingroup as a Function of Overall Strategy and Social Identity Condition across Events in Time
Computer’s Overall Strategy
Social Identity
Unfair/Unjust Ingroup
T 1
Unfair/Unjust Ingroup
T 2
Unfair/Unjust Ingroup
T 3
Mostly Collaborates
Competes Collaborates Collaborates
High M
SD
5.71
2.44
4.12
2.80
3.17
2.42
Low M
SD
5.00
1.95
3.10
2.31
2.75
2.02
Mostly
Competes
Collaborates Competes Competes
High M
SD
3.56
1.53
5.39
2.02
5.26
2.26
Low M
SD
3.58
1.81
4.67
2.30
4.29
2.40
240

B.5.2. Analyses of Emotion Ratings (all cases) Table B.5.2.1. Means and Standard Deviations for Surprise(all cases) as a Function of Overall Strategy and Social Identity Condition across Events in Time
Computer’s Overall Strategy
Social Identity
Surprise T 1
Surprise T 2
Surprise T 3
Mostly Collaborates
Competes Collaborates Collaborates
High M
SD
3.79
1.91
4.67
2.03
5.29
2.51
Low M
SD
4.35
1.95
5.15
1.78
5.35
2.08
Mostly
Competes
Collaborates Competes Competes
High M
SD
4.22
2.04
4.22
1.83
4.48
2.06
Low M
SD
4.96
1.76
5.00
1.89
4.00
1.88
Table B.5.2.2. Means and Standard Deviations for Relief (all cases) as a Function of Overall Strategy and Social Identity Condition across Events in Time
Computer’s Overall Strategy
Social Identity
Relief T 1
Relief T 2
Relief T 3
Mostly Collaborates
Competes Collaborates Collaborates
High M
SD
2.46
2.04
6.67
2.31
6.54
2.55
Low M
SD
2.10
1.25
6.40
1.96
5.75
2.47
Mostly
Competes
Collaborates Competes Competes
High M
SD
5.43
1.93
2.17
1.23
2.91
2.31
Low M
SD
5.08
2.43
2.17
1.88
2.12
1.75
241

Table B.5.2.3. Means and Standard Deviations for Happiness (all cases) as a Function of Overall Strategy and Social Identity Condition across Events in Time
Computer’s Overall Strategy
Social Identity
Happy T 1
Happy T 2
Happy T 3
Mostly Collaborates
Competes Collaborates Collaborates
High M
SD
2.71
2.17
6.96
2.42
6.83
2.56
Low M
SD
2.40
1.57
6.90
1.80
6.50
2.30
Mostly
Competes
Collaborates Competes Competes
High M
SD
6.61
1.44
2.69
1.71
3.13
2.26
Low M
SD
5.33
2.56
2.29
1.68
2.12
1.62
Table B.5.2.4. Means and Standard Deviations for Satisfaction (all cases) as a Function of Overall Strategy and Social Identity Condition across Events in Time
Computer’s Overall Strategy
Social Identity
Satisfied T 1
Satisfied T 2
Satisfied T 3
Mostly Collaborates
Competes Collaborates Collaborates
High M
SD
2.87
2.02
6.87
2.36
7.21
2.35
Low M
SD
2.35
1.81
7.00
2.05
6.50
2.48
Mostly
Competes
Collaborates Competes Competes
High M
SD
6.74
1.63
2.78
1.86
3.39
2.39
Low M
SD
5.29
2.44
2.75
2.00
2.54
1.89
242
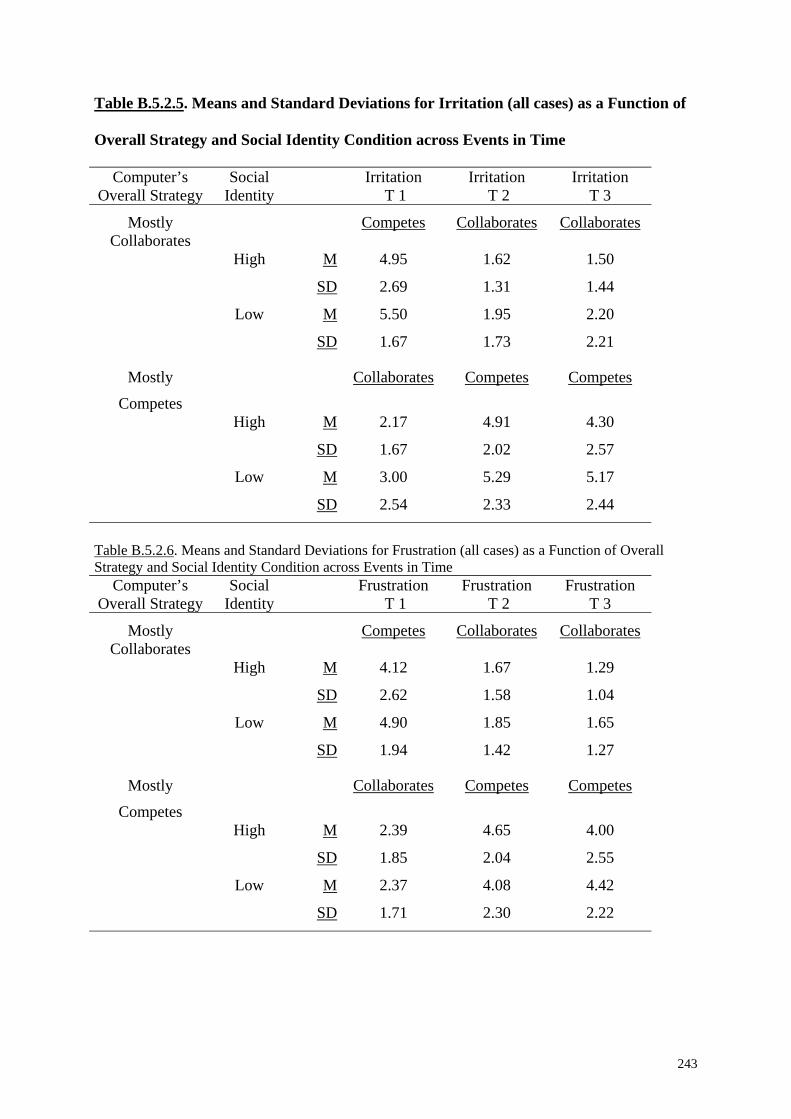
Table B.5.2.5. Means and Standard Deviations for Irritation (all cases) as a Function of
Overall Strategy and Social Identity Condition across Events in Time
Computer’s Overall Strategy
Social Identity
Irritation T 1
Irritation T 2
Irritation T 3
Mostly Collaborates
Competes Collaborates Collaborates
High M
SD
4.95
2.69
1.62
1.31
1.50
1.44
Low M
SD
5.50
1.67
1.95
1.73
2.20
2.21
Mostly
Competes
Collaborates Competes Competes
High M
SD
2.17
1.67
4.91
2.02
4.30
2.57
Low M
SD
3.00
2.54
5.29
2.33
5.17
2.44
Table B.5.2.6. Means and Standard Deviations for Frustration (all cases) as a Function of Overall Strategy and Social Identity Condition across Events in Time
Computer’s Overall Strategy
Social Identity
Frustration T 1
Frustration T 2
Frustration T 3
Mostly Collaborates
Competes Collaborates Collaborates
High M
SD
4.12
2.62
1.67
1.58
1.29
1.04
Low M
SD
4.90
1.94
1.85
1.42
1.65
1.27
Mostly
Competes
Collaborates Competes Competes
High M
SD
2.39
1.85
4.65
2.04
4.00
2.55
Low M
SD
2.37
1.71
4.08
2.30
4.42
2.22
243

Table B.5.2.7. Means and Standard Deviations for Anger (all cases) as a Function of Overall Strategy and Social Identity Condition across Events in Time
Computer’s Overall Strategy
Social Identity
Anger T 1
Anger T 2
Anger T 3
Mostly Collaborates
Competes Collaborates Collaborates
High M
SD
3.58
2.48
1.67
1.57
1.54
1.28
Low M
SD
4.15
2.00
1.30
.73
1.75
1.48
Mostly
Competes
Collaborates Competes Competes
High M
SD
1.30
.76
3.69
2.05
3.43
2.39
Low M
SD
2.29
2.09
4.21
2.68
4.21
2.48
244

B.5.3. Analyses of Positive and Negative Emotion Variables (all cases) Table B.5.3.1. Means and Standard Deviations for Positive Emotions (all cases) as a Function of Overall Strategy and Social Identity Condition across Events in Time
Computer’s Overall Strategy
Social Identity
Positive Emotions
T 1
Positive Emotions
T 2
Positive Emotions
T 3
Mostly Collaborates
Competes Collaborates Collaborates
High M
SD
2.68
1.91
6.88
2.28
6.86
2.39
Low M
SD
2.28
1.46
6.77
2.40
6.25
2.24
Mostly
Competes
Collaborates Competes Competes
High M
SD
6.26
1.43
2.55
1.47
3.14
2.24
Low M
SD
5.23
2.29
2.40
1.61
2.26
1.62
Table B.5.3.2. Means and Standard Deviations for Negative Emotions (all cases) as a Function of Overall Strategy and Social Identity Condition across Events in Time
Computer’s Overall Strategy
Social Identity
Negative Emotions
T 1
Negative Emotions
T 2
Negative Emotions
T 3
Mostly Collaborates
Competes Collaborates Collaborates
High M
SD
4.22
2.28
1.65
1.44
1.44
1.09
Low M
SD
4.85
1.56
1.70
1.79
1.87
1.35
Mostly
Competes
Collaborates Competes Competes
High M
SD
1.95
1.16
4.39
1.83
3.91
2.27
Low M
SD
2.55
1.87
4.53
1.98
4.60
2.08
B.5.4. Analyses of Positive and Negative Emotion Variables (cases with values above 1)
245

Table B.5.4.1. Means and Standard Deviations for Positive Emotions (only values above 1) as a Function of Overall Strategy and Social Identity Condition across Events in Time
Computer’s Overall Strategy
Social Identity
Positive Emotions
T 1
Positive Emotions
T 2
Positive Emotions
T 3 Mostly
Collaborates Competes Collaborates Collaborates
High MSD
% not felt
3.80 1.70
(N=17)
29.20
7.10 1.91
(N=23)
4.20
7.13 2.04
(N=23)
4.20
Low MSD
% not felt
3.17 1.28
(N=13)
35.00
6.87 1.62
(N=20) 0
6.63 1.89
(N=19)
5.00
Mostly Competes
Collaborates Competes Competes
High MSD
% not felt
6.32 1.36
(N=23) 0
3.02 1.46
(N=20)
13.00
3.79 2.04
(N=19)
17.40
Low MSD
% not felt
5.84 1.72
(N=21)
12.50
3.44 1.49
(N=18)
25.00
3.23 1.72
(N=17)
29.20
Note. % not felt= percentage of participants reporting a scale value of 1 “not at all pertinent” for the emotion
246

Table B.5.4.2. Means and Standard Deviations for Negative Emotions (only values above 1) as a Function of Overall Strategy and Social Identity Condition across Events in Time
Computer’s Overall Strategy
Social Identity
Negative Emotions
T 1
Negative Emotions
T 2
Negative Emotions
T 3 Mostly
Collaborates Competes Collaborates Collaborates
High MSD
% not felt
5.00 1.94
(N=22)
8.30
3.20 1.77
(N=8)
66.70
3.47 1.39
(N=5)
79.20
Low MSD
% not felt
4.98 1.41
(N=20) 0
2.88 1.58
(N=10)
50.00
3.20 1.64
(N=11)
45.00
Mostly Competes
Collaborates Competes Competes
High MSD
% not felt
3.70 1.35
(N=13)
43.5
4.84 1.45
(N=21)
8.70
5.18 1.71
(N=18)
21.70
Low MSD
% not felt
4.09 1.80
(N=14)
41.70
5.20 1.68
(N=22)
8.30
5.17 1.75
(N=22)
8.30
Note. % not felt= percentage of participants reporting a scale value of 1 “not at all pertinent” for the emotion
247

B.5.5. Mediation Analyses Table B.5.5.1. Regression analyses for Step 1 (social identity predicting appraisals)
Variable R2 B SEB Beta
DV: Conduciveness a
Social Identity Condition .01 .34 .57 .09
DV: Caused by other’s group membership Social Identity Condition .09 -.68 .35 -.30+
DV: Considered as unjust/unfair by ingroupc
Social Identity Condition .01 -.20 .47 -.06
+p=.06. Note. Univariate outliers were removed so that a =47; b N=41, c N=42
Table B.5.5.2. Regression analysis for step 2 (social identity predicting positive emotions) Variable R2 B SEB Beta
Social Identity Condition .07 1.02 .56 .27+ +p=.07. Note. Univariate outliers were removed before computer “positive emotions” so that N=46 Table B.5.5.3. Regression analyses summary for steps 3 and 4 (social identity and appraisals predicting positive emotions)
Variable R2 B SEB Beta
Social Identity Conditiona .37 .83 .47 .21+
Conduciveness .55 .12 .55*
Social Identity Conditionb .06 .95 .62 .25
Caused by Other’s Group Membership .00 .27 .03
Social Identity Conditionc .13 1.13 .61 .28+
Considered as Unjust by Ingroup Members .20 -.21
+p=.08. Note. Univariate outliers were removed so that a N=46; b N=40; c N=42.
248

Appendix C.1. Thomas-Kilmann Questionnaire (French Version)
[not available online]
249
Appendix C.2. Copies of Written Materials
C.2.1. Scripts for the Oral Feedback
C.2.1.1. General Feedback
INTRODUCTION
Bonjour et merci de votre participation à cette recherche.
Si je su s en tra n de l re cette introduction c'est simplement pour nous assurer que tous les participants reçoivent exactement
i i i les mêmes informations.
Cette recherche est conduite par Patricia Garcia-Prieto et Véronique Tran dans le cadre de leurs doctorats en psychologie des émotions sous la direction du Prof. Scherer.
Avant toute chose, nous tenons à vous rappeler que : 1. votre participation est volontaire 2. vous pouvez vous retirer de l’expérience à n’importe quel moment (mais vous
devez effectuer la totalité de l’expérience pour obtenir les crédits) 3. toutes les informations que nous allons recueillir resteront strictement
confidentielles.
Avant de participer à cet exercice, nous voudrions vous donner quelques informations complémentaires sur le questionnaire que vous avez complété lors de la première phase de cette étude.
Ce questionnaire a été crée par deux chercheurs américains, Thomas et Kilmann en 1974 ; il sert à évaluer les choix que fait une personne pour résoudre un conflit. Deux modes de résolution ont été retenus : 1. un mode qui donne plutôt de l'importance aux relations 2. un mode qui donne plutôt de l'importance à la tâche
Des recherches récentes sur les négociations en entreprise ont montré que pour résoudre des conflits à long terme, c'est le mode favorisant les relations qui est le plus adapté.
250

C.2.1.2. Feedback for Participants in the High Social Identity Salience Condition
Pour cette étude nous avons fait une moyenne de vos scores en vous regroupant dans une entité "étudiants de Psychologie", et nous vous avons comparé aux scores des "étudiants d'HEC".
Nous avons été un peu étonnés par les résultats : il apparaît en effet que les étudiants de Psychologie montrent un style de résolution de conflit qui est beaucoup moins orienté vers les relations que les étudiants de HEC.
Ces résultats sembleraient indiquer que les étudiants de Psychologie serraient donc moins adaptés à la résolution des conflits à long terme que les étudiants de HEC.
Maintenant vous allez participer à une négociation virtuelle, via des ordinateurs, avec des étudiants d'HEC qui participent aussi à cette étude.
C.2.1.2. Feedback for Participants in the Low Social Identity Salience Condition
Pour cette étude nous avons regardé la moyenne de vos scores et de façon générale il y a autant de personnes qui montrent un style de résolution de conflit qui est orienté vers les relations, que vers les tâches.
Maintenant vous allez participer à une négociation virtuelle, via des ordinateurs, avec d'autres étudiants venant de plusieurs facultés qui participent aussi à cette étude.
// Si les étudiants demandent de connaître leurs résultats comparés à d'autres étudiants, dire que malheureusement nous n'avons pas encore fait la moyenne pour les autres facultés.
Maintenant je vais vous distribuer quelques instructions générales sur la négociation que je vous demanderais de lire en silence et je vais vous amener à la salle ou vous aller réaliser cette négociation
251

C.2.2. Written Instructions Packages C.2.2.1. Instructions for Participants in the High Social Identity Salience Condition
But de l’étude :
Le but de cette étude est de mieux comprendre la prise de décision et les réactions émotionnelles lors des négociations virtuelles interdépartementales (par ex. entre les membres de départements fonctionnels différents) dans les entreprises.
Pour cette étude, nous avons construit un outil informatique qui permet de réaliser des négociations virtuelles entre deux membres de départements fonctionnels différents (par ex. entre une personne qui travaille dans le département de marketing et une personne qui travaille dans le département de finances).
Pour essayer de récréer en laboratoire une simulation suffisamment proche de la réalité d’une négociation virtuelle en entreprise, nous avons élaboré un jeux de négociation basé sur les cas d’une vraie entreprise. Il s’agit du constructeur de voitures Porsche, et vous aurez l’occasion de jouer un rôle en tant que négociateur dans une négociation virtuelle.
Instructions générales :
4. Lire attentivement le cas Porsche et la description de votre rôle que je vais vous distribuer.
Une première fois pour avoir une idée générale de la simulation, et une deuxième fois en prenant des notes concernant les objectifs que vous devez atteindre lors de la négociation.
5. Essayez de vous mettre dans la peau de votre personnage et de rester dans votre rôle durant
toute la négociation. 6. Utilisez les données fournies dans le cadre du cas et ne rajoutez pas d’autres informations
252

Instructions concernant votre rôle :
Dans le groupe des étudiants de Psychologie vous êtes tous des membres du département de « Recherche et Développement ». Chacun d’entre vous va participer via des ordinateurs à une négociation par paires avec un étudiant d'HEC qui est un représentant du département « Production ». Le groupe des étudiants d'HEC se trouvent eux dans un autre laboratoire identique à celui ci. Sachez que le département « Recherche et Développement » vous accorde toute sa confiance. Vos chercheurs savent que vous partagez tous les mêmes valeurs et objectifs :
t
• l’excellence dans la recherche • rester le numéro un dans la technologie automobile • chercher continuellement des occasions pour développer des nouveaux proje s au
sein de Porsche. Le département « Recherche et Développement » compte sur vous pour défendre à tout prix ses objectifs, mais surtout ils comptent sur vous pour les aider à sauvegarder des postes et pour éviter des réductions au budget du département. Par conséquent il est dans votre intérêt de gagner le plus de points possibles lors de ce jeu de négociation.
253
C.2.2.2. Instructions for Participants in the Low Social Identity Salience Condition
But de l’étude :
Le but de cette étude est de mieux comprendre la prise de décision et les réactions émotionnelles lors des négociations virtuelles interpersonnelles (c-à-d. entre collaborateurs) dans les entreprises.
Dans le cadre de cette étude, nous avons construit un outil informatique qui permet de réaliser des négociations virtuelles entre deux personnes.
Pour essayer de récréer en laboratoire une simulation suffisamment proche de la réalité d’une négociation virtuelle en entreprise, nous avons élaboré un jeux de négociation basé sur les cas d’une vraie entreprise. Il s’agit du constructeur de voitures Porsche, et vous aurez l’occasion de jouer un rôle en tant que négociateur dans une négociation virtuelle.
Instructions générales :
3. Lire attentivement le cas Porsche et la description de votre rôle que je vais vous distribuer.
Une première fois pour avoir une idée générale de la simulation, et une deuxième fois en prenant des notes concernant les objectifs que vous devez atteindre lors de la négociation.
4. Utilisez les données fournies dans le cadre du cas et ne rajoutez pas d’autres informations
Instructions concernant votre rôle :
Chacun d’entre vous va participer à une négociation via l’ordinateur par paires avec une autre personne qui se trouve dans un autre laboratoire identique à celui ci.
254

Appendix C.3. Computerized Questionnaires
C.3.1. Appraisal Questions1
Voici un questionnaire concernant votre interprétation des réponses de l'autre joueur
Dans quelle mesure, la stratégie de négociation choisie par l'autre vous est… Désagréable Neutre Agréable 1 2 3 4 5 6 7 8 9 Vous empêche Vous aide d'obtenir a obtenir quelque chose Vous est neutre quelque chose 1 2 3 4 5 6 7 8 9 Dans quelle mesure, la stratégie de négociation choisie par l'autre est quelque chose qui… a de l'importance pour vous ? Pas du tout Moyennement Extrêmement 1 2 3 4 5 6 7 8 9 est causé par son appartenance à un autre département ? Pas du tout Moyennement Extrêmement 1 2 3 4 5 6 7 8 9 est causé par son appartenance à la section HEC ? Pas du tout Moyennement Extrêmement 1 2 3 4 5 6 7 8 9 est le reflet de sa personnalité ? Pas du tout Moyennement Extrêmement 1 2 3 4 5 6 7 8 9 est dirigé intentionnellement contre vous ? Pas du tout Moyennement Extrêmement 1 2 3 4 5 6 7 8 9 est contrôlable par votre attitude? Pas du tout Moyennement Extrêmement 1 2 3 4 5 6 7 8 9 est inéquitable ou injuste pour vous ? Pas du tout Moyennement Extrêmement 1 2 3 4 5 6 7 8 9
1 The questions underlined indicate that the question was modified or is new compared to study 2.
255
serait considéré comme inéquitable ou injuste par les autres membres de votre département? Pas du tout Moyennement Extrêmement 1 2 3 4 5 6 7 8 9 serait considéré comme inéquitable ou injuste par les autres membres de la section de psychologie? Pas du tout Moyennement Extrêmement 1 2 3 4 5 6 7 8 9
256

C.3.2. Social Identity Manipulation Check Questions2 Voici un questionnaire sur le rôle que vous avez eu dans ce jeu Réfléchissez un moment au département que vous représentiez dans cette négociation... Vous êtes-vous identifié au département de recherche et développement? Pas du tout Tout à fait 1 2 3 4 5 6 7 8 9 Pour vous, le fait d'appartenir au département de recherche et développement était-il important? Pas du tout Tout à fait 1 2 3 4 5 6 7 8 9 Vous êtes-vous identifié à la section de Psychologie? Pas du tout Tout à fait 1 2 3 4 5 6 7 8 9 Pour vous, le fait d'appartenir à la section de Psychologie était-il important? Pas du tout Tout à fait 1 2 3 4 5 6 7 8 9
2 The questions underlined indicate that the question is new compared to study 2.
257

Appendix C.4. Additional Statistical Information
C.4.1. Analyses on Appraisals Table C.4.1.1.Means and Standard Deviations for Unpleasantess/Pleasantness as a Function of Overall Strategy and Social Identity Condition across Events in Time Computer’s Overall
Strategy Social
Identity Pleasant
T 1 Pleasant
T 2 Pleasant
T 3
Mostly Collaborates
Competes Collaborates Collaborates
High M
SD
3.08
1.31
6.58
1.97
6.58
1.83
Low M
SD
2.78
1.25
6.86
1.70
6.00
2.38
Mostly
Competes
Collaborates Competes Competes
High M
SD
6.83
2.04
3.08
1.08
3.25
1.91
Low M
SD
6.78
1.25
2.92
1.54
3.43
1.22
Table C.4.1.2. Means and Standard Deviations for Conduciveness as a Function of Overall Strategy and Social Identity Condition across Events in Time Computer’s Overall
Strategy Social
Identity Conducive
T 1 Conducive
T 2 Conducive
T 3
Mostly Collaborates
Competes Collaborates Collaborates
High M
SD
3.08
1.56
7.00
2.29
7.00
2.63
Low M
SD
2.71
1.38
6.64
2.44
6.43
2.50
Mostly
Competes
Collaborates Competes Competes
High M
SD
6.83
2.51
2.42
.79
2.92
1.78
Low M
SD
6.43
1.55
2.50
1.60
2.93
1.41
258

Table C.4.1.3. Means and Standard Deviations for Importance as a Function of Overall Strategy and Social Identity Condition across Events in Time Computer’s Overall
Strategy Social
Identity Important
T 1 Important
T 2 Important
T 3
Mostly Collaborates Competes Collaborates Collaborates High M
SD
5.58
2.02
6.42
1.78
6.08
1.50
Low M
SD
6.14
1.75
6.86
1.56
6.57
1.60
Mostly
Competes
Collaborates Competes Competes
High M
SD
7.42
.90
6.75
1.36
6.42
1.97
Low M
SD
6.71
1.59
6.64
2.02
6.64
1.50
Table C.4.1.4. Means and Standard Deviations for Caused by Other’s Production (artificial) Group Membership as a Function of Overall Strategy and Social Identity Condition across Events in Time Computer’s Overall
Strategy Social
Identity Caused by
artificial membership
T 1
Caused by artificial
membership T 2
Caused by artificial
membership T 3
Mostly Collaborates
Competes Collaborates Collaborates
High M
SD
6.83
1.95
4.50
2.19
3.83
2.76
Low M
SD
6.86
1.41
4.36
2.40
5.14
2.32
Mostly
Competes
Collaborates Competes Competes
High M
SD
5.42
2.02
5.25
2.83
6.00
2.89
Low M
SD
6.50
1.91
7.00
1.71
6.86
2.10
259
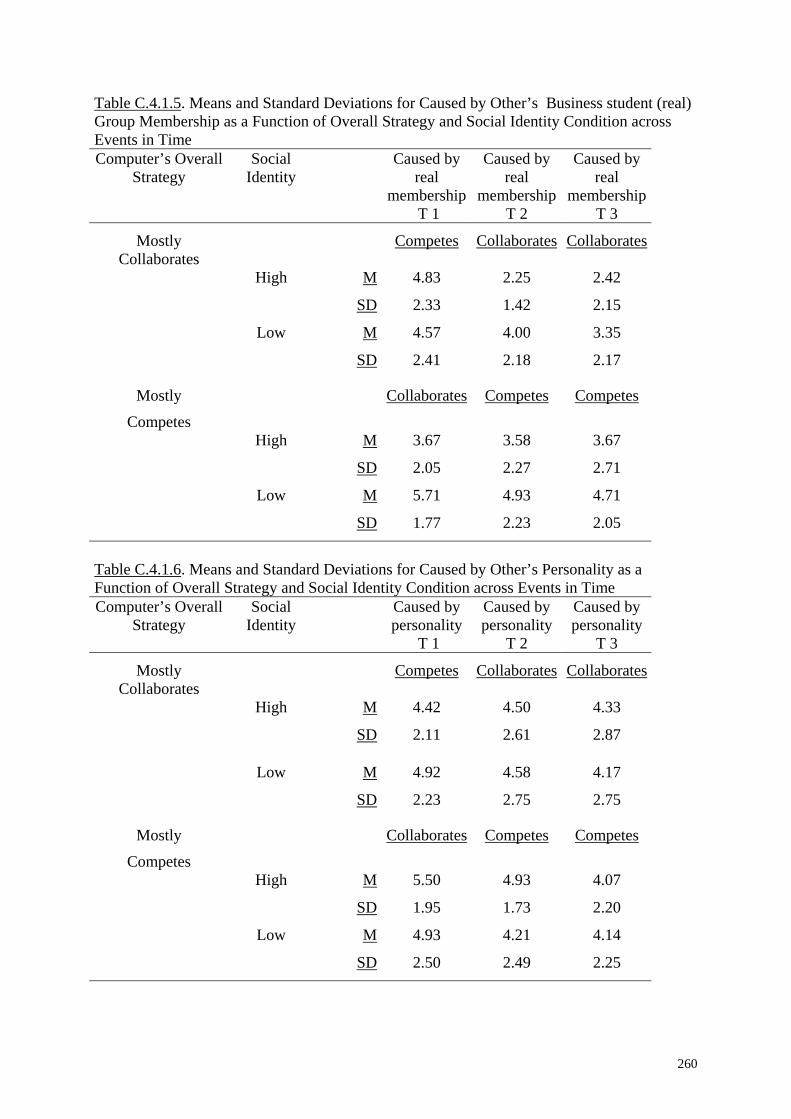
Table C.4.1.5. Means and Standard Deviations for Caused by Other’s Business student (real) Group Membership as a Function of Overall Strategy and Social Identity Condition across Events in Time Computer’s Overall
Strategy Social
Identity Caused by
real membership
T 1
Caused by real
membership T 2
Caused by real
membership T 3
Mostly Collaborates
Competes Collaborates Collaborates
High M
SD
4.83
2.33
2.25
1.42
2.42
2.15
Low M
SD
4.57
2.41
4.00
2.18
3.35
2.17
Mostly
Competes
Collaborates Competes Competes
High M
SD
3.67
2.05
3.58
2.27
3.67
2.71
Low M
SD
5.71
1.77
4.93
2.23
4.71
2.05
Table C.4.1.6. Means and Standard Deviations for Caused by Other’s Personality as a Function of Overall Strategy and Social Identity Condition across Events in Time Computer’s Overall
Strategy Social
Identity Caused by
personality T 1
Caused by personality
T 2
Caused by personality
T 3
Mostly Collaborates
Competes Collaborates Collaborates
High M
SD
4.42
2.11
4.50
2.61
4.33
2.87
Low M
SD
4.92
2.23
4.58
2.75
4.17
2.75
Mostly
Competes
Collaborates Competes Competes
High M
SD
5.50
1.95
4.93
1.73
4.07
2.20
Low M
SD
4.93
2.50
4.21
2.49
4.14
2.25
260

Table C.4.1.7.Means and Standard Deviations for Caused by Other Intentionally as a Function of Overall Strategy and Social Identity Condition across Events in Time Computer’s Overall
Strategy Social
Identity Caused
intentionally T 1
Caused intentionally
T 2
Caused intentionally
T 3
Mostly Collaborates
Competes Collaborates Collaborates
High M
SD
2.00
1.48
1.83
1.53
1.50
1.45
Low M
SD
1.92
1.07
2.14
2.03
2.21
2.19
Mostly
Competes
Collaborates Competes Competes
High M
SD
1.42
.67
1.00
.00
1.33
.49
Low M
SD
2.07
1.64
2.36
1.78
2.07
1.86
Table C.4.1.8. Means and Standard Deviations for Controllability as a Function of Overall Strategy and Social Identity Condition across Events in Time
Computer’s Overall Strategy
Social Identity
Controllability T 1
Controllability T 2
Controllability T 3
Mostly Collaborates
Competes Collaborates Collaborates
High M
SD
4.83
1.94
4.58
2.39
3.67
1.67
Low M
SD
4.64
2.02
5.14
2.57
4.78
2.45
Mostly
Competes
Collaborates Competes Competes
High M
SD
4.50
1.83
3.83
2.48
4.25
2.05
Low M
SD
5.28
1.77
5.21
1.89
4.86
1.70
261

Table C.4.1.9. Means and Standard Deviations for Considered as Unfair/Unjust by Self as a Function of Overall Strategy and Social Identity Condition across Events in Time
Computer’s Overall Strategy
Social Identity
Unfair/Unjust Self T 1
Unfair/Unjust Self T 2
Unfair/Unjust Self T 3
Mostly Collaborates
Competes Collaborates Collaborates
High M
SD
4.00
1.95
2.08
1.56
2.25
1.71
Low M
SD
4.07
2.13
2.65
1.91
2.35
1.95
Mostly
Competes
Collaborates Competes Competes
High M
SD
1.59
1.16
2.83
2.25
3.25
2.05
Low M
SD
2.64
1.55
5.57
2.50
4.71
2.55
Table C.4.1.10. Means and Standard Deviations for Considered as Unfair/Unjust by R&D (artificial) Ingroup as a Function of Overall Strategy and Social Identity Condition across Events in Time
Computer’s Overall Strategy
Social Identity
Unfair/Unjust artificial Ingroup
T 1
Unfair/Unjust artificial Ingroup
T 2
Unfair/Unjust artificial Ingroup
T 3
Mostly Collaborates
Competes Collaborates Collaborates
High M
SD
4.58
2.02
2.58
1.73
2.42
1.78
Low M
SD
5.21
1.88
3.28
2.40
2.50
2.21
Mostly
Competes
Collaborates Competes Competes
High M
SD
2.50
1.38
3.75
2.30
3.75
2.42
Low M
SD
3.00
1.96
6.71
2.13
6.00
1.96
262

Table C.4.1.11. Means and Standard Deviations for Considered as Unfair/Unjust by Psychology students (real) Ingroup as a Function of Overall Strategy and Social Identity Condition across Events in Time
Computer’s Overall Strategy
Social Identity
Unfair/Unjust real
Ingroup T 1
Unfair/Unjust real
Ingroup T 2
Unfair/Unjust real
Ingroup T 3
Mostly Collaborates
Competes Collaborates Collaborates
High M
SD
3.17
2.33
2.17
1.27
1.91
1.24
Low M
SD
3.28
1.98
2.78
1.85
2.71
1.86
Mostly
Competes
Collaborates Competes Competes
High M
SD
2.17
1.34
2.83
2.08
3.00
2.00
Low M
SD
3.14
2.15
4.57
2.44
4.21
2.04
263

C.4.2. Analyses on Emotions (all cases) Table C.4.2.1. Means and Standard Deviations for Surprise(all cases) as a Function of Overall Strategy and Social Identity Condition across Events in Time
Computer’s Overall Strategy
Social Identity
Surprise T 1
Surprise T 2
Surprise T 3
Mostly Collaborates
Competes Collaborates Collaborates
High M
SD
4.17
2.29
5.42
2.06
5.83
2.08
Low M
SD
4.07
2.59
4.00
2.29
4.35
2.50
Mostly
Competes
Collaborates Competes Competes
High M
SD
4.25
1.86
4.58
2.11
4.08
2.61
Low M
SD
4.36
1.50
5.43
2.17
4.57
2.21
Table C.4.2.2. Means and Standard Deviations for Relief (all cases) as a Function of Overall Strategy and Social Identity Condition across Events in Time
Computer’s Overall Strategy
Social Identity
Relief T 1
Relief T 2
Relief T 3
Mostly Collaborates
Competes Collaborates Collaborates
High M
SD
2.92
1.31
6.42
1.31
6.67
1.43
Low M
SD
1.78
1.62
6.14
2.28
4.93
2.84
Mostly
Competes
Collaborates Competes Competes
High M
SD
5.42
1.89
2.50
1.86
2.33
1.67
Low M
SD
6.07
1.38
2.43
1.65
2.36
1.50
264

Table C.4.2.3. Means and Standard Deviations for Happiness (all cases) as a Function of Overall Strategy and Social Identity Condition across Events in Time
Computer’s Overall Strategy
Social Identity
Happy T 1
Happy T 2
Happy T 3
Mostly Collaborates
Competes Collaborates Collaborates
High M
SD
3.17
1.64
6.58
1.38
6.58
2.35
Low M
SD
2.14
1.91
6.78
1.86
5.93
2.59
Mostly
Competes
Collaborates Competes Competes
High M
SD
6.17
2.21
3.17
2.55
3.08
1.62
Low M
SD
7.00
1.66
2.50
1.45
2.14
1.03
Table C.4.2.4. Means and Standard Deviations for Satisfaction (all cases) as a Function of Overall Strategy and Social Identity Condition across Events in Time
Computer’s Overall Strategy
Social Identity
Satisfied T 1
Satisfied T 2
Satisfied T 3
Mostly Collaborates
Competes Collaborates Collaborates
High M
SD
3.58
2.23
7.42
1.08
7.33
1.61
Low M
SD
2.07
1.86
6.93
2.16
5.57
2.76
Mostly
Competes
Collaborates Competes Competes
High M
SD
7.00
2.04
2.92
2.11
3.17
2.12
Low M
SD
7.07
1.98
2.36
1.78
1.86
1.03
265

Table C.4.2.5. Means and Standard Deviations for Irritation (all cases) as a Function of Overall Strategy and Social Identity Condition across Events in Time
Computer’s Overall Strategy
Social Identity
Irritation T 1
Irritation T 2
Irritation T 3
Mostly Collaborates
Competes Collaborates Collaborates
High M
SD
4.58
2.15
1.75
1.05
2.08
1.56
Low M
SD
5.28
2.37
1.78
.97
2.64
2.34
Mostly
Competes
Collaborates Competes Competes
High M
SD
2.00
1.91
4.92
2.20
5.00
2.13
Low M
SD
2.00
1.71
5.86
2.71
5.71
2.33
Table C.4.2.6. Means and Standard Deviations for Frustration (all cases) as a Function of Overall Strategy and Social Identity Condition across Events in Time
Computer’s Overall Strategy
Social Identity
Frustration T 1
Frustration T 2
Frustration T 3
Mostly Collaborates
Competes Collaborates Collaborates
High M
SD
4.08
2.02
1.58
.99
1.58
1.24
Low M
SD
4.93
2.84
1.93
1.49
2.57
2.14
Mostly
Competes
Collaborates Competes Competes
High M
SD
1.67
1.07
4.08
2.02
5.08
2.11
Low M
SD
1.93
1.54
4.57
2.62
5.07
2.02
266

Table C.4.2.7. Means and Standard Deviations for Anger (all cases) as a Function of Overall Strategy and Social Identity Condition across Events in Time
Computer’s Overall Strategy
Social Identity
Anger T 1
Anger T 2
Anger T 3
Mostly Collaborates
Competes Collaborates Collaborates
High M
SD
2.67
1.77
1.67
.58
1.08
.29
Low M
SD
4.43
2.21
1.28
.82
2.28
2.20
Mostly
Competes
Collaborates Competes Competes
High M
SD
1.00
.00
3.33
2.01
3.92
2.15
Low M
SD
1.57
1.16
4.86
2.88
4.71
2.55
267
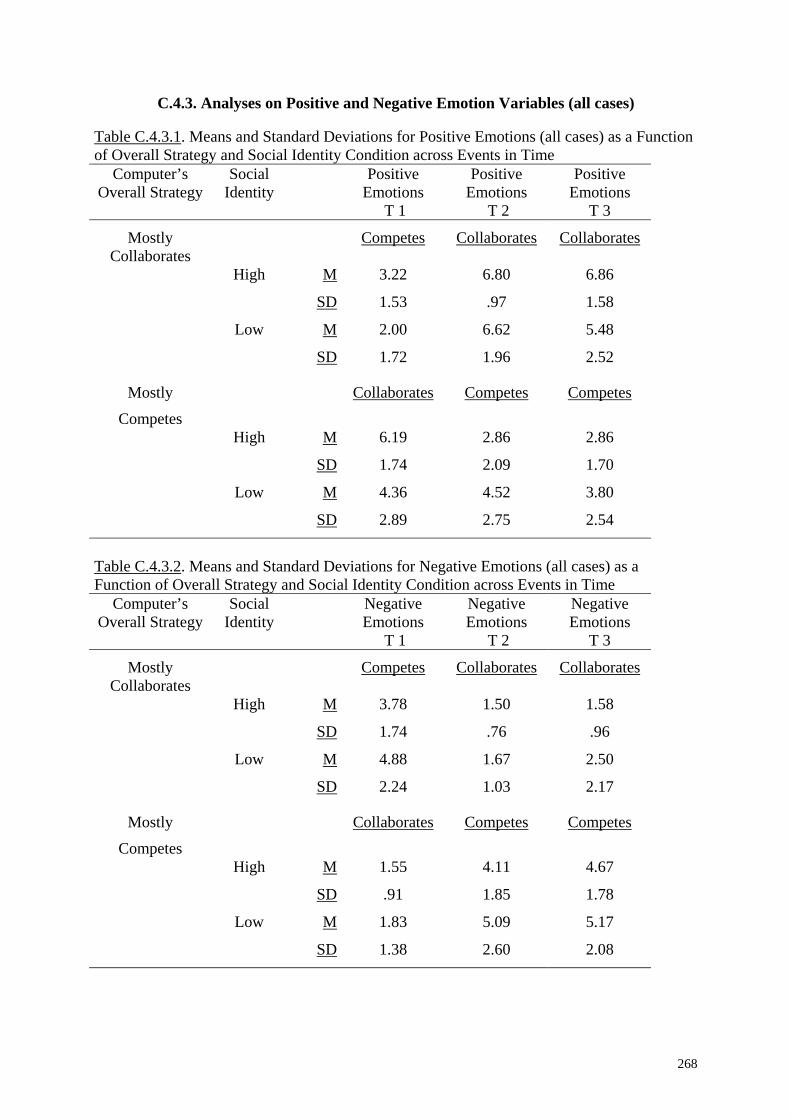
C.4.3. Analyses on Positive and Negative Emotion Variables (all cases) Table C.4.3.1. Means and Standard Deviations for Positive Emotions (all cases) as a Function of Overall Strategy and Social Identity Condition across Events in Time
Computer’s Overall Strategy
Social Identity
Positive Emotions
T 1
Positive Emotions
T 2
Positive Emotions
T 3
Mostly Collaborates
Competes Collaborates Collaborates
High M
SD
3.22
1.53
6.80
.97
6.86
1.58
Low M
SD
2.00
1.72
6.62
1.96
5.48
2.52
Mostly
Competes
Collaborates Competes Competes
High M
SD
6.19
1.74
2.86
2.09
2.86
1.70
Low M
SD
4.36
2.89
4.52
2.75
3.80
2.54
Table C.4.3.2. Means and Standard Deviations for Negative Emotions (all cases) as a Function of Overall Strategy and Social Identity Condition across Events in Time
Computer’s Overall Strategy
Social Identity
Negative Emotions
T 1
Negative Emotions
T 2
Negative Emotions
T 3
Mostly Collaborates
Competes Collaborates Collaborates
High M
SD
3.78
1.74
1.50
.76
1.58
.96
Low M
SD
4.88
2.24
1.67
1.03
2.50
2.17
Mostly
Competes
Collaborates Competes Competes
High M
SD
1.55
.91
4.11
1.85
4.67
1.78
Low M
SD
1.83
1.38
5.09
2.60
5.17
2.08
268

C.4.4. Analyses on Positive and Negative Emotion Variables (cases with values above 1) Table C.4.4.1. Means and Standard Deviations for Positive Emotions (only values above 1) as a Function of Overall Strategy and Social Identity Condition across Events in Time
Computer’s Overall Strategy
Social Identity
Positive Emotions
T 1
Positive Emotions
T 2
Positive Emotions
T 3 Mostly
Collaborates Competes Collaborates Collaborates
High MSD
% not felt
3.78 1.14
(N=10)
29.20
6.80 .97
(N=12)
4.20
6.86 1.58
(N=12)
4.20
Low MSD
% not felt
3.07 1.78
(N=9)
35.00
6.62 1.96
(N=14) 0
5.91 2.11
(N=13)
5.00
Mostly Competes
Collaborates Competes Competes
High MSD
% not felt
6.25 1.58
(N=12) 0
3.87 1.86
(N=8)
13.00
3.27 1.52
(N=11)
17.40
Low MSD
% not felt
6.71 1.57
(N=14)
12.50
3.25 1.28
(N=10)
25.00
2.83 .53
(N=10)
29.20
Note. % not felt= percentage of participants reporting a scale value of 1 “not at all pertinent” for the emotion
269

Table C.4.4.2. Means and Standard Deviations for Negative Emotions (only values above 1) as a Function of Overall Strategy and Social Identity Condition across Events in Time
Computer’s Overall Strategy
Social Identity
Negative Emotions
T 1
Negative Emotions
T 2
Negative Emotions
T 3 Mostly
Collaborates Competes Collaborates Collaborates
High MSD
% not felt
4.30 1.40
(N=11)
8.30
2.67 .51
(N=5)
66.70
2.89 1.02
(N=6)
79.20
Low MSD
% not felt
5.33 1.97
(N=13) 0
2.52 .88
(N=9)
50.00
3.75 2.19
(N=8)
45.00
Mostly Competes
Collaborates Competes Competes
High MSD
% not felt
3.30 1.20
(N=5)
43.50
4.65 1.44
(N=11)
8.70
5.03 1.37
(N=11)
21.70
Low MSD
% not felt
3.47 1.12
(N=5)
41.70
5.67 2.13
(N=13)
8.30
5.73 1.49
(N=13)
8.30
Note. % not felt= percentage of participants reporting a scale value of 1 “not at all pertinent” for the emotion
270