the influence of social-media on audiences of the tv
TRANSCRIPT
217
The Influence of Social-Media on Audiences of the TV Channels
in Romania
Alina DINU1 Raluca MAREI2
Ion TUDOR3 Lorian-Ovidiu VINTILA4 Raluca-Elena GHINEA5
ABSTRACT Social-media influences people's lives including organizational activity. At the organizational level, social-media has changed the way employees communicate, multinational companies developing social-media platforms especially for their employees. The influence of social-media on mass media is a widely researched subject, and, we focused our attention on the way in which the activity on social-media of different TV stations in Romania influences their audiences. This study examines the influence of social-media on the audiences of ten TV stations in Romania. Through a questionnaire, we determined the rating of the TV stations without the influence of social-media and these audiences were compared to the official ones. The results of the study showed that there is an economic effect of the social-media influence in the case of the analysed TV stations. KEYWORDS: social-media, mass-media, audience, social television
JEL CLASSIFICATION: C12, C29, L82, M19, M39
1. INTRODUCTION It is proven that social media has a major influence on consumers of TV programs. Equally important, social media is a very relevant opinion maker and decisively influences the way viewers think and behave. The quantification of the social-media influence on the audiences of the TV stations in Romania was the purpose of this research. Defining the concepts of organizational communication, television, social-media, social television, identifying and analysing the new types of audiences on television in Romania was the objective of this research. In order to reach our goal, we developed a questionnaire through which we determined the economic effect of the social-media influence in the case of the analysed TV stations. 2. LITERATURE REVIEW 2.1 Organizational Communication Chenhall and Morris (1995) have examined the combined effect of organic decision, communication processes and management accounting system on performance. Also, Plumert and Carswell (1995) aimed how the communication task and the structure of the environment
1 Bucharest University of Economic Studies, Romania, [email protected], corresponding author 2 Bucharest University of Economic Studies, Romania, - [email protected] 3 Bucharest University of Economic Studies, Romania, [email protected] 4 Bucharest University of Economic Studies, Romania, [email protected] 5 Bucharest University of Economic Studies, Romania, [email protected]
Alina DINU, Raluca MAREI, Ion TUDOR, Lorian-Ovidiu VINTILA, Raluca-Elena GHINEA
218
influence the content and organization of messages about object locations. (Van Riel, 1995) defines corporate communication as an instrument of management by means of which all consciously used forms of internal and external communication are harmonized as effectively and efficiently as possible, so as to create a favourable basis for relationships with groups upon which the company is dependent. Since then, researchers’ interest in this topic has not diminished. Johansson et al. (2019) discussed about the communication and its value for organizations, studied from a number of perspectives and Qin and Men (2019) about the importance of developing effective social-media strategies. The communication in the organizations can be classified into formal (when it follows certain formalities) and informal (it refers to a friendly communication), verbal (sharing information between individuals by the use of speech) and nonverbal (the use of gestures, the way we dress and speak), vertical (discussion between employees from different hierarchical levels) versus horizontal (discussion between employees from the same hierarchical level), and interpersonal communication (Contractor & Monge, 2003). According to Contractor and Monge (2003), the communication in the organizations, can also be classified into internal and external. Internal communication is the information exchange between direct members of a company and is taking place within the organization. External communication, on the contrary, occurs when the company exchanges information with the suppliers, customers, and the government and takes place when the Company communicates with the outside world. Recent studies examined the effect of internal communication on positive emotional culture and the impact of positive emotional culture on supportive employee behaviours (Men & Yue, 2019), effective crisis communication in organizations’ internal context (Kim et al., 2019), internal communication of corporate social responsibility (Duthler & Dhanesh, 2018). Also, Rauwers et al. (2016) investigated the effects of the integration of external and internal communication features in digital magazines on consumers' magazine attitude. 2.2 Television Allen, 2004 offers a comprehensive definition of the television. In the first-place television is a changing set of technologies for electronically recording, capturing, manipulating and arranging sounds and images and (sometimes) their transmission. Television is also a set of formal, narrative, and representational structures and capacities and a set of institution and relationship among institutions: broadcasters, production companies, state television systems (in the case of public service television), networks (and the corporations that own them, advertisers (in the case of commercial televisions), program distributors, government regulators, international trade and cultural agencies, equipment manufacturers, other media (cinema, radio, publishers, computers, Internet), universities, and public advocacy groups among them. The impact of television on people is best surprised by Gerbner and Gross (1976), whose statement is that television is the first centralized cultural influence to permeate both the initial and the final years of life-as well as the years between, hence the television can be seen as a social experience associated with listening, producing, viewing, reading about, talking about, appearing on, being captured by, and being affected and influenced by television (Allen, 2004). Also, as stated by McAnally et al. (2019) television and other screen-based media play a major role in modern life affecting family routines, social interactions and leisure activities. According to Moran (1998) contemporary television faces many challenges, as the approach of television institutions and audiences change. The use of the alternative devices and Internet in viewing televisual material challenges defining television from a technological, institutional, and social perspective. Television broadcasters have had to adapt to new audience trends, just as the old media of motion pictures and radio had to adapt when television was introduced, changing the platform and the method used for broadcast and distribution (Moran, 1998). Some television broadcasters, in relation to the Internet and contemporary alternative media platforms, have used a transmedia storytelling approach, distributing media across mobile
Management and Economics Review Volume 5, Issue 2, 2020
219
phones, television, and the Internet. Specifically, Bruns (1998), argued that storytelling method it could be the future of television, allowing both online media and traditional television broadcasts to coexist. In the last decade, according to Lot (2018), exceptional changes have transpired related to the technologies of distribution through which we receive television and the screen technologies we use to view it. The previous distribution and screen technologies also persist, although hour experience of television has quickly transitioned to adopt new ways of viewing (Lotz, 2018). These changes were framed by valuable scholarship, through their research, in changes in distribution technologies (Jenkins, 2006), television (Spigel, 2004), and the multifaceted of the current environment (Uricchio, 2009). The fact that Internet can be used as a distribution method for for the material created by the television has prompted debate about the extinction of television. Studies as Havick (2000), Lotz (2007), Spigel and Olsson (2004) question the future of television. Specifically, Havick (2000) considered that television and the Internet according to how each performs the following functions: (1) educate, inform and entertainment, (2) surveillance and newsgathering, (3) enforcement of norms, and (4) interpretation and editorializing. Furthermore, Havick (2000) considers that the Internet offers a different type of surveillance and newsgathering than does television giving individuals the capability to control the storage, production, and dissemination of information, each Internet user being a potential transmitter of information or reporter. The conclusion of Harvick's study is that the Internet properties are sufficiently different from those of television to predict that Internet impact will be substantial. 2.3 Social-media The term “social-media” refers to the new forms of media that involve interactive participation (Manning, 2014). According to Huang and Lu (2017) social-media is a new type of fast-growing media nowadays. The basic characteristics of all social-media, in Manning’s opinion are: (1) is a digital platform that (2) allows people to participate and (2) that participation is never completely passive. The common forms of social-media are: email (electronic mail), texters (e.g WhatsApp), blogs, message boards, connection sites (online dating sites), social networking sites (e.g Instagram, Facebook), games and apps or so-called mobile applications (Manning, 2014). In addition, Manning (2014) defines the term blog as a webpage where you can share information or ideas with a large group of people via the internet. Secondly, Nardi et al. (2004) appreciate that social-media applications, such as social network services, blogs, micro-blogs and wikis have permeated into almost every aspect of our daily life. Within companies, according to (Luo et al., 2018), efforts have been made to develop internal blogging platforms and employees are encouraged to actively use the applications in their routine work. Equally important, Lai et al. (2017) offers, through their article, explanations for relational outcomes through social-media use and organizations' relationship building. Another example, Zubiaga (2019) discuss about social-media as a data source for come after the latest developments of ongoing news and studying about breaking news. The same author mentions that social-media is used for newsgathering and outline the development of this field. Correspondingly, according to (Saud et al., 2018) the role of the Internet, in addition to the role of mass media in informing the general public is addressing the general public's interest in environmental issues. 2.4 Social television Nowadays, computers, tablet or smart phones are used by television viewers as second screens, in order to connect to Social Networking Services (SNSs) and web-based media with an eye to be able to share their viewing experiences whit others who are watching the same program (Choi, 2017). As Selva (2015) mentioned, social television can be defined as the social practice of commenting on television shows with friends, peers and unknown people, who are all connected together through various digital devices. Nee and Barker (2019) defines second screening as using cell phone, laptop or tablet to use social-media, go online, or text in a adjective manner to what is watching television. Quintas-Froufe and González-Neira (2014)
Alina DINU, Raluca MAREI, Ion TUDOR, Lorian-Ovidiu VINTILA, Raluca-Elena GHINEA
220
analyzed the factors which contribute to the failure or success of Spain programs (in September 2013) with a similar format in relation to their social audience, and the results of their study showed that the activity in the social network accounts of the presenters and the judges has influenced the success of the shows. In recent years, according to Chávez and Cordes (2018), the traditional relationship between audience, text and producer was disrupted by the prevalence of online platforms in Ghana. In a recent study, Nee and Barker (2019) was compared the social outcomes of television viewing with virtually co-viewing streamed videos focusing. The results of this study indicated that in order to gratify social needs second screening need not occur at once with video viewing. 3. METHODOLOGY In order to identify the influence of social-media on TV stations in Romania we used a questionnaire that was completed between June - August 2020, conceived and distributed using the google forms of the 120 replies received, 99 were valid. The questionnaire includes both general questions (age, profession, environment, income) and specific questions regarding the number of TV users in a household, the TV preferences, the frequency with which they watch TV channels and the frequency of accessing social-media platforms. The questionnaire includes also questions regarding the relevance of the activity of the respondents on social-media in choosing to watch one TV station in the detriment of the others. The TV stations in Romania included in this study were chosen according to the adverts presented by https://www.arma.org.ro, the first ten being selected and the selected social-media platforms were Facebook, Instagram and YouTube. The main hypothesis subjected to econometric testing is the one according to which the activity on the social-media significantly influences the audience of the respective station. In order to deepen the survey, we formulated the following two secondary hypothesis: (1) the activity social-media activity of a TV channel significantly influences the audience of the respective TV channel and (2) the social-media activity of the viewers significantly influences the audience of the respective TV channel. The hypotheses were tested using EViews 8. In order to determine the economic effect of the social-media influence on the TV stations, we calculated, first of all, the rating of the TV stations without social-media influences. This calculation was made possible with the help of the respondents in the questionnaire who mentioned that they watch a certain TV station daily but do not see any social-media posts about that TV station. Thus, the difference between the official rating (the one mentioned on the https:// www.arma.org.ro platform) and the rating of the TV stations without social-media influences represents the rating due to the social-media influence. Secondly, it is necessary to calculate the value of a share point. From the total amount that a cable operator receives from the subscribers, the retransmission costs and the VAT (value added tax) are deducted. Then, 30% of the remaining amount is transferred to television based on share, and the value of one share point for one television is calculated as the amount transferred to television divided by the number of televisions. The final value of a share point is calculated as an average of the share point values calculated for the three cable operators in Romania (Digi Communication, Telekom and UPC). The total amount that cable operator named Digi Communication received from the subscribers was calculated with the help of the financial data presented in the annual activity report of Digi Communications (2018). The amount for the other two cable operators (Telekom and UPC) was deducted based on financial information of Digi Communications and the difference between the number of subscribers of each cable operator.
Management and Economics Review Volume 5, Issue 2, 2020
221
Finally, the economic effect of social-media influence is calculated as a product of the value
of a share point and share points due to social-media influence. Share points due to social-
media influence are calculated as the difference between the share for a TV station and the
share of that TV station without social-media influences. The share without the influence of
social-media is calculated as the difference between the official share of the station and the
product between the percentage with which the audience increases on the TV station divided
by 100 and the official share of the TV station.
4. RESULTS
The respondents of the questionnaire are mostly women (59%), live in the urban area (92%),
have the maximum income of 3000 lei (77%) are employees (55%) and belong to the age
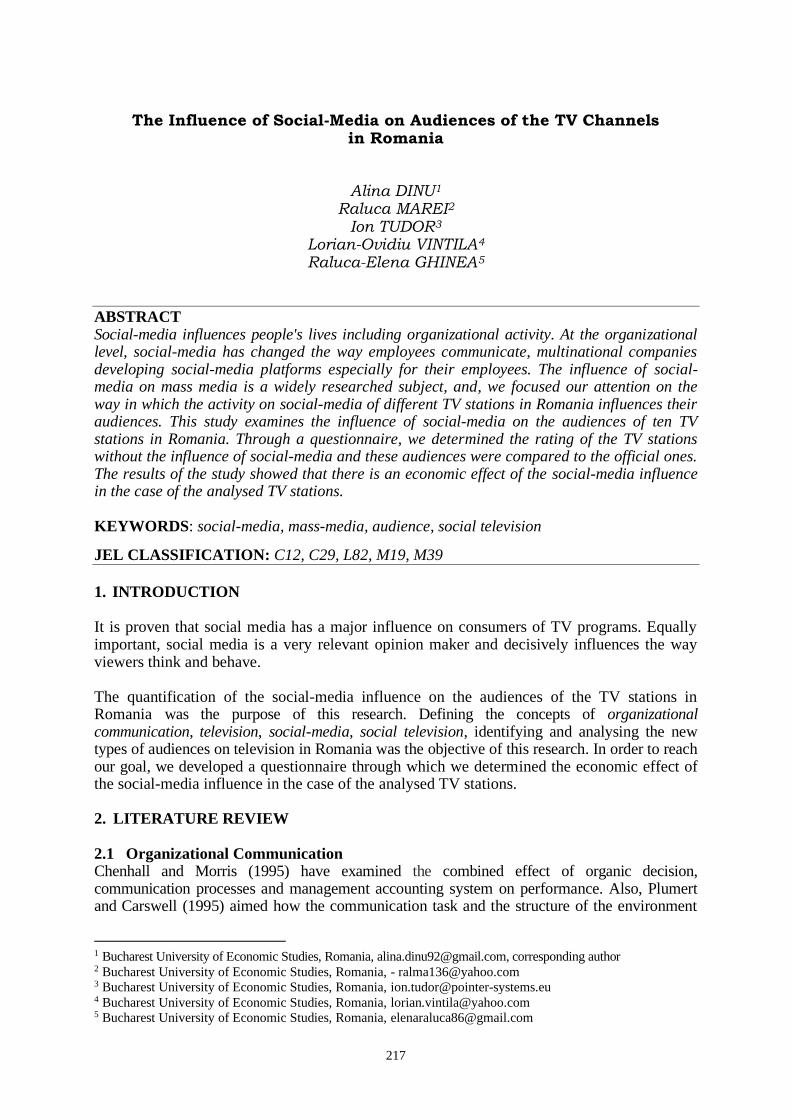
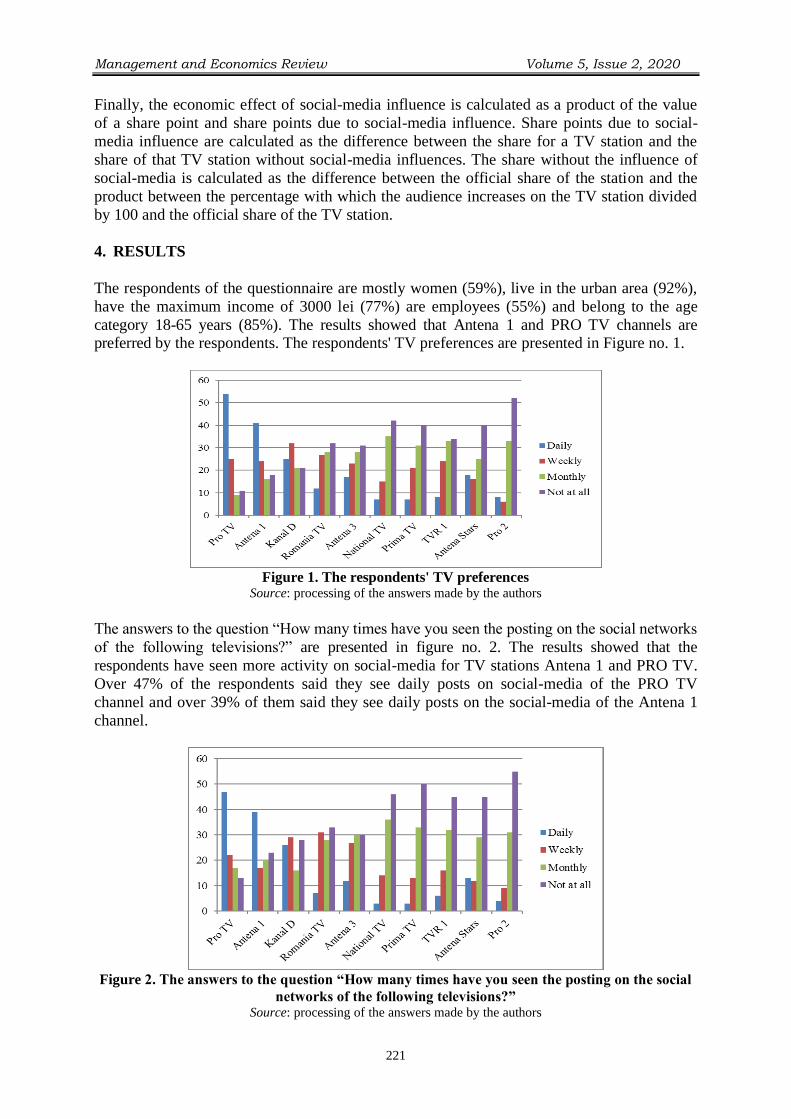
category 18-65 years (85%). The results showed that Antena 1 and PRO TV channels are preferred by the respondents. The respondents' TV preferences are presented in Figure no. 1.
Figure 1. The respondents' TV preferences
Source: processing of the answers made by the authors
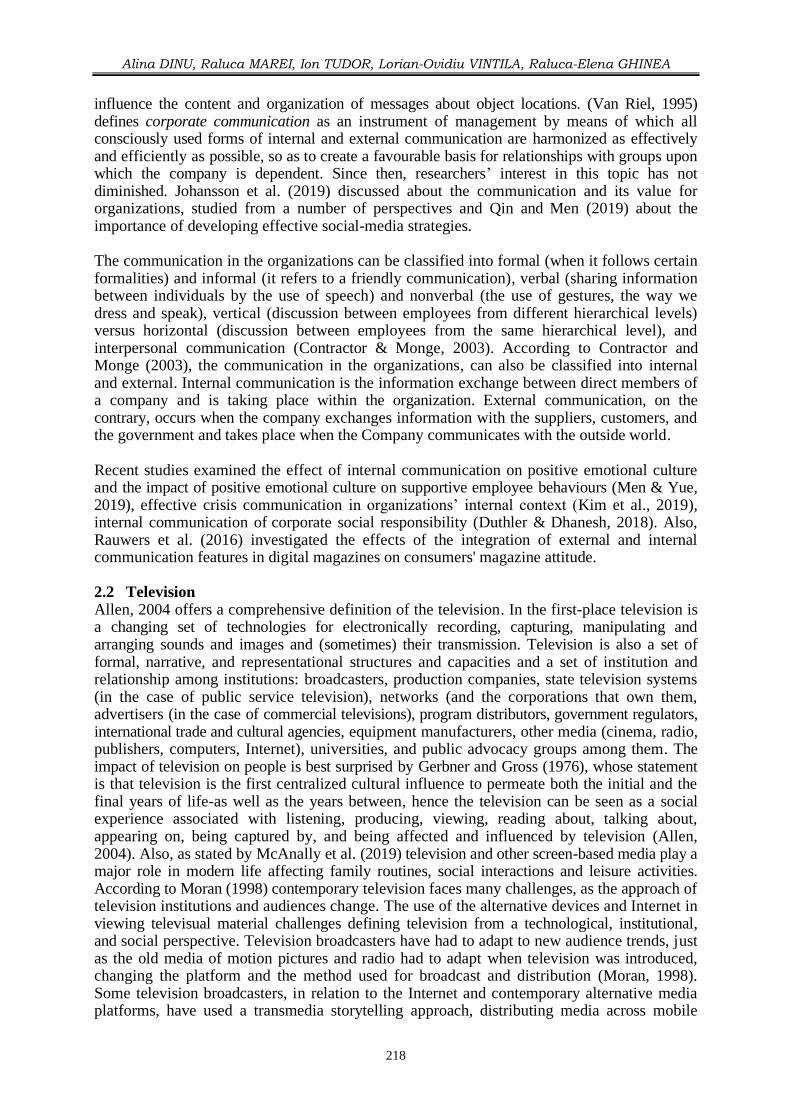
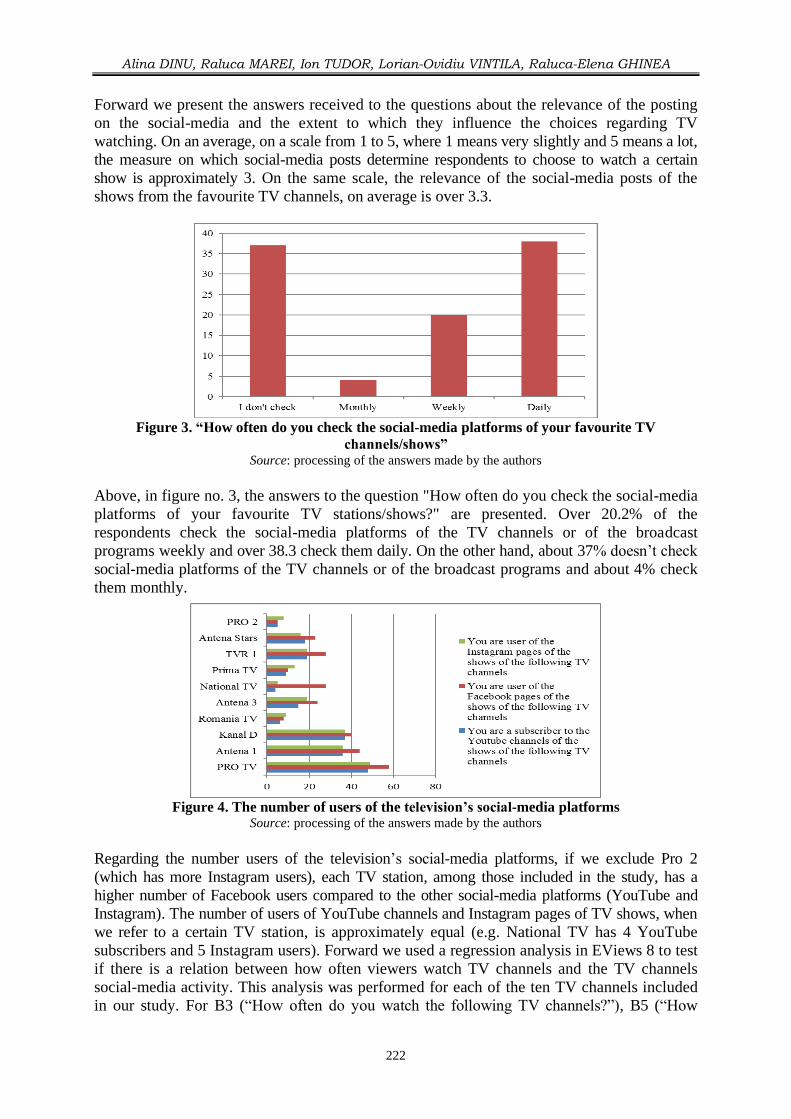
The answers to the question “How many times have you seen the posting on the social networks
of the following televisions?” are presented in figure no. 2. The results showed that the
respondents have seen more activity on social-media for TV stations Antena 1 and PRO TV.
Over 47% of the respondents said they see daily posts on social-media of the PRO TV
channel and over 39% of them said they see daily posts on the social-media of the Antena 1
channel.
Figure 2. The answers to the question “How many times have you seen the posting on the social
networks of the following televisions?” Source: processing of the answers made by the authors
Alina DINU, Raluca MAREI, Ion TUDOR, Lorian-Ovidiu VINTILA, Raluca-Elena GHINEA
222
Forward we present the answers received to the questions about the relevance of the posting
on the social-media and the extent to which they influence the choices regarding TV
watching. On an average, on a scale from 1 to 5, where 1 means very slightly and 5 means a lot,
the measure on which social-media posts determine respondents to choose to watch a certain
show is approximately 3. On the same scale, the relevance of the social-media posts of the
shows from the favourite TV channels, on average is over 3.3.
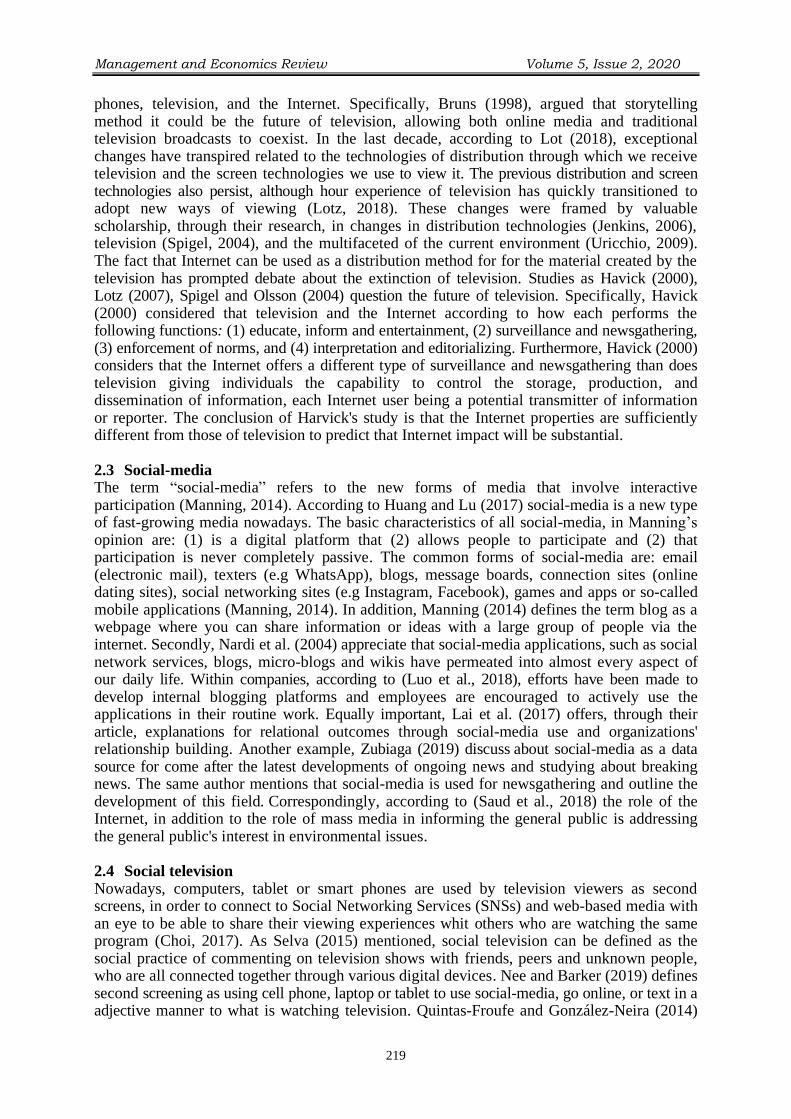
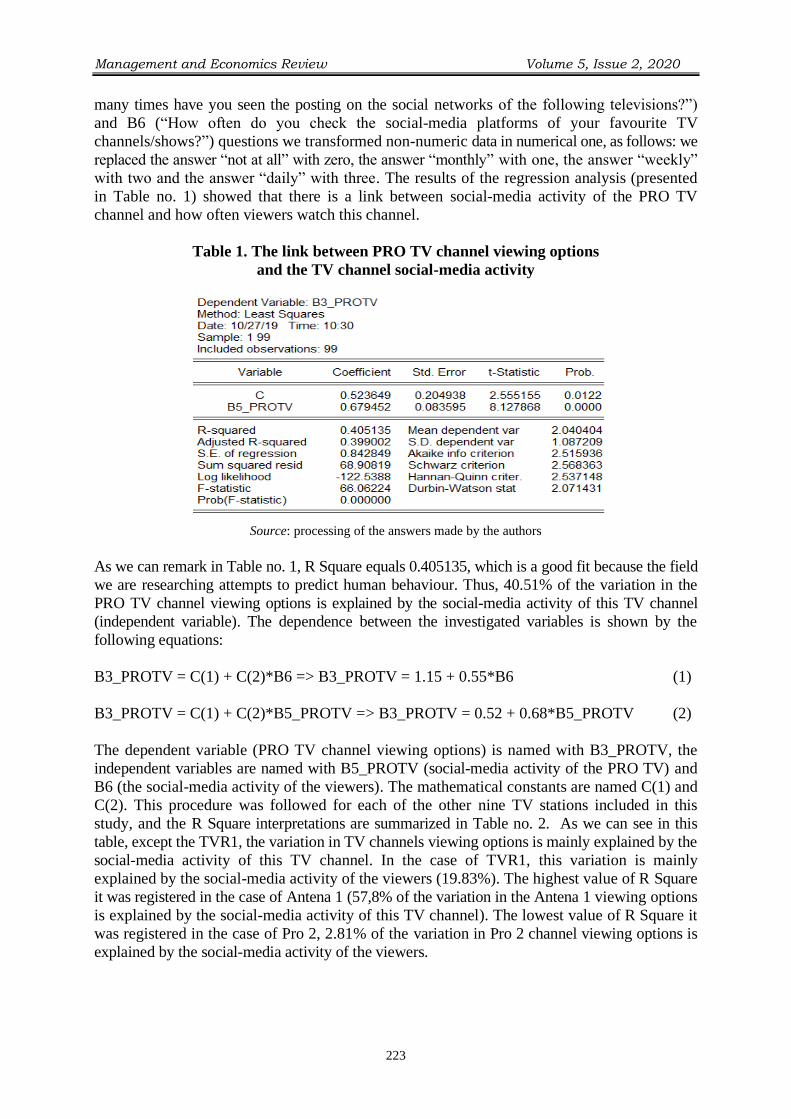
Figure 3. “How often do you check the social-media platforms of your favourite TV
channels/shows” Source: processing of the answers made by the authors
Above, in figure no. 3, the answers to the question "How often do you check the social-media
platforms of your favourite TV stations/shows?" are presented. Over 20.2% of the
respondents check the social-media platforms of the TV channels or of the broadcast
programs weekly and over 38.3 check them daily. On the other hand, about 37% doesn’t check
social-media platforms of the TV channels or of the broadcast programs and about 4% check
them monthly.
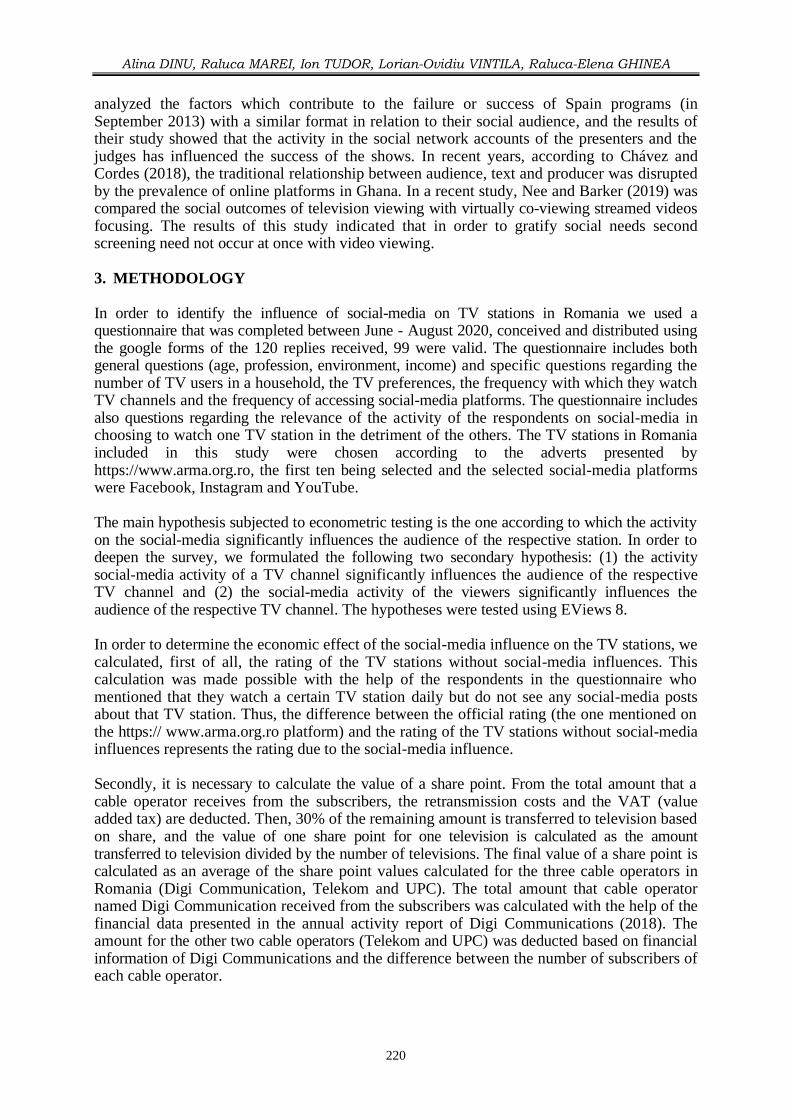
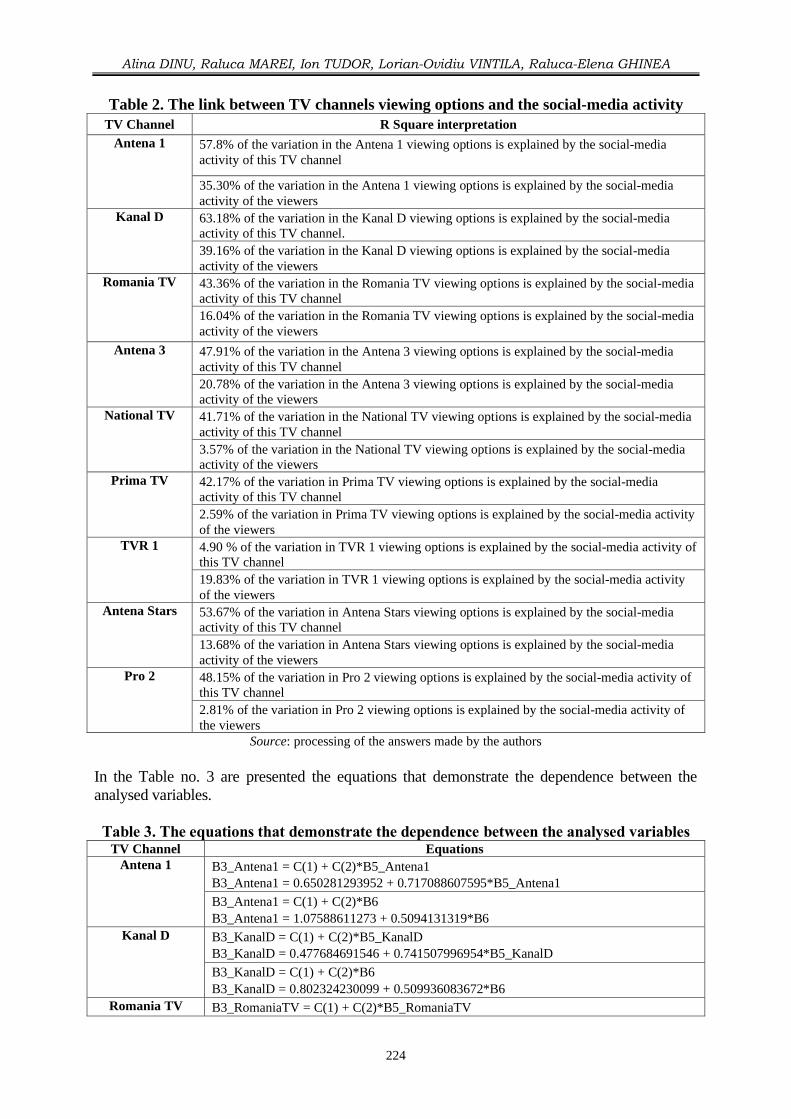
Figure 4. The number of users of the television’s social-media platforms
Source: processing of the answers made by the authors
Regarding the number users of the television’s social-media platforms, if we exclude Pro 2
(which has more Instagram users), each TV station, among those included in the study, has a
higher number of Facebook users compared to the other social-media platforms (YouTube and
Instagram). The number of users of YouTube channels and Instagram pages of TV shows, when
we refer to a certain TV station, is approximately equal (e.g. National TV has 4 YouTube
subscribers and 5 Instagram users). Forward we used a regression analysis in EViews 8 to test
if there is a relation between how often viewers watch TV channels and the TV channels
social-media activity. This analysis was performed for each of the ten TV channels included
in our study. For B3 (“How often do you watch the following TV channels?”), B5 (“How
Management and Economics Review Volume 5, Issue 2, 2020
223
many times have you seen the posting on the social networks of the following televisions?”)
and B6 (“How often do you check the social-media platforms of your favourite TV
channels/shows?”) questions we transformed non-numeric data in numerical one, as follows: we
replaced the answer “not at all” with zero, the answer “monthly” with one, the answer “weekly”
with two and the answer “daily” with three. The results of the regression analysis (presented
in Table no. 1) showed that there is a link between social-media activity of the PRO TV
channel and how often viewers watch this channel.
Table 1. The link between PRO TV channel viewing options
and the TV channel social-media activity
Source: processing of the answers made by the authors
As we can remark in Table no. 1, R Square equals 0.405135, which is a good fit because the field
we are researching attempts to predict human behaviour. Thus, 40.51% of the variation in the
PRO TV channel viewing options is explained by the social-media activity of this TV channel
(independent variable). The dependence between the investigated variables is shown by the
following equations:
B3_PROTV = C(1) + C(2)*B6 => B3_PROTV = 1.15 + 0.55*B6 (1)
B3_PROTV = C(1) + C(2)*B5_PROTV => B3_PROTV = 0.52 + 0.68*B5_PROTV (2)
The dependent variable (PRO TV channel viewing options) is named with B3_PROTV, the
independent variables are named with B5_PROTV (social-media activity of the PRO TV) and
B6 (the social-media activity of the viewers). The mathematical constants are named C(1) and
C(2). This procedure was followed for each of the other nine TV stations included in this
study, and the R Square interpretations are summarized in Table no. 2. As we can see in this
table, except the TVR1, the variation in TV channels viewing options is mainly explained by the
social-media activity of this TV channel. In the case of TVR1, this variation is mainly
explained by the social-media activity of the viewers (19.83%). The highest value of R Square
it was registered in the case of Antena 1 (57,8% of the variation in the Antena 1 viewing options
is explained by the social-media activity of this TV channel). The lowest value of R Square it
was registered in the case of Pro 2, 2.81% of the variation in Pro 2 channel viewing options is
explained by the social-media activity of the viewers.
Alina DINU, Raluca MAREI, Ion TUDOR, Lorian-Ovidiu VINTILA, Raluca-Elena GHINEA
224
Table 2. The link between TV channels viewing options and the social-media activity
TV Channel R Square interpretation
Antena 1 57.8% of the variation in the Antena 1 viewing options is explained by the social-media
activity of this TV channel
35.30% of the variation in the Antena 1 viewing options is explained by the social-media
activity of the viewers
Kanal D 63.18% of the variation in the Kanal D viewing options is explained by the social-media
activity of this TV channel.
39.16% of the variation in the Kanal D viewing options is explained by the social-media
activity of the viewers
Romania TV 43.36% of the variation in the Romania TV viewing options is explained by the social-media
activity of this TV channel
16.04% of the variation in the Romania TV viewing options is explained by the social-media
activity of the viewers
Antena 3 47.91% of the variation in the Antena 3 viewing options is explained by the social-media
activity of this TV channel
20.78% of the variation in the Antena 3 viewing options is explained by the social-media
activity of the viewers
National TV 41.71% of the variation in the National TV viewing options is explained by the social-media
activity of this TV channel
3.57% of the variation in the National TV viewing options is explained by the social-media
activity of the viewers
Prima TV 42.17% of the variation in Prima TV viewing options is explained by the social-media
activity of this TV channel
2.59% of the variation in Prima TV viewing options is explained by the social-media activity
of the viewers
TVR 1 4.90 % of the variation in TVR 1 viewing options is explained by the social-media activity of
this TV channel
19.83% of the variation in TVR 1 viewing options is explained by the social-media activity
of the viewers
Antena Stars 53.67% of the variation in Antena Stars viewing options is explained by the social-media
activity of this TV channel
13.68% of the variation in Antena Stars viewing options is explained by the social-media
activity of the viewers
Pro 2 48.15% of the variation in Pro 2 viewing options is explained by the social-media activity of
this TV channel
2.81% of the variation in Pro 2 viewing options is explained by the social-media activity of
the viewers
Source: processing of the answers made by the authors
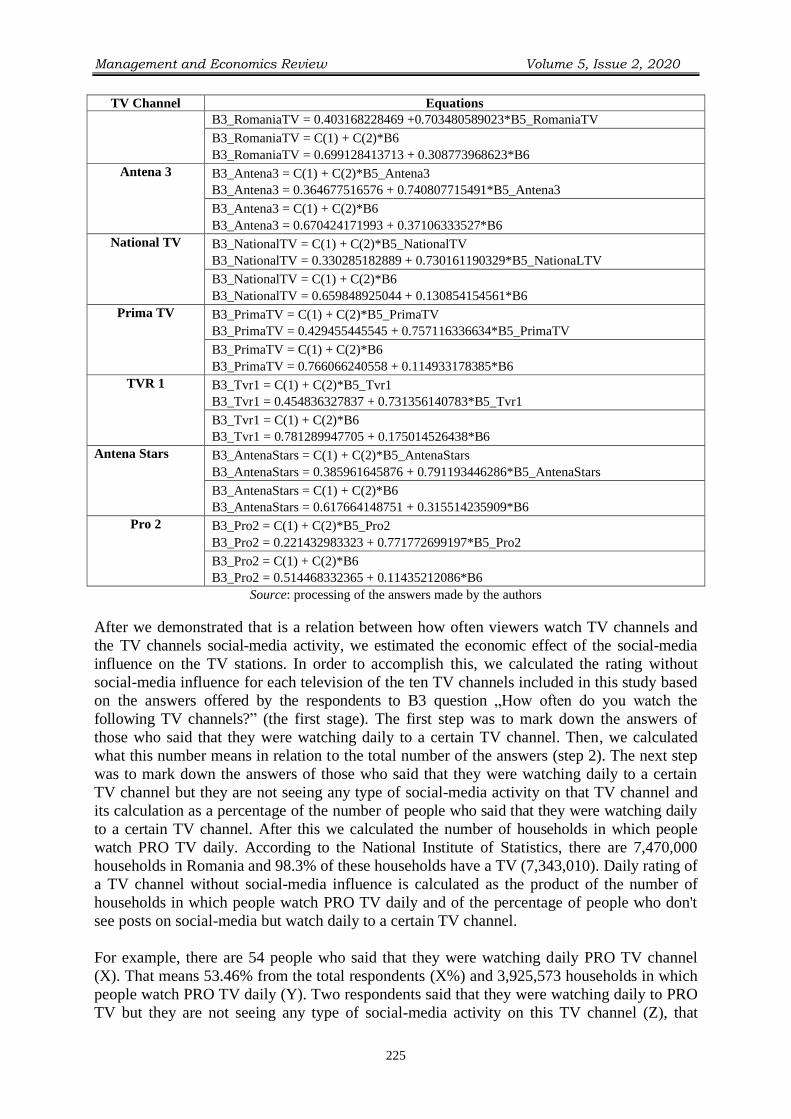
In the Table no. 3 are presented the equations that demonstrate the dependence between the
analysed variables.
Table 3. The equations that demonstrate the dependence between the analysed variables TV Channel Equations
Antena 1 B3_Antena1 = C(1) + C(2)*B5_Antena1
B3_Antena1 = 0.650281293952 + 0.717088607595*B5_Antena1
B3_Antena1 = C(1) + C(2)*B6
B3_Antena1 = 1.07588611273 + 0.5094131319*B6
Kanal D B3_KanalD = C(1) + C(2)*B5_KanalD
B3_KanalD = 0.477684691546 + 0.741507996954*B5_KanalD
B3_KanalD = C(1) + C(2)*B6
B3_KanalD = 0.802324230099 + 0.509936083672*B6
Romania TV B3_RomaniaTV = C(1) + C(2)*B5_RomaniaTV
Management and Economics Review Volume 5, Issue 2, 2020
225
TV Channel Equations
B3_RomaniaTV = 0.403168228469 +0.703480589023*B5_RomaniaTV
B3_RomaniaTV = C(1) + C(2)*B6
B3_RomaniaTV = 0.699128413713 + 0.308773968623*B6
Antena 3 B3_Antena3 = C(1) + C(2)*B5_Antena3
B3_Antena3 = 0.364677516576 + 0.740807715491*B5_Antena3
B3_Antena3 = C(1) + C(2)*B6
B3_Antena3 = 0.670424171993 + 0.37106333527*B6
National TV B3_NationalTV = C(1) + C(2)*B5_NationalTV
B3_NationalTV = 0.330285182889 + 0.730161190329*B5_NationaLTV
B3_NationalTV = C(1) + C(2)*B6
B3_NationalTV = 0.659848925044 + 0.130854154561*B6
Prima TV B3_PrimaTV = C(1) + C(2)*B5_PrimaTV
B3_PrimaTV = 0.429455445545 + 0.757116336634*B5_PrimaTV
B3_PrimaTV = C(1) + C(2)*B6
B3_PrimaTV = 0.766066240558 + 0.114933178385*B6
TVR 1 B3_Tvr1 = C(1) + C(2)*B5_Tvr1
B3_Tvr1 = 0.454836327837 + 0.731356140783*B5_Tvr1
B3_Tvr1 = C(1) + C(2)*B6
B3_Tvr1 = 0.781289947705 + 0.175014526438*B6
Antena Stars B3_AntenaStars = C(1) + C(2)*B5_AntenaStars
B3_AntenaStars = 0.385961645876 + 0.791193446286*B5_AntenaStars
B3_AntenaStars = C(1) + C(2)*B6
B3_AntenaStars = 0.617664148751 + 0.315514235909*B6
Pro 2 B3_Pro2 = C(1) + C(2)*B5_Pro2
B3_Pro2 = 0.221432983323 + 0.771772699197*B5_Pro2
B3_Pro2 = C(1) + C(2)*B6
B3_Pro2 = 0.514468332365 + 0.11435212086*B6
Source: processing of the answers made by the authors
After we demonstrated that is a relation between how often viewers watch TV channels and
the TV channels social-media activity, we estimated the economic effect of the social-media
influence on the TV stations. In order to accomplish this, we calculated the rating without
social-media influence for each television of the ten TV channels included in this study based
on the answers offered by the respondents to B3 question „How often do you watch the
following TV channels?” (the first stage). The first step was to mark down the answers of
those who said that they were watching daily to a certain TV channel. Then, we calculated
what this number means in relation to the total number of the answers (step 2). The next step
was to mark down the answers of those who said that they were watching daily to a certain
TV channel but they are not seeing any type of social-media activity on that TV channel and
its calculation as a percentage of the number of people who said that they were watching daily
to a certain TV channel. After this we calculated the number of households in which people
watch PRO TV daily. According to the National Institute of Statistics, there are 7,470,000
households in Romania and 98.3% of these households have a TV (7,343,010). Daily rating of
a TV channel without social-media influence is calculated as the product of the number of
households in which people watch PRO TV daily and of the percentage of people who don't
see posts on social-media but watch daily to a certain TV channel.
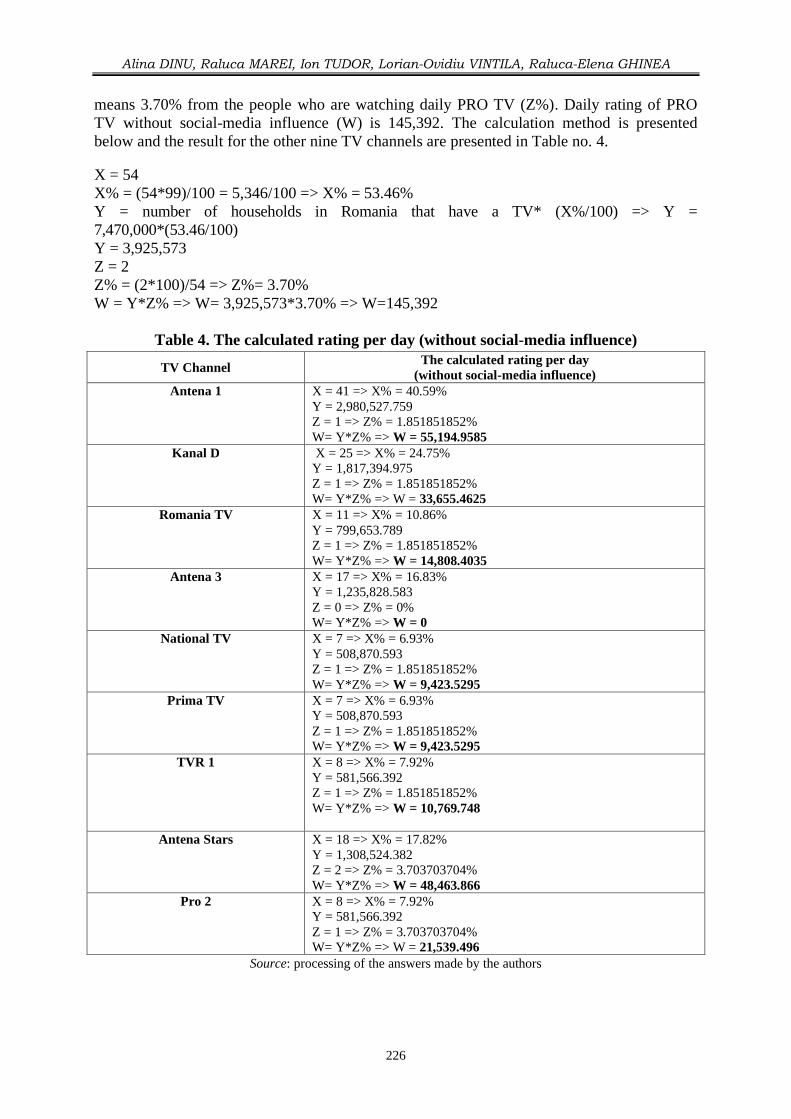
For example, there are 54 people who said that they were watching daily PRO TV channel
(X). That means 53.46% from the total respondents (X%) and 3,925,573 households in which
people watch PRO TV daily (Y). Two respondents said that they were watching daily to PRO
TV but they are not seeing any type of social-media activity on this TV channel (Z), that
Alina DINU, Raluca MAREI, Ion TUDOR, Lorian-Ovidiu VINTILA, Raluca-Elena GHINEA
226
means 3.70% from the people who are watching daily PRO TV (Z%). Daily rating of PRO
TV without social-media influence (W) is 145,392. The calculation method is presented
below and the result for the other nine TV channels are presented in Table no. 4.
X = 54
X% = (54*99)/100 = 5,346/100 => X% = 53.46%
Y = number of households in Romania that have a TV* (X%/100) => Y =
7,470,000*(53.46/100)
Y = 3,925,573
Z = 2
Z% = (2*100)/54 => Z%= 3.70%
W = Y*Z% => W= 3,925,573*3.70% => W=145,392
Table 4. The calculated rating per day (without social-media influence)
TV Channel The calculated rating per day
(without social-media influence)
Antena 1 X = 41 => X% = 40.59%
Y = 2,980,527.759
Z = 1 => Z% = 1.851851852%
W= Y*Z% => W = 55,194.9585
Kanal D X = 25 => X% = 24.75%
Y = 1,817,394.975
Z = 1 => Z% = 1.851851852%
W= Y*Z% => W = 33,655.4625
Romania TV X = 11 => X% = 10.86%
Y = 799,653.789
Z = 1 => Z% = 1.851851852%
W= Y*Z% => W = 14,808.4035
Antena 3 X = 17 => X% = 16.83%
Y = 1,235,828.583
Z = 0 => Z% = 0%
W= Y*Z% => W = 0
National TV X = 7 => X% = 6.93%
Y = 508,870.593
Z = 1 => Z% = 1.851851852%
W= Y*Z% => W = 9,423.5295
Prima TV X = 7 => X% = 6.93%
Y = 508,870.593
Z = 1 => Z% = 1.851851852%
W= Y*Z% => W = 9,423.5295
TVR 1 X = 8 => X% = 7.92%
Y = 581,566.392
Z = 1 => Z% = 1.851851852%
W= Y*Z% => W = 10,769.748
Antena Stars X = 18 => X% = 17.82%
Y = 1,308,524.382
Z = 2 => Z% = 3.703703704%
W= Y*Z% => W = 48,463.866
Pro 2 X = 8 => X% = 7.92%
Y = 581,566.392
Z = 1 => Z% = 3.703703704%
W= Y*Z% => W = 21,539.496
Source: processing of the answers made by the authors
Management and Economics Review Volume 5, Issue 2, 2020
227
The results for the other nine TV channels, presented in Table no. 4, ranks PRO TV channel
in first place of the viewers preferences (145,392), followed by Antena 1 (55,195) and Kanal
D (33,655.4625). According to our calculations, the lowest rating is recorded for the Prima
TV and National TV channels (9,424). In the case of Antena 3 the rating without social-media
influence couldn't be calculated because it wasn’t recorded respondents' answers in which
they affirm that they are watching daily to Antena 3 but they are not seeing any type of social-
media activity on this TV channel.
The second stage involves the calculation of the value of a share per day. From the total
amount that a cable operator receives from the subscribers, the retransmission costs and the
VAT (value added tax) are deducted (1). Then, 30% of the remaining amount is transferred to
television based on share, and the value of one share point for one television is calculated as the
amount transferred to television divided by the number of televisions (2). Finally, the economic
effect of social-media influence is calculated as a product of the value of a share point and
share points due to social-media influence (5). Share points due to social-media influence are
calculated as the difference between the share for a TV station and the share of that TV station
without social-media influences (4). The share without the influence of social-media is
calculated as the difference between the official share of the station and the product between
the percentage with which the audience increases on the TV station divided by 100 and the
official share of the TV station (3).
(1) How many subscribers does each cable operator have?
X - the total amount received from subscribers = 1,115,400,000 lei/year, as follows:
• 3,400,000 subscribers, 750,000 subscribers to satellite television
• The average is 28 lei/month (subscription price)
• On satellite television the average is 25 lei/month
X = (3,400,000 subscribers/year -750,000 subscribers/year * 28 lei/month/subscriber * 12
months/ year) + 750,000 subscribers * 25 lei/month/subscriber * 12 months/year =
1,115,400,000 lei/year
10,460,000 euros are the retransmission costs for the Digi Communications. We convert euro
to lei (1 euro = 4.85 lei) and we obtain 50,731,000.00 lei (Y).
We deduct the VAT for X:
VATX = 1,115,400,000 lei/year - 0.19 * 1,115,400 lei/year = 903,474,000 lei/year
We deduct the retransmission costs:
X retransmission costs = 903,474,000 lei/year - 49,517,640 lei/year = 853,956,360 lei/year
(2) We calculate 30% of the remaining amount:
30%* (retransmission costs) = 0.3 * 853,956,630 lei/year = 256,186,908 lei/year
256,186,908 lei/year/365 days = 701,882 lei/day
Alina DINU, Raluca MAREI, Ion TUDOR, Lorian-Ovidiu VINTILA, Raluca-Elena GHINEA
228
For each of the 100 TV channels we will obtain:
701,882 lei/day/100 TV channels = 7,019 lei/day/station
Calculation of the average:
(4,111 lei/day/station + 5,850 lei/day/ station + 7,019 lei/day/ station) / 3 = 5,660 lei/ station
5,660 lei/ station = the value of one share point
(3) Share without the social-media influence = share TV channel - (the percentage with which
the social-media activity increases the audience of the TV channel / 100) * share TV channel.
(4) Share points due to social-media influence = TV channel share - TV channel share without
social-media influence
(5) The economic effect of social-media influence = the value of one share point/day (lei) *
share points due to social-media influence.
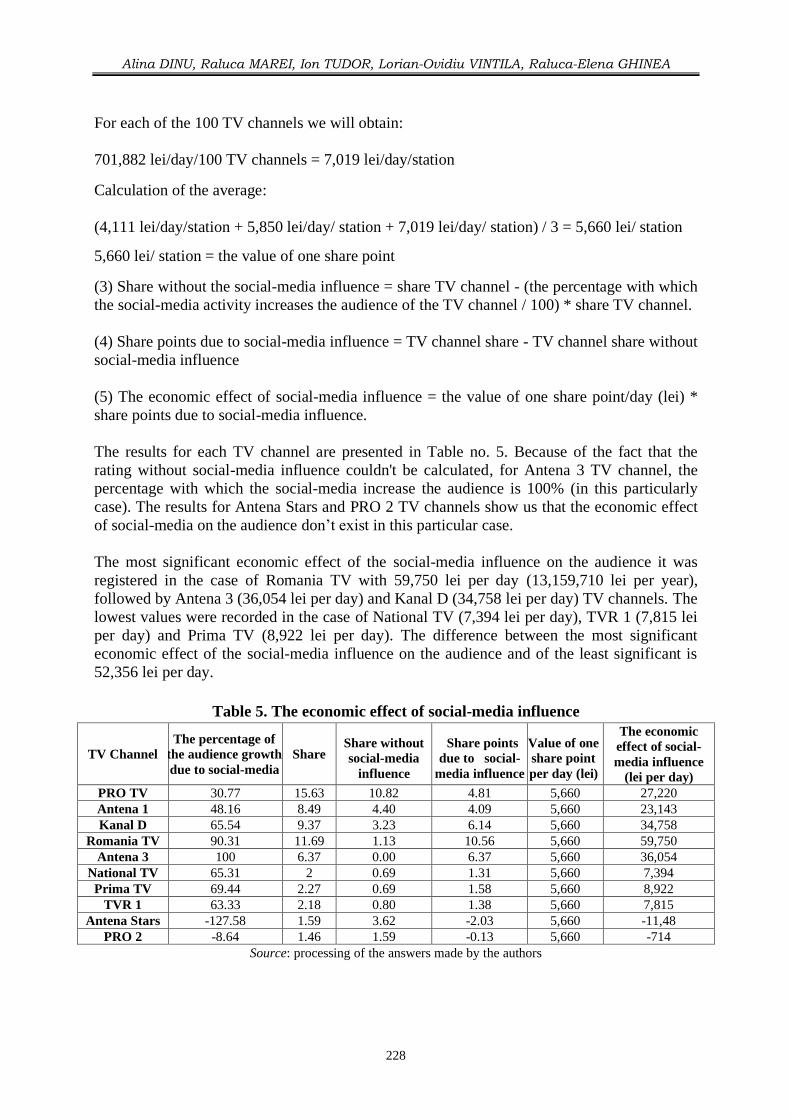
The results for each TV channel are presented in Table no. 5. Because of the fact that the
rating without social-media influence couldn't be calculated, for Antena 3 TV channel, the
percentage with which the social-media increase the audience is 100% (in this particularly
case). The results for Antena Stars and PRO 2 TV channels show us that the economic effect
of social-media on the audience don’t exist in this particular case.
The most significant economic effect of the social-media influence on the audience it was
registered in the case of Romania TV with 59,750 lei per day (13,159,710 lei per year),
followed by Antena 3 (36,054 lei per day) and Kanal D (34,758 lei per day) TV channels. The
lowest values were recorded in the case of National TV (7,394 lei per day), TVR 1 (7,815 lei
per day) and Prima TV (8,922 lei per day). The difference between the most significant
economic effect of the social-media influence on the audience and of the least significant is
52,356 lei per day.
Table 5. The economic effect of social-media influence
TV Channel
The percentage of
the audience growth
due to social-media
Share Share without
social-media
influence
Share points
due to social-
media influence
Value of one
share point
per day (lei)
The economic
effect of social-
media influence
(lei per day)
PRO TV 30.77 15.63 10.82 4.81 5,660 27,220
Antena 1 48.16 8.49 4.40 4.09 5,660 23,143
Kanal D 65.54 9.37 3.23 6.14 5,660 34,758
Romania TV 90.31 11.69 1.13 10.56 5,660 59,750
Antena 3 100 6.37 0.00 6.37 5,660 36,054
National TV 65.31 2 0.69 1.31 5,660 7,394
Prima TV 69.44 2.27 0.69 1.58 5,660 8,922
TVR 1 63.33 2.18 0.80 1.38 5,660 7,815
Antena Stars -127.58 1.59 3.62 -2.03 5,660 -11,48
PRO 2 -8.64 1.46 1.59 -0.13 5,660 -714
Source: processing of the answers made by the authors
Management and Economics Review Volume 5, Issue 2, 2020
229
5. DISCUSSION
With respect to the regression analysis, there are four lower values of the r squared: 0.0357
(3.57% of the variation in the National TV channel viewing options is explained by the social-
media activity of the viewers), 0.0259 (2.59% of the variation in Prima TV channel viewing
options is explained by the social-media activity of the viewers), 0.0490 (4.90 % of the
variation in TVR 1 channel viewing options is explained by the social-media activity of this
TV channel) and 0.0281 (2.81% of the variation in Pro 2 channel viewing options is explained
by the social-media activity of the viewers). These values are not so close to 1 (1 or 100%
indicates that the model explains all the variability of the response data around its mean), but
in the case of the first value, the standard error of the social-media activity of the viewers as
an independent variable regression is 0.069015. For the second and the fourth values the
standard error of the social-media activity of the viewers as an independent variables
regression is 0.071602 and 0.068289. For the third value, the standard error of the social-
media activity of the TV channel is 0.075789. Smaller values of the standard error of the
regression are better because it indicates that the observations are closer to the fitted line.
The rating without social-media influence for Antena 3 TV channel equals zero (do to the fact
that there wasn’t any person who declared that is watching daily Antena 3 TV channel but is
not seeing any type of social-media activity of this TV channel), and that explains the high
value of the economic effect of social-media influence on the audience in the case of this
television. Actually, there may be a certain number of people that are is watching daily
Antena 3 TV channel and see social-media activity of this TV channel, but from that people
does not exist in our data. The validity of the numbers stands out only in this case (we are
referring to the data that we were collected from the answers of the 99 respondents). The
results for Antena Stars and Pro 2 Tv channels show us that the economic effect of social-
media on the audience doesn’t exist in this particularly case because there is a significant
difference between the daily rating of TV channels without the social-media influence
(calculated by us) and the official one. The official one is lower by 27,169 in the case of
Antena Stars (21,294.729 in comparation with 48,463.866) a lower by 1,713 in the case of Pro
2 (19826.127 in comparation with 21539.496).
6. CONCLUSIONS
Both the main and secondary hypotheses have been validated and 196,134 lei per day is the
total economic effect of social-media influence on TV channels rating included in our study.
Thus, the purpose of this article has been achieved. Also, we defined the concepts of
organizational communication, television, social-media, social television, identifying and
analysing the new types of audiences on television in Romania.
Thus, the objective of this research has been achieved. The respondents of the questionnaire are
mostly women (59%), live in the urban area (92%), have the maximum income of 3000 lei/
month (77%) are employees (55%) and belong to the age category 18-65 years (85%).
The results showed that the respondents have seen more activity on social-media for Antena 1
and PRO TV channels.
Over 47% of the respondents said they see daily posts on social-media of PRO TV channel
and over 39% of them said they see daily posts on the social-media of Antena 1 channel.
Alina DINU, Raluca MAREI, Ion TUDOR, Lorian-Ovidiu VINTILA, Raluca-Elena GHINEA
230
Over 20.2% of the respondents check the social-media platforms of the TV channels or of the
broadcast programs weekly and over 38.3 check them daily.
On the other hand, about 37 % doesn’t check social-media platforms of the TV channels or of
the broadcast programs and about 4% check them monthly.
Regarding the number users of the television’s social-media platforms, if we exclude PRO 2
(which has more Instagram users), each TV station, among those included in the study, has a
higher number of Facebook users compared to the other social-media platforms (YouTube
and Instagram). The number of users of YouTube channels and Instagram pages of TV shows,
when we refer to a certain TV station, is approximately equal (e.g. National TV has 4
YouTube subscribers and 5 Instagram users).
REFERENCES
Allen, R.C. (2004). Frequently asked questions. In Allen, E.C. & Hill A. (Ed.). The Television
Studies Reader, London: Routledge, 1-27.
Burns, R. (1998). Television - An international history of the formative years, IEE History of
Technology Series, vol. 22, The Institution of Electrical Engineers, London.
Chávez, C.A., & Cordes, A. (2018). Selling Subversion: An African City and the Promise of
Online Television, Television & New Media, 19(3), 1-17.
Chenhall, R.H., & Morris, D. (1995). Organic decision and communication processes and
management accounting systems in entrepreneurial and conservative business
organizations, Omega, 23(5), 458-497.
Choi, Y.J., (2017). Emergence of the viewing public: Does social television viewing
transform individual viewers into a viewing public?, Telematics and Informatics, 34(7),
1059-1070.
Contractor, N., & Monge, P.R. (2003). Theories of Communication Network, Oxford
University Press: New York.
Duthler, G., Dhanesh, G.S. (2018). The role of corporate social responsibility (CSR) and
internal CSR communication in predicting employee engagement: Perspectives from the
United Arab Emirates (UAE), Public Relations Review, 44(4), 453-462.
Gerbner, G., & Gross, L. (1976). Living with Television: The Violence Profile, Journal of
Communication, 26, 172-199.
Havick, J., (2000). The impact of the Internet on a television-based society, Technology in
Society, 22, 273-287.
Huang, L., & Lu, W. (2017). Functions and roles of social-media in media transformation in
China: A case study of ‘‘@CCTV NEWS”, Telematics and Informatics, 34, 774-775. Jenkins, H. (2006). Convergence Culture: Where Old and New Media Collide, New York:
New York University Press.
Johansson, C., Grandien, C., & Strandh, K. (2019). Roadmap for a communication maturity
index for organizations – Theorizing, analysing and developing communication value,
Public Relations Review, 45(4), 1-17.
Kim, Y., Kang, M., Lee, E., & Yang, S-U. (2019). Exploring crisis communication in the
internal context of an organization: Examining moderated and mediated effects of
employee-organization relationships on crisis outcomes, Public Relations Review, 45(3).
Lotz, A.D. (2018). Evolution or revolution? Television in transformation, Critical Studies in
Television, The International Journal of Television Studies, 13(4), 491-494.
Management and Economics Review Volume 5, Issue 2, 2020
231
Luo, N., Guo X., Lu, B., & Chen, G. (2018). Can non-work-related social-media use benefit
the company? A study on corporate blogging and affective organizational commitment,
Computers in Human Behavior, 81, 84-92.
Manning, J. (2014). Social-media, definition and classes of. In K. Harvey (Ed.), Encyclopedia
of social-media and politics (pp. 1158-1162). Thousand Oaks, CA: Sage.
McAnally, H., Young, T., & Hancox, R.J. (2019). Childhood and adolescent television
viewing and internalizing disorders in adulthood, Preventive Medicine Reports, 15, 1-5.
Men, L.R., & Yue, C.A. (2019). Creating a positive emotional culture: Effect of internal
communication and impact on employee supportive behaviors, Public Relations Review,
45(3), 1-17.
Moran, A. (1998). Copycat television: globalisation, program formats and cultural identity,
University of Luton Press; Luton.
Nardi, B. A., Schiano, D. J., & Gumbrecht, M. (2004). Blogging as Social Activity, or, Would You Let 900 Million People Read Your Diary? Proceedings of the 2004 ACM
Conference on Computer Supported Cooperative Work - CSCW’04, 6(3), 222-231.
Nee, R. C., & Barker, V. (2019). Co-viewing Virtually: Social Outcomes of Second Screening
with Televised and Streamed Content, Television & New Media.
Plumert, J.M., Carswell, C., Devet, K., & Ihrig, D. (1995). The Content and Organization of
Communication about Object Locations, Journal of Memory and Language, 34(4),
477-498.
Qin, Y., & Men, L. R. (2019). Exploring negative peer communication of companies on
social-media and its impact on organization-public relationships, Public Relations
Review, 45(4).
Quintas-Froufe, N., & González-Neira, A. (2013). Active Audiences: Social Audience
Participation in Television, Comunicar, 43, 83-90.
Rauwers, F., Voorveld, H. A. M. & Neijens, P. C. (2016). The effects of the integration of
external and internal communication features in digital magazines on consumers'
magazine attitude, Computers in Human Behavior, 61, 454-462.
Selva, D. (2015). Audience and Political Engagement: An Analysis of Twitter Use during
Italian Talk Shows, Televion & New Media, 17(2), 159-173.
Spigel, L., & Olsson, J. (2004). Television after TV: essays on a medium in transition. Duke
University Press, London.
Thompson-Saud, G., Gelcich, S., & Barraza, J. (2018). Marine environmental issues in the
mass media: Insights from television, newspaper and internet searches in Chile, Ocean
and Coastal Management, 165, 154-160.
Uricchio, W. (2009). Contextualizing the broadcast era: nation, commerce, and constraint,
Annals of the American Academy of Political and Social Science, 625, 60-73
Van Riel, C.B.M. (1995). Corporate Communication, Prentice Hall: New York
Zubiaga, A. (2019). Mining social-media for newsgathering: A review, Online Social
Networks and Media, 13, 1-9