the influence of the morphological characteristics of
TRANSCRIPT

RSC Advances
PAPER
Ope
n A
cces
s A
rtic
le. P
ublis
hed
on 0
6 N
ovem
ber
2018
. Dow
nloa
ded
on 1
2/7/
2021
11:
59:3
1 PM
. T
his
artic
le is
lice
nsed
und
er a
Cre
ativ
e C
omm
ons
Attr
ibut
ion-
Non
Com
mer
cial
3.0
Unp
orte
d L
icen
ce.
View Article OnlineView Journal | View Issue
The influence of
aCentre of Physics, University of Minho,
Portugal. E-mail: [email protected] of Biological Engineering, Universi
Braga, Portugal
† Electronic supplementary informa10.1039/c8ra07490a
Cite this: RSC Adv., 2018, 8, 37254
Received 7th September 2018Accepted 29th October 2018
DOI: 10.1039/c8ra07490a
rsc.li/rsc-advances
37254 | RSC Adv., 2018, 8, 37254–3726
the morphological characteristicsof nanoporous anodic aluminium oxide (AAO)structures on capacitive touch sensor performance:a biological application†
J. O. Carneiro, *a F. Machado,a M. Pereira,a V. Teixeira,a M. F. Costa,a Artur Ribeiro,b
Artur Cavaco-Paulo b and A. P. Samantilleke*a
This work is devoted to the study of the influence of different anodic aluminium oxide (AAO) morphologies on
the sensitivity and performance of an AAO-based capacitive touch sensor. The AAO structures were fabricated in
a cylindrical homemade anodization cell made from a solid polycarbonate billet via a lathe machining process.
The AAOmorphologies were obtained from the anodization of Al foil by using three different types of electrolyte
(sulphuric acid, oxalic acid and phosphoric acid) and their morphologies are reported and compared using
scanning electron microscopy (SEM) micrographs and current–time characteristic curves. The sensors were
fabricated by integrating the AAO structure with a nanotextured gold thin film deposited over the AAO layer
by thermal evaporation, thus realizing a type of metal/insulator/metal parallel-plate capacitance sensor. It is
demonstrated that AAO morphologies have influence on the performance of the AAO-based capacitive
touch sensors. The variation of the capacitance of the sensors is investigated in this work for the AAO
structures produced from anodization in an attempt to select anodizing conditions for a biological application
aiming to detect small microorganisms such as bacterial colonies of Escherichia coli.
1. Introduction
The industrialization of the anodizing process arose in the mid-1920s, aer Buff1 have demonstrated the possibility of oxidizingmetallic aluminium using an electrochemical process carriedout in acid aqueous solution, which led to the formation of anoxide layer much thicker than that of its thin natural passivelayer. Since then, the application of anodized Al and its alloyshas continued to grow, as the anodizing process offers theanodized product a number of unique engineering protectionproperties such as excellent corrosion, hardness, and abrasionresistance.2 Since anodic aluminium oxides (AAOs) showedhigh porosity, they have been also employed in industry as goodadhesion platforms for electroplating, painting and decorativecoloration, in the form of colourful anodizing where applica-tions to car tuning nds its greatest expression. Furthermore,anodized products can be found in applications such as specialinjection moulds, various electronic devices, cookware sets,automotive parts, window frames for buildings, and severaltypes of machine components, among others. In many ways, it
Azurem Campus, 4800-058 Guimaraes,
ty of Minho, Gualtar Campus, 4710-057
tion (ESI) available. See DOI:
6
is noteworthy that almost a century aer the observation of Alanodizing, this phenomenon has recently triggered interest andacquired increased importance to the scientic community thatworks in leading scientic areas such as the eld of nanotech-nology. This trajectory was commenced with the work devel-oped by Masuda and Fukuda,3 who in 1995, reported theproduction of porous AAO layers exhibiting a self-ordered porestructure and one year later Masuda and Satoh4 developed, whatis known as two-step anodizing process by which porous AAOcould be obtained with improved structural periodicities overlarger spatial areas. AAOs nd many high-tech applications innanostructures and devices. Among different research areas,the use of AAO in one-dimensional nanostructures is note-worthy,5–11 as tubular membranes for hemodialysis,12,13
membranes for gas separation, drug delivery and bone xa-tion14–17 energy storage devices, among others.18–21 Recent workby several authors12,14 prove that nanostructured functionallayers of signicantly enlarged surface areas for sensor appli-cations can be made from thin porous alumina lms.
The fabrication of AAO is based on simple, cost-effective self-ordering anodization of aluminium, which yields verticallyaligned, highly ordered nanoporous structures.
It is well known that there are two main processes for AAOfabrication, namely mild anodization (MA) and hard anodiza-tion (HA).3,22 In general both of these processes utilize threedifferent types of acidic electrolytes, namely sulphuric, oxalic,
This journal is © The Royal Society of Chemistry 2018

Paper RSC Advances
Ope
n A
cces
s A
rtic
le. P
ublis
hed
on 0
6 N
ovem
ber
2018
. Dow
nloa
ded
on 1
2/7/
2021
11:
59:3
1 PM
. T
his
artic
le is
lice
nsed
und
er a
Cre
ativ
e C
omm
ons
Attr
ibut
ion-
Non
Com
mer
cial
3.0
Unp
orte
d L
icen
ce.
View Article Online
and phosphoric acids. The MA process has been mostly used inacademic work for a wide variety of nanotech applications.However, since MA uses a low anodizing potential, the growthrate of AAO nanostructures is in general slow, and the processbecomes even more time consuming under the two-step anod-izing conditions. On the contrary, HA is mostly used by certainindustrial applications due to efficient growth of AAO nano-structures and improved periodicity of nanopores over largerspatial areas. HA process requires the application of relativelyhigh anodic voltages, thus leading to a high current density,which causes the HA process to have exothermic characteristics(as the result of Joule's heating). However, the generation ofexcessive heat during HA processes is also responsible for theacidic dissolution of the formed AAO nanoporous structure aswell as strongly contributing to the occurrence of local break-down,23 for which reason the fabrication of AAO nanostructuresunder HA conditions has not been widely used in nanotech-nology applications. Several approaches have been made to ndeffective solutions to extract the reaction heat such as the use ofcooling systems24 or certain cooling reagents (e.g. ethanol isused as coolant agent) added to the aqueous electrolytes inorder to compensate or minimize the generated heating andlocal burning problems.25,26 In recent years, capacitive typetactile or pressure sensors have been reported.27,28 Hong et al.29
used AAO structures to serve as template to form a nanotexturedgold lm to fabricate a capacitive touch sensor to detect smallcontact forces, such as insects. The AAO structures were formedby two-step anodizing conditions from an aqueous solution of0.3 M oxalic acid at a voltage of 47 V DC. According to theauthors, they obtained an AAO structure with an averagenanopore diameter of 54 nm and a porosity of about 23.6%.Aer covering the entire pore structure by a nanotextured Au topelectrode, they registered a capacitance of �1.75 nF and anaverage capacitance variation of 4.1%.
Taking as basis the study performed by Hong et al., we haveperformed a experimental campaign in which the main objec-tive and novelty is to study the inuence of different AAOmorphologies, obtained by using three different acid electro-lytes and anodization conditions, on the sensitivity andperformance of an AAO-based capacitive touch sensor. Thesensor fabricated proved to be able to detect the surface contactinteraction of small objects (bacterial colonies of Escherichia coliand also a tiny metal plate were used in this work), due tovariations on the nanotextured Au electrode area. Escherichiacoli (E. coli) is particularly interesting in this study as capacitivesensors of this nature generally show high selectivity and is ableto distinguish E. coli when present together with competingbacterial strains, which are known to have similar shape.28 Idilet al. also reported suitability of similar capacitive touch sensorsfor the detection of E. coli, having investigated selectivity of theE. coli-imprinted electrode with other bacterial strains such asStaphylococcus aureus (S. aureus), Bacillus subtilis (B. subtilis),and Salmonella paratyphi (S. paratyphi) using real-time detec-tion experiments.30
The performance of the AAO capacitive-type sensor and itsdependence on the AAO morphology, which is characterized bydifferent structural parameters such as inter-pore distance
This journal is © The Royal Society of Chemistry 2018
(Dint), pore diameter (Dp) and porosity (P), which in turn, aredependent on the anodizing conditions, namely the electrolytetype, concentration, temperature, applied anodizing potentialand anodizing time will be investigated in this work.
2. Sensing principle and mechanismof the AAO capacitive-type sensor
The underlying physical principle that governs the practicalperformance of the AAO capacitive sensor, is associated with thevariation of capacitance, which results from changes on the AAOsurface area (due to the contact with the object) and also on theproperties of the dielectric medium. Under the scope of thiswork, the presence of small objects was simulated via the use ofa specic bacterial culture medium that clearly demonstrateda strong capability of the as-fabricated AAO-based capacitivedevice to be used in biomedical applications, such as in hypo-thetical scenarios where someone, over time, intends to monitorthe progression stage of a particular type of bacterial disease.
Fig. 1 refers to the underlying concept of a nanoporous AAOcapacitive sensor. The AAO structure is grown through theanodization process from a pure aluminium substrate. Thestructural properties (i.e. Dint and P), of the obtained AAOstructures depends on the type of electrolytes used, namelysulphuric, oxalic, and phosphoric acids.
Analysing Fig. 1(a), it is possible to identify the nanotexturedtop electrode, which is composed of an Au thin lm directlydeposited on the AAO porous layer by thermal resistive evapo-ration. The evaporation parameters are presented later in thetext. Fig. 1(b) depicts the metal–insulator–metal (MIM) capac-itor device, which consists of a base metal (Al) substrate, aninsulator (AAO layer) and a top metallic electrode (Au). Thesensor operating mechanism can be briey described asfollows: due to the AAO nanoporous structure, which may havedifferent structural properties according the type of used elec-trolyte, any external object (in this work, bacteria and also an Almetal disk) that could enter into contact with the surface of theMIM device will cover the surface pores to some extent, thuscausing a variation on the total electrical capacitance of theMIM device (see Fig. 1(c)). This occurs because, as soon as theobject contacts the nanotextured surface to cover new pores, itcreates additional capacitors (where the dielectric medium is airor a particular aqueous medium in the case of the bacteriaculture), which adds a parallel capacitive component to theexisting MIM device and thus, an increase of the total capaci-tance of the MIM device is expected. In this work the E. coli wasused as a model microorganism to assess and validate theability of the AAO based sensors to detect microorganisms.
3. Experimental3.1 Fabrication technology: production of AAO nanoporousstructures by Al anodization
The nanoporous AAO structures were electrochemicallyproduced from Al (99.999% purity) foils (0.25 mm thick,acquired from Sigma-Aldrich) by one-step anodizing process.
RSC Adv., 2018, 8, 37254–37266 | 37255

Fig. 1 Nanoporous AAO structure used as a capacitive-type sensor; (a) schematic representation of the metal–insulator–metal (MIM) sensorarchitecture comprising the nanotextured thin film Au top electrode, the nanoporous AAO insulator layer and the bottom Al substrate; (b) crosssection and top surface of theMIM based AAO capacitive sensor showingmain structural characteristics and (c) operatingmechanism of the AAObase capacitive sensor when a particular object (e.g. a colony of specific bacteria) makes a contact with the surface of the MIM sensor.
RSC Advances Paper
Ope
n A
cces
s A
rtic
le. P
ublis
hed
on 0
6 N
ovem
ber
2018
. Dow
nloa
ded
on 1
2/7/
2021
11:
59:3
1 PM
. T
his
artic
le is
lice
nsed
und
er a
Cre
ativ
e C
omm
ons
Attr
ibut
ion-
Non
Com
mer
cial
3.0
Unp
orte
d L
icen
ce.
View Article Online
The anodizing process was realized in a homemade anodizationcell comprising an anode (pre-treated Al foil) and a cathode (Pbplate). The body of the electrochemical cell is made of poly-propylene material and has a cylindrical geometry fabricated bylathe machining a solid polycarbonate billet.
The total volume of the anodization cell is about 220 ml,where the anode is placed at the bottom and holds a circulargeometry with a diameter of 20 mm. The cathode consists ofone Pb plate with rectangular-type geometry and dimensions of(105 � 15 � 4) mm. Some geometrical details related with thehomemade anodization cell are properly identied in the ESI(Fig. SI1(a) and (b)†).
Aer standard substrate cleaning, the Al foils were subjectedto a pre-treatment by ultra-sonication in ethanol/benzine for 10to 15 minutes at room temperature (RT). The Al foils were thendried and used as anodes in the anodization cell. In order to
Table 1 Experimental conditions of anodization process
Anodizing condition Sample IDElectrolyte type/concentration [M]
MA SU 0.3 M H2SO4
OX 0.3 M H2C2O4
HA P1 0.3 M H3PO4
P2
37256 | RSC Adv., 2018, 8, 37254–37266
obtain AAO structures with different structural parameters, theAl foils were anodized with the three different electrolytes:sulphuric acid (0.3 M), oxalic acid (0.3 M) and phosphoric acid(0.3 M). In the case of sulphuric acid and oxalic acid electrolytes,the anodizing process was realized at room temperature (RT)and we observed that the optimum anodizing potential (U) toachieve the best ordering of pores are 21 and 40 V, respectively.For the phosphoric acid electrolyte (HA conditions), the appliedanodization potential was U¼ 150 V at a temperature of 0 �C. Allthe Al foils were only subjected to one anodizing step by usingan EA-PS 3150-04B-power supply (from Elektro Automatik). Thecurrent transients, I(t), were monitored during the anodizationprocess using a EA-UTA 12 analogue interface (from Elektro-Automatik) equipped with LabView soware. The experi-mental conditions and the related samples' identication(sample ID) are shown in Table 1.
Electrolytetemperature (�C)
Appliedvoltage (V)
Anodizingtime (min)
RT 21 6040 40
0 150 0.671.08
This journal is © The Royal Society of Chemistry 2018
Paper RSC Advances
Ope
n A
cces
s A
rtic
le. P
ublis
hed
on 0
6 N
ovem
ber
2018
. Dow
nloa
ded
on 1
2/7/
2021
11:
59:3
1 PM
. T
his
artic
le is
lice
nsed
und
er a
Cre
ativ
e C
omm
ons
Attr
ibut
ion-
Non
Com
mer
cial
3.0
Unp
orte
d L
icen
ce.
View Article Online
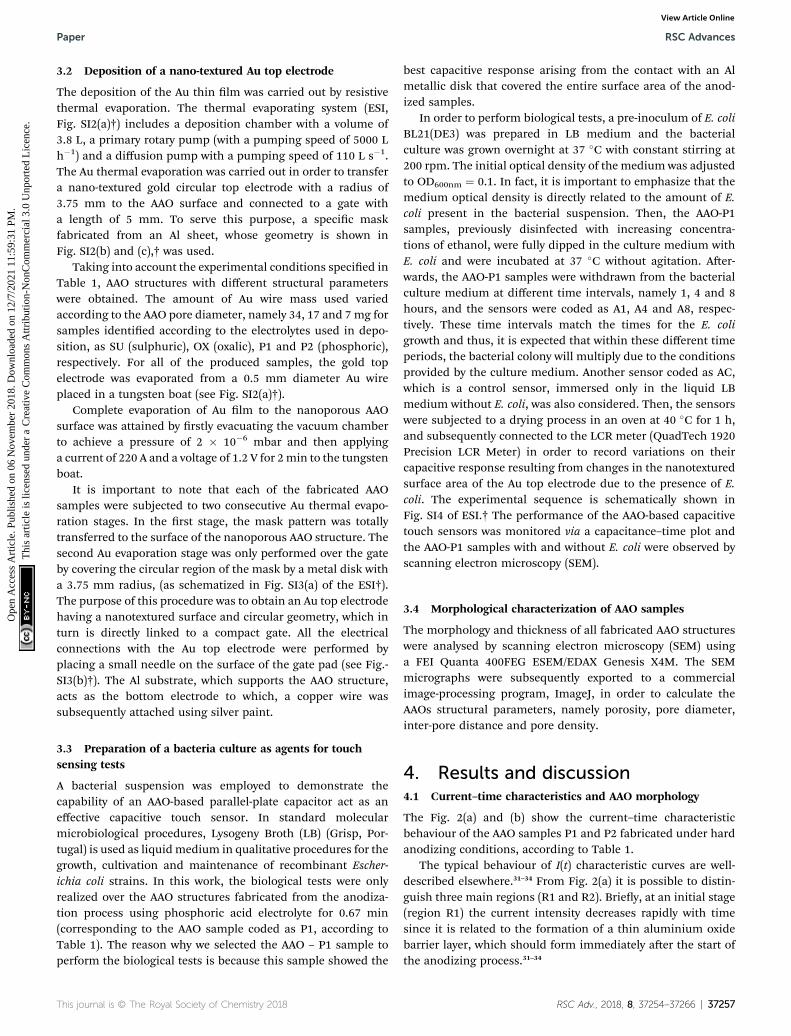
3.2 Deposition of a nano-textured Au top electrode
The deposition of the Au thin lm was carried out by resistivethermal evaporation. The thermal evaporating system (ESI,Fig. SI2(a)†) includes a deposition chamber with a volume of3.8 L, a primary rotary pump (with a pumping speed of 5000 Lh�1) and a diffusion pump with a pumping speed of 110 L s�1.The Au thermal evaporation was carried out in order to transfera nano-textured gold circular top electrode with a radius of3.75 mm to the AAO surface and connected to a gate witha length of 5 mm. To serve this purpose, a specic maskfabricated from an Al sheet, whose geometry is shown inFig. SI2(b) and (c),† was used.
Taking into account the experimental conditions specied inTable 1, AAO structures with different structural parameterswere obtained. The amount of Au wire mass used variedaccording to the AAO pore diameter, namely 34, 17 and 7 mg forsamples identied according to the electrolytes used in depo-sition, as SU (sulphuric), OX (oxalic), P1 and P2 (phosphoric),respectively. For all of the produced samples, the gold topelectrode was evaporated from a 0.5 mm diameter Au wireplaced in a tungsten boat (see Fig. SI2(a)†).
Complete evaporation of Au lm to the nanoporous AAOsurface was attained by rstly evacuating the vacuum chamberto achieve a pressure of 2 � 10�6 mbar and then applyinga current of 220 A and a voltage of 1.2 V for 2min to the tungstenboat.
It is important to note that each of the fabricated AAOsamples were subjected to two consecutive Au thermal evapo-ration stages. In the rst stage, the mask pattern was totallytransferred to the surface of the nanoporous AAO structure. Thesecond Au evaporation stage was only performed over the gateby covering the circular region of the mask by a metal disk witha 3.75 mm radius, (as schematized in Fig. SI3(a) of the ESI†).The purpose of this procedure was to obtain an Au top electrodehaving a nanotextured surface and circular geometry, which inturn is directly linked to a compact gate. All the electricalconnections with the Au top electrode were performed byplacing a small needle on the surface of the gate pad (see Fig.-SI3(b)†). The Al substrate, which supports the AAO structure,acts as the bottom electrode to which, a copper wire wassubsequently attached using silver paint.
3.3 Preparation of a bacteria culture as agents for touchsensing tests
A bacterial suspension was employed to demonstrate thecapability of an AAO-based parallel-plate capacitor act as aneffective capacitive touch sensor. In standard molecularmicrobiological procedures, Lysogeny Broth (LB) (Grisp, Por-tugal) is used as liquidmedium in qualitative procedures for thegrowth, cultivation and maintenance of recombinant Escher-ichia coli strains. In this work, the biological tests were onlyrealized over the AAO structures fabricated from the anodiza-tion process using phosphoric acid electrolyte for 0.67 min(corresponding to the AAO sample coded as P1, according toTable 1). The reason why we selected the AAO – P1 sample toperform the biological tests is because this sample showed the
This journal is © The Royal Society of Chemistry 2018
best capacitive response arising from the contact with an Almetallic disk that covered the entire surface area of the anod-ized samples.
In order to perform biological tests, a pre-inoculum of E. coliBL21(DE3) was prepared in LB medium and the bacterialculture was grown overnight at 37 �C with constant stirring at200 rpm. The initial optical density of the medium was adjustedto OD600nm ¼ 0.1. In fact, it is important to emphasize that themedium optical density is directly related to the amount of E.coli present in the bacterial suspension. Then, the AAO-P1samples, previously disinfected with increasing concentra-tions of ethanol, were fully dipped in the culture medium withE. coli and were incubated at 37 �C without agitation. Aer-wards, the AAO-P1 samples were withdrawn from the bacterialculture medium at different time intervals, namely 1, 4 and 8hours, and the sensors were coded as A1, A4 and A8, respec-tively. These time intervals match the times for the E. coligrowth and thus, it is expected that within these different timeperiods, the bacterial colony will multiply due to the conditionsprovided by the culture medium. Another sensor coded as AC,which is a control sensor, immersed only in the liquid LBmedium without E. coli, was also considered. Then, the sensorswere subjected to a drying process in an oven at 40 �C for 1 h,and subsequently connected to the LCR meter (QuadTech 1920Precision LCR Meter) in order to record variations on theircapacitive response resulting from changes in the nanotexturedsurface area of the Au top electrode due to the presence of E.coli. The experimental sequence is schematically shown inFig. SI4 of ESI.† The performance of the AAO-based capacitivetouch sensors was monitored via a capacitance–time plot andthe AAO-P1 samples with and without E. coli were observed byscanning electron microscopy (SEM).
3.4 Morphological characterization of AAO samples
The morphology and thickness of all fabricated AAO structureswere analysed by scanning electron microscopy (SEM) usinga FEI Quanta 400FEG ESEM/EDAX Genesis X4M. The SEMmicrographs were subsequently exported to a commercialimage-processing program, ImageJ, in order to calculate theAAOs structural parameters, namely porosity, pore diameter,inter-pore distance and pore density.
4. Results and discussion4.1 Current–time characteristics and AAO morphology
The Fig. 2(a) and (b) show the current–time characteristicbehaviour of the AAO samples P1 and P2 fabricated under hardanodizing conditions, according to Table 1.
The typical behaviour of I(t) characteristic curves are well-described elsewhere.31–34 From Fig. 2(a) it is possible to distin-guish three main regions (R1 and R2). Briey, at an initial stage(region R1) the current intensity decreases rapidly with timesince it is related to the formation of a thin aluminium oxidebarrier layer, which should form immediately aer the start ofthe anodizing process.31–34
RSC Adv., 2018, 8, 37254–37266 | 37257

Fig. 2 Current–time plot related to anodized sample P1 and P2. (a) The current intensity for sample P1 shows two main regions – R1, showinga sharp drop in current intensity and region R2, with a steady current intensity; and (b) the current intensity for sample P2 behaved almostidentical to the P1 for the first 60 s (t ¼ 60 s). The main difference of the current profiles is that from t ¼ 60 s (region R3) a sharp increase of thecurrent intensity was observed for the sample P2.
RSC Advances Paper
Ope
n A
cces
s A
rtic
le. P
ublis
hed
on 0
6 N
ovem
ber
2018
. Dow
nloa
ded
on 1
2/7/
2021
11:
59:3
1 PM
. T
his
artic
le is
lice
nsed
und
er a
Cre
ativ
e C
omm
ons
Attr
ibut
ion-
Non
Com
mer
cial
3.0
Unp
orte
d L
icen
ce.
View Article Online
The current intensity then increases slightly reaching a localmaximum. At this stage, the barrier layer experiences a thinningprocess until it reaches a stable thickness and, simultaneously,the pore formation is initiated on the convex surface due to theincrease of the local electric eld. In region R2, the current
Fig. 3 SEM micrographs of AAO nanostructures fabricated under hard asample P1, respectively whereas (c) and (d) are the side and top view mi
37258 | RSC Adv., 2018, 8, 37254–37266
intensity reaches a steady value, which is related to the growthof the porous layer.
On the other hand, from the current–time characteristiccurve the thickness h of the formed AAO structure can be esti-mated by applying the Faraday's law,35
nodizing conditions; (a) and (b) are side and top view micrographs forcrographs for sample P2, respectively.
This journal is © The Royal Society of Chemistry 2018

Fig. 4 Side view SEM micrographs of nanotextured MIM (Au-AAO-Al)parallel-plate capacitor produced with (a) sulphuric acid electrolyte(sample SU); (b) oxalic acid electrolyte (sample OX) and (c) phosphoricacid electrolyte (sample P1). The insets shown in (a) and (b) correspondto the SEM top view micrographs of non-textured Au anodizedsamples SU and OX, respectively. The inset shown in (c) is a photo ofthe surface of sample P1 showing the general appearance of itsnanotextured Au top electrode.
Paper RSC Advances
Ope
n A
cces
s A
rtic
le. P
ublis
hed
on 0
6 N
ovem
ber
2018
. Dow
nloa
ded
on 1
2/7/
2021
11:
59:3
1 PM
. T
his
artic
le is
lice
nsed
und
er a
Cre
ativ
e C
omm
ons
Attr
ibut
ion-
Non
Com
mer
cial
3.0
Unp
orte
d L
icen
ce.
View Article Online
h ¼ MQ
zFrA(1)
where z is the number of electrons involved in the anodizingreaction (in the present case, 6 electrons), F is the Faradayconstant (96 485 C mo1�1), Q is the total electrical chargepassing in the anodizing process and M and r are the molarmass and density of alumina, respectively. The total electrical
charge Q ¼ Ð t2t1Idt is the integral of current with respect to time,
which can be calculated from the experimental I(t) character-istic curve. The thickness of sample P1, determined by eqn (1),is about 5.54 mm, which is a reasonably value close to the onemeasured by SEM (z6.3 mm), as shown in Fig. 3(a), which refersto the side view micrograph of sample P1.
The analysis of SEM micrographs presented in Fig. 3(a) and(b) reveals that, in general, the sample P1 holds a morphologycharacterized by a well-dened and self-ordered porousalumina. The AAO structure of the sample P1 has an averagenanopore diameter and inter-pore distance of �183 nm and294.8 nm, respectively.
I(t) characteristic plot of sample P2, (Fig. 3(b)) shows thataer t ¼ 60 s, there was a sharp increase in current intensity(region R3) resulting in a strong local temperature rise due toJoule heating. It has been pointed out that generated heat playsan important role in the enlargement of the pore size byassisting dissolution of the oxide from pore walls, resulting intruncated pore channels.36 This behaviour can be clearlyconrmed by the observation of Fig. 3(c) and (d), which corre-spond to side and top view of the SEM micrographs for sampleP2, respectively. The inset shown in Fig. 6(d) is a photographicimage of the anodized surface for sample P2, which experienceda “local burning” due to Joule heating. It is possible to observea damaged and quite irregular surface, which results from thecollapse of the pores. It is important to note that althoughsample P2 does not appear to be useful for the main goal of thiswork, the destruction of its AAO structure due to pore collapsehas led to the formation of alumina nanobres, whichmay be ofgreat interest to several other nanotech applications. Theprocess reveals an efficient and economical method to produceAl2O3 nanobres.
The SEM micrographs presented in Fig. 4(a–c) show the sideview of the typical nanotextured Au-AAO-Al (MIM) parallel-platecapacitor referring to samples SU, OX and P1, respectively. Theinsets shown in Fig. 4(a) and (b) correspond to the SEM top viewmicrographs of non-textured Au anodized samples SU and OX,respectively (i.e. before thermal evaporation of gold). On theother hand, the inset shown in Fig. 4(c) is the photographicimage of sample P1, which reveals the general appearance of itsAu nanotextured surface area (Au top electrode).
Analysing SEM side view micrographs shown in Fig. 4(a–c) itcan be concluded that, in general, for all the produced samples,the thermally evaporated gold was deposited homogeneouslyand mostly in the regions of the pore walls, thus makinga nanoporous layer of Au on the surface of the AAO nano-structures. This evidence is attested by examining Fig. 4(c),which is the SEM micrograph of sample P1 acquired withbackscattered electrons (BSE), therefore enabling to observe the
This journal is © The Royal Society of Chemistry 2018
typical atomic brightness contrast related with the existence oftwo different materials, namely alumina and gold. In addition,compared to AAO structures before the deposition of Au theaverage diameters of pores have been slightly reduced aer thedeposition of Au, which can inuence the electrical response ofthese AAO structures. According to Nielsch et al.37 the porosity P(volume fraction of nanopores) of the AAO-based capacitivetouch sensor can be expressed as,
P ¼ p
2ffiffiffi3
p�Dp
Dint
�2
(2)
where Dp (in nm) and Dint (in nm) are the AAO pore diameterand the inter-pore distance, respectively, as indicated inFig. 1(b). On the other hand, the AAO pore density, n, is denedas the total number of pores that occupy a surface area of 1 cm2,and can be given as,
n ¼ 1014ffiffi3
p2Dint
2(3)
RSC Adv., 2018, 8, 37254–37266 | 37259

Table 2 Structural parameters for the fabricated AAO nanostructures
Sample IDPore diameter,Dp (nm)
Inter-pore distance,Dint (nm)
Calculated porosity,P (%)
Calculated poredensity, n (pore/cm2)
SU 21.8 45.2 21.0 5.6 � 1010
OX 58.0 118.7 22.0 8.1 � 109
P1 183.0 294.8 35.0 1.3 � 109
RSC Advances Paper
Ope
n A
cces
s A
rtic
le. P
ublis
hed
on 0
6 N
ovem
ber
2018
. Dow
nloa
ded
on 1
2/7/
2021
11:
59:3
1 PM
. T
his
artic
le is
lice
nsed
und
er a
Cre
ativ
e C
omm
ons
Attr
ibut
ion-
Non
Com
mer
cial
3.0
Unp
orte
d L
icen
ce.
View Article Online
In order to evaluate AAO structural parameters, a statisticalanalysis was performed over the top view SEM micrographspresented in Fig. 3 and 4 by using the image-processingprogram, ImageJ. Table 2 show the structural dimensions forthe produced AAO nanostructures.
Table 2 does not include results of the structural parametersfor sample P2, since the morphology of this sample does notpresent self-organized pores due to the almost completedestruction of its nanoporous structure arising from thecollapse of pore walls. For the other samples, the results shownin Table 2 reveal that the structural parameters of AAO samplesare strongly dependent on the anodizing conditions (i.e. hard ormild conditions). For example, concerning the sample P1,fabricated with 0.3 M phosphoric acid electrolyte (U¼ 150 V andT¼ 0 �C), the values of its structural parameters, namely Dp, Dint
and P are about 8.4, 6.5 and 1.6 times higher than those theobtained for sample SU. As a consequence, sample P1 has a poredensity that is markedly smaller (about 43 times lower) thanthat of the SU sample.
4.2 Capacitive characteristics of the AAO capacitive sensor
The capacitances of the fabricated AAO-based parallel-platecapacitors were estimated with the help of an LCR meter(QuadTech 1920 Precision LCR Meter), under a 100 kHz input
Fig. 5 The initial measured capacitance and the capacitance after the fuAAO capacitive sensor.
37260 | RSC Adv., 2018, 8, 37254–37266
signal with an amplitude of 1.0 V. This frequency was chosenbecause it is the one for which we obtained the lowest materialdielectric losses (below 1%). The dielectric constant of the AAOmaterial (3AAO) can be expressed as,
3AAO ¼ C � d
30 � AG
(4)
where d is the AAO thickness, 30 is the permittivity in the air, C isthe measured capacitance of the AAO capacitive sensor and AGis the AAO surface area covered by the Au lm, which can beexpressed as AG ¼ A (1 � P), where A is the circular area of theat surface without nanopores.
Fig. 5 shows the capacitance variations, DC (from which thesensors' sensitivity was calculated) for AAO sensors as the Autop detection electrodes come into contact with a metal Alcircular disk with 7.5 mm in diameter (inset).
Noteworthy is that the initial capacitance is the capacitanceof the AAO sensor with open pores but not covered by the metalAl circular disk. Thus, the greater the deviation of the capaci-tance from the AAO sensor initial capacitance, higher the devicesensitivity is.
For example, considering the measured capacitance forsample P1 and applying eqn (4), the dielectric constant (3AAO)can be estimated to be 8.69, which is close to the values typicallyreported in literature.38,39 In this work, the sensitivity, S, of the
ll contact of an Al disk with the Au nanotextured top electrode of the
This journal is © The Royal Society of Chemistry 2018

Paper RSC Advances
Ope
n A
cces
s A
rtic
le. P
ublis
hed
on 0
6 N
ovem
ber
2018
. Dow
nloa
ded
on 1
2/7/
2021
11:
59:3
1 PM
. T
his
artic
le is
lice
nsed
und
er a
Cre
ativ
e C
omm
ons
Attr
ibut
ion-
Non
Com
mer
cial
3.0
Unp
orte
d L
icen
ce.
View Article Online
AAO-based capacitive touch sensors in contact with the metal Alcircular disk was determined using eqn (5)40
S ¼�DC%
A
�(5)
where DC% ¼ [(C � C0)/C0] � 100 is the percentage change incapacitance of the sensor in which C corresponds to thecapacitance value of the AAO sensor in contact with the metal Alcircular disk, C0 is the initial capacitance of the AAO sensor(with open pores but not covered by the metal Al circular disk)
Fig. 6 Measurement of the capacitance variation with time for the AAObacteria. The values were recorded from (a) sample A1 (E. coli grown for 1h) and (d) control sample AC that does not contain E. coli as it was only imcorrespond to the recorded signal from the clean sensor (i.e. without liq
This journal is © The Royal Society of Chemistry 2018
and A is the top sensing electrode area fully contacted with theAl conductor circular disk of 7.5 mm in diameter. From Fig. 5, itis possible to observe that P1 sample (anodized with phosphoricacid electrolyte) present a capacitance change of 5.4%, which isthe highest value for the different produced samples. Moreover,by using eqn (5), it was also observed that the AAO sensor withthe average highest sensitivity of 0.12 DC%/mm2 corresponds toP1 sample (anodized with phosphoric acid electrolyte) while theother two types of AAO sensors fabricated under mild anodizingconditions, (namely the sample OX and sample SU) showed
touch sensor due to the contact with a suspension of Escherichia colih) (b) sample A4 (E. coli grown for 4 h) (c) sample A8 (E. coli grown for 8mersed in the LB liquid medium. The triangular dots (identified as AAO)uid medium and E. coli), which is used as reference.
RSC Adv., 2018, 8, 37254–37266 | 37261

RSC Advances Paper
Ope
n A
cces
s A
rtic
le. P
ublis
hed
on 0
6 N
ovem
ber
2018
. Dow
nloa
ded
on 1
2/7/
2021
11:
59:3
1 PM
. T
his
artic
le is
lice
nsed
und
er a
Cre
ativ
e C
omm
ons
Attr
ibut
ion-
Non
Com
mer
cial
3.0
Unp
orte
d L
icen
ce.
View Article Online
much lower sensitivities of 0.06 DC%/mm2 and 0.05 DC%/mm2,respectively. This difference in sensitivities demonstrates thatthe AAO sensor showing a higher porosity (higher pore diam-eter) is more sensitive and therefore, more suitable for capaci-tive sensing/touch applications. When comparing the sensingperformance of the present sensors with existing literatureinformation on similar studies, it can be observed that thevalues of capacitance change obtained herein are in line withthose assigned by Hong et al.29 In their work, the authors haveproduced AAO nanostructures by using a two-step anodizingconditions from an aqueous solution of 0.3 M oxalic acid ata voltage of 47 V DC, and have registered a capacitance changeof about 4% (in average), thus obtaining an AAO sensor withsensitivity of 0.21 DC%/mm2.
In fact, as the Al circular disk makes contact with thenanotextured Au lm, AAO nanopores (containing air inside)will be covered and as a consequence, a variation in the sensorcapacitance, DCair, can be observed, as schematized in Fig. 1(c).If the surface of touch sensor is entirely covered by the Al disk(see Fig. 5), the theoretical change in the sensing area is A � Pand the theoretical capacitance variation can be estimated asDCair ¼ [303air(A � P)/d], where 3air is the dielectric constant ofair. The sample P1 has the highest theoretical variation forsensor capacitance (DCair ¼ 6.2%), which is a slightly highervalue than the one experimentally obtained (DC ¼ 5.4%), thussuggesting the highest capacitance variation, could be chosento evaluate the performance of the AAO capacitive sensor forbacterial sensing applications.
Fig. 7 Schematic for a single pore of an AAO-based capacitive sensor,where the volume inside is partially filled by air while the rest is filled bythe LB culturemedium. The capacitance variation (DC) results from theseries connection of two capacitors with different dielectric constants(3air and 3LB) and thicknesses (d1and d2).
4.3 Performance of the AAO sensor for bacterial sensingapplications
For a biological application, the AAO sensor was used to detectthe presence over time of E. coli through micro-touch typesensing tests. Fig. 6(a–c) shows the time variation of capacitancefor the AAO touch sensor measured before (clean sensor) andaer the contact with E. coli bacteria. On the other hand,Fig. 6(d) shows the variation with time of the capacitance for thecontrol sensor (AC), which refers to the sample that was onlyimmersed in the LB liquid medium (i.e. without the presence ofE. coli). Triangular dotted lines used as reference in Fig. 6(a–c)denote the recorded signal from the clean sensor (i.e. with nobacterial suspension)
It can be observed that the capacitance of sensors has expe-rienced great intermittent variations during the time interval inwhich the capacitance measurements were taken for the samplesA1 and A4 (see Fig. 6(a) and (b), respectively). It is also noticeablethat, in general, there is a tendency to an increase in the value ofcapacitance over time. The aforementioned gures also presentthe measured optical density values of the culture medium,OD600 ¼ 0.15 and OD600 ¼ 0.50 for samples A1 and A4, respec-tively. The values clearly show that the suspension used forsample A4 hold a much higher amount of bacteria than that ofsample A1. In addition, this condition is also expressed by thevalues recorded for the capacitance at t ¼ 0 s, which are about0.49 nF and 0.93 nF for sample A1 and A4, respectively.
37262 | RSC Adv., 2018, 8, 37254–37266
In contrast, the sample A8, despite the existing amount ofbacteria (OD600 ¼ 0.61) is higher than that for the previous twosamples, it is surprising that the recorded values for capacitanceremain constant during the measurement period, showing anaverageDC%of about 35.7%, which result from the increase in themeasured capacitance when compared with the clean sensor.Furthermore, still keeping the comparison with the clean sensor,the AC control sample shows no signicant changes in capacitanceduring the measurement time, as would be already expected.
Aer the stipulated incubation period, the AAO sensorswere subjected to a drying process in an oven at 40 �C for 1 h.Taking these experimental conditions and assuming a totalevaporation of the LB liquid medium (the pores should onlycontain air inside), it is expected that E. coli has deposited onthe nanotextured surface of the Au electrode, thus making thenecessary electrical contact. Under these conditions, the AAOsensor's capacitance variation would result from the additionof new capacitors, connected in parallel, where the dielectricmedium is air (3air ¼ 1). In this case, the theoretical capaci-tance change is estimated as 6.2%, as already mentioned.However, this value is far from the ones experimentallyrecorded. This observation suggests that some volume of theLB culture medium possibly remains inside the pores of theAAO structures, which can occur because the surface positionof bacteria (covering the pores of the AAO nanostructures)could have avoided the evaporation of the LB liquid culturemedium from the porous channels of the AAO nanostructure,since the temperature of 40 �C as well as samples exposed for1 h inside the oven correspond to very moderate conditions.Under this situation, each individual pore would act (ina simplied arrangement) as two capacitors in series, wherethe effective dielectric constant has a contribution from the LBculture medium as well, as schematically shown in Fig. 7.
The total effective capacitance variation, DC, can be deter-mined as,
1
DC¼ 1
C1
þ 1
C2
(6)
This journal is © The Royal Society of Chemistry 2018

Paper RSC Advances
Ope
n A
cces
s A
rtic
le. P
ublis
hed
on 0
6 N
ovem
ber
2018
. Dow
nloa
ded
on 1
2/7/
2021
11:
59:3
1 PM
. T
his
artic
le is
lice
nsed
und
er a
Cre
ativ
e C
omm
ons
Attr
ibut
ion-
Non
Com
mer
cial
3.0
Unp
orte
d L
icen
ce.
View Article Online
where C1 ¼ [303air(A � P)/d1] is the capacitance of the rstcapacitor, which contains air as dielectric material withthickness d1 while, C2 ¼ [303LB(A � P)/d2] is the capacitance forthe second capacitor with the dielectric of LB liquid mediumwith thickness d2. For example, considering sample A8 andassuming that the dielectric constant of the LB culturemedium, 3LB, is around the value of the dielectric constant ofwater, 3LB z 3water ¼ 78 (20 �C).41,42 According Fig. 6(c), thecapacitance variation of about 35.7% for A8 sample (resultingfrom the increase on its capacitance) will be only achieved ifthe thickness of the LB culture medium is d2 z 5.3 mm and theair layer thickness is d1 z 1 mm, which corresponds to about84% and 16% of the total thickness (6.3 mm) of the anodic layerof the A8 sample, respectively (see SEM micrograph inFig. 3(a)). Moreover, as sample A8 was subjected to a long
Fig. 8 SEM micrographs showing the E. coli cells located on the surfaceonto the nanoporous AAO structures). Micrographs (a), (c) and (e) are tsensors A1, A4 and A8, respectively.
This journal is © The Royal Society of Chemistry 2018
period of incubation, there was an increase on bacteria growth(number of bacteria) in comparison with the other points oftime. For this incubation period, the higher number ofbacteria could result in a strong reduction of bacteria mobilityon the surface of the AAO-based sensor. As can be seen onFig. 8(e) and (f) the E. coli bacteria formed a biolm on thesurface of the sensor thus reducing the mobility of individualbacteria. Under these conditions, characterized by the lack ofbacteria mobility, the capacitance of the AAO sensor haseffectively remained constant during measurements. Thesesuggestions can be corroborated by the observation of the SEMmicrographs shown in Fig. 8(a–f), which refers to the samplesA1, A4 and A8.
For the case of A1 and A4 sensors, it is also possible toobserve that the amount of bacteria was not sufficient to entirely
of the nanotextured Au electrode (deposited by thermal evaporationop view, and (b), (d) and (f) are side view micrographs of AAO-based
RSC Adv., 2018, 8, 37254–37266 | 37263
RSC Advances Paper
Ope
n A
cces
s A
rtic
le. P
ublis
hed
on 0
6 N
ovem
ber
2018
. Dow
nloa
ded
on 1
2/7/
2021
11:
59:3
1 PM
. T
his
artic
le is
lice
nsed
und
er a
Cre
ativ
e C
omm
ons
Attr
ibut
ion-
Non
Com
mer
cial
3.0
Unp
orte
d L
icen
ce.
View Article Online
cover the surface area of the Au electrode (see Fig. 8(a–d)). Thisnding conrms that the results shown in Fig. 6(a) and (b),revealing a very high increase in the capacitance of A1 and A4samples, can not only be explained by the presence of bacteriaon the surface of the Au electrode avoiding the evaporation ofthe LB liquid from the AAO nanoporous channels. It is antici-pated that the moment the capacitance measurements werecarried out, many bacteria would still be alive, presenting anadequate mobility to cause changes in the recorded capaci-tance. This assumption is justied because, as the population ofthe bacterial colony is relatively low (due to the moderately lowincubation time for samples A1 and A4, respectively), asSemenov et al. reported,43 there could be a weak competitionbetween them in order to consume the “food” that is providedby a certain volume of the LB culture medium still enclosed inthe pores of the AAO structure. Although this is a not a widelyinvestigated topic, there is strong evidence that living micro-organisms that make up a bacterial colony holds speciccommunication mechanisms for their cooperation and survivalin community.44 The work developed by Maxim44 proves thatone of the communication mechanisms used by bacteria isassociated with the emission of infrared radiation (IR). In thiscontext, we speculate that there is the possibility that the IRradiation frequency, emitted by the bacteria resting on thesurface of the AAO structures, may be capable of selectivelyexciting determined vibration eigenmodes (and/or to causesome localized temperature changes), thus contributing tosignicant changes in the electrical properties of the AAOmaterial or its surroundings. Nevertheless, this speculationneeds further scientic investigation.
5. Conclusions
Nanoporous anodic aluminium oxides were successfullyproduced from three different types of electrolytes, namelysulphuric acid, oxalic acid and phosphoric acid by usinga cylindrical homemade anodization cell made from a solidpolycarbonate billet via a lathe machining process. Dependingon the anodizing conditions, different AAO morphologies (poresize, inter-pore distance and porosity) were achieved and it wasdemonstrated that they inuence the sensitivity and perfor-mance of capacitive touch sensors based on the manufacturedAAO structures. The experimental results show that the bestcapacitive response for the AAO-based capacitive touch sensorwas attained by using specic anodizing conditions requiringthe use of 0.3 M phosphoric acid at 150 V, 0 �C and a very fastanodizing process (�40 s), because the initial capacitance forthis Au-AAO-Al parallel-plate MIM capacitor (P1 sample) hasbeen increased by 5.4% and its corresponding sensitivity was of0.12 DC%/mm2. This is a much higher value than the ones re-corded for the other two sensors, namely the OX sample and SUsample, which presented sensitivity values of 0.06 DC%/mm2
and 0.05 DC%/mm2, respectively.As a biological application, the AAO-based capacitive touch
sensor has been successfully implemented to detect the pres-ence and progress over time of a given amount of E. coli bacteriain contact with the Au nanotextured surface of the AAO-based
37264 | RSC Adv., 2018, 8, 37254–37266
sensor. It was found that depending on the amount ofbacteria present on the Au nanotextured surface of the AAO-based sensor, its capacitive response also varied, indicatingthe occurrence of different interaction mechanisms betweenthe culture of bacteria and the sensor.
Conflicts of interest
There are no conicts to declare.
Acknowledgements
This study was supported by the Portuguese Fundaçao paraa Ciencia e a Tecnologia (FCT) under the scope of the strategicfunding of UID/FIS/04650/2013 and UID/BIO/04469/2013 unitsand COMPETE 2020 (POCI-01-0145-FEDER-006684). ArturRibeiro thanks FCT for funding the scholarship with the refer-ence SFRH/BPD/98388/2013.
References
1 H. Buff, Uber das electrische Verhalten des Aluminiums,Liebigs Ann. Chem., 1857, 102(2006), 265–284.
2 P. G. Sheasby and R. Pinner, The Surface Treatment andFinishing of Aluminium and Its Alloys, 6th edn, FinishingPublications Ltd. & ASM International, Materials Park, OH,and Stevenage, UK, 2001.
3 H. Masuda and K. Fukuda, Ordered Metal Nanohole ArraysMade by a Two Step Replication of Honeycomb Structuresof Anodic Alumina, Science, 1995, 268(5216), 1466–1468.
4 H. Masuda and M. Satoh, Fabrication of Gold Nanodot ArrayUsing Anodic Porous Alumina as an Evaporation Mask, Jpn.J. Appl. Phys., 1996, 35(Part 2, No. 1B), L126–L129.
5 D. H. Park, H. Seung Kim, M.-Y. Jeong, Y. Baek Lee,H.-J. Kim, D.-C. Kim, J. Kim and J. Jo, SignicantlyEnhanced Photoluminescence of Doped Polymer-MetalHybrid Nanotubes, Adv. Funct. Mater., 2008, 18(17), 2526–2534.
6 Ki H. Young, D. Hyuk Park, S. Kyu Park, H. Song, D.-C. Kim,J. Kim, H. H. Young, O. Kyung Park, B. Cheol Lee and J. Joo,Tuning and Enhancing Photoluminescence ofLight-Emitting Polymer Nanotubes through Electron-BeamIrradiation, Adv. Funct. Mater., 2009, 19(4), 567–572.
7 Y. K. Hong, D. H. Park, S. Gi Jo, M. H. Koo, D. -C. Kim, J. Kim,J. -S. Kim, S. -Y. Jang and J. Joo, Fine CharacteristicsTailoring of Organic and Inorganic Nanowires UsingFocused Electron-Beam Irradiation, Angew. Chem., Int. Ed.,2011, 50(16), 3734–3738.
8 T.-C. Chan, Y.-M. Lin, H.-W. Tsai and Z. M. Wang, Chien-Neng Liao, Yu-Lun Chueh, Growth of large-scalenanotwinned Cu nanowire arrays from anodic aluminumoxide membrane by electrochemical deposition process:controllable nanotwin density and growth orientation withenhanced electrical endurance performance, Nanoscale,2014, 6, 7332–7338.
This journal is © The Royal Society of Chemistry 2018

Paper RSC Advances
Ope
n A
cces
s A
rtic
le. P
ublis
hed
on 0
6 N
ovem
ber
2018
. Dow
nloa
ded
on 1
2/7/
2021
11:
59:3
1 PM
. T
his
artic
le is
lice
nsed
und
er a
Cre
ativ
e C
omm
ons
Attr
ibut
ion-
Non
Com
mer
cial
3.0
Unp
orte
d L
icen
ce.
View Article Online
9 S. Ghosh, T. Maiyalagan and R. N. Basu, Nanostructuredconducting polymers for energy applications: towardsa sustainable platform, Nanoscale, 2016, 8, 6921–6947.
10 U. Khan, M. Irfan, W. J. Li, N. Adeela, P. Liu, Q. T. Zhang andX. F. Han, Diameter-dependent multiferroic functionality inhybrid core/shell NWs, Nanoscale, 2016, 8, 14956–14964.
11 H. Wang, T. Chang, X. Li, W. Zhang, Z. Hu and A. M. Jonas,Scaled down glass transition temperature in connedpolymer nanobers, Nanoscale, 2016, 8(32), 14950–14955.
12 A. Khan Kasi, J. Khan Kasi, M. Hasan, N. Afzulpurkar,S. Pratontep, S. Porntheeraphat and P. Apirak, Fabricationof low cost anodic aluminum oxide (AAO) tubularmembrane and their application for hemodialysis, Adv.Mater. Res., 2012, 550–553, 2040–2045.
13 A. Belwalkar, E. Grasing, W. Van Geertruyden, Z. Huang andW. Z. Misiolek, Effect of Processing Parameters on PoreStructure and Thickness of Anodic Aluminum Oxide (AAO)Tubular Membranes, J. Membr. Sci., 2008, 319(1–2), 192–198.
14 G. Gorokh, A. Mozalev, D. Solovei, V. Khatko, E. Llobet andX. Correig, Anodic formation of low-aspect-ratio porousalumina lms for metal-oxide sensor application,Electrochim. Acta, 2006, 52(4), 1771–1780.
15 E. P. Briggs, A. R. Walpole, P. R. Wilshaw, M. Karlsson andE. Palsgard, Formation of highly adherent nano-porousalumina on Ti-based substrates: a novel bone implantcoating, J. Mater. Sci.: Mater. Med., 2004, 15(9), 1021–1029.
16 M. Darder, P. Aranda, M. Hernandez-Velez, E. Manova andE. Ruiz-Hitzky, Encapsulation of enzymes in aluminamembrane of controlled pore size, Thin Solid Films, 2006,495(1), 321–326.
17 D. Gong, V. Yadavalli, M. Paulose, M. Pishko and A. Craig,Grimes, Controlled Molecular Release Using NanoporousAlumina Capsules. Therapeutic Micro andNanotechnology, Biomed. Microdevices, 2003, 5, 75–80.
18 J. Chen, S. Wang, L. Ding, Y. Jiang and H. Wang,Performance of through-hole anodic aluminum oxidemembrane as a separator for lithium-ion battery, J. Membr.Sci., 2014, 461, 22–27.
19 Y.-keon Ahn, J. Park, D. Shin, S. Cho, Si Y. Park, H. Kim,Y. Piao, J. Yoo and Y. S. Kim, Enhanced electrochemicalcapabilities of lithium ion batteries by structurally idealAAO separator, J. Mater. Chem. A, 2015, 3, 10715–10719.
20 Y. Gao, Y. Lin, J. Chen, Q. Lin, Y. Wu, W. Su, W. Wang andZ. Fan, Three-dimensional nanotube electrode arrays forhierarchical tubular structured high-performancepseudocapacitors, Nanoscale, 2016, 8, 13280–13287.
21 A. P. Samantilleke, J. O. Carneiro, P. Alpuim, V. Teixeira andT. T. Thu Thuy, Nanoporous alumina templates: anodisationand mechanical characterisation, Nanotechnology, 2012, 4,319–342.
22 W. Lee and S. J. Park, Porous anodic aluminum oxide:anodization and templated synthesis of functionalnanostructures, Chem. Rev., 2014, 114(5), 7487–7556.
23 P. G. Sheasby and R. Pinner, The Surface Treatment andFinishing of Aluminum and Its Alloys, 6th edn, FinishingPublications Ltd. & ASM International, Materials Park, OH,and Stevenage, UK, 2001.
This journal is © The Royal Society of Chemistry 2018
24 W. Lee, R. Ji, U. Gosele and K. Nielsch, Fast fabrication oflong-range ordered porous alumina membranes by hardAnodization, Nat. Mater., 2006, 5, 741–747.
25 Y. Li, M. Zheng, L. Ma and W. Shen, Fabrication of highlyordered nanoporous alumina lms by stable high-eldanodization, Nanotechnology, 2006, 17, 5101–5105.
26 S. Ono, M. Saito and H. Asoh, Self-Ordering of Anodic PorousAlumina Induced by Local Current Concentration: Burning,Electrochem. Solid-State Lett., 2004, 7(7), B21–B24.
27 H. K. Lee, S. I. Chang and E. Yoon, A exible polymer tactilesensor: Fabrication andmodular expandability for large areadeployment, J. Microelectromech. Syst., 2006, 15(6), 1681–1686.
28 J. P. Bergstrom and T. Dong, Rapid Detection of E. coli Cellsin Urine Samples using a Self-Capacitance TouchscreenDevice, IEEE Engineering in Medicine and Biology SocietyConference Proceedings, 2015, pp. 5545–5548.
29 C. Hong, L. Chu, W. Lai, A.-S. Chiang and W. Fang,Implementation of a New Capacitive Touch Sensor Usingthe Nanoporous Anodic Aluminum Oxide (np-AAO)Structure, IEEE Sens. J., 2011, 11(12), 3409–3415.
30 N. Idil, M. Hedstrom, A. Denizli and B. Mattiasson, Wholecell based microcontact imprinted capacitive biosensor forthe detection of Escherichia coli, Biosens. Bioelectron.,2017, 87, 807–815.
31 A. P. Samantilleke, J. O. Carneiro, S. Azevedo, T. Thuy andV. Teixeira, Electrochemical Anodizing, Structural andMechanical Characterization of Nanoporous AluminaTemplates, J. Nano Res., 2013, 25, 77–89.
32 M. Mibus, C. Jensen, X. Hu, C. Knospe, M. L. Reed andG. Zangari, Dielectric breakdown and failure of anodicaluminum oxide lms for electrowetting systems, J. Appl.Phys., 2013, 114(1), 014901.
33 G. K. Singh, A. A. Golovin and I. S. Aranson, Formation ofSelf-organized Nanoscale Porous Structures in AnodicAluminum Oxide, Phys. Rev. B: Condens. Matter Mater.Phys., 2006, 73, 205422.
34 X. Zhao, S.-K. Seo, U.-J. Lee and K.-H. Lee, ControlledElectrochemical Dissolution of Anodic Aluminum Oxidefor Preparation of Open-Through Pore Structures, J.Electrochem. Soc., 2007, 154(10), C553–C557.
35 F. C. Walsh, The Overall Rates of Electrode Reactions:Faraday's Laws of Electrolysis, Trans. Inst. Met. Finish.,1991, 69(4), 155–157.
36 J. S. L. Leach and P. Neufeld, Pore structure in anodic Al2O3lms, Corros. Sci., 1969, 9(6), 413–421.
37 K. Nielsch, J. Choi, K. Schwirn and B. Ralf, Wehrspohn,Ulrich Gosele, Self-ordering Regimes of Porous Alumina:The 10 Porosity Rule, Nano Lett., 2002, 2(7), 677–680.
38 P. Lo, C.-C. Lee, W. Fang, Implementation of electrostaticallycontrolled Fabry–Perot interferometer using nanoporousanodic aluminum oxide layer, Transducers 2013, Barcelona,Spain, 16-20 June 2013, pp. 677–680.
39 J. I. Sohn, Y.-S. Kim, C. Nam, B. K. Cho and S. Tae-Yeon,Fabrication of high-density arrays of individually isolatednanocapacitors using anodic aluminum oxide templates
RSC Adv., 2018, 8, 37254–37266 | 37265

RSC Advances Paper
Ope
n A
cces
s A
rtic
le. P
ublis
hed
on 0
6 N
ovem
ber
2018
. Dow
nloa
ded
on 1
2/7/
2021
11:
59:3
1 PM
. T
his
artic
le is
lice
nsed
und
er a
Cre
ativ
e C
omm
ons
Attr
ibut
ion-
Non
Com
mer
cial
3.0
Unp
orte
d L
icen
ce.
View Article Online
and carbon nanotubes, Appl. Phys. Lett., 2005, 87(12),123115.
40 G. R. Suma, N. K. Subramanic, S. Sachhidananda andS. V. Satyanarayana, Siddaramaiah, NanotechnologyEnabled E.Coli Sensors: An Opto-Electronic Study, Mater.Today, 2017, 4, 11300–11304.
41 C. G. Malmberg and A. A. Maryott, Dielectric Constant ofWater from 0 C� to 1000 �C, J. Res. Natl. Bur. Stand., 1956,56(1), 2641.
42 C. Ren, L. Zeng and M. M. Zhou, Preparation, BiochemicalAnalysis, and Structure Determination of the
37266 | RSC Adv., 2018, 8, 37254–37266
Bromodomain, an Acetyl-Lysine Binding Domain, MethodsEnzymol., 2016, 573, 321–343.
43 A. V. Semenov, A. H. C. van Bruggen, Leo van Overbeek,A. J. Termorshuizen and A. M. Semenov, Inuence oftemperature uctuations on Escherichia coli O157:H7 andSalmonella enterica serovar Typhimurium in cow manure,FEMS Microbiol. Ecol., 2007, 60(3), 419–428.
44 V. T. Maxim, Light-mediated ‘‘conversation’’ amongmicroorganisms, Microbiol. Res., 2004, 159, 1–10.
This journal is © The Royal Society of Chemistry 2018