the informal sector in the jordanian economy - undp.org · 4 1.1 introduction the discovery of the...
TRANSCRIPT

The Informal Sector in theJordanian Economy


The views expressed in this publication are those of the author and do not necessarily represent those of the United Nations Development
Programme (UNDP), the report is the work of an independent team of authors sponsored by UNDP.
Copyright © 2013
All rights reserved. No part of this publication may be produced, stored in a retrieval system or transmitted, in any form or by any means,
electronic, mechanical, photocopying, recording or otherwise without prior permission for United Nations Development Programme.

Chapter One
Overview

4
1.1 Introduction
The discovery of the informal sector began to materialize in the early seventies. The notion, although
alien to many, showed logic and started to develop to this day. The debate over the importance of the
informal sector/economy continued, some believed that the informal sector is associated with poor
countries and economies and it would disappear once these countries achieved sufficient economic
growth.
The evolution of the informal sector theory throughout the past four decades showed that it can no
longer be considered as a temporary phenomenon. It is not considered to be a fixed characteristic in
countries where incomes and assets are not equitably distributed.
The past decades have indicated that the informal sector is clearly a potential engine of job and income
generation, thus the main challenges exist in developing innovative and supportive policies that
recognize the contributions, workforce of the informal economy and finding the correct method of
integrating this economy into the formal economy.
After initially realizing the existence of the formal economy another huge challenge arose. How do we
measure the informal economy? The first problem of measuring the informal economy is finding a
suitable definition of it. At the outset, it needs to be made clear that “the informal sector manifests
itself in different ways in different countries, in different cities within the same country”.
For the purposes of the present study the term ‘informal economy’ is preferred to the term ‘informal
sector’ for the following two reasons. First of all, the informal and formal parts of the economy are so
inter-related that it is difficult to imagine them as two distinct sectors. Second of all, the term ‘sector’ is
more commonly used to classify industry groups. (Chen, Jhabvala & Lund, 2001)
Smith (1994), for example, defines the informal economy as “market based production of goods and
services, whether legal or illegal, that escapes detection in the official estimates of GDP.” Schneider
(1986) also describes the informal economy as all economic activity that contributes to value added,
but which is presently not registered by national measurement agencies. Hartzenburg & Leimann
(1992), too, prefer a broad definition: “all economic activities pursued without the sanction of the
authorities; i.e. those not recorded in the national accounts.”

1.2 The Informality
5
The purpose of this study is to shed light on the status of the informal sector in Jordan, by being able to
better identify and measure it. Additionally the study will define the sectors in which the informal
economy operates.
In this paper we use a new and original data set, the Jordan Labor Market Panel Survey of 2010
(JLMPS 2010) to study changes in the structure and evolution of employment in Jordan. We strive to
better address the challenge of measuring the informal economy in Jordan. Previously conducted studies
have used the Employment and Unemployment Survey to estimate the informal sector. The JLMPS 2010
data is also offers significant advantages over the Employment and Unemployment Survey in its ability to
identify informal employment in its various guises, including wage and salary employment without
contracts or social insurance and self-employment and unpaid family employment. It also offers a more
detailed view of employment conditions including paid and unpaid leaves, the presence of health
insurance, hours of work, and the type and size of economic unit in which the worker is employed.
As mentioned in the introduction, the definition and measurement of the informal economy presents a
huge obstacle and we will be referring to it as informal economy as mentioned earlier as well.
At the same time the criteria used to define ‘informal economy’ varies depending on the legal, technical,
financial and organizational use to which the term is to be put. Researchers, therefore, typically define
the informal economy according to the criteria specific to their research and these criteria are not
generally applicable to other studies. For this reason, the present study will focus on generalized
definitions of the informal economy that may be used by a variety of studies.
One of the most important influences on the study of the informal economy has been the International
Labor Organization (ILO) in Geneva. The ILO (1993) probably offers the most comprehensive and widely
used definition of the informal economy: “The informal economy is broadly characterized as consisting
of units engaged in the production of goods and services with the primary objective of generating
employment and income to the persons concerned.” The informal sector then is defined as comprising
those households with market production that are:

1.3 The Issue of Measurement
6
• Informal own-account enterprises may comprise either all own-account enterprises or only those
which are not registered under specific forms of national legislations;
• Enterprises of informal employers may be defined in terms of either the size of the unit below a
specified level of employment, or the non-registration of the enterprise or its employees.
The System of National Accounts (SNA), which is a coherent and integrated set of internationally
accepted accounting concepts and rules devised by the United Nations, takes its definition directly
from the ILO definition. For statistical purposes, then, the SNA regards the informal economy as a
group of production units which form part of the household sector as household enterprises, or
equivalently, non-incorporated enterprises owned by households. (Prinsloo, 1999).
Despite the heterogeneity of the informal economy it is possible to use a classification of either the
type of economic unit, or the employment status of workers. Informal economy units can be micro-
enterprises, family businesses, and own-account operations. Workers in the informal economy are
sometimes actual employees of informal enterprises, but more often than not they are domestic
workers without regular contracts, casual workers without fixed employers, temporary workers who
get paid through an agency, part-time workers for fixed employers, and unregistered workers
(ILO, 2001).
Measurement of the informal economy is difficult because of its nature and composition. The informal
economy comprises of (i) households with at least some market production; and (ii) production units
with low levels of organization and technology, and with unclear distinction between labor and
capital or between household and production operations. Other typical characteristics of these units
are high mobility and turnover, seasonality, lack of recognizable features for identification, and
reluctance to share information. These units usually are not covered by establishment or enterprise
surveys, because they are not included in the sampling frames for these surveys. However, these units
might be covered by household surveys, which usually do not include questions pertaining to
production. Because of these issues, informal sector statistics are not collected through the regular
survey system of national statistical offices (NSOs). Therefore, informal sector statistics can be
compiled only through special surveys for this purpose.

1.4 The benefits of Informality
7
Since data on the informal economy and informal employment are not available regularly, if at all, the
national accounts statistics cannot cover this sector, resulting in distorted estimates of the structure of the
economy. This lack of information also hinders the understanding of policy makers in government, the
private sector, and the public about many social and economic issues related to informal sector activities,
such as lack of social protection; limited access to credit, training, and markets; and differentials in wages
and working conditions. As such, the policies and interventions that are formulated and implemented to
reduce poverty by generating decent work might not result in the desired outcome.
The collection of data on the informal sector can take many approaches independent surveys, mixed
household–enterprise surveys, labor force or other household surveys, or the expansion of coverage of
establishment surveys and economic censuses. Developing countries with limited public funds cannot
sustain many of these approaches, because conducting regular national surveys requires sizeable budgets.
However, many of these same countries have large informal sectors and informal employment that need
to be measured.
The reasons why people operate in the informal economy, either partially or completely can be shown
using cost/benefit analysis. It has been shown in a large number of international studies (Thomas 1999)
that the increase in taxation and other social security contribution burdens has been the most important
contributing factor in the increase in the size of informal economies. An increase in the marginal tax rate
in the formal economy would result in an increase in the opportunity cost of remaining in the formal
economy. The substitution of the informal economy by the formal economy would therefore result in a
net welfare loss due to the tax distortion.
Schneider & Enste (2003) use a modified form of the Laffer Curve to show the relationship between the
tax rate and the size of the various economic sectors (the public sector, the official sector, and the informal
sector). The Laffer Curve shows the relationship between the tax rate and the tax yield.
When taxes are introduced there is a positive incentive to move from the informal economy into the formal
economy, as the benefits derived from the public sector (ensuring property rights and public services)
outweigh the costs; ultimately this process reaches an optimal level. At a certain point, however, any
further rise in tax rates results in negative incentives to work in the formal economy due to the high tax
rates. This naturally has the effect, of expanding the informal economy.

1.5 The Costs of Informality
8
Increased regulation of the economy (i.e. a greater number of regulatory laws and licenses), and inefficient
bureaucracies are two further factors that increase the opportunity cost of operating in the formal
economy. In fact there is a direct correlation between increased regulation and increasing in size of the
informal economy: the greater the regulation of countries’ economies, the more informal activity there is.
A strong social welfare system also has the net effect of increasing the size of the informal economy by
raising the opportunity cost of operating in the formal economy. At the same time, however, a social
welfare system provides a major incentive to receive unemployment benefits – despite working in the
informal economy.
On the other hand, enforcing minimum wages which are too high might have the effect of driving firms
into the informal sector. By making labor more expensive, high minimum wages push firms (partially
those which hire low-skilled workers) to either increase their capital-labor ratio, reducing their demand for
labor, or to shift to the informal sector where wages are not regulated.
A dramatic increase in the informal economy leads to a decrease in the level of government tax revenue,
which leads to a reduction in government expenditure on public goods and services. In order to improve
expenditure on public goods and services, governments often increase tax rates.
According to Schneider (2002) findings such as the above demonstrate that governments should put
greater emphasis on improving law enforcement and regulations rather than on simply increasing the
number of regulations. However, in practice governments seem to increase the number of laws and
regulations in response to the growth of the informal economy.
The cost of operating in the informal economy can be presented in the fact that operating in the informal
economy means one cannot take advantage of government services that are provided to the formal
economy.
There are various public services that are not provided to the informal economy. The most important of
these services is probably access to the legal system. This would ensure property rights and the enforce-
ment of trade law. Because it does not have any legal support for any contracts or documents, the informal
company operates in an uncertain environment. This increases the risk and cost of doing business.
The increase in risk raises the cost of capital (i.e. ‘informal’ interest rates) and this, in turn, leads to lower
levels of investment.

1.6 Informality in the Jordanian Economy
9
However, the benefits of operating in the informal economy tend to outweigh the costs. Even if the costs
of operating in the informal economy increase, mistrust of the formal economy tends, in the end, to
prevent firms from ‘formalizing’ their operations.
In 2008, the Jordanian Department of Statistics (DOS) published a report which concentrated on female
employment in informal sector; the study covered greater Amman area. In order to establish the study,
the World Bank identified the informal economy as work in home, which means people who are not related
to a company, or who don’t have a job contract with a specific company; most of these people don’t pay
taxes, and might not have a social insurance record.
Based on this survey, in 2009, Al- Budirate presented a paper in the global forum on gender statistics
” Jordanian Experience in measuring Employment in the Informal sector”. The author viewed women
participation in the Jordanian working force, according to 2007 figures, 97.7% of inactive females are
housewives and students, self-employed females constituted 2.4% of the total employed females while
employer females constituted less than 1.7%.
In 2011 the World Bank issued the study under the title” Striving for Better Jobs: The Challenge of
Informality in the Middle East and North Africa”. The study resulted that the informal sector size varies in
the Middle East and particularly in the non-gulf countries. The size of the informal sector depends on the
availability of the natural resources and manpower in addition to the demographic state. The data showed
that countries with abundant labor and natural resources suffer from high rates of informal employment
such as (Iran, Syria and Yemen). Additionally, the data showed that 80% to 90% of the labor force doesn’t
contribute to the social security system; in spite of the high rate the rate of the non-observed part of the
GDP estimated around 20% to 25%.
On the other side , countries with low employment and natural resources such as Jordan, Tunisia and
Morocco, the percentage of the non-observed GDP in it reached 36% to 40%, while the proportion of the
labor force who don’t contribute to the social security system reached 45% to 67%.
The IMF in its last report “Regional Economic Outlook: Middle East and Central Asia” estimated the size of
the informal sector in the Jordanian economy at 26%, they used in their methodology the Multiple
Indicator-Multiple Cause (MIMIC) model.

1.7 The Methodology of the Study in Measuring the Informality
10
In collaboration between the Department of Statistics and the National Central of Human Resources
Development, a survey was conducted to track the Jordanian Labor market (JLMPS 2010). The survey
focused on studying the characteristics of the Jordanian labor market during the quarter of the last century.
In addition, the survey focused on new employment to the market and pursued the evolvement of this
employment over time. This survey in its approach characterized by its ability to monitor the informal
employment in its various guises, including wage and salary employment without contracts or social
insurance and self-employment and unpaid family employment.
In this study, we will distinguish between five types of employment, namely: (i) government employment,
(ii) formal private wage work, which includes wage and salary employment with either a legal employment
contract or social insurance coverage in either the private sector or in state-owned enterprises, (iii) informal
private wage work, which includes wage and salary work in the private sector with neither a contract nor
social insurance coverage, (iv) employers and self-employed individuals in the private sector, and finally
(v) unpaid family workers in the private sector.

Chapter Two
The reality of the labor marketin Jordan

2.1 The Labor Market in Jordan
12
In the last six decades, Jordan has witnessed key economic, social and demographic changes especially
after the 1948 war, which led to forced migration towards the Kingdom which increased the numbers of
the population and caused structural imbalances in the Jordanian labor market. The labor supply exceeded
the domestic demand due to the inability of the economy to absorb the large numbers the newcomers
to the labor force, which aggravated the unemployment problem.
In the seventies and eighties, the Jordanian labor market has witnessed marked developments reflecting
the conditions experienced by Jordan and the Arab Region in general regarding the political, economic
and social development. As a result, the size of the workforce in Jordan increased from 332.8 thousand
workers in 1973 to 420 thousand in 1980, to 630.1 thousand in 1990 and then to 1142.3 thousand in 2000.
Hence, the total participation rate in the past years has increased from 19.83% to 20.24%, 21.5% and to
26.4% respectively, while the unemployment rate has seen a marked fluctuation during the period
(1973-2000) and reached 11.1%, 3.5%, 16.8% and 13.7% respectively. In 2010, the estimated size of the
workforce was about 1412.1 thousand workers, the crude participation rate was 25.1%, and the unemplo-
yment rate was 12.5%. (Al-Talafhah, 1993 and the Ministry of Labor, 2010).
Unemployment rates have passed several stages since 1973, where the Jordanian economy turned around
towards semi-full employment of human resources, and calling for foreign workers to bridge the gap
caused by the developments in the Jordanian labor market. This has coincided with the economic
development plans (1973-1975), (1976-1980) and (1981-1985). This situation continued until the mid-
eighties, where the Jordanian economy witnessed a noticeable decline in production and employment,
which led to accelerated rates of unemployment. This coincided with the decline in domestic and external
demand for Jordanian labor. During this period, the return of the Jordanian emigrant labor started
especially from the Gulf countries (Khasawneh, 1986). Then the external demand for Jordanian labor
increased during the nineties, which contributed to a gradual decline in the unemployment rates.
In terms of the sectoral distribution of the Jordanian labor, it has witnessed a continuous decline of
contribution from the agricultural sector in the total employment from 16.8% in 1973, 10.2% in 1980,
7.3% in 1990 and then to 4.6% in 2000. This significant decline was due to the low return on agricultural
production and therefore workers in agriculture moved to other sectors, especially services, whose share
in total employment increased from 63.7% to 67.7%, 71.3% and to 73.3% respectively. The ratio of the
contribution of the industrial sector was 9.9%, 9.5%, 11.5% and 15.5% respectively and the construction

13
sector's contribution was 9.7%, 12.6%, 9.9% and 6.5% respectively. In 2004, the agricultural sector absorbed
3.55% of the total employment compared to 15.51% for the industrial sector, 7.11% for construction and
73.83% for the service sector. In 2010, the agricultural sector employed only 2.0% of the total employment,
compared to 12.3% in the industrial sector, 6.6% in the construction sector and 79.3% in the services sector.
(Ibrahim, 1989, the Ministry of Labor, 2004 and 2010).
Regarding the educational distribution of Jordanian employment, there was a significant improvement
due to the focus on investment in human resources through the establishment of different institutions
of higher education in the Kingdom, so the proportion of the Jordanian labor carrying the Secondary
Certificate and lower degrees decreased to less than 89.0% in 1973, 85.4% in 1980, 75.9% in 1990 and
69.0% in 2000, while the percentage of those carrying the bachelor's degree and other higher degrees
increased form 6.1% to 7.2%, 12.2% and to 17.6% respectively. In 2010, the percentage of those holding
the secondary certificates and lower degrees reached less than 49.6% versus 25.2% for Bachelor and higher
degrees holders (Ibrahim 1989, the Ministry of Labor, 2010).
The occupational distribution of employment in Jordan and its professional distribution was affected by
changes in the sectoral and educational distribution in the Jordanian labor market, it was in 1973 as follows:
specialists: 8.4%, administrators: 1.3%, clerks: 5.9%, in sales: 7.5%, employees in services: 6.2%, workers in
agriculture: 15.8%, and workers in production: 54.9%. The previous figures were in 1980 as follows: 13.3%,
1.6%, 6.4% and 8.2%, 6.4%, 10.1% and 54.1% respectively. While the percentages in 1990 were: 19.3%,
2.6%, 6.5% ,8.9%, 5.2% , 5.4%, and 52.1%, and in 2000, they were: 27.7% , 0.9%, 8.3 % , 0.1%, 15.0% , 3.3%
and 44.8%. In 2010, the previous percentages were as follows: Specialists 23.5%,, administrators 0.5%,
clerks 6.2%, workers in services and sales together 27.4%, workers in agriculture 1.5%, workers in produ-
ction 40.9% (Ibrahim 1989, the Ministry of Labor , 2010).
2.2 Characteristics of the Jordanian labor market
2.2.1 Imbalance in the labor market
2.2.2. Fluctuating rates of unemployment
14
The Jordanian economy and the Jordanian labor market were affected by the political and economic
previously experienced developments in the region, which have produced a changing demographic
reality for Jordan and imposed different economic pressures such as the forced migrations to Jordan in
1948, 1967, 1991 and 2003.
The reason of the imbalance in the Jordanian labor market could be resulted by the rapid changes
experienced by the Jordanian economy since 1948, accompanied by political and economic conditions
whose prerogatives are present to this day. By analyzing the supply and demand in the labor market, we
can conclude the reasons for this imbalance. Regarding supply, the high population growth increased the
supply of manpower, especially, where the rate of population growth in Jordan exceeds 28 per thousand.
This is caused mainly by migration to Jordan and low mortality rates, which reached 7 per thousand, as
well as high birth rates, which reached 30.1 per thousand in 2010 (Department of Statistics, 2010).
Furthermore, there is a continuous influx of foreign workers to Jordan since 1973, in addition to an
accelerated increase in the outputs of the educational system in Jordan. Regarding demand, there was an
obvious fluctuation in the demand for the Jordanian labor force the political conditions as well as the
Jordanian relations with the hosting countries of the Jordanian.
The labor market in Jordan witnessed during the period (1973-2010 a noticeable fluctuation in unemplo-
yment rates which ranged from 1.6% in 1976 to 18.8% in 1993, while they were 11.1% in 1973 (Ibrahim,
1989); however, the rate began to decline significantly since 1975 (below 9%) and began to increase
significantly since 1989 because of the economic crisis that hit Jordan that year and led to the low
exchange rate of the Jordanian Dinar for about the half in addition to the subsequent negative effects of
the second Gulf War on the Jordanian economy, which led to a decline in the external demand (particularly
from the Gulf countries) for Jordanian labor. The unemployment rate reached its peak in 1993 where it was
(18.8%) and fluctuation started again until it reached 12.5% in 2004 and 2010 (Ministry of Labor, 2004 and
2010).The reasons for the high rates of unemployment in the Jordanian labor market since the fifties are
due to the economic and political conditions which are still valid to this day. The reasons were associated
with the competition between foreign and national workers in various economic activities. The most
important reasons can be summarized as follows:

15
1. Slowdown in the economic growth since the eighties, compared with growth in the seventies when
Jordan witnessed important economic leaps and high growth rates (Al-Omari, 2002).
2. Rapid increase in the outputs of the educational system at different levels and lack of harmony between
these outputs and the needs of the Jordanian labor market.
3. The vocational education represents only a modest proportion (about 10%) of the output of the
educational system in Jordan, which focuses on the academic education as a whole.
4. High rates of population growth in Jordan (2.2% in 2010), which often exceed the economic growth
rates; therefore, the population increase will cause (especially in the long run) excess labor supply that
cannot be absorbed by the labor market.
5. The employment saturation reached by the public sector in Jordan, the largest employer in Jordan, and
the trend towards privatization of some public bodies led to a decline in the public sector's demand for
workforce.
6. The competition between foreign workers and national workers in Jordan for some professions, and
differences in wages. Foreign workers usually accept lower wages than the Jordanian workers are willing
to accept for the same job. Additionally foreign workers are more willing to work in difficult conditions
and for long hours, thus creating a better labor supply in those professions.
7. Decline in the external demand for Jordanian labor due to the retreat in the volume of investments in
the countries which have been considered traditional markets for the Jordanian labor, and the nationali-
zation of jobs policy whereby foreign labor is substituted in those markets by national workers.
8. Political conditions that were a result from turmoil and wars in the region, especially the second
Gulf War in 1991 which forced a large numbers of Jordanians living in the Gulf (about 350 thousand) to
return home and look for jobs, consequently unemployment rates began to increase rapidly and peaked
in 1993 (18.8%).

16
2.2.3. Low crude rate of participation
The crude activity rate in the labor force reached about 23% during the period (1973-2010), which is low,
despite the gradual rise it went through, which is much lower than those in other countries, as well as for
the refined activity rate in Jordan during the period (2006-2010), which was 39.3%, compared with 65% in
the U.S. ,62% in the UK , 58% in Israel and 58% in India (http://data.worldbank.org/indicator/SL.TLF.CACT.ZS).
The reasons for the low crude activity rate economic participation are:
1. Low rate of female participation in the labor force, which did not exceed 9.4% in 2010 due to customs
and traditions, such as marriage, child-bearing and family desires for better activities for females, which
reduced the rate of the contribution of women in the labor force in Jordan (Talafha and Fahdawi, 1998
and DOS, 2010).
2. The age composition of the Jordanian population, where children under the age of fifteen represent
about 37.1% of the total population because of the high fertility rate, which leads to lower proportion of
people of working age (between 15 and 65 years).
3. The expansion of the educational system in Jordan which is mainly directed to investing in human
capital, and therefore it delays the entrance of part of the population into the labor market, where those
who still receive their education at different stages in Jordan represent about a third of the Kingdom's
population (Ibrahim A, 1989).
4. The persistent migration of young workers to work abroad, especially in the Gulf Countries despite the
slow pace of this migration for more than 15 years is still within narrow limits especially for talented
people, professionals and non-traditional jobs.
Early pension systems for a large part of the population (Amira, 1991), especially for those who work
outside the system of retirement of the General Organization of Social Security. The early retirement
systems include civilian and military retirement systems before 1994; however, the social security system
has been lately applied to cover on any person appointed in the different governmental institutions so as
to include all the workers under one umbrella, the social security retirement system.

17
Year!Total Labor
Force (thousand)!
Workers in the economy
(thousand)!
Participation rate (%)!
Unemployment rate (%)!
1973 333.8! 296.0 19.9 11.1 1974 343.9 316.4 19.8 8.0 1975 355.4 338.1 19.7 4.9 1976 367.2 361.3 19.8 1.6 1977 379.5 371.0 19.6 2.2 1978 392.2 380.9 19.8 2.9 1979 405.3 391.1 19.8 3.5 1980 420.0 405.3 20.2 3.5 1981 435.4 418.4 21.1 3.9 1982 451.2 431.8 21.1 4.3 1983 467.7 445.3 21.1 4.8 1984 484.7 458.5 21.4 5.4 1985 502.4 472.3 21.1 6.0 1986 535.4 492.5 21.3 8.0 1987 555.7 509.3 21.4 8.3 1988 572.2 521.8 21.4 8.8 1989 583.5 523.5 21.5 10.3 1990 630.1 524.2 21.5 16.8 1991 646.6 525.0 17.5 18.8 1992 706.0 600.0 17.4 15.0 1993 809.3 657.2 21.1 18.8 1994 948.7 803.5 23.8 15.3 1995 974.6 836.2 23.5 14.2 1996 994.0 874.7 22.4 12.0 1997 1032.7 884.0 23.2 14.4 1998 1064.8 903.0 23.3 15.2 1999 1116.2 955.5 23.8 14.4 2000 1142.3 989.2 23.7 13.4 2001 1175.7 1002.9 23.8 14.7 2002 1216.8 1030.6 24.0 15.3 2003 1227.2 1049.3 23.6 14.5 2004 1250.3 1094.0 23.4 12.5 2005 1273.3 1073.3 23.3 14.8 2006 1226.2 1055.8 21.9 14.0 2007 1312.6 1140.4 22.9 13.1 2008 1342.8 1172.7 23.0 12.7 2009 1400.8 1220.5 23.4 12.9 2010 1412.1 1235.9 23.1 12.5
Table 2.1
Labor force, Workers, Participation Rates and
Unemployment Rates (1973-2010)
Source:
- Talafha, Hussein (1993), Labor Supply and the Rate of Participation in the Labor Force in Jordan, ABHATH ALYARMOUK-
Humanities and Social Sciences Series, Volume IX, No. IV, pp. 271-307.
- Ministry of Labor, Annual Report, from 1991-2010.

18
2.2.4. Imbalance in sectoral distribution
2.2.5. Imbalance in the geographical distribution
The area fit for cultivation in Jordan is decreasing due to expansion of construction, limited water resources,
outdated technology used in the agricultural sector, and low returns in agriculture which led to a declining
contribution of this sector in total employment for the benefit of other economic sectors, particularly
services and industry. In 2010, the percentage of contribution of the agricultural sector in total employ-
ment came to 2.0% versus 79.1% for the services sector and 12.3% for the industrial sector, while the
previous proportions were in 1973 16.8%, 63.7% and 9.9% respectively. (Issa Ibrahim, 1989, the Ministry
of Labor, 2010); the annual rate of the decline in the proportion of using the agricultural sector for a part
of the overall employment during (1973-2010) was 5.9%.
Employment in Jordan is concentrated on the Greater Amman area. In 2010, the central region, which
includes the Governorates of Amman, Zarqa, Balqa and Madaba had the largest proportion of the
workforce (68.1%), followed by the northern region, which includes the Governorates of Irbid, Mafraq,
Jerash and Ajloun (21.2%), and the southern region, which includes the Governorates of Karak, Ma'an,
Tafileh and Aqaba (10.7%). It seems evident that the proportion of the workforce in each region of the
total workforce in Jordan is a reflection of the proportion of the population in the same region, where the

2.2.6 Sending and receiving market
2.3. The Structural changes in the labor force
19
central region is inhabited by the largest proportion (62.8%), followed by the north region, which is
inhabited by (27.8%) and finally the southern region which is inhabited by (9.4%) (Ministry of Labor, 2010).
This is attributed partially to the fact that the central region includes ministries, official departments,
public services institutions, factories, private interests and investments.
The labor market in Jordan is considered to be an importer and exporter of labor. Jordan imports labor
from Arab and foreign countries and also exports workers to Arab countries, especially the Gulf Countries.
The peak of the import and export of workforce in Jordan was in the eighties, when Jordan benefited from
the differences in wages between what was paid for the Jordanian workers abroad and what is paid to
the foreign workers coming to Jordan, especially for similar professional groups.
In 1985, for example, the total number of Jordanian emigrant labor was about 339 thousands workers,
which represents about 67.5% of the total work force of Jordan and 12.6% of the total population. In the
same year, the volume of foreign workers coming to Jordan was 143 thousand workers, which constitutes
about 28.5% of the total labor force in Jordan, 30.3% of all the workers in the economy and 5.3% of the
total population. In 2010, the number of registered foreign workers coming to Jordan was 298,342, while
the number of Jordanian workers abroad was about 350 thousand (Athamneh, 2011).
The economic, social and political developments witnessed by Jordan caused structural changes in the
labor market of the Kingdom during the last four decades.
2.3.1. Employment according to the economic activity
The sectoral distribution of employment in Jordan is characterized as being imbalanced due to the nature
of each economic activity, in addition to the technological development used in these activities.
The structural changes in the GDP between economic sectors play an important role in the distribution
of the labor force in the same sectors; i.e. the sectoral distribution of employment is reflected in the
sectoral distribution of the GDP (Al-Talafhah, 1990); therefore, the economic sectors that are growing at
high rates should employ more people than the sectors which grow at lower rates.

20
Table (2.2) refers to a significant decline in the number of workers in the agricultural sector from 49.8
thousand workers in 1973 to 24.7 thousand in 2010 with an annual decline of 1.9%. The proportion of
workers in the agricultural sector in the above two years decreased from 16.8% to 2.0% respectively
because of the decreasing cultivated lands and rapid technological developments which have been
entered into the agricultural sector and contributed to the presence of employment in addition to the low
economic returns in this sector compared with other economic sectors.

21
Source:
- Issa Ibrahim and others (1989), the Study of the Reality and Future of the Jordanian Labor Market, part III, the Jordanian
Labor Market Database, Royal Scientific Society, Amman, table (3-11), p. 62.
- Ministry of Labor, Annual Report, for the years (1990-2010).
Table (2.2)
The Distribution of the Labor Force by Economic Activity in Jordan (1973-2010)
(Thousand Worker)
Agriculture Industry Construction Services Year
Workers in the economy
No. % No. % No. % No. %
1973 296.0 49.8 16.8 29.4 9.9 28.8 9.7 188.5 63.5 1974 316.4 50.4 15.9 31.4 9.9 32.5 10.3 202.1 63.9 1975 338.1 50.2 14.9 32.8 9.7 36.2 10.7 218.9 64.7 1976 361.3 49.5 13.7 34.1 9.4 39.4 11.0 238.1 65.9 1977 371.0 48.0 13.0 34.8 9.4 43.4 11.7 244.7 65.9 1978 380.9 46.6 12.2 35.5 9.3 47.0 12.3 251.9 66.1 1979 391.1 45.1 11.5 36.1 9.2 50.8 12.9 259.4 66.3 1980 405.3 41.4 10.2 38.6 9.5 50.9 12.6 274.4 67.7 1981 418.4 39.0 9.3 42.2 10.1 52.5 12.6 284.5 68.0 1982 431.8 35.8 8.3 45.5 10.5 52.6 12.2 297.7 69.0 1983 445.3 32.8 7.4 48.7 10.9 52.7 11.8 311.1 69.8 1984 458.5 34.9 7.6 52.0 11.3 52.7 11.5 318.9 69.6 1985 472.3 36.9 7.8 55.1 11.7 51.9 11.0 328.5 69.6 1986 492.5 37.4 7.6 58.1 11.8 54.2 11.0 342.8 69.9 1987 509.3 37.7 7.4 62.1 12.2 53.4 10.5 356.2 70.3 1988 521.8 39.7 7.6 62.2 11.9 52.6 10.1 367.0 71.3 1989 523.5 37.7 7.2 61.8 11.7 51.8 9.9 373.0 71.3 1990 524.2 38.3 7.3 60.3 11.5 51.9 9.9 373.8 71.3 1991 525.0 40.8 7.4 64.3 11.6 54.0 9.8 393.0 71.2 1992 600.0 44.4 7.4 68.4 11.4 60.0 10.0 437.0 71.2 1993 657.2 42.0 6.4 74.3 11.3 46.0 7.0 494.8 75.3 1994 834.8 54.3 6.5 97.7 11.7 79.3 9.5 603.6 72.3 1995 836.2 57.7 6.9 107.0 12.8 83.6 10.0 587.8 70.3 1996 874.7 82.2 9.4 100.6 11.5 84.8 9.7 607.0 69.4 1997 884.0 68.0 7.7 141.4 16.0 84.0 9.5 590.5 66.8 1998 903.0 60.5 6.7 145.4 16.1 72.2 8.0 624.9 69.2 1999 955.5 58.3 6.1 143.3 15.0 68.8 7.2 686.0 71.8 2000 989.2 45.5 4.6 153.3 15.5 64.3 6.5 725.1 73.3 2001 1002.9 41.1 4.1 151.4 15.1 68.2 6.8 742.1 74.0 2002 1030.6 41.2 4.0 155.6 15.1 64.9 6.3 768.8 74.6 2003 1049.3 37.8 3.6 160.5 15.3 67.2 6.4 783.8 74.7 2004 1094.0 39.4 3.6 169.6 15.5 77.7 7.1 807.4 73.8 2005 1073.3 36.5 3.4 154.6 14.4 67.6 6.3 814.6 75.9 2006 1055.8 32.7 3.1 144.6 13.7 66.5 6.3 811.9 76.9 2007 1140.4 30.8 2.7 151.7 13.3 76.4 6.7 881.5 77.3 2008 1172.7 30.5 2.6 151.3 12.9 75.1 6.4 915.9 78.1 2009 1220.5 34.2 2.8 156.2 12.8 81.8 6.7 948.3 77.7 2010 1235.9 24.7 2.0 152.0 12.3 79.1 6.4 980.1 79.3

22
Table (2.2) refers to a significant decline in the number of workers in the agricultural sector from 49.8
thousand workers in 1973 to 24.7 thousand in 2010 with an annual decline of 1.9%. The proportion of
workers in the agricultural sector in the above two years decreased from 16.8% to 2.0% respectively
because of the decreasing cultivated lands and rapid technological developments which have been
entered into the agricultural sector and contributed to the presence of employment in addition to the low
economic returns in this sector compared with other economic sectors.
As for the industrial sector, it is evident form the same table that there is a steady increase in the number
of employees in the sector from 29.4 thousand in 1973 to 152.0 thousand in 2010 with an annual growth
of 4.5%; as a result of this, the contribution of the industrial sector in the total employment in the two
years has increased from 9.9% to 12.3%, respectively. The reason for the ability of the Jordanian industrial
sector in absorbing the growing labor is the Unbalanced Growth strategy adopted by Jordan in order to
achieve economic development by focusing on the industrial sector as an engine for the economic
development.
Regarding the construction sector, its employment has increased from 28.8 thousand in 1973 to 79.1
thousand in 2010 with an annual growth rate of 2.8%. Despite the marked increase in the number of
workers employed by the sector, the percentage of the sector's employment out of the total employment
has declined between the above-mentioned years from 9.7% to 6.4%, respectively because of the
construction sector largely depends on the foreign labor, which increased from 224 thousand workers in
1980 to 336 thousand in 2010.

23
With regard to the services sector, it has the largest share of the total labor force whereby the number of
employees increased from 188.5 thousand workers in 1973 to 980.1 thousand in 2010 with an annual
growth rate of 4.6%. Workers as a percentage of the total employment in the service sector increased in
the two years from 63.5% to 79.3%, respectively. The services sector is thus considered the main employer
for the new entrants to the labor market, where Jordanians prefer to work in the public sector (the public
sector with all its bodies and the armed forces), which constitutes a high percentage of the total workforce
(about 37% in 2010, for example).
The labor market in Jordan has witnessed remarkable development in the educational levels of the
workforce because of the focus on investment in the human capital in order to meet the growing
development needs in the Kingdom at all the economic and social dimensions. This has resulted in the
establishment of universities, technical institutes and schools in order to provide the labor market with
qualified workers to meet the needs of employment. As a result, the labor force’s holding of high academic
qualifications increased due to the acceleration of the pace of education that emerged from the interde-
pendence of wages with the educational level (Abu-Jaber, 1991).
Table (2.3) shows that the proportion of workers holding the Secondary and lower certificates has
declined from 89% in 1973 to 75.9% in 1990 and then to 73.5% in 2010. The number of those workers in
the same years increased from 296.2 to 478.2 and to 960.3 thousand workers, respectively with an annual
growth rate of 4.1% during the period (1973-2010).
The number of individuals holding a Diploma has increased form 15.6 thousand in 1973 to 75.0 thousand
in 1990 and then to 102.6 thousand workers in 2010 with an annual growth of 5.2% during the period
(1973-2010). Their percentage of the total employment in the same years was 4.7%, 11.9% and 8.3%
respectively.
With regard to those holding the Bachelor and higher degrees, their number has increased from 21.0
thousand in 1973 to 76.9 thousand in 1990 and then to 173.0 thousand workers in 2010 with an annual
growth rate of 5.9% during the same period. Their percentages from the total employment in the previous
years have increased from 6.3% to 12.2% and to 14.0%. Despite the significant rise in the number of the
university graduates, their percentage from the total labor force is still low; the labor market in Jordan
still suffers from a shortage in the needs of professions and disciplines, especially during the economic
2.3.2. Employment according to the educational level

24
boom which motivated Jordanian labor in this category to emigrate (Ibrahim A, 1989, and DOS, 2010).
The emigration of part of the Jordanian labor has also increased this shortage, where the number of
emigrants from the Diploma and Bachelor holders was estimated by 33% from the total Jordanian
emigrants in 1985 (Al-Talafha, 1989).

25
Source:
- Issa Ibrahim and others (1989), the Study of the Reality and Future of the Jordanian Labor Market, part III, the Jordanian
Labor Market Database, Royal Scientific Society, Amman, p. 76.
- Ministry of Labor, Annual Report, various issues.
- Department of Statistics, Employment and Unemployment Survey for the years (1993-2010).
Table (2.3)
Distribution of the Labor Force by the Educational Level in Jordan (1973-2010)
Secondary certificates and lower!
Diploma Bacholor+higher studies year Labor force
No. % No. % No. % 1973! 332.8 296.2 89.0 15.6 4.7 21.0 6.3 1974 343.9 304.8 88.6 17.2 5.0 21.9 6.4 1975 355.4 313.5 88.2 18.9 5.3 23.0 6.5 1976 367.2 322.2 87.7 20.8 5.7 24.2 6.6 1977 379.5 331.3 87.3 22.9 6.0 25.3 6.7 1978 392.2 340.4 86.8 25.3 6.5 26.5 6.8 1979 405.3 349.7 86.3 27.8 6.8 27.8 6.9 1980 420.0 358.6 85.4 31.0 7.4 30.4 7.2 1981 435.4 367.9 84.5 34.0 7.8 33.5 7.7 1982 451.2 377.1 83.6 37.1 8.2 37.0 8.2 1983 467.7 386.7 82.7 40.4 8.6 40.6 8.7 1984 484.7 396.4 81.8 43.5 9.0 44.8 9.2 1985 502.4 406.5 80.9 47.4 9.4 48.5 9.7 1986 535.4 429.1 80.1 52.3 9.8 54.0 10.1 1987 555.7 438.9 79.0 57.6 10.4 59.2 10.7 1988 572.2 445.7 77.9 62.4 10.9 64.4 11.3 1989 583.5 448.7 76.9 66.5 11.4 68.5 11.7 1990 630.1 478.2 75.9 75.0 11.9 76.9 12.2 1991 646.6 488.1 75.5 80.2 12.4 78.2 12.1 1992 706.0 529.5 75.0 89.6 12.7 86.9 12.3 1993 809.3 602.1 74.4 105.2 13.0 102.0 12.6 1994 948.7 708.7 74.7 124.3 13.1 115.7 12.2 1995 974.6 723.2 74.2 124.8 12.8 126.7 13.0 1996 994.0 730.6 73.5 126.2 12.7 137.2 13.8 1997 1032.7 728.1 70.5 135.3 13.1 169.4 16.4 1998 1126.0 799.5 71.0 148.6 13.2 176.8 15.7 1999 1195.0 841.3 70.4 153.0 12.8 202.0 16.9 2000 1209.4 834.5 69.0 162.1 13.4 213.0 17.6 2001 1175.7 979.3 83.3 97.6 8.1 101.1 8.6 2002 1216.8 1003.9 82.5 101.0 8.3 111.9 9.2 2003 1227.2 1012.4 82.5 99.4 8.1 115.4 9.4 2004 1250.3 1041.5 83.3 91.3 7.3 117.5 9.4 2005 1073.3 870.4 81.1 93.4 8.7 109.5 10.2 2006 1055.8 856.3 81.1 91.9 8.7 107.7 10.2 2007 1140.4 899.8 78.9 95.8 8.4 144.8 12.7 2008 1172.7 925.3 78.9 98.5 8.4 148.9 12.7 2009 1220.5 959.3 78.6 102.5 8.4 158.7 13 2010 1235.9 960.3 77.7 102.6 8.3 173.0 14.0

2.3.3. Employment according to professions
26
boom which motivated Jordanian labor in this category to emigrate (Ibrahim A, 1989, and DOS, 2010).
The emigration of part of the Jordanian labor has also increased this shortage, where the number of
emigrants from the Diploma and Bachelor holders was estimated by 33% from the total Jordanian
emigrants in 1985 (Al-Talafha, 1989).
The category of "workers in the production and the non-classified" still holds the largest proportion of the
total workforce that it has increased from 182.7 in 1973 to 328.4 in 1990 and then to 505.5 thousand
workers in 2010 with an annual growth rate of 2.8% during the period (1973-2010). However, the
proportion of those workers from the total employment decreased in the same years from 54.9% to 52.1%
and then to 48.1%, respectively. It is well known that this category of employment does not require high
academic qualifications; therefore, we can see a reflection of the changes in the sectoral and educational
distribution of the workforce in the labor market on their professional distribution.
This can be confirmed by Table (2.4), where the category of "professionals and technicians" came in second
place and the number of the employees in the three years has increased from 28.0 to 121.6 and then to
290.4 thousands, respectively with an annual growth rate of 6.5% during the study period. This high rate
reflects the extent of development reached by the methods of production and specialization in the labor
market in Jordan. It is worth pointing out that the number of workers in agriculture as a profession has
significantly decreased between 1973 and 2004 from 52.6 thousand workers to 18.5 thousand, respectively
with an annual decline rate of 2.8% during the period (1973-2010).

27
From the above, we can conclude that the professional dynamicity in the labor market was reflected by
the trend towards the professional, administrative, and technical jobs and refraining from the agricultural
work and some service activities, which resulted in the need for foreign labor force to fill vacancies in
these occupations (Al-Talafha and Al-Fahdawi, 1998).

Table (2.4)
Distribution of the labor Force by Major Occupational Groups in Jordan (1973-2010)
(Thousand Workers)
28
Specialists Adminis-rators
Clerks Workers in sales
Workers in services
Workers in agriculture
Workers in production
Year Labor force
No. % No. %
No. %
No. % No. % No. %
No. %
1973 332.8 28.0 8.4 4.2 1.3 19.7 5.9 24.9 7.5 20.6 6.2 52.6 15.8 182.7 54.9 1974 343.9 31.2 9.1 4.6 1.3 20.8 6.1 26.0 7.6 21.3 6.2 51.2 14.9 185.8 54.9 1975 355.4 34.7 9.8 4.9 1.4 21.9 6.2 27.2 7.7 22.1 6.2 49.8 14.0 194.8 54.8 1976 367.2 38.6 10.5 5.4! 1.5 23.0 6.3 28.4 7.7 22.9 6.2 48.8 13.3 200.5 54.6 1977 379.5 42.9 11.3 5.9 1.6 24.2 6.4 29.7 7.8 23.8 6.3 47.1 12.4 205.9 54.3 1978 392.2 47.7 12.2 6.4 1.6 25.5 6.5 31.1 7.9 24.7 6.3 45.8 11.7 211.1 53.8 1979 405.3 54.0 13.3 6.9 1.7 26.8 6.6 32.5 8.0 25.6 6.3 44.6 11.0 215.9 53.3 1980 420.0 55.7 13.3 6.9 1.6 26.8 6.4 34.6 8.2 26.7 6.4 42.2 10.1 227.2 54.1 1981 435.4 58.6 13.5 6.9 1.6 26.8 6.2 36.8 8.5 27.6 6.3 40.0 9.2 238.7 54.8 1982 451.2 61.8 13.7 6.9 1.5 28.9 6.4 38.7 8.6 28.7 6.4 37.8 8.4 248.2 55.0 1983 467.7 64.8 13.9 7.0 1.5 26.9 5.8 41.5 8.9 29.8 6.4 35.8 7.7 261.9 56.0 1984 484.7 68.1 14.1 7.0 1.4 26.9 5.6 44.2 9.1 30.9 6.4 33.9 7.0 273.8 56.5 1985 502.4 72.8 14.5 7.0 1.4 28.6 5.7 45.7 9.1 32.1 6.4 30.7 6.1 285.4 56.8 1986 535.4 80.3 15.0 7.5 1.4 31.3 5.8 48.7 9.1 33.7 6.3 32.1 6.0 302.5 56.5 1987 555.7 89.4 16.1 8.3 1.5 32.8 5.9 48.4 8.7 34.3 6.2 32.2 5.8 312.9 56.3 1988 572.2 95.0 16.6 9.7 1.7 34.3 6.0 49.2 8.6 31.5 5.5 33.8 5.9 318.7 55.7 1989 583.5 98.0 16.8 10.5 1.8 35.6 6.1 50.2 8.6 31.5 5.4 33.3 5.7 324.4 55.6 1990 630.1 121.6 19.3 16.4 2.6 40.9 6.5 56.1 8.9 32.7 5.2 34.0 5.4 328.4 52.1 1991 646.6 147.4 22.8 29.1 4.5 47.8 7.4 - - 56.9 8.8 38.8 6.0 326.6 50.5 1992 706.0 157.4 22.3 29.0 4.1 43.8 6.2 - - 68.5 9.7 40.2 5.7 367.1 52.0 1993 809.3 182.1 22.5 25.9 3.2 44.5 5.5 - - 95.5 11.8 41.3 5.1 420.0 51.9 1994 948.7 195.4 20.6 20.0 2.1 68.3 7.2 - - 119.5 12.6 51.2 5.4 484.8 51.1 1995 974.6 182.3 18.7 13.6 1.4 72.1 7.4 - - 120.9 12.4 61.4 6.3 524.3 53.8 1996 994.0 199.8 20.1 23.9 2.4 81.5 8.2 - - 121.3 12.2 81.5 8.2 487.1 49.0 1997 1032.7 259.2 25.1 27.9 2.7 96.0 9.3 - - 136.3 13.4 62.0 6.0 449.2 43.5 1998 1126.0 280.4 24.9 19.1 1.7 87.8 7.8 - - 158.8 14.1 47.3 4.2 538.2 47.8 1999 1195.0 304.7 25.5 14.3 1.2 99.2 8.3 - - 164.9 13.8 65.7 5.5 547.3 45.8 2000 1209.4 330.2 27.7 10.9 0.9 100.4 8.3 - - 181.4 15.0 40.0 3.3 541.8 44.8 2001 1175.7 328 27.9 7.1 0.6 94.1 8.0 - - 182.2 15.5 29.4 2.5 534.9 45.5 2002 1216.8 355.3 29.2 4.9 0.4 97.3 8.0 - - 188.6 15.5 31.6 2.6 539.0 44.3 2003 227.2 353.4 28.8 3.7 0.3 92.0 7.5 - - 182.9 14.9 28.2 2.3 565.7 46.1 2004 1250.3 360.1 28.8 1.3 0.1 76.3 6.1 - - 181.3 14.5 28.8 2.3 601.4 48.1 2005 1073.3 195.3 18.2 1.1 0.1 70.8 6.6 - - 162.1 15.1 20.4 1.9 623.6 58.1 2006 1055.8 163.6 15.5 1.1 0.1 60.2 5.7 - - 153.1 14.5 19.0 1.8 658.8 62.4 2007 1140.4 250.9 22 1.1 0.1 65.0 5.7 - - 158.5 13.9 18.2 1.6 646.6 56.7 2008 1172.7 256.8 21.9 1.2 0.1 73.9 6.3 - - 161.8 13.8 17.6 1.5 661.4 56.4 2009 1220.5 261.2 21.4 2.4 0.2 75.7 6.2 - - 181.9 14.9 19.5 1.6 679.8 55.7 2010 1235.9 290.4 23.5 6.2 0.5 76.6 6.2 - - 338.6 27.4 18.5 1.5 505.5 40.9
Source:
- Issa Ibrahim and others (1989), the Study of the Reality and Future of the Jordanian Labor Market, part III, the Jordanian Labor
Market Database, Royal Scientific Society, Amman, p. 76.
- Ministry of Labor, Annual Report, various issues.
- Department of Statistics, Employment and Unemployment Survey for the years (1993-2010).

29
From the above, we can conclude that the professional dynamicity in the labor market was reflected by
the trend towards the professional, administrative, and technical jobs and refraining from the agricultural
work and some service activities, which resulted in the need for foreign labor force to fill vacancies in
these occupations (Al-Talafha and Al-Fahdawi, 1998).

Chapter Three
The Informal Employment in theJordanian Labor Market
31
We reviewed in chapter one the concept of the informal sector and how to measure its size in the national
economy. Additionally, we demonstrated the benefits of informality, its costs, and the methodology which
this study will use to measure informal sector in Jordan. While the second chapter introduced labor market
developments in Jordan concerning characteristics, market imbalances, participation rates, and structural
changes.
In this chapter we will try to measure the size of the informal sector in the Jordanian economy, and the
extent of its presence in the economic sectors as well as its distribution by sex, rural and urban areas, age
groups, educational level, and employment status. Measurement will cover two levels; labor market as
whole and the private sector. Measurement will depend on the results of the survey on "Following-up the
Jordanian labor market 2010" which was conducted by the Department of Statistics in Jordan in 2010 in
collaboration with the Economic Research Forum in Egypt and the National Center for Human Resources
Development. The survey sample constituted of 5760 households representing all the governorates of
the Kingdom. The sample was based on the framework provided by the General Census of Population
and Housing 2004.
The main aim of that survey was to provide data about workers conditions in the Jordanian labor market
the size of the labor force and the economically active population. Additionally, it provided detailed data
on the labor force such as age, gender place of residence, educational status, marital status, employment
status, economic activity, occupation, employment sector, unemployment …etc.
Measuring the size of informal sector in the Jordanian economy will rely on the outputs and results of the
previous survey, which provided a detailed and appropriate database to estimate the size and character-
istics of the informal sector in Jordan more than any other survey or study.
The survey also aimed at studying the characteristics of the Jordanian labor market during the past 25
years; the focus of this survey is on the labor market entrants and follow-up on their professional develo-
pment over time. The tracking survey is characterized by its ability to monitor the informal employment,
which is known as "those working without contract or social security, those working for their private
account and workers for households without pay." The survey results indicate that the Jordanian labor
3.1 Introduction

3.2 The distribution of informal employment
3.2.1 The percentage distribution by sex
32
market suffers from structural imbalances where the economic growth does not lead to a reduction in
unemployment rates despite the fact that high growth rates were achieved during the past decade, the
unemployment rates remained relatively stable in addition to the fact that the drop in the economic
growth led to increasing the proportion of informal employment.
From the survey, employment in Jordan was classified into five groups, represented by the following:
1. Employment in the public sector
2. Formal employment in the private sector (those working with payment, and those who have a contract
or a social security). The formal employment in the private sector is divided into permanent and
temporary contracts.
3. Informal employment in the private sector (those working without a contract or social security)
4. Those working for their private account
5. Working for households without pay.
The informal employment in the private sector represented (26%) of total workers in 2010, in contrast
with (22%) of the formal employment in the private sector. About (34%) of the workers in the public
sector as well as (17%) of those working for their own account and (1%) workers in households without
pay.
It is noted from the results of the survey that males are "workers in the public" (32%), (28%) informal
workers in the private sector, (20%) formal workers in the private sector constituted, (19%) workers for
their own accounts, and (1%) workers in households without pay. But concerning females, the above
mentioned percentages came to (44%), (17%), (30%), (7%) and (3%) respectively. The same ratio concerning
total labor force were (34%), (26%), (22%), (17%) and (1%) respectively.
Here, we conclude that the share of employment out of total employment is represented by "informal labor
in the private sector" and "workers in households without pay", and in this regard, the informal employment
represents (44%) of the total employment in the Jordanian Economy.

33
The survey analysis reported a high proportion of informal employment in the private sector for each of
the workers in the crafts, services and sales and machinery operators whose proportions were (30%),
(24%), (14%) of the total employment, respectively. While the percentage of workers in the elementary
occupations was (9%) of the informal employment in the private sector, followed by the specialists (7%),
technicians (5%) and clerks (5%) while the percentage of skilled workers in agriculture was (3%).
On the other hand, it is noted that the percentage of the informal labor in the private sector in the
supreme administrative jobs represented (0.4%) of the total informal employment in the private sector.
3.2.2 The percentage distribution of informal employment in the private sector byoccupation

3.2.3 The percentage distribution of informal employment in the private sector byeconomic sector
34
The results of the survey brought out that (30%) of informal employment in the private sector is
concentrated in the wholesale and retail trade and repair of engines and motorcycles, (18.6%) in
manufacturing, (11.7%) in transportation and storage, and (11.1%) in construction.
Additionally, the proportion of informal employment in the supply of electricity, gas, steam, and air
conditioning, the supply of water and sewerage and waste management and the activities of arts,
entertainment and recreation is low where the employment in these sectors was (0.1%), (0.2%) and (0.3%),
respectively.
With respect to the classification of informal employment in the private sector by gender, (32.4%) of males
work in wholesale, retail trade and repair of motor vehicles and motorcycles and (19.4%) work in manuf-
acturing. As for females, informal employment is concentrated in the activities of human health and social
services by (17%), followed by agriculture, forestry and fishing, and education by (16.4%) and (16.1%),
respectively.

35

3.2.4 The distribution of wage earner workers by the level of education andeconomic sector
36
The data extracted from the survey showed that (39%) of wage earner workers in 2010 are holders only
less than secondary in the public sector while there was (30%) of those holding the bachelor's degree or
higher degrees out of the total wage earner workers.
As for the distribution of wage earner workers in the private sector, the wage earners workers in the formal
private sector holding a degree less than the Secondary Certificate and Bachelor degree or higher
constituted (35%) and (33%) compared to (71%) and (9%) respectively for the wage earner workers in the
informal sector.(with higher degrees).
Whereas the percentage of own-account workers holding only less than secondary were (56%) compared
with (13%) of those holding the bachelor degree or higher degrees. While the percentage of unpaid
workers holding less than Secondary Certificate and bachelor degree or higher degrees were (63 %) and
(20%) respectively.

37
The survey showed that the increase in wages tend to favor wage earner workers in the formal private
sector, where the average monthly wage for workers in the formal private sector was (388) JDs in 2010,
compared with the average monthly wage of (315 JDs) and (269 JDs) for workers in the public sector and
workers in the informal private sector, respectively, during the same year.
3.2.5 The distribution of wage earner workers by sector and monthly wage

3.2.6 The distribution of wage earner workers by sector, level of education and theaverage monthly wage
38
The results indicated a significant increase in the average monthly wage for wage earner workers holding
'BA and higher degrees in the formal and informal private sector compared with an average monthly wage
for the same educational level of wage earner workers in the public sector; workers in the private sector
receive (575 JDs) followed by the workers in the informal private sector (468 JDs), while the average
monthly wage received by the workers in the public sector was (398 JDs) in 2010.
The results also indicated, as expected, that the wage earner workers holding less than secondary degrees
receive low average monthly wage in both public and private sectors; the average monthly wage for
workers in the public sector who have lower degrees than the secondary level receive (262 JDs) and
workers in the formal private sector receive (267 JDs) compared with workers in the informal private
sector who receive (218 JDS).
The survey indicated that (45%) of wage earner workers in the private sector represent formal employment;
(31%) of them were permanent workers, while informal workers represented (55%) of the total number of
wage earner workers in the firms of the private sector.
The informal workers constituted (92%) of wage earner workers in the private sector firms which employ
less than 5 workers and about (68%) in the firms which employ (5-9 workers), while there were only (10%)
of the firms employ 100 workers or more.
3.3 The characteristics of wage earner workers in the private sector
3.3.1 The distribution of wage earner workers in the private sector by the size ofthe institution

39
The data of the survey showed that (36%) of wage earner workers in the private sector have an access
to a fully paid leave compared with (44%) who do not get any kind of paid leaves. Additionally, about
(72%) of wage earner workers in the private sector occupies formal permanent jobs and can get a paid
leave against (77%) of informal workers who haven't access to any kind of leaves.
3.3.2 The distribution of wage earner workers in the private sector by type of leaveand type of work

40
3.3.3 Non-Jordanian workers in the private sector
Non-Jordanian labor constituted about (16%) of the wage earner workers in the private sector at which
this labor shared in (25%) of the total employment in the informal sector. It should be noted that most of
the foreign workers in the informal sector are concentrated in micro and small enterprises taking into
consideration that the sample of this survey does not represent non-Jordanians because it is built on the
basis of households living in traditional dwellings, so the coverage of the households of non-Jordanians
is incomplete and therefore, the data about them is only indicative.

41
In 2010, the number of workers in the informal sector in the Jordanian labor market was (487,861)
compared with (744,724) workers in the formal sector. Consequently, the informal employment constituted
44% of the total employment in the Jordanian Economy.
3.3 The size of informal sector

42
Table 3.1
The Distribution of Employment (Formal, Informal and Total) by Occupation 2010

43
Table 3.2
The Distribution of Employment (Formal, Informal and Total)
by Economic Activity 2010

44
Table 3.1
The Distribution of Employment (Formal, Informal and Total) by Occupation 2010
It is obvious from table 3.1 that more than 72% of the employment in the informal sector concentrated
mainly in three occupations; "workers in services and sales" (28.1%), "workers in crafts" (26.4%) and
"machine operators" (17.7%). The "legislators, supreme administration employees and directors" category
became in the last instance and employed only (1.1%).
In contrast to the formal sector, at which the "specialist" become first and this category employed (28.5%),
then "workers in services and sales" (25.3%), and then "clerks" (13.1%), while "skilled workers in agriculture"
came last (0.30%). Here one can conclude that "workers in services and sales" category employ a significant
portion of the total employment (formal and informal) (26.4%), however other occupation showed disparity
in the ratios of the employment between formal and informal employments.
The same table shows that the informal sector employs (92.3%) of the total employment in the "skilled
workers in agriculture" category, (68.1%) of the total employment of "workers in craft", and (63.6%) of the
total employment of "machine operators". The ratio of "specialists" employed the lowest ratio in the
informal sector (14.1%).

45
Concerning the percentage distribution of informal sector by economic activity, the activity of "wholesale,
retail trade, repair of motor vehicles and motorcycles" employed (32.2%) of the total informal labor, followed
by the "transport and storage" (14.8%) and then by the "manufacturing" (14.7%). On the other hand, in the
formal sector, the "public administration, civil defense and social security" employed (40.0%) of the total
formal labor, while the "education" activity came second (19.9%), and then the "manufacturing" activity"
(10.3%) in which this activity stands as a common employer for both formal and informal labor.
With respect to the participation of the informal labor in the total employment in economic activities, the
activity of "agriculture, forestry and fishing" employed high ratio (93.3%) as well as " wholesale, retail trade,
repair of motor vehicles and motorcycles" (85.6%) and the "real estate activities" (74.3%). The activity of
"public administration, civil defense and social security" came in the last (0.40%). This result is ultimately
reasonable since this sector represents an important part of the public sector which subject to different
pension systems and the social security system.
It is rather important to mention here that females constituted only (11.0%) of the informal labor in 2010,
while female participation in formal employment was (22.7%) and (22.0%) in the labor market as whole.

Chapter Four
Model Specification, Research Methodand Empirical Results
47
In this chapter we will measure the size of the informal economy using the currency demand approach
Cagan, (1958), Guttman (1977), Tanzi, (1999), and Faal, (2003). The specification of the model and the
method will be presented before explaining the results.
The key assumptions of the currency demand approach are maintained as follows:
1. Informal economic activity uses currency to conclude transactions.
2. Informal income velocity of money is the same as in the formal economy.
Multiple regression analysis will be used to econometrically estimate a currency demand function
in order to estimate the size of the informal economy. Within the broad framework of the general
functional form, alternative variables and proxies were used during trial estimations. Only the
estimations using log-log are given in the study as they proved to be the most robust.
The model, which can be used to estimate the size of the informal economy, can be specified as
follows:
Y=F(X1,X2,µ) ……….(1)
Where Y, the dependent variable, may represent the ratio of currency in circulation outside the
banks to demand deposits, narrowly defined money supply or broadly defined money supply.
X1 is the set of traditional independent variables considered to be the major determinants of Y. X2
are the proxy variables that stimulate informal economic activity, while µ refers to the error term.
When the variables that stimulate the informal economy are assigned their lowest historical value,
the regression equation yields an estimate of the demand for currency of the formal economy.
When the variables that stimulate the informal economy are assigned their highest historical values
the regression equation yields an estimate of the demand for currency of both the formal and
informal economies combined. The difference, then, between the two estimates provides an estimate
of the currency held in the informal economy. When multiplied by the income velocity of money,
an indication of the size of the informal economy can be derived.
The demand for currency equation for Jordan for the period 1976-2010 is initially specified as:
4.1 Model Specification

48
In(NCM)= β0 + β1 In(GR) + β2 In(WS) + β3 In(R) + β4In(YN) + β5In(G)+ µ …..(2)
Where;
Ln: the natural log
NCM: the ratio of notes and coins holdings to broad money supply.
GR: the ratio of government revenue to GDP.
WS: the proportion of final consumption expenditure in national income ( to capture changing
payment and money holding patterns ).
R: the nominal interest (to capture the opportunity cost of holding cash).
YN: the real per capita income, i.e. Nominal income deflated by the GDP deflator.
G: general government index (to capture government intervention).
µ: the error term.
Economic theory has shown, there are a number of different factors that might influence the ratio of
cash holdings. To account for these factors the model introduces a number of variables such as:
the proportion of final consumption expenditure in national income ( to capture changing payment
and money holding patterns ), the nominal interest paid (to capture the opportunity cost of holding
cash), the general government index ( to capture government intervention).
Under the assumption that the informal economy uses currency to conclude transactions and that
income velocity of money in the informal economy is the same as it is in the formal economy, the
velocity of money was obtained by dividing official GDP by nominal money, narrowly defined for
the formal economy as M1 (i.e. equal to the sum of the estimated nominal formal currency and
the actual demand deposits present in the economy).
The velocity of money can be defined formally as the ratio of income to the quantity of money:
��=���� or ��=������ ……….(3)
Where;
Y represent real GDP, C is the sum of currency, and M is a narrow definition of money .

49
Before the results of the multiple regressions are used to estimate the currency demand function,
each variable in the time series is tested for the underlying assumption of stationarity.
The results of the analysis are then used to report on the overall strength of the relationship between the
dependent and independent variables, as well as the results of the overall significance tests. The t-test is
performed to determine the significance variables (at 5% level of significance) and confirm the expected
signs for the coefficients on the variables. To measure the goodness of the fit of the regression equation
(i.e. the proportion of the total variation in the dependent variable explained by the explanatory variables),
the adjusted R2 is used. The problem with the measure is that the “goodness of fit” improves as more and
more variables are included in the model. Besides the adjusted R2, Akaik’s information Criterion (AIC) is
used to offer guidance on the selection of the numbers of terms in the equation. Ideally, the AIC should
be as small as possible to select the most appropriate model.
4.2 Method
Following the currency demand approached, as presented in equation (2), the size of the informal
economy for the period 1976-2010 estimated through this equation.
Table number 4.1 presents the results of equation (2). The table shows that the estimated coefficients for
the regression model were all statistically significant at 5% level of significance (except for R), with
t-statistics value. The overall regression fit, as measured by the adjusted R2 value, indicates that 94% of
the variation in currency demand is explained by the independent variables. The overall F-statistics shows
a value of (117) indicating that the model is significant at 1% level. The Durbin-Watson statistics of (1.8)
shows that the equation is free of serial correlation.
4.3 Empirical Results

Table 4.1
OLS Estimation Results of the Size of the Informal
Economy in Jordan 1976-2010
ln(CM)t= 2.172+ 0.521ln (GR)t – 0.628 ln(PC)t+ 0.086 ln(R)t - 0.389 ln (PCI)t – 0.379 ln (G)t+ μt
50
Using the regression output from table (4.1), the size of the informal economy was estimated for Jordan
using the detailed method mentioned before. The informal economy nominal GDP (GDPI), the nominal
GDP (GDP), the ratio of informal economy nominal GDP to nominal GDP (GDPI/GDP) and the nominal
growth rates for GDPI are calculated and presented in table (4.2).
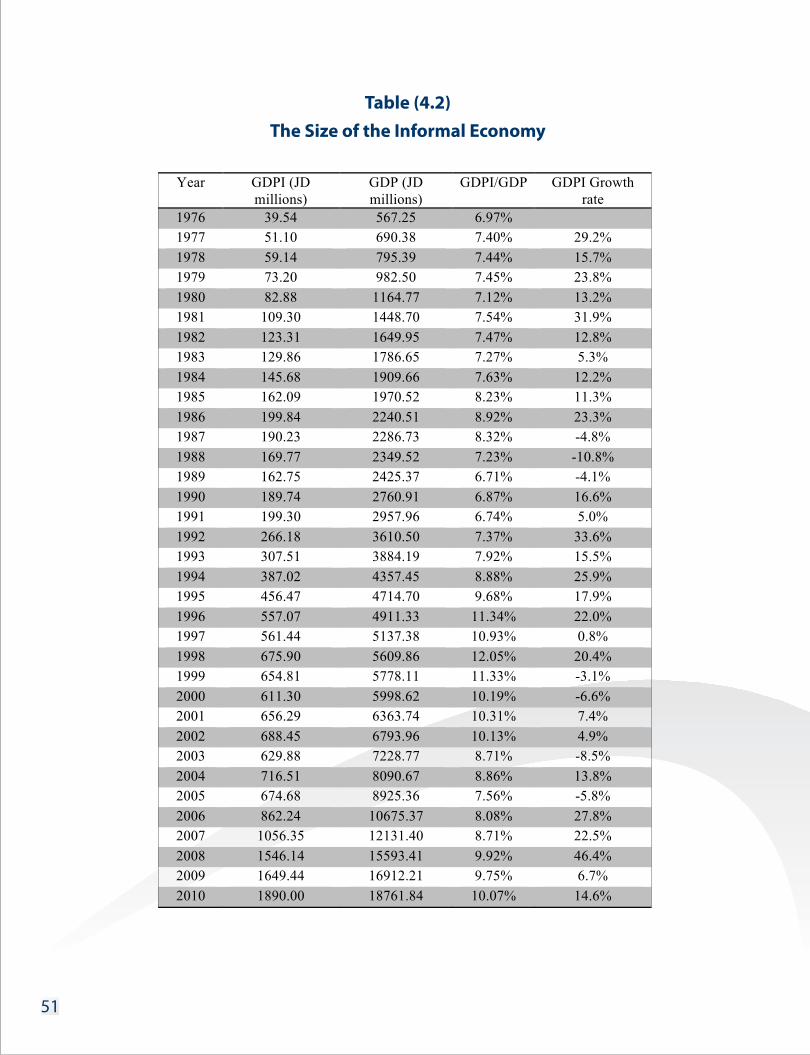
Table (4.2)
The Size of the Informal Economy
51

52
The table above shows the informal economy out of the nominal GDP had reached 10.07% in the year
2010. The highest rate of the informal economy in 1998 was 12.05%. The average estimation of the
informal economy in the study period 1976-2010 was 8.6%. In the past ten years, the average size of the
informal economy was around 9%. From the table above we can notice that in the years that the economy
had witnessed high economic growth rate, the informal sector expanded because of the effect of that
growth rate, this can be shown specifically in the period 2006-2008 as the economic growth on average
was around 7% and the growth rate of the informal economy was 27.8%, 22.5%, 46.4% respectively. We
also notice that the years that came after the economic shocks, the Gulf Wars and influx of refugees had
an increase in the rates of the informal sector, whereby in 1990 the informal economy was around 6.87%
where it grew of around 16% from the previous year.
The empirical evidence suggests that the informal economy needs to be explicitly taken into account when
any macroeconomic policy is formulated. There are number of reasons for this:
1. Empirical findings show that the informal economy is currently estimated at about 10% of GDP, which
suggests that the size is sufficient to be given importance within the macroeconomic framework.
2. An informal economy that contributes to the overall economy can produce economic benefits for
society by creating employment opportunities.
3. The informal economy can be managed through applicable government economic policies.
The empirical contribution of the study led to a new understanding of the informal economy’s role in the
macro economy. One important issue, for example, is whether the informal economy is simply a survival
strategy of the poor, or if it can have an active role in promoting economic growth. Although informal
employment is deemed better than unemployment, the informal economy should not be seen as the
solution to the poor performance of the formal economy. All things considered, then, the informal
economy should be of paramount importance in national policy formation.

53
The study of the informal sector suffers from the absence of registration of individual firms in the official
records, such as: real estate registry, the records of industry, work permits, etc., and therefore extracting
data for this sector is very difficult, especially since firms of the informal sector are characterized by
small size of employment and investments, and mostly depend on labor intensive activities.
There are problems associated with this sector, among of which: tax evasion, which in turn grants the
firms of this sector a comparative advantage in the cost of production compared to firms in the formal
sector, which are subject to taxes and other fees and therefore incurred addition costs. Consequently,
it is important to transform the informal sector to the formal sector, as this will increase the financial
resources of the government, and give establishments in the National Economy many advantages,
such as: the protection of intellectual property rights, to take advantage of the various services provided
by the government, particularly the infrastructure, in addition to that, the transition to the formal sector
will make the firms eligible for credit facilities to finance the their investments.
Here an important question arises; how does the Government convince producers and employers in
the informal sector to enter into the formal sector, or how to prevent the escape of producers and
employers in the formal sector to work in accordance with the rules of the informal sector?
1. Simplification of procedures for the launch of economic projects including the establishment of one
reference body that deals with new investors. In addition, transparency in procedures and policies should
be reinforced through announcing them by media.
2. It important to reduce the start-up costs and licensing fees, and to impose one-time fees, which
investors should pay, commensurate with the nature of the activity and its size (micro or small).
3. Simplification of the tax measures creates confidence between producers and the government,
including the granting of tax exemptions, especially for small projects.
4. Expand the scope of social security for individual, which was applied by the Social Security Corporation
in some governorates, to cover individuals in the rest governorates of the Kingdom.
4.4 Recommendations and policy implication

References
54
- Abu Jaber, Kamel (1991), The Labor Market in Jordan: Development, Characteristics, Policies and Future,
Dar Al-Bashir, Amman.
- Al-Talafha and Al-Fahdawi, (1998), an Analytical Study of Unemployment in the Jordanian Economy
( 1968-1996), Yarmouk University, Irbid-Jordan.Talafha, Hussain, (1989), "The Role of Guest Workers in the
Economy of Jordan", Abhath Al-Yarmouk-Humanities and Social Sciences Series, Vol.5, No.1, Irbid-Jordan,
P67-92.
- Talafha, Hussain, (1993), "The Supply of Labor and the Labor Force Participation Rate in Jordan", Abhath
Al-Yarmouk, Humanities and Social Sciences Series, Vol.9, No.4, Irbid-Jordan, P271-307.
- Ameerah, Mohamad (1991), Labor Market and Unemployment in Jordan (In: The Structure of Man Power
in the Jordanian Labor Market: Nabeel Khouri and Ahmed Qasem, Royal Scientific Society and
International Labor Organization, First edition, Amman.
- Athamneh, Abdel Baset (2011), Gender and Migration in and from Jordan, Carim Analytic and Synthetic
Notes 2011/22, European University Institute, Florence, Italy.
- Cagan, P. (1958). The Demand for Currency Relative to the Total Money Supply. The Journal of Political
Economy, 66 (4): 303-328.
- Chen, M. A., Jhabvala, R., & Lund, F. (2001). Supporting Works in the Informal Economy: A Policy
Framework, International Labor Office Task Force on the Informal Economy : 1-61.
- Department of Statistics, Employment and Unemployment Survey for the years (1993-2010), Amman.
- Faal, E. (2003). Currency Demand, The Underground Economy, and Tax Evasion: The Case of Guyana.
International Monetary Fund Working Paper, 3 (7) : 1-31.
- Guttman, P. (1977). The Subterranean Economy. Financial Analysts Journal, 34 (1) : 24-27.
- Hartzenberg, G. M. & Leimann A. (1992). The Informal Economy and its Growth Potential. In Economic
Growth in South Africa. Edited by Abedian, A. Oxford: Oxford University Press: 187-214.
- International Labour Organization (1993). Resolution Concerning Statistics of Employment in the
Informal Sector. 15th International Conference of Labour Statisticians. Geneva, International Labour
Organization.
- Issa Ibrahim and others (1989), the Study of the Reality and Future of the Jordanian Labor Market,
part III, the Jordanian Labor Market Database, Royal Scientific Society, Amman.

55
- Ministry of Labor, Annual Report, for the years (1990-2010), Amman.
- Khasawneh, Saleh (1986), "The Development and Organization of the Jordanian Labor Market", Journal
of Labor (Jordan), Vol.9, No.33, Amman.
- Omari, Mokhullud 2002, The Absorption Capacity of Labor in Jordanian Economy: An Econometric
Study (1968-2000), Unpublished MA Thesis, Department of Economics, Yarmouk University, Irbid-Jordan.
- Prinsloo, J. W. (1999). South Africa’s National Accounts: An Overview of Sources and Methods. South
African Reserve Bank Bulletin, June 1999: 1-60.
- Schneider, F. (1986). Estimating the Size of the Danish Shadow Economy Using the Currency Demand
Approach: An Attempt. The Scandinavian Journal of Economics, 88 (4) : 193-212.
- Schneider, F. (2002).The Size and Development of the Shadow Economy and Shadow Economy Labour
Force of 22 Transition and 21 OECD Countries. Invited Paper Prepared for the Round Table Conference
held in Sofia, Bulgaria. April 18-20, 2002.
- Schneider, F. & Enste, D. (2003). The Shadow Economy: An International Survey. Cambridge: Cambridge
University Press.
- Smith, P. (1994). Assessing the size of the Underground Economy: The Canadian Statistical Perspectives.
Canadian Economic Observer, 3 (11-010): 16-33.
- Tanzi, V. (1999). The Underground Economy in the United states: Annual Estimates, 1930-1980.
International Monetary Fund Staff Papers, 30 (2): 283-305.
- Thomas, J. (1999). Quantifying the Black Economy: ‘Measurement without Theory’ Yet again?
The Economic Journal, 109 (456): 381-390.
- http://data.worldbank.org/indicator/SL.TLF.CACT.ZS).

