the initial public offering of the industrial and...
TRANSCRIPT

The Initial Public Offering of the Industrial and Commercial Bank of China (ICBC)*
Franklin Allen The Wharton School
University of Pennsylvania [email protected]
Darien Huang The Wharton School
University of Pennsylvania [email protected]
Jun "QJ" Qian
Carroll School of Management Boston College [email protected]
Mengxin Zhao
School of Business University of Alberta
Current Draft: November 27, 2011
* We are very grateful to Wendy Chan, Ying Liu, and Yan Tong for excellent research assistance. We also thank participants in our session at the IEA Meetings In Beijing in July 2011 for their comments.

1
Summary
The conventional wisdom up until the crisis was that efficient financial systems required privately owned banks and financial institutions. The events since 2007 have shown that financial systems such as China’s, where banks are government owned but are also publicly listed can have a significant advantages in terms of financial stability. In this paper we investigate the initial public offering (IPO) of the Industrial and Commercial Bank of China (ICBC). At the time it took place, the ICBC IPO was the largest ever. The firm was the first to be listed simultaneously in Hong Kong and Shanghai. This paper gives the background of the industry at the time, considers the way the IPO was conducted and provides a valuation. The IPO provides an interesting example of how the Chinese government has improved the governance of its financial institutions, while at the same time maintaining a majority ownership position in the company.
JEL Classifications: O5, K0, G2.
Keywords: banks, IPO, non-performing loans, markets, ICBC.

2
1. Introduction
The conventional wisdom before the financial crisis that started in 2007 suggested a link
between financial openness and economic growth. Papers by Bekaert, Harvey and Lundblad (2005)
Bekaert, Harvey, Lundblad and Siegel (2007) and Quinn and Toyoda (2008) have shown that
financial liberalization promotes economic growth. Bekaert, Harvey and Lundblad (2011) provides
additional evidence that financial openness improves the growth of factor productivity. They
attribute these liberalization effects to the role of financial openness in stock market and banking
sector development, and to changes in the quality of institutions.
In a study that focuses on the growth experience in China, Bekaert, Harvey and Lundblad
(2007) do not find a link between China's economic growth and foreign trade and foreign direct
investment. They identify a more efficient financial sector, less state ownership, higher quality of
government institutions and full financial openness as important factors that may promote further
growth of China's economy.
The experience of the financial crisis suggests that Chinese banks with their mixture of
government and private ownership may have significant advantages. At the height of the crisis the
three largest banks by market capitalization in the world were all Chinese. The banks did not suffer
from financial stability problems and this helped China to come through the crisis well, at least so
far. In this paper, we focus on the IPO of the largest bank in China, Industrial and Commercial
Bank of China (ICBC), to examine how China takes steps in liberalizing their financial sector by
taking a state-owned bank public and combining government and private ownership. The IPO of
ICBC was the largest bank IPO in history at the time of its IPO. ICBC is also the largest bank by
market capitalization in China and globally (see Table 1). It provides a good example of how a
state-owned bank in an emerging market goes through the privatization process. We provide
detailed analyses on how government takes active measures to clean up the troubled assets, improve

3
the bank's capital performance, and effectively prepare a smooth transition from a totally
government owned bank to a partially government owned bank. This process has been an initial
success for China's government in their efforts to further open up their financial markets, develop
their bank sector to meet international standards, and move financial institutions to function in a
market-oriented manner.
The paper starts by providing information on China's banking sector (Section 2),
information on ICBC (Section 3), its efforts to become a global bank (Section 4), its IPO process
and valuation (Section 5), and finishes with a discussion of the IPO and the conclusions that can be
drawn (Section 6).
2. China’s Banking Sector1
2.1 Overview
China’s banking sector has been through several stages of development and reforms.
Between 1949 and 1979, China’s entire financial system consisted of one bank, the PBOC, which
was a single bank that managed all deposit-taking, lending and payment system functions of the
state planning system. In 1979, as part of the reform towards a more modern banking system,
PBOC’s international trade financing and foreign exchange businesses were spun off to the Bank of
China (BOC), the agriculture and fixed investment & construction functions were allocated to the
Agricultural Bank of China (ABC) and the China Construction Bank (CCB) respectively. In 1984,
the PBOC became the central bank after its savings and loan functions were transferred to ICBC.
By the early 1990s, the top-tier structure of the Chinese banking system was formed, with the Big
Four banks, 9 joint-stock commercial banks, and numerous cooperatives and finance companies. All
of the non-bank financial institutions can be classified into one or more of the following: trust and
1 For a review of China’s financial system (banking sector, financial markets and beyond), see Allen, Qian, Qian, and Zhao (2009).

4
investment companies (TICs), finance companies, financial leasing companies, rural credit
cooperatives and urban credit cooperatives.
China’s banking system had been under strict government control including setting interest
rates, lending targets and lending decisions until the early 1990s. In 1993 and 1994, with the
establishment of the three policy banks (the State Development Bank of China, the Export-Import
Bank of China and the Agricultural Development Bank of China), the largest four specialized banks
became the Big Four state-owned commercial banks.
The dominance of the Big Four banks also implies that the degree of competition within the
banking sector has been low. For example, Demirgüç-Kunt and Levine (2001) compare the five-
bank concentration (share of the assets of the five largest banks in total banking assets), and find
that China’s concentration ratio of 91% at the end of 1997 (and for much of 1990s) is one of the
highest in the world. However, China’s concentration ratio has been falling sharply since 1997 with
the entrance of many non-state banks and intermediaries. There are more than 30,000 banks and
non-bank financial institutions operating as legal entities in China, although the Big Four banks still
control more than half of the total banking assets.
The most significant problem for China’s banking sector, and for the entire financial system
in recent years, has been the amount of NPLs within state-owned banks, and in particular, among
the Big Four banks. Reducing the amount of NPLs to normal levels was the most important task for
China’s financial system in the short term. Since the late 1990s, the central government has been
taking actions to improve the banking industry’s asset quality, risk management and capital base, to
ensure that state-owned banks will eventually be transformed into modern (limited liability)
corporations listed in global capital markets and complying with international standards. Thus, it
was important to reduce the level of NPLs to improve the banks’ capital adequacy.

5
In 1998, the Ministry of Finance issued RMB270 billion in bonds to enhance the capital
adequacy of the Big Four banks. In 1999, four asset management corporations (AMCs: Huarong,
Great Wall, Xinda, and Oriental) were established to assume RMB1.4 trillion worth of NPLs from
the Big Four. Despite these and other efforts, at the end of 2001 the total amount of NPLs within the
Big Four was estimated to be at the level of around RMB1.7 trillion; among the four banks, only the
Bank of China, which has the lowest level of exposure to bad loans, could meet the 8% capital
adequacy ratio imposed by the Basle Accord.
Recognizing the importance of and its responsibility in reducing NPLs in the Big Four
banks, the Chinese government injected foreign currency reserves (mostly in the form of US
dollars, T-bills, Euros and Yen) into these banks to improve their balance sheets in preparation for
going public. This process began at the end of 2003, with the establishment of the Central Huijin
Investment Company, through which the PBOC injected US$45 billion of reserves into the BOC
and PCBC, while ICBC (the largest commercial bank in China and one of the largest in the world in
terms of assets) received US$15 billion during the first half of 2005 (e.g., Financial Times,
01/09/2004, 04/21/2005; Asia Wall Street Journal, 01/13/2004). All three banks have since become
publicly listed and traded in either the HKSE and/or the SHSE. Given that China’s total foreign
exchange reserve reached US$1.68 trillion as of March 2008, the largest in the world, while the
total amount of NPLs was around US$160 billion at the end of 2007, the foreign exchange reserves
were more than enough to remove all the existing NPLs off the books of all the banks in China.
Table 2 shows the size of the NPLs among China, U.S., Japan, Korean, India, Indonesia and Taiwan
between 1997 and 2006.
The Big Four account for about 60% and 50% of the total deposits and total loans,
respectively, of banking institutions. Among the Big Four, ICBC is the largest bank by total assets,

6
total deposits, and total loans. In each of the three categories, ICBC captures about 30% of the total
market amount.
2.2 Banking Industry Trends and Challenges
The banking industry, along with financial markets in China, has been undergoing
significant reforms for some time. The government is expected to continue to strengthen regulation
and further liberalize the markets (e.g., entry of new financial institutions and setting of interest
rates), while commercial banks are expected to enhance corporate governance that is in line with
international best practices and improve risk management – with the focus on improving capital
adequacy, asset quality, liquidity, operational efficiency and profitability. Banks are also expected
to improve credit approval procedures and other lending practices, attract more foreign investment,
expand businesses into insurance and asset/fund management, and promote further growth of fee-
and commission-based products and services.
As mentioned earlier, NPLs within the banking sector were significantly reduced in the
years leading up to the IPO following the sequence of restructuring and recapitalization effects,
including directly injecting capital into and transferring the NPLs out of the banks’ balance sheets.
However, many feared that the injection plan might create perverse incentives for state-owned
banks, because these banks will believe that there would be a “bailout” whenever they run into
financial problems again, leading to a lack of incentive to improve efficiency. Many argued that in
spite of the reduction, NPLs would remain a potential problem as the then current NPL ratio (total
non-performing loans/total outstanding loans) was still substantially higher than the 2% ratio of
leading banks around the world. Indeed, more than half of the reduction of NPLs from 2001-2005
was done through the transfer to state-owned asset management companies. The problem was that
only 20% of the face value of these loans was expected to be recovered and the government would
still need to provide more capital. Another reason for the reduction in NPL ratio was the increases

7
in loans during these years. Due to the lack of consistent standards and transparency, some
conjectured that the size of NPLs might be underestimated.
Bank earnings are significantly exposed to business cycles, since they rely heavily on
corporate banking and relatively large property-related loans. The fear was that the strong growth
and high liquidity in the financial system would lead to increased property prices. However, if the
real estate market was brewing another bubble, the bursting of the bubble could lead to earnings and
asset quality deterioration for banks with large exposure to this sector. This problem can be more
severe for banks that have a large proportion of mortgage loans on their balance sheets. Many banks
had grown their investment businesses and many of them diversified their investments into other
currencies. This could have led to new market and credit risks. Another key challenge for Chinese
banks was earnings growth and diversification – the banks could broaden their lines of businesses to
include a larger set of consumer products such as credit cards and personal loans. By reducing
overall credit concentrations, the banks could enhance their capacity and might generate higher fees
and commissions.
Foreign competition was another imminent challenge faced by Chinese banks. China joined
the World Trade Organization (WTO) on December 11th, 2001. Historically, the banking industry in
China was protected from foreign competition by the government. Foreign banks were not allowed
to do local currency business with Chinese Clients. There were also severe geographical restrictions
on establishment of foreign banks. However, as the part of the WTO entry agreement, foreign banks
were to see all geographic and customer restrictions on their local currency businesses removed by
December, 2006. Moreover, China was scheduled to eliminate any nonprudential measures that
restricted the ownership, operation, and operational form of foreign banks. The combined phase-in
of these commitments was to mark the full opening of China's banking sector to foreign companies.
Running at the then low efficiency compared with their foreign competitors, Chinese banks needed

8
to improve their business significantly in order to compete with foreign banks on their home turf as
well as in world market.
A further challenge was the lack of transparency in the banking industry. Though risk-based
capital rules had been used for many years, it was still unclear as to how these standards were
consistently applied to all banking sectors equally and whether they were consistent across the
banking system. Chinese listed banks were required to adopt international financial reporting
standards (IFRS) by the start of 2007. The transition of local accounting standards towards IFRS
helped strengthen accounting standards and attract public and international investors by their use of
comparable financial statements.
2.3 Regulations
Chinese banks are jointly regulated by the central bank, the PBOC, and the China Banking
Regulatory Commission (CBRC). The publicly listed banks are also subject to the supervision of
the China Securities Regulatory Commission (CSRC). The Ministry of Finance (MOF) determines
tax and local accounting rules for the banks.
Historically the setting of interest rates on loans and deposits was tightly controlled by the
government. China liberalized lending rates on the upside. Interest rates on deposits have not been
liberalized yet unless the depositor has a dollar deposit account above $3million (RMB deposits
have fixed rates regardless of the amount of the deposits).
Since the Asian financial crisis in 1997, one of the top priorities of the CBRC was to
monitor the health of the banking system through the capital adequacy ratio (CAR) of commercial
banks which should be no lower than 8% in line with the Basel I Accord. With the accession to the
WTO, the CBRC committed to remove all non-prudential restrictions on foreign banks and provide
the environment for the opening up of the Chinese market to foreign banks by the end of 2006.

9
The CBRC also provided guidelines on the corporate governance reform and supervision of
state-owned commercial banks including ICBC. Publicly listed banks, along with other listed
companies, follow a mixture of U.S. and European models with both a board of directors and a
supervisory board. The government and regulators believe that banks going public can accelerate
the transformation of China’s banking system – to help create more efficient and effective
intermediation of funds in the economy and provide the banks with greater flexibility to raise
finance to support the capital needs of the growing economy. On the other hand, government
ownership of all major banks still plays an important role.
3. Background Information of ICBC
3.1 History of ICBC
ICBC was established in 1984 as a state-owned bank specialized in commercial financing
and transactions. Its formation was part of China’s banking sector reform that started in 1978. ICBC
assumed all the commercial banking functions of the PBOC, China’s central bank. From 1984 to
1993, ICBC continued to operate as a specialized state-owned bank. It expanded its operations and
distribution network, strengthened financial accounting and management systems and increased
their focus on profitability and risk management. In 1994, three policy banks were established to
assume all the ‘policy lending’ functions (in underdeveloped areas, export and import) from the
state-owned specialized banks. ICBC, along with the other three state-owned banks (Bank of China,
China Construction Bank, and Agriculture Bank of China) started to operate on a more commercial
basis, forming the ‘Big Four’ commercial banks in China.
In 1997, ICBC set up its first website, and in 1999, launched the ‘95588 telephone banking’
services nationwide. Together with the Hong Kong Bank of East Asia, ICBC acquired and
established the ICBC-BEA Finance Shareholding Company with a 75% stake. In 2000, the ICBC-

10
Asia Company was formed after ICBC’s acquisition of the Union Bank. ICBC began its online
private and commercial banking services, mobile banking, business-to-business online services, and
telephone banking services in 2000. In 2002, ICBC (through ICBC-Asia) purchased a 25% stake of
Taiping Insurance Company from China Insurance International Holdings and China Insurance
Holdings. This purchase enhanced ICBC’s presence in China’s booming insurance market.
ICBC’s new personal internet product, Banking@home, was launched in December 2002,
after signing the co-operation agreement with Microsoft on Personal Internet Banking Security. In
2004, ICBC, again through ICBC-Asia, acquired Fortis Bank Asia in Hong Kong and changed its
name to Belgian Bank.
To strengthen the capital base and asset quality of the largest state-owned commercial banks,
China’s Ministry of Finance, through the establishment of a bank holding company (approved by
the State Council) – the Central Huijin Investment Company (Huijin hereafter) in December 2005,
injected capital (foreign currency reserves) to ICBC and the other Big Four banks. In addition, four
asset management companies (China Huarong Asset Management Corporation, China Great Wall Asset
Management Corporation, China Cinda Asset Management Corporation and China Orient Asset
Management Corporation), established by the central government, assumed non-performing assets
(mainly non-performing loans, or NPLs) of the Big Four banks; one of the four companies, Huarong
Asset Management Corporation, is associated with the transferral of bad assets from ICBC (refer to
the section on financial restructuring below for detailed information). Finally, ICBC’s legal status
was changed from state-owned to ‘joint-stock limited company’ in October, 2005, with the Ministry
of Finance and Huijin as promoters and its new name changed to ICBC Limited.
3.2 Business and Operation
ICBC is a commercial bank that provides wholesale banking, personal banking, e-banking,
corporate banking and international business banking services. It operates in the corporate banking

11
business in China and supports many infrastructure constructions, primary industries, pilot projects,
key enterprises as well as small and medium-sized enterprise development. There are four segments:
corporate banking, personal banking, e-banking and bank card; the scale of operation of each of the
segments is the largest among all financial institutions in China. As of December 31, 2005, ICBC
had RMB6,456.1 billion in total assets, RMB3,289.6 billion in total loans, RMB5,736.9 billion in
total deposits, and their total operating income in 2005 was RMB171.6 billion. ICBC’s assets, loans
and deposits represented 16.8%, 15.4% and 19.4% of the total assets, total loans and total deposits,
respectively, of all banking institutions in China, and 31.4%, 30.4% and 32.6% of the total assets,
total loans and total deposits of the Big Four banks, based on data published by the PBOC. Table 3
provides a breakdown of ICBC’s operating income.
As of December 31st, 2005, ICBC was the largest corporate bank in China in terms of
outstanding corporate loans, discounted bills and corporate deposits, and the largest personal bank
in China in terms of outstanding personal loans and deposits. ICBC had more than 2.5 million
corporate banking customers and more than 150 million personal customers. ICBC is headquartered
in Beijing, and, as of June 30, 2006, had 98 overseas branches, subsidiaries, representative offices
and outlets.
Prior to the IPO, ICBC had been focusing on developing non-interest based businesses and
had experienced fast growth in their fee- and commission-based income. Their net fees and
commission income were the highest among the Big Four banks, with the average compound annual
growth rate in their fee-based banking greater than 30% per annum. ICBC’s fee-based banking
business mainly covered bank cards, clearing and settlements, investment banking, wealth
management, agency services, electronic banking and custody service businesses. A large part of
their wealth management fees come from the increased transaction volumes in the distribution of
life insurance products and mutual funds. Table 4 summarizes ICBC’s loan portfolios and yields.

12
4. Making ICBC a Global Standard Bank
Prior to the IPO, ICBC had taken several steps in reforming the bank into a global standard
bank. These reforms focused on setting up efficient operation systems that match with the
international standard, financial restructuring that try to enhance the capital adequacy and reduce
the non-performing loan problem, setting up good corporate governance mechanisms, and an up-to-
date risk management system.
4.1 Operational Reforms
Prior to the IPO, ICBC began a new phase of operational reforms in 2006, focusing on
improving customer services, risk management, and operational efficiency. More specifically, they
focused on realigning customer oriented business activities including corporate banking, personal
banking, treasury operations, streamlining operational structure by reducing branches and
management layers, enhancing risk management and internal control systems, centralizing capital
and financial management with a better reporting platform and a comprehensive review system, and
improving employee incentive structures such as establishing an EVA-based profit sharing program.
4.2 Financial Restructuring
ICBC went through a series of financial restructuring efforts to enhance its capital adequacy,
and the key dates and events are summarized in Table 3. First, in 1998, the Ministry of Finance
injected RMB85 billion to ICBC through a special issue of 30-year government bonds. Then, in
1999 and 2000, non-performing assets in the amount of RMB407.7 billion were transferred to
(state-owned) Huarong Asset Management Corporation, in exchange for RMB94.7 billion of cash
and non-transferable ten-year bonds with face value of RMB313 billion.
Third, to prepare for the IPO, several steps were taken in 2005 to further shore up ICBC’s
capital adequacy. The Ministry of Finance (MOF) retained RMB124 billion of ICBC’s existing
capital, the Central Huijin Investment Company made a capital contribution of US$15 billion, ICBC

13
disposed of non-performing assets in an aggregate amount of RMB705.0 billion from its books,2 the
central government granted land use rights to ICBC that were worth RMB19.9 billion, and the
Ministry of Finance further amended the terms of the special government bonds issued to ICBC.
4.3 Setting Up Good Corporate Governance
4.3.1 Foreign ownership
In April 2006, a consortium comprised of the Goldman Sachs Group, Inc., Allianz Group
(through its wholly owned subsidiary, Dresdner Bank Luxembourg S.A.), and the American
Express Company acquired an 8.45% equity stake in ICBC (Goldman’s stake was 5.75% and
Allianz’s 2.25%) at the Latest Practicable Date (latest date for compiling statistics prior to the IPO
filing). This was the first step of opening ICBC to outside investors. This foreign ownership was
linked to those strategic investors that had formed various alliances with ICBC to help ICBC
establish certain business practices, particularly risk management, to enhance its financial
performance and efficiency. Table 4 shows ICBC's ownership structure around the IPO.
ICBC worked with Goldman Sachs to strengthen their corporate governance practices, risk
management and internal controls, and enhance their treasury operations, asset management,
corporate banking and investment banking operations as well as their non-performing loan disposal
capabilities. They collaborated with Allianz to develop and provide banc assurance products and
services to their customers; and as for American Express, ICBC began and continue to expand their
cooperation on bank card business, risk management and customer service.
2 On May 27, 2005, ICBC transferred (at book value) NPLs in the amount of RMB176 billion and other assets of RMB70 billion to the MOF (who in turn designated Huarong to hold these assets) in exchange for an MOF receivable of RMB246 billion that accrues 3% annual interest. Then on June 27, ICBC sold NPLs of RMB459 billion at book value to the four AMCs; RMB 430.5 billion of the proceeds were invested in a special 5-year, non-transferable PBOC bill. Both of these transactions were recorded to ICBC’s capital reserve in an aggregate amount of RMB567.6 billion after allowance for impairment losses was made. On Jun 14, 2005, MOF announced that it would take full responsibility for Huarong’s debt obligations to ICBC in the event that Huarong was unable to repay its debt.
14
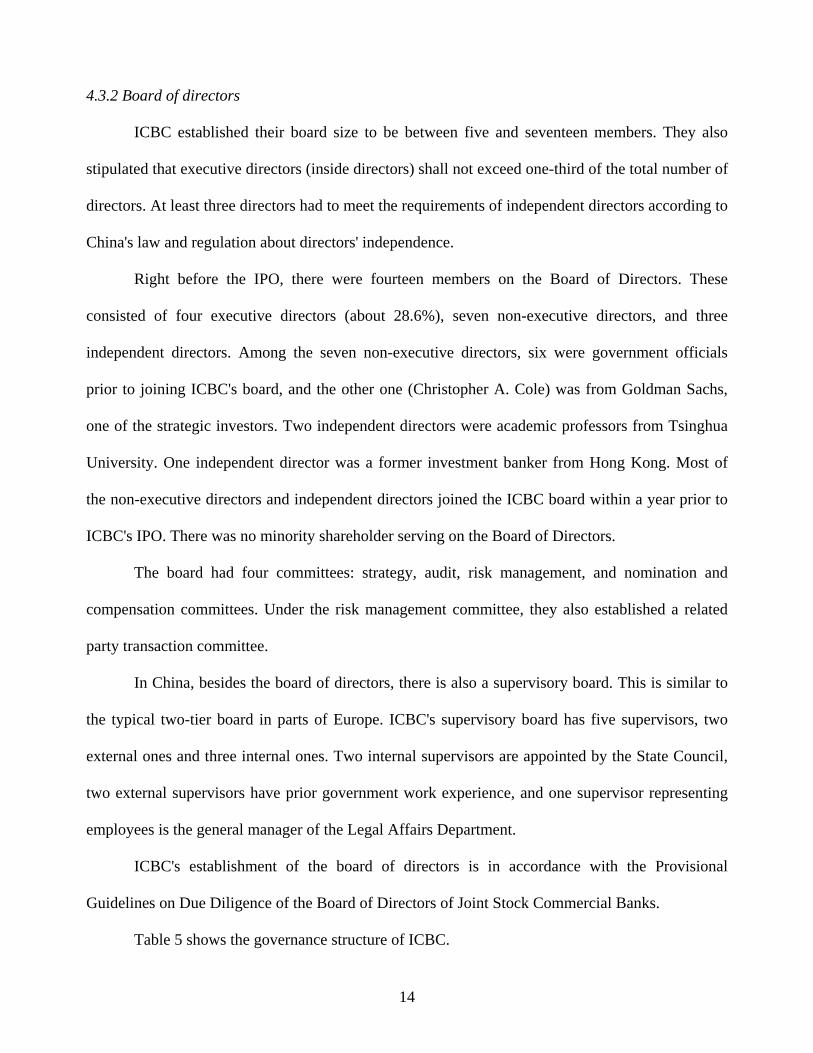
4.3.2 Board of directors
ICBC established their board size to be between five and seventeen members. They also
stipulated that executive directors (inside directors) shall not exceed one-third of the total number of
directors. At least three directors had to meet the requirements of independent directors according to
China's law and regulation about directors' independence.
Right before the IPO, there were fourteen members on the Board of Directors. These
consisted of four executive directors (about 28.6%), seven non-executive directors, and three
independent directors. Among the seven non-executive directors, six were government officials
prior to joining ICBC's board, and the other one (Christopher A. Cole) was from Goldman Sachs,
one of the strategic investors. Two independent directors were academic professors from Tsinghua
University. One independent director was a former investment banker from Hong Kong. Most of
the non-executive directors and independent directors joined the ICBC board within a year prior to
ICBC's IPO. There was no minority shareholder serving on the Board of Directors.
The board had four committees: strategy, audit, risk management, and nomination and
compensation committees. Under the risk management committee, they also established a related
party transaction committee.
In China, besides the board of directors, there is also a supervisory board. This is similar to
the typical two-tier board in parts of Europe. ICBC's supervisory board has five supervisors, two
external ones and three internal ones. Two internal supervisors are appointed by the State Council,
two external supervisors have prior government work experience, and one supervisor representing
employees is the general manager of the Legal Affairs Department.
ICBC's establishment of the board of directors is in accordance with the Provisional
Guidelines on Due Diligence of the Board of Directors of Joint Stock Commercial Banks.
Table 5 shows the governance structure of ICBC.

15
4.3.4 Compensation
ICBC adopts the market-oriented incentive system that organizes their management based
job functions and value added. ICBC implements an economic value-added (EVA)-based incentive
scheme, such that employee income is tied to the employee’s personal performance and the
contribution made by their respective work units. This incentive scheme is intended to attract, retain,
motivate and develop a high quality workforce.
ICBC compensates their directors, supervisors and senior management with salaries,
bonuses, enterprise annuities, social security plans, housing provident fund plans. In preparation for
the IPO, ICBC also adopted a share appreciation rights policy. This essentially is the same as stock
option grants in U.S. companies. Directors, supervisors, senior management and other board
designated personnel are eligible for participation in the share appreciation rights plan. The
benchmark price is based on the market value of the stocks that are traded on the Hong Kong Stock
Exchange.
4.4 Risk Management
Risk management is very important to the banking sector. ICBC implemented a risk
management framework covering credit, liquidity, market and operational risks. This framework,
which is supported by ICBC's advanced risk management information technology, enabled ICBC to
better manage the risks and thus to improve asset quality.
Prior to 1994, ICBC was a state-owned specialized bank and their risk management
capabilities were limited. With the promulgation of the PRC Commercial Banking Law in 1995,
they began to operate on a more commercial basis and started to more proactively manage their
risks. They have accelerated the development of the bank's risk management capabilities since the
late 1990s.

16
ICBC established the Chief Risk Officer (CRO) position in July 2006 in an effort to
strengthen their risk management. The risk management department at the head office reported
directly to the bank's CRO. ICBC’s risk management department at the head office is primarily
responsible for coordinating the bank's efforts in establishing their comprehensive risk management
framework, preparing consolidated reports on their credit risk, market risk and operational risk,
developing methodologies and approaches for the quantification of credit risk, developing and
implementing the internal rating-based project and monitoring and managing their non-performing
loans. In addition, the risk management department at the head office provided administrative
support to the bank's risk management committee at the head office level. The CRO assists the
president in overseeing their risk management and making related decisions.
ICBC undertook the following initiatives to enhance their risk management capabilities
based on applicable PRC regulatory requirements and the specific needs of the bank: (1)
establishing a bank-wide risk management framework and related systems to improve their risk
assessment, monitoring and management capabilities and develop a risk management culture
within the bank; (2) enhancing corporate governance and strengthening the independence of the
internal audit functions; (3) developing enhanced risk management information systems; (4)
increasing employees' accountability for their own performance and compliance with the bank’s
policies and procedures.
ICBC also made continuous efforts to align the risk management and internal control
capabilities with international best practices. These included continuing to develop their risk
management culture; further strengthening the independence of the internal control functions and
improving the bank-wide internal control systems; continuing the rollout of the Internal Ratings-
Based approach in their risk management systems and improving their capabilities of identifying
and quantifying risks; introducing risk-based pricing into their credit risk management process;

17
further improving risk warning and early identification and prevention capabilities: and enhancing
asset and liability management capabilities and further centralize risk management. Table 6
describes the risk management structure of ICBC.
5. The IPO of ICBC
5.1 The IPO Process
ICBC simultaneously carried out an H-share (global) offering in HKSE (HKD) and an A-
share offering in SHSE (RMB). Specifically, the H shares were offered in the Hong Kong Public
Offering and International Offering. As mentioned above, the offering prices for A-shares and H-
shares would be the same having taken currency conversion (RMB and HKD) into account. It was
the first ever simultaneous IPO of two types of shares (H-shares and A-shares) in two different
stock exchanges.
The Hong Kong H-share underwriting syndicate (joint lead managers) included Merrill
Lynch Far East Limited, China International Capital Corporation (CICC-Hong Kong) Limited,
Credit Suisse (Hong Kong) Limited, Deutsche Bank AG (Hong Kong Branch), and ICEA Capital
Limited. The Shanghai A-share underwriting syndicate includes CICC, CITI Securities Co., Ltd.,
Guotai Junan Securities Co., Ltd., Shenyin & Wanguo Securities Co., Ltd. Greenshoe options for
over allotment were included in the contracts with both investment banking syndicates.
The (H-share) international offering underwriters solicited from prospective investors’
indications of interest in acquiring the H shares. In particular, ICBC and the investment banking
syndicate solicited qualified institutional buyers in the U.S. (as defined in SEC Rule 144a) and
outside of the US in reliance with SEC Regulation S. This “book-building” process provided
enough information that helped to determine the eventual offer price.

18
The allocation of H shares pursuant to the International Offering was determined by the
Joint Bookrunners and was based on a number of factors including the level and the timing of the
demand, the total size of the relevant investor’s invested assets or equity assets in the relevant sector
and whether or not it was expected that the relevant investor is likely to buy further, and/or hold or
sell H shares after the listing on HKSE. The targets were professional, institutional, corporate, and
retail investors. The goal was to establish a stable shareholder base. ICBC was expected to use the
net proceeds from the Global Offering to strengthen its capital base to support the ongoing growth
of its business.
5.2. Valuation of ICBC Stock in Preparation for the IPO
According to most analysts (in Hong Kong), ICBC enjoyed some cost advantages over its
peers, however, its profitability was on the lower end relative to peers. Many analysts believed
ICBC’s efforts in streamlining its vast distribution network (over 18,000 branches) and its plan to
adopt an economic value added incentive scheme would boost employee productivity and improve
operational efficiency. ICBC’s asset quality lagged that of its peers, mainly due to its longer
operating histories and more exposure to state-owned enterprise (SOE) lending; on the other hand,
ICBC's low NPL ratio of just 1.86% for new loans made since FY99 offered good proof of its
enhanced risk control. Analysts believed that its assets quality would continue to improve in the
foreseeable future. Most of the Chinese banks’ performance moved closely together, reflecting their
close relation with the overall economic growth and the underlying macroeconomic conditions.
Many analysts believed ICBC’s growth was more steady and defendable compared to its peers
because of its leadership position in terms of market shares.
A standard approach to evaluate a financial services company such as a commercial bank is
the equity cash flow (ECF) method rather than the enterprise DCF approach for a non-financial
services firm. For most nonfinancial companies, operating decisions and financing decisions are

19
separate. For financial companies, however, we cannot value operations separately from interest
income and expense, since these are important components of their income. Moreover, financing
decisions, for example, the choice of leverage, are at the core of how banks and insurers generate
earnings. Therefore, to value financial institutions we should use the ECF method to directly
estimate (free) cash flows for the equity holders.3 We can derive ECF from net income minus the
earnings retained in the business:
Equity Cash Flow = Net Income – Increase in Equity + Other Comprehensive Income
We start with net income because it represents the earnings theoretically available to
shareholders after the company has paid all expenses, including those to debtholders. However, net
income is not a cash flow. As a financial institution grows, it will need to increase equity to prevent
the debt/equity ratio from rising above solvency levels imposed by regulators. Hence, increases in
equity reduce ECF, because the company must set aside earnings that could otherwise be paid out to
shareholders. Finally, we add back other comprehensive income (if applicable), which under US
GAAP consists of several noncash items that are added or subtracted from the equity account.4
To forecast equity cash flow, the standard approach is to forecast income statements and
balance sheets to obtain projected net income. Appendix A1 provides consolidated income
statements and balance sheets for 2003 to 2005, as well as the first half of 2006. Changes in equity
can be calculated by considering overall changes in balance sheet or by determining the implied
shareholders’ equity. We can first forecast the growth in loans and deposits, and for simplicity,
assuming a fixed ratio of total loans to total deposits going forward.
We then derive risk-adjusted assets from total loans with another simplifying assumption of
fixed ratio of risk-adjusted assets to total loans. We also calculate Tier 1 capital from risk-adjusted
3 For more details, see for example, Chapter 25 (and in particular, the subsection titled “Valuing Banks from the Outside in,” pp. 672-679), in Koller, Goedhart, and Wessels (2005). 4 The main items are net unrealized gains and losses from certain equity and debt investments and hedging activities, adjustments to the minimum pension liability, and foreign-currency transaction items.

20
assets, assuming, again, a fixed percentage of Tier 1 capital to risk-adjusted assets. Alternatively, as
the business grows, we can assume that this ratio falls to the regulatory minimum (8%) in the long
run. Exhibit 12 presents information on key financial indicators of ICBC and other comparable
banks. We then calculate total shareholders’ equity to be equal to Tier 1 capital plus goodwill.
Finally, the terminal value can be estimated by:
TV = NI * (1- g / RONE) (rE – g) where
– NI: net income in the first year after forecast period ends;
– g: NI perpetual growth rate;
– RONE: incremental return on new equity after forecasting period;
– rE: cost of equity.
Some comments on the ECF approach are as follows:
Development stages: the explicit forecast is divided into three 5-year stages of development
that correspond to the take-off stage, high-growth stage, and maturing stage. A low growth
rate of 3.5% was assumed in calculating terminal value.
Forecast growth ratios: largely based on analysts’ consensus; some were based on averages
of ICBC historical data.
Assets & liabilities: deposits are the main driver to growth, and loans and other assets are
forecast in proportion to deposits. Assumed asset compositions and loan quality remain
stable (i.e., provisions to loans ratio remains unchanged).
Equity & risk-adjusted capital: Banks need to increase equity as they grow in order to fulfill
the capital requirements set forth by regulators; while risk-adjusted capital may not
necessarily be the same as book-value of equity, the model assumes book-value of equity is
a good proxy of risk-adjusted capital the bank needs to employ.

21
Cost of equity: calculated using CAPM and emerging market equity premium of 6%, risk-
free rate of 5%, and equity beta of 1.1.
Sensitivity analysis: needs to be performed on the key inputs, such as terminal growth rate,
cost of equity and long-term risk free rate.
Finally, to evaluate the per share value of ICBC stock (for IPO), we assume the total number
of shares outstanding to be 334,019 million. According to the investment bankers and ICBC (and
verified in the IPO prospectus), after distribution to all major institutional shareholders, most of the
remaining shares would be listed on the HKSE and the rest on the SHSE. In terms of IPO pricing of
A shares (in SHSE) and H shares (in HKSE), the prices were to reflect the same fundamental value
of the equity (i.e., the per share value of the ECF approach) and spot exchange rate between RMB
and HK$ (as of 10/26/06).5
Our valuation gives us per share value under ECF of RMB3.76 (HKD 3.81) per share
Sensitivity analyses give us the range of per share value as RMB3.00 to RMB5.00. The listed price
for A-shares at the Shanghai Stock Exchange was RMB3.12, and for H-shares at the Hong Kong
Stock Exchange was HKD3.07 or RMB3.01.
ICBC was simultaneously listed on both the Hong Kong Stock Exchange and Shanghai
Stock Exchange on 27 October 2006. It was the world's largest IPO at that time valued at US$21.9
billion. China's largest commercial bank was also the first company to be listed simultaneously on
both the Hong Kong and Shanghai stock exchanges.
ICBC raised at least US$14 billion in Hong Kong (H-shares) and another US$5.1 billion in
Shanghai (A-shares). Due to heavy subscriptions, the greenshoe (i.e. over-allotment) placements
were exercised and ICBC's take rose to US$21.9 billion (17% of ICBC's market value before the
IPO). At the end of its first day of trading, the bank's shares closed up almost 15% at HK$3.52 in
5 During the few years leading up to the IPO of ICBC, the inflation rate in China was low and stable; most of the analysts did not forecast any significant changes in inflation rates going forward (as of June 2006).

22
Hong Kong, compared with the listing price of HK$3.07, which was set at the top of the indicative
range due to the strong demand. Meanwhile, ICBC's Shanghai-listed A-shares recorded more
modest gains and ended up 5.1% from the offering price of RMB 3.12.
5.3 Post-IPO performance
If ICBC's IPO is seen as part of the initial success of the Chinese government opening up
their banking sector, then it is important to know whether this step of liberalizing the banking sector
brings further development and better performance of the involved banks. During the first year after
the IPO, ICBC experienced further improvement in its profitability and its net profit increased about
60%, higher than the average growth rate in profitability of 30% prior to its IPO. Table 7 reports the
profitability of ICBC from 2006 to 2010. ICBC continues to grow in both its business expansion
and diversification. Its total assets are more than $1.4trillion. The market value of ICBC continued
to rise for some time, and it remains as the largest bank in the world based on total market
capitalization (as of June 2011, ICBC's market capitalization was around $250billion). Its current
stock price is between HK$4- HK$5.0. Figure 4 shows the stock performance of both A and H
shares post IPO until recently.
ICBC continues its efforts in improving its governance structure. The year following its IPO,
a new independent director was elected to the board. With Central Huijin and China's Ministry of
Finance each holding more than 30% of ownership, the issue of governance is not simply
shareholder value maximization or managing the conflicts between majority shareholders and
minority shareholders. It is more complex and has to do with different types of agency problems.
Table 8 shows the distribution of the shareholdings by majority shareholders. Government
ownership is dominant. However, with the presence of the foreign strategic shareholders at ICBC,
we may expect some further improvement in its effectiveness of the governance mechanisms. With
the observed growth in its business and profitability, it suggests that ICBC's board of directors are

23
doing a good job in creating value for the bank. Table 9 shows the structure of ICBC's board of
directors. ICBC's board structure has been quite stable after its IPO. We observe an increase in the
percentage of the independent directors (above 30%) up until 2010. Insiders and government
officials are still the majority on the board.
Recent data shows that ICBC's non-performing loan ratio has been around 2%. This
suggests that ICBC has maintained or even further reduced their non-performing loan after the IPO.
We do note that ICBC's H-shares have been over-performing the market, while their A-shares have
been underperforming the market.
6. Discussion and Conclusions
The IPO of ICBC marks one of the initial efforts taken by Chinese government to liberalize
their financial sector. With more and more banks going public, the banking sector invited many
foreign investors. Some of the foreign investors like Goldman Sachs and Allianz were strategic
investors, which not only provided capital to the bank, but also formed a strategic alliance with the
bank. However, the process of banking sector privatization is still just beginning. Even though
ICBC has listed stock on two stock exchanges, the majority of the ownership is still with the
Chinese government. The role of government ownership stakes may lead to certain conflicts of
interest. On the one hand, the bank may be able to seek rents from the government given the
extensive government ownership. Regulations may be more likely to favour banks like ICBC.
However, on the other hand, the government ownership stake may lead to the government seeking
rents from the bank - the conflicts of "for-profit" goals of the bank versus "not-for-profit" goals of
the government. This conflict of interest may be intensified because of the political connections of
the directors and supervisors on the board. The government may make the bank provide capital to

24
government owned projects, which may lead to lower capital proficiency for the bank. This could
lead to a typical agency problem - the majority shareholders expropriating the minority shareholders.
ICBC appears to have adopted a standard board of directors with a sufficient number of
outside directors. However, the majority of the directors are still either current government officials
or previous bureaucrats. The question is that how independent they are in making decisions or
evaluating the management.
With the WTO agreements, China has taken steps in liberalizing its financial markets and
banking sector. The role of government ownership should become less and less important for banks
like ICBC. As more foreign strategic investors move into the domestic market, financial institutions
like ICBC will face more competition. It is important for domestic financial institutions to stay
competitive.
As we mentioned in the introduction, the conventional view is that a more efficient financial
sector, less state ownership, higher quality of government institutions and full financial openness
(identified in Bekaert, Harvey and Lundblad (2007)) are critical for China's further economic
growth. However, in the crisis this conventional wisdom did not hold up well. In fact China’s
banks did much better than western banks. The IPO of ICBC may help the firm stay competitive, as
outside minority shareholders or those strategic investors will discount the bank if the management
or majority shareholders are not maximizing firm value. It will be interesting to see if government
ownership in the banking sector recedes overtime, and whether this will essentially improve the
bank's competitive position in the market place. What will happen when more and foreign banks are
allowed banking business in China? Will long-term government protection create inertia and
prevent real efficiency inside the financial institution? Or will the Chinese model with partial
ownership prove to be better in the face of financial crises? These are all interesting questions we
hope to answer in the future.

25
References
Allen, F., J. Qian, M. Qian, and M. Zhao (2009). “A Review of China’s Financial System and
Initiatives for the Future,” Chapter 1 of China’s Emerging Financial Markets: Challenges
and Opportunities, edited by J. Barth, J. Tatom, and G. Yago, The Milken Institute Series on
Financial Innovation and Economic Growth, New York: Springer, 3-72.
Bekaert, G., C. Harvey, and C. Lundblad (2005). “Does Financial Liberalization Spur Economic
Growth,” Journal of Financial Economics 77, 3-55.
Bekaert, G., C. Harvey, and C. Lundblad, (2007). “Financial Openness and the Chinese Growth
Experience” in China's Financial Transition at a Crossroads edited by C. Calomiris, New
York: Columbia University Press, 202-280.
Bekaert, G., C. Harvey, and C. Lundblad, (2011). “Financial Openness and Productivity,”
World Development 39, 1-19.
Bekaert, G., C. Harvey, C. Lundblad, and S. Siegel (2007). “Growth Opportunities and Market
Integration,” Review of Financial Studies 62, 1081-1138.
Demirgüç-Kunt, A., and R. Levine (2001). Financial Structure and Economic Growth: Cross-
country Comparisons of Banks, Markets, and Development, Cambridge, MA: MIT Press.
Koller, T., M. Goedhart, and D. Wessels (2005). Valuation: Measuring and Managing the Value of
Companies, fourth edition, Hoboken, NJ: John Wiley.
Quinn, D. and A. Toyoda (2008). “Does Capital Account Liberalization Lead to Economic
Growth?” Review of Financial Studies 2, 1403-1449.

26
Table 1: The Largest Banks in the World (as of August, 2011)
Panel A Top 10 Banks Measured by Market Capitalization ($billion)
Rank Bank Name HQ Country
Market Cap. $B
(as of Aug. 2011) Total Return (%) YTD
1 IND & COMM BK OF CHINA-A China 235.31 0.86%
2 CHINA CONSTRUCTION BANK-H China 196.66 -14.46%
3 HSBC HOLDINGS PLC United Kingdom 177.23 -16.94%
4 JPMORGAN CHASE & CO United States 158.31 -17.34%
5 WELLS FARGO & CO United States 143.76 -20.94%
6 AGRICULTURAL BANK OF CHINA-H China 137.49 -6.23%
7 BANK OF CHINA LTD-H China 130.22 -21.41%
8 CITIGROUP INC United States 107.64 -39.93%
9 BANK OF AMERICA CORP United States 96.16 -45.50%
10 COMMONWEALTH BANK OF AUSTRAL Australia 83.28 -0.30%
Source: Bloomberg.
Panel B Top 20 Banks Measured by Total Assets (August, 2011; $trillion) Rank Bank Name (HQ Country) HQ Country Total Assets ($trillion)
1 BNP PARIBAS France 2.79 2 HSBC HOLDINGS PLC United Kingdom 2.69
3 DEUTSCHE BANK AG- Germany 2.68
4 MITSUBISHI UFJ FINANCIAL Japan 2.49
5 BARCLAYS PLC United Kingdom 2.40
6 ROYAL BANK OF SCOTLAND United Kingdom 2.32
7 CREDIT AGRICOLE SA France 2.31
8 IND & COMM BK OF CHINA-A China 2.30
9 BANK OF AMERICA CORP United States 2.26
10 JPMORGAN CHASE & CO United States 2.25
11 CITIGROUP INC United States 1.96
12 MIZUHO FINANCIAL GROUP Japan 1.94
13 CHINA CONSTRUCTION BANK- China 1.82
14 BANCO SANTANDER SA Spain 1.79
15 BANK OF CHINA LTD-H China 1.78
16 SOCIETE GENERALE France 1.68
17 SUMITOMO MITSUI FINANCIAL Japan 1.66
18 LLOYDS BANKING GROUP PLC United Kingdom 1.57
19 AGRICULTURAL BANK OF China 1.57
20 UBS AG-REG Switzerland 1.47
Source: Bloomberg

27
Table 2 A Comparison of Non-performing Loans (NPLs) This table compares total outstanding NPLs within the banking system, among China, the U.S., and other major Asian countries for the period 1997-2006. The size of the NPLs, is measured by US$ billion and as the percentage of GDPs in the same year. NPLs in the U.S. measure the outstanding “delinquency loan”; NPLs in Japan measure the “risk management loans” (or loans disclosed under the Financial Reconstructed Law and/or loans subject to self-assessment). All figures are converted into U.S. dollars using the average exchange rate within the observation year.
Year China U.S. Japan S. Korea India Indonesia Taiwan
Size of NPLs: In US$ billion and as percentage of GDPs in the same year (in brackets)
1997 -- 66.9 (0.8%) 217.4 (5.1%) 16.2 (3.1%) -- 0.2 (0.1%) 19.6 (6.5%)
1998 20.5 (2.0%) 71.3 (0.8%) 489.7 (12.7%) 23.2 (6.7%) 12.7 (3.1%) 5.5 (5.2%) 21.8 (7.9%)
1999 105.1 (9.7%) 72.2 (0.8%) 547.6 (12.6%) 54.4 (12.2%) 14.0 (3.2%) 3.1 (3.8%) 27.2 (9.1%)
2000 269.3 (22.5%) 90.1 (0.9%) 515.4 (11.1%) 35.5 (6.9%) 12.9 (2.8%) 6.3 (2.7%) 33.2 (10.3%)
2001 265.3 (20.0%) 108.4 (1.1%) 640.1 (15.6%) 12.2 (2.5%) 13.2 (2.8%) 4.3 (1.7%) 37.9 (13.0%)
2002 188.4 (13.0%) 107.8 (1.0%) 552.5 (14.1%) 9.9 (1.8%) 14.8 (3.0%) 3.3 (2.0%) 30.7 (10.4%)
2003 181.2 (11.0%) 95.9 (1.0%) 480.1 (11.3%) 11.7 (1.9%) 14.6 (2.5%) 4.7 (1.5%) 23.1 (7.7%)
2004 207.4 (10.7%) 81.3 (0.9%) 334.8 (7.3%) 10.0 (1.5%) 14.4 (2.2%) 3.8 (2.1%) 16.4 (5.1%)
2005 164.2 (7.3%) 84.6 (0.7%) 183.3 (4.0%) 7.6 (1.0%) 13.4 (1.7%) 6.0 (1.5%) 11.2 (3.2%)
2006 (Q2) 160.3 (6.3%) 88.8 (0.7%) 108.2 (2.4%) 7.4 (0.8%) 11.8 (1.4%) 7.3 (2.1%) --

28
Table 3: Financial Restructuring of ICBC Capital restructuring started as early as 1998
– MOF injected capital of RMB 85.0 billion to improve capital adequacy Non-performing loans problem was first tackled between 1999-2000
– Aggregate amount of RMB 408 billion was transferred to Huarong Significant restructuring happened prior to IPO in 2005
– Converted from a state-owned commercial bank to a joint-stock limited company in Oct. 2005
– Huijin made capital contribution of RMB 124 billion – Disposed NPL to asset management companies – Government contributed certain land rights – MOF amended terms of government bonds issued by it to ICBC
Table 4: ICBC Sharing holding & Group Structure*
1998
MoF 30yr special govn’t bond
RMB 85bn
1999/2000 Apr 2005 May/Jun 2005 Aug 2005
Strengthen Capital Base
Improve Assets Quality
Hujin Capital injection
RMB 124bn
Subordinated debt
RMB 35bn
NPL carve-out RMB $408bn
-RMB 95bn cash
-RMB $313bn Huarong 10yr bond
NPA disposal RMB $705bn
-RMB 246bn MoF receivable
-RMB 459bn AMCsSource: Company data, Deutsche Bank’s analyst report
MOF Huijin SSFGoldman
SachsAllianz
AmericanExpress
H ShareShareholders
A ShareShareholders
Industrial and Commercial Bank of China LimitedIndustrial and Commercial Bank of China Limited
Source: ICBC Hong Kong Offering Memorandum Oct 20, 2006* Assume neither the H-share nor A-share over-allotment option is exercised
36.24% 36.24% 5.39% 5.03% 1.96% 0.39% 10.80% 3.97%
Domesticbranches
Major domestic controlled
entities
Overseascontrolled
entities
Overseaswholly-owned
subsidiary banks
Overseasbranches
Overseasrepresentative
offices

29
Table 5: ICBC Corporate Governance Structure
Source: Company data

30
Table 6

31
Table 7 ICBC Operating performance post IPO This table reports operating performance from year 2006 to year 2010.
Year Total Assets
Total Profit
Net Profit
ROA ROE NPL/Loans NPL/Assets
2006 7,509,118 71,521 49,336 0.66% 10.47% 5.47% 1.75%
2007 8,684,288 115,114 81,990 0.94% 15.06% 2.57% 1.29%
2008 9,757,654 145,301 111,151 1.14% 18.31% 2.13% 1.07%
2009 11,785,053 167,248 129,350 1.10% 19.05% 1.39% 0.75%
2010 13,417,887 166,324 127,795 0.95% 16.83% 1.00% 0.54%
Table 8 ICBC Majority Shareholders
This table reports the list of majority shareholders and their % of shareholdings. "%classshares" is the % of shareholdings of the respective share class. "%totalshares" is the % of total number of shares outstanding.
Substantial Shareholders Disclosure
A Shares
Institution Name (all long, beneficial unless noted) % class shares
% total shares
China Ministry of Finance 45 33.81
Huijin 45 33.81
H Shares
Social Security Fund 18.17 4.52
Goldman Sachs 11.68 2.91
Goldman Sachs (controlled interest) 0.18 0.05
Nomura Holdings (long-position; controlled interest) 5.66 1.41
Nomura Holdings (short-position; controlled interest) 4.45 1.11
JP Morgan Chase 0.48 0.12
JP Morgan Chase (investment manager) 1.52 0.38
JP Morgan Chase (custodian) 2.79 0.69
JP Morgan Chase (short position) 0.41 0.1
Capital Research & Management (investment mgr.) 5.77 1.44

32
Table 9 ICBC Board of directors This table reports characteristics of the board of directors of ICBC and how it evolves over time after IPO. Year Size %
Executive Directors (Insiders)
% Government
Officials
% Independent
Directors
Average Age
Average Tenure
% Foreign
Directors
% Female
Directors
2006 14 28.6% 0.214286 21.4% 51.6 n/a 28.6% 7.1%
2007 14 28.6% 0.214286 28.6% 53.1 n/a 28.6% 7.1%
2008 14 28.6% 0.214286 28.6% 54.2 n/a 28.6% 7.1%
2009 14 28.6% 0.214286 28.6% n/a n/a 28.6% 7.1%
2010 16 25.0% 0.1875 37.5% 53.8 7.4 25.0% 6.3%
Table 10 ICBC's International Settlement
ICBC Settlement PL, Millions CNY
Net Fee/Commission Income
% Commission Income
2006 4,656
16,344
28.49%
2007 5,294
34,384
15.40%
2008 9,081
44,002
20.64%
2009 14,587
55,147
26.45%
2010 19,160
72,840
26.30%

33
Figure 1: Chinese Banking Industry Structure (as of December 31, 2005)
53.5%
15.3%
5.4%
0.5%
8.3%
1.7%
15.4%Big Four commercial banks
Other national commercial banks
City commercial banks
Urban credit cooperatives
Rural credit cooperatives
Foreign-invested banks
Others
¥6,454
¥4,771
¥4,584
¥4,743
ICBC
Agricultural Bank of China
Bank of China
China Construct ion Bank
58.7%
15.4%
5.7%
0.6%
9.4%
0.6%9.6%
Big Four commercial banks
Other national commercial banks
City commercial banks
Urban credit cooperatives
Rural credit cooperatives
Foreign-inves ted banks
Others
Breakdown of deposits own by Big FourBreakdown of deposits own by banking institutions
Breakdown of assets own by Big FourBreakdown of assets own by banking institutions
Source: ICBC Prospectus
Note 1: As of December 31, 2005
(in RMB billions)
¥5,660
¥4,037
¥3,973
¥3,704
ICBC
Agricultural Bank of China
Bank of China
China Construction Bank
(in RMB billions)

34
Figure 2: ICBC’s Operating Income Breakdown
Figure 3: ICBC's Loan Portfolio
Net interest income(91.6%)
Net fee and commiss ionincome (7.0%)
Other operating income(0.2%)
Other investment income(2.7%)
Net exchange gain/loss(-1.5%)
Operating income (2003-2005)Operating income breakdown (2005)(in RMB millions)
76,89381,019
32,655
40,269
53,681
20,56624,313
28,296
2,670 2,358 2,161
87,482
2003 2004 2005Corporate banking Personal banking
Treasury operations OthersSource: Company Annual Report
Note 1: As of December 31, 2005
93,049 56,704 4,664
335,192 343,116301,283
2,833,853
303,384
106,348
2,619,708
Normal loans Special mentionloans
Substandardloans
Doubtful loans Loss loans
2005 2004Corporate short-term loans (28.5%)
Corporate mediun to long-term loans (40.7%)
Discounted bills (11.9%)
Personal housing loans (13.6%)
Personal consumer loans (2.1%)
Overseas business (3.2%)
Average loan yield (2005)
Distribution of loans by products (2005) Loans by risk classification 2005/2004
Distribution of loans by industry (2005)
Source: Company Annual Report
Note 1: As of December 31, 2005
Manufacturing (20.1%)
Transportation and telecommunications (11.2%)
Power, gas and water gen and supplies (8.6%)
Retailing and wholesale (8.1%)
Property development (5.9%)
Social service organization (3.1%)
Construction (2.7%)
Personal loans (15.7%)
Other (24.6%)
4.61%3,98286,357Overseas operations
2.67%9,044339,123Discounted bills
5.83%29,060498,851Personal loans
5.32%133,1992,505,521Corporate loans
5.11%175,2853,429,852Total customer loans
Average yield
Interest income
Average balance
4.61%3,98286,357Overseas operations
2.67%9,044339,123Discounted bills
5.83%29,060498,851Personal loans
5.32%133,1992,505,521Corporate loans
5.11%175,2853,429,852Total customer loans
Average yield
Interest income
Average balance
(in RMB millions, except percentages)
(in RMB millions)
NPL decreased significantly in 2005

35
Figure 4 ICBC Stock Price after IPO (A share vs. H share)
¥0.0¥1.0¥2.0¥3.0¥4.0¥5.0¥6.0¥7.0¥8.0¥9.0
¥10.0
CNY/Share
ICBC: A shares vs H shares
601398 CH
1398 HK

36
Appendix A1 – ICBC Consolidated Financial Information Consolidated Income Statements(Expressed in millions of Renminbi, unless otherwise stated)
2003 2004 2005 2005 2006
Interest income 189,069 204,889 240,202 112,283 129,038
Interest expenses (66,361) (70,161) (86,599) (40,558) (52,530)
Net interest income 122,708 134,728 153,603 71,725 76,508
Fee and commission income 7,059 9,780 12,376 5,502 8,761
Fee and commission expense (1,435) (1,572) (1,830) (635) (895)
Net fee and commission income 5,624 8,208 10,546 4,867 7,866
Other operating income 4,452 5,023 7,471 4,500 1,376
Total operating income 132,784 147,959 171,620 81,092 85,750
Total operating expenses, including
Operating expenses (62,575) (62,639) (81,585) (33,964) (34,696)
Provisions for impairment losses on:
Loans and advances to customers (34,914) (30,511) (26,589) (11,558) (11,645)
Others (1,379) (348) (425) (165) (573)
Operating profit 33,916 54,461 63,021 35,405 38,836
Share of profits and losses of associates (32) (50) 5 - 5
Profit before tax 33,884 54,411 63,026 35,405 38,841
Income tax expense (11,292) (23,193) (25,007) (9,957) (13,199)
Profit for the year 22,592 31,218 38,019 25,448 25,642
Attributable to:
Equity holders of the Bank 22,472 30,863 37,555 25,161 25,399
Minority interests 120 353 464 287 243
22,592 31,216 38,019 25,448 25,642
Earnings per share attributable to equity holders Basic and diluted (RMB) 0.09 0.12 0.15 0.10 0.10
Year ended December 31, Six months ended June 30,

37
Appendix A2
Source: ICBC Global Offering Prospectus, Oct 16, 2006
Consolidated Balance Sheets(Expressed in millions of Renminbi, unless otherwise stated)
June 30,
2003 2004 2005 2006
Assets
Cash and balances with central banks 457,816 508,616 553,873 598,269
Due from banks and other financial institutions 66,009 69,430 132,162 131,133
Reverse repuchase agreement 71,239 21,764 89,235 105,542
Loans 3,402,277 3,707,748 3,289,553 3,461,080
- Provisions (636,222) (598,557) (83,692) (85,738)
Net loans 2,766,055 3,109,191 3,205,861 3,375,342
Investment securiteis 1,044,730 1,230,416 2,305,689 2,657,819
Income tax recoverable 427 - - -
Investment in associates 274 117 120 125
Property and Equipment 77,767 75,579 92,984 88,709
Deferred income tax assets 27,381 8,805 - -
Other assets 45,253 45,406 76,207 97,686
Total Assets: 4,556,951 5,069,324 6,456,131 7,054,625
Due to a central bank 32,383 28,402 - -
Due to banks & other financial institutions 219,009 205,695 232,910 367,218
Repurchase agreements 16,253 26,339 32,301 11,622
Certificates of deposits 3,376 3,680 5,704 6,991
Due to Customers 4,706,861 5,176,282 5,736,866 6,119,038
Income tax payable 84 2,792 14,641 12,812
Deferred income tax liabilities - - 1,418 270
Debt issued - 3,294 38,076 37,987
Other liabilities 118,119 130,885 134,339 169,222
Total Liabilities: 5,096,085 5,577,369 6,196,255 6,725,160
Issued share capital/paid-up capital 160,671 160,669 248,000 286,509
Reserves 17,151 15,334 2,559 19,681
Retained profits/(accumulated loss) (718,571) (687,716) 5,280 19,183
Equity attributable to equity holde: (540,749) (511,713) 255,839 325,373
Minority interest 1,615 3,668 4,037 4,092
Total Equity: (539,134) (508,045) 259,876 329,465
Total Liabilities and Equity: 4,556,951 5,069,324 6,456,131 7,054,625
December 31,

38
Appendix A3 – Financial Indicators & Miscellaneous Asset Data
Source: Company Data
2006 2005 2004 2003Profitability Indicator (%)
Return on Average Total Assets 0.71 0.66 0.65 N/A Return on Weighted Average Equity 15.37 N/A N/A N/A Net Interest Spread 2.29 2.58 2.54 2.59Net Interest Margin 2.39 2.61 2.55 2.59Ratio of Net Fee and Commission Income to Operating Income 9 6.14 5.55 4.24Cost-to-income Ratio 36.3 40.1 34 38.8
Assets Quality Indicator (%)
Non-Performing Loans (“NPL”) Ratio 3.79 4.69 21.16 24.24Allowance to NPL 70.56 54.2 76.28 77.15Total Loan Reserve Ratio 2.68 2.54 16.14 18.7
Capital Adequacy Ratio (%)
Core Capital Adequacy Ratio 12.23 8.11 N/A N/A Capital Adequacy Ratio 14.05 9.89 N/A N/A Total Equity to Total Assets Ratio 6.27 4.03 N/A N/A Net core capital 462,019 255,586 N/A N/A Net weighted-average risk assets 3,779,170 3,152,206 N/A N/A
* Data for 2006 reflects financial situation for the entire fiscal year 2006
Dec. 31, 2005 Bank of China China Construction Bank Hang Seng Bank *Total risk-adjusted assets 3,131,002.0 2,562,153.0 291,570.0
Tier 1 capital 252,970.0 284,307.0 30,269.0
Tier 1 capital/total risk adjusted assets (%) 8.1% 11.1% 10.4%Loans 2,597,272.0 2,458,398.0 261,714.0
Risk-adjusted assets/loans 120.5% 104.2% 111.4%
* in HK dollar