the influence of the haz softening on the mechanical ... · the influence of the haz softening on...
TRANSCRIPT

Engineering Fracture Mechanics 71 (2004) 2053–2064
www.elsevier.com/locate/engfracmech
The influence of the HAZ softening on themechanical behaviour of welded jointscontaining cracks in the weld metal
D.M. Rodrigues *, L.F. Menezes, A. Loureiro
Departamento de Engenharia Mecanica, Universidade de Coimbra, P�olo II––Pinhal de Marrocos, Coimbra 3030, Portugal
Received 26 February 2002; received in revised form 3 June 2003; accepted 30 September 2003
Abstract
The mechanical behaviour of welds containing cracks was analysed through the numerical simulation of the three-
point bending tests of welded specimens. This paper presents the mechanical model and the methodology used for the
numerical simulation of the tests. The variation in crack driving force of cracked welds is studied as a function of the
strength mismatch in the heat affected zone and of the crack position relative to the weld metal/heat affected zone
interface. This analysis was performed with recourse to the numerical calculation of the J integral.
� 2003 Elsevier Ltd. All rights reserved.
Keywords: Elastoplasticity; Crack-driving force; Numerical simulation; Weldments; Heat affected zone
1. Introduction
In any weld produced with a fusion process, the mechanical properties in the heat affected zone (HAZ)
can drastically differ from the unaffected base metal (BM), depending on the heating and cooling conditions
imposed by the welding process and on the structure and chemical composition of the base plate. This is
common in high strength steels in which slow cooling rates can cause a considerable loss in the yield
strength of the base plate [1,2]. In this context, it is important to understand the effect of HAZ strength loss
in the overall mechanical behaviour of the welds, in order to predict its strength and toughness. However,
most of the published studies on the mechanical behaviour of welds have neglected the effect of the HAZ.They consider the welds as a bi-material system constituted by the weld metal (WM) and base metal, or
were focused only in very specific situations in which the HAZ is considered as a very narrow portion of
material with a precise mismatch level. There are few extensive studies concerning the variation of the weld
fracture strength for a wide range of mismatch conditions and HAZ widths. In the present work, the in-
fluence of HAZ softening on the crack driving force of welds, with cracks in the weld metal centreline, is
* Corresponding author. Fax: +351-239-790-701.
E-mail address: [email protected] (D.M. Rodrigues).
0013-7944/$ - see front matter � 2003 Elsevier Ltd. All rights reserved.
doi:10.1016/j.engfracmech.2003.09.002
2054 D.M. Rodrigues et al. / Engineering Fracture Mechanics 71 (2004) 2053–2064
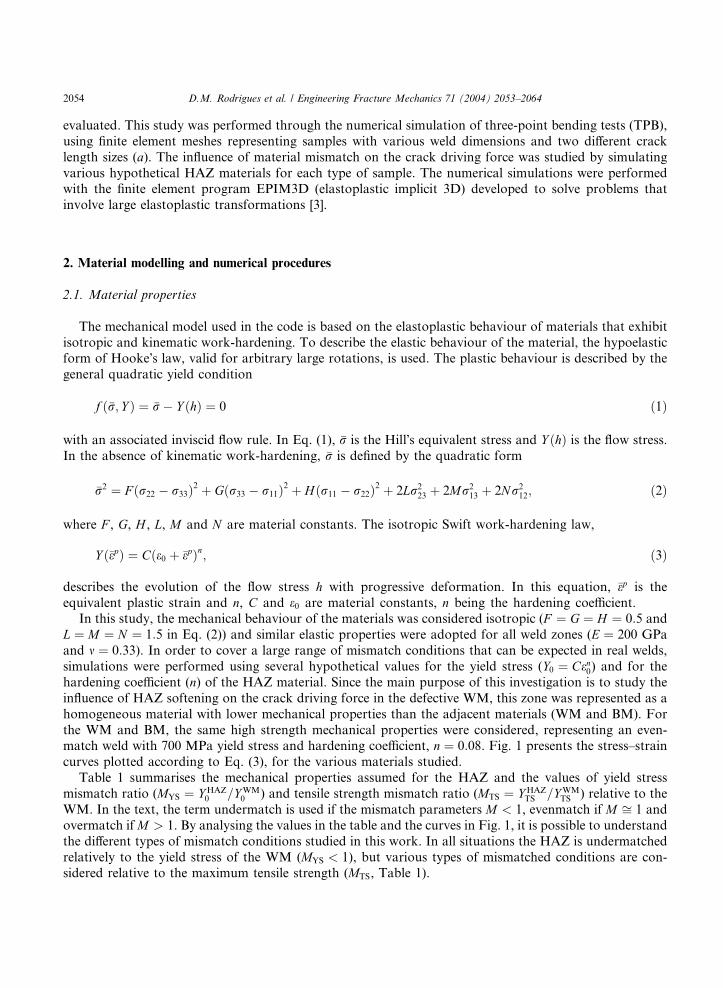
evaluated. This study was performed through the numerical simulation of three-point bending tests (TPB),
using finite element meshes representing samples with various weld dimensions and two different crack
length sizes (a). The influence of material mismatch on the crack driving force was studied by simulating
various hypothetical HAZ materials for each type of sample. The numerical simulations were performedwith the finite element program EPIM3D (elastoplastic implicit 3D) developed to solve problems that
involve large elastoplastic transformations [3].
2. Material modelling and numerical procedures
2.1. Material properties
The mechanical model used in the code is based on the elastoplastic behaviour of materials that exhibit
isotropic and kinematic work-hardening. To describe the elastic behaviour of the material, the hypoelasticform of Hooke�s law, valid for arbitrary large rotations, is used. The plastic behaviour is described by the
general quadratic yield condition
f ð�r; Y Þ ¼ �r� Y ðhÞ ¼ 0 ð1Þ
with an associated inviscid flow rule. In Eq. (1), �r is the Hill�s equivalent stress and Y ðhÞ is the flow stress.
In the absence of kinematic work-hardening, �r is defined by the quadratic form
�r2 ¼ F ðr22 � r33Þ2 þ Gðr33 � r11Þ2 þ Hðr11 � r22Þ2 þ 2Lr223 þ 2Mr2
13 þ 2Nr212; ð2Þ
where F , G, H , L, M and N are material constants. The isotropic Swift work-hardening law,
Y ð�epÞ ¼ Cðe0 þ �epÞn; ð3Þ
describes the evolution of the flow stress h with progressive deformation. In this equation, �ep is the
equivalent plastic strain and n, C and e0 are material constants, n being the hardening coefficient.In this study, the mechanical behaviour of the materials was considered isotropic (F ¼ G ¼ H ¼ 0:5 and
L ¼ M ¼ N ¼ 1:5 in Eq. (2)) and similar elastic properties were adopted for all weld zones (E ¼ 200 GPa
and m ¼ 0:33). In order to cover a large range of mismatch conditions that can be expected in real welds,
simulations were performed using several hypothetical values for the yield stress (Y0 ¼ Cen0) and for the
hardening coefficient (n) of the HAZ material. Since the main purpose of this investigation is to study the
influence of HAZ softening on the crack driving force in the defective WM, this zone was represented as a
homogeneous material with lower mechanical properties than the adjacent materials (WM and BM). For
the WM and BM, the same high strength mechanical properties were considered, representing an even-match weld with 700 MPa yield stress and hardening coefficient, n ¼ 0:08. Fig. 1 presents the stress–strain
curves plotted according to Eq. (3), for the various materials studied.
Table 1 summarises the mechanical properties assumed for the HAZ and the values of yield stress
mismatch ratio (MYS ¼ Y HAZ0 =YWM
0 ) and tensile strength mismatch ratio (MTS ¼ Y HAZTS =YWM
TS ) relative to the
WM. In the text, the term undermatch is used if the mismatch parameters M < 1, evenmatch if M ffi 1 and
overmatch ifM > 1. By analysing the values in the table and the curves in Fig. 1, it is possible to understand
the different types of mismatch conditions studied in this work. In all situations the HAZ is undermatched
relatively to the yield stress of the WM (MYS < 1), but various types of mismatched conditions are con-sidered relative to the maximum tensile strength (MTS, Table 1).

Fig. 1. Stress–strain curves for the various materials considered in the study. The grey curve corresponds to the mechanical behaviour
of the adjacent materials (BM and WM, Y adj0 ¼ 700 MPa, n ¼ 0:08) and the black curves represent the hypothetical properties con-
sidered for the HAZ (Table 1).
D.M. Rodrigues et al. / Engineering Fracture Mechanics 71 (2004) 2053–2064 2055
2.2. Finite element modelling
Three different material domains corresponding to the WM, HAZ and BM compose the finite element
meshes used in this research, as is shown in Fig. 2. Specimens with deep cracks (a=W ¼ 0:5, Fig. 2) and
Fig. 2. Finite element mesh used in the numerical simulation of the three-point bend tests of deep crack specimens. a represents the
crack depth and L the ligament length. The finite element discretisation was performed using 20-node hexahedron elements.
Table 1
Material properties of the HAZ and stress mismatch ratios: yield stress mismatch (MYS ¼ Y HAZ0 =YWM
0 ) and tensile strength mismatch
(MTS ¼ YHAZTS =YWM
TS )
Y ZTA0 400 MPa 500 MPa 600 MPa
n 0.08 0.12 0.16 0.08 0.12 0.16 0.08
MYS 0.57
undermatch
0.71
undermatch
0.8
undermatch
MTS 0.65
undermatch
0.79
undermatch
0.98
evenmatch
0.81
undermatch
0.99
evenmatch
1.23
overmatch
0.97
evenmatch

2056 D.M. Rodrigues et al. / Engineering Fracture Mechanics 71 (2004) 2053–2064
shallow cracks (a=W ¼ 0:15) located in the WM centreline were simulated. The bending test was simulated
imposing displacements (D) on the x-direction to the nodes located at (y < d1, x ¼ L), and restricting the
movement in the same direction of the nodes over segment d2 in x ¼ �a. During these numerical simula-
tions, the movement in the z-direction of the nodes located in the z ¼ 0 and B=2 planes was restricted. Thisrequirement insures that a plane strain state prevails at the crack tip, simulating the most severe conditions
for fracture [4].
Several HAZ and WM widths were considered in the numerical simulations. In Fig. 2, lHAZ is the HAZ
width and lmin represents the distance from the crack tip to the soft zone, which is equal to one half of the
WM width (lmin ¼ lWM=2). The different samples are identified using simple codes of the form
HAZXWMY , where X and Y represent the HAZ and WM widths, respectively. For example, a sample for
which lHAZ ¼ 2 mm and lWM ¼ 10 mm is identified through the code HAZ2WM10.
Finally, the TPB test of homogeneous samples with the same mechanical properties of the WM was alsosimulated. The results obtained with these tests were adopted as the reference behaviour, since the main
purpose of this work was to study the crack driving force variation in the weld zone as a function of the
HAZ softening.
3. Results and discussion
In the study of fracture problems, Rice�s J integral [5] is a useful parameter for quantifying the globalload applied to a crack under different specimen characteristics. In this work, the J integral was calculated
using the equivalent domain integral method [6–9]. As expected for incremental plasticity [10,11] in all
simulations, it was observed that the computed J integral is path-independent outside the finitely deformed
zone at the crack tip. For the weld geometries considered in this study, the J integral, which was computed
along contours remote from the crack, was used as global loading parameter to compare results from the
different specimens.
3.1. Samples with different HAZ widths (lHAZ)
The graphs in Figs. 3 and 4 show the J–D curves obtained in the TPB test of homogeneous and welded
samples (HAZ2WM10, HAZ5WM10, HAZ8WM10). These results correspond to the welds with HAZyield stress (Y HAZ
0 ) of 400, 500 and 600 MPa and nHAZ ¼ 0:08. In all simulations, the load was increased
until a total displacement (D) of 0.6 mm was reached. For specimens with the most severe undermatch
conditions in the HAZ (Y HAZ0 ¼ 400 MPa, nHAZ ¼ 0:08) the J–D curves are plotted until a total displace-
ment D ¼ 1 mm is attained, in order to verify if any change in the crack driving force exists with progressive
strain hardening of the HAZ.
By analysing the graphs in Fig. 3, where the results obtained for the samples with deep cracks
(a=W ¼ 0:5) are presented, it is possible to conclude, that the curves for the welded samples are very close to
the WM homogeneous results until D ¼ 0:6 mm. The exception to this is in situations with the most severeundermatch conditions in the HAZ (Y HAZ
0 ¼ 400 MPa), for which it is possible to observe some drop in the
J values since D ¼ 0:4 mm. By comparing the results relative to the samples with different HAZ widths
(HAZ2, HAZ5, HAZ8 samples), it is possible to conclude that the crack driving force is independent of the
HAZ width, since the curves corresponding to the different samples are very close, at least for small dis-
placements.
The results in Fig. 4, relative to samples with shallow cracks (a=W ¼ 0:15), show a different trend. In
fact, when the HAZ width is larger than 2 mm for the most severe yield stress undermatch situations, it is
possible to observe a severe drop in the J curves relatively to the WM homogeneous sample curve, sinceD ¼ 0:3 mm. When the HAZ have only 2 mm width, the J–D curve comes very close to the homogeneous

Fig. 3. J–D curves for samples with deep cracks (a=W ¼ 0:5), various HAZ widths (lHAZ ¼ 2, 5 and 8 mm) and lWM ¼ 10 mm. The
results were obtained for three different yield stress values of the HAZ (Y HAZ0 ¼ 400, 500 and 600 MPa) and considering the same value
of the hardening coefficient nHAZ ¼ 0:08 in all the simulations.
D.M. Rodrigues et al. / Engineering Fracture Mechanics 71 (2004) 2053–2064 2057

Fig. 4. J–D curves for samples with shallow cracks (a=W ¼ 0:15), various HAZ widths (lHAZ ¼ 2, 5 and 8 mm) and lWM ¼ 10 mm. The
results were obtained for three different yield stress values of the HAZ (Y HAZ0 ¼ 400, 500 and 600 MPa) and considering the same value
of the hardening coefficient nHAZ ¼ 0:08 in all the simulations.
2058 D.M. Rodrigues et al. / Engineering Fracture Mechanics 71 (2004) 2053–2064

D.M. Rodrigues et al. / Engineering Fracture Mechanics 71 (2004) 2053–2064 2059
one, independently of the mismatch values. This shows some influence of the HAZ width on the crack tip
loading for shallow crack specimens.
In deep cracked specimens, the weakest section of the specimen is the part containing the crack, making
it difficult for the spreading of plastic deformation to the HAZ, unless severe HAZ undermatching exists.The cracked cross section of shallow cracked specimens is more resistant than that of the deep cracked
specimens, and the load transfer to the HAZ is more effective resulting in larger plastic deformation in this
zone. In this case, the HAZ width assumes some importance. If the plastic deformation in this zone is
significant, the strain hardening exponent of the HAZ may be relevant.
The J–D curves obtained during the TPB test of the HAZ5WM10 samples are plotted in Figs. 5 and 6.
These consider two yield stress mismatch values (Y HAZ0 ¼ 400 and 500 MPa), and different values of the
strain hardening exponent of the HAZ (nHAZ ¼ 0:08, 0.12, 0.16), for specimens with deep and shallow
cracking. By analysing the figures, it is possible to conclude that there is almost no influence of thehardening of the HAZ on the crack driving force, since the different curves are almost superposed, mainly,
for low imposed displacements D. Once more, shallow cracked specimens are more influenced by the
mismatching due to their better capacity to transfer load, and consequently deformation, to the HAZ.
Fig. 5. J–D curves for the samples HAZ5WM10 having different yield strength mismatch factors and strain hardening exponents
(nHAZ ¼ 0:08, 0.12 and 0.16). Deep crack specimens (a=W ¼ 0:5).

Fig. 6. J–D curves for the samples HAZ5WM10 having different yield strength mismatch factors and strain hardening exponents
(nHAZ ¼ 0:08, 0.12 and 0.16). Shallow crack specimens (a=W ¼ 0:15).
2060 D.M. Rodrigues et al. / Engineering Fracture Mechanics 71 (2004) 2053–2064
3.2. Samples with different WM widths (lWM)
The variation of the crack driving force, analysed through the J–D curves, was also studied as a function
of the WM width, more precisely, as a function of the distance of the crack tip to the WM/HAZ interface
(lmin ¼ lWM=2). The J–D curves for specimens with lWM ¼ 6, 8 and 10 mm and HAZ widths equal to 2 and 5
mm are shown in Fig. 7 for the samples with deep cracks, and in Fig. 8 for the samples with shallow cracks.
Since the previous results show that the crack driving force is essentially conditioned by the yield stressmismatch (MYS) between the WM and HAZ, the numerical results presented in Figs. 7 and 8 were obtained
considering different HAZ yield stress values (Y HAZ0 ¼ 400, 500 and 600 MPa), and the same value for the
hardening coefficient nHAZ ¼ 0:08.Fig. 7, which is relative to samples with deep cracks, shows that the J values decrease relatively to the
homogeneous sample J values when the crack tip approaches the WM/HAZ interface (WM8 and WM6
samples), mainly in the high HAZ undermatch condition. It is also possible to observe that the J variation
is almost independent of the HAZ width (results are close for HAZ2 and HAZ5 samples). By analysing the

Fig. 7. J–D curves for samples with deep cracks (a=W ¼ 0:5), various HAZ (lHAZ ¼ 2, 5 and 8 mm) and WMwidths (lWM ¼ 6, 8 and 10
mm). The results were obtained for three different yield stress values of the HAZ (Y HAZ0 ¼ 400, 500 and 600 MPa) and considering the
same value of the hardening coefficient nHAZ ¼ 0:08 in all the simulations.
D.M. Rodrigues et al. / Engineering Fracture Mechanics 71 (2004) 2053–2064 2061
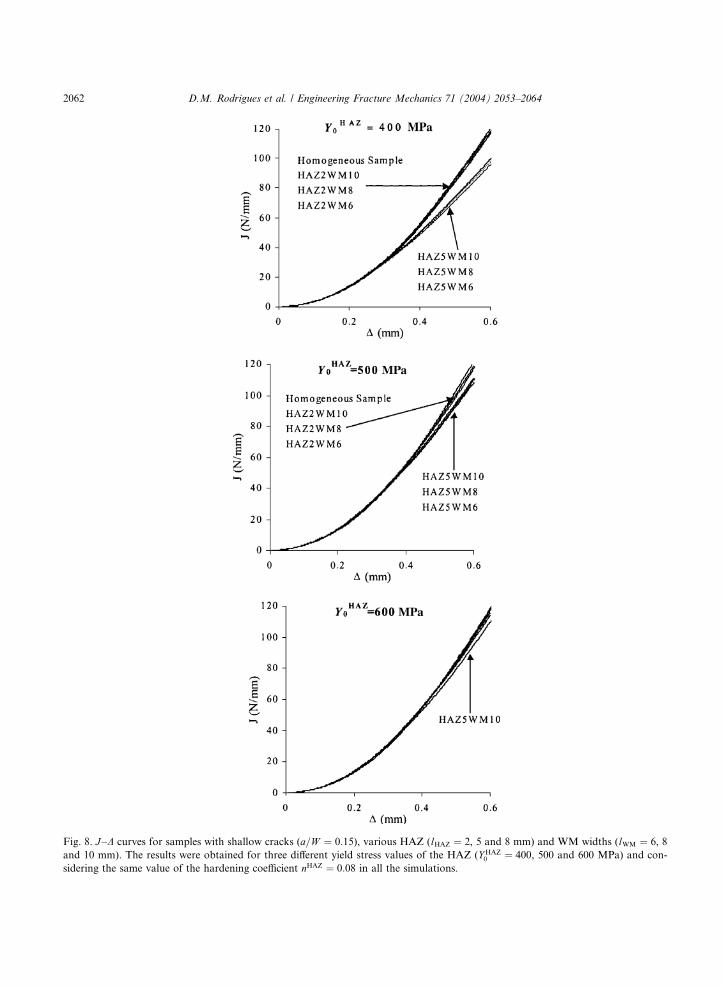
Fig. 8. J–D curves for samples with shallow cracks (a=W ¼ 0:15), various HAZ (lHAZ ¼ 2, 5 and 8 mm) and WM widths (lWM ¼ 6, 8
and 10 mm). The results were obtained for three different yield stress values of the HAZ (Y HAZ0 ¼ 400, 500 and 600 MPa) and con-
sidering the same value of the hardening coefficient nHAZ ¼ 0:08 in all the simulations.
2062 D.M. Rodrigues et al. / Engineering Fracture Mechanics 71 (2004) 2053–2064

Fig. 9. J–D curves obtained with deep cracked samples: HAZWM (lHAZ ¼ 1, lWM ¼ 10 mm), HAZ2WM12 (lHAZ ¼ 2, lWM ¼ 12 mm),
HAZ2WM10 (lHAZ ¼ 2, lWM ¼ 10 mm) and WM homogeneous sample. HAZ material (Y HAZ0 ¼ 400 MPa, nHAZ ¼ 0:08).
D.M. Rodrigues et al. / Engineering Fracture Mechanics 71 (2004) 2053–2064 2063
results relative to samples with shallow cracks, presented in Fig. 8, it is possible to conclude that the drop in
the J–D curves is independent of the distance lmin (results are close for WM6, WM8 and WM10 samples),
being mainly affected by the HAZ width.
The results obtained with the deep crack samples (a=W ¼ 0:5), suggest that the influence of the HAZ
softening on the fracture behaviour of the specimens is essentially conditioned by the amplitude of the yield
stress mismatch (rHAZ0 =rWM
0 ), and by the distance of the crack tip to the soft zone (lmin), independently ofthe width of this zone. In order to verify if the crack driving force is effectively independent of the soft zone
width, and for which values of lWM (or lmin) this influence disappears, new simulations were performed
using two new types of meshes. The first mesh represents a weld with lHAZ ¼ 2 mm and lWM ¼ 12 mm and
will be identified by the code HAZ2WM12. The other mesh represents a weld with an infinite HAZ width
(lHAZ ¼ 1) and lWM ¼ 10 mm (WM/HAZ bi-material system) identified by the code WMHAZ. The results
corresponding to these new simulations are presented in Fig. 9, together with the results of the WM ho-
mogeneous sample and HAZ2WM10. By comparing the curves, it is possible to observe that the results
obtained with the sample HAZ2WM12 approach the results registered in the WM homogeneous sample.This proves that when the distance from the crack tip to the soft zone increases, the influence of the HAZ
on the crack driving force vanishes. By comparing the results of the samples HAZ2WM10 (lHAZ ¼ 2 mm)
and HAZWM (lHAZ ¼ 1), it is also possible to confirm that the crack driving force is independent of the
soft zone width, since the curves for both samples are very close.
4. Conclusions
A large variety of weld dimensions and mismatch conditions of the heat affected zone relative to the
welding metal were addressed in this investigation, in order to investigate the influence of the occurrence of
HAZ softening on the fracture resistance of welds with cracked WM.
The results presented in Figs. 3 and 5 are relative to samples with deep cracks. They show that only a
strong yield stress undermatch of the HAZ relative to the WM (MYS ¼ 0:57) can originate a drop in the Jvalues of the weld samples relative to those registered in a sample of homogeneous WM, when loaded up to
the same imposed displacement value (D). This occurs even when the soft HAZ structure has only 2 mm in
width, and is more pronounced when the distance of the crack tip to the HAZ is smaller. It was alsopossible to conclude that the crack driving force is independent of the HAZ width (Fig. 9).
2064 D.M. Rodrigues et al. / Engineering Fracture Mechanics 71 (2004) 2053–2064
On the other hand, the results obtained for the samples with shallow cracks (Figs. 4 and 6) show an
opposite trend. The drop in the J–D curves is clearly a function of the yield stress undermatch value, but
only occurs when the HAZ width is greater than 2 mm. The drop in the J–D curves relative to homogeneous
sample results is independent of the weld metal width. When the HAZ width is large, the drop in J–D curvesof shallow crack specimens is more pronounced than the one registered in deep crack samples.
Acknowledgements
The authors wish to acknowledge the sponsorship of Fundac�~ao para a Ciencia e a Tecnologia (FCT-
MCT).
References
[1] Thaulow C, Paauw AJ, Hauge M, Toyoda M, Minami F. Fracture property of HAZ-notched weld joint with mechanical mis-
matching––Part II. In: Schwalbe K-H, Koc�ak M, editors. Mis-matching of welds, ESIS 17. London: Mechanical Engineering
Publications; 1994. p. 417–32.
[2] Wojnowski D, Oh YK, Indacochea JE. Metallurgical assessment of the softened HAZ region during multipass welding. J Manuf
Sci Engng (ASME) 2000;122(2):310–5.
[3] Menezes LF, Fernandes JV, Rodrigues DM. Numerical simulation of tensile tests of pre-strained sheets. Mat Sci Engng A
1999;264(1–2):130–8.
[4] Hutchinson JW. Fundamentals of the phenomenological theory of non-linear fracture mechanics. ASME J Appl Mech
1983;50(4B):1042–51.
[5] Rice JR. A path independent integral and the approximate analysis of strain concentration by notches and cracks. J Appl Mech
1968;35(2):379–86.
[6] Li FZ, Shih CF, Needleman A. A comparison of methods for calculating energy releases rates. Engng Fract Mech 1985;21(2):405–
21.
[7] Nikishkov GP, Atluri SN. Calculation of fracture mechanics parameters for an arbitrary three-dimensional crack, by the
equivalent domain integral method. Int J Numer Meth Engng 1987;24(9):1801–21.
[8] Shivakumar KN, Raju IS. An equivalent domain integral method for three-dimensional mixed-mode fracture problems. Engng
Fract Mech 1992;42(6):935–59.
[9] Schmitt W, Kienzler R. The J -integral concept for elastic–plastic material behavior. Engng Fract Mech 1989;32(3):409–18.
[10] Stump DM, Zywicz E. J -integral computations in the incremental and deformation plasticity analysis of small-scale yielding.
Engng Fract Mech 1993;45(1):61–77.
[11] Shih CF, German MD. Requirements for a one parameter characterization of crack tip fields by the HRR singularity. Int J Fract
1981;17(1):27–43.