the input-output relation of primary nociceptive neurons
TRANSCRIPT

Copyright © 2020 the authors
Research Articles: Cellular/Molecular
The input-output relation of primarynociceptive neurons is determined by themorphology of the peripheral nociceptiveterminals
https://doi.org/10.1523/JNEUROSCI.1546-20.2020
Cite as: J. Neurosci 2020; 10.1523/JNEUROSCI.1546-20.2020
Received: 18 June 2020Revised: 19 October 2020Accepted: 21 October 2020
This Early Release article has been peer-reviewed and accepted, but has not been throughthe composition and copyediting processes. The final version may differ slightly in style orformatting and will contain links to any extended data.
Alerts: Sign up at www.jneurosci.org/alerts to receive customized email alerts when the fullyformatted version of this article is published.

1
The input-output relation of primary nociceptive neurons is determined by the morphology 1
of the peripheral nociceptive terminals 2
Abbreviated title: Structure to function of nociceptive terminal 3
Omer Barkai1,2, Rachely Butterman1,2, Ben Katz1,2, Shaya Lev1,2, and Alexander M. Binshtok1,2 4
1Department of Medical Neurobiology; Institute for Medical Research Israel-Canada, The 5
Hebrew University-Hadassah School of Medicine, Jerusalem, Israel, 91120; 2The Edmond and 6
Lily Safra Center for Brain Sciences, The Hebrew University of Jerusalem, Israel 7
8
Correspondence should be sent to: Alexander M. Binshtok, [email protected] 9
Number of Figures: 12 10
Number of words in: 11
Abstract: 236 12
Introduction: 650 13
Discussion: 1480 14
15
Conflicts of Interest: The authors declare no competing financial interests. 16
Acknowledgments: We would like to thank Dr. Ilya Fleidervish from the Ben Gurion University 17
and Dr. Idan Segev from the Hebrew University for helpful comments and fruitful discussion. 18
Funding sources: Support is gratefully acknowledged from the Israeli Science Foundation - 19
grant agreement 1470/17; Canadian Institutes of Health Research (CIHR), the International 20
Development Research Centre (IDRC), the Israel Science Foundation (ISF) and the Azrieli 21

2
Foundation - grant agreement 2545/18; the Deutsch-Israelische Projectkooperation program of 22
the Deutsche Forschungsgemeinschaft (DIP) grant agreement BI 1665/1-1ZI1172/12-1. 23
24

3
Abstract 25
The output from the peripheral terminals of primary nociceptive neurons, which detect and 26
encode the information regarding noxious stimuli, is crucial in determining pain sensation. The 27
nociceptive terminal endings are morphologically complex structures assembled from multiple 28
branches of different geometry, which converge in a variety of forms to create the terminal tree. 29
The output of a single terminal is defined by the properties of the transducer channels producing 30
the generation potentials and voltage-gated channels, translating the generation potentials into 31
action potential firing. However, in the majority of cases, noxious stimuli activate multiple 32
terminals; thus, the output of the nociceptive neuron is defined by the integration and 33
computation of the inputs of the individual terminals. Here we used a computational model of 34
nociceptive terminal tree to study how the architecture of the terminal tree affects the input-35
output relation of the primary nociceptive neurons. We show that the input-output properties of 36
the nociceptive neurons depend on the length, the axial resistance, and location of individual 37
terminals. Moreover, we show that activation of multiple terminals by a capsaicin-like current 38
allows summation of the responses from individual terminals, thus leading to increased 39
nociceptive output. Stimulation of the terminals in simulated models of inflammatory or 40
nociceptive hyperexcitability led to a change in the temporal pattern of action potential firing, 41
emphasizing the role of temporal code in conveying key information about changes in 42
nociceptive output in pathological conditions, leading to pain hypersensitivity. 43
44

4
Significance statement 45
Noxious stimuli are detected by terminal endings of primary nociceptive neurons, which are 46
organized into morphologically complex terminal trees. The information from multiple 47
terminals is integrated along the terminal tree, computing the neuronal output, which propagates 48
towards the CNS, thus shaping the pain sensation. Here we revealed that the structure of the 49
nociceptive terminal tree determines the output of nociceptive neurons. We show that the 50
integration of noxious information depends on the morphology of the terminal trees and how this 51
integration and, consequently, the neuronal output change under pathological conditions. Our 52
findings help to predict how nociceptive neurons encode noxious stimuli and how this encoding 53
changes in pathological conditions, leading to pain. 54
55

5
Introduction 56
Peripheral terminals of nociceptive neurons are key structures in detecting, translating and 57
transmitting noxious stimuli towards the CNS, thus setting the scene for the sensation of pain 58
(Woolf and Ma, 2007; Basbaum et al., 2009; Dubin and Patapoutian, 2010; Gold and Gebhart, 59
2010; Binshtok, 2011). Single nociceptive terminals combine into complex terminals trees, 60
which differ in number and form of their terminal branches. In some nociceptive terminal trees, 61
the terminals do not branch after leaving a fiber and terminate at the target organ with a single 62
terminal branch of different length (Zylka et al., 2005; Ivanusic et al., 2013; Alamri et al., 2015; 63
Olson et al., 2017; Alamri et al., 2018; Bouheraoua et al., 2019). Other nociceptive terminals do 64
branch, creating a more complex termination (Ivanusic et al., 2013; Alamri et al., 2015; Olson et 65
al., 2017; Alamri et al., 2018). Thus, noxious stimuli activate morphologically complex excitable 66
structures, which differ among primary nociceptive neurons. Importantly, morphology of 67
terminal trees changes with age or under pathological conditions (Cain et al., 2001; Chartier et 68
al., 2018; Lakatos et al., 2020; Leibovich et al., 2020). 69
It has been shown that the morphology of dendrites and axons of central neurons (Manor et al., 70
1991; Mainen and Sejnowski, 1996; Williams and Stuart, 2003; Gidon and Segev, 2012; Jadi et 71
al., 2012; Ferrante et al., 2013) and peripheral mechanosensitive neurons (Lesniak et al., 2014) 72
shape their input-output properties. We, therefore, hypothesized that output of the nociceptive 73
neuron might depend on the integration of outputs from the individual terminal branches and that 74
this integration depends on the structure of the individual terminal and the morphology of the 75
terminal tree. 76
Noxious stimuli are detected by activation of a specific repertoire of transducer channels 77
expressed in the terminals. The biophysical properties and spatial distribution of functional 78

6
transducer and voltage-gated channels expressed by nociceptive neurons are essential factors in 79
defining the gain of the terminals, i.e., the number and pattern of action potential firing resulting 80
from activation of the terminal by noxious stimuli (Dib-Hajj et al., 2010; Waxman and Zamponi, 81
2014; Goldstein et al., 2019). The current electrophysiological and imaging approaches allow 82
studying how a single terminal encodes the information (Vasylyev and Waxman, 2012; 83
Goldstein et al., 2019). Skin-nerve (Reeh, 1986) or teased fiber preparations (Tal and Devor, 84
1992) permit studying how the whole nociceptive terminal trees respond to stimulation. 85
However, due to technical constraints, it is still unclear what is the contribution of a single 86
terminal location and electrical properties to the output of the terminal tree, and how different 87
terminal tree architectures or a change in the specific architecture of the terminal tree relate to 88
nociceptive function. 89
Here we implemented a realistic computational model of the nociceptive terminal tree, which we 90
build based on known terminal physiology in vitro (Vasylyev and Waxman, 2012; Goldstein et 91
al., 2017) and in vivo (Barkai et al., 2017; Goldstein et al., 2019) to study structure-function 92
relation of nociceptive terminals. We stimulated terminals of different terminal trees by a 93
capsaicin-like stimulation and defined the output of the neurons by registering the resulting 94
activity at the central terminal of the modeled nociceptive neuron. We show that the length and 95
the axial resistance of individual terminal branches affect the response of the whole terminal tree 96
to a capsaicin-like current. Our model predicts that the activation of a longer terminal leads to a 97
higher firing rate at the central terminals. Activation of the terminals with lower axial resistance 98
leads to a decreased response. Our model also suggests that the activation of multiple terminals 99
allows summation of responses of each individual terminal, thus facilitating the nociceptive 100
response. Perturbations correlated with inflammatory and neuropathic conditions increase the 101

7
gain of nociceptive input-output function and change the temporal pattern of the spike trains. 102
Our results predict how noxious stimuli are integrated by nociceptive neurons and how structural 103
changes of the nociceptive neurons in pathological conditions can modify nociceptive responses. 104
105
106

8
Materials and Methods 107
Simulations were performed using passive and active properties of the NEURON environment-108
based compartmental nociceptor model, which we previously developed (Barkai et al., 2017; 109
Goldstein et al., 2019), with adaptations described below. Briefly, we developed a biophysically 110
realistic multi-compartment model of an unmyelinated axon, including the terminal tree (Barkai 111
et al., 2017; Goldstein et al., 2019). The nociceptor morphology consisted of a 25 m diameter 112
soma-like compartment, connected to a stem axon expanding to peripheral and central axons 113
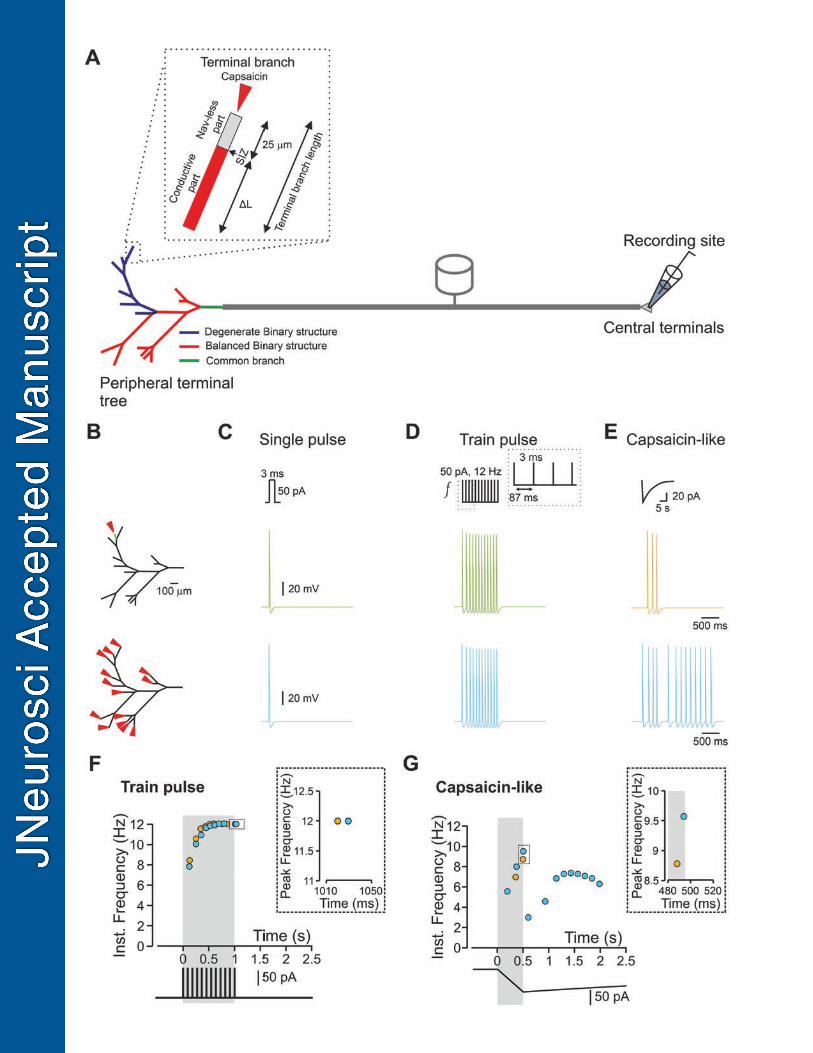
which join at a T-junction bifurcation site (Figure 1A). 114
Morphology 115
The morphology of the nociceptive neuron was based on our adaptation of Sundt et al.’s model 116
of a nociceptive neuron (Sundt et al., 2015; Barkai et al., 2017). A cylindric soma (25 m 117
diameter, 25 m length) was connected to a stem compartment (0.8 m diameter, 75 m length) 118
which bifurcate to a T-junction, creating two branches, the first branch (0.8 m diameter, 100 119
m length) connected to a peripheral axon (0.8 m diameter, 5 mm length) and the second 120
branch (0.4 m diameter, 100 m length) connected to a central axon (0.4 m, 5 mm length). All 121
of the abovementioned compartments, apart from the soma, were subdivided into 100 segments 122
each. The peripheral axon was then connected to a terminal tree structure, as described below. 123
Terminal tree structures 124
For the “realistic” type of the terminal tree, which was reconstructed according to one of our 125
arbitrary experimental observations (Barkai et al., 2017), the distal axon ending tapered at its end 126
and expanded into a terminal tree composed of 27 branches. For proper electrical propagation 127

9
from the terminal tree to the peripheral axon, these two compartments were connected by a 128
tapered cone-like axon with a linearly changing diameter over 100 μm of length. 129
The branches of the terminal tree were of variable lengths (50 - 300 μm) and of a diameter of 130
0.25 μm. These branches included 13 mother branches, which were connected from both ends to 131
other branches and terminal branches (see below), which were connected at the proximal end to a 132
mother branch and had a free-nerve ending on the other end (Figure 1A). 133
Binary tree models: Balanced and degenerate binary tree structures were generated in and 134
simulated in PyNeuron. All terminal tree branches, unless otherwise mentioned, were identical in 135
length (50 m). Binary tree structures were changed according to the number of their bifurcation 136
stages (nl), which controlled the total number of terminal branches (nTB) according to nTB = 2nl-1 137
(Jarvis et al., 2018). 138
The terminal branches of all types consisted of two sections separated by the spike initiation 139
zone (SIZ, (Goldstein et al., 2019): a 25 m long compartment which consisted of all the active 140
conductances described below, but that did not contain voltage-gated sodium channel (Nav) 141
conductances (Nav-less compartment) and a “conductive” compartment connecting between the 142
Nav-less compartment and the mother branch (Figure 1A). The conductive compartment 143
possessed all the active conductances described below. In some experiments, the length of either 144
Nav-less or conductive compartments on all their properties was changed. 145
The 25 m Nav-less compartment of the terminal branches was sub-divided into 2.5 m 146
segments (10 segments). The conductive compartment was subdivided into 5 m segments; thus, 147
the number of segments changed according to the length of the compartment. 148
149

10
Passive membrane properties 150
The passive conductance equilibrium potential was set to −60 mV (Gudes et al., 2015). The 151
simulated resting potential was −58 mV, in line with our experimental results (Barkai et al., 152
2017). 153
Membrane capacitance of 1μF cm−2 was set for all compartments. Passive membrane resistance 154
of 10000 Ω cm−2 was set for all compartments apart from the terminal branch, which has a 4-fold 155
somatic membrane resistance (Vasylyev and Waxman, 2012). Axial resistance (Ra) in all 156
compartments, apart from the terminal branch, was 150 Ω cm. This is a generalized value 157
representing the suggested Ra value for the mammalian cytoplasm (about 100 Ω cm; Jamieson 158
et al., 2003); the Ra value for the cytosol of DRG neurons (123 Ω; Choi and Waxman, 2011) and 159
a suggested Ra value for small-diameter fibers (200 Ω cm; Vasylyev and Waxman, 2012). The 160
axial resistance of the terminal branch (RaTB) was set to 15-fold of Ra (RaTB = 2.25 MΩ cm, see 161
below). In some experiments, the value of Ra of the passive and conductive parts of the 162
terminal branch was changed, and its effect on neuronal excitability was examined. 163
Calculation of the terminal branch RaTB: 164
It has been demonstrated that the insertion of mitochondria into the dendrite increases Ra of the 165
dendrite 15-fold (Bekkers, 2011). This experimental evidence is in line with our calculations for 166
a terminal branch: we considered that the axial resistance of the terminal branch, RaTB, may be 167
increased in a state in which the axoplasmic medium of the terminal branch is populated with 168
intracellular organelles (i.e., mitochondria). The ratio between the axial terminal resistance with 169
( ) and without mitochondria ( ) is inversely proportional to the axonal radial 170
plane surface area: 171
∝ − ∙

11
where A represents the axonal radial plane surface, “term+mit” and “term” denote the terminal 172
axon with or without intracellular mitochondria respectively and is the number of mitochondria 173
per length unit of the terminal branch while the cylinder surface area is given by the following 174
equation: 175
=
where x is a variable representing the terminal axons or mitochondrion and is the radius of the 176
specificied variable cylinder x. 177
In a condition in which there are no mitochondria within the terminal branch, A is, 178
=
When mitochondria are present, the area is reduced by the number of mitochondria (n) 179
aggregated within the branch compartment, depending on mitochondrion radius (rmit) and 180
therefore is, 181
− ∙ = − ∙
Thus, the ratio between the axial terminal branch resistance with (Ra ) and without 182
mitochondria (Ra ) is: 183
( ) = − ∙ = − ∙ = 11 − ∙
184
According to Heppelmann (Heppelmann et al., 1990) and Barrientos and Court (Barrientos et al., 185
2011), the mitochondrion radius in nociceptive terminals is ~0.1 186

12
The terminal branch radius is set in our model to = 0.25 (see ‘Terminal tree 187
structures’ section above). 188
189
Finally, according to Heppelmann et al. (Heppelmann et al., 1994)see Figure 1B), we consider 190
that either 5 or 6 mitochondria are situated within a length unit of a terminal axon (n = 5 or 6), 191
assuming maximal mitochondria density in nociceptive terminal branches. 192
Thus 193
(5) = 5 ; (6) = 25
194
For a generalized approximation, we used the mean between the two cases (5 and 25): 195
= 15
196
Active conductances 197
The model neuron of all tree structures includes the following Hodgkin-Huxley-type ion 198
channels used in Barkai et al. (Barkai et al., 2017) and Goldstein et al. (Goldstein et al., 2019): 199
TTX-sensitive sodium current (INattxS), TTX-s sensitive persistent sodium current (INaP), Nav1.9 200
TTX-r sodium channels (INav1.9) and Nav1.8 TTX-r sodium channels (INav1.8). All channels 201
parameters of the sodium currents were adapted from Herzog et al. (Herzog et al., 2001) and 202
Baker et al. (Baker, 2005). Three types of potassium channels included: (i) the delayed rectifier 203
channel (IKDR) adapted from (Herzog et al., 2001); (ii) An A-type potassium channel (IKA) 204

13
adapted from Miyasho et al. (Miyasho et al., 2001), whose activation and inactivation gates were 205
shifted by 20 mV in the hyperpolarized direction to closely resemble kinetics of DRG neurons 206
(Qu and Caterina, 2016) and (iii) the Kv7/M channels which were adapted from Shah et al. 207
(Shah et al., 2008), and their activation curve parameters were tuned as in Barkai et al. (Barkai et 208
al., 2017). The h-current (Ih) was also included and taken from Shah et al. (Shah et al., 2008), 209
the slope factor was tuned according to Komagiri and Kitamura (Komagiri and Kitamura, 2003). 210
For simulating the excitable properties of a single-compartment neuron we used the following 211
fixed maximal conductance parameters: 212
gNav1.8=0.02 ⁄ , gNav1.9=0.00064 ⁄ , gNaTTXS=0.0017 ⁄ , gNaP=0.00005 ⁄ , 213
gKDR=0.00083 ⁄ , gKA=0.0015 ⁄ , 214
gKv7/M=0.00034 ⁄ , gH=0.00033 ⁄ . 215
Calcium channels were adapted directly from Shah et al. (Shah et al., 2008) and their 216
conductance values were tuned according to the inward currents described in Blair and Bean 217
(Blair and Bean, 2002). The T-type and L-type channels representing the low voltage-activated 218
(LVA) and high voltage-activated (HVA) currents, respectively, were added with the following 219
conductance values: 220
gCaL=0.003 ⁄ , gCaT=0.001 ⁄ 221
The reversal potentials for sodium (ENa), potassium (EK), and h-current (EH) were set to +60mV, 222
−85mV and −20 mV, respectively. The passive reversal potential was set to −60mV. 223
Apart from Nav conductances, which were unevenly distributed between Nav-less and 224
conductive compartments, all other conductances were evenly distributed in all compartments. 225

14
The recordings were performed by positioning a NEURON “point-process” electrode at the 226
terminal end of the central axon (Figure 1A). In some experiments, the recording electrode was 227
positioned at the Nav-less compartment, 2.5 mm before the SIZ or at the conductive 228
compartment of the terminal branch, 2.5 mm after the SIZ. 229
Stimulation parameters 230
Simulations were performed, assuming a room temperature of 25o C. To avoid boundary 231
condition problems, the stimulating electrode or capsaicin puff-like process were positioned at 232
10% of the terminal branch length taken from the terminal branch’s tip. 233
For simulating an optogenetic stimulation, a short 3 ms square pulse of either 50 or 100 pA was 234
applied into a single simplified voltage-clamp point-process at the distal end of the single or 235
multiple terminal branches. In some experiments, these brief square pulses were applied at 236
various frequencies. 237
A capsaicin-like stimulation was injected to single or multiple nerve-endings. To that end, a 238
capsaicin-like current was introduced into a single simplified voltage-clamp point-process with 239
fast exponential activation and slow exponential inactivation mimicking the experimental 240
kinetics of puff-applied 1 μM capsaicin-induced current and sufficient to induce action potential 241
firing when applied onto the acutely dissociated dorsal root ganglion neuron (Nita et al., 2016). 242
A similar current was used in Barkai et al. (Barkai et al., 2017) and Goldstein et al. (Goldstein et 243
al., 2019) to generate activity in the modeled nociceptive neuron when applied to the single 75 244
m length terminal: 245
for t ≤ tpuff 246
= ( − )

15
for tpuff < t 247
= ( − ) ∙ − ( + )
248
249
( ) = 1 − ( ) =
250
where gCap is the maximal conductance, α(xt) and β(xt) are the activation and inactivation 251
functions with and as the activation and inactivation time constants, respectively. The 252
values of the time constants were: 253
=1⋅106 ms, =6500 ms 254
tonset and tpuff are the times at which the puff application simulation begins and the length of 255
application, respectively. 256
To mimic the changes in membrane resistance following the opening of TRPV1 channels, the 257
capsaicin-like current injection was accompanied by an opening of passive transducer channels 258
(Goldstein et al., 2019). The conductance to this channel ( ) was exponentially distributed 259
and the exponential decay constant ( ) was calculated to fit the diffusion of capsaicin and hence 260
change in its concentration as a function of distance from the pipette tip as was previously 261
calculated in Goldstein et. al. (Goldstein et al., 2017). In the experiments where the length of the 262
terminal branches was changed, the distribution of the transducer conductances was adapted 263
accordingly. 264

16
The final transducer distribution equation introduced into the model was: 265
( ) = ∙ /
Where x is the distance from the nerve-ending and the fixed parameters were: 266
= 0.0025 /
= 7.04
Randomized onset timing: 267
Onset time was generated with an addition of a normal distribution randomize value : 268
= + | ( , )| where is the mean (and set to zero) and is the standard deviation. We modified the value of 269
to generate randomized onset timing. The randomized part of the equation was an absolute 270
value since the onset of stimulation cannot occur prior to the stimulation time. Each generated 271
stimulation was then applied to a single terminal. 272
"Inflammation" (SIZ shift) model 273
To simulate inflammatory hyperalgesia, we mimicked the distal shift of the SIZ (Goldstein et al., 274
2017) by shortening of the Nav-less compartment from its normal 25 m lengths to 20 m. The 275
terminal’s conducting compartment was elongated by the same length reduced from the passive 276
compartment, leaving the total terminal length at a constant value. All the active and passive 277
parameters were modified accordingly. 278
"Neuropathic pain" (Noise) model 279

17
To simulate nerve injury-mediated hyperalgesia, an external noise conductance was incorporated 280
into all terminal tree branches as previously described (Olivares et al., 2015, Barkai et al. 2017 et 281
al.). The noise was injected into the whole terminal tree and was based on the Ornstein-282
Uhlenbeck process with a mean 0, and the current was taken from Olivares et al. (Olivares et al., 283
2015). 284
= − + ( )
Where is a square root of the steady-state variance of the current amplitude; N - is a normally 285
distributed random variable with zero mean and variance = 1 and is the steady-state correlation 286
time length of the current (was fixed to 1 ms). 287
Data Analysis 288
To avoid artifacts resulting from the artificial instability of the Neuron simulation environment 289
before reaching steady-state, we have allowed a long 500 ms initialization time prior to 290
stimulation of the simulated neuron, and this time was discarded from the analysis. 291
Unless otherwise stated, the firing patterns were recorded from the central terminal compartment. 292
Instantaneous spike frequencies were analyzed and plotted as previously described by 293
Zimmerman et al. (Zimmermann et al., 2009). 294
Data and software availability: All datasets generated during and/or analyzed during the current 295
study are available in the main text or upon request from the Corresponding Author, Alexander 296
Binshtok ([email protected]). 297
The model files will be uploaded to Model DB and also available upon request from the 298
Corresponding Author, Alexander Binshtok ([email protected]). 299

19
Results 302
Nociceptive terminal trees are complex structures composed of individual branches of different 303
lengths and complexity (Treede et al., 1990; Zylka et al., 2005; Ivanusic et al., 2013; Alamri et 304
al., 2015; Olson et al., 2017; Alamri et al., 2018; Bouheraoua et al., 2019). The terminal 305
branches, which ends at the target organ and detect the noxious stimuli consist of (1) the 306
terminal, which is activated by noxious stimuli; (2) the passive part, an initial 20-30 m of the 307
terminal branch, in which the depolarization, resulting from the terminal activation, propagates 308
without involving voltage-gated sodium channels (Navs) and (3) the conductive part where 309
propagation is active as it involves Navs (Goldstein et al., 2019). The length of the terminal and 310
the passive part of the terminal branch is similar among different terminals (Goldstein et al., 311
2019); thus, the length of the conductive part defines the overall length of the terminal branch. 312
The terminal branches converging onto the fibers constructing the nociceptive terminal tree 313
(Belmonte et al., 2004). To examine the effect of the morphology of the nociceptive terminal 314
trees on their coding properties, we adapted a computational model of the nociceptive nerve 315
fiber, which we previously described (Barkai et al., 2017; Goldstein et al., 2019). In this model, 316
we first based the geometry of the terminal tree on the rendering of a nociceptive terminal tree 317
visualized using in vivo two-photon microscopy (Barkai et al., 2017). The complex structure of 318
the “realistic” modeled terminal tree can be simplified and represented as a combination of 319
different “tree data structures”: a balanced binary tree, where each branching point, a node, 320
bifurcates into two branches (Figure 1A, red branches) and a degenerate binary tree, where each 321
node gives rise only to one branch (Figure 1A, blue branches). The nodes are branching points 322
from an anatomical point of view. However, from a physiological point of view, these nodes in 323

20
afferent neurons serve as merging or convergence points of voltage deflections from the 324
converging terminal branches. 325
We adapted the physiological properties of the terminals from data obtained from recordings of 326
capsaicin-mediated activity of corneal nociceptive terminals in vivo (Goldstein et al., 2019). 327
Specifically, the contribution of Navs begins only 25 m proximal to the terminal tip (Nav-less 328
compartment, Figure 1A, inset); thus, the spike initiation zone is located 25 m from the tip 329
(Goldstein et al., 2019). Also, we increased the axial resistance of the terminal branches to reflect 330
the presence of intracellular organelles, such as mitochondria (Heppelmann et al., 1994; Müller 331
et al., 1996; Heppelmann et al., 2001; Alamri et al., 2018). In these conditions, the action 332
potential (AP) conduction velocity along the terminal branch was 0.04 m/s, and the refractory 333
period for a 3 ms, 50 pA stimuli was 49 ms. The refractory period in nociceptive c-fibers, 334
obtained by stimulating the central process and recording from cell somata, was shown to vary 335
between 4 to 45 ms (Gemes et al., 2013). 336
We first compared the nociceptive output following activation of a single terminal activation of 337
all the terminals in the “realistic” terminal tree to examine how the structures of terminal trees 338
affect the gain of the nociceptive neurons, i.e., the relation between the stimuli and the resulted 339
AP firing (Kispersky et al., 2012). We activated the terminals with simulated rectangular or 340
capsaicin-like currents (see Methods) and monitored the resulting activity by measuring the 341
number of APs and their instantaneous frequency at the central terminal (see Methods, Figure 342
1A). The stimulation was applied at the tip of a random terminal or all the terminals (Figure 1B, 343
red arrowhead; see Methods). First, we simulated the activation of a single terminal (Figure 1B, 344
C, green) with a length of 75 m (25 m of the Nav-less compartment + 50 m conductive 345
compartment, Figure 1A, inset) using a brief (3 ms) suprathreshold (50 pA) rectangular current. 346

21
We chose these parameters since the optogenetic stimulation of similar duration was sufficient to 347
generate a single AP (Browne et al., 2017). Indeed, the stimulation of this terminal with a single 348
short current pulse produced a single AP at the central terminal (Figure 1C, upper panel, green). 349
We next simulated the state in which the stimulus affects a wider area and simultaneously 350
activates all terminals in the same receptive field (Treede et al., 1990). We asked whether 351
stimulation of multiple terminals would amplify the resulting response of a nociceptive neuron. 352
We simultaneously stimulated all terminals from the same fiber by a brief suprathreshold 353
stimulus and showed that still only one AP was recorded at the central terminal (Figure 1B, C, 354
lower panel, light blue). These results are in line with recent findings showing that a 3 ms 355
optogenetic stimulation of the terminal tree, which is not restricted to a single terminal branch, 356
leads to the generation of 1 AP at the DRG soma (Browne et al., 2017). 357
Train of short single-action potential-generating stimuli applied to a single terminal at 12 Hz 358
produced a train of APs at the central terminals with identical frequency (Figure 1D, upper 359
panel, green). Moreover, the application of brief multiple stimuli to all terminals (Figure 1D, 360
lower panel, light blue) did not produce any increase in the number of APs fired. The 361
simultaneous stimulation of all terminals also failed to produce a further increase in the firing 362
frequency (Figure 1F). The gradual increases of the instantaneous frequency towards the 363
stimulation frequency (Figure 1F) was not observed when recordings were performed from a 364
single stimulated terminal before a conversion point but became apparent only when recordings 365
were performed after the first conversion point and toward the central terminal (data not shown). 366
Therefore, it is probably caused by the terminal tree's geometrical irregularity, such as successive 367
arborizations, which may affect the velocities of action potentials (Manor et al., 1991). The 368
increase in the stimulus amplitude to 100 pA also did not change the output of the terminals such 369

22
that the modeled cell fired 12 APs for a 12 Hz stimulation (data not shown). These data suggest 370
that activation of a single terminal by brief stimuli conveys the information similar to the 371
information integrated from multiple terminals. 372
However, we previously showed that stimulation of a simulated single terminal by a prolonged 373
continuous capsaicin-like current leads to firing of up to five APs (Goldstein et al., 2019). 374
Recordings from C and A fibers in skin-nerve preparation or teased fiber preparation showed 375
that application of noxious stimuli to a receptive field, i.e., activation of multiple terminals, lead 376
to a much higher AP firing (Levy et al., 2000; St Pierre et al., 2009; Zimmermann et al., 2009; 377
Murthy et al., 2018; Vandewauw et al., 2018). These results, which describe the activation of the 378
whole receptive field by a prolonged “natural” stimuli, suggesting that activation of multiple 379
terminals by prolonged stimuli may lead to a summation of the responses and overall increase in 380
AP number. To examine this statement, we stimulated either a single terminal or all the terminals 381
by a simulated capsaicin-like current (Figure 1E, see Methods) to mimic the “natural” activation 382
of TRPV1 channels located at the terminals (Goldstein et al., 2019). The simulated capsaicin 383
current (Figure 1E) was modeled from a current evoked following a 500 ms puff application of 384
500 nM capsaicin, recorded from acutely dissociated nociceptive DRG neurons, held at −65 mV 385
(Nita et al., 2016; Barkai et al., 2017; Goldstein et al., 2019). Stimulation of a single 75 m 386
terminal with a capsaicin-like current triggered 3 APs at the central terminal (Figure 1E, upper 387
panel, green). Importantly, stimulation of all terminal branches with the same capsaicin-like 388
current substantially increased the AP firing (13 Aps, Figure 1E, lower panel, light blue), 389
amplified the firing frequency (Figure 1F), and shortened the first spike latency (191 ms when all 390
terminals are stimulated vs. 345 ms when only single terminal was stimulated). 391

23
These data predict that stimulation of multiple terminals by prolonged capsaicin-like current 392
facilitates the response by increasing the firing and response frequency, differently from the 393
activation by brief current pulses. This implies that longer activation of the terminal tree might 394
increase the nociceptive response. 395
The activation of all terminals introduces a number of variables that may underlie the increased 396
nociceptive output: (1) the increase in firing following stimulation of all terminals may result 397
from the integration and summation of the responses from individual terminals at the 398
convergence points; (2) since the structure of the tree is asymmetrical, the distance of the 399
individual terminal from the common convergence point is different; thus the effect of the closest 400
terminal may affect the overall nociceptive response; and (3) stimulation of all terminals 401
activates terminals with different electrical properties, e.g., different length of the conductive 402
part, which may contribute to the difference in the activation of a single terminal to that of 403
multiple terminals. We, therefore, systematically studied the effect of these factors on 404
nociceptive gain. 405
To prevent an effect of asymmetry in length and in the terminal location on nociceptive 406
excitability and to examine only the effect of a number of activated terminals, we studied the 407
impact of multiple stimulations on the symmetrical (balanced) binary trees (Figure 1A) with 408
similar terminal branch lengths. First, we applied a capsaicin-like current to either one or both 409
terminal branches of a simple, symmetrical, balanced binary tree containing only one node and 410
two symmetrical branches (Figure 2A, upper panel). We measured the resulting changes in 411
terminal voltage after the convergence point. Stimulation of a single terminal resulted in a single 412
AP (Figure 2A, bottom, blue trace). Simultaneous stimulation of both terminals by a capsaicin-413
like current generated two APs (Figure 2A, bottom, red trace). This result is unexpected, as we 414

24
assumed that at the convergence point, only one AP would propagate, resetting the other 415
branches (Weidner et al., 2003; Gemes et al., 2013). We hypothesized that stimulation with a 416
prolonged capsaicin-like current, differently from stimulation with a brief square-like current, 417
might induce a long-lasting after-AP depolarization that persists after a refractory period of the 418
first AP is over. In the case of a single stimulus, this after-AP depolarization may not be 419
sufficient to generate additional AP. Simultaneous stimulation of both terminals might lead to 420
the summation of an after-AP depolarization from two terminal branches, which, in this case, 421
maybe suprathreshold and sufficient to generate a second AP. To examine this hypothesis and to 422
examine if, indeed, simultaneous stimulation facilitates after AP depolarization, we measured the 423
voltage deflection resulting from a single stimulus or simultaneous stimulation of two terminals. 424
To prevent the effect of voltage-gated sodium channels on the voltage deflection, we removed all 425
Nav conductances from the simulation. Simultaneous stimulation of two terminals did not affect 426
the voltage deflection measured at the SIZ of each of the branches (Figure 2B) but substantially 427
increased the voltage deflection after the convergence point (Figure 2C). The summated voltage 428
deflection persisted (Figure 2C, grey shadowed area), succeeding the refractory period of the AP 429
(49 ms, Figure 2C, red shadowed area). These data suggest that an increase in the number of 430
activated terminals facilitates nociceptive activation, by allowing the summation of the 431
depolarizations from the converging terminal branches. To further validate this conclusion, we 432
increased the complexity of the balanced binary tree type of the nociceptive terminal (Figure 3). 433
We systematically examined the activation of a single terminal branch, the simultaneous 434
stimulation of two adjacent (sisters) terminal branches and all terminal branches at the terminal 435
trees composed of a different number of terminal branches (nTB) defined by the number of the 436
“bifurcation stages” (nl) according to nTB = 2nl-1 (Figure 3A, see Methods, (Jarvis et al., 2018). 437

25
Activation of a single terminal branch by a capsaicin-like current in a nl = 2 tree with two 438
terminals, evoked one AP at the central terminal (Figure 3C, Figure 2) and two APs in more 439
complex trees (Figure 3B, C, yellow). As our model predicts (Figure 2), activation of two (sister) 440
terminals led to a moderate increase in firing at the central terminals (Figure 3B, C, purple). 441
Activation of all terminals led to a substantial increase in the number of AP than activation of a 442
single terminal in all examined trees (Figure 3B, blue). Importantly, as the complexity increased, 443
i.e., the number of the terminal branches increased, activation of all terminals led to a rise in AP 444
firing at the central terminal (Figure 3B, C, blue) with increased firing frequency (Figure 3D). It 445
is noteworthy that although the number of AP changes considerably between stimulations of 446
terminal trees of different complexity, the instantaneous frequency and peak instantaneous 447
frequency change vary little (Figure 3D). Altogether the results from the symmetrical terminal 448
tree analysis suggest that stimulation of more terminals (activation of a larger area or area with 449
higher terminal density) leads to increased response. It also implies that an increase in terminal 450
complexity might facilitate nociceptive gain. 451
From a mechanistic point of view, the increase in gain in terminal trees with more bifurcation 452
stages could be due to, as our model predicts, the depolarization summation at the convergence 453
points (Figure 2) or an increase in the length of Nav expressing compartments of the terminal 454
tree, which elongates as the tree complexity increases (Figure 3). The elongation of Nav 455
expressing components was shown to increase neuronal excitability (Kuba et al., 2006). To 456
distinguish between the effect of the activation of multiple branches and that of the length on 457
nociceptive gain, we simultaneously stimulated all four terminals of nl =3 tree while changing 458
the length of the common branch (Figure 3A, green branch, Figure 4A, green dashed line). In 459
our model, the common branch is a part of the terminal tree. Accordingly, it possesses all the 460

26
electrical properties of the mother branches and has a diameter of 0.25 m. The common branch 461
is connected to the thicker fiber (0.8 m diameter) by a tapered cone-like axon with a linearly 462
changing diameter. Our data show that an increase in the length of the conductive components 463
indeed leads to an increase in firing and frequency, at the central terminal (Figure 4B), 464
suggesting that the increase in overall length of Nav expressing compartment of the terminal tree 465
plays a role in the increased gain at the more complex terminals. However, the increase in length 466
could account only for part of the increase in gain as stimulation of all terminals in a nl =3 tree 467
with a length equivalent to the length of a nl = 7 tree (350 m), although led to more firing than 468
that of the shorter nl = 3 tree, generated less firing than activation of all terminals in a nl = 7 tree 469
of the same length (11 vs. 18 APs, Figure 4B, left; Figure 3C). Altogether our data predict that 470
activation of more terminals will lead to an increase in AP firing at the central terminal due to the 471
summation of the depolarization at the convergence points, which in case of multiple terminal 472
activations would “meet” higher Nav conductance, leading to more firing. 473
In addition to the balanced binary tree, the “realistic” terminal tree also consists of a part that can 474
be simplified to a degenerate binary type of terminal (Figure 1A, blue branches). In this type of 475
binary tree, each node gives rise only to one terminal branch of a similar length (Figure 5A). We 476
examined the impact of the complexity of this type of terminal structure on its encoding 477
properties. We used a degenerate tree with branches of a similar length (Figure 5A), thus 478
avoiding possible effects of the length of the terminal branch on the gain. Activation of all 479
terminals in the degenerate tree led to a substantially higher number of APs than activation of a 480
single terminal (Figure 5A, yellow terminal), or sister terminals (Figure 5A, yellow and purple 481
terminals), in all examined trees (Figure 5B). Also, in terminals with more bifurcation stages, the 482
activation of all terminals led to increased AP firing at the central terminal (Figure 5B, light 483

27
blue), with increased firing frequency (Figure 5B - D). These data suggest that in the degenerate 484
terminal tree activation of more terminals facilitates the response, similar to the balanced binary 485
type of terminal tree. However, here, in addition to the number of convergence points, and the 486
overall length of the Nav containing components, an additional level of complexity exists. In the 487
balanced binary tree, the distances between each single terminal end to the beginning of the 488
common branch are equal (Figure 3A) such that the generated responses would arrive at the 489
convergence points at the same time. In the degenerate binary tree, however, the distance 490
between the different terminals to the common branch (Figure 5A, green branch) are different 491
(for example, the difference at a distance to a common branch between yellow and light blue 492
terminals in Figure 5A, nl = 7 tree). This suggests that the signals from the simultaneously 493
activated terminals would arrive at the common branch at different times and if one of the 494
branches is situated closer to the common convergence point, the APs generated at this branch 495
would reach the common convergence point before the APs generated by other terminals which 496
are situated further away. The AP generated at the closest terminal branch would propagate both 497
orthodromically and antidromically, upon reaching the convergence point. In the latter case, it 498
would render the rest of the terminal tree inactive, by inactivating Navs, and if the firing and 499
following inactivation are long enough, it may prevent APs from other terminal branches to 500
reach the central terminal. We stimulated the closest terminal to the common branching point of 501
the “realistic” terminal tree with a capsaicin-like current to examine if, indeed, the stimulation of 502
the branch closest to the common convergence point would take over the activation of the whole 503
terminal tree (Figure 6A, deep navy-blue terminal). This terminal was of 175 m length, and its 504
activation led to the firing of 13 APs, which indeed reached the central terminal faster than other 505
terminals (191 ms vs. for example 345 ms from the terminal shown in Figure 1A, bottom) and at 506

28
the same time as when all the terminals were active (191 ms, both). Moreover, the activation of 507
the closest terminal led to an identical pattern of firing to the firing evoked by stimulation of all 508
terminals (Figure 6A right and B). These data suggest that the location of the terminal relative to 509
the common convergence point is important in defining the effect of a terminal on nociceptive 510
firing. We next examined how activation of other terminals contributes to nociceptive activity 511
when the closest terminal does not produce dominant firing. The shortening of the closest 512
terminal to 75 m evoked three APs following activation by a capsaicin-like current (Figure 6C, 513
deep navy blue), and activation of sister terminals evoked four APs (Figure 6C, green). In this 514
case, activation of all terminals produced a firing of 13 APs (Figure 6, dark green), leading to the 515
facilitation of nociceptive response. The results of this experiment predict that the location of an 516
individual terminal is important in defining the overall contribution of this terminal to the 517
nociceptive response. The results showing that activation of terminals of different length (75 vs. 518
175 m) evoke different firing also suggest that apart from the location, the electrical properties 519
of the individual terminals affect the nociceptive gain. 520
We, therefore, examined the effects of the properties of individual terminals on the nociceptive 521
gain. Nociceptive terminal trees are composed of terminal branches with different lengths and 522
thicknesses (Zylka et al., 2005; Ivanusic et al., 2013; Alamri et al., 2015; Olson et al., 2017; 523
Alamri et al., 2018; Bouheraoua et al., 2019). Application of a simulated capsaicin-like current 524
produced a variety of responses depending on the length of the individual stimulated terminals. 525
Stimulation of the shortest single terminal (total length of 75 m) triggered three APs at the 526
central terminal (Figure 7A). The same stimulation applied to a longer adjacent (distance-wise 527
from the common branch), terminal produced a substantially higher firing at the central terminals 528
(Figure 7B), culminating at 13 APs following stimulation of the longest 175 m terminal (Figure 529

29
7C). The longest terminal was situated at the farthest distance from the common branch, 530
suggesting that in addition to the location of the individual terminal, the length of the terminal 531
branch is one of the factors defining the terminal gain. 532
In our model, each terminal consists of two parts: a 25 m, constant length distal “passive” part, 533
which receives the stimulation, and does not contain Navs (Goldstein et al., 2019). The 534
subsequent “conductive” part contains Navs, and it varies in length before it converges onto the 535
fiber (Figure 1A). In order to reflect the presence of intracellular organelles within the terminal 536
branch (Müller et al., 1996; Bekkers, 2011; Alamri et al., 2018; Goldstein et al., 2019), we 537
increased the axial resistance of the terminal branch (RaTB) 15 times that of the value of the fiber 538
(Bekkers, 2011; Goldstein et al., 2019). In this respect, the passive part of the terminals, which 539
receives the stimulus and is connected to the highly resistive conductive part, is somehow similar 540
to a “head” of the dendritic spine connected to the spine neck (Nimchinsky et al., 2002). 541
Accordingly, the voltage response of the passive part to a capsaicin-like current is dependent on 542
its own resistive properties. The Ra of the passive part will determine its length constant, and 543
therefore will define how the capsaicin-like current-induced voltage deflection decays along the 544
terminal. Indeed, when Ra of the passive part was equal to the fiber Ra, the voltage deflection 545
( Vm, V – Vrest) measured at the SIZ, was about 70 mV. When we increased the Ra of the 546
passive part, the Vm decreased progressively, such that when Ra of the non-conductive part 547
was 5-fold that of the fiber, Vm became 51 mV; for 10-fold it became 38 mV and at 15-fold 548
that of the fiber, Vm became 29 mV. Additionally, the voltage response of the passive part 549
may also depend on the axial resistance (Ra) of the consecutive conductive part, such that, 550
similarly to a spine head and neck, a high Ra component of the conductive part would lead to 551
higher voltage deflection at the SIZ and hence a higher firing, by effectively decreasing the 552

30
current sink (Segev and Rall, 1988). Consequently, we examined capsaicin-induced voltage 553
deflection along the terminal branch, by stimulating the tip of the terminal by a capsaicin-like 554
current and monitoring the resulting voltage deflection at the “passive” part, 2.5 m before the 555
SIZ (Figure 8A) and at the SIZ, while changing the Ra of the conductive part (Figure 8A, B). We 556
removed all Nav conductances from the conductive part, to eliminate the effect of Nav activation 557
and APs on the voltage deflection. To examine how voltage deflection at the SIZ affects the AP 558
firing at the central terminal, we added back in the Nav conductances (Figure 8C). When the Ra 559
value of the conductive part was 15 times that of the fiber, stimulation of the terminal tip with a 560
capsaicin-like current produced a voltage deflection of about 60 mV, depolarizing the membrane 561
potential (Vm) of the terminal end to 0 mV which is equivalent to TRPV1’s reversal potential 562
(Figure 8A). At the SIZ, the voltage deflection was smaller, probably due to the voltage decay 563
resulting from the small space constant, reaching VmSIZ of –12 mV (Figure 8B). This 564
depolarization at the SIZ was sufficient to produce an excessive firing at the central terminal (13 565
APs, Figure 8C). Reduction of the conductive part’s Ra to that of the fiber’s led to a smaller 566
depolarization ( VmTip of 35 mV) at the terminal tip (Figure 8A) and at the SIZ ( VmSIZ of 25 567
mV, Figure 8B). In these conditions no APs were evoked by stimulation with capsaicin-like 568
current when Nav conductances were turned back on (Figure 8C). These data predict that 569
changes in Ra, solely in the conductive part, may strongly affect the terminal membrane 570
depolarization and AP firing. 571
These results, however, do not explain the increase in firing when longer terminals are stimulated 572
(Figure 7) since all the terminals had a similar Ra. Indeed, the effect of length on the firing at 573
the central terminals was independent of Ra values, and at any given Ra the change in length of 574
the conductive part affected the firing at the central terminal in a sigmoidal manner as the length 575

31
increased (Figure 8C). The shortening of the “conductive” terminal part below 25 m prevented 576
the generation of APs at all Ra values, whereas the elongation of the conductive part led to the 577
increase in the firing at the central terminal which peaked and plateaued when the conductive 578
part was of 125 -150 m (Figure 8C). It has been shown that the length of the SIZ of central 579
neurons defines neuronal excitability, by virtue of the amount of Nav conductance (Kuba et al., 580
2010). Our model suggests that an increase in the length of the Nav containing components 581
enhances nociceptive gain (Figure 4). Consequently, we examined whether the change in length 582
of the terminals regulates the terminal gain through changes in Nav conductance. Nociceptive 583
neurons express a variety of sodium channels. Among them, slow Nav 1.8-mediated sodium 584
current which defines the ability of a nociceptive neuron to fire repetitively (Blair and Bean, 585
2003). Persistent Nav 1.9-mediated sodium current controls subthreshold excitability (Cummins 586
et al., 1999; Herzog et al., 2001; Baker et al., 2003). Both Nav 1.8 and 1.9 are expressed by 587
nociceptive terminals (Persson et al., 2010). We stimulated a fixed-length terminal by a 588
capsaicin-like current and mimicked the change of the terminal length by varying either Nav1.8 589
or Nav1.9 conductances. Increase in Nav 1.8 conductance to 145% in short terminals of 50 m 590
(25 m Nav-less compartment + 25 m conductive, Nav expressing, compartment), which 591
generates two APs in control conditions, lead to the firing of 13 APs, which is comparable with 592
the firing generated by a 125 m long terminal (Figure 9A). In a 75 m long terminal (25 m 593
Nav-less compartment + 50 m conductive, Nav expressing, compartment), which fires 3 APs in 594
normal conditions, the increase in Nav1.8 conductance to 110% was sufficient to generate 14 595
APs, which is comparable with the firing of a 125 m terminal (Figure 9A). Further increase in 596
Nav1.8 conductance leads to higher firing, exceeding that of longer terminals with “normal” 597
Nav1.8 conductance (Figure 9B). Shortening of the terminal, by decreasing Nav1.8 conductance, 598

32
reduces the firing in an abrupt manner, such that application of capsaicin-like current to the 599
terminal with 95% of Nav1.8 conductance leads to the generation of 4 instead of 13 APs and a 600
decrease in Nav1.8 conductance below 55% prevented AP generation (Figure 9B). Changing 601
only Nav 1.9 conductance resulted in a more gradual effect on AP firing (Figure 9C, D), and in 602
short terminals of 50 and 75 m, the increase in Nav1.9 conductance to 150% was not sufficient 603
to increase the terminal gain properties (Figure 9D). In a longer terminal of 100 m, an increase 604
in Nav1.9 conductance by 10% increased the firing to levels comparable to the firing of longer 605
terminals (Figure 9C). Similar to Nav1.8 conductance, a further increase in Nav1.9 conductance 606
in terminals longer than 100 m produced substantially higher firing than the firing of the long 607
terminals in “normal” conditions (Figure 9D). The decrease in Nav 1.9 conductance led to a 608
gradual reduction of the firing, which was reduced but not annulled even when Nav1.9 609
conductance was zeroed (Figure 9D). These data suggest that longer terminals are more excitable 610
due to higher expression of Nav1.8 and Nav 1.9 channels. The Nav 1.8 conductance defines the 611
repetitive firing, and Nav1.9 tunes it. The non-linearity between Nav1.8 and 1.9 conductances, 612
the length, and the firing, could be explained by the effect of other conductances regulating the 613
firing. Since we only manipulated Nav conductance and not the length of the conductive part, 614
our manipulation left all other conductances intact; thus, an increase in Nav1.8 or Nav1.9 615
conductance was not counteracted by the increased potassium conductances, which normally 616
restrain firing. 617
Altogether these data propose that the properties of the individual terminals and the complexity 618
of the terminal tree affect the gain of nociceptive input-output function. The value of the 619
generation potential is defined by the resistance of the terminal branch. The translation of the 620
generation potential into AP firing depends on the length of Nav 1.8 and 1.9 expressing 621

33
compartments and the integration of firing from multiple branches. All these factors contribute to 622
the encoding properties of the nociceptive terminal. 623
In all the experiments described above, we stimulated all the branches simultaneously. However, 624
in physiological conditions, the stimulus (e.g., heat, cold, capsaicin) applied to a certain region 625
area dissipates from the center of the stimulated areas into the surroundings. For example, in a 626
case of nociceptive neurons with large receptive fields of back and leg (Mancini et al., 2014), the 627
stimuli will first activate the terminals at the epicenter of the stimuli and only then at the 628
surrounding areas as it dissipated there. But it is also true in a case of nociceptors with small 629
receptive fields of palms and fingers (Mancini et al., 2014), as terminals vary in skin depth and 630
distance from the stimulation point (Dezhdar et al., 2015; Alamri et al., 2018). Thus, each 631
terminal receives the stimuli at different times, possibly leading to a temporal summation of the 632
stimuli. At the dendrites, the differences in location and time of stimulation define the resulted 633
output of the stimulated neuron (Magee, 2000; Magee and Johnston, 2005). Traditionally, the 634
temporal proximity of a series of subthreshold synaptic events can, as a result of EPSP temporal 635
integration, increase the output of the postsynaptic cell in terms of its firing probability and AP 636
frequency. We, therefore, studied whether the temporal integration of noxious stimuli amplifies 637
the nociceptor excitability. To simulate a stimulation of the receptive field with respect to time 638
variance among terminals, we reformulated the capsaicin-like stimulations with the addition of a 639
normally distributed probability randomized onset time variability (Figure 10A). The simulations 640
were then applied to all terminals of a complex nl = 7 balanced binary type terminal tree (Figure 641
10B). An increase in onset time probability from 10 to 2500 ms resulted in an exponential 642
increase in total AP firing recorded at the central terminal over logarithmically increased onset 643
time variance (Figure 10C). Changes between 10 to 250 ms produced only a small increase in 644

34
total AP firing over time (<20). However, the extension of onset time probability greatly 645
increased the excitatory output (Figure 10C) up to a 2-fold increase in longer onset times (Figure 646
10C). These data indicate that the prolonged continuous capsaicin-like currents stimuli feature a 647
temporal-summation characteristic such that the successive application of these stimuli leads to 648
an increase in the response of nociceptive neurons. Our data also implies that the facilitation we 649
observed in the degenerate binary tree (Figure 5) could be due to the temporal integration of the 650
responses from different terminals. 651
While the simulations described above were performed in “normal” conditions, we next 652
examined how nociceptive terminals integrate the increased responses to noxious stimuli in 653
pathological conditions. Many pathological conditions lead to hyperalgesia, i.e.., increased pain 654
response to noxious stimuli (Sandkuhler, 2009). We previously demonstrated that inflammation 655
leads to hyperalgesia by shifting the location of the SIZ of the nociceptive terminals closer to the 656
terminal tip (Goldstein et al., 2019). Consequently, we shifted the location of the SIZ towards the 657
terminal tip (Figure 11A), to simulate the changes which occur during inflammatory 658
hyperalgesia. Activation of all terminals with a capsaicin-like current under these conditions 659
slightly increased the firing (15 instead of 13 APs, Figure 11B) and the peak instantaneous 660
frequency from 9.4 Hz to 10.4 Hz (Figure 11C). To simulate excitability changes in neuropathic 661
pain, we conferred upon nociceptive membrane sub- and suprathreshold perturbations of the 662
membrane potential (Barkai et al., 2017). It has been demonstrated that nerve injury leads to an 663
increase in the resting membrane potential voltage perturbations, which may initiate spontaneous 664
ectopic activity (Amir et al., 1999; Liu et al., 2000; Rho and Prescott, 2012) and that this ectopic 665
activity is correlated with neuropathic pain (Kleggetveit et al., 2012). Accordingly, we injected 666
an Onstein-Uhlenbeck based current noise (Olivares et al., 2015) in which the amplitude of the 667

35
injected current varies according to the normal distribution at each time step. We simulated 668
subthreshold noise and suprathreshold spontaneous activity by varying the standard deviation of 669
the current amplitude’s normal distribution (σ) between 0.006 to 0.007 A/cm2, respectively 670
(Figure 11A). In the higher σ of 0.007 A/cm2, the probability of reaching higher injected 671
currents was higher; thus, it caused higher membrane fluctuation, which sometimes reached the 672
threshold, and generated APs (Figure 11A). In these conditions, activation of all terminals by a 673
capsaicin-like current substantially increased firing (Figure 11B) and the peak instantaneous 674
frequency was slightly increased (9.9 Hz in subthreshold noise and 10.1 Hz in suprathreshold 675
noise, Figure 11C). 676
Our data demonstrate that activation of all terminals of the “realistic” terminal tree in normal 677
conditions led to the generation of 13 APs, which fires at the central terminal with an 678
instantaneous frequency peaked at 9.3 Hz (Figure 1E and 11C). Activation of complex balanced 679
or degenerate trees, although produced a higher firing (18 and 21 APs, respectively), the peak 680
instantaneous frequency remained within a similar limit of 9 to 10 Hz (Figures 3 and 5). 681
Similarly, in the simulated pathological conditions, the peak instantaneous frequency was only 682
slightly increased (see above). This change in peak instantaneous frequency may be too narrow 683
to encode and convey the changes in response to stimuli. We, therefore, hypothesized that in 684
addition to the spike rate coding (Adrian and Zotterman, 1926), the nociceptive neurons might 685
also use “temporal” coding to integrate and encode the information about different response 686
properties via different timing patterns of spikes (Cho et al., 2016). Accordingly, we analyzed the 687
spiking activity over time following a capsaicin-like current stimulation of all terminals in the 688
“realistic” terminal tree in normal conditions, in inflammatory hyperalgesia conditions, in which 689
the SIZ is shifted toward the terminals and in neuropathic pain conditions, in which sub- and 690

36
suprathreshold current noise are injected (Figure 11D). The simulation revealed that the peak 691
discharge rate following the stimulation in different conditions was almost unchanged, while the 692
patterns of the discharges evoked in different conditions were substantially different (Figure 693
11D). These data propose that changes in temporal encoding of the spike trains from an 694
individual nociceptive neuron may convey key information about changes in nociceptive output 695
in pathological conditions, thus defining abnormal nociceptive behavior after nerve injury or 696
inflammation. 697
To summarize the effects of the different normal and abnormal morphology of nociceptive 698
terminal tree on the nociceptive functions, we produced a simplified model of the “realistic” 699
nociceptive terminal tree which contain “degenerative” and “symmetric” component steaming 700
from the common branch, in which all terminal branches are of the same length (75 m, Figure 701
12A, black). Under these “normal” conditions, activation of this terminal tree by a capsaicin-like 702
stimulus, i.e., simultaneous activation of all terminal branches by the capsaicin-like current 703
generated 10 APs. We then simulated the morphological changes in the terminal branches and 704
the terminal tree and examined how these changes affect the terminal output. An increase in the 705
number of terminal branches to 16, simulating hyperinnervation changes (Cain et al., 2001; 706
Leibovich et al., 2020) led to an increase in firing (Figure 12A, red). A decrease in the number of 707
the terminal branches to 7, simulating a denervation state, substantially decreased the nociceptive 708
gain (Figure 12A, blue). Changes in the properties of individual terminal branches by shortening 709
and decreasing Ra of the conductive part also substantially decreased nociceptive gain (Figure 710
12A, green). An increase in the terminal branch length had an opposite effect on the nociceptive 711
gain. Importantly, all the changes in the morphology of the nociceptive terminal tree affected 712
also the pattern of firing (Figure 12B, C, green), suggesting that in addition to changes in the 713

37
number of APs, there is also a change in their timing for reaching the central terminal, which 714
may be an important factor in nociceptive neuronal processing. 715
716

38
Discussion 717
Nociceptive terminals innervate the tissue forming a variety of morphologically complex 718
structures (Zylka et al., 2005; Ivanusic et al., 2013; Alamri et al., 2015; Olson et al., 2017; 719
Alamri et al., 2018; Bouheraoua et al., 2019). To examine the effect of the architecture of the 720
whole terminal tree, together with morphological and biophysical properties of its specific 721
component on nociceptive input-output relation, we used a computational model. While building 722
this in-silico nociceptive terminal tree, we used data from available experimental results acquired 723
by us and others, but for some of the parameters, estimation and assumptions had to be made. 724
We derived our conclusions by changing specific parameters through a range of values. We, 725
however, make no claim that the model simulates all nociceptive neurons at all states. The 726
purpose of the model was to generate plausible predictions for how the morphology of 727
nociceptive terminal trees affects nociceptive signaling under the parameter constraints available 728
in the literature. 729
The architecture of our model is based on the morphology of a representative nociceptive tree in 730
vivo (Barkai et al., 2017), and it is composed of basic structural tree characteristics, which are 731
universal for terminal tree architectures, such as symmetrical and degenerate tree structures. 732
Therefore, our model, although does not represent in detail all types of terminal trees (Hoyes and 733
Barber, 1976; Heppelmann et al., 1994; Müller et al., 1996; Heppelmann et al., 2001; Zylka et 734
al., 2005; Ivanusic et al., 2013; Alamri et al., 2015; Olson et al., 2017; Alamri et al., 2018; 735
Bouheraoua et al., 2019), it could be adjusted to study structure-to-function relations in more 736
specific terminal tree structures. 737
An important element of our model is the assumption that the terminal branch possesses a high 738
Ra. We implemented the high (X15) axial resistivity of the terminal branches due to several 739

39
reasons. First, EM evidence showing that intracellular organelles, such as mitochondria, are 740
present at the terminal branches (Hoyes and Barber, 1976; Heppelmann et al., 1990, 1994; 741
Müller et al., 1996). It has been suggested that the presence of mitochondria in terminals 742
(Heppelmann et al., 1990) or dendrites (Bekkers, 2011) could increase axial resistance. Our 743
theoretical calculations based on the terminal structure and mitochondria size (see Methods) 744
show that the Ra of the terminal branch is X15 higher than the Ra of the terminal branch without 745
intracellular organelles. Second, in line with our calculations, the presence of the mitochondria in 746
a “pinched” dendrite increases its Ra 15-fold (Bekkers, 2011). The high Ra of the terminal 747
branch explains, in part, our findings demonstrating that in corneal terminal branches in vivo an 748
AP, initiated at the SIZ, does not propagate antidromically and does not reach the terminal tip 749
(Goldstein et al., 2019). The high terminal Ra, producing short space constant together with 750
depolarization-mediated activation of outwards conductances such as low threshold potassium 751
channels such as Kv1, which were shown to regulate the conductive properties of the peripheral 752
nociceptive fibers (Wang et al., 2016; Alvarez et al., 2019), could prevent antidromic AP 753
propagation from the SIZ. 754
To simulate the activation of the terminal branch by noxious stimuli, we used capsaicin-like 755
current-based stimuli instead of a TRPV1 channel model module. Although it is possible to 756
build an ion-channel module for any given channel based on its biophysical properties (Hines 757
and Carnevale, 1997), often, there is a need to investigate how a single current affects neural 758
excitability without employing biophysical property detailing to simulate it. For example, point- 759
process current-based stimulations similar to the one used here, are utilized to model the effects 760
of various synaptic and dendritic properties on neuronal excitability, instead of using modules of 761
synaptic or voltage-gated channels (Migliore et al., 1999; Magee and Cook, 2000). Here we 762

40
preferred to use current-based stimuli instead of using a complex multimodal model of TRPV1 763
channels since we use a capsaicin stimulation only as means of nociceptor activation. The usage 764
of the point-process stimulation, instead of the complex model of TRPV1 channels, allows 765
studying the effects of various types of noxious stimuli on nociceptive terminals in normal and 766
pathological conditions. 767
Our model predicts that the properties of an individual terminal have a prominent effect on 768
nociception. The axial resistance determines the voltage response to the activating current and 769
the resulting AP firing is defined by the length of the conductive part of the terminal. These 770
features render the nociceptive terminal as a special unit combining properties of two structures 771
known to affect the neuronal gain: a dendritic spine, which increases its synaptic gain by 772
increasing spine-neck axial resistance (Segev and Rall, 1988; Beaulieu-Laroche and Harnett, 773
2018), and the AIS, a conductive compartment showed to elevate neural excitability with its 774
elongation (Kuba et al., 2010). These two structures, although co-exist in a variety of neurons, 775
they are functionally and topologically distant from each other, with spines defining the dendritic 776
input function and the AIS attributed to axonal output function. Here, we show that the 777
nociceptive terminal combines these two functional characteristics into one gain-defining 778
compartment, the terminal branch. Interestingly, both spine-neck Ra and AIS length are 779
considered key to neuronal plasticity (Magee, 2000; Grunditz et al., 2008; Sjöström et al., 2008; 780
Grubb et al., 2011; Araya et al., 2014; Gulledge and Bravo, 2016; Yamada and Kuba, 2016). It 781
is, therefore, reasonable to consider terminals as key regulatory sites for nociceptive plasticity. 782
Thus, changes in the electrical properties of a terminal (Goldstein et al., 2019) could lead to 783
changes in pain perception. For example, our data predict that the change in the density of 784
intracellular organelles at the terminal branch can cause a local increase of the terminal axial 785

41
resistance and thereby an increase in its excitatory characteristics, leading to increased pain. 786
Changes in the electrical properties of a single terminal leading to an increase of its gain could 787
serve as a possible explanation to the state in which a decrease in fiber density due to nerve 788
degeneration leads to increased pain (Chiang et al., 2018). 789
It was recently demonstrated that neuropathic pain following nerve injury was associated with a 790
decreased number of DRG neuronal somata innervating the hypersensitive area (Leibovich et al., 791
2020) and an increased number of axons innervating the area (Duraku et al., 2012). Together 792
these results suggest that each DRG neuron innervating the hypersensitive area increases the 793
complexity of its terminal fibers. Our model predicts that the increase in terminal branching of 794
individual DRG neurons following nerve injury (Leibovich et al., 2020) or inflammation or 795
tumor formation (Cain et al., 2001) augments neuronal excitability and thus may contribute to 796
the development of pain hypersensitivity in neuropathic conditions. 797
Our model also suggests how primary nociceptive neurons encode noxious stimuli and how this 798
encoding may change under pathological conditions. Neurons encode information using both 799
spike rate coding (Adrian and Zotterman, 1926) and temporal coding (Panzeri et al., 2001; 800
Johansson and Birznieks, 2004). Model simulation of hyperexcitable nociceptive states which 801
mimics different pathological conditions shows that nociceptive neuron’ firing differs in the 802
number of APs; however, the peak instantaneous frequency varies only slightly. These 803
differences in spike rate may be too narrow to encode the differences in neuronal excitability. 804
We show that in modeled pathological conditions in which nociceptive neurons become 805
hyperexcitable, the changes in their gain are encoded by the differences in the spike arrival time. 806
The differences in spike patterns between capsaicin and GABA-evoked responses were recently 807
correlated with the differences in the resulting pain sensation following either capsaicin or 808

42
GABA stimulation (Cho et al., 2016). Thus, the difference in the timing pattern of spikes could 809
convey important information regarding the gain of the input-output properties of the nociceptive 810
neurons. 811
In summary, we introduced here a realistic model of the nociceptive terminal tree, which reveals 812
that the structure of the terminal tree plays an important role in defining the function of 813
nociceptive neurons. Our model predicts how activation of the nociceptive neurons with different 814
terminal architecture would change the neuronal response. It also suggests that the changes in the 815
tree architecture in pathological conditions may be sufficient to modify the input-output relation 816
of the primary nociceptive neurons, thus leading to pathological pain. As in all models, although 817
it does not reflect all neuronal morphological and physiological properties, its simplicity allows 818
examining how a change in a specific parameter affects the whole complex multiparameter 819
system. It also could be utilized to test other hypotheses of the physiology and pathophysiology 820
of nociception. For example, we used a capsaicin-like stimulus; however, our model could be 821
adapted to predict how nociceptive neurons respond to other types of noxious stimuli and how 822
these responses vary depending on changes in different ion conductances, electrical properties of 823
the terminal, terminal architecture or under pathological conditions. The knowledge collected 824
from our model gives rise to predictions and speculations, which otherwise could not be 825
achieved with the current experimental tools. Moreover, the results of this theoretical study open 826
new avenues to follow and explore experimentally. 827

43
References 828
Adrian ED, Zotterman Y (1926) The impulses produced by sensory nerve-endings: Part II. The 829
response of a Single End-Organ. J Physiol 61:151-171. 830
Alamri A, Bron R, Brock JA, Ivanusic JJ, Melbourne, VIC, Australia, (2015) Transient receptor 831
potential cation channel subfamily V member 1 expressing corneal sensory neurons can 832
be subdivided into at least three subpopulations. Front Neuroanat 8;9:71. 833
Alamri AS, Wood RJ, Ivanusic JJ, Brock JA (2018) The neurochemistry and morphology of 834
functionally identified corneal polymodal nociceptors and cold thermoreceptors. PLoS 835
One 13. 836
Alvarez P, Bogen O, Levine JD (2019) Interleukin 6 decreases nociceptor expression of the 837
potassium channel KV1.4 in a rat model of hand-arm vibration syndrome. Pain 160:1876-838
1882. 839
Amir R, Michaelis M, Devor M (1999) Membrane potential oscillations in dorsal root ganglion 840
neurons: role in normal electrogenesis and neuropathic pain. J Neurosci 19:8589-8596. 841
Araya R, Vogels TP, Yuste R (2014) Activity-dependent dendritic spine neck changes are 842
correlated with synaptic strength. Proc Natl Acad Sci U S A 111:30. 843
Baker MD (2005) Protein kinase C mediates up-regulation of tetrodotoxin-resistant, persistent 844
Na+ current in rat and mouse sensory neurones. J Physiol 567:851-867. 845
Baker MD, Chandra SY, Ding Y, Waxman SG, Wood JN (2003) GTP-induced tetrodotoxin-846
resistant Na+ current regulates excitability in mouse and rat small diameter sensory 847
neurones. J Physiol 548:373-382. 848
Barkai O, Goldstein RH, Caspi Y, Katz B, Lev S, Binshtok AM (2017) The Role of Kv7/M 849
Potassium Channels in Controlling Ectopic Firing in Nociceptors. Front Mol Neurosci 850
10:181. 851
Barrientos SA, Martinez NW, Yoo S, Jara JS, Zamorano S, Hetz C, Twiss JL, Alvarez J, Court 852
FA (2011) Axonal degeneration is mediated by the mitochondrial permeability transition 853
pore. J Neurosci 31:966-978. 854
Basbaum AI, Bautista DM, Scherrer G, Julius D (2009) Cellular and molecular mechanisms of 855
pain. Cell 139:267-284. 856

44
Beaulieu-Laroche L, Harnett MT (2018) Dendritic Spines Prevent Synaptic Voltage Clamp. 857
Neuron 97:75-82. 858
Bekkers JM (2011) Changes in dendritic axial resistance alter synaptic integration in cerebellar 859
Purkinje cells. Biophys J 100:1198-1206. 860
Belmonte C, Aracil A, Acosta MC, Luna C, Gallar J (2004) Nerves and sensations from the eye 861
surface. Ocul Surf 2:248-253. 862
Binshtok AM (2011) Mechanisms of nociceptive transduction and transmission: a machinery for 863
pain sensation and tools for selective analgesia. International review of neurobiology 864
97:143-177. 865
Blair NT, Bean BP (2002) Roles of Tetrodotoxin (TTX)-Sensitive Na Current, TTX-Resistant 866
Na Current, and Ca Current in the Action Potentials of Nociceptive Sensory Neurons. J 867
Neurosci 22:10277-10290. 868
Blair NT, Bean BP (2003) Role of tetrodotoxin-resistant Na+ current slow inactivation in 869
adaptation of action potential firing in small-diameter dorsal root ganglion neurons. J 870
Neurosci 23:10338-10350. 871
Bouheraoua N, Fouquet S, Marcos-Almaraz MT, Karagogeos D, Laroche L, Chédotal A (2019) 872
Genetic Analysis of the Organization, Development, and Plasticity of Corneal 873
Innervation in Mice. J Neurosci 39:1150-1168. 874
Browne LE, Latremoliere A, Lehnert BP, Grantham A, Ward C, Alexandre C, Costigan M, 875
Michoud F, Roberson DP, Ginty DD, Woolf CJ (2017) Time-Resolved Fast Mammalian 876
Behavior Reveals the Complexity of Protective Pain Responses. Cell Rep 20:89-98. 877
Cain DM, Wacnik PW, Turner M, Wendelschafer-Crabb G, Kennedy WR, Wilcox GL, Simone 878
DA (2001) Functional interactions between tumor and peripheral nerve: changes in 879
excitability and morphology of primary afferent fibers in a murine model of cancer pain. 880
J Neurosci 21:9367-9376. 881
Chartier SR, Mitchell SAT, Majuta LA, Mantyh PW (2018) The Changing Sensory and 882
Sympathetic Innervation of the Young, Adult and Aging Mouse Femur. Neuroscience 883
387:178-190. 884
Chiang H, Chang KC, Kan HW, Wu SW, Tseng MT, Hsueh HW, Lin YH, Chao CC, Hsieh ST 885
(2018) Physiological and pathological characterization of capsaicin-induced reversible 886
nerve degeneration and hyperalgesia. Eur J Pain 22:1043-1056. 887

45
Cho K, Jang JH, Kim SP, Lee SH, Chung SC, Kim IY, Jang DP, Jung SJ (2016) Analysis of 888
Nociceptive Information Encoded in the Temporal Discharge Patterns of Cutaneous C-889
Fibers. Front Comput Neurosci 10. 890
Choi JS, Waxman SG (2011) Physiological interactions between Na(v)1.7 and Na(v)1.8 sodium 891
channels: a computer simulation study. J Neurophysiol 106:3173-3184. 892
Cummins TR, Dib-Hajj SD, Black JA, Akopian AN, Wood JN, Waxman SG (1999) A novel 893
persistent tetrodotoxin-resistant sodium current in SNS-null and wild-type small primary 894
sensory neurons. J Neurosci 19:RC43. 895
Dezhdar T, Moshourab RA, Fründ I, Lewin GR, Schmuker M (2015) A Probabilistic Model for 896
Estimating the Depth and Threshold Temperature of C-fiber Nociceptors. Sci Rep. 897
2015 Dec 7;5:17670. 898
Dib-Hajj SD, Cummins TR, Black JA, Waxman SG (2010) Sodium channels in normal and 899
pathological pain. Annu Rev Neurosci 33:325-347. 900
Dubin AE, Patapoutian A (2010) Nociceptors: the sensors of the pain pathway. J Clin Invest 901
120:3760-3772. 902
Duraku LS, Hossaini M, Hoendervangers S, Falke LL, Kambiz S, Mudera VC, Holstege JC, 903
Walbeehm ET, Ruigrok TJ (2012) Spatiotemporal dynamics of re-innervation and 904
hyperinnervation patterns by uninjured CGRP fibers in the rat foot sole epidermis after 905
nerve injury. Mol Pain 30;8:61. 906
Ferrante M, Migliore M, Ascoli GA (2013) Functional impact of dendritic branch-point 907
morphology. J Neurosci 33:2156-2165. 908
Gemes G, Koopmeiners A, Rigaud M, Lirk P, Sapunar D, Bangaru ML, Vilceanu D, Garrison 909
SR, Ljubkovic M, Mueller SJ, Stucky CL, Hogan QH (2013) Failure of action potential 910
propagation in sensory neurons: mechanisms and loss of afferent filtering in C-type units 911
after painful nerve injury. J Physiol 591:1111-1131. 912
Gidon A, Segev I (2012) Principles governing the operation of synaptic inhibition in dendrites. 913
Neuron 75:330-341. 914
Gold MS, Gebhart GF (2010) Nociceptor sensitization in pain pathogenesis. Nat Med 16:1248-915
1257. 916

46
Goldstein RH, Katz B, Lev S, Binshtok AM (2017) Ultrafast optical recording reveals distinct 917
capsaicin-induced ion dynamics along single nociceptive neurite terminals in vitro. J 918
Biomed Opt 22:76010. 919
Goldstein RH, Barkai O, Íñigo-Portugués A, Katz B, Lev S, Binshtok AM (2019) Location and 920
Plasticity of the Sodium Spike Initiation Zone in Nociceptive Terminals In Vivo. Neuron 921
102:801-812. 922
Grubb MS, Shu Y, Kuba H, Rasband MN, Wimmer VC, Bender KJ (2011) Short- and long-term 923
plasticity at the axon initial segment. J Neurosci 31:16049-16055. 924
Grunditz A, Holbro N, Tian L, Zuo Y, Oertner TG (2008) Spine neck plasticity controls 925
postsynaptic calcium signals through electrical compartmentalization. J Neurosci 926
28:13457-13466. 927
Gudes S, Barkai O, Caspi Y, Katz B, Lev S, Binshtok AM (2015) The role of slow and persistent 928
TTX-resistant sodium currents in acute tumor necrosis factor-alpha-mediated increase in 929
nociceptors excitability. J Neurophysiol 113:601-619. 930
Gulledge AT, Bravo JJ (2016) Neuron Morphology Influences Axon Initial Segment Plasticity. 931
eNeuro 3:0085-0015. 932
Heppelmann B, Messlinger K, Neiss WF, Schmidt RF (1990) Ultrastructural three-dimensional 933
reconstruction of group III and group IV sensory nerve endings ("free nerve endings") in 934
the knee joint capsule of the cat: evidence for multiple receptive sites. J Comp Neurol 935
292:103-116. 936
Heppelmann B, Messlinger K, Neiss WF, Schmidt RF (1994) Mitochondria in fine afferent nerve 937
fibres of the knee joint in the cat: a quantitative electron-microscopical examination. Cell 938
Tissue Res 275:493-501. 939
Heppelmann B, Gallar J, Trost B, Schmidt RF, Belmonte C (2001) Three-dimensional 940
reconstruction of scleral cold thermoreceptors of the cat eye. J Comp Neurol 441:148-941
154. 942
Herzog RI, Cummins TR, Waxman SG (2001) Persistent TTX-resistant Na+ current affects 943
resting potential and response to depolarization in simulated spinal sensory neurons. J 944
Neurophysiol 86:1351-1364. 945
Hines ML, Carnevale NT (1997) The NEURON simulation environment. Neural Comput 946
9:1179-1209. 947

47
Hoyes AD, Barber P (1976) Ultrastructure of the corneal nerves in the rat. Cell Tissue Res 948
172:133-144. 949
Ivanusic JJ, Wood RJ, Brock JA (2013) Sensory and sympathetic innervation of the mouse and 950
guinea pig corneal epithelium. J Comp Neurol 521:877-893. 951
Jadi M, Polsky A, Schiller J, Mel BW (2012) Location-dependent effects of inhibition on local 952
spiking in pyramidal neuron dendrites. PLoS Comput Biol (6):e1002550. 953
Jamieson J, Boyd HD, McLachlan EM (2003) Simulations to derive membrane resistivity in 954
three phenotypes of guinea pig sympathetic postganglionic neuron. J Neurophysiol 955
89:2430-2440. 956
Jarvis S, Nikolic K, Schultz SR (2018) Neuronal gain modulability is determined by dendritic 957
morphology: A computational optogenetic study. PLoS Comput Biol 9;14(3):e1006027. 958
Johansson RS, Birznieks I (2004) First spikes in ensembles of human tactile afferents code 959
complex spatial fingertip events. Nat Neurosci 7:170-177. 960
Kispersky TJ, Caplan JS, Marder E (2012) Increase in sodium conductance decreases firing rate 961
and gain in model neurons. J Neurosci 32:10995-11004. 962
Kleggetveit IP, Namer B, Schmidt R, Helas T, Ruckel M, Orstavik K, Schmelz M, Jorum E 963
(2012) High spontaneous activity of C-nociceptors in painful polyneuropathy. Pain 964
153:2040-2047. 965
Komagiri Y, Kitamura N (2003) Effect of intracellular dialysis of ATP on the hyperpolarization-966
activated cation current in rat dorsal root ganglion neurons. J Neurophysiol 90:2115-967
2122. 968
Kuba H, Ishii TM, Ohmori H (2006) Axonal site of spike initiation enhances auditory 969
coincidence detection. Nature 444:1069-1072. 970
Kuba H, Oichi Y, Ohmori H (2010) Presynaptic activity regulates Na(+) channel distribution at 971
the axon initial segment. Nature 465:1075-1078. 972
Lakatos S, Jancsó G, Horváth Á, Dobos I, Sántha P (2020) Longitudinal Study of Functional 973
Reinnervation of the Denervated Skin by Collateral Sprouting of Peptidergic Nociceptive 974
Nerves Utilizing Laser Doppler Imaging. Front Physiol 11:439. 975
Leibovich H, Buzaglo N, Tsuriel S, Peretz L, Caspi Y, Katz B, Lev S, Lichtstein D, Binshtok 976
AM (2020) Abnormal Reinnervation of Denervated Areas Following Nerve Injury 977
Facilitates Neuropathic Pain. Cells 9(4):1007. 978

48
Lesniak DR, Marshall KL, Wellnitz SA, Jenkins BA, Baba Y, Rasband MN, Gerling GJ, 979
Lumpkin EA (2014) Computation identifies structural features that govern neuronal 980
firing properties in slowly adapting touch receptors. Elife 3: e01488. 981
Levy D, Tal M, Höke A, Zochodne DW (2000) Transient action of the endothelial constitutive 982
nitric oxide synthase (ecNOS) mediates the development of thermal hypersensitivity 983
following peripheral nerve injury. Eur J Neurosci 12:2323-2332. 984
Liu CN, Michaelis M, Amir R, Devor M (2000) Spinal nerve injury enhances subthreshold 985
membrane potential oscillations in DRG neurons: relation to neuropathic pain. J 986
Neurophysiol 84:205-215. 987
Magee JC (2000) Dendritic integration of excitatory synaptic input. Nat Rev Neurosci 1:181-988
190. 989
Magee JC, Cook EP (2000) Somatic EPSP amplitude is independent of synapse location in 990
hippocampal pyramidal neurons. Nat Neurosci 3:895-903. 991
Magee JC, Johnston D (2005) Plasticity of dendritic function. Curr Opin Neurobiol 15:334-342. 992
Mainen ZF, Sejnowski TJ (1996) Influence of dendritic structure on firing pattern in model 993
neocortical neurons. Nature 382:363-366. 994
Mancini F, Bauleo A, Cole J, Lui F, Porro CA, Haggard P, Iannetti GD (2014) Whole-body 995
mapping of spatial acuity for pain and touch. Ann Neurol 75:917-924. 996
Manor Y, Koch C, Segev I (1991) Effect of geometrical irregularities on propagation delay in 997
axonal trees. Biophys J 60:1424-1437. 998
Migliore M, Hoffman DA, Magee JC, Johnston D (1999) Role of an A-type K+ conductance in 999
the back-propagation of action potentials in the dendrites of hippocampal pyramidal 1000
neurons. J Comput Neurosci 7:5-15. 1001
Miyasho T, Takagi H, Suzuki H, Watanabe S, Inoue M, Kudo Y, Miyakawa H (2001) Low-1002
threshold potassium channels and a low-threshold calcium channel regulate Ca2+ spike 1003
firing in the dendrites of cerebellar Purkinje neurons: a modeling study. Brain Res 1004
891:106-115. 1005
Murthy SE, Loud MC, Daou I, Marshall KL, Schwaller F, Kühnemund J, Francisco AG, Keenan 1006
WT, Dubin AE, Lewin GR, Patapoutian A (2018) The mechanosensitive ion channel 1007
Piezo2 mediates sensitivity to mechanical pain in mice. Sci Transl Med 1008
10(462):eaat9897. 1009

49
Müller LJ, Pels L, Vrensen GF (1996) Ultrastructural organization of human corneal nerves. 1010
Invest Ophthalmol Vis Sci 37:476-488. 1011
Nimchinsky EA, Sabatini BL, Svoboda K (2002) Structure and function of dendritic spines. 1012
Annu Rev Physiol 64:313-353. 1013
Nita, II, Caspi Y, Gudes S, Fishman D, Lev S, Hersfinkel M, Sekler I, Binshtok AM (2016) 1014
Privileged crosstalk between TRPV1 channels and mitochondrial calcium shuttling 1015
machinery controls nociception. Biochim Biophys Acta 1863:2868-2880. 1016
Olivares E, Salgado S, Maidana JP, Herrera G, Campos M, Madrid R, Orio P (2015) TRPM8-1017
Dependent Dynamic Response in a Mathematical Model of Cold Thermoreceptor. PLoS 1018
One 10:e0139314. 1019
Olson W, Abdus-Saboor I, Cui L, Burdge J, Raabe T, Ma M, Luo W (2017) Sparse genetic 1020
tracing reveals regionally specific functional organization of mammalian nociceptors. 1021
Elife 12:29507. 1022
Panzeri S, Petersen RS, Schultz SR, Lebedev M, Diamond ME (2001) The role of spike timing 1023
in the coding of stimulus location in rat somatosensory cortex. Neuron 29:769-777. 1024
Persson AK, Black JA, Gasser A, Cheng X, Fischer TZ, Waxman SG (2010) Sodium-calcium 1025
exchanger and multiple sodium channel isoforms in intra-epidermal nerve terminals. Mol 1026
Pain 6:84. 1027
Qu L, Caterina MJ (2016) Enhanced excitability and suppression of A-type K+ currents in joint 1028
sensory neurons in a murine model of antigen-induced arthritis. In: Sci Rep. 1029
Reeh PW (1986) Sensory receptors in mammalian skin in an in vitro preparation. Neurosci Lett 1030
66:141-146. 1031
Rho YA, Prescott SA (2012) Identification of molecular pathologies sufficient to cause 1032
neuropathic excitability in primary somatosensory afferents using dynamical systems 1033
theory. PLoS Comput Biol 8:24. 1034
Sandkuhler J (2009) Models and mechanisms of hyperalgesia and allodynia. Physiological 1035
reviews 89:707-758. 1036
Segev I, Rall W (1988) Computational study of an excitable dendritic spine. J Neurophysiol 1037
60:499-523. 1038

50
Shah MM, Migliore M, Valencia I, Cooper EC, Brown DA (2008) Functional significance of 1039
axonal Kv7 channels in hippocampal pyramidal neurons. Proc Natl Acad Sci U S A 1040
105:7869-7874. 1041
Sjöström PJ, Rancz EA, Roth A, Häusser M (2008) Dendritic excitability and synaptic plasticity. 1042
Physiol Rev 88:769-840. 1043
St Pierre M, Reeh PW, Zimmermann K (2009) Differential effects of TRPV channel block on 1044
polymodal activation of rat cutaneous nociceptors in vitro. Experimental brain research 1045
Experimentelle Hirnforschung Expérimentation cérébrale 196:31-44. 1046
Sundt D, Gamper N, Jaffe DB (2015) Spike propagation through the dorsal root ganglia in an 1047
unmyelinated sensory neuron: a modeling study. J Neurophysiol 114:3140-3153. 1048
Tal M, Devor M (1992) Ectopic discharge in injured nerves: comparison of trigeminal and 1049
somatic afferents. Brain Res 579:148-151. 1050
Treede RD, Meyer RA, Campbell JN (1990) Comparison of heat and mechanical receptive fields 1051
of cutaneous C-fiber nociceptors in monkey. J Neurophysiol 64:1502-1513. 1052
Vandewauw I, De Clercq K, Mulier M, Held K, Pinto S, Van Ranst N, Segal A, Voet T, 1053
Vennekens R, Zimmermann K, Vriens J, Voets T (2018) A TRP channel trio mediates 1054
acute noxious heat sensing. Nature 555:662-666. 1055
Vasylyev DV, Waxman SG (2012) Membrane properties and electrogenesis in the distal axons 1056
of small dorsal root ganglion neurons in vitro. J Neurophysiol 108:729-740. 1057
Wang XC, Wang S, Zhang M, Gao F, Yin C, Li H, Zhang Y, Hu SJ, Duan JH (2016) Α-1058
Dendrotoxin-sensitive Kv1 channels contribute to conduction failure of polymodal 1059
nociceptive C-fibers from rat coccygeal nerve. J Neurophysiol 115:947-957. 1060
Waxman SG, Zamponi GW (2014) Regulating excitability of peripheral afferents: emerging ion 1061
channel targets. Nat Neurosci 17:153-163. 1062
Weidner C, Schmidt R, Schmelz M, Torebjork HE, Handwerker HO (2003) Action potential 1063
conduction in the terminal arborisation of nociceptive C-fibre afferents. J Physiol 1064
547:931-940. 1065
Williams SR, Stuart GJ (2003) Role of dendritic synapse location in the control of action 1066
potential output. Trends Neurosci 26:147-154. 1067
Woolf CJ, Ma Q (2007) Nociceptors--noxious stimulus detectors. Neuron 55:353-364. 1068

51
Yamada R, Kuba H (2016) Structural and Functional Plasticity at the Axon Initial Segment. 1069
Front Cell Neurosci 10:250. 1070
Zimmermann K, Hein A, Hager U, Kaczmarek JS, Turnquist BP, Clapham DE, Reeh PW (2009) 1071
Phenotyping sensory nerve endings in vitro in the mouse. Nature protocols 4:174-196. 1072
Zylka MJ, Rice FL, Anderson DJ (2005) Topographically distinct epidermal nociceptive circuits 1073
revealed by axonal tracers targeted to Mrgprd. Neuron 45:17-25. 1074
1075
1076

52
Figure Legends 1077
Figure 1. The response of a nociceptive neuron to a capsaicin-like current depends on the 1078
morphology of the nociceptive terminal tree. A. Scheme depicting the model of the primary 1079
nociceptive neuron. The peripheral terminal tree morphology is rendered from the structure of a 1080
terminal innervating glabrous skin of mice paw in vivo. The terminal tree consists of 14 terminal 1081
branches of different lengths. Inset depicts the functional organization of a terminal branch. The 1082
first 25 m of each terminal branch does not express Navs (Nav-less, light grey). The Nav 1083
expression starts from the spike initiation zone (SIZ) and continues for the rest of the fiber 1084
(conductive part, red). The terminal branch length is defined by the length of the conductive part, 1085
which differs among the terminals and the Nav-less part, which has a constant length of 25 m. 1086
The complex terminal tree morphology consists of the simplified version of the balanced binary 1087
tree (red terminal branches) in which two branches converge into one node (convergence point) 1088
and a degenerate binary tree, in which one branch converges into the fiber (blue terminal 1089
branches). The terminal branches converge into the mother branches, which then converge into 1090
the common branch (green branch). The stimulations are applied to the terminal branch end (red 1091
arrow in the inset), and the recording electrode is placed at the central terminal. B. The locations 1092
of the stimulations. The stimulated terminal or all terminals are marked by the red arrows, and 1093
single stimulated terminals are color-coded. C - D. Simulated voltage-clamp recordings from a 1094
central terminal following stimulation of a single terminal (yellow) and all terminals (light blue) 1095
by single brief 3 ms square current of 50 pA (C) or train of brief 3 ms square current of 50 pA 1096
applied at 12 Hz (D). Note, no difference in firing between stimulating one all terminals. E. 1097
Same as C, but the terminals are stimulated by simulated capsaicin-like current (see Methods). 1098
Note that in this case, the firing following stimulation of one terminal differs from the firing 1099

53
resulting from stimulation of all terminals. F. Instantaneous discharge frequencies following 1100
stimulation with a train of brief 3 ms square current of 50 pA applied at 12 Hz (lower inset) of a 1101
single terminal (yellow), and all terminals (light blue). Shadowed area outlines the time of the 1102
stimulation. Note, no difference in peak instantaneous frequency (upper inset). G. Same as in E 1103
but following stimulation with a capsaicin-like current (color-coded as in E). Shadowed area 1104
outlines the 500 ms of a capsaicin-like current step. Note, an increase in peak instantaneous 1105
frequency when all the terminals are stimulated (upper inset, light blue). 1106
Figure 2. Stimulation of multiple terminals allows summation of the voltage and facilitates 1107
nociceptive response. A. Upper, scheme depicting the experimental conditions: either one (blue) 1108
or both (red) 75 m length terminal branches converging into the same convergence point in the 1109
symmetrical binary tree were stimulated by a capsaicin-like current. Lower, the resulted response 1110
recorded after the convergence point. Note that simultaneous activation of both terminals 1111
generated two APs (red trace), with higher after depolarization (inset). B. With all the Nav 1112
conductances annulled, activation of either one or two terminals with a capsaicin-like current 1113
produced similar depolarization measured before the bifurcation C. Activation of two terminals 1114
led to substantially higher depolarization (red) after the converging point than activation of only 1115
one terminal (blue). The AP firing following activation of two terminals, shown in A is 1116
superimposed with the voltage traces to show that the depolarization evoked by the activation of 1117
two terminals remained high also at the time after the refractory period of the AP. The red 1118
shadowed area outlines the refractory period (49 ms), and the grey shadowed area outlines the 1119
time of the summated post-AP depolarization. 1120
1121

54
Figure 3. In a symmetrical nociceptive terminal tree, an increased number of stimulated 1122
terminals facilitates nociceptive response. A. Scheme depicting the model of the symmetrical 1123
binary trees of different complexities determined by the number of bifurcation stages (nl, see 1124
Methods), which defines the number of terminal branches. B. Responses detected at the central 1125
terminal following stimulation of either single terminal branch (yellow), pair of sister terminal 1126
branches converging into the same converging point (purple) and all terminals (blue) by a 1127
capsaicin-like current (depicted below the traces) applied to the representative nl = 3, nl =5 and nl 1128
= 7 trees. C. The number of APs plotted as a function of the number of bifurcation stages, 1129
following stimulation of a single terminal branch (yellow), pair of sister terminal branches 1130
converging into the same convergence point (purple) and all terminals (blue) by a capsaicin-like 1131
current. D. Instantaneous discharge frequencies following stimulation with a capsaicin-like 1132
current (shown below) applied to all terminals of the trees of different complexity (nl). Inset: 1133
peak instantaneous frequency (color-coded as in D). 1134
Figure 4. Complex terminal trees affect nociceptive gain partially by virtue of the length of 1135
their conductive parts. A. Scheme of the experiment, the length of the common branch (green) 1136
was changed without changing the number of terminal branches. All terminals were 1137
simultaneously stimulated by a capsaicin-like current, and the resulted activity was measured at 1138
the central terminal. B. The number of APs recorded at the central terminal (left) and their peak 1139
instantaneous frequency (right) plotted as a function of the length of the common branch. 1140
1141

55
Figure 5. In an asymmetrical degenerate nociceptive terminal tree, an increased number of 1142
stimulated terminals facilitates nociceptive response. A. Scheme depicting the model of the 1143
degenerate binary trees of different complexities determined by the number of bifurcation stages 1144
(nl, see Methods), which defines the number of terminal branches. B. Responses detected at the 1145
central terminal following stimulation of either single terminal branch (yellow), pair of adjacent 1146
terminal branches (purple) and all terminals (blue) by a capsaicin-like current (depicted below 1147
the traces) applied to the representative nl = 3, nl = 5 and nl = 7 trees. C. The number of APs 1148
plotted as a function of the number of bifurcation stages, following stimulation of a single 1149
terminal branch (yellow), pair of adjacent terminal branches (purple) and all terminals (blue) by a 1150
capsaicin-like current. D. Instantaneous discharge frequencies following stimulation with a 1151
capsaicin-like current (shown below) applied to all terminals of the trees of different complexity 1152
(nl). Inset: instantaneous peak frequency (color-coded as in D). 1153
Figure 6. The location of a single terminal branch defines its contribution to the terminal 1154
response. A. Upper panels, schemes depicting the locations of the stimulation. Left lower panel, 1155
AP firing detected at the central terminal following stimulation of single 175 m terminal branch 1156
located close to the terminal branch (navy blue terminal at the upper panel). Right lower panel, 1157
superimposition of the traces obtained following stimulation of all terminal branches (light blue) 1158
and stimulation of a single 175 m terminal branch shown in the left. Note that the firing is 1159
identical. B. Instantaneous frequencies plotted as a function of time, following stimulation by a 1160
capsaicin-like current of a single 175 m terminal branch shown in A, left (navy blue triangle), 1161
or all terminal branches (light blue circle). Shadowed area outlines the 500 ms of a capsaicin-like 1162
current step. C. Same as A, but the terminal stimulated in A was shortened to 75 m. The 1163
stimulation of this terminal branch resulted in the firing of three APs (lower left). The stimulation 1164

56
of this terminal branch, together with the similar adjacent terminal branch, led to the generation 1165
of four APs (lower middle) and was substantially lower than the firing resulted from stimulation 1166
of all the terminal branches (lower right). 1167
Figure 7. The length of the terminal branch affects the response to a capsaicin-like current. 1168
A-C. Simulated voltage-clamp recordings from a central terminal following stimulation of single 1169
terminal branches of different length (75 m, yellow, A, 100 m, green, B, and 175 m, dark 1170
blue, C), by a capsaicin-like current. Note that the firing depends on the lengths of the stimulated 1171
terminal branch. 1172
Figure 8. The axial resistance of the terminal branch’s conductive part determines the 1173
nociceptive gain. A. Upper, the scheme of the stimulated terminal branch with the location of 1174
the recording pipette 2.5 m before the SIZ. The Nav conductances at the conductive part were 1175
annulled to prevent the effect of the APs on the measurements of the terminal membrane 1176
potential. Lower, the heatmap representing the relation between the axial resistance of the 1177
conductive part (Ra), the conductive part length, and the depolarization of the terminal 1178
membrane recorded at the Nav-less part, 2.5 m before the SIZ. The resulted membrane 1179
potential is color-coded (shown on the right). Note that when the Ra of the conductive part is 1180
similar to the Ra of the proximal fiber (1 X Ra), the depolarization resulted from the application 1181
of a capsaicin-like current to the terminal tip is substantially lower than when Ra is higher. B. 1182
Same as A, but the recordings are performed at the SIZ. C. The relation between the axial 1183
resistance of the conductive part (Ra), the conductive part length, and the AP firing measured at 1184
the central terminal following stimulation of a single terminal. The Nav conductance of the 1185
conductive part is intact. The AP count is color-coded (shown on the right). 1186

57
Figure 9. The length of the conductive parts affects the nociceptive gain by defining the 1187
level of Nav 1.8 and Nav 1.9 conductances. A. Left, a trace of the response to the stimulation 1188
(red arrow) of the 50 m terminal branch (yellow) with the Nav1.8 conductance at the control 1189
level (100%). Stimulation of the same terminal branch but with increased Nav1.8 (145%) 1190
conductance led to higher firing (middle), which was compatible with the stimulation of longer 1191
(125 m) terminal branch with the control (100%) Nav1.8 conductance (right). B. The heatmap 1192
representing the relation between the length of the conductive part, the relative level of Nav 1193
conductance, and the AP firing measured at the central terminal following stimulation of a single 1194
terminal. The AP count is color-coded (shown on the right). Note that firing following the 1195
stimulation of the terminals with the 100% Nav 1.8 conductance is increased when the Nav 1196
conductance is increased. Note also that the decrease in Nav 1.8 conductance in the long terminal 1197
branches, which normally triggers a high number of APs, led to a dramatic reduction of firing. 1198
C and D. Same as A and B but showing the relation between Nav1.9 conductance, the 1199
conductive part length, and the AP firing at the central terminal. 1200
Figure 10. Temporal summation by the nociceptive terminal tree. A. Scheme of normally 1201
distributed random time onset for a single of n terminal stimulations (N). After a capsaicin 1202
current is generated (red) its stimulation onset time is shifted to a normal distribution (blue) 1203
random onset time with a standard deviation (σ). n stimulations are then each applied to a single 1204
terminal index with respect to its index (1..n). B. Scheme depicting the model of a 7 bifurcation 1205
stages balanced binary tree. Each of the time-randomized stimulations (N[1..n]) is applied to a 1206
terminal nerve-ending (grey arrows). C. The number of APs generated as a function of the 1207
logarithmic scaling of normal distribution standard deviation onset time of a capsaicin-like 1208
current in all terminals. The activity was measured at the central terminal. 1209

58
Figure 11. In modeled inflammatory and neuropathic conditions, the change in response is 1210
encoded by alteration in the temporal pattern of the spike trains. A. Scheme of the 1211
experiment: in the “normal” condition, the SIZ is located 25 m from the terminal end, and the 1212
terminal membrane potential is quiescent. The inflammatory hyperalgesia is modeled by shifting 1213
the SIZ 5 m towards the terminal tip. The neuropathic hyperalgesia is modeled by injected to 1214
the model sub- or suprathreshold current noise (see Methods). The insets show the recording of 1215
the membrane voltage following the application of sub- and suprathreshold noise. B. Responses 1216
detected at the central terminals following activation of all terminal branches by a capsaicin-like 1217
current in normal conditions (black), in the conditions of the inflammatory hyperalgesia (red) 1218
and in the conditions of the neuropathic hyperalgesia with the injection of subthreshold noise 1219
(purple) and suprathreshold noise (orange). The AP count was performed for a first 5 s after a 1220
capsaicin-like current application (outlined by the dashed-line rectangle). Inset: superimposition 1221
of the traces obtained in normal conditions and in the inflammatory hyperalgesia conditions at 1222
the time outlined by the gray dashed-line rectangle. Note the difference in the pattern of firing. 1223
C. Instantaneous discharge frequencies following stimulation with a capsaicin-like current 1224
(shown below) applied to all terminal branches in normal conditions (black), in the conditions of 1225
the inflammatory hyperalgesia (red) and in the conditions of the neuropathic hyperalgesia with 1226
the injection of subthreshold noise (purple) and suprathreshold noise (orange). Insets show 1227
expanded x-axis. D. A spike raster plot showing the AP timing, following stimulation of all 1228
terminal branches with a capsaicin-like current, in normal conditions (black), in the conditions of 1229
the inflammatory hyperalgesia (red) and in the conditions of the neuropathic hyperalgesia with 1230
the injection of subthreshold noise (purple) and suprathreshold noise (orange). Insets show 1231

59
expanded x-axis. The data describing the normal conditions are taken from Figure 1 and showed 1232
here for better comparison. 1233
Figure 12. The effect of the morphology of the nociceptive terminal tree on the input-1234
output properties of the primary nociceptive neuron. A figure summarizing the effect of the 1235
terminal structure on its function. Activation of all terminal branches in a simplified “realistic” 1236
terminal tree (all the terminal branches are of equal size of 75 m, and they are evenly 1237
distributed along the degenerate and symmetrical parts of the complex terminal, black) by 1238
capsaicin-like stimulus led to the response whose gain (A, lower panels) and AP temporal 1239
pattern (B, C, showing the instantaneous frequency and spike raster plot, respectively) are 1240
depending on the terminal morphological characteristics, such as change on the number in 1241
terminal branches and the properties of the individual branch. The increase in the number of 1242
activated terminal branches (red) led to increased firing; the decrease in branching (blue) led to 1243
decreased firing. Terminal tree with short and thick (lower conductive part’s Ra) terminal 1244
branches demonstrate lower gain (green), whereas a terminal tree with long terminals has a 1245
higher gain (orange). All the perturbations in terminal morphology change the timing pattern of 1246
firing (B, C). 1247
1248