the ins and outs of business development...
TRANSCRIPT

The Ins and Outs ofBUSINESS DEVELOPMENT COMPANIES
MERCER CAPITAL

© Mercer Capital 2013 | www.mercercapital.com 2
The Ins and Outs of Business Development Companies December, 2013
IntroductionWith more than thirty five public registrants reporting
nearly $40 billion of assets under management, business
development companies, or BDCs, are increasingly
important financial intermediaries, matching a wide variety of
businesses needing capital with yield-hungry investors eager
to provide it.
Compared to private equity funds, BDCs have historically
garnered less media and investor awareness, although the
persistent low yield environment has helped to raise the
profile of BDCs. Like private equity funds, BDCs invest in
a portfolio of generally illiquid securities of privately held
companies. Unlike private equity funds, which are structured
as finite-lived investment partnerships, BDCs are publicly
traded vehicles accessible to retail investors, providing
permanent capital for investment. As long as certain
distribution requirements are met, BDCs are not subject to
income tax. Like any other publicly traded company, a BDC
must file quarterly and annual reports with the SEC. These
reports provide a window into the trends and economic
factors influencing the broader universe of investors providing
debt and equity capital to middle market companies.
The purpose of this whitepaper is to review the principal
financial statement components of BDCs with a view to
clarifying the factors that are most likely to influence financial
performance.
The Balance SheetThe relative value of BDC shares is often evaluated with
reference to the corresponding net asset value (book value)
per share. Figure 1 presents the aggregate balance sheet
for a group of 28 BDCs at September 30, 2013.
Investment Portfolio
The largest asset category on a BDCs balance sheet is
the investment portfolio. A BDC’s investment strategy will
be manifest in the composition (and risk) of the investment
portfolio. At the most conservative end, some BDCs invest
almost exclusively in senior secured loans. Moving down the
Figure 1Aggregate BDC Balance SheetDollars in millions
% of %
Sep-13 Assets Sep-12 Change
Investment Portfolio (at FV) 34,684.7 90.1% 28,421.7 22.0%
Cash & Equivalents 1,941.4 5.0% 1,390.1 39.7%
Other Assets 1,854.1 4.8% 1,696.6 9.3%
TOTAL ASSETS 38,480.2 100.0% 31,508.4 22.1%
Interest-Bearing Debt 12,445.3 32.3% 9,163.6 35.8%
Other Liabilities 1,220.5 3.2% 1,108.0 10.2%
Total Liabilities 13,665.8 35.5% 10,271.6 33.0%
Shareholders' Equity 24,814.4 64.5% 21,236.8 16.8%
TOTAL LIAB & EQUITY 38,480.2 100.0% 31,508.4 22.1%
Source: SEC Filings, Mercer Capital Analysis
BDCs included in group: ARCC, ACAS, PSEC, AINV, FSC, SLRC, BKCC,
PNNT, HTGC, MAIN, TICC, GBDC, TCAP, MCGC, MVC, TCRD, GAIN, MCC,
FDUS, GLAD, KCAP, NGPC, GSVC, SUNS, HRZN, PFLT, SAR, FULL
© Mercer Capital 2013 | www.mercercapital.com 3
The Ins and Outs of Business Development Companies December, 2013
right hand side of the borrower’s balance sheet, other BDCs
add increasing amounts of subordinated debt, preferred
equity, and common equity in the search for higher returns
and capital appreciation.
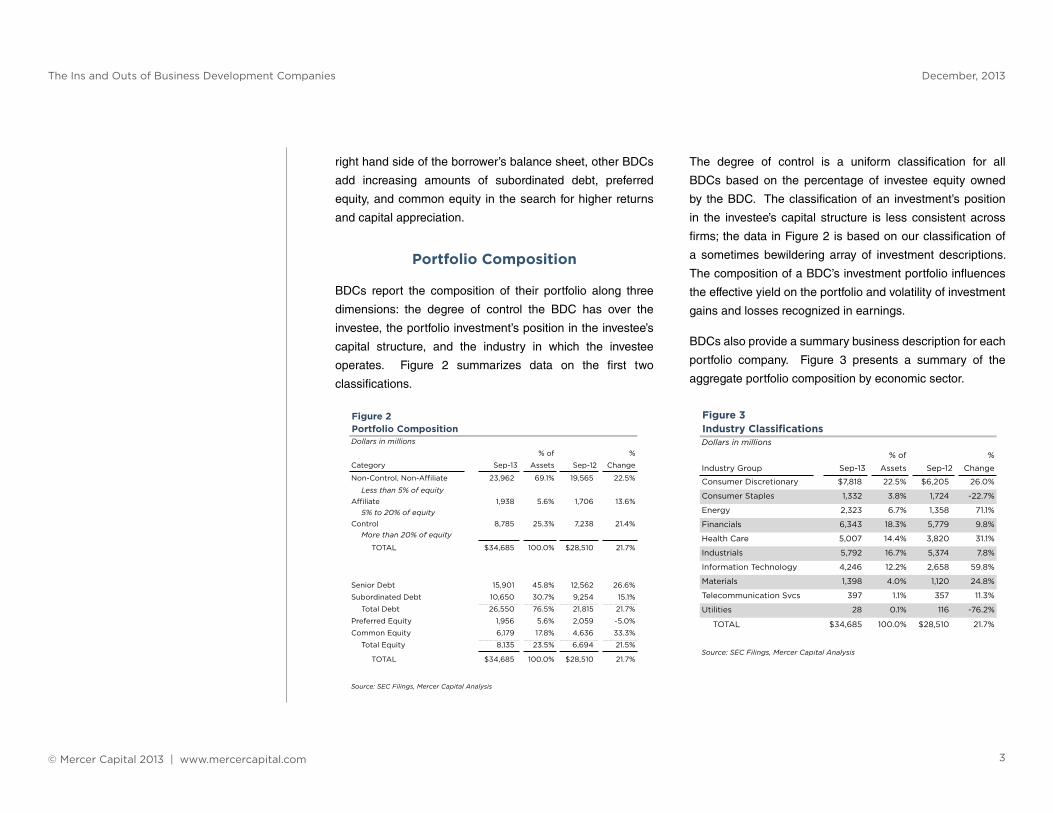
Portfolio Composition
BDCs report the composition of their portfolio along three
dimensions: the degree of control the BDC has over the
investee, the portfolio investment’s position in the investee’s
capital structure, and the industry in which the investee
operates. Figure 2 summarizes data on the first two
classifications.
The degree of control is a uniform classification for all
BDCs based on the percentage of investee equity owned
by the BDC. The classification of an investment’s position
in the investee’s capital structure is less consistent across
firms; the data in Figure 2 is based on our classification of
a sometimes bewildering array of investment descriptions.
The composition of a BDC’s investment portfolio influences
the effective yield on the portfolio and volatility of investment
gains and losses recognized in earnings.
BDCs also provide a summary business description for each
portfolio company. Figure 3 presents a summary of the
aggregate portfolio composition by economic sector.
Figure 2Portfolio CompositionDollars in millions
% of %
Category Sep-13 Assets Sep-12 Change
Non-Control, Non-Affiliate 23,962 69.1% 19,565 22.5%
Less than 5% of equityAffiliate 1,938 5.6% 1,706 13.6%
5% to 20% of equityControl 8,785 25.3% 7,238 21.4%
More than 20% of equity
TOTAL $34,685 100.0% $28,510 21.7%
Senior Debt 15,901 45.8% 12,562 26.6%
Subordinated Debt 10,650 30.7% 9,254 15.1%
Total Debt 26,550 76.5% 21,815 21.7%
Preferred Equity 1,956 5.6% 2,059 -5.0%
Common Equity 6,179 17.8% 4,636 33.3%
Total Equity 8,135 23.5% 6,694 21.5%
TOTAL $34,685 100.0% $28,510 21.7%
Source: SEC Filings, Mercer Capital Analysis
Figure 3Industry ClassificationsDollars in millions
% of %
Industry Group Sep-13 Assets Sep-12 Change
Consumer Discretionary $7,818 22.5% $6,205 26.0%
Consumer Staples 1,332 3.8% 1,724 -22.7%
Energy 2,323 6.7% 1,358 71.1%
Financials 6,343 18.3% 5,779 9.8%
Health Care 5,007 14.4% 3,820 31.1%
Industrials 5,792 16.7% 5,374 7.8%
Information Technology 4,246 12.2% 2,658 59.8%
Materials 1,398 4.0% 1,120 24.8%
Telecommunication Svcs 397 1.1% 357 11.3%
Utilities 28 0.1% 116 -76.2%
TOTAL $34,685 100.0% $28,510 21.7%
Source: SEC Filings, Mercer Capital Analysis
© Mercer Capital 2013 | www.mercercapital.com 4
The Ins and Outs of Business Development Companies December, 2013
While Figures 2 and 3 present aggregate portfolio statistics
for BDCs, the composition of individual portfolios can deviate
significantly from that of the overall group. Investment
strategies include targeting a particular point in the investee’s
capital structure and/or focusing on particular industries. A
comparison of portfolio composition across BDCs can provide
investors with relevant information regarding potential future
earnings and dividends for a particular BDC.
Fair Value
BDCs are required to report investments on the balance sheet
at fair value rather than historical cost. Fair value is defined in
ASC 820 as “the price that would be received to sell an asset
or paid to transfer a liability in an orderly transaction between
market participants at the measurement date.”1
Fair value is measured from the perspective of a market
participant that is a party to a hypothetical transaction for the
subject asset or liability at the measurement date. Market
participants are defined as 1) unrelated parties, who are
2) knowledgeable of the subject asset, 3) able to transact,
and 4) motivated but not compelled to transact.2 Fair value
is the so-called “exit price” of the subject asset for a market
participant in the principal or (in the absence of such a
market) most advantageous market for the asset.
ASC 820 states that valuation techniques consistent
with the market approach, income approach, and/or cost
approach should be used to measure fair value. Inputs to the
various valuation techniques may be either observable or
unobservable; the FASB has established a hierarchy which
prioritizes inputs into three broad levels.
» Level 1 inputs are observable quoted prices in
active markets for identical assets;
» Level 2 inputs generally include observable quoted
prices for similar assets in active markets or quoted
prices for identical assets in markets that are not
active; and,
» Level 3 inputs are unobservable inputs that are
developed based upon the best information
available under the circumstances, which might
include the reporting entity’s own data.
Unobservable inputs should reflect the reporting entity’s own
assumptions about the assumptions that market participants
would use in pricing the asset or liability.3
BDCs generally measure the fair value of portfolio
investments using techniques under the market or income
approaches. Valuation techniques are often selected with
reference to the subject investment’s position in the investee’s
capital structure.
» Equity investments are most commonly measured
using a market multiple of EBITDA or some other
performance benchmark to derive the fair value
The inescapable consequence
of fair value reporting is that
the reported value of the
largest asset on a BDCs balance
sheet is subject to a healthy
dose of judgment

© Mercer Capital 2013 | www.mercercapital.com 5
The Ins and Outs of Business Development Companies December, 2013
of the enterprise as a whole. A “waterfall” analysis
is then performed in which the balances of senior
securities are deducted to measure the fair value of
the residual equity. Less frequently, a discounted
cash flow technique under the income approach
is used to measure the fair value of the enterprise
(prior to application of the waterfall) or the subject
equity investment directly.
» Senior debt investments are usually measured with
a yield-based technique under the income approach.
Using this technique, future interest payments
and return of principal are discounted to the
measurement date at a yield that is commensurate
with changes in market yields and coverage ratios
for the subject investment since origination.
» Performing junior debt investments are also usually
measured using a yield-based technique. Fair value
measurement of distressed or non-performing
debt investments may be supplemented by use
of a waterfall methodology (i.e., as if an equity
investment).
The degree of control the BDC exerts over the portfolio
company may also influence the principal or most
advantageous market for an investment, which may affect the
selection of valuation techniques.
The inescapable consequence of fair value reporting is that
the reported value of the largest asset on a BDCs balance
sheet is subject to a healthy dose of judgment. One should
bear in mind, however, that interim fair value measurements
are ultimately exposed to the discipline of realized exits.
In other words, while the inevitable vagaries of fair value
measurement influence the reported earnings of the BDC
from quarter to quarter, the cash flows and dividend-paying
capacity of the BDC are determined by realized investment
exits.
Cash & Equivalents
A BDC’s cash balance provides a measure of the investment
capacity available without accessing the capital markets
or liquidating a portion of the investment portfolio. A larger
cash balance provides greater investing flexibility, but is
also a drag on the effective yield on assets (and, therefore,
on dividend-paying capacity). In other words, the cash
position of a BDC is a trade-off between investment flexibility
and asset yield. As noted in Figure 1, cash & equivalents
represented approximately 5.0% of total BDC assets at
September 30, 2013.
. . . while the inevitable vagaries
of fair value measurement
influence the reported earnings
of the BDC from quarter to
quarter, the cash flows and
dividend-paying capacity of the
BDC are determined by realized
investment exits
© Mercer Capital 2013 | www.mercercapital.com 6
The Ins and Outs of Business Development Companies December, 2013
Interest-Bearing Debt
Financial leverage for BDCs is limited under the 1940 Act to
50% of total assets. As noted in Figure 1, BDCs are currently
maintaining financial leverage well below this limit. Used
judiciously, interest-bearing debt (having a blended effective
pre-tax cost of approximately 5.5% at September 30, 2013)
increases the return on shareholders’ equity. However, in a
period of falling asset values (as experienced in 2008 and
2009), financial leverage constrains a BDC’s investment
flexibility, potentially triggering asset sales at less than
fair value in order to maintain compliance with investment
company regulations. In other words, a margin call at an
inopportune time.
Some BDCs establish Small Business Investment Corporation
subsidiaries, or SBICs, to secure access to SBA-guaranteed
debentures. BDCs with SBICs may issue up to $225 million
of long-term (10-year) debentures at fixed rates that are
generally lower than rates on comparable non-guaranteed
financing. SBICs are required to provide financing to small
businesses (defined as having tangible equity of not more
than $18 million and average annual net income of not more
than $6 million). SBA-guaranteed debentures are generally
excluded from the calculation of the asset coverage test
under the 1940 Act.
Net Asset Value Per Share
Net asset value (NAV) per share is an important reference
point for BDCs and is disclosed on the face of the balance
sheet. The ratio of stock price to NAV per share is an
important barometer of relative value for BDCs.
Given distribution requirements, BDCs cannot increase NAV
per share meaningfully by retaining net investment income.
Instead, NAV per share fluctuates primarily with appreciation
or depreciation in underlying portfolio investments.
Alternatively, issuing new shares at a premium to NAV (or
repurchasing shares at a discount to NAV) is accretive
to NAV per share. BDCs are generally required to obtain
special shareholder permission to issue new shares at a
price less than NAV per share. This can effectively close the
market for new equity issuances for BDCs trading at a price-
to-book ratio of less than 1.0x, which in turn, limits the BDC’s
ability to grow the balance sheet.
© Mercer Capital 2013 | www.mercercapital.com 7
The Ins and Outs of Business Development Companies December, 2013
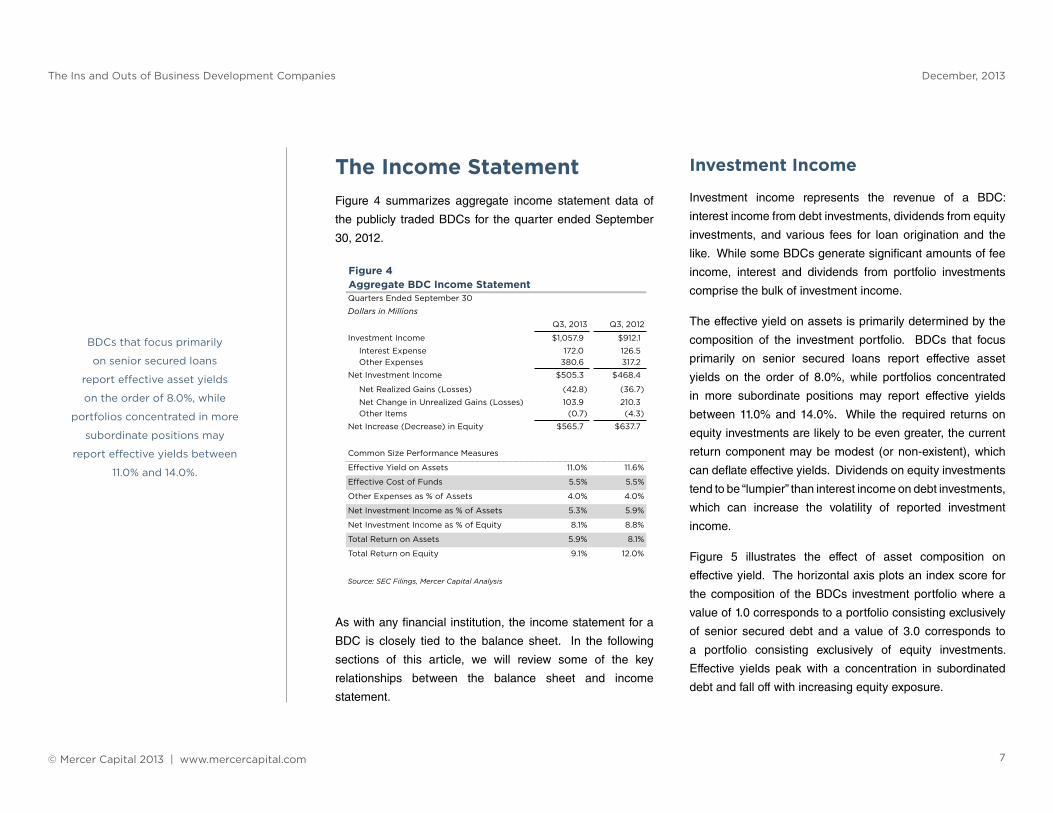
The Income StatementFigure 4 summarizes aggregate income statement data of
the publicly traded BDCs for the quarter ended September
30, 2012.
As with any financial institution, the income statement for a
BDC is closely tied to the balance sheet. In the following
sections of this article, we will review some of the key
relationships between the balance sheet and income
statement.
Investment Income
Investment income represents the revenue of a BDC:
interest income from debt investments, dividends from equity
investments, and various fees for loan origination and the
like. While some BDCs generate significant amounts of fee
income, interest and dividends from portfolio investments
comprise the bulk of investment income.
The effective yield on assets is primarily determined by the
composition of the investment portfolio. BDCs that focus
primarily on senior secured loans report effective asset
yields on the order of 8.0%, while portfolios concentrated
in more subordinate positions may report effective yields
between 11.0% and 14.0%. While the required returns on
equity investments are likely to be even greater, the current
return component may be modest (or non-existent), which
can deflate effective yields. Dividends on equity investments
tend to be “lumpier” than interest income on debt investments,
which can increase the volatility of reported investment
income.
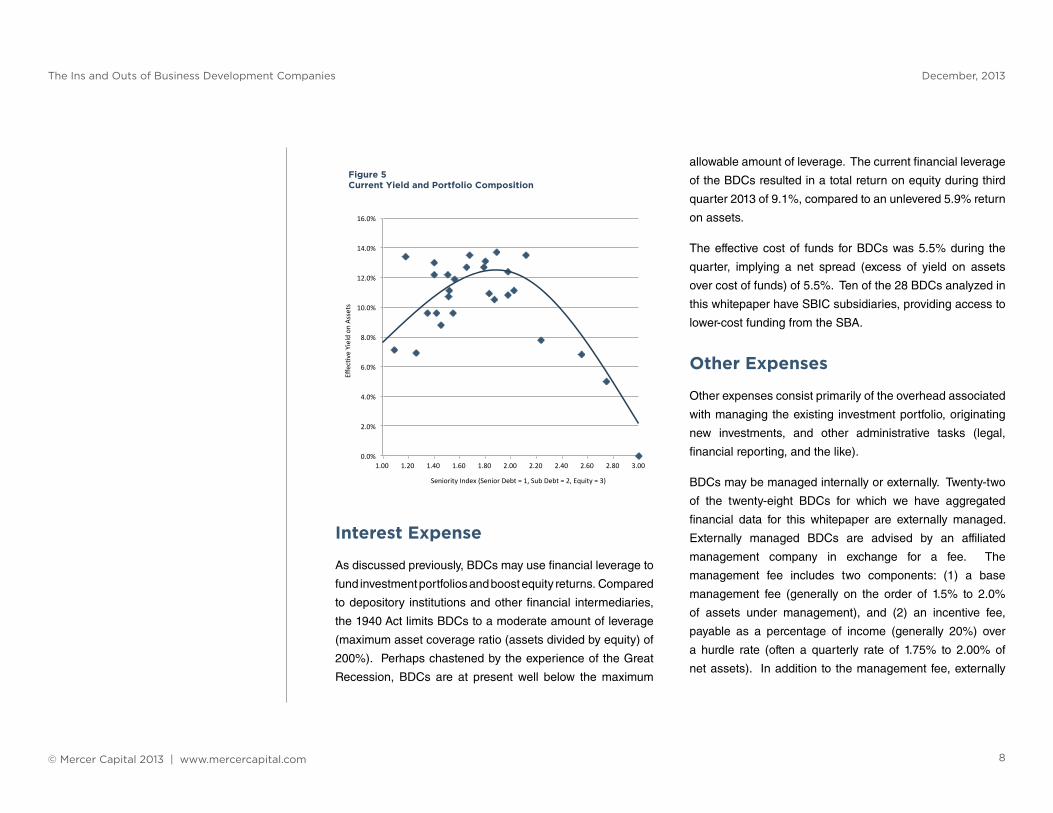
Figure 5 illustrates the effect of asset composition on
effective yield. The horizontal axis plots an index score for
the composition of the BDCs investment portfolio where a
value of 1.0 corresponds to a portfolio consisting exclusively
of senior secured debt and a value of 3.0 corresponds to
a portfolio consisting exclusively of equity investments.
Effective yields peak with a concentration in subordinated
debt and fall off with increasing equity exposure.
BDCs that focus primarily
on senior secured loans
report effective asset yields
on the order of 8.0%, while
portfolios concentrated in more
subordinate positions may
report effective yields between
11.0% and 14.0%.
Figure 4Aggregate BDC Income StatementQuarters Ended September 30
Dollars in Millions
Q3, 2013 Q3, 2012
Investment Income $1,057.9 $912.1
Interest Expense 172.0 126.5Other Expenses 380.6 317.2
Net Investment Income $505.3 $468.4
Net Realized Gains (Losses) (42.8) (36.7)
Net Change in Unrealized Gains (Losses) 103.9 210.3Other Items (0.7) (4.3)
Net Increase (Decrease) in Equity $565.7 $637.7
Common Size Performance Measures
Effective Yield on Assets 11.0% 11.6%
Effective Cost of Funds 5.5% 5.5%
Other Expenses as % of Assets 4.0% 4.0%
Net Investment Income as % of Assets 5.3% 5.9%
Net Investment Income as % of Equity 8.1% 8.8%
Total Return on Assets 5.9% 8.1%
Total Return on Equity 9.1% 12.0%
Source: SEC Filings, Mercer Capital Analysis
© Mercer Capital 2013 | www.mercercapital.com 8
The Ins and Outs of Business Development Companies December, 2013
Interest Expense
As discussed previously, BDCs may use financial leverage to
fund investment portfolios and boost equity returns. Compared
to depository institutions and other financial intermediaries,
the 1940 Act limits BDCs to a moderate amount of leverage
(maximum asset coverage ratio (assets divided by equity) of
200%). Perhaps chastened by the experience of the Great
Recession, BDCs are at present well below the maximum
allowable amount of leverage. The current financial leverage
of the BDCs resulted in a total return on equity during third
quarter 2013 of 9.1%, compared to an unlevered 5.9% return
on assets.
The effective cost of funds for BDCs was 5.5% during the
quarter, implying a net spread (excess of yield on assets
over cost of funds) of 5.5%. Ten of the 28 BDCs analyzed in
this whitepaper have SBIC subsidiaries, providing access to
lower-cost funding from the SBA.
Other Expenses
Other expenses consist primarily of the overhead associated
with managing the existing investment portfolio, originating
new investments, and other administrative tasks (legal,
financial reporting, and the like).
BDCs may be managed internally or externally. Twenty-two
of the twenty-eight BDCs for which we have aggregated
financial data for this whitepaper are externally managed.
Externally managed BDCs are advised by an affiliated
management company in exchange for a fee. The
management fee includes two components: (1) a base
management fee (generally on the order of 1.5% to 2.0%
of assets under management), and (2) an incentive fee,
payable as a percentage of income (generally 20%) over
a hurdle rate (often a quarterly rate of 1.75% to 2.00% of
net assets). In addition to the management fee, externally
0.0%
2.0%
4.0%
6.0%
8.0%
10.0%
12.0%
14.0%
16.0%
1.00 1.20 1.40 1.60 1.80 2.00 2.20 2.40 2.60 2.80 3.00
Effec/ve Yield on
Assets
Seniority Index (Senior Debt = 1, Sub Debt = 2, Equity = 3)
Figure 5 Current Yield and Portfolio Composition
© Mercer Capital 2013 | www.mercercapital.com 9
The Ins and Outs of Business Development Companies December, 2013
managed BDCs also incur professional fees and other
general and administrative expenses. Internally managed
BDCs pay compensation and related overhead expenses
associated with managing the portfolio directly.
During the third quarter of 2013, operating expenses,
measured as a percentage of assets, averaged 2.9% for
internally managed BDCs compared to 3.8% for externally
managed firms. The overall average for the group was 3.6%.
Net Investment Income
BDCs have two sources of potential return: current income
and capital appreciation. Net investment income measures
the current income return on the BDC’s investment portfolio.
On an unlevered basis, net investment income for the group
during the third quarter represented a 5.3% return on assets;
including the effect of leverage, the current income return on
equity registered 8.1%. As demonstrated in the preceding
chart, BDCs with a greater equity concentration in their
investment portfolio report lower net investment income (as
a percentage of assets and equity) since a greater portion of
their total expected investment return is attributable to capital
appreciation.
Net Realized Gains & Losses
Upon exiting an investment, BDCs record a gain or loss
measured by the difference between the proceeds received
upon exit and the amortized cost of the investment. Net
realized gains or losses during a period provide perspective
on the credit performance of management’s prior investment
decisions, but do not directly reflect investment performance
during the period. For example, a realized loss on investment
may be deferred simply by not exiting the investment;
conversely, a gain may be realized during a given quarter
even if the decision to sell the investment and realize the
gain was not optimal from an investment perspective.
On a cumulative basis, the net realized gains and losses
permit evaluation of a BDC’s underwriting and investment
process without the period to period “noise” associated with
reporting the investment portfolio at fair value.
Net Change in Unrealized Gains & Losses
The difference between the fair value and amortized cost of a
portfolio investment is the unrealized gain or loss. As the fair
value of a portfolio investment is remeasured each quarter,
the unrealized gain or loss associated with the investment
may fluctuate. The sum of the increases or decreases in
unrealized gain or loss across the portfolio during a period is
recognized in the earnings of the current period.
© Mercer Capital 2013 | www.mercercapital.com 10
The Ins and Outs of Business Development Companies December, 2013
Upon exiting an investment, the unrealized gain or loss for that
investment reduces to zero; this “reversal” offsets the portion
of the realized gain or loss that was recognized in earnings
prior to the period in which the investment was disposed. The
sum of the net realized gain and the net change in unrealized
gain provides a measure of the capital appreciation return on
the investment portfolio during the period.
Capital appreciation is a more significant component of
financial performance for BDCs with greater equity exposure.
For debt-focused BDCs, unrealized gains and losses can
result from changes in the yields used to measure the fair
value of performing loans or changes in credit status (i.e.,
impairment or recovery), which can often be more significant.
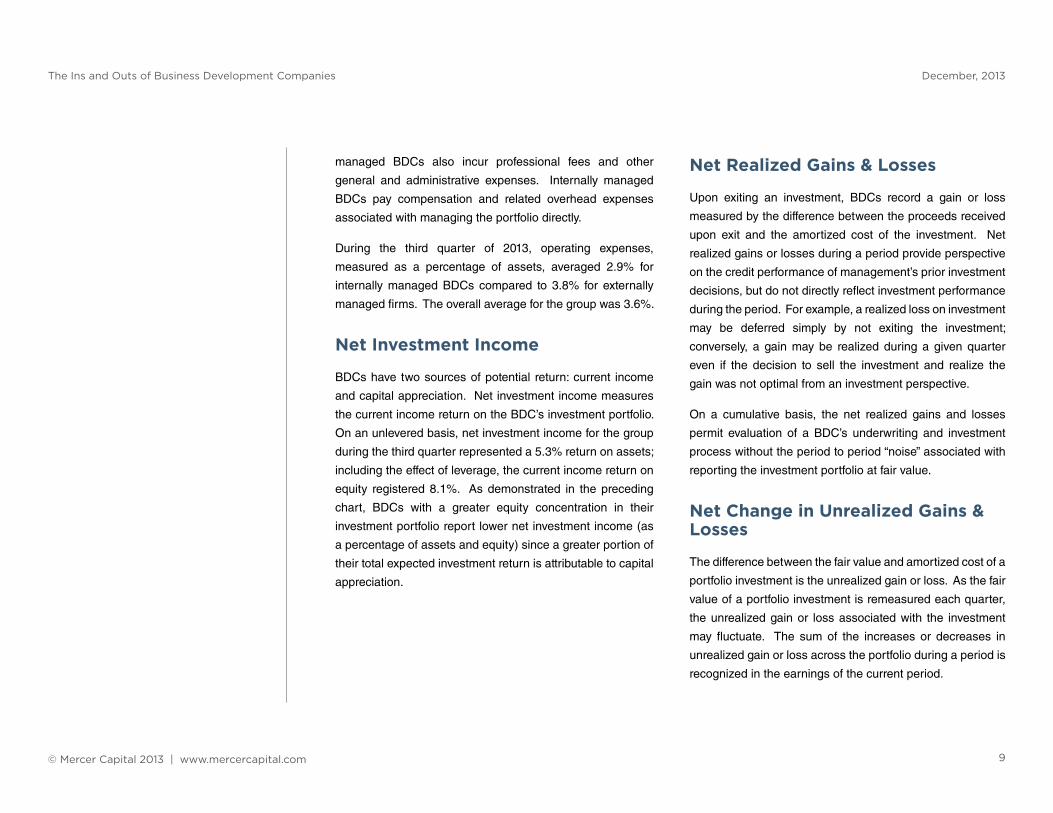
The capital appreciation component of BDC earnings is
more volatile than net investment income and can generally
be correlated to the performance of equity and debt markets
during the period. For example, as shown in Figure 6, during
the first quarter of 2013, BDCs reported a net gain on assets
of approximately 1.0% while the S&P 500 registered a 10.0%
gain. During the second quarter, however, the BDCs reported
a net loss on assets despite a 2.4% increase in the S&P 500
as the yield on high-yield loans increased from 5.82% to
6.74%.
Earnings: Net Increase (Decrease) in Equity Resulting from Operations
The net income of a BDC, referred to as “Net Increase
in Equity Resulting from Operations”, is the sum of the
net investment income and capital appreciation on the
underlying portfolio. Figure 7 summarizes the various
aggregate earnings measures for BDCs for the quarter
ended September 30, 2013.
-‐2.0%
0.0%
2.0%
4.0%
6.0%
8.0%
10.0%
12.0%
Q3, 2012 Q4, 2012 Q1, 2013 Q2, 2013 Q3, 2013
Gain (Loss) as % of Assets Change in S&P 500 Change in Merrill Lynch High Yield Index Eff Yield
Source: SEC filings, Mercer Capital analysis, St. Louis FED
Figure 6 BDC Portfolio Capital Appreciation vs. Benchmarks
© Mercer Capital 2013 | www.mercercapital.com 11
The Ins and Outs of Business Development Companies December, 2013
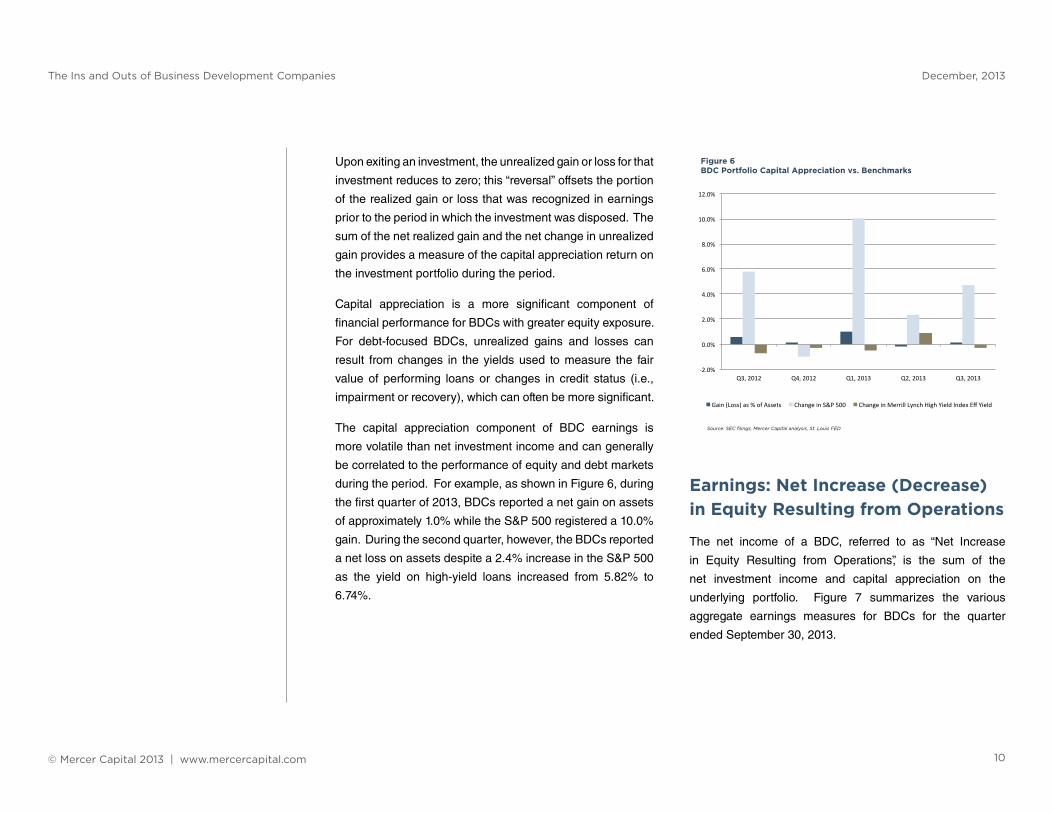
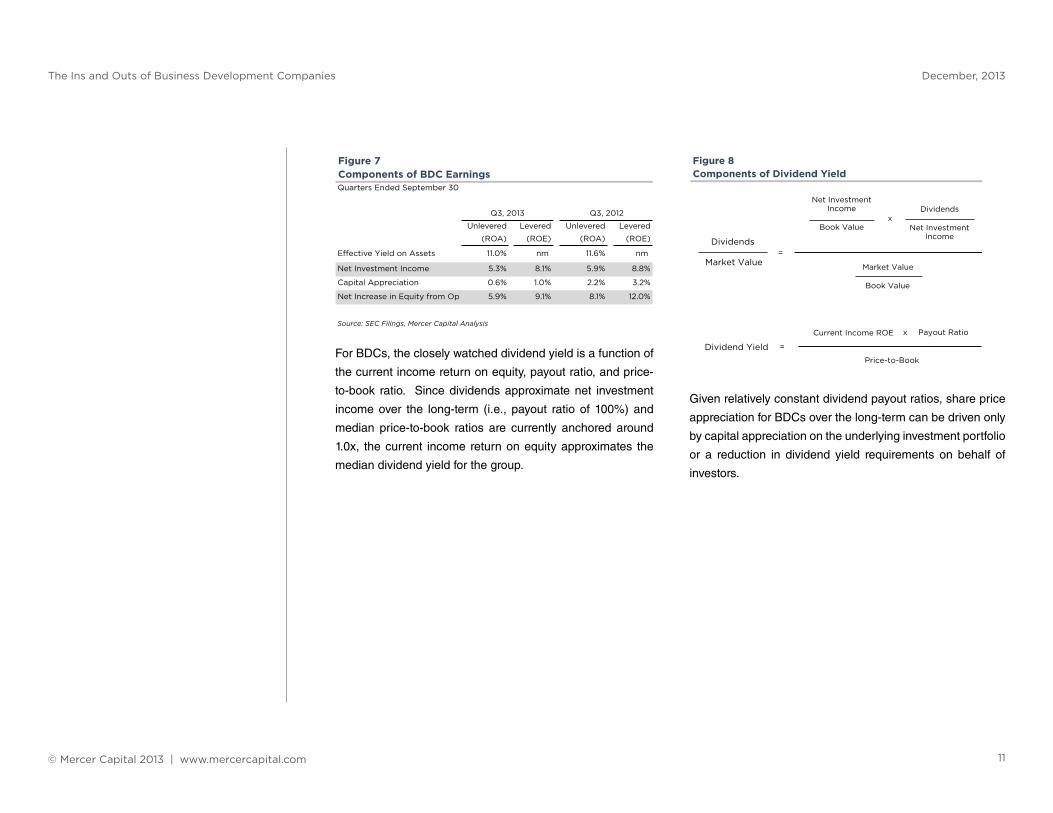
For BDCs, the closely watched dividend yield is a function of
the current income return on equity, payout ratio, and price-
to-book ratio. Since dividends approximate net investment
income over the long-term (i.e., payout ratio of 100%) and
median price-to-book ratios are currently anchored around
1.0x, the current income return on equity approximates the
median dividend yield for the group.
Given relatively constant dividend payout ratios, share price
appreciation for BDCs over the long-term can be driven only
by capital appreciation on the underlying investment portfolio
or a reduction in dividend yield requirements on behalf of
investors.
Figure 7Components of BDC EarningsQuarters Ended September 30
Unlevered Levered Unlevered Levered
(ROA) (ROE) (ROA) (ROE)
Effective Yield on Assets 11.0% nm 11.6% nm
Net Investment Income 5.3% 8.1% 5.9% 8.8%
Capital Appreciation 0.6% 1.0% 2.2% 3.2%
Net Increase in Equity from Op 5.9% 9.1% 8.1% 12.0%
Source: SEC Filings, Mercer Capital Analysis
Q3, 2013 Q3, 2012
Figure 8Components of Dividend Yield
Net Investment Income
Book Value
Dividends
Net Investment Income
Dividends
Market Value Market Value
Book Value
Dividend Yield
Current Income ROE Payout Ratio
Price-to-Book
=
x
x
=

© Mercer Capital 2013 | www.mercercapital.com 12
The Ins and Outs of Business Development Companies December, 2013
Statement of Cash FlowsThe statement of cash flows for a BDC reveals the linkages
between reported earnings and balance sheet growth (or
shrinkage) during the period. Figure 9 summarizes selected
aggregate cash flow measures of the publicly traded BDCs
for the quarter ended September 30, 2013.
Investment Activity
BDC statements of cash flow often do not include a separate
section for investing activities. Instead, purchases and sales
of portfolio investments are often included as components of
the operating activities section. Regardless of the financial
statement classification, data on the volume of originations
and exits in a given period are critical to assessing BDC
performance.
The pace of origination volume is a key measure of a BDC’s
long-run sustainability. A significant portion of a BDC’s
operating expense base relates to screening, selecting, and
funding new portfolio investments. The menu of potential
investment opportunities (middle market firms seeking
financing) is a function of the macroeconomic environment
and the refinancing cycle. The investment capacity of BDCs
depends on the pace of investment exits and the availability
of incremental debt and equity funding.
If investment exits exceed investment purchases, cash
accumulates in the BDC, creating a drag on investment
yield and income. On the other hand, purchases of new
investments in excess of sales of existing investments
requires new financing and/or realized gains on portfolio
investments.
Figure 9Aggregate BDC Cash Flow DataQuarters Ended September 30Dollar figures in millions
%
Investment Activity Q3, 2013 Q3, 2012 Change
Investment Purchases $3,982 $3,503 13.7%
As % of Assets 10.3% 11.1%
Investment Sales $2,854 $2,016 41.6%
As % of Assets 7.4% 6.4%
Financing Activity
Proceeds from Stock Issuance $509 $1,034 -50.8%
As % of Equity 2.1% 4.9%
Net Proceeds from Debt Issuance $1,347 $265 408.1%
As % of Debt 10.8% 2.9%
Dividends Paid $469 $364 28.7%
As % of Net Investment Inc 92.7% 77.7%
Source: SEC Filings, Mercer Capital Analysis
© Mercer Capital 2013 | www.mercercapital.com 13
The Ins and Outs of Business Development Companies December, 2013
Financing Activity
The net financing activity of BDCs can be segregated into three
primary components: proceeds from new stock issuance, net
proceeds from lenders, and dividends paid to shareholders.
Since dividend payments approximate net investment income
over the long haul, BDC growth requires access to the capital
markets. (In Figure 9, dividends paid as a percentage of net
investment income is artificially depressed because one of
the largest BDCs, American Capital, Ltd. (ACAS), is currently
repurchasing shares in lieu of paying dividends. The median
ratio for the group is 100.9%.)
Taking advantage of the continuing accommodation at
the Fed, BDCs borrowed aggressively during the quarter
to refinance existing debt and to increase leverage. At
September 30, the aggregate equity/assets ratio for the
group stood at 64.5%, compared to 67.4% one year earlier.
Furthermore, since BDCs are generally prohibited from
issuing new shares at less than book value and leverage
capacity is limited to 50% of assets, only BDCs priced at or
above book value can achieve sustainable balance sheet
growth. In November 2013, 20 of the 28 referenced BDCs
are trading at a premium to book value, compared to fifteen
one year earlier, allowing more BDCs to potentially access
the equity markets and grow.
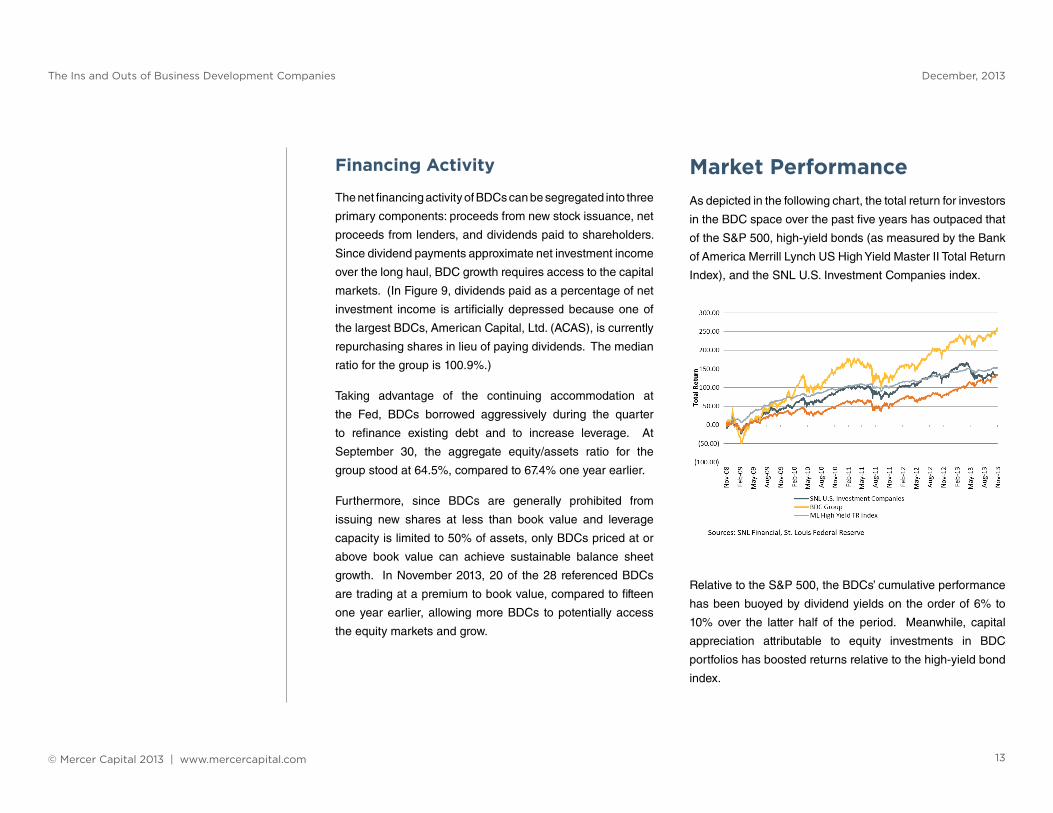
Market PerformanceAs depicted in the following chart, the total return for investors
in the BDC space over the past five years has outpaced that
of the S&P 500, high-yield bonds (as measured by the Bank
of America Merrill Lynch US High Yield Master II Total Return
Index), and the SNL U.S. Investment Companies index.
Relative to the S&P 500, the BDCs’ cumulative performance
has been buoyed by dividend yields on the order of 6% to
10% over the latter half of the period. Meanwhile, capital
appreciation attributable to equity investments in BDC
portfolios has boosted returns relative to the high-yield bond
index.
© Mercer Capital 2013 | www.mercercapital.com 14
The Ins and Outs of Business Development Companies December, 2013
ConclusionUntil recently, BDCs occupied a relatively obscure corner
of the financial universe. However, the number of publicly
traded vehicles has grown markedly over the past five years.
The confluence of middle market companies requiring
additional growth capital, private equity buyers, and yield-
starved investors searching for current income suggests that
BDCs will become a more prominent fixture in the financial
landscape in the next several years.
Looking forward, BDC performance and investor returns will
likely be driven by a few key factors:
» Competition for loans. On a year over year basis,
the aggregate effective yield on assets slipped
from 11.6% to 11.0%. With funding and operating
costs largely fixed, the contraction in effective yield
pressures ROA and ROE by a comparable amount.
If the increasing efficiency of financial intermediation
for middle market companies drives borrowing
costs for such companies down, BDCs will have to
choose between supplying smaller cash dividends
to shareholders or taking on more credit risk
(through either borrower profile or subordination) to
maintain net investment income.
» Balance sheet leverage and credit quality. BDCs
have been taking advantage of open credit markets
over the past year, pushing leverage ratios higher.
Reported credit quality is holding steady, but the
pain associated with credit deterioration in the
event of economic softening will be heightened by
the additional leverage.
» Investor comfort with the sector and demand for
yield. Given their payout obligations and leverage
limitations, BDCs ultimately depend on secondary
offerings for growth. As BDCs become larger
and investor awareness grows, the potential for
additional investor capital could pressure dividend
yields and boost price/NAV ratios.
» Interest rate sensitivity. While it appears the Fed
will continue to favor a low rate environment over
the foreseeable future, rising rates could pressure
the fair value of loan portfolios and NAV per share.
In the aggregate, approximately 31% of interest-
bearing BDC assets bear fixed rates, but at the
individual level, balance sheet sensitivity to interest
rate changes varies significantly.
For more information or to discuss a valuation or transaction
issue in confidence, do not hesitate to contact us at
901.685.2120.
ENDNOTES1 ASC 820-10-20. Glossary.2 Ibid.3 ASC 820-10-25-53 (formerly SFAS 157, paragraphs 22-30).
The confluence of middle
market companies requiring
additional growth capital,
private equity buyers, and
yield-starved investors
searching for current income
suggests that BDCs will
become a more prominent
fixture in the financial
landscape in the next few years

© Mercer Capital 2013 | www.mercercapital.com 15
The Ins and Outs of Business Development Companies December, 2013
ANALYSIS OF BUSINESS DEVELOPMENT COMPANIESAS OF NOVEMBER 13, 2013
QUARTERLY FINANCIAL SNAPSHOT HISTORICAL PER SHARE AND OTHER DATA
BALANCE SHEET & RETURN DATA MARKET PRICING DATA
TotalReturn Investment Portfolio Equity
on Shares NAV Fair Amortized FV Market Dividend Yield Price TotalAssets Equity Equity/ Equity Out per Value Cost as % of Price for Price for Price for Cap Price/ Current Next Change Return
Ticker ($Mil) ($Mil) Assets (LTM) (Mil) Share ($Mil) ($Mil) Cost 11/13/13 9/30/13 11/13/12 ($Mil) Book Indicated Yr Est Yr Est (LTM) (LTM)
Total Assets > $1.0B
Ares Capital Corp ARCC 7,754.1 4,392.4 56.6% 12.8% 268.6 $16.35 7,385.3 7,277.7 101.5% $17.72 $17.29 $15.31 4,759.5 108.4% 8.6% 8.7% 9.0% 15.7% 24.3%
American Capital Ltd ACAS 6,271.0 5,419.0 86.4% 9.1% 277.3 $19.54 5,035.0 5,272.0 95.5% $14.19 $13.75 $11.58 3,934.9 72.6% 0.0% nm nm 22.5% 22.5%
Prospect Capital Corp PSEC 4,783.6 2,909.8 60.8% 10.6% 271.4 $10.72 4,553.1 4,642.3 98.1% $11.42 $11.06 $9.11 3,099.4 106.5% 11.6% 11.6% 11.6% 25.4% 37.0%
Apollo Investment Corp AINV 3,139.8 1,864.6 59.4% 7.7% 224.7 $8.30 3,029.7 3,080.9 98.3% $8.68 $8.15 $6.92 1,950.8 104.6% 9.2% 9.2% 9.5% 25.4% 34.7%
Fifth Street Finance Corp FSC 1,896.8 1,197.3 63.1% 10.2% 121.0 $9.90 1,802.1 1,776.1 101.5% $10.15 $10.09 $9.15 1,228.1 102.5% 11.3% 11.3% 11.3% 10.9% 22.3%
Solar Capital Ltd SLRC 1,255.8 986.1 78.5% 7.5% 44.3 $22.25 1,133.4 1,173.7 96.6% $22.29 $22.18 $20.46 988.0 100.2% 7.2% 9.0% 7.5% 8.9% 16.1%
Main Street Capital Corp MAIN 1,239.3 794.2 64.1% 14.9% 39.7 $20.01 1,152.4 1,014.6 113.6% $30.81 $29.77 $28.36 1,223.1 154.0% 6.4% 6.4% 6.4% 8.6% 15.1%
Hercules Technology Growth Capital Inc HTGC 1,227.5 643.4 52.4% 17.9% 61.8 $10.42 983.4 983.0 100.0% $16.71 $14.97 $9.48 1,031.9 160.4% 7.4% 6.7% 7.6% 76.3% 83.7%
BlackRock Kelso Capital Corp BKCC 1,193.6 696.3 58.3% 9.1% 74.2 $9.38 1,139.1 1,039.2 109.6% $9.47 $9.48 $8.75 703.1 101.0% 11.0% 11.0% 10.9% 8.2% 19.2%
PennantPark Investment Corp PNNT 1,153.3 697.5 60.5% 13.4% 66.5 $10.49 1,078.2 1,091.5 98.8% $11.34 $11.28 $9.46 754.1 108.1% 9.9% 9.9% 9.9% 19.9% 29.7%
TICC Capital Corp TICC 1,021.7 528.1 51.7% 12.8% 53.3 $9.90 941.4 925.3 101.7% $10.26 $9.74 $8.31 547.1 103.6% 11.3% 11.3% 11.3% 23.5% 34.8%
Golub Capital BDC Inc GBDC 1,015.8 601.5 59.2% 8.8% 39.8 $15.12 967.8 962.5 100.6% $17.68 $17.33 $14.20 703.5 116.9% 7.2% 7.2% 7.6% 24.5% 31.7%
GROUP MEDIAN 1,247.6 890.2 59.9% 10.4% 100.3% 1,127.5 105.6% 8.9% 9.2% 9.5% 21.2% 27.0%
Total Assets > $300MM
Triangle Capital Corp TCAP 806.7 441.3 54.7% 18.4% 27.7 $15.94 630.5 613.7 102.7% $28.64 $29.37 $23.31 792.7 179.7% 7.5% 7.5% 7.7% 22.9% 30.4%
Medley Capital Corp MCC 724.9 420.2 58.0% 9.9% 33.2 $12.65 686.4 695.6 98.7% $14.13 $13.79 $12.46 469.5 111.7% 10.5% 10.3% 10.9% 13.4% 23.9%
THL Credit Inc TCRD 598.2 453.8 75.9% 10.4% 33.9 $13.38 571.7 571.2 100.1% $16.25 $15.61 $12.46 551.0 121.4% 8.4% 8.6% 8.5% 30.4% 38.8%
MVC Capital Inc MVC 583.4 392.8 67.3% 7.5% 22.6 $17.36 416.4 355.8 117.0% $13.95 $12.93 $11.39 315.5 80.4% 3.9% 3.9% 5.5% 22.5% 26.3%
MCG Capital Corp MCGC 546.0 363.5 66.6% 7.0% 71.2 $5.10 395.5 589.3 67.1% $4.59 $4.91 $3.82 326.9 90.0% 10.9% 10.9% 10.9% 20.2% 31.1%
KCAP Financial Inc KCAP 468.0 265.1 56.6% 12.8% 33.3 $7.96 431.4 471.0 91.6% $8.16 $8.70 $7.32 271.8 102.5% 12.3% 13.1% 12.3% 11.5% 23.7%
Fidus Investment Corp FDUS 371.0 219.4 59.1% 13.8% 13.7 $15.98 277.4 279.9 99.1% $20.21 $19.40 $14.59 277.6 126.5% 7.5% 8.6% 8.4% 38.5% 46.0%
Gladstone Investment Corp GAIN 347.1 241.4 69.6% 13.3% 26.5 $9.12 287.2 354.2 81.1% $7.29 $6.89 $6.41 193.0 79.9% 9.9% 9.2% 9.9% 13.7% 23.6%
GSV Capital Corp GSVC 324.5 254.3 78.4% -2.2% 19.3 $13.16 253.0 245.2 103.2% $13.29 $14.82 $6.92 256.8 101.0% 0.0% nm nm 92.1% 92.1%
NGP Capital Resources Co NGPC 305.7 188.9 61.8% 0.4% 20.5 $9.22 213.5 227.8 93.7% $7.57 $7.43 $6.41 155.2 82.1% 8.5% 8.0% 8.5% 18.1% 26.6%
GROUP MEDIAN 507.0 314.3 64.2% 10.2% 98.9% 296.5 101.8% 8.4% 8.6% 8.5% 21.3% 28.5%
Total Assets < $300MM
Solar Senior Capital Ltd SUNS 285.6 206.3 72.3% 4.0% 11.5 $17.91 276.3 280.3 98.6% $18.29 $17.97 $16.52 210.8 102.1% 7.7% 7.7% 7.7% 10.7% 18.4%
Horizon Technology Finance Corp HRZN 281.9 143.4 50.9% 2.4% 9.6 $14.95 241.3 248.1 97.3% $14.03 $13.10 $12.78 134.5 93.8% 9.8% 9.8% 10.3% 9.8% 19.6%
Gladstone Capital Corp GLAD 281.2 180.7 64.3% 4.9% 21.0 $8.60 255.3 353.8 72.2% $9.22 $8.60 $7.24 193.6 107.2% 9.1% 9.1% 9.1% 27.3% 36.5%
PennantPark Floating Rate Capital Ltd PFLT 263.2 144.1 54.7% 8.7% 10.3 $13.98 250.5 253.5 98.8% $13.35 $13.69 $11.82 137.6 95.5% 8.1% 8.0% nm 12.9% 21.0%
Saratoga Investment Corp SAR 224.1 112.4 50.2% 9.5% 4.7 $23.77 187.8 184.2 102.0% $15.96 $16.16 $14.85 75.5 67.1% 0.0% nm nm 7.5% 7.5%
Full Circle Capital Corp FULL 116.5 56.6 48.6% 1.2% 7.6 $7.48 109.6 113.6 96.5% $7.77 $8.47 $6.65 58.8 103.9% 10.3% 11.6% 11.1% 16.8% 27.2%
GROUP MEDIAN 272.2 143.7 52.8% 4.5% 97.9% 136.1 98.8% 8.6% 9.1% 9.7% 11.8% 20.3%
AVERAGE 1,278.0 824.9 62.7% 8.6% 97.8% 840.4 105.4% 7.8% 9.1% 9.2% 24.8%
MEDIAN 583.4 392.8 60.8% 9.1% 98.8% 326.9 102.5% 8.5% 9.0% 9.1% 19.9%
GROUP TOTAL 38,480.2 24,814.4 64.5% 10.3% 34,684.7 35,075.9 98.9% 25,344.2
Source: Bloomberg, SEC Filings, Mercer Capital analysis
© Mercer Capital 2013 | www.mercercapital.com 16
The Ins and Outs of Business Development Companies December, 2013
ANALYSIS OF BUSINESS DEVELOPMENT COMPANIESAS OF NOVEMBER 13, 2013
HISTORICAL PER SHARE AND OTHER DATA FINANCIAL PERFORMANCE FOR MOST RECENT QUARTER
GROWTH NET ASSET VALUE HISTORY DIVIDEND HISTORY OTHER ITEMS
CAGR2008 - 2012 Number
NAV Dividend of LTM Portfolio Composition (@ FV) External /per per Net Asset Value per Share Dividend per Share Covering as of Senior Sub Internal
Share Share 2008 2009 2010 2011 2012 Current 2008 2009 2010 2011 2012 Indicated Curr Est Next Est Analysts Date Debt Debt Equity Mgmt
Total Assets > $1.0B
Ares Capital Corp 9.2% -1.2% $11.27 $11.44 $14.92 $15.34 $16.04 $16.35 $1.68 $1.47 $1.40 $1.41 $1.60 $1.52 $1.55 $1.60 19 Sep-13 45.6% 43.3% 11.1% External
American Capital Ltd 11.4% -100.0% $11.57 $8.29 $10.71 $13.87 $17.84 $19.54 $2.32 $1.07 $0.00 $0.00 $0.00 $0.00 na na 11 Sep-13 15.2% 14.5% 70.3% Internal
Prospect Capital Corp -7.1% -6.4% $14.55 $12.40 $10.29 $10.36 $10.83 $10.72 $1.59 $1.62 $1.33 $1.21 $1.22 $1.33 $1.32 $1.33 9 Sep-13 54.0% 24.3% 21.7% External
Apollo Investment Corp -4.2% -18.6% $9.82 $10.06 $10.03 $8.55 $8.27 $8.30 $1.82 $1.10 $1.12 $1.04 $0.80 $0.80 $0.80 $0.83 17 Sep-13 52.0% 40.1% 7.9% External
Fifth Street Finance Corp -6.6% na $13.02 $10.84 $10.43 $10.07 $9.92 $9.90 $0.31 $1.20 $1.31 $1.28 $1.18 $1.15 $1.15 $1.15 13 Jun-13 64.7% 30.4% 4.9% External
Solar Capital Ltd -3.2% na $25.88 $52.56 $22.73 $22.02 $22.70 $22.25 na na $4.28 $2.40 $2.40 $1.60 $2.00 $1.68 13 Sep-13 42.5% 25.8% 31.7% External
Main Street Capital Corp 11.1% 4.6% $12.20 $11.96 $13.06 $15.19 $18.59 $20.01 $1.43 $1.50 $1.50 $1.56 $1.71 $1.98 $1.96 $1.99 8 Sep-13 79.1% 7.1% 13.8% Internal
Hercules Technology Growth Capital Inc -4.2% -7.7% $11.56 $10.29 $9.50 $9.83 $9.75 $10.42 $1.32 $1.26 $0.80 $0.88 $0.96 $1.24 $1.12 $1.27 15 Sep-13 91.0% 0.0% 9.0% Internal
BlackRock Kelso Capital Corp 0.2% -11.8% $9.23 $9.55 $9.62 $9.58 $9.31 $9.38 $1.72 $0.80 $1.28 $1.10 $1.04 $1.04 $1.04 $1.04 9 Sep-13 34.5% 43.7% 21.9% External
PennantPark Investment Corp 0.5% 5.6% $10.00 $11.85 $10.69 $10.13 $10.22 $10.49 $0.90 $0.96 $1.03 $1.07 $1.12 $1.12 $1.12 $1.12 13 Sep-13 27.8% 61.2% 11.0% External
TICC Capital Corp 6.6% 1.4% $7.68 $8.36 $9.85 $9.30 $9.90 $9.90 $1.06 $0.60 $1.62 $0.99 $1.12 $1.16 $1.16 $1.16 9 Sep-13 72.4% 3.9% 23.6% External
Golub Capital BDC Inc na na na na $14.71 $14.56 $14.60 $15.12 na na $0.55 $1.27 $1.28 $1.28 $1.28 $1.34 5 Jun-13 45.6% 43.3% 11.1% External
GROUP MEDIAN 0.2% -6.4% 48.8% 28.1% 12.4%
Total Assets > $300MM
Triangle Capital Corp 3.7% 8.8% $13.22 $11.03 $12.09 $14.68 $15.30 $15.94 $1.44 $1.62 $1.61 $1.77 $2.02 $2.16 $2.16 $2.20 12 Sep-13 5.4% 77.6% 17.0% Internal
Medley Capital Corp na na na na na $12.57 $12.52 $12.65 na na na $0.37 $1.20 $1.48 $1.46 $1.54 13 Jun-13 60.0% 39.6% 0.4% External
THL Credit Inc na na na na $13.06 $13.24 $13.20 $13.38 na na $0.30 $2.04 $1.34 $1.36 $1.39 $1.39 9 Sep-13 32.1% 56.8% 11.1% External
MVC Capital Inc -1.8% 1.0% $17.36 $17.47 $17.71 $17.54 $16.14 $17.36 $0.48 $0.48 $0.48 $0.48 $0.50 $0.54 $0.54 $0.77 3 Jul-13 0.0% 25.1% 74.9% External
MCG Capital Corp -12.1% -4.9% $8.66 $8.06 $7.54 $5.65 $5.18 $5.10 $0.71 $0.00 $0.37 $0.66 $0.58 $0.50 $0.50 $0.50 5 Sep-13 55.4% 34.6% 10.0% Internal
KCAP Financial Inc -3.4% -10.1% $9.03 $9.56 $8.21 $7.85 $7.85 $7.96 $1.44 $0.92 $0.68 $0.69 $0.94 $1.00 $1.07 $1.00 5 Sep-13 42.5% 17.1% 40.4% Internal
Fidus Investment Corp na na na na na $14.90 $15.32 $15.98 na na na $0.64 $1.46 $1.52 $1.74 $1.70 4 Sep-13 13.5% 70.7% 15.8% External
Gladstone Investment Corp -1.7% -11.1% $9.73 $8.74 $9.00 $9.38 $9.10 $9.12 $0.96 $0.48 $0.48 $0.61 $0.60 $0.72 $0.67 $0.72 7 Sep-13 47.0% 26.0% 27.0% External
GSV Capital Corp na na na na na $12.95 $13.07 $13.16 na na na na na $0.00 na na 4 Jun-13 0.0% 0.1% 99.9% External
NGP Capital Resources Co -5.8% -22.9% $12.15 $11.10 $10.90 $9.26 $9.57 $9.22 $1.61 $0.64 $0.69 $0.72 $0.57 $0.64 $0.61 $0.64 4 Sep-13 19.9% 36.8% 43.2% External
GROUP MEDIAN -2.6% -7.5% 26.0% 35.7% 22.0%
Total Assets < $300MM
Solar Senior Capital Ltd na na na na na $18.15 $18.33 $17.91 na na na $0.55 $1.29 $1.41 $1.41 $1.41 6 Sep-13 86.0% 2.0% 12.0% External
Horizon Technology Finance Corp na na na na $16.75 $17.01 $15.15 $14.95 na na $0.22 $1.18 $2.15 $1.38 $1.38 $1.44 9 Sep-13 6.3% 89.7% 4.0% External
Gladstone Capital Corp -8.6% -15.9% $12.89 $11.81 $11.85 $10.16 $8.98 $8.60 $1.68 $1.26 $0.84 $0.84 $0.84 $0.84 $0.84 $0.84 5 Jun-13 52.2% 45.1% 2.7% External
PennantPark Floating Rate Capital Ltd na na na na na $13.44 $13.98 $13.98 na na na $0.25 $0.91 $1.08 $1.07 na 5 Jun-13 91.2% 8.7% 0.1% External
Saratoga Investment Corp na na $24.23 $21.37 $21.38 $25.12 $22.98 $23.77 $3.04 $11.91 $3.58 $3.00 $4.25 $0.00 na na 1 Aug-13 73.0% 22.1% 4.9% External
Full Circle Capital Corp na na na na na na $8.59 $7.48 na na na na $0.92 $0.80 $0.90 $0.86 3 Sep-13 94.1% 0.0% 5.9% External
GROUP MEDIAN -8.6% -15.9% 79.5% 15.4% 4.5%
AVERAGE -1.2% -12.2% 43.5% 31.0% 24.9%
MEDIAN -2.9% -7.6% 45.6% 30.4% 13.8%
Source: Bloomberg, SEC Filings, Mercer Capital analysis
© Mercer Capital 2013 | www.mercercapital.com 17
The Ins and Outs of Business Development Companies December, 2013
ANALYSIS OF BUSINESS DEVELOPMENT COMPANIESAS OF NOVEMBER 13, 2013
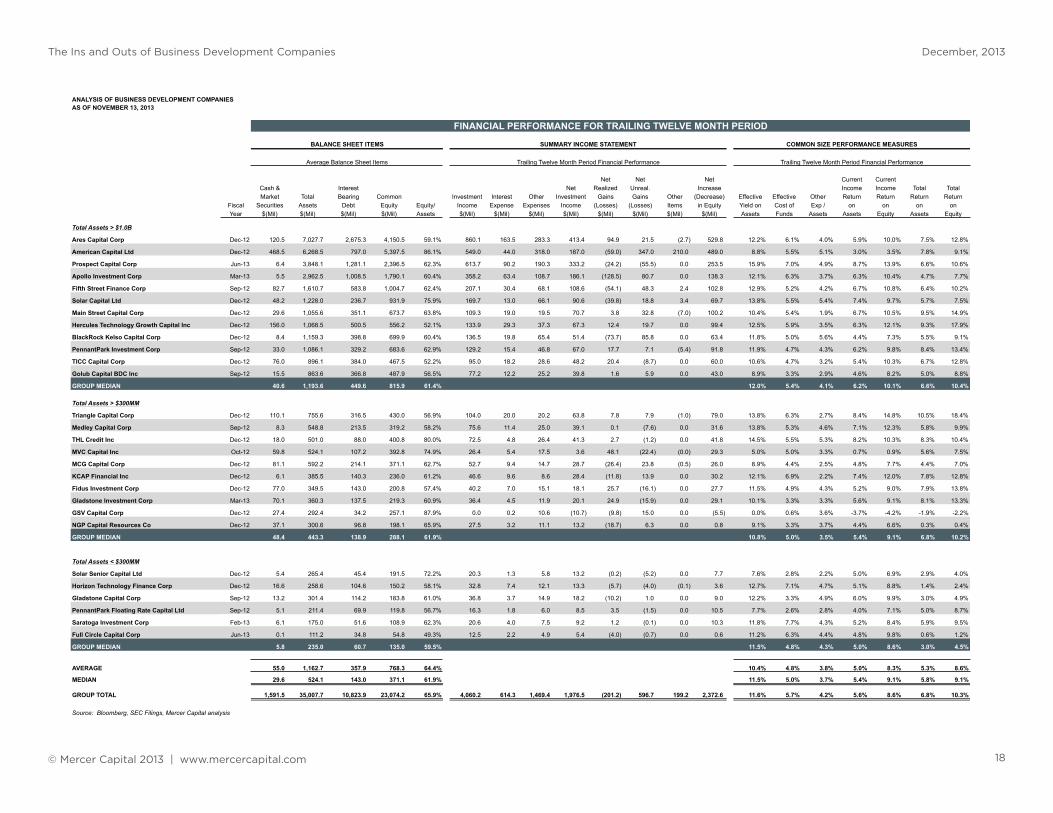
FINANCIAL PERFORMANCE FOR MOST RECENT QUARTER FINANCIAL PERFORMANCE FOR TRAILING TWELVE MONTH PERIOD
BALANCE SHEET ITEMS SUMMARY INCOME STATEMENT COMMON SIZE PERFORMANCE MEASURES
Ending Balance Sheet Items Most Recent Quarter Financial Performance Most Recent Quarter Financial Performance
Net Net Net Current CurrentCash & Interest Net Realized Unreal. Increase Income Income Total TotalMarket Total Bearing Common Investment Interest Other Investment Gains Gains Other (Decrease) Effective Effective Other Return Return Return Return
Fiscal Securities Assets Debt Equity Equity/ Income Expense Expenses Income (Losses) (Losses) Items in Equity Yield on Cost of Exp / on on on onYear $(Mil) $(Mil) $(Mil) $(Mil) Assets $(Mil) $(Mil) $(Mil) $(Mil) $(Mil) $(Mil) $(Mil) $(Mil) Assets Funds Assets Assets Equity Assets Equity
Total Assets > $1.0B
Ares Capital Corp Dec-12 135.5 7,754.1 3,137.9 4,392.4 56.6% 246.8 44.4 76.2 126.2 8.9 5.6 0.0 140.8 12.7% 5.7% 3.9% 6.5% 11.5% 7.3% 12.8%
American Capital Ltd Dec-12 633.0 6,271.0 791.0 5,419.0 86.4% 106.0 10.0 73.0 23.0 (39.0) 15.0 0.0 (1.0) 6.8% 5.1% 4.7% 1.5% 1.7% -0.1% -0.1%
Prospect Capital Corp Jun-13 10.4 4,783.6 1,726.2 2,909.8 60.8% 161.0 27.4 51.3 82.3 3.8 (6.2) 0.0 79.9 13.5% 6.4% 4.3% 6.9% 11.3% 6.7% 11.0%
Apollo Investment Corp Mar-13 4.5 3,139.8 1,082.3 1,864.6 59.4% 93.7 17.5 26.7 49.6 (17.3) 44.1 0.0 76.4 11.9% 6.5% 3.4% 6.3% 10.6% 9.7% 16.4%
Fifth Street Finance Corp Sep-12 59.6 1,896.8 674.0 1,197.3 63.1% 58.1 9.2 18.5 30.4 (17.5) 13.1 0.0 26.0 12.2% 5.4% 3.9% 6.4% 10.2% 5.5% 8.7%
Solar Capital Ltd Dec-12 83.3 1,255.8 225.0 986.1 78.5% 43.0 4.2 17.2 21.6 (15.7) 4.6 0.0 10.6 13.7% 7.4% 5.5% 6.9% 8.8% 3.4% 4.3%
Main Street Capital Corp Dec-12 37.5 1,239.3 405.1 794.2 64.1% 29.7 5.9 6.3 17.5 (7.8) 18.8 (0.5) 28.1 9.6% 5.8% 2.0% 5.6% 8.8% 9.1% 14.1%
Hercules Technology Growth Capital Inc Dec-12 205.0 1,227.5 570.1 643.4 52.4% 41.0 7.6 11.9 21.6 7.1 8.3 0.0 37.0 13.4% 5.3% 3.9% 7.0% 13.4% 12.1% 23.0%
BlackRock Kelso Capital Corp Dec-12 13.7 1,193.6 412.9 696.3 58.3% 31.4 5.5 17.1 8.9 0.1 10.8 0.0 19.8 10.5% 5.3% 5.7% 3.0% 5.1% 6.7% 11.4%
PennantPark Investment Corp Sep-12 58.4 1,153.3 363.9 697.5 60.5% 31.4 4.1 10.3 17.1 3.0 2.4 0.0 22.5 10.9% 4.5% 3.6% 5.9% 9.8% 7.8% 12.9%
TICC Capital Corp Dec-12 29.0 1,021.7 450.5 528.1 51.7% 27.4 5.0 10.2 12.2 (1.3) 12.7 0.0 23.6 10.7% 4.4% 4.0% 4.8% 9.3% 9.2% 17.9%
Golub Capital BDC Inc Sep-12 12.9 1,015.8 403.8 601.5 59.2% 22.3 3.0 7.3 12.0 (0.1) 0.7 0.0 12.7 8.8% 2.9% 2.9% 4.7% 8.0% 5.0% 8.4%
GROUP MEDIAN 48.0 1,247.6 510.3 890.2 59.9% 11.4% 5.4% 3.9% 6.1% 9.5% 7.0% 12.1%
Total Assets > $300MM
Triangle Capital Corp Dec-12 160.0 806.7 354.4 441.3 54.7% 27.3 5.0 5.5 16.8 1.0 4.9 0.5 23.2 13.5% 5.6% 2.7% 8.3% 15.2% 11.5% 21.0%
Medley Capital Corp Sep-12 13.5 724.9 278.2 420.2 58.0% 23.6 4.0 7.5 12.0 (0.1) (8.7) 0.0 3.2 13.0% 5.8% 4.2% 6.6% 11.5% 1.7% 3.0%
THL Credit Inc Dec-12 10.0 598.2 125.9 453.8 75.9% 19.1 1.4 6.1 11.6 (0.4) (3.1) (0.3) 7.8 12.7% 4.5% 4.1% 7.8% 10.2% 5.2% 6.8%
MVC Capital Inc Oct-12 94.6 583.4 164.4 392.8 67.3% 7.2 2.1 7.3 (2.1) 0.2 20.0 0.0 18.1 5.0% 5.1% 5.0% -1.5% -2.2% 12.4% 18.4%
MCG Capital Corp Dec-12 96.4 546.0 179.2 363.5 66.6% 13.2 2.3 2.9 8.0 0.1 (4.7) (0.1) 3.3 9.6% 5.2% 2.1% 5.8% 8.8% 2.4% 3.6%
KCAP Financial Inc Dec-12 9.7 468.0 192.5 265.1 56.6% 12.6 2.9 2.2 7.6 (10.4) 3.1 (0.3) (0.1) 10.8% 6.0% 1.9% 6.5% 11.4% -0.1% -0.1%
Fidus Investment Corp Dec-12 85.9 371.0 144.5 219.4 59.1% 10.3 1.8 3.2 5.3 24.6 (25.4) 0.0 4.5 11.1% 4.9% 3.5% 5.7% 9.6% 4.9% 8.3%
Gladstone Investment Corp Mar-13 47.2 347.1 101.3 241.4 69.6% 11.4 1.3 3.8 6.2 24.8 (16.1) 0.0 14.9 13.1% 5.2% 4.4% 7.2% 10.3% 17.2% 24.7%
GSV Capital Corp Dec-12 28.4 324.5 68.3 254.3 78.4% 0.0 0.2 2.8 (3.0) (0.2) 8.9 0.0 5.7 0.0% 1.1% 3.5% -3.7% -4.7% 7.0% 9.0%
NGP Capital Resources Co Dec-12 42.3 305.7 111.0 188.9 61.8% 6.0 0.7 2.7 2.6 (0.1) 2.5 0.0 5.1 7.8% 2.4% 3.5% 3.4% 5.6% 6.6% 10.7%
GROUP MEDIAN 44.8 507.0 154.5 314.3 64.2% 10.9% 5.2% 3.5% 6.2% 9.9% 5.9% 8.6%
Total Assets < $300MM
Solar Senior Capital Ltd Dec-12 7.2 285.6 34.8 206.3 72.3% 4.9 0.3 1.3 3.3 (0.5) (0.2) 0.0 2.6 6.9% 3.5% 1.9% 4.6% 6.4% 3.6% 5.0%
Horizon Technology Finance Corp Dec-12 27.5 281.9 133.0 143.4 50.9% 8.7 2.2 3.0 3.5 (5.6) 6.0 0.0 3.9 12.4% 6.6% 4.3% 4.9% 9.7% 5.5% 10.8%
Gladstone Capital Corp Sep-12 17.0 281.2 98.0 180.7 64.3% 8.6 1.4 2.7 4.4 (2.4) (4.1) 0.0 (2.1) 12.2% 5.9% 3.8% 6.3% 9.8% -2.9% -4.6%
PennantPark Floating Rate Capital Ltd Sep-12 6.9 263.2 85.6 144.1 54.7% 4.7 0.4 1.1 3.2 1.7 (3.3) 0.0 1.6 7.1% 1.8% 1.6% 4.9% 8.9% 2.4% 4.4%
Saratoga Investment Corp Feb-13 11.6 224.1 88.3 112.4 50.2% 5.4 1.6 1.5 2.3 0.5 (2.9) 0.0 (0.0) 9.6% 7.3% 2.7% 4.1% 8.1% -0.1% -0.1%
Full Circle Capital Corp Jun-13 0.1 116.5 43.1 56.6 48.6% 3.2 0.7 1.3 1.2 (0.7) (2.8) 0.0 (2.3) 11.1% 6.7% 4.3% 4.3% 8.8% -7.8% -15.9%
GROUP MEDIAN 9.4 272.2 87.0 143.7 52.8% 10.3% 6.2% 3.3% 4.7% 8.9% 1.2% 2.1%
AVERAGE 66.3 1,278.0 412.2 824.9 62.7% 10.0% 4.9% 3.6% 4.7% 8.0% 5.5% 8.8%
MEDIAN 29.0 583.4 179.2 392.8 60.8% 10.9% 5.2% 3.6% 5.7% 9.3% 5.9% 9.0%
GROUP TOTAL 1,941.4 38,480.2 12,445.3 24,814.4 64.5% 1,057.9 172.0 380.6 505.3 (42.8) 103.9 (0.7) 565.6 11.0% 5.5% 4.0% 5.3% 8.1% 5.9% 9.1%
Source: Bloomberg, SEC Filings, Mercer Capital analysis
© Mercer Capital 2013 | www.mercercapital.com 18
The Ins and Outs of Business Development Companies December, 2013
ANALYSIS OF BUSINESS DEVELOPMENT COMPANIESAS OF NOVEMBER 13, 2013
FINANCIAL PERFORMANCE FOR TRAILING TWELVE MONTH PERIOD CASH FLOW ANALYSIS - MOST RECENT QUARTER
BALANCE SHEET ITEMS SUMMARY INCOME STATEMENT COMMON SIZE PERFORMANCE MEASURES CASH FLOW MEASURES
Average Balance Sheet Items Trailing Twelve Month Period Financial Performance Trailing Twelve Month Period Financial Performance
Net Net Net Current CurrentCash & Interest Net Realized Unreal. Increase Income Income Total TotalMarket Total Bearing Common Investment Interest Other Investment Gains Gains Other (Decrease) Effective Effective Other Return Return Return Return
Fiscal Securities Assets Debt Equity Equity/ Income Expense Expenses Income (Losses) (Losses) Items in Equity Yield on Cost of Exp / on on on onYear $(Mil) $(Mil) $(Mil) $(Mil) Assets $(Mil) $(Mil) $(Mil) $(Mil) $(Mil) $(Mil) $(Mil) $(Mil) Assets Funds Assets Assets Equity Assets Equity
Total Assets > $1.0B
Ares Capital Corp Dec-12 120.5 7,027.7 2,675.3 4,150.5 59.1% 860.1 163.5 283.3 413.4 94.9 21.5 (2.7) 529.8 12.2% 6.1% 4.0% 5.9% 10.0% 7.5% 12.8%
American Capital Ltd Dec-12 468.5 6,268.5 797.0 5,397.5 86.1% 549.0 44.0 318.0 187.0 (59.0) 347.0 210.0 489.0 8.8% 5.5% 5.1% 3.0% 3.5% 7.8% 9.1%
Prospect Capital Corp Jun-13 6.4 3,848.1 1,281.1 2,396.5 62.3% 613.7 90.2 190.3 333.2 (24.2) (55.5) 0.0 253.5 15.9% 7.0% 4.9% 8.7% 13.9% 6.6% 10.6%
Apollo Investment Corp Mar-13 5.5 2,962.5 1,008.5 1,790.1 60.4% 358.2 63.4 108.7 186.1 (128.5) 80.7 0.0 138.3 12.1% 6.3% 3.7% 6.3% 10.4% 4.7% 7.7%
Fifth Street Finance Corp Sep-12 82.7 1,610.7 583.8 1,004.7 62.4% 207.1 30.4 68.1 108.6 (54.1) 48.3 2.4 102.8 12.9% 5.2% 4.2% 6.7% 10.8% 6.4% 10.2%
Solar Capital Ltd Dec-12 48.2 1,228.0 236.7 931.9 75.9% 169.7 13.0 66.1 90.6 (39.8) 18.8 3.4 69.7 13.8% 5.5% 5.4% 7.4% 9.7% 5.7% 7.5%
Main Street Capital Corp Dec-12 29.6 1,055.6 351.1 673.7 63.8% 109.3 19.0 19.5 70.7 3.8 32.8 (7.0) 100.2 10.4% 5.4% 1.9% 6.7% 10.5% 9.5% 14.9%
Hercules Technology Growth Capital Inc Dec-12 156.0 1,068.5 500.5 556.2 52.1% 133.9 29.3 37.3 67.3 12.4 19.7 0.0 99.4 12.5% 5.9% 3.5% 6.3% 12.1% 9.3% 17.9%
BlackRock Kelso Capital Corp Dec-12 8.4 1,159.3 398.8 699.9 60.4% 136.5 19.8 65.4 51.4 (73.7) 85.8 0.0 63.4 11.8% 5.0% 5.6% 4.4% 7.3% 5.5% 9.1%
PennantPark Investment Corp Sep-12 33.0 1,086.1 329.2 683.6 62.9% 129.2 15.4 46.8 67.0 17.7 7.1 (5.4) 91.8 11.9% 4.7% 4.3% 6.2% 9.8% 8.4% 13.4%
TICC Capital Corp Dec-12 76.0 896.1 384.0 467.5 52.2% 95.0 18.2 28.6 48.2 20.4 (8.7) 0.0 60.0 10.6% 4.7% 3.2% 5.4% 10.3% 6.7% 12.8%
Golub Capital BDC Inc Sep-12 15.5 863.6 366.8 487.9 56.5% 77.2 12.2 25.2 39.8 1.6 5.9 0.0 43.0 8.9% 3.3% 2.9% 4.6% 8.2% 5.0% 8.8%
GROUP MEDIAN 40.6 1,193.6 449.6 815.9 61.4% 12.0% 5.4% 4.1% 6.2% 10.1% 6.6% 10.4%
Total Assets > $300MM
Triangle Capital Corp Dec-12 110.1 755.6 316.5 430.0 56.9% 104.0 20.0 20.2 63.8 7.8 7.9 (1.0) 79.0 13.8% 6.3% 2.7% 8.4% 14.8% 10.5% 18.4%
Medley Capital Corp Sep-12 8.3 548.8 213.5 319.2 58.2% 75.6 11.4 25.0 39.1 0.1 (7.6) 0.0 31.6 13.8% 5.3% 4.6% 7.1% 12.3% 5.8% 9.9%
THL Credit Inc Dec-12 18.0 501.0 88.0 400.8 80.0% 72.5 4.8 26.4 41.3 2.7 (1.2) 0.0 41.8 14.5% 5.5% 5.3% 8.2% 10.3% 8.3% 10.4%
MVC Capital Inc Oct-12 59.8 524.1 107.2 392.8 74.9% 26.4 5.4 17.5 3.6 48.1 (22.4) (0.0) 29.3 5.0% 5.0% 3.3% 0.7% 0.9% 5.6% 7.5%
MCG Capital Corp Dec-12 81.1 592.2 214.1 371.1 62.7% 52.7 9.4 14.7 28.7 (26.4) 23.8 (0.5) 26.0 8.9% 4.4% 2.5% 4.8% 7.7% 4.4% 7.0%
KCAP Financial Inc Dec-12 6.1 385.5 140.3 236.0 61.2% 46.6 9.6 8.6 28.4 (11.8) 13.9 0.0 30.2 12.1% 6.9% 2.2% 7.4% 12.0% 7.8% 12.8%
Fidus Investment Corp Dec-12 77.0 349.5 143.0 200.8 57.4% 40.2 7.0 15.1 18.1 25.7 (16.1) 0.0 27.7 11.5% 4.9% 4.3% 5.2% 9.0% 7.9% 13.8%
Gladstone Investment Corp Mar-13 70.1 360.3 137.5 219.3 60.9% 36.4 4.5 11.9 20.1 24.9 (15.9) 0.0 29.1 10.1% 3.3% 3.3% 5.6% 9.1% 8.1% 13.3%
GSV Capital Corp Dec-12 27.4 292.4 34.2 257.1 87.9% 0.0 0.2 10.6 (10.7) (9.8) 15.0 0.0 (5.5) 0.0% 0.6% 3.6% -3.7% -4.2% -1.9% -2.2%
NGP Capital Resources Co Dec-12 37.1 300.6 96.8 198.1 65.9% 27.5 3.2 11.1 13.2 (18.7) 6.3 0.0 0.8 9.1% 3.3% 3.7% 4.4% 6.6% 0.3% 0.4%
GROUP MEDIAN 48.4 443.3 138.9 288.1 61.9% 10.8% 5.0% 3.5% 5.4% 9.1% 6.8% 10.2%
Total Assets < $300MM
Solar Senior Capital Ltd Dec-12 5.4 265.4 45.4 191.5 72.2% 20.3 1.3 5.8 13.2 (0.2) (5.2) 0.0 7.7 7.6% 2.8% 2.2% 5.0% 6.9% 2.9% 4.0%
Horizon Technology Finance Corp Dec-12 16.6 258.6 104.6 150.2 58.1% 32.8 7.4 12.1 13.3 (5.7) (4.0) (0.1) 3.6 12.7% 7.1% 4.7% 5.1% 8.8% 1.4% 2.4%
Gladstone Capital Corp Sep-12 13.2 301.4 114.2 183.8 61.0% 36.8 3.7 14.9 18.2 (10.2) 1.0 0.0 9.0 12.2% 3.3% 4.9% 6.0% 9.9% 3.0% 4.9%
PennantPark Floating Rate Capital Ltd Sep-12 5.1 211.4 69.9 119.8 56.7% 16.3 1.8 6.0 8.5 3.5 (1.5) 0.0 10.5 7.7% 2.6% 2.8% 4.0% 7.1% 5.0% 8.7%
Saratoga Investment Corp Feb-13 6.1 175.0 51.6 108.9 62.3% 20.6 4.0 7.5 9.2 1.2 (0.1) 0.0 10.3 11.8% 7.7% 4.3% 5.2% 8.4% 5.9% 9.5%
Full Circle Capital Corp Jun-13 0.1 111.2 34.8 54.8 49.3% 12.5 2.2 4.9 5.4 (4.0) (0.7) 0.0 0.6 11.2% 6.3% 4.4% 4.8% 9.8% 0.6% 1.2%
GROUP MEDIAN 5.8 235.0 60.7 135.0 59.5% 11.5% 4.8% 4.3% 5.0% 8.6% 3.0% 4.5%
AVERAGE 55.0 1,162.7 357.9 768.3 64.4% 10.4% 4.8% 3.8% 5.0% 8.3% 5.3% 8.6%
MEDIAN 29.6 524.1 143.0 371.1 61.9% 11.5% 5.0% 3.7% 5.4% 9.1% 5.8% 9.1%
GROUP TOTAL 1,591.5 35,007.7 10,823.9 23,074.2 65.9% 4,060.2 614.3 1,469.4 1,976.5 (201.2) 596.7 199.2 2,372.6 11.6% 5.7% 4.2% 5.6% 8.6% 6.8% 10.3%
Source: Bloomberg, SEC Filings, Mercer Capital analysis

© Mercer Capital 2013 | www.mercercapital.com 19
The Ins and Outs of Business Development Companies December, 2013
ANALYSIS OF BUSINESS DEVELOPMENT COMPANIESAS OF NOVEMBER 13, 2013
CASH FLOW ANALYSIS - MOST RECENT QUARTER CASH FLOW ANALYSIS - LAST TWELVE MONTHS
CASH FLOW MEASURES COMMON SIZE MEASURES CASH FLOW MEASURES COMMON SIZE MEASURES
Financing Activity Net Financing Activity NetNet Borrow / Net Borrow /
Borrow / Investment Activity Stock (Repay) Borrow / Investment Activity Stock (Repay)Investment Activity Stock (Repay) Div Purch / Sales / Issued / of Debt / Div Investment Activity Stock (Repay) Div Purch / Sales / Issued / of Debt / Div
Purchases Sales Net Issued of Debt Paid Ending Ending Average Average Paid / Purchases Sales Net Issued of Debt Paid Average Average Average Average Paid /$(Mil) $(Mil) $(Mil) $(Mil) $(Mil) $(Mil) Assets Assets Equity Debt NII $(Mil) $(Mil) $(Mil) $(Mil) $(Mil) $(Mil) Assets Assets Equity Debt NII
Total Assets > $1.0B
Ares Capital Corp 931.2 350.0 581.3 (0.0) 572.5 97.1 12.0% 4.5% 0.0% 18.2% 76.9% 3,487.5 2,173.3 1,314.2 333.4 917.8 385.3 49.6% 30.9% 8.0% 34.3% 93.2%
American Capital Ltd 65.0 223.0 (158.0) (176.0) 176.0 0.0 1.0% 3.6% -3.2% 22.3% 0.0% 635.0 1,095.0 (460.0) (230.0) (14.0) 0.0 10.1% 17.5% -4.3% -1.8% 0.0%
Prospect Capital Corp 522.6 164.2 358.4 235.8 43.2 80.1 10.9% 3.4% 8.1% 2.5% 97.2% 2,765.8 937.6 1,828.2 985.4 890.2 278.4 71.9% 24.4% 41.1% 69.5% 83.6%
Apollo Investment Corp 411.5 470.2 (58.7) 0.0 (53.1) 44.9 13.1% 15.0% 0.0% -4.9% 90.6% 2,143.4 1,790.5 352.9 182.3 141.8 166.7 72.4% 60.4% 10.2% 14.1% 89.6%
Fifth Street Finance Corp 236.6 184.4 52.2 151.8 473.3 31.1 12.5% 9.7% 12.7% 70.2% 102.2% 1,095.2 507.8 587.4 386.3 722.5 107.8 68.0% 31.5% 38.5% 123.8% 99.3%
Solar Capital Ltd 68.8 308.7 (239.9) 0.0 (143.8) 26.2 5.5% 24.6% 0.0% -63.9% 121.2% 566.2 538.4 27.7 146.9 (23.4) 97.6 46.1% 43.8% 15.8% -9.9% 107.6%
Main Street Capital Corp 179.8 147.7 32.1 131.5 (113.9) 20.3 14.5% 11.9% 16.6% -28.1% 116.0% 775.3 489.6 285.7 208.4 106.1 70.1 73.4% 46.4% 30.9% 30.2% 99.1%
Hercules Technology Growth Capital Inc 69.8 124.1 (54.3) (0.8) (7.8) 16.5 5.7% 10.1% -0.1% -1.4% 76.7% 616.0 451.2 164.8 126.5 138.2 57.4 57.6% 42.2% 22.7% 27.6% 85.3%
BlackRock Kelso Capital Corp 125.2 16.0 109.3 0.0 98.1 18.0 10.5% 1.3% 0.0% 23.7% 202.4% 438.9 430.5 8.3 0.0 29.5 71.7 37.9% 37.1% 0.0% 7.4% 139.5%
PennantPark Investment Corp 187.2 166.0 21.2 0.0 31.0 18.1 16.2% 14.4% 0.0% 8.5% 105.6% 504.4 437.1 67.2 (0.1) 71.8 68.5 46.4% 40.2% 0.0% 21.8% 102.2%
TICC Capital Corp 108.7 59.7 48.9 6.0 0.0 14.6 10.6% 5.8% 1.1% 0.0% 119.4% 748.2 350.0 398.2 120.5 132.5 54.9 83.5% 39.1% 25.8% 34.5% 113.8%
Golub Capital BDC Inc 265.5 92.6 172.9 101.6 18.1 12.1 26.1% 9.1% 16.9% 4.5% 100.9% 659.9 349.5 310.4 223.4 72.0 39.1 76.4% 40.5% 45.8% 19.6% 98.3%
GROUP MEDIAN 11.5% 9.4% 0.0% 3.5% 101.5% 62.8% 39.7% 19.3% 24.7% 98.7%
Total Assets > $300MM
Triangle Capital Corp 75.3 98.4 (23.1) 0.0 11.6 14.1 9.3% 12.2% 0.0% 3.3% 84.3% 232.8 255.5 (22.7) 0.0 75.6 56.0 30.8% 33.8% 0.0% 23.9% 87.7%
Medley Capital Corp 147.1 48.6 98.5 63.8 43.6 12.0 20.3% 6.7% 15.2% 15.7% 99.3% 520.0 197.6 322.4 209.8 125.5 38.9 94.7% 36.0% 65.7% 58.8% 99.4%
THL Credit Inc 97.1 31.2 65.9 0.0 55.9 14.2 16.2% 5.2% 0.0% 44.4% 122.7% 423.5 227.7 195.8 111.0 75.9 41.9 84.5% 45.4% 27.7% 86.3% 101.4%
MVC Capital Inc 42.5 15.6 26.8 (10.9) 83.9 3.1 7.3% 2.7% -2.8% 51.0% -143.6% 79.5 117.2 (37.8) (16.7) 114.4 12.7 15.2% 22.4% -4.2% 106.7% 350.9%
MCG Capital Corp 2.9 60.9 (58.0) 0.0 (25.8) 8.9 0.5% 11.2% 0.0% -14.4% 111.8% 195.4 247.9 (52.4) (27.2) (69.9) 35.8 33.0% 41.9% -7.3% -32.6% 124.9%
KCAP Financial Inc 94.8 28.7 66.1 0.0 (5.5) 9.1 20.3% 6.1% 0.0% -2.9% 120.4% 263.1 114.7 148.3 50.4 113.1 31.6 68.2% 29.8% 21.4% 80.7% 111.1%
Fidus Investment Corp 20.3 53.6 (33.3) 0.0 0.0 5.4 5.5% 14.5% 0.0% 0.0% 102.7% 107.4 97.7 9.7 28.9 3.0 19.3 30.7% 27.9% 14.4% 2.1% 106.7%
Gladstone Investment Corp 20.4 50.7 (30.3) 0.0 (19.0) 4.0 5.9% 14.6% 0.0% -18.8% 63.8% 80.3 68.0 12.3 31.0 (71.5) 15.9 22.3% 18.9% 14.1% -52.0% 79.1%
GSV Capital Corp 5.1 (10.9) 16.1 0.0 69.0 0.0 1.6% -3.4% 0.0% 101.0% 0.0% 37.2 6.9 30.3 0.0 69.0 0.0 12.7% 2.3% 0.0% 202.0% 0.0%
NGP Capital Resources Co 2.2 0.8 1.3 0.0 (6.0) 3.3 0.7% 0.3% 0.0% -5.4% 124.6% 99.0 90.3 8.7 (5.9) 28.5 13.4 32.9% 30.0% -3.0% 29.5% 101.9%
GROUP MEDIAN 6.6% 6.4% 0.0% 1.6% 101.0% 31.9% 29.9% 7.1% 44.1% 101.7%
Total Assets < $300MM
Solar Senior Capital Ltd 77.0 50.1 26.8 0.0 (4.6) 3.9 27.0% 17.6% 0.0% -13.2% 119.9% 233.5 186.7 46.8 37.2 (21.1) 14.9 88.0% 70.4% 19.4% -46.5% 112.8%
Horizon Technology Finance Corp 11.5 18.0 (6.5) 0.0 0.0 3.2 4.1% 6.4% 0.0% 0.0% 91.4% 121.3 93.4 27.9 (0.0) 56.7 13.8 46.9% 36.1% 0.0% 54.2% 104.2%
Gladstone Capital Corp 10.0 15.1 (5.0) 0.0 3.2 4.4 3.6% 5.4% 0.0% 3.3% 100.0% 73.5 103.4 (29.9) 34.9 (66.7) 17.6 24.4% 34.3% 19.0% -58.4% 96.8%
PennantPark Floating Rate Capital Ltd 114.3 46.4 67.9 6.3 51.4 2.4 43.4% 17.6% 4.4% 60.0% 73.1% 227.1 135.1 92.0 48.3 31.2 7.4 107.4% 63.9% 40.3% 44.7% 87.0%
Saratoga Investment Corp 54.9 29.9 25.0 0.0 0.0 0.0 24.5% 13.4% 0.0% 0.0% 0.0% 131.2 61.9 69.3 0.0 73.5 3.3 75.0% 35.4% 0.0% 142.4% 35.9%
Full Circle Capital Corp 35.0 10.1 24.9 0.0 (4.8) 1.7 30.1% 8.7% 0.0% -11.1% 140.5% 135.7 122.2 13.6 10.7 15.5 6.8 122.1% 109.9% 19.5% 44.6% 126.0%
GROUP MEDIAN 25.7% 11.0% 0.0% 0.0% 95.7% 81.5% 50.0% 19.2% 44.6% 100.5%
AVERAGE 11.9% 8.3% 2.2% 11.7% 85.3% 53.5% 37.2% 15.0% 43.0% 98.1%
MEDIAN 10.5% 6.7% 0.0% 1.6% 100.9% 46.9% 35.4% 14.1% 30.2% 99.4%
GROUP TOTAL 3,982.3 2,853.9 1,128.4 509.1 1,346.5 468.6 10.3% 7.4% 2.1% 10.8% 92.7% 17,396.1 11,676.8 5,719.4 2,995.2 3,737.7 1,726.7 49.7% 33.4% 13.0% 34.5% 87.4%
Source: Bloomberg, SEC Filings, Mercer Capital analysis

© Mercer Capital 2013 | www.mercercapital.com 20
The Ins and Outs of Business Development Companies December, 2013
Travis W. Harms, CFA, CPA/ABVSenior Vice President
901.322.9760
Travis’s practice focuses on providing public and private
clients with fair value opinions and related assistance
pertaining to goodwill and other intangible assets, stock-
based compensation, and illiquid financial assets. In
addition, he has experience with insurance and specialty
finance companies. He leads Mercer Capital’s Business
Development Companies industry team.
Jeff K. Davis, CFAManaging Director of Financial Institutions Group
615.767.9490
Jeff leads Mercer Capital’s Financial Institutions Group.
Prior to rejoining Mercer Capital, Jeff spent 13 years as a
sell-side analyst providing coverage of publicly traded banks
and specialty finance companies to institutional investors
evaluating common equity and fixed income investment
opportunities. Jeff speaks at industry gatherings, including
SNL Financial/University of Virginia’s annual analyst training
seminar, the ABA, state banking associations, and securities
industry gatherings. Additionally, he is widely quoted in the
media, is an editorial contributor to SNL Financial, and he
regularly makes presentations to boards of directors and
executive management teams regarding industry and market
trends.
Mercer CapitalFor over thirty years, Mercer Capital has met the valuation needs of the same middle market companies to which BDCs and other
funds provide capital. Mercer Capital’s senior valuation professionals bring broad and deep experience to the range of valuation
needs faced by BDCs and other investment funds.
Subscribe to Mercer Capital’s Business Development Companies Quarterly Newsletter at www.mercercapital.com.

© Mercer Capital 2013 | www.mercercapital.com 21
The Ins and Outs of Business Development Companies December, 2013
MERCER CAPITAL
5100 Poplar Avenue, Suite 2600
Memphis, TN 38137
901.685.2120
www.mercercapital.com
For more information about Mercer Capital, visit:
www.mercercapital.com