the institutional infrastructure of political contestation...
TRANSCRIPT

1
L Pretorius, Infrastructure of Political Contestation in South Africa, IPSA RC49, Madrid, 2012
The Institutional Infrastructure of Political Contestation in South Africa
Interlocking Directorates in the Mining Sector
XXIInd World Congress of Political Science, Madrid July 8 to 12, 2012. RC49: Democracy and Governance in the New Transitional Economies: The Case of ‘BRIC Countries’ Draft. Please do not quote without permission. Louwrens Pretorius Department of Sociology University of South Africa (Unisa) mailto:[email protected] ; [email protected]
The power elite is composed of men whose positions enable them to transcend the ordinary environments of ordinary men and women; they are in positions to make decisions having major consequences. Whether they do or do not make such decisions is less important than the fact that they occupy such pivotal decisions: their failure to act, their failure to make decisions, is itself an act that is often of greater consequence than the decisions they do make. For they are in command of the major hierarchies and organizations of modern society. They rule the big corporations. They run the machinery of the state and claim its prerogatives. They direct the military establishment. They occupy the strategic command posts of the social structure, in which are now centred the effective means of the power and the wealth and the celebrity which they enjoy. (C Wright Mills, The power elite)
The government was happy at the increasing placement of ANC cadres on company boards. This showed that companies were deferring not just to black interests but specifically to the ANC, increasing the party's reach into the private sector and strengthening its hegemony over civil society. (R W Johnson, South Africa's brave new world)
Government and Anglo-American are like Siamese twins. We always have to look at each other’s interests . . . Government would not like to take an intimidating position on empowerment. (Phumzile Mlambo-Ngcuka, former SA Minister of Minerals and Energy)
1 Introduction
The literature on South Africa is rich in insightful analyses of and commentaries on political contestation and power. It is, however, my impression that the extant analyses tend to generalise by exemplification rather than on the basis of systematic conceptualisation and description. To the extent that self-conscious conceptions of power are present in the literature, they tend to entail an eclectic mix of descriptions of influence/power as somehow associated with broadly named interest groups, cliques or organisations and personalities. Such descriptions are essential to comprehension of the evolving political system. However, lack of attention to the institutional infrastructure which girds political contestation and power makes it hard to get a grip on the dynamics of processes, on the fluctuating fortunes of powerful groups and individuals and on the trajectories of political contests.
This paper is an early product of a project which is designed to systematically map some of the institutional structures through which political contestation and power are mediated. The project is rooted in the assumption that comprehension of political influence/power and the associated stress lines require systematic descriptions of
2
L Pretorius, Infrastructure of Political Contestation in South Africa, IPSA RC49, Madrid, 2012
their associational, organisational and (more comprehensive in meaning than organizational) institutional (infra-) structures. Such descriptions might not be sufficient for comprehending political structures, but they are necessary.
Here I present only early and tentative results from the project. My current focus is on interlocking directorates among South African mining corporations and a very small sample of state and other interest organizations. The main current objective of the project is to map the South African mining sector as a network of corporations and corporate directors and to trace its extensions into the domain of the state, political parties and interest organizations. A longer-term purpose is to grow the project so as to also encompass other sectors of the economy.
The purpose of this presentation is descriptive, but ideas about "the politics of networks" are invited. While I am interested in developing insights into the politico-economic implications of the system of interlocking directorates, such insights are not mooted in this paper. Currently I am still on a learning curve with regard to the empirical domain (mining) and the methods (network analysis).
Perspectives and objectives
Methodologically this study resides within the broad field of Network Analysis (NA) -- which some call a paradigm rather than merely an analytic method. The claim to paradigmatic status refers to the structuralist roots of NA in, among others, Simmelian sociology (Marin & Wellman 2011, 13-15). More particularly, I draw on the large and growing corpus of studies on interlocking directorates. Theoretically the study has affinities with power structure research (Carroll & Sapinsky 2011, 181). This harks back to works on corporate and other elites such as those associated with names C Wright Mills, John Porter and G. William Domhoff and also the debates between elite and pluralist (e.g. Robert Dahl) interpretations of power.
For the purposes of this paper I assume audience knowledge of both NA concepts and ideas from the relevant political sociologies.
My preferred focus is on whole networks rather than on ego / egocentric networks, but both dimensions are explored in the project.
Whole networks "take a bird's-eye view of social structure, focusing on all nodes rather than privileging the network surrounding any particular node" (Marin & Wellman 2011, 19).
Egocentric networks "focus on the network surrounding one node" (Marin & Wellman 2011, 20)
The mining network is operationalized and depicted as a system of interlocking directorates (ID). Two or more corporations are interlocked when they share one or more directors. Interlocking directorates form affiliation networks - also known as 2-mode networks.
The formal analysis of affiliation networks is complicated through various difficulties which arise both in the construction of appropriate matrices and the application of appropriate metrics. The current presentation is based on a database that is still under construction and on exploratory applications of graphic and metric methods which allow for visual presentation of networks. It should be noted that I use formal measurements of the kind that are associated with Statistics [as in sample-based sociologies of attributes] and Mathematics [as in network analyses and formal

3
L Pretorius, Infrastructure of Political Contestation in South Africa, IPSA RC49, Madrid, 2012
modeling] as tools for exploration rather than as decision criteria. The purpose in this project is to explore the characteristics of the system rather than to provide mathematically precise descriptions thereof. The descriptions presented in this paper (and the intended Power Point accompaniment) are offered as foils for discussion and suggestion. No more.
The present presentation has the following objectives:
To describe selected characteristics of the system of interlocked corporations in the mining sector.
To identify potential broker corporations and broker directors in the system
To identify potential interest groups in the system
To illustrate a small sample of links between the system of mining corporations and directors and the state, the ruling party, political parties and interest organizations.
The search for brokers (or big linkers) reflects my support for relational and positional conceptions of influence/power. The ascription of influence (or stronger: power) to positions within organisations or other collectivities -- and more particularly to positions within networks of such entities -- has a prominent place in political sociology. Works from Simmel and Wright-Mills to Domhof and Dye come to mind. I accept that position may not be all that counts either analytically or practically. This paper is not, however, the space for revisiting theoretical disputes. I simply begin with the minimalist assumption that it seems to be reasonable to assume that actors (whether corporate or individual or, more decisively, in combination) who are located at key points in networks of action, have the potential to affect flows of information. If so, they have the potential to influence the shape of political contests and content of both decisions and non-decisions (as per Bachrach & Baratz 1963).1 Whether this can be more than an assumption requires, as a fundamental step, mapping of the relevant networks. But, to emphasize:
This presentation reports on first results from an ongoing project on intercorporate (more broadly: inter-organizational) networks. It is not concerned with assessing the actual current or future influence of particular individuals, elites, parties, factions, or interest groups inside or outside of the webs of institutions within which they operate. It is not concerned with assertions about, for example, a "dawning of a new mining order" and the rise or fall of particular factions of "a black mining elite" in association with entry and exit of former, present or future presidents (Financial Mail, 15 January 2010). The results do, however, identify corporations and individuals who occupy positions that are formally located at the peak of the corporations and who thus occupy positions which are -- in terms of the institutionalist assumptions behind this project -- theoretically central to the network. (In fact, the results support extant identifications of influential personalities. But they also identify less frequently noted corporations and persons.)
Some additional considerations should help to clarify the limitations of today's presentation:
1 A similar theoretical position but a different approach and theme: Pretorius 2011.

4
L Pretorius, Infrastructure of Political Contestation in South Africa, IPSA RC49, Madrid, 2012
The distribution of influence/power between executive managers and other directors is an empirical matter which requires attention. It may be that, for example, non-executive independent directors serve primarily prestige functions. In South Africa the presence of black independent directors in predominantly white-controlled corporations represent nominal compliance with BEE and affirmative action requirements. Hence it could be argued that they serve a primarily legitimation function. However, the evolving institutional norms and rules2 in terms of which South Africa corporations (and other types of organisations) are governed, prescribe substantive tasks and obligations to directors -- which make them responsible for the wellbeing of corporations, shareholders and a variety of stakeholders.3
This presentation deals with interlocking directorates. However, comprehension of network dynamics and their political meanings requires that attention be given also to other dimensions such as shareholding structures, joint ventures and, most particularly, the dynamics of BEE in South Africa. Such variables receive no more than passing mention in this presentation.
A data-base on other-than-corporate associational affiliations of directors is under construction, but documentary data -- particularly with regard to the political affiliations of directors -- are hard to obtain. The presentation nevertheless closes with a small illustration of the intended direction of this part of the research.
Union organizations and leaders are not (yet) included in this project.
The collection of data concerning the demographic attributes of directors is part of the wish list for the project.
This presentation largely avoids a major issue of contestation: The representivity of the directoriat in terms of race and gender. While the issue is not a priority for this presentation, the descriptions do provide some perspective on the matter. In fact, the NA results indicate the presence of predominantly black corporations and directors at the centre of the system.
Assessment of the real or potential political salience of mining corporations and their managements must factor in the fact that the sector is significantly globalized. The current "network topology" of the sector is very largely a product of the formerly (pre-1990s) dominant mining houses' disinvestment and unbundling strategies -- which purposely or conveniently -- fitted in with black economic empowerment (BEE) strategies. The point is addressed briefly in section 5.
2 Why the mining sector?
The mining sector is historically central to the industrial and political history of South Africa; it remains an important contributor to the national and global economy and (thus) a focus of contestation. But here I mention only the sector's economic significance. It is the domestic economic potential and global salience of mining that makes the sector a pre-eminent terrain for contestation -- with issues ranging from labor compensation, security and general welfare through ownership of minerals and
2 A tautology - since I take norms and rules to be elements in the definition of institution.
3 See http://www.auditor.co.za/Portals/23/king%20111%20saica.pdf
5
L Pretorius, Infrastructure of Political Contestation in South Africa, IPSA RC49, Madrid, 2012
corporations to the class structure of society, the welfare of local communities and the state of the environment.
The economic contribution of mining does, of course, vary with local and global conditions -- and its share in national performance measures has tended to decline over the decades. According to Sorenson (2011, 632) the decline was from 8.7% of GDP in 1994 to 7.7% (R135.6 billion) in 2007. However, the Chamber of Mines (COM) of South Africa claims that the addition of backward and forward linkages as well as mining wage and salary induced effects pushes the contribution to around 18% of GDP (Sorenson 2011, 632-633). The COM further claims that mining adds
More than 50% of merchandise exports, if beneficiated mineral exports are added;
about one million jobs, 500,000 of them directly -- but, mining has been shedding large numbers of jobs over the past decades, not least during the early 2000s commodities boom when mining investment actually fell and 20,000 jobs were lost in 2004-2006];
in the region of 20% of gross investment;
about 30% of capital inflows into the economy via the financial account of the balance of payments;
more than 40%, or close to R2-trillion, of the market capitalisation of the JSE;
More than 90% of South Africa's electricity-generating capacity;
About 30% of the country's liquid fuel supply; and
About 13% of direct corporate tax receipts, more than R17-billion in monetary value.
http://www.businesslive.co.za/southafrica/sa_markets/2012/02/04/migdett-to-reshape-industry
Despite domestic mining decline, South Africa remains a major minerals force. Measured in terms of Mining GDP it follows (at some US$21 billion) China's US$182 somewhat distantly, but remains competition with Canada, Russia and India for the 5th position.
Although mining is obviously not the only globally-connected sector of the economy, it is an important inward and outward linkage due to, among other things, "materials-intensive growth in developing countries and emerging economies with a fast-growing populous (i.e., Brazil, Russia, India and China (BRIC)), driven by significant urbanisation and industrialization processes" (Baxter 2009, 110). Four of the world's top mining corporations have strong South African links: BHP Billiton, Rio Tinto, Xstrata and Anglo American. Another, the Chinese state concern China Shenua, recently came close to a joint venture with the originally state-owned (now privatized) South African coal-to-oil giant, SASOL. Hence the inclusion of systematic data on the mining corporations' national provenances and international linkages is part of the research agenda for this project (albeit not yet done).
3 Procedures
3.1 The domain / population of study
6
L Pretorius, Infrastructure of Political Contestation in South Africa, IPSA RC49, Madrid, 2012
My intention is to cover as many sectors as possible, but at present the focus is on the mining sector. Even within this limitation, the domain boundaries are flexible and will remain so. The boundaries are subject to continuous change due to processes of unbundling, take-over, re-alignment of joint ventures, new establishment, disestablishment, etc. Domain specification is also complicated with reference to the sectoral identities of some corporations -- such as those which cross the nominal boundaries between, say, mining and manufacturing (a trend to come -- because it is encouraged by the South African government policy). Then there are organizations which are involved in significant ways in mining but which do not mine (as, indeed, holding companies don't). Within the present database an important example is the Industrial Development Corporation of SA (IDC). The inclusion or exclusion of the IDC does have noteworthy effects on the character of the corporate network. Other organisations also deserve attention because, for example, it is their specific function to represent the sector or parts thereof within the broader political system. Some are included in descriptions which follow.
The common research practice of delimiting the domain in terms of time periods and nominal typing of units is (thus) not appealing at this stage of my venture. Network analysis deals with dynamic systems. With reference to (youth criminal) gang boundaries, Bouchard & Konarski (2011, 2) have cautioned that members interact with larger social scenes that include many non-members. Hence gang boundaries should not be taken for granted, but should be allowed to emerge from relational data. The same goes for corporations and directors. And I would add that the identity of individuals and their positions are dynamic. That also requires an emergent rather than fixed notion of the domain.
3.2 The database
The descriptions that follow in section 4 reflect the database as it was on 1 June 2012 (after which it has already been both edited and expanded).
The construction of the database combines procedures which are akin to positional and snowball selection of units: I select organizations and directors which are known to be located in the mining and minerals sector of the economy from available listings and add to those through scrutiny of on-line mining and other industry and news sources. 4 On 1 June 2012 the mining-sector database included 86 corporations and 673 directors. Within the sector, the data-base currently contains mostly corporations that mine coal and lignite, gold and uranium, iron, chrome, and platinum group metals. Currently only two diamond-mining companies are included in the data set.
Since the database is constructed so as to list holding companies, business groups and subsidiaries as separate entities (depending on how they are listed in the sources), certain manipulations of the data result in smaller and varying numbers of units.5 The manipulations are part of efforts to grasp the structures of the various
4
The primary source for identifying corporations of data is McGregor's Who Owns Whom (http://www.whoownswhom.co.za/ -- electronic access provided via the University of South Africa Library).
5 The effects on overall system metrics are in fact reflected in some of the descriptions which follow in
this presentation; however they are not significant enough to merit discussion here.

7
L Pretorius, Infrastructure of Political Contestation in South Africa, IPSA RC49, Madrid, 2012
types of units. That rather complex task is still underway and not a topic for this presentation.
The inclusion of individual directors is less of a decision challenge. I follow the McGregor's listings and check these against the corporate websites where they are available, or use corporate websites or other Internet-based sources. The present description does not distinguish between types of directors and their specific formal roles. All directors are, for now, assumed to be equal in capacity and allowed to "compete analytically" for (non-)recognition as "brokers". Ultimately I may have to consider the relative positioning of different types of directors.
The database is compiled via an uncomplicated but efficient piece of software titled NodeXl -- "a free, open-source template for Microsoft® Excel® 2007 and 2010" (http://nodexl.codeplex.com/).
3.3 Analysis and interpretation
NodeXL is the current mainstay for data analysis and network visualization. However, UCINET6 -- which is probably more commonly used in academic research -- is also used and is likely to be further exploited for its superior analytic capabilities (https://sites.google.com/site/ucinetsoftware/home).
Formal interpretation of network characteristics is facilitated by a variety of mathematically-rooted network metrics. I have to admit that I am on a rather slippery learning curve in this regard. Another troublesome impediment in the way of formal estimation of the mining network characteristics derives from the fact that the database is currently constructed in way that makes data entering, editing, and manipulation relatively easy (an attraction of NodeXl), but which has the disadvantage that the data is stored in a format which does not facilitate the

8
L Pretorius, Infrastructure of Political Contestation in South Africa, IPSA RC49, Madrid, 2012
deployment of dedicated 2-mode metrics. Such difficulties aside: My personal approach to data interpretation -- which includes but does not rely on quantitative analytics -- favors both more and less conventional manipulation of data-arrays, metrics and graphic visualizations. I think such an approach is appropriate for the exploratory intentions of much network analysis. Hence this presentation reflects (but does not show) numbers and (shows) graphics which describe tentatively rather than affirmatively.
4 The system of interlocked mining corporations
At the time the database was "closed" for the purposes of finalising this presentation, it contained data on 86 corporations and 629 directors, i.e. a mean of 7 directors per corporation. Table 1 contains the descriptive statistics pertaining to the number of directorships per director.
Table 1
Box 1 identifies the 3 "busiest" directors in the sector and provides additional figures regarding the distribution per person.
It seems that multiple positions per person are scarce in the mining sector.

9
L Pretorius, Infrastructure of Political Contestation in South Africa, IPSA RC49, Madrid, 2012
Box 1
Distribution of directorates
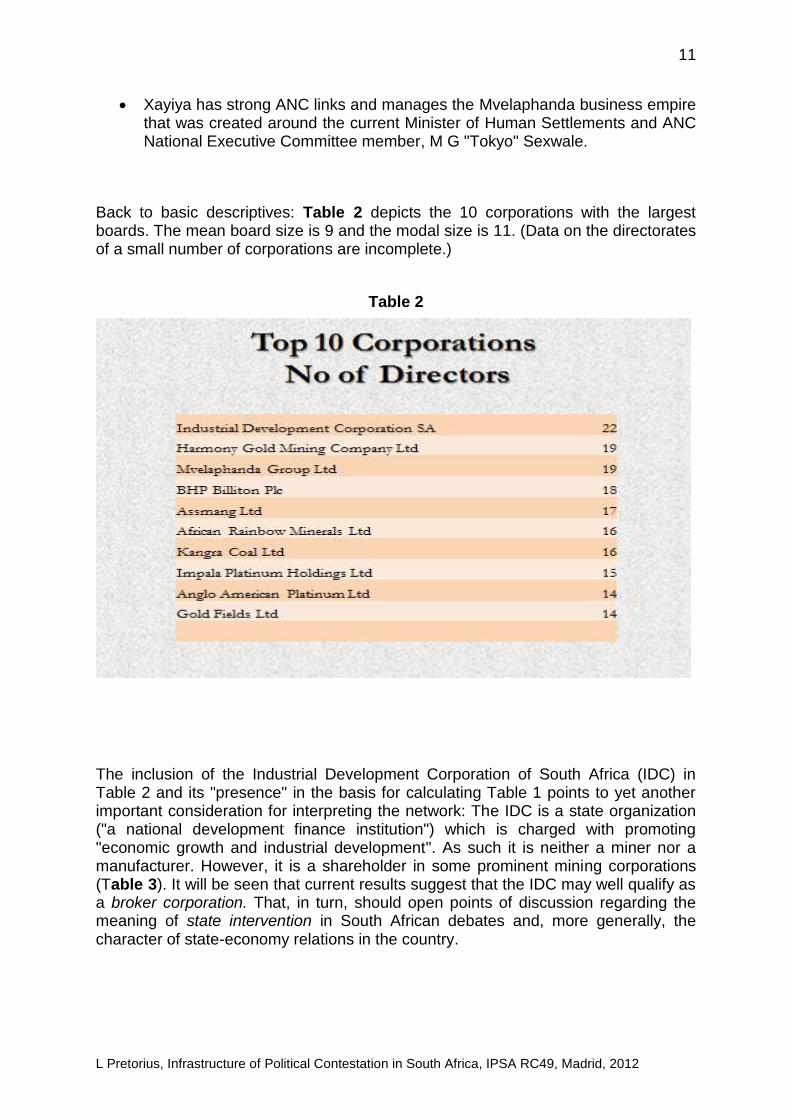
Table 2 displays the top 10 corporations in terms of the number of directors per corporate board.
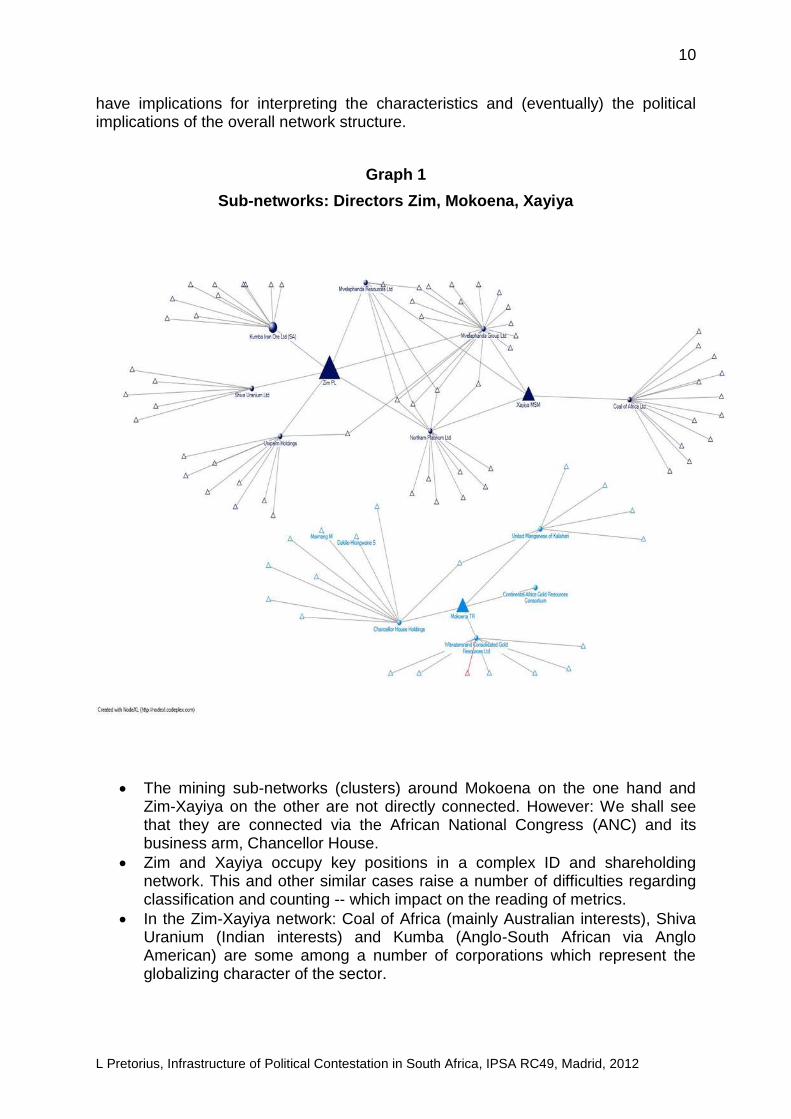
The names P L Zim and M S M Xayiya will recur in this presentation as broker directors (big linkers). That is, they occupy (theoretically) central positions in the network of interlocking directorates. T R Mokoena, on the other hand is not so positioned, but he is associated with Chancellor House Holdings -- which is itself centrally located and whose political potential is enhanced by its role as the ruling African National Congress's business arm.
Graph 1 depicts the sub-networks as constituted through the directorates held by Zim, Mokoena and Xayiya. Three features of the graph are worth noting - all of which
Zim PL Kumba Iron Ore Ltd (SA)
Zim PL Mvelaphanda Group Ltd
Zim PL Mvelaphanda Resources Ltd
Zim PL Northam Platinum Ltd
Zim PL Shiva Uranium Ltd
Zim PL Unipalm Holdings
Mokoena TR Chancellor House Holdings
Mokoena TR Continental Africa Gold Resources Consortium
Mokoena TR United Manganese of Kalahari
Mokoena TR Witwatersrand Consolidated Gold Resources Ltd
Xayiya MSM Coal of Africa Ltd
Xayiya MSM Mvelaphanda Group Ltd
Xayiya MSM Mvelaphanda Resources Ltd
Xayiya MSM Northam Platinum Ltd
• 24 Directors with 3 directorates each
• 76 Directors with 2 directorates each
• 526 (84%) Directors serve on only a single board
10
L Pretorius, Infrastructure of Political Contestation in South Africa, IPSA RC49, Madrid, 2012
have implications for interpreting the characteristics and (eventually) the political implications of the overall network structure.
Graph 1
Sub-networks: Directors Zim, Mokoena, Xayiya
The mining sub-networks (clusters) around Mokoena on the one hand and Zim-Xayiya on the other are not directly connected. However: We shall see that they are connected via the African National Congress (ANC) and its business arm, Chancellor House.
Zim and Xayiya occupy key positions in a complex ID and shareholding network. This and other similar cases raise a number of difficulties regarding classification and counting -- which impact on the reading of metrics.
In the Zim-Xayiya network: Coal of Africa (mainly Australian interests), Shiva Uranium (Indian interests) and Kumba (Anglo-South African via Anglo American) are some among a number of corporations which represent the globalizing character of the sector.
11
L Pretorius, Infrastructure of Political Contestation in South Africa, IPSA RC49, Madrid, 2012
Xayiya has strong ANC links and manages the Mvelaphanda business empire that was created around the current Minister of Human Settlements and ANC National Executive Committee member, M G "Tokyo" Sexwale.
Back to basic descriptives: Table 2 depicts the 10 corporations with the largest boards. The mean board size is 9 and the modal size is 11. (Data on the directorates of a small number of corporations are incomplete.)
Table 2
The inclusion of the Industrial Development Corporation of South Africa (IDC) in Table 2 and its "presence" in the basis for calculating Table 1 points to yet another important consideration for interpreting the network: The IDC is a state organization ("a national development finance institution") which is charged with promoting "economic growth and industrial development". As such it is neither a miner nor a manufacturer. However, it is a shareholder in some prominent mining corporations (Table 3). It will be seen that current results suggest that the IDC may well qualify as a broker corporation. That, in turn, should open points of discussion regarding the meaning of state intervention in South African debates and, more generally, the character of state-economy relations in the country.

12
L Pretorius, Infrastructure of Political Contestation in South Africa, IPSA RC49, Madrid, 2012
Table 3
Industrial Development Corporation of South Africa's presence in the mining sector
Source: McGregor's and others
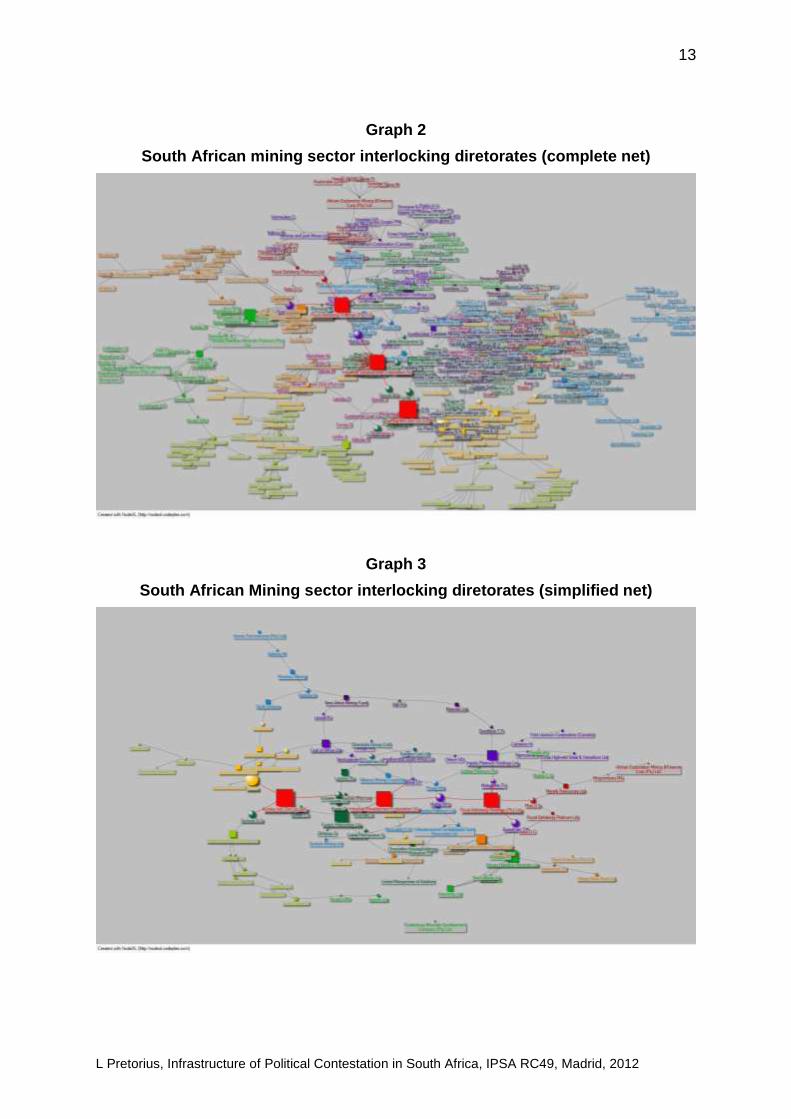
To turn to the heart of the matter: The overall mining system of interlocking directorates in the mining sector (as generated from the current data-base) comprises 6 connected components. That is, it comprises 6 sub-networks within each of which all the comprising corporations are connected, but which sub-networks are disconnected from each other. Of the 6 sub-networks 5 comprise 3 or fewer corporations. All the other corporations are combined into a single component. See Graph 5.
Graph 2 represents the full system of interlocks (for data as at 1 June 2012). It is a 2-mode or affiliation network. In other words, the corporations are linked via shared directors. The red squares in the centre represent three likely broker corporations - in terms of their respective betweenness centrality scores - in decreasing order of centrality: (1) Kumba, the (2) IDC and (3) Royal Bafokeng Holdings. Such scores identify the relevant vertices (nodes) in the network as brokers (bridges) between unconnected or (relatively) weakly connected clusters of corporations -- clusters which may well be conceptualized as interest groups within the system (see also comments on Graph 4).6
6 Graph color and shape codes will be identified during the oral and power point presentation.
IDC share in - Percent
ArcelorMittal South Africa Ltd 7.91
Aquarius Platinum SA (Pty) Ltd 29.50
Hernic Ferrochrome (Pty) Ltd 21.30
Hulamin Ltd 29.86
Incwala Resources (Pty) Ltd 23.60
Kalagadi Manganese (Pty) Ltd 10.00
Kumba Iron Ore Ltd (SA) 12.91
Lesego Platinum Mining Ltd 28.00
Merafe Resources Ltd 22.08
13
L Pretorius, Infrastructure of Political Contestation in South Africa, IPSA RC49, Madrid, 2012
Graph 2
South African mining sector interlocking diretorates (complete net)
Graph 3
South African Mining sector interlocking diretorates (simplified net)
14
L Pretorius, Infrastructure of Political Contestation in South Africa, IPSA RC49, Madrid, 2012
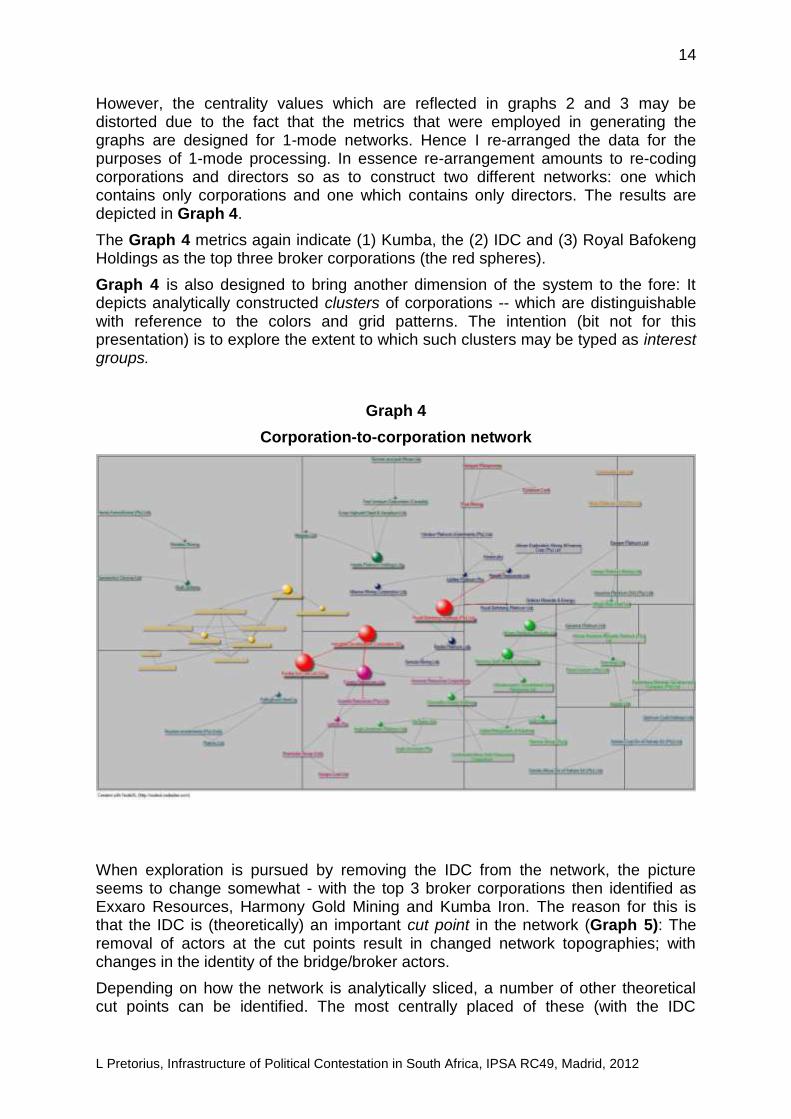
However, the centrality values which are reflected in graphs 2 and 3 may be distorted due to the fact that the metrics that were employed in generating the graphs are designed for 1-mode networks. Hence I re-arranged the data for the purposes of 1-mode processing. In essence re-arrangement amounts to re-coding corporations and directors so as to construct two different networks: one which contains only corporations and one which contains only directors. The results are depicted in Graph 4.
The Graph 4 metrics again indicate (1) Kumba, the (2) IDC and (3) Royal Bafokeng Holdings as the top three broker corporations (the red spheres).
Graph 4 is also designed to bring another dimension of the system to the fore: It depicts analytically constructed clusters of corporations -- which are distinguishable with reference to the colors and grid patterns. The intention (bit not for this presentation) is to explore the extent to which such clusters may be typed as interest groups.
Graph 4
Corporation-to-corporation network
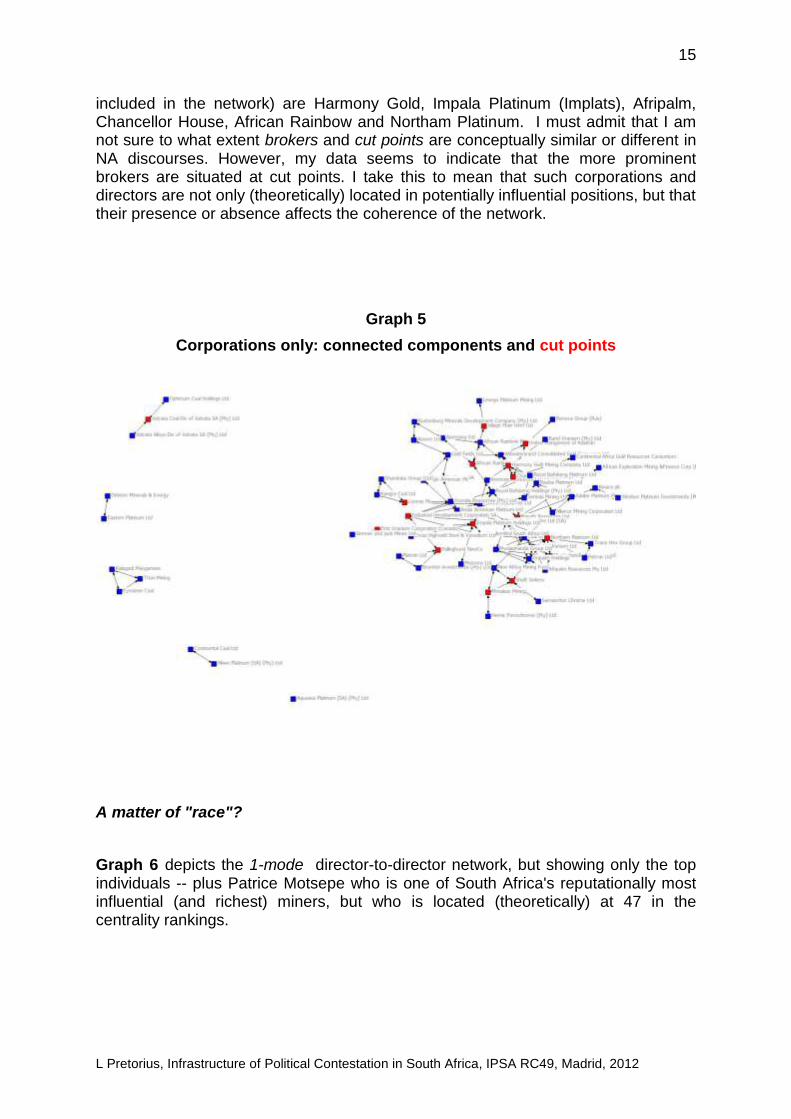
When exploration is pursued by removing the IDC from the network, the picture seems to change somewhat - with the top 3 broker corporations then identified as Exxaro Resources, Harmony Gold Mining and Kumba Iron. The reason for this is that the IDC is (theoretically) an important cut point in the network (Graph 5): The removal of actors at the cut points result in changed network topographies; with changes in the identity of the bridge/broker actors.
Depending on how the network is analytically sliced, a number of other theoretical cut points can be identified. The most centrally placed of these (with the IDC
15
L Pretorius, Infrastructure of Political Contestation in South Africa, IPSA RC49, Madrid, 2012
included in the network) are Harmony Gold, Impala Platinum (Implats), Afripalm, Chancellor House, African Rainbow and Northam Platinum. I must admit that I am not sure to what extent brokers and cut points are conceptually similar or different in NA discourses. However, my data seems to indicate that the more prominent brokers are situated at cut points. I take this to mean that such corporations and directors are not only (theoretically) located in potentially influential positions, but that their presence or absence affects the coherence of the network.
Graph 5
Corporations only: connected components and cut points
A matter of "race"?
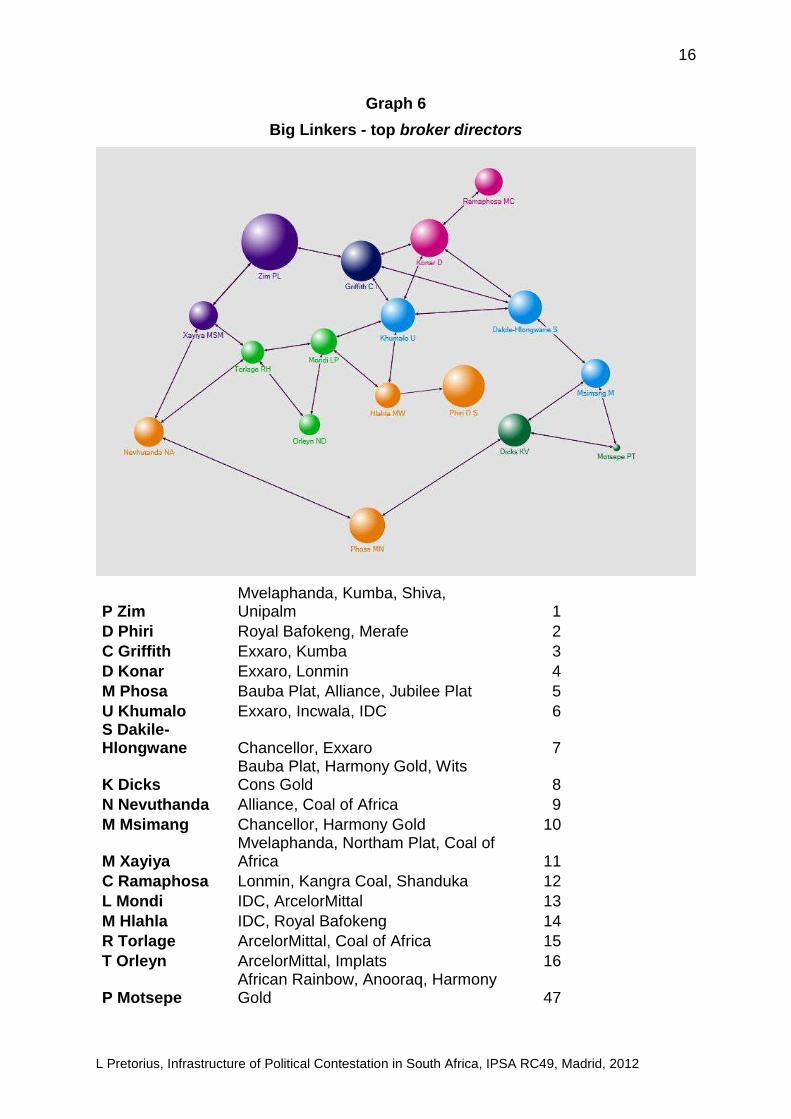
Graph 6 depicts the 1-mode director-to-director network, but showing only the top individuals -- plus Patrice Motsepe who is one of South Africa's reputationally most influential (and richest) miners, but who is located (theoretically) at 47 in the centrality rankings.
16
L Pretorius, Infrastructure of Political Contestation in South Africa, IPSA RC49, Madrid, 2012
Graph 6
Big Linkers - top broker directors
P Zim Mvelaphanda, Kumba, Shiva, Unipalm 1
D Phiri Royal Bafokeng, Merafe 2
C Griffith Exxaro, Kumba 3
D Konar Exxaro, Lonmin 4
M Phosa Bauba Plat, Alliance, Jubilee Plat 5
U Khumalo Exxaro, Incwala, IDC 6 S Dakile-Hlongwane Chancellor, Exxaro 7
K Dicks Bauba Plat, Harmony Gold, Wits Cons Gold 8
N Nevuthanda Alliance, Coal of Africa 9
M Msimang Chancellor, Harmony Gold 10
M Xayiya Mvelaphanda, Northam Plat, Coal of Africa 11
C Ramaphosa Lonmin, Kangra Coal, Shanduka 12
L Mondi IDC, ArcelorMittal 13
M Hlahla IDC, Royal Bafokeng 14
R Torlage ArcelorMittal, Coal of Africa 15
T Orleyn ArcelorMittal, Implats 16
P Motsepe African Rainbow, Anooraq, Harmony Gold 47
17
L Pretorius, Infrastructure of Political Contestation in South Africa, IPSA RC49, Madrid, 2012
In the literature on power in South Africa much is made of the new black middle class and, more particularly, the presumed political influence of the very rich among them (some of whose names appear above). It may or may not be significant that 14 of the 17 names that accompany Graph 6 are of persons who are, in South African discourse, black. However, of the full range of directors in the current database only some 33 to 35% appear to be black South Africans.
Where is the power?
Betweenness centrality indicates the relative value/weight of a node as a hub for communication. It seems reasonable to work with the proposition that central actors -- the brokers -- are likely to be influential actors. However, Bonacich (1987, 1170) argued
… that power does not equal centrality in exchange networks. In … experimental and simulation studies, those who were most central were not the most successful in exercising bargaining power. This seems to contradict much social network research, especially in the area of interlocking directorates" (emphasis added).
Bonacich (1987, 1171) further suggested that
… in bargaining situations, it is advantageous to be connected to those who have few options; power comes from being connected to those who are powerless. Being connected to powerful others who have many potential trading partners reduces one's bargaining power.
He thus formulated a metric of centrality which is rooted in this argument. In the UCINET6 toolbox the function designed to measure power according to this "dependency"-based conception identifies nodes with "neighbors who do not have many connections to others … those neighbors are likely to be dependent on ego, making ego more powerful" (Hanneman & Riddle, 151/322).
Application of the metric produces an interesting contrast with that obtained from conventional centrality Freeman-type measures - as in Table 4. The shifts are obvious, but it is also apparent that they concern the rank-ordering of corporations rather than the composition of the top-10 grouping of corporations.

18
L Pretorius, Infrastructure of Political Contestation in South Africa, IPSA RC49, Madrid, 2012
Table 4
Centrality - dependency influence comparison (corporations)
Note: Corporations (and directors) in a network are, of course, not the "independent units" that are assumed for statistical analyses of the attributes of individuals. They are, instead, related entities - for example through interlocking directorates and shareholding. For example, Afripalm has a controlling stake in Mvelaphanda Resources, and African Rainbow Minerals own 15% of Harmony Gold Mining.
Betweenness centrality•
Bonacich power†
Exxaro [coal, iron]
Northam Platinum
Harmony Gold
Kumba Iron
Kumba Iron
Mvelaphanda [gold, platinum, diamond]
Royal Bafokeng [platinum, ferrochrome]
Afripalm
Impala Platinum
Shiva Uranium
Coal of Africa
Coal of Africa Ltd
Afripalm
Exxaro [coal, iron]
Chancellor House [manganese]
Trans Hex [diamonds]
African Rainbow [platinum, ferrous, coal, copper, gold @ Harmony]
Petmin [anthracite, iron]
Northam Platinum
Harmony Gold
•IDC & NAMF excluded, groups comb †IDC & NAMF excluded, groups comb 1-mode
1-mode.

19
L Pretorius, Infrastructure of Political Contestation in South Africa, IPSA RC49, Madrid, 2012
Graph 7 closes this section. It sketches a network which was generated around the 10 most central corporations (the red spherical nodes) in the South African mining sector.
Graph 7
The top 10 interlock constellation
5 Towards as description of political interlocks?
One of the more interesting features of the network is that most of the corporations at the centre of the network are products of the disinvestment and unbundling strategies of formerly (pre-1994) dominant mining houses. For example: African Rainbow Minerals (Motsepe), Mvelaphanda (Sexwale / Xayiya), Shanduka (Ramaphosa) and Exxaro (Nkosi) and are products of asset sales (at discounted
20
L Pretorius, Infrastructure of Political Contestation in South Africa, IPSA RC49, Madrid, 2012
prices) by what used to be the foremost South African corporate giant, Anglo-American. Anglo-American's disinvestment from South Africa was accompanied by investment in Australia and Latin America and relocation to London. A similar route was followed by Billiton (previously the Afrikaner mining citadel, Gencor, now BHP Billiton).
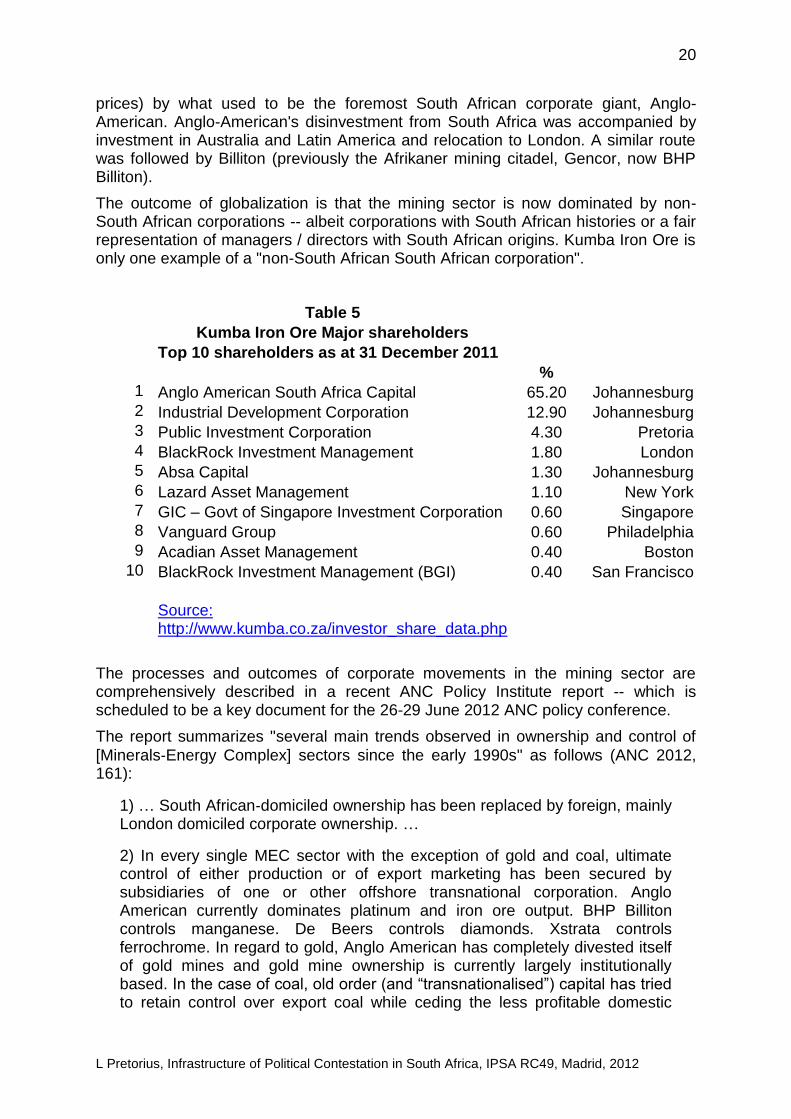
The outcome of globalization is that the mining sector is now dominated by non-South African corporations -- albeit corporations with South African histories or a fair representation of managers / directors with South African origins. Kumba Iron Ore is only one example of a "non-South African South African corporation".
Table 5
Kumba Iron Ore Major shareholders
Top 10 shareholders as at 31 December 2011
%
1 Anglo American South Africa Capital 65.20 Johannesburg 2 Industrial Development Corporation 12.90 Johannesburg 3 Public Investment Corporation 4.30 Pretoria 4 BlackRock Investment Management 1.80 London 5 Absa Capital 1.30 Johannesburg 6 Lazard Asset Management 1.10 New York 7 GIC – Govt of Singapore Investment Corporation 0.60 Singapore 8 Vanguard Group 0.60 Philadelphia 9 Acadian Asset Management 0.40 Boston
10 BlackRock Investment Management (BGI) 0.40 San Francisco
Source: http://www.kumba.co.za/investor_share_data.php
The processes and outcomes of corporate movements in the mining sector are comprehensively described in a recent ANC Policy Institute report -- which is scheduled to be a key document for the 26-29 June 2012 ANC policy conference.
The report summarizes "several main trends observed in ownership and control of
[Minerals‐Energy Complex] sectors since the early 1990s" as follows (ANC 2012, 161):
1) … South African‐domiciled ownership has been replaced by foreign, mainly London domiciled corporate ownership. …
2) In every single MEC sector with the exception of gold and coal, ultimate control of either production or of export marketing has been secured by subsidiaries of one or other offshore transnational corporation. Anglo American currently dominates platinum and iron ore output. BHP Billiton controls manganese. De Beers controls diamonds. Xstrata controls ferrochrome. In regard to gold, Anglo American has completely divested itself of gold mines and gold mine ownership is currently largely institutionally based. In the case of coal, old order (and “transnationalised”) capital has tried to retain control over export coal while ceding the less profitable domestic

21
L Pretorius, Infrastructure of Political Contestation in South Africa, IPSA RC49, Madrid, 2012
market to black capital. Currently the transnationals are manoeuvring to acquire control over that part of South Africa’s export coal that has been reserved for black capital. …
3) South Africa’s MEC minerals and processed commodities are largely locked into and traded by the offshore corporate global marketing divisions of the respective transnational corporations.
The local-international division amongst corporations clearly needs to be factored into eventual interpretations of the potential influence of the corporations and their directorates. The division should likewise be considered in analyzing (and projecting) possible lines of ascending contestation about current and mooted forms of state intervention (including the establishment of state mining entities and the institution of various forms of tax and nationalization). To phrase the point somewhat clumsily: Local and global corporations comprise and operate in different though overlapping power sets. They may also calculate their respective issue positions differently -- since they act in terms of different "institutional regimes".
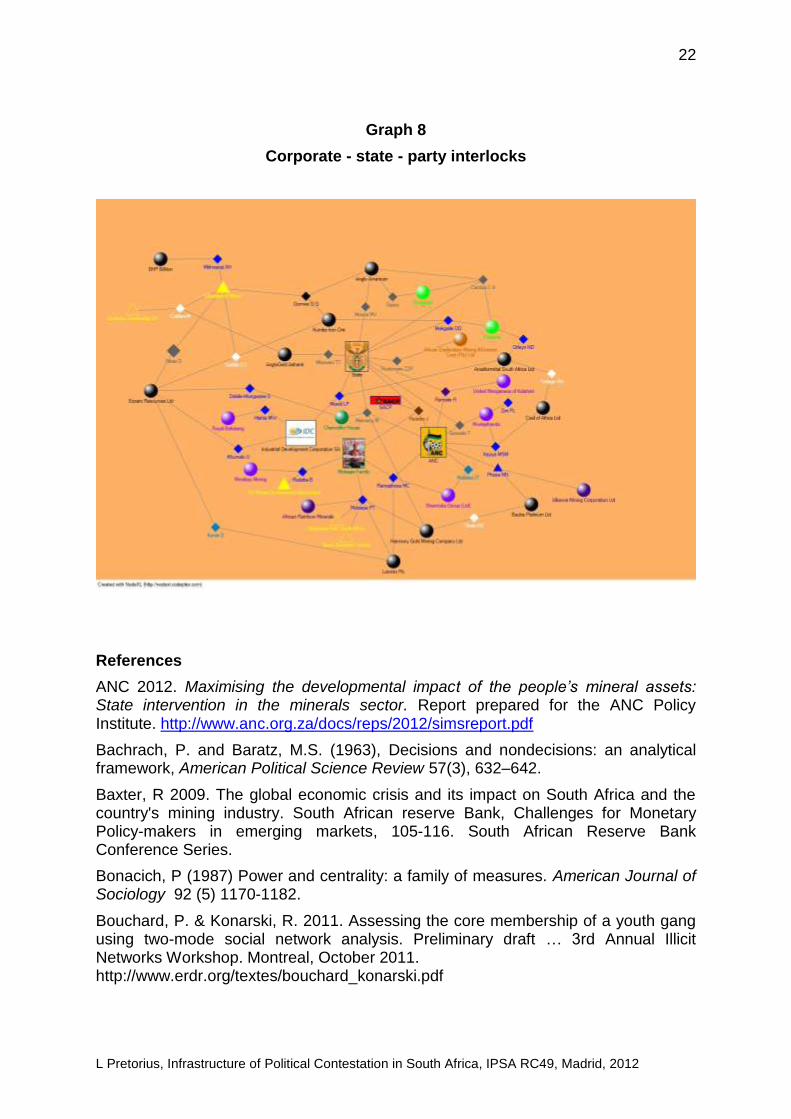
Graph 8 displays results from the still very limited data-base on directors' affiliations with state agencies, political parties and interest organizations.
Data on the major associations for the representation of corporate interests are relatively easy to access. It is much harder to find information about the non-corporate affiliations of individual directors. For some of the more prominent individuals, fragments of information can be gleaned from sources such as Who is Who and Internet searches. However, for the most part data on the political (and other social) affiliations of individuals must be extracted from news media reports.
Graph 8 goes a small step beyond the identification of, for example, known individual political actors (e.g. cabinet ministers Radebe and Sexwale) and South Africa's most prominent current politically-connected mining family (the Motsepes): It also illustrates links between corporate boards and selected interest organizations.
It is not really prudent to draw conclusions from the data at hand. Even so, they do seem to indicate (not surprisingly) that the foreign corporations (black spheres) are located at some remove from the core of the political system: the state, the ANC. They have to mediate through their interlocks with local corporations (violet spheres) -- all of whom we know are at least nominally connected with the ANC and other organized interest organizations (e.g. the Chamber of Mines; yellow triangles). However, the influence-value of all such connections is likely to be affected by the relative strength of the ANC's internal factions (about the composition of which little is known). Directors Ramaphosa and Phosa and former director (but current cabinet minister) Sexwale are important players in those factions.
22
L Pretorius, Infrastructure of Political Contestation in South Africa, IPSA RC49, Madrid, 2012
Graph 8
Corporate - state - party interlocks
References
ANC 2012. Maximising the developmental impact of the people’s mineral assets: State intervention in the minerals sector. Report prepared for the ANC Policy Institute. http://www.anc.org.za/docs/reps/2012/simsreport.pdf
Bachrach, P. and Baratz, M.S. (1963), Decisions and nondecisions: an analytical framework, American Political Science Review 57(3), 632–642.
Baxter, R 2009. The global economic crisis and its impact on South Africa and the country's mining industry. South African reserve Bank, Challenges for Monetary Policy-makers in emerging markets, 105-116. South African Reserve Bank Conference Series.
Bonacich, P (1987) Power and centrality: a family of measures. American Journal of Sociology 92 (5) 1170-1182.
Bouchard, P. & Konarski, R. 2011. Assessing the core membership of a youth gang using two-mode social network analysis. Preliminary draft … 3rd Annual Illicit Networks Workshop. Montreal, October 2011. http://www.erdr.org/textes/bouchard_konarski.pdf

23
L Pretorius, Infrastructure of Political Contestation in South Africa, IPSA RC49, Madrid, 2012
Carroll, W A & Sapinski J P 2011 Corporate elites and intercorporate networks. 180-195 in J Scott and P J Carrington eds. The Sage handbook of social network analysis. London Sage 2011.
Empowerdex. 2004. The state of black economic empowerment in the mining sector. Executive summary. July 2004. http://free.financialmail.co.za/empowerment/charters/miningsectorupdate.pdf Hanneman, R A & Riddle, M. 2005. Introduction to social network methods. Riverside, CA: University of California, Riverside (published in digital form at http://faculty.ucr.edu/~hanneman/ )
http://free.financialmail.co.za/empowerment/charters/miningsectorupdate.pdf
Johnson, R W. 2009. South Africa's brave new world. The beloved country since the end of apartheid. London, Penguin / Allen Lane.
Marin, A & Wellman, B 2011 Social network analysis: an introduction. 11-25 in J Scott and P J Carrington eds. The Sage handbook of social network analysis. London Sage 2011.
Mlambo-Ngcuka, P quoted in Tangri, R & Southall, R. 2008. The politics of black economic empowerment in South Africa. Journal of Southern African Studies 34(3) 699-716.
Pretorius. L. 2011. Giving and governing policy advice. The South African Economic Advisory Council, 1960-1985’ Politikon. South African Journal of Political Science 38 (3) 367-387.
Robinson V & Brümmer S. 2006. SA Democracy Incorporated. Corporate fronts and political party funding. ISS Paper 129.
Sorensen P (2011): Mining in South Africa: a mature industry? International Journal of Environmental Studies 68 (5) 625-649.