the integration of ammonia-water absorption chillers with residential ... · the integration of...
TRANSCRIPT

The Integration of Ammonia-Water Absorption Chillers with Residential Cogeneration Units:
A Feasibility Study
Kevin Key
A thesis submitted in partial fulfillment of the requirements for the degree of
BACHELOR OF APPLIED SCIENCE
Supervisor: J. S. Wallace
Department of Mechanical and Industrial Engineering University of Toronto
April, 2008

i
Abstract
The goal of this paper was to determine the feasibility of incorporating an absorption chiller with an existing residential cogeneration unit. The reasoning behind this is two-fold. First, absorption chilling reduces the load on the electricity grid when compared with a traditional vapour compression air conditioner. Second, it makes use of the waste heat of the cogeneration unit in the summer which would otherwise be discarded into the atmosphere.
This study found that it is possible to integrate an absorption chiller with an
existing cogeneration unit, but the chiller designed for this study did not achieve the performance of similarly-sized chillers discussed in the literature. As a result, the already costly cogeneration unit had to be scaled in order to provide sufficient heat to the absorption chiller. This means that the initial costs associated with absorption chilling and cogeneration are far too high to make this trigeneration system economically feasible for residential use.

ii
Acknowledgements I would like to thank Professor Wallace of the Mechanical Engineering
Department at the University of Toronto for his assistance throughout the period of
writing this paper. His wealth of knowledge and willingness to help were welcomed and
appreciated and made this process a very enjoyable learning experience.
I would also like to thank my family and friends for their never-ending support
throughout my entire educational career. Without their constant encouragement I would
not have been able to achieve the excellence I have, nor would I be as happy and
confident as I am today.
Whether you think you can or whether you think you cannot, you are right.
Believe in the power of positive thought.

iii
Table of Contents
Abstract i
Acknowledgements ii
Table of Contents iii
List of Symbols v
List of Figures vii
List of Tables ix
1. Background 1
1.1 Reducing our Electricity Demand 1
1.2 The Growing Popularity of Cogeneration 5
1.3 Absorption Chilling 6
2. Purpose of Study 8
3. System Design and Components 9
3.1 Residential Heating and Cooling Loads 9
3.2 Absorption Chiller Design 10
3.3 Cogeneration Unit 15
4. Economic Analysis 17
4.1 Base System and Comparison Systems 17
4.2 Cost of Utilities 20
4.3 Feasibility 22
4.4 Study Limitations 24
4.5 Energy Consumption Figures 25
5. Conclusion 28

iv
5.1 Study Summary 28
5.2 Closing Remarks 29
5.3 Further Studies 29
6. References 31
Appendix A – eQuest Inputs 33
Appendix B – Monthly Heating and Cooling Loads 34
Appendix C – Ammonia-Water Enthalpy-Concentration Diagram 35
Appendix D – Ammonia-Water Specific Volume 36
Appendix E – Ammonia and Water Specific Heats 37
Appendix F - Solutions to System Equations 38
Appendix G – Climate Energy Cogeneration Specification Sheet 40
Appendix H – Climate Energy Demonstration 45
Appendix I – Chiller COP vs. Capacity 57
Appendix J – HTS Fan Coil Selection 59
Appendix K – Armstrong Pump Curve 63
Appendix L – System Run Times 64
Appendix M – Utility Costs 65
Appendix N – Electrical Energy Requirements 66
Appendix O – Natural Gas Requirements 68
Appendix P – Distributed System Costs 70

v
List of Symbols
COP coefficient of performance [dimensionless]
CP specific heat Ckg
kJo
h specific enthalpy kg
kJ
HC heat of combustion kg
kJ
m mass flow rate s
gor
skg
MW molecular weight mol
kg
η thermodynamic efficiency [dimensionless]
P pressure [kPa]
Q heat flow [kW]
R ideal gas constant Kkg
mkPa 3
SEER seasonal energy efficiency ratio
T temperature [oC]
specific volume kg
m3
Vol volume of a gas [m3]
W work [kW]
x liquid mass fraction of ammonia kgLiquid
kgNH3
y vapour mass fraction of ammonia kgVapour
kgNH3

vi
Subscripts
Abs absorber
Cond condenser
Elec electricity
Evap evaporator
Fuel methane fuel
Gen generator
Heat space heating
P pump
Rec rectifier

vii
List of Figures Figure 1.1.1 - Satellite image taken August 13, 2003 before the blackout 1
Figure 1.1.2 - Satellite image taken after the blackout on August 14, 2003 1
Figure 1.1.3 – Canada’s energy consumption since 1990 2
Figure 1.1.4 – Canada’s greenhouse gas emissions since 1990 3
Figure 1.1.5 – Average Earth temperature 4
Figure 1.1.6 – Canadian residential space cooling electrical energy demand 4
Figure 1.3.1 – Basic absorption chiller schematic 6
Figure 1.3.2 – Velazquez and Best Absorption Chiller 7
Figure 3.2.1 – Cengel and Boles absorption chiller 10
Figure 3.2.2 – Schematic of the absorption chiller designed in this study 11
Figure 3.2.3 – COP of a 2.5 Ton chiller as a function of generator temperature 14
Figure 4.1.1 – Velazquez and Best Absorption Chiller 18
Figure 4.2.1 – Yearly Utility Costs for each Case 22
Figure 4.3.1 – Complete system costs distributed over a selected number 23 of years
Figure 4.5.1 – Case 1 Natural Gas and Electricity Consumption 25
Figure 4.5.2 – Case 2 Natural Gas and Electricity Consumption 25
Figure 4.5.3 – Case 3 Natural Gas and Electricity Consumption 26
Figure 4.5.4 – Case 4 Natural Gas and Electricity Consumption 26
Figure 4.5.5 – Case 5 Natural Gas and Electricity Consumption 27
Figure 4.5.6 – Case 6 Natural Gas and Electricity Consumption 27 Figure B.1 – Monthly Heating and Cooling Loads 34

viii
Figure C.1 – Ammonia-Water Enthalpy-Concentration Diagram from ASHRAE 35 Fundamentals 1993 Figure D.1 – Ammonia-Water Saturated Specific Volume from ASHRAE 36
Fundamentals 1993 Figure E.1 – Specific Heats for various liquids, solids, and foods from Cengel 37
and Boles Figure K.1 – Armstrong Pump Curve for chilled water loop 63

ix
List of Tables Table 3.2.1 – Properties at each state of the designed absorption chiller 15 Table 3.2.2 – Energy transfer of each component 15
Table 4.1.1 – Equipment summary for each case 20
Table 4.1.2 – Cogeneration Unit Costs 20 Table 4.1.3 – Absorption Chiller Costs 20 Table 4.1.4 – Carrier Air Conditioner Costs 20 Table 4.1.5 – HTS Fan Coil Costs 20
Table 4.3.1 – Overall costs associated with each case 23
Table I.1 – 3 Ton chiller state properties and energy exchanges 57 Table I.2 – 2.5 Ton chiller state properties and energy exchanges 57 Table I.3 – 2 Ton chiller state properties and energy exchanges 58 Table L.1 – Run times during the heating season for each case 64 Table L.2 – Run times during the cooling season for each case 64 Table N.1 – Electricity requirements of components used in each case 66 Table N.2 – Monthly energy loads and electricity costs for each case 66 Table O.1 – Natural gas power requirements for each case 68 Table O.2 – Monthly natural gas loads and costs for each case 68 Table P.1 – Distributed System Costs over a selected number of years 70

1
1. Background
Chapter one provides the reader with information pertaining to key topics that will
be useful throughout the paper. The first section highlights the increase in Canadian
energy consumption in general and residential space cooling in particular. The Blackout
of 2003 is also recalled. The next section introduces the growing popularity of
residential cogeneration and one area where improvements can be made. This chapter
concludes with a section on absorption chilling where the basics of absorption chilling
will be explained.
1.1 Reducing our Electricity Demand
“At 4:11 p.m. ET on Aug. 14, 2003, Ontario and much of the northeastern U.S.
were hit by the largest blackout in North America's history. Electricity was cut to 50
million people, bringing darkness to customers from New York to Toronto to North Bay”
[1]. While the cause was determined to be the unexpected shut down of FirstEnergy’s
East Lake power plant, personal electricity consumption may have played a factor as
well. If we all had been consuming less energy, the loss of the East Lake plant may
have had little effect.
Figure 1.1.1 - Satellite image taken August Figure 1.1.2 - Satellite image taken after the
13, 2003 before the blackout [2] blackout on August 14, 2003 [2]

2
Energy consumption has been an increasingly popular subject of discussion this
past decade and will likely remain that way for decades to come. Figure 1.1.3
demonstrates Canada’s energy consumption over the last fifteen years. It can bee seen
that both the total energy demand and the electrical demand have been steadily
increasing. Ontario in particular relies a great deal on coal-fired power plants for
electricity; so if this trend continues there are serious negative implications for Ontario’s
environment. Greenhouse gas emissions are a major result of coal-fired power plants’
processes and it has been shown that greenhouse gas emissions have increased in
Canada over the same fifteen year period (Figure 1.1.4).
Canadian Energy Consumption
0.0
1,000.0
2,000.0
3,000.0
4,000.0
5,000.0
6,000.0
7,000.0
8,000.0
9,000.0
1990 1991 1992 1993 1994 1995 1996 1997 1998 1999 2000 2001 2002 2003 2004 2005
Year
En
erg
y (
PJ)
Electrical Energy
Total Energy
Figure 1.1.3 – Canada’s energy consumption since 1990

3
Greenhouse Gas Emissions
0.00
100.00
200.00
300.00
400.00
500.00
600.00
1990 1991 1992 1993 1994 1995 1996 1997 1998 1999 2000 2001 2002 2003 2004 2005
Year
Em
iss
ion
s (
Mt
of
CO
2)
Total GHG Emissions
Residential GHG Emissions
Figure 1.1.4 – Canada’s greenhouse gas emissions since 1990
With increasing amounts of greenhouse gases in the atmosphere comes an
increase in the average earth temperature (Figure 1.1.5) since greenhouse gases trap
the sun’s energy and reduce the amount of heat radiated back into space. Therefore,
with this increase in average temperature it is no surprise that the energy demands for
residential space cooling have increased as well. Figure 1.1.6 illustrates this point very
nicely. In a sense, a “snowball effect” takes place since as temperature increases,
more energy is needed for cooling, which releases more greenhouse gases into the
atmosphere and increases the Earth’s temperature further. This cycle must be broken
in order to ensure that the planet and its inhabitants continue to survive.

4
Figure 1.1.5 – Average Earth temperature [3]
Residential Space Cooling Electrical Energy Consumption
0.00
0.50
1.00
1.50
2.00
2.50
1990 1991 1992 1993 1994 1995 1996 1997 1998 1999 2000 2001 2002 2003 2004 2005
Year
En
erg
y U
sag
e (
PJ)
Figure 1.1.6 – Canadian residential space cooling electrical energy demand

5
1.2 The Growing Popularity of Cogeneration
The principles behind cogeneration are rather simple and have been put to use
for years in industrial and commercial applications. Back in the 1880s, industrial plants
began using cogeneration to produce electricity and steam for plant processes [4].
Now, systems scaled down to sizes suitable for residential use are becoming
increasingly available due to increasing environmental concerns such as some of those
mentioned above.
For residential applications there are typically four different types of cogeneration
systems: internal combustion engine based, micro-turbine based, fuel cell based and
Stirling engine based. They all operate differently but their output is essentially the
same. All four, other than the fuel cell, produce electricity mechanically through an
electric generator and reject heat via the exhaust gases of the burnt fuel. The fuel cell’s
purpose is to produce electricity through chemical reaction. This reaction is exothermic
which is how heat is produced [4].
The benefits of this type of system are obvious; operators get both heat and
electricity from one input. This advantage is, however, somewhat short lived. During
seasons where heat is not required the thermodynamic efficiency drops dramatically.
From the equation for thermodynamic efficiency of a cogeneration unit, Fuel
HeatElec
Q
QW,
rejecting QHeat in the summer clearly emphasizes this point. In order to increase the
potential of these systems in climates that have significant cooling requirements, the
waste heat of the cogeneration unit needs to be used.

6
1.3 Absorption Chilling
The basic refrigeration absorption cycle, as designed by Edmond Carre in 1850
and patented by Ferdinand Carre in 1859, takes the form shown in Figure 1.3.1 [5].
There are typically two types of working fluid used in absorption chillers: a water-lithium
bromide solution and an ammonia-water solution. For this study, an ammonia-water
solution has been selected based on literature, which states that an ammonia-water
solution is better suited for small applications [6], and the availability of property relation
data.
Figure 1.3.1 – Basic absorption chiller schematic [7]
In this system, heat is added to the generator to vaporize some of the solution of
ammonia and water. The saturated vapour, rich in ammonia since the boiling point of
ammonia is lower than water, enters the condenser where heat is rejected to the
atmosphere, reducing the fluid to a saturated liquid. It is then throttled to the lower

7
pressure before entering the evaporator where it picks up heat from the space to be
cooled. In the absorber, the saturated vapour is dissolved into the ammonia-weak liquid
from the generator. This reaction is exothermic and the amount of ammonia that can be
dissolved is inversely proportional to the temperature of the solution. Therefore, heat
must be rejected to the atmosphere. From there, the saturated liquid solution is
pumped back to the generator and the cycle is complete [8].
As with all products, refinement continually takes place throughout the product’s
life. One such refinement produced the double-effect absorption chiller (the chiller
described above is a single-effect chiller). The double-effect chiller has two condensers
and two generators. The idea is that by adding and rejecting heat in stages, these
processes approach isothermal processes as the number of stages increase.
Isothermal processes allow efficiencies to approach the Carnot efficiency which is the
highest thermodynamic efficiency possible between two given temperature regions.
These chillers are typically used for large commercial applications due to their high cost.
Another refinement, better suited for small-
scale applications, is the Generator Absorber Heat
Exchange (GAX) absorption chiller. Figure 1.3.2
shows a GAX absorption chiller proposed by
Velazquez and Best [6]. It takes the general single-
effect chiller and adds three heat exchangers and a
rectifier to boost efficiency. Studies have show that
the GAX cycle will provide the highest COP of any
single-effect absorption cycle [6].
Figure 1.3.2 – Velazquez and Best Absorption Chiller [6]

8
2. Purpose of Study
This study determines the feasibility of integrating an absorption chiller with a
residential cogeneration unit to produce a trigeneration unit suitable for application in
residential homes in Toronto, Ontario. The aim was to decrease the electrical demand
on the grid and to increase the efficiency of the cogeneration unit during the summer
months. The absorption chiller is the perfect candidate since it is heat driven and it
compresses a liquid rather than a vapour. Liquids have specific volumes typically three
orders of magnitude smaller than vapours' and pump power is proportional to specific
volume.
To investigate the feasibility of this trigeneration system, a hypothetical building
was created to determine the heating and cooling load. A chiller was then designed to
meet the cooling load. The final step compared the economics of this chiller and
cogeneration unit with other systems that homeowners may be interested in installing.

9
3. System Design and Components
This chapter describes the process used to create and analyze the proposed
system. Section one introduces the computer modeling software used to create the
hypothetical house. The following section describes the procedures used to create the
absorption chiller and presents a schematic and the operating characteristics of the
chiller. The final section examines the existing Honda Cogeneration Unit and its design
specifications relevant to this particular application.
3.1 Residential Heating and Cooling Loads
eQuest 3.6 software was used to construct a computer model of the hypothetical
residential home to approximate heating and cooling loads. This software has an easy-
to-use interface and a design wizard which makes it easy to create any type of building
for energy simulations. This section describes the basic design of the residential space
created using the design wizard and the heating and cooling loads computed by the
program.
The home is a simple square-based home (2500ft2) that is symmetrical on all
sides to avoid complexity. Sensible and latent heat gains from people, appliances and
the like are not considered here since operating profiles are highly dependent on the
homeowner, but solar gains are considered. The selected building materials are
generic materials predefined by the program. For a detailed list of inputs, refer to
Appendix A.
The maximum design heating and cooling loads produced by the program are
8.34kW (28,465BTU/h) and 6.95kW (23,718BTU/h), respectively. A breakdown of the
monthly heating and cooling loads can be found in Appendix B. Notably, the heating

10
and cooling loads are specific to this application and are not representative of all 2500ft2
homes in Toronto. Since every building is different, specifications specific to each
building being analyzed should be utilized to accurately predict heating and cooling
loads.
3.2 Absorption Chiller Design
The first step involved deciding on the type of chiller to design. Initially, the goal
was to design a GAX-type chiller since it was claimed to have the highest COP of
single-effect absorption chillers [6]. However, once into the design process, it was
determined that the design of the system would require more time than was available
for the completion of this study due to its complexity. Therefore, the system found in
Cengel and Boles’ text, shown in Figure 3.2.1, was selected due to its inherent increase
in COP from the basic cycle and its increased simplicity compared to the GAX cycle.
For this application, the solar input was replaced by the heat from the cogeneration
unit’s exhaust. Figure 3.2.1 shows a schematic of the chiller designed for this study
where the circled numbers are the state numbers.
Figure 3.2.1 – Cengel and Boles absorption chiller [8]

11
Figure 3.2.2 – Schematic of the absorption chiller designed in this study
With the type of chiller selected, the next step was to determine the operating
pressures of the condenser and evaporator. According to the 2006 Ontario Building
Code, the ambient design temperature in Southern Ontario is between 29 and 31oC [9].
As such, the condenser temperature was selected at 40oC to ensure sufficient heat
rejection to the atmosphere from the condenser, where the working fluid is pure
ammonia. The Enthalpy-Concentration Diagram for Ammonia-Water in Appendix C [10]
determined that the condenser pressure should be 1300kPa.
On the evaporator side, since ammonia is not allowed within residential spaces in
any concentration, a chilled glycol-water line (glycol prevents freezing and the necessity
of draining the system in winter) was used to transfer heat from the home to the
evaporator. The Air-Conditioning and Refrigeration Institute requires that that chillers
supply air handlers with 7.2oC water [11], which allows the evaporator temperature to be
Generator
HE
Rectifier
Absorber Evaporator
Condenser
P
QGen
QAbs QEvap
QCond QRec
WP
2
3
4
5
6
10
9
8
7
1
12
11

12
selected at 2.5oC for adequate heat transfer from the chilled glycol-water loop to the
evaporator. This results in an evaporator pressure of 150kPa.
Before the mass flow rates and energy exchanges were determined, the states
were identified using the ammonia-water enthalpy-concentration diagram. Below is a
list of the states that were easily determined from the discussion in Chapter 1 and the
use of the enthalpy-concentration diagram.
State 2: Saturated Vapour at 1300kPa and 100% Ammonia
State 3: Saturated Liquid at 1300kPa and 100% Water
State 4: Saturated Liquid at 1300kPa and 100% Ammonia
State 5: Mixture of Liquid and Vapour at 150kPa and h5=h4
State 6: Saturated Vapour at 150kPa and 100% Ammonia
The properties of these states are shown later in this section in Table 3.2.1. Since the
chiller capacity was known, 2.5 tons in this case, the mass flow rate of refrigerant at
State 6 was determined using an energy balance on the evaporator.
EvapQ
hhm 42
6
Exhaust gases from the cogeneration unit give up some of their energy in the
generator. Since exhaust gases are typically in excess of 200oC, the chiller has been
designed with a range of generator temperatures, from 130 to 170oC, to determine
which TGen gave the greatest COP. Therefore, knowing TGen and the generator
pressure, States 1 and 9 were determined where 1 and 9 are saturated vapour and
liquid, respectively.
For the absorber to reject heat to the atmosphere, it must be at a higher
temperature. As mentioned above, the ambient design temperature is between 29 and

13
31oC for Southern Ontario, so TAbs was selected at 40oC to maintain consistency.
Similar to the generator, State 7 was determined since it was known to be a saturated
liquid. Following from State 7, State 8 was solved with the knowledge of the following:
Pumppump Ph
Referring to the specific volume table in Appendix D, the specific volume at State 7 is
0.00114kg
m3
[12]. Therefore, the enthalpy at State 8 was found for this mixture of
liquid and vapour.
To solve for the mass flow rates in the system, fluid mass and ammonia mass
balances were conducted on the rectifier and the absorber. Both produced a system of
two equations with two unknowns. The rectifier was straight-forward, but solving for the
absorber was more complex. To do this, it had to be recognized that the fluid mass flow
rate at State 9 equals the fluid mass flow rate at State 10 and the ammonia mass flow
rates are equal at each state as well.
The final step involved balancing the energy within the heat exchanger to resolve
the remaining states. Since none of the fluid properties of States 11 or 12 could be
determined from the enthalpy-concentration diagram, an approximation was made. To
ensure sufficient energy transfer in the heat exchanger, the temperature of State 12 was
assumed to be 45oC. Therefore, the enthalpy at State 12 was approximated as:
1212 TCh P
From the data presented in Cengel and Boles’ text (Appendix E), the Cp of an ammonia-
water solution was found using a weighted average of the Cp of water and ammonia at
45oC since the fractions were known [8]. Lastly, the enthalpy of State 11 was found

14
using an energy balance on the heat exchanger where it was assumed that there was
no net heat transfer with the surroundings.
To determine the COP of the absorption chiller, the energy input into the
generator and the pump was calculated. For example, the energy transferred out of the
condenser was found using the equation:
QCond = 6m (h2-h4).
The COP was calculated as follows:
COP = PumpGen
Evap
WQ
Q and is plotted in Figure 3.2.2 versus generator temperature.
Figure 3.2.3 – COP of a 2.5 Ton chiller as a function of generator temperature
Selecting 145oC as the generator temperature yields the highest COP for this
application of approximately 0.317.
Below is a table which summarizes the twelve states within the chiller. This is
followed by the energy transfers for each component in Table 3.2.2. Most of the states
are marked on the enthalpy-concentration diagram in Appendix C (those state that are
not saturated liquid or vapour cannot be marked). For a complete set of solutions to the
COP of 2.5-Ton Chiller
0.270
0.280
0.290
0.300
0.310
0.320
0.330
120 130 140 150 160 170
Generator Temperature (TGen)
COP

15
fluid mass balances, the ammonia mass balances and the energy balances, refer to
Appendix F.
State Pressure
(kPa) Temperature
(Deg. C) Mass Flow
(g/sec) Ammonia Fraction
(kg NH3/Kg) Enthalpy (KJ/kg)
1 Sat. Vap. 1300 145 11.02 0.700 1885
2 Sat. Vap. 1300 40 7.71 1.000 1320.0
3 Sat. Liq. 1300 192 3.31 0.000 800.0
4 Sat. Liq. 1300 40 7.71 1.000 155.0
5 -- 150 -- 7.71 -- 155.0
6 Sat. Vap. 150 2.5 7.71 1.000 1295.0
7 Sat. Liq. 150 40 47.70 0.300 -40.0
8 -- 1300 40.3 47.70 -- -38.7
9 Sat. Liq. 1300 145 39.99 0.165 520
10 -- 150 -- 39.99 -- 193.2
11 -- 1300 59.1 47.70 -- 235.3
12 -- 1300 45 39.99 -- 193.2
Table 3.2.1 – Properties at each state of the designed absorption chiller.
Component Energy (kW)
Qgen 27.69
Qrec 7.94
Qcond 8.98
Qevap 8.79
Qabs 19.62
Wp 0.063
Table 3.2.2 – Energy transfer of each component
3.3 Cogeneration Unit
Produced by Honda, the cogeneration unit selected for this application is a
single-cylinder 4-stroke spark ignition engine that uses natural gas for fuel. The unit
produces 3.52kW (12,000BTU/h) of thermal energy and 1.2kW of electricity. Climate
Energy, located in the United States, has integrated a natural gas furnace with the

16
cogeneration unit so that one integrated package is capable of supplying residential
spaces with all the heat they require. Specifications and highlights from a
demonstration program can be found in Appendix G and H.
From these specifications, it was found that the cogeneration unit, without the
furnace, needed to be scaled in order to meet the heating load of the residential space.
For this particular home, three Honda Cogeneration Units were required to meet the
8.34kW (28,465BTU/h) heating load. In order to meet the heating requirement of the
absorption chiller, the cogeneration unit was scaled eight times. Therefore, the base
design case consisted of the absorption chiller designed in Section 3.2 and eight Honda
Cogeneration Units. Further description of this system and the systems it was
compared against will be introduced in the next chapter.

17
4. Economic Analysis
The first section of chapter four elaborates on the baseline system, which was
outlined in chapter three, and defines the five cases it has been compared against. This
section also includes the additional equipment necessary to complete the system, in
addition to those already presented in Chapter three. Section 4.2 presents a monthly
numerical and graphical breakdown of the electricity and natural gas demands of the
residential space. Next, the yearly utility costs for each system are presented. The final
section in chapter four evaluates the potential of the trigeneration system designed for
this paper in relation to the other cases.
4.1 Base System and Comparison Systems
The base system (Case 1), as mentioned in Section 3.3, consisted of the
absorption chiller designed in Section 3.2 and eight Honda Cogeneration Units to
provide the full heat requirement of the chiller. As previously noted, the capacity of the
eight cogeneration units was more than the space heating load required. For small
capacity absorption chillers, their purchase and installation cost was approximated as
$1000/ton and maintenance costs about $100 per year for filter changes and routine
inspections [13]. According to Climate Energy, the cogeneration unit on its own is
$11,385 to purchase, a minimum of $3500 to install and requires a $150 service for
every 6000 hours of operation [14]. To determine a cost for a cogeneration unit scaled
eight times, the costs were also scaled by a factor of eight. Table 4.1.1 and Table 4.1.2
summarize these costs.
Cases 2 and 3 made use of the Honda Cogeneration Unit and a vapour
compression air conditioner from Carrier. For these cases, the cogeneration unit only

18
had to be scaled three times to meet the residential heating load since heat was not
required during the cooling months. As such, the costs associated with the unit were
scaled in the same manner as they were for Case 1. To provide cooling to the home, a
Carrier air conditioner with SEER 13 and 21 were selected for Case 2 and 3,
respectively. It costs $3200 to purchase and install the SEER 13 unit and $5000 for the
SEER 21 unit. Both units require a yearly $95 service [15].
To alleviate the financial strain of purchasing a cogeneration unit that has been
scaled, the cogeneration unit provided by Climate Energy and the Carrier air
conditioners of Cases 2 and 3 made up Cases 4 and 5. The cogeneration unit with the
17.58kW (60,000BTU/h) high efficiency furnace (product number WA-A060N-01) was
selected for this application since it is the smallest unit available that met the building
load. This unit, according to Climate
Energy, costs $14,275 to purchase,
$3500 to install and requires a $150
service every 6000hrs of operations [14].
The final case reincorporated an
absorption chiller, but used the chiller
designed in Velazquez and Best’s study
introduced in the first chapter. This chiller
is a GAX-type chiller and has a COP of
about 0.69. The chiller is a 3-ton unit, but
calculations done for the chiller designed
for this study showed that the chiller can
Figure 4.1.1 – Velazquez and Best Absorption Chiller [6]

19
be scaled without error. Proof of this is found in Appendix I. The state properties
remained constant, but the flow rates were scaled by five sixths. This scaled the energy
inputs and outputs, since energy is proportional to flow rate, and achieved a capacity of
2.5 tons. From Figure 4.1.1 it can be seen that the chiller uses natural gas and solar
inputs. For the purpose of this study, these two inputs were combined and heat was
supplied by the exhaust of the cogeneration unit. As in Case 1, the cogeneration unit
and its costs had to be scaled by a factor of three. The costs associated with the chiller
are the same as Case 1 since the chiller capacity was unchanged.
All six cases, other than Cases 4 and 5, required the selection of an air handler
to distribute conditioned air throughout the residential space. HTS Engineering selected
a 2.5 ton fan coil unit (model number LAH004A) to be used for this purpose [16]. While
a specification sheet for a horizontal unit is found in Appendix J, the vertical unit has the
same specifications. The unit was selected based on the required cooling capacity,
external static pressure from eQuest and 40% glycol in the chilled water line. The costs
associated with the fan coil are found in Table 4.2.4.
The final piece of equipment requiring selection was the chilled water pump for
Cases 1 and 6. The flow rate requirement was provided in the fan coil unit specification
sheet and the pressure head was estimated at 14.95kPa (5ft H2O). This pressure head
considered the pressure drop in the cooling coil and the estimated friction loss in the
small run required to link to the air handler. Pump curves on Armstrong Pumps Ltd.’s
websites were used to select pump S-25 with a 0.062kW motor for this application [17]
and are shown in Appendix K.

20
Equipment Summary
Cogeneration Unit Cooling Air Distribution Glycol Pump
Case 1 8x Honda Cogen Absorption COP=0.317 HTS Fan Coil Yes
Case 2 3x Honda Cogen Carrier SEER=13 HTS Fan Coil No
Case 3 3x Honda Cogen Carrier SEER=21 HTS Fan Coil No
Case 4 1x Climate Energy Carrier SEER=13 Climate Energy No
Case 5 1x Climate Energy Carrier SEER=21 Climate Energy No
Case 6 3x Honda Cogen Absorption COP=0.69 HTS Fan Coil Yes
Table 4.1.1 – Equipment summary for each case
Cogeneration Costs Absorption Chiller
Purchase Installation Maintenance (per 6000hr)
Purchase and Installation
Maintenance (per year)
Case 1 $91,080.00 $28,000.00 $1,200.00 Case 1 $2,500 $100.00
Case 2 $34,155.00 $10,500.00 $450.00 Case 2 -- --
Case 3 $34,155.00 $10,500.00 $450.00 Case 3 -- --
Case 4 $14,275.00 $3,500.00 $150.00 Case 4 -- --
Case 5 $14,275.00 $3,500.00 $150.00 Case 5 -- --
Case 6 $34,155.00 $10,500.00 $450.00 Case 6 $2,500 $100.00
Table 4.1.2 – Cogeneration Unit Costs Table 4.1.3 – Absorption Chiller Costs
Carrier Air Conditioner HTS Fan Coil Unit
Purchase and
Installation Maintenance
(per year) Purchase Installation Maintenance
(per year)
Case 1 -- -- Case 1 $3,150 $5,000 $100
Case 2 $3,200.00 $95.00 Case 2 $3,150 $5,000 $100
Case 3 $5,000.00 $95.00 Case 3 $3,150 $5,000 $100
Case 4 $3,200.00 $95.00 Case 4 -- -- --
Case 5 $5,000.00 $95.00 Case 5 -- -- --
Case 6 -- -- Case 6 $3,150 $5,000 $100
Table 4.1.4 – Carrier Air Conditioner Costs Table 4.1.5 – HTS Fan Coil Costs
4.2 Cost of Utilities
Figure 4.5.1 to 4.5.6, found at the end of this chapter, show the natural gas and
electricity demands of each of the six systems. Data used to determine these
requirements can be found in Appendix L to O. In calculating these requirements, it
was assumed that any electricity generated by the system would be purchased back by
Toronto Hydro at their lowest rate. Similarly, any electricity that was consumed was
charged at the lowest rate. This simplified the analysis since other electricity loads did
not have to be approximated to determine which cost bracket the electricity would be

21
charged at. Delivery and other charges associated with Toronto Hydro were applied
even if the net electrical energy was out to the grid since the distributor still had to
distribute the electricity out of the home. Additionally, it was assumed that the home
only required natural gas for running the cogeneration unit.
From these figures, it is apparent that the cases with absorption chillers were the
only cases where there was net electricity production during the summer. This is not
surprising since these were the only scenarios where the cogeneration system was
running during the summer. As such, these were the only cases that satisfied one of
the objectives of the study, which was to reduce summertime electricity consumption.
The only drawback of these cases, in terms of energy consumption, was that they
required much more natural gas than any of the systems with vapour compression air
conditioners.
Converting these energy consumptions into expenses the homeowner will incur
clearly highlights the effect of scaling the cogeneration unit (Figure 4.2.1). Only the
cases where the cogeneration unit was used in the summer was there more electricity
produced than consumed during one year. Here the electricity costs were set to zero
since Toronto Hydro will not pay the customer for the electricity they supply to the grid,
but will zero their account instead [20]. Also, the cases where an absorption chiller was
employed had the highest natural gas costs over the year. As expected, the scaled
cogeneration units required more natural gas than units not scaled.

22
Yearly Utility Costs
$0.00
$50.00
$100.00
$150.00
$200.00
$250.00
$300.00
$350.00
Case 1 Case 2 Case 3 Case 4 Case 5 Case 6
Co
st Natual Gas
CostElectricity
CostsCombined
Cost
Figure 4.2.1 – Yearly Utility Costs for each Case
4.3 Feasibility
Combining the results of Section 4.1 and 4.2 revealed the clear advantage of
avoiding scaling the cogeneration unit and using a vapour compression air conditioner
(Table 4.3.1 and Figure 4.3.1). The high initial cost of Case 1 made the system
impractical for residential use. After distributing the costs over 40 years, the yearly cost
of the Case 1 system was just less than twice the cost of the next most expensive and
over four times the cheapest system. However, the chiller proposed by Velazquez and
Best showed significant potential since it is slightly less expensive than the equally
scaled cogeneration unit with vapour compression air conditioning. But it became clear
that the best choices from an economic standpoint are Case 4 and 5; the Climate
Energy cogeneration unit with natural gas furnace and a vapour compression air
conditioner.

23
Costs
Equipment Maintenance (per year) Natural Gas (per year) Electricity (per year)
Case 1 $129,730.00 $467.89 $215.75 $0.00
Case 2 $56,005.00 $369.94 $97.24 $191.44
Case 3 $57,805.00 $369.94 $97.24 $129.41
Case 4 $20,975.00 $133.45 $24.09 $184.89
Case 5 $22,775.00 $133.45 $24.09 $121.26
Case 6 $55,305.00 $374.94 $143.11 $0.00
Table 4.3.1 – Overall costs associated with each case
Distributed System Costs
$0.00
$5,000.00
$10,000.00
$15,000.00
$20,000.00
$25,000.00
$30,000.00
0 10 20 30 40Years
Co
st
Case 1
Case 2
Case 3
Case 4
Case 5
Case 6
Figure 4.3.1 – Complete system costs distributed over a selected number of years (Data presented in
Appendix P)

24
4.4 Study Limitations
Before concluding this study, it is important to reiterate some of its limitations.
For example, in designing the absorption chiller, the state properties of the cycle were
determined from a graph. Interpreting data from a graph is never as accurate as using
calculations based on state equations. The references of the paper where the enthalpy-
concentration diagram was obtained were explored and, surprisingly, failed to reveal the
equations used to create the chart.
Additionally, the model home was a very crude approximation of a typical home
in Southern Ontario. To increase its accuracy, interior heat sources, such as computers
and lighting, should be included. Moreover, related to the eQuest model, it is important
to realize that every house is different and should be modeled accurately before
selecting heating and cooling equipment. For example, the house designed for this
study may have thicker or thinner insulation than other homes, which will have a
significant impact on the building loads.
One final limitation of this study is related to the scaling of the cogeneration
system. Indeed scaling the system is a relatively accurate way of predicting its energy
inputs and outputs, but not its cost. To demonstrate, consider an engine block.
Doubling its size will require twice the amount of material but the labour costs involved
with manufacturing the engine block will not be doubled. As a result, it is possible that
the costs associated with the scaled cogeneration systems are overestimates. This
means that the initial investment, the highest contributor to the failure of Case 1, may be
lower than predicted in this study, making the feasibility of absorption chillers greater
than the results of this study show.

25
4.5 Energy Consumption Figures
Case 1 Energy Consumption
0.00
50.00
100.00
150.00
200.00
250.00
Jan Feb Mar Apr May Jun Jul Aug Sep Oct Nov Dec
Natu
ral
Gas C
on
su
mp
tio
n (
m^
3)
-1500.0
-1000.0
-500.0
0.0
500.0
Ele
ctr
icit
y C
on
su
mp
tio
n (
kW
h)
Natural Gas
Electricity
Figure 4.5.1 – Case 1 Natural Gas and Electricity Consumption
Case 2 Energy Consumption
0.00
50.00
100.00
150.00
200.00
250.00
Jan Feb Mar Apr May Jun Jul Aug Sep Oct Nov Dec
Natu
ral
Gas C
on
su
mp
tio
n (
m^
3)
-1500.0
-1000.0
-500.0
0.0
500.0
Ele
ctr
icit
y C
on
su
mp
tio
n (
kW
h)
Natural Gas
Electricity
Figure 4.5.2 – Case 2 Natural Gas and Electricity Consumption

26
Case 3 Energy Consumption
0.00
50.00
100.00
150.00
200.00
250.00
Jan Feb Mar Apr May Jun Jul Aug Sep Oct Nov Dec
Natu
ral
Gas C
on
su
mp
tio
n (
m^
3)
-1500.0
-1000.0
-500.0
0.0
500.0
Ele
ctr
icit
y C
on
su
mp
tio
n (
kW
h)
Natural Gas
Electricity
Figure 4.5.3 – Case 3 Natural Gas and Electricity Consumption
Case 4 Energy Consumption
0.00
50.00
100.00
150.00
200.00
250.00
Jan Feb Mar Apr May Jun Jul Aug Sep Oct Nov Dec
Natu
ral
Gas C
on
su
mp
tio
n (
m^
3)
-1500.0
-1000.0
-500.0
0.0
500.0
Ele
ctr
icit
y C
on
su
mp
tio
n (
kW
h)
Natural Gas
Electricity
Figure 4.5.4 – Case 4 Natural Gas and Electricity Consumption

27
Case 5 Energy Consumption
0.00
50.00
100.00
150.00
200.00
250.00
Jan Feb Mar Apr May Jun Jul Aug Sep Oct Nov Dec
Natu
ral
Gas C
on
su
mp
tio
n (
m^
3)
-1500.0
-1000.0
-500.0
0.0
500.0
Ele
ctr
icit
y C
on
su
mp
tio
n (
kW
h)
Natural Gas
Electricity
Figure 4.5.5 – Case 5 Natural Gas and Electricity Consumption
Case 6 Energy Consumption
0.00
50.00
100.00
150.00
200.00
250.00
Jan Feb Mar Apr May Jun Jul Aug Sep Oct Nov Dec
Natu
ral
Gas C
on
su
mp
tio
n (
m^
3)
-1500.0
-1000.0
-500.0
0.0
500.0
Ele
ctr
icit
y C
on
su
mp
tio
n (
kW
h)
Natural Gas
Electricity
Figure 4.5.6 – Case 6 Natural Gas and Electricity Consumption

28
5. Conclusion
This chapter summarizes this study and the ideas presented within it. It
highlights what has been discussed thus far, reiterates the findings of the previous
chapter and makes recommendations for future studies based on the limitations of this
study.
5.1 Study Summary
This paper began by highlighting the urgency of reducing the electricity
consumption, especially during the summer months. Then, the idea of residential
cogeneration was highlighted and its advantages and disadvantages were discussed.
This was followed by a brief introduction to the science of absorption chilling. The
purpose of this study was then disclosed based on the ideas presented on the
aforementioned topics.
Next, a hypothetical residential home was created to determine the heating and
cooling loads the designed and selected equipment would have to provide. After
determining the building loads, a 2.5-ton absorption chiller was designed and the
process used in the design was presented. Unfortunately, due to the lower than
expected COP of the designed chiller, the Honda Cogeneration Unit had to be scaled in
order to provide sufficient heat to drive the system.
The last chapter was dedicated to the economics of integrating an absorption
chiller with the cogeneration unit. The aim was to determine if this would be more
economically attractive than using the cogeneration unit and a vapour compression air
conditioner. The findings show that, the vapour compression air conditioner systems
were much more cost effective than the systems with absorption chillers.

29
5.2 Closing Remarks
Currently, findings suggest that the economic feasibility of residential
trigeneration with a Honda Cogeneration Unit and an absorption chiller is minimal.
Scaling the cogeneration unit to meet the needs of the absorption chiller made the initial
investment far outweigh the cost savings of the utilities required. Even with prices of
small-scale absorption chillers decreasing as mass production begins, a sharper
decrease in cogeneration costs must occur in order for this to be a feasible option. To
alleviate this problem, a supplementary heat source, such as a solar collector, could be
implemented if higher chiller COPs cannot be achieved. In the mean time, homeowners
would be wise to purchase the cogeneration unit from Climate Energy with the 17.58kW
(60,000BTU/h) natural gas furnace and install a vapour compression air conditioner.
5.3 Further Studies
The most apparent limitation on the depth of this study has been time
constraints. For that reason, there are other areas worth investigating that may show
the feasibility of absorption chillers being integrated into cogeneration units. These
areas will now be discussed.
The first, and probably the most obvious, extension of this study is to incorporate
the environmental effects of using an absorption chiller instead of a vapour compression
air conditioner. In this instance, the yearly CO2 emissions should be examined to
determine what effect absorption chilling has on the environment compared to vapour
compression air conditioning. To further enhance this addition, other air pollutants can
be monitored and reported. Similarly, a lifecycle analysis could be conducted to

30
determine the effects of absorption chillers over their life and the inputs and outputs
associated with them.
As mentioned earlier, the absorption chiller designed for this study had a COP of
only 0.317 and was not a GAX-type chiller. A future study could look into designing a
GAX absorption chiller similar to the one designed by Velazquez and Best and perform
a full economic and environmental analysis on a system using that chiller. There is
even the potential to design chillers that have a COP in excess of 0.7 for residential use.
Additionally, a study could be conducted to determine the feasibility of changing the
working fluid from ammonia-water to water-lithium bromide.
Finally, this study was performed assuming the system would be utilized in
Southern Ontario. In this situation, the absorption chiller did not fare well. However, it
may be better suited for use in an area with a different climate and/or utility costs.
Potentially, warmer climates with lower utility costs may see increased benefits of using
residential trigeneration with absorption chilling. This is a very worthwhile area to
pursue.

31
6. References
[1] “Blackout,” CBC News Online, August 20, 2003. Retrieved March 21, 2008, from http://www.cbc.ca/news/background/poweroutage/
[2] “Learning from the Blackout of 2003,” Natural Elements, vol. 11, February 2007.
Retrieved March 21, 2008, from http://www.nrcan.gc.ca/com/elements/issues/11/blapan-eng.php
[3] Thompson, M. (2008, January 8). “Global Annual Mean Temperature,” Lecture:
MIE516: Combustion and Fuels. University of Toronto. [4] H. Onovwiona and V. Ugursal, “Residential Cogeneration Systems: Review of
Current Technology,” Renewable and Sustainable Energy Reviews, vol. 10, pp. 389-431, 2006.
[5] “The Future of Absorption Technology in America,” U.S. Department of Energy,
June 2000. [6] N. Velazquez and R. Best, “Methodology for the Energy Analysis of an Air
Cooled GAX Absorption Heat Pump Operated by Natural Gas and Solar Energy,” Applied Thermal Engineering, vol. 22, pp. 1089-1103, 2002.
[7] W. Stoecker and J. Jones, Refrigeration and Air Conditioning. McGraw-Hill Inc,
1982. [8] Y. Cengel and M. Boles, Thermodynamics: An Engineering Approach (4th ed.).
New York: McGraw-Hill Inc, 2002. [9] “Supplementary Standards SB-1,” Ontario Building Code, 2006. [10] “Enthalpy-Concentration Diagram for Ammonia-Water Solution,” ASHRAE
Fundamentals, 1993. [11] D. Priedeman, “Performance of a Residential-Sized CAX Absorption Chiller,”
Transactions of the ASME, vol. 123, pp. 236-241, September 2001. [12] “Specific Volume of Saturated Ammonia Solutions,” ASHRAE Fundamentals,
1993. [13] Esther Tam, Trane. Personal Communication, Week of February 4, 2008.
B: 416-499-3600. [14] Tony Petruccelli, Climate Energy. Personal Communication, February 14 and
20, 2008. B: 508-359-4500, [email protected].

32
[15] Mario, Dupont Heating and Air Conditioning. Personal Communication, Week of March 3. B: 416-532-2859.
[16] John Sampson, Sales Engineer, HTS Engineering Ltd. Personal
Communication, March 17 and 18, 2008. B: 416-661-3400 ext. 261, [email protected].
[17] “Inline Circulators,” Armstrong Pumps Ltd. Retrieved March 18, 2008 from
http://www.armstrongpumps.com/present.asp?marketID=01&market_sectionID=01&classID=05&modelID=004&groupid=0.
[18] “Residential Customers,” Enbridge Gas Distribution Inc. Retrieved February 27,
2008, from https://portal-plumprod.cgc.enbridge.com/portal/server.pt?open=512&objID=248&PageID=0&cached=true&mode=2&userID=2
[19] “Residential Rates,” Toronto Hydro Electric System. Retrieved February 27,
2008, from http://www.torontohydro.com/electricsystem/residential/rates/index.cfm
[20] “Net Metering,” Toronto Hydro Electric System. Retrieved February 27, 2008,
from http://www.torontohydro.com/electricsystem/customer_care/cond_of_services/generation_connection/net_metering/index.cfm
[21] E. Keating, Applied Combustion (2nd ed.). New York: CRC Press.

33
Appendix A – eQuest Inputs
Before beginning, it is important to note that if the option is not described in this
writing, it was left at the default setting. On the first page, Toronto, Ontario was
selected as the location of construction. For this study, a home with a 2500 ft2 area was
selected with two floors above ground and none below. Typically, the load on a
basement is small in comparison to the main floors and is uninhabited, so it was
omitted. Originally, a multi-family low-rise building type was selected since there was
no single family option, but this option appears on page 15. Finally, the heating and
cooling options were selected. These did not impact the loads on the space (the
program uses them for cost simulations) but selecting evaporative coils and furnace
made the simulation simpler.
On page three, each floor was set to its own zone. Typically, residential homes
are zoned as one large zone, but unfortunately this was not an option. Therefore, each
floor was made into its own zone which included an attic because heat loss through the
roof is critical. The direction that the house faced was not important since it was made
symmetrical on all sides. Similarly, on page six, one door per side was selected.
For the sake of simplicity, page 15 to 18 were set to make the entire space
residential (removed storage and laundry) and all interior enduses that contributed to
the space load were removed. Removing all the interior sources of heat simplified the
analysis since usage profiles are dependent on the individual resident. Ambient lighting
was kept so that solar heat gain would be included. Continuing with the interior, the
occupied cooling and heating temperatures were set to 75oF and 72oF, respectively.

34
Appendix B – Monthly Heating and Cooling Loads

35
Appendix C – Ammonia-Water Enthalpy-Concentration Diagram
Figure C.1 – Ammonia-Water Enthalpy-Concentration Diagram from ASHRAE Fundamentals 1993 [10]

36
Appendix D – Ammonia-Water Specific Volume
Figure D.1 – Ammonia-Water Saturated Specific Volume from ASHRAE Fundamentals 1993 [12]

37
Appendix E – Ammonia and Water Specific Heats
Figure E.1 – Specific Heats for various liquids, solids, and foods from Cengel and Boles [8]

38
Appendix F - Solutions to System Equations Pump Enthalpy
kgkJkPa
kgmPh Pumppump 311.1)1501300(00114.0
3
kgkJ
kgkJhhh Pump 689.38)311.140(78
Refrigerant Mass Flow Rate
sg
skg
kgkJ
kW
hh
Qmmmm
Evap71.700771.0
)1551295(
8792
56
6542
Rectifier Mass Balances
332211 mxmymy
sg
m
sg
kgkgNH
mkg
kgNH
02.11
071.7000.1700.0
1
31
3
321 mmm
sg
m
ms
gs
g
31.3
71.702.11
3
3
Absorber Mass Balances
996677
967
mxmymx
mmm
Combining these two equations gives:
1012
3
3
97
766
9 99.39
)165.0300.0(
)300.000.1(71.7)(
mms
g
kgkgNH
kgkgNH
sg
xx
xymm
1187 70.47)99.3971.7( mms
gs
gm
Heat Exchanger Energy Balance
1212 TCh P
kgkJh
kgCkJ
OkgHCkJ
kgOkgH
kgNHCkJ
kgkgNH
COHCxCNHCxC
o
oo
o
PC
o
PP
185.193
293.4
18.4835.0208.5165.0
)45@()1()45@(
12
2
2
3
3
2939

39
0)()( 9121281111 hhmhhm
kgkJh
kgkJ
sg
kgkJh
sg
3.235
0)520185.193(99.39))689.38((70.47
11
11
Component Energy Balances
1111339911 hmhmhmhmQGen
kW
kgkJ
skg
kgkJ
skg
kgkJ
skg
kgkJ
skg
69.27
3.2351000
7.47800
1000
31.3520
1000
99.391885
1000
02.11
kgkJ
skg
kgkJ
skg
kgkJ
skg
hmhmhmQ c 8001000
31.31320
1000
71.71885
1000
02.11332211Re
kW94.7
kWkg
kJs
kghhmQ
kWkg
kJs
kghhmQ
Evap
Cond
79.8)1551295(1000
71.7)(
98.8)1551320(1000
71.7)(
566
426
kgkJ
skg
kgkJ
skg
kgkJ
skg
hmhmhmQAbs )40(1000
7.472.193
1000
99.391295
1000
71.777101066
kW62.19
kWkg
kJs
kghhmWP 063.0))40(689.38(
1000
7.47)( 787

40
Appendix G – Climate Energy Cogeneration Specification Sheet

TECHNICAL SPECIFICATION
Warm Air freewatt System Model WA-A
COMBINED HEAT AND POWER FOR THE HOME Climate Energy’s freewatt System combines two technologies, an advanced warm air furnace and a natural gas-fired engine-generator. This hybrid heat and power generation package provides unrivaled total energy efficiency in combined heat and power delivery to the home. The freewatt system is designed to be installed in the place of a typical furnace and uses the same ductwork system to deliver the heat to the home
freewatt SYSTEM FEATURES • Honda MCHP Power Generation
Technology o Honda Reliable o Quiet (47 dBA) o Efficient (85%+ = Heat And Power) o 1.2 kW of Electric Power Production o UL 1741 Certified for Grid
Interconnection o Proven Technology
freewatt SYSTEM BENEFITS • Reliable Power Generation, Powered by Honda™ • Significantly Reduces:
o Home’s Carbon Footprint Using Energy Conservation o Monthly Electric Bill by Net-Metering Power Generation &
Use • Enhanced Comfort
o Low Level of Continuous Heat Delivery • Indoor Air Quality – MERV 8 Air Filtration
• Advanced Warm Air Furnace
o Energy-Star Qualified o High Efficiency (93% AFUE) o ECM Blower Motor: Low Power
Consumption • Hybrid Integration Module
o Permanent Magnet Pump o Custom Air Coil Heat Exchanger
High Efficiency Air Filter (MERV 8)
• Supervisory Control System
o freewatt System Controller o Advanced Heat And Power Algorithm o Communicating Thermostat o Internet Connection
• Simple Installation • Compatible with Conventional Air
Conditioning Systems
• Increases house value by $5,000 to $20,000 (National Appraiser’s Institute)
• Return on Investment (ROI) of up to 20% annually • System Monitoring through the Internet Connection • Breakthrough Home Energy Technology • Simplified Grid Interconnection
As an Energy Star partner, Climate Energy has determined that the furnace included as part of the freewatt system meets Energy Star guidelines for energy efficiency.
The Furnace and HI Module assembly is design certified in the US and Canada by the Canadian Standards Association.
The Honda MCHP is an Underwriter’s Laboratory (UL) Listed, “Utility Interactive, Cogeneration, Stationary Engine-Generator Assembly, File Number FTSR.AU2004 (U.S.) and FTSR7.AU2004 (Canada).”

Quiet Operation & Comfort Honda MCHP
• Generates heat & power at a noise level of only 47 dBA
Advanced Warm Air Furnace • Low Heat mode drastically reduces temperature swings,
increases overall comfort and lowers the unit’s noise
freewatt System • Low Heat mode – MCHP operates • High Heat mode – MCHP and furnace operate
Engineered for High Efficiency 1. Honda MCHP
• Delivers a steady-state efficiency of 85%+ while producing power and heat, thereby reducing the amount of energy consumed to generate your power
• Delivers exhaust through PVC Venting 2. Advanced Warm Air Furnace
• Delivers 93% AFUE with a corrosion resistant heavy gauge aluminized-steel tubular triple-pass heat exchanger coupled with a stainless steel heat recovery coil
• Reduces electric power consumption by 20% over conventional blower motors using an electronically commutated motor (ECM) in High Heat mode and over 80% in Low Heat Mode
3. Hybrid Integration Module • Consumes under 30 watts to deliver heat from Honda
MCHP unit to air coil heat exchanger 4. Supervisory Control System
• Advanced heat and power algorithm optimizes power production of Honda MCHP unit
Advanced Technology 5. Onboard Inverter
• Integrated inverter delivers high quality power to the home’s main circuit panel
• UL 1741 Certified for Grid Interconnection 6. Exhaust Heat Exchanger
• High efficiency heat exchanger reduces exhaust products to 140° F, allowing use of PVC venting
• Three-way catalytic converter significantly reduces emissions
7. Combustion Control System • Oxygen sensor feedback allows for excellent emissions
control • Stepping gas valve offers almost unlimited control of
gas:air mixutre
Reliability Honda’s commitment to bringing products to market that improve the quality of people’s life goes well beyond cars and motorcycles. Since 1953, Honda has manufactured over 40 million power products worldwide and continues as a leader in the development of low-emission, fuel efficient, environmentally friendly 4-stroke engines for use in numerous power equipment applications. Now Honda’s unwavering reliability, quality, durability and environmentally conscious efficiency combines with Climate Energy’s freewatt System to bring micro-combined heat and power to the home.
Warm Air freewatt System
123
4
Warm Air freewatt System
Model WA-A
Honda MCHP Unit
5
6
7

™
Warm Air freewatt System
Model WA-A
Model WA-A Hybrid Integration Module Details
Model WA-A Connections
Furnace/HI Module
Electrical: 120 Volts AC, 60 Hz, 1 phase, Less than 12 amps Air Intake/Vent: 2”/3” Sch 40 PVC Natural Gas: ½” NPT Condensate Drain: ½” PVC Internet Connection: RJ45 Honda MCHP
Electrical: 240 Volts AC, 60 Hz, 1 phase, Less than 5 amps Vent: 2” Sch 40 PVC Natural Gas: ½” NPT w/ flexible connector Condensate Drain: ½” Tube
Consult Installation Manuals for more details.
Model WA-A Typical Warm Air freewatt System Footprint
Model WA-A Integrated Furnace and HI Module Dimensions
Model WA-A System Clearances
Dimensions
Furnace/ HI
Module
Honda MCHP Service
Top 1” 20” 8”
Left Side 0” 12” 24”
Right Side 0” 12” -
Base C - Note 1 B – Note 2 -
Front 0” 21” 24”
Back 0” 2” -
Intake/Vent Piping
0” 0” -
Model WA-A Honda MCHP Unit - Standard YM2A Model

93 West Street Medfield, MA 02052
1.508.359.4500 Fax 508.359.9755 Web site: www.climate-energy.com
freewatt HEATING CAPACITIES – NATURAL GAS Model WA-A060N-01 WA-A080N-01 WA-A100N-01 Honda MCHP
Input (BTU) 0-2,000’ 18,500 18,500 18,500 Output (BTU) 0-2,000’ 12,000 12,000 12,000
Furnace Input (BTU) 0-2,000’ 60,000 80,000 100,000
Output (BTU) 0-2,000’ 55,800 74,400 93,000 Furnace Efficiency (AFUE) 93% 93% 93%
AIRFLOW AND COOLING Cooling Capacity (tons) 3 4 4 Heating - Max cfm @ 0.20” WC 1,200 1,700 1,800 Cooling - Max cfm @ 0.50” WC 1,200 1,600 1,700 Motor – ECM Direct Drive ½ hp ½ hp ¾ hp
DUCTWORK CONNECTION DIMENSIONS Supply Air (F x G) 16 x 20 17.5 x 20 19.5 x 20 Return Air (D x E) 14 x 22 14 x 22 14 x 22
MAXIMUM VENTING LENGTHS (EACH ELBOW EQUALS FIVE FEET) Venting Length (ft.) – Furnace (3”)
100 ft. 100 ft. 100 ft.
Venting Length (ft.) – Honda MCHP (2”)
90 ft. 90 ft. 90 ft.
Model WA-A freewatt Air Filter Details
MERV Rating: 8 Air Flow Rating:
Medium: 1,400 cfm High: 1,750 cfm
Resistance: Medium: 0.19 W.G High: 0.29 W.G.
Face Area: 18.6 sq. ft. Media Area/Face Area: 1.0 sq. ft.
The filter is Class 2 Approved and Listed.
Model WA-A Typical Sidewall Vent/Intake Terminations
Consult Installation Manuals for more details.
Model WA-A Typical Roof Vent/Intake Terminations
Consult Installation Manuals for more details.
Model WA-A Grid Interconnection
The Honda MCHP unit must be grid interconnected in order to operate properly. Depending on the state’s regulations and the electric utility, different grid interconnection application processes are required. Climate Energy is actively educating state governments and electric utilities about the benefits of Micro-CHP and how the freewatt system can be a critical component in their energy conservation portfolio. If any questions surface during the grid interconnection process, please contact your Climate Energy product technician or Climate Energy at 508-359-4500.

45
Appendix H – Climate Energy Demonstration

Summary: Climate Energy partnered with several industry and government organizations to demonstrate the energy conservation benefits of Micro-Combined Heat & Power (Micro-CHP) through the Freewatt™ Demonstration Program. Climate Energy’s Freewatt Demonstration Program began in late 2005 with the identification and confirmation of a number of candidate residential homes. Installations subsequently occurred at 19 sites, mostly in Eastern Massachusetts, and the Freewatt Systems were operated for the 2006 to 2007 heating season. Overall, results were consistent with energy performance expectations and the Freewatt Micro-CHP System was well received by both the system installers and the homeowners. Climate Energy’s unique Freewatt micro-CHP system was shown to have important residential energy conservation and environmental benefits at levels comparable to those of some renewable energy alternatives.
System Description: The Climate Energy Warm Air Freewatt System is designed to replace an existing warm air furnace or install in the place of a conventional warm air furnace in a new home. Each Freewatt Micro-CHP system has four primary parts: a furnace module with a high-efficiency auxiliary burner and ECM blower motor, a Honda MCHP module, a hybrid integration module (HI Module), and a microprocessor based system controller.
Whenever heat is demanded by the room thermostat the Honda MCHP unit turns on and begins to generate 12,000 BTU/hr of heat and 1.0 kW of electricity. (Note - the current production model generates 1.2 kW.) The MCHP unit is a natural gas driven, liquid-cooled, internal combustion engine-generator set (see sidebar) specifically developed by Honda for the home cogeneration application. A similar MCHP product is in widespread use in Japan. The heat that is produced by the Honda MCHP is captured and delivered
2006 – 2007 HOME HEATING SEASON
PROGRAM REPORT Demonstration of Freewatt™
Micro-Combined Heat and Power System
Table of Contents
Summary 1 System Description 1 Internet Connection 3 Certifications 3 Installation 3 Grid Interconnection 4 Net Metering 4 Operations 4 Program Results 7 Conclusion 11 Current Status of Freewatt 11
Participating Groups
American Public Power Association
Braintree Electric Light Department (BELD)
KeySpan Energy Delivery
City of Quincy
HI Module Furnace
Honda MCHP
FreewattController
HI Module Furnace
Honda MCHP
FreewattController

Rev. 2 2
to a heat exchanger in the HI -Module. The heat is transferred into the return air stream from the building and then delivered into the home by the furnace module blower operating in low air flow mode. The Freewatt System runs in this mode for many thousands of hours per year, maximizing the benefits of combined heat and power as well as improving the comfort of the home by maintaining a more constant temperature.
If more heat is required than can be provided by the MCHP unit alone, the auxiliary burners in the furnace module are automatically operated. This can occur on very cold days or when the thermostat calls for a quick re-warming of the building after a period of night-time temperature setback. The sizing of the auxiliary burners is depends on the maximum heat demand of the home. The specific sizes employed are 60, 80, and 100 MBtu/hr.
The above illustration shows the heat flow in the system during the normal combined heat and power mode of operation. Heat from the Honda MCHP is transferred to the HI Module via a liquid coolant circulating loop. Return air from the home is heated by engine coolant in the heat exchanger in the HI Module and the heated air is supplied to the home by means of the furnace blower.
The furnace module is manufactured for Climate Energy by ECR International and is based on well-established condensing warm air furnace design practices. The HI Module is manufactured by Climate Energy and incorporates mechanical
Honda MCHP Specifications:
Thermal Output: 12,000 BTU/hr
Electrical Output: 1.0 kW as tested (current production units 1.2 kW)
Cogeneration Efficiency: 85%+
Engine Type: Single cylinder, 4-stroke
Generator: Multi-pole, permanent magnet
Grid Tie: Inverter based 240v AC
Exhaust Treatment: 3-way catalytic converter
Noise output: 47 dB
Weight: 179 lbs.
Dimensions: 35”H x 23”W x 15”D
Freewatt System Specifications: Thermal Output: 12,000 – 105,000 BTU/hr Overall Fuel Efficiency: > 90 % Electric Connection: 120v AC and 240 v AC. Venting : PVC pipe Fuel: Natural Gas or Propane Heating Stages: Two 1) Cogeneration 2) Cogeneration + Auxiliary Burners Controller: Rabbit BL2600 Main Blower: 1/2 – ¾ HP ECM

Rev. 2 3
components widely used in the HVAC industry. The demonstration program Honda MCHP 1.0 kW modules were manufactured by Honda to Climate Energy specification for the United States market and are largely based on an existing production model now widely used in Japan. Since the installation of these demonstration systems, Honda now supplies Climate Energy with improved, second generation MCHP units (1.2 kW), similar to the current standard in Japan. The system controller is structured around a high capability, highly reliable micro-processor controller and it communicates digitally with the Honda MCHP and the thermostat, while also controlling the main air blower, the auxiliary burners, and coolant pump and receiving inputs from various sensors.
Internet Connection: Each Freewatt system controller connects to the home’s internal computer network or directly to the internet. Periodically the system sends a report of over 150 operational parameters to a database located at Climate Energy. This allows remote monitoring of the system by the Climate Energy development team. This setup also allows Climate personnel to remotely access the Freewatt system and modify certain operational parameters as necessary. Some of the parameters that are continuously monitored at each test site include: operating mode status, electrical output, coolant temperatures, room temperature, set point temperature, outdoor temperature, engine temperature, engine RPM, operating time for the engine and auxiliary burners, thermostat program, and error/fault status.
Certifications: The furnace module and HI Module were tested by the Canadian Standards Association (CSA) to the ANSI Z21.47/CSA-2.3 Gas Fired Central Furnaces standard. The Honda MCHP was tested to the UL 2200 and UL 1741 standards for stationary generators and grid tied inverters. The Massachusetts State Plumbing Board received the independent test results and granted “Test Site” status to the proposed Freewatt Demonstration sites. Since completion of the test program the Freewatt System has achieved certification to these standards and listing in Massachusetts.
Freewatt Systems improved the indoor air quality in
demonstration homes due to continuous air flow through
a high efficiency filter

Rev. 2 4
Installation: The Climate Energy Micro-CHP System was designed with the heating and air conditioning trades in mind. The system requires no additional skills to install beyond those already represented in a typical heating system installation crew of electrician, plumber, and duct fitter. Installation of each Freewatt was completed in less than 2 days, including removal of the old heating system.
Grid Interconnection: The Freewatt System connects to the electrical grid automatically using the Honda MCHP’s on-board electronic inverter. Permission to connect to the grid for this class of system is obtained using a one-page Simplified Grid Interconnect permit application in Massachusetts. Most systems were installed by wiring a 240v AC receptacle to a location near the Honda MCHP unit and simply plugging the Honda MCHP unit power cord into it. In most areas, no outside disconnect switch was required.
Net Metering: The Freewatt System produces electrical power as it operates to meet the space heating demand. Electric power is not produced in response to specific, instantaneous on-site electrical power demands. In the net metering mode of operation, when more power is being produced by the Freewatt System than can be used in the home, excess power flows back out to the electric grid. A customer receives an instantaneous “credit” during such occurrences as his electric meter spins backwards. Later, when the customer has a greater power demand than can be supplied by the Freewatt System, the extra power needed is drawn from the power grid and that “credit” is redeemed as the meter spins forward again. At the end of the month, the net excess power produced, if any, is typically credited to the homeowner’s monthly bill. If the homeowner uses more power during the billing month than is generated by the Freewatt, he simply pays for that net amount of power drawn from the grid. The Freewatt electric generation capacity is sized such that the amount of power generation during the winter months would be about equal to the level of consumption of a typical home. Typical home power consumption is, on a 24-hour average, about 1 kW. With the Freewatt system operating nearly continuously in the cogen heating mode during the winter months, the ability to meet much of the power needs of a typical home during the heating season is demonstrated. A number of
Data Collection Example: System #0044: Operation Parameter Totals for the heating season Honda MCHP Run Time: 3,968 hours Furnace Auxiliary Burner Run Time: 450 hours Honda MCHP Gas Usage: 732 Therms Furnace Auxiliary Gas Usage: 360 Therms Combined Gas Usage: 1092 Therms Electrical Generation: 3,968 kilowatt-hours Total Combined Heat Generated: 884 Therms Fraction of Total Annual Heat Delivered by Honda MCHP: 62% Total Combined Annual Efficiency: 93% Energy Cost: $1,747 Combined heat and Electric Energy Cost Savings: $756 Reduction in CO2 Produced: 5,111 lbs. (2.5 tons)

Rev. 2 5
homeowners received net zero electric bills during the coldest months of the heating season. One site experienced no electrical use charges for six months.
Operations:
For the most part, the Freewatt Demonstration Systems operated as designed and expected. The advanced heating algorithm allowed the Honda MCHP to accumulate substantial runtime while using the auxiliary burners in the furnace only sparingly. This result alleviates a common concern about the potential of micro-CHP in residences, which is whether it can actually deliver the significant electrical generation that is needed while operating only in response to the space heating thermostat demand.
After the first two to three installations, it was quickly determined that the initial operating logic programmed into the system was preventing the system from bringing the home’s indoor temperature to the proper setpoint. Instead, the indoor temperature would stabilize at 1 degree F below the setpoint. A minor modification was required to the heating algorithm to remedy the issue.
A few months into the test program, the telemetry data from the units indicated occasional lockouts of several Honda MCHP units after a long period of off time. Testing in Climate Energy’s laboratories showed that the coolant pumps were sticking after being allowed to cool down. Discussions with the manufacturer of the pump led to an investigation at the factory that concluded that a production method had changed between our initial shipment of laboratory test pumps and the receipt of pumps for the demonstration units. All demonstration unit pumps were replaced with new pumps made after a correction was made to the manufacturing process to eliminate the sticking defect. No further occurrence of this issue was encountered. Heating capacity was not lost in any of these MCHP lockouts as the Freewatt automatically operates with the auxiliary burners in such circumstances.
It was observed that the coolant level in the HI Module reservoir was falling faster than expected during the demonstration program, presumably due to evaporation as no leakages were detected. A new gasket was procured for the coolant reservoir covers and installed in a few homes. The homes with the new gaskets experienced a much slower and acceptable rate of coolant loss compared to the other sites. The new gaskets are now installed in all sites and are part of the production system design.
Very minor problems were encountered with the Honda MCHP modules. Occasionally, a spurious error would occur due to an internal sensor reading,
Many Demonstration System homeowners
noticed that the Freewatt System was much quieter overall than their previous
equipment.

Rev. 2 6
such as improper voltage to the oxygen sensor. These errors were cleared with a reset of the unit. In one case, an inverter self diagnosed a problem and was subsequently replaced. The Honda MCHP modules that are part of the current production Freewatt systems are now a second generation production design and all such minor operational problems have been eliminated.
A number of interesting findings came out of the day to day observation of the demonstration systems. Contrary to conventional thinking it was found that the Freewatt Micro-CHP system can cost less to operate when keeping the house at a constant temperature, rather than using a setback program in a programmable thermostat. If large setback of temperature is used, it causes the Honda MCHP to turn off for some lengthy period of time as the building temperature gradually coasts down to the new low setpoint temperature. Later, when the setpoint changes back to the normal indoor temperature, the operation of the auxiliary burners is needed to provide much of the heat needed for the room temperature to recover. This essentially trades steady cogeneration runtime of the Honda MCHP unit for auxiliary burner runtime which reduces the overall number of kilowatt-hours produced – sometimes substantially. The small gas energy cost savings with large setback can be more than offset by the loss of more valuable electricity production.
Another interesting finding is that, by providing a small amount of space heating continuously with this warm air system, heat can actually be delivered with a higher electrical efficiency than with conventional warm furnaces. The Electrically Commutated Motor (ECM) in the furnace module operates at about 10% of full electrical power in the cogeneration mode to deliver up to 20% of full heat capability. This further contributes to the electrical savings of the system.
While difficult to quantify, a number of homeowners reported a more comfortable home with the Freewatt Micro-CHP system. This is directly attributable to the near-continuous heating mode of the Freewatt system as compared to the on – off cycling of participants’ old warm air systems. It is also consistent with general industry finding that modulating and multi-stage warm air heating is generally more comfortable for the building occupants.
Also, a number of homeowners remarked on how quiet the system was in comparison to their old warm air heating systems.
Freewatt Systems saved between $461 and $1,077 in energy costs per site.
These savings will increase by about 20% with
replacement of the field test systems with production
Freewatt systems having a 1.2kW electric output.

Rev. 2 7
Program Results: Over the course of the Demonstration Program, Climate Energy collected nearly 100 million data points for use in quantifying, optimizing, and demonstrating the effects of the Freewatt System. Figure 1 shows the combined total of kilowatt-hours generated by all the Freewatt Demonstration Systems on a monthly basis. This generation profile closely follows the typical seasonal heat output characteristics of a conventional heating system. What is significant about this result is that a small number of Freewatt Systems can, in aggregate, produce a large amount of electric power.
Freewatt Demonstration Systems Total Kilowatt-Hour Production by Month for all homes combined
0
1,000
2,000
3,000
4,000
5,000
6,000
7,000
8,000
9,000
10,000
September October November December January February March April May
Kilo
wat
t-Hou
rs
Figure 1
Figure 2 is an example of the relative contributions to overall required heat production by the Honda MCHP and the Furnace. Early in the heating season, the Honda MCHP is able to provide the majority of heat required by the home by steadily producing about 12,000 BTU/hr. As the heating season proceeds, the auxiliary burners begin to play a larger role in heating to the point where they may surpass that of the Honda MCHP. After the coldest part of the season, the Honda MCHP is again able to handle the bulk of the heating load. In this example, there were only two months of the year where the Honda MCHP was not able to provide the majority of the heat required for the home.
Freewatt Systems saved an average of 4,500 pounds of
CO2 production per site

Rev. 2 8
Heat Contribution of Honda MCHP and Furnace Auxiliary Burners (Site 0044)
0
20
40
60
80
100
120
September October November December January February March April May
Heat
in T
herm
s
Furnace Auxiliary Burners
Honda MCHP
Figure 2
Freewatt Demonstration Systems Minimum, Average, and Maximum Kilowatt-Hour Production
by Month for Individual Homes
0
100
200
300
400
500
600
700
800
September October November December January February March April May
Kilo
wat
t-Hou
rs
Min Avg Max
Figure 3
Freewatt Demonstration homes produced between 2,226 and 5,067 kilowatt-
hours; the average site produced 3,338 kWh

Rev. 2 9
The homes chosen for the Demonstration Program varied in size from 1200 square feet up to 3000 square feet. The homes represented a large variety of shapes, sizes, and vintages. All of these parameters affect the overall heat loss of the home and consequently the number of run hours possible for the Honda MCHP. Figure 3 illustrates the variation in electrical production across all of the Demonstration Systems on a monthly basis. The figure shows the minimum, maximum, and average monthly power generation by the Freewatt systems. As the electrical output of the demonstration systems was 1.0 kW, it is clear from the chart that in the coldest parts of the winter the Honda MCHP module can run for nearly every hour in the month (720 hours in 30 day month). Analysis of some of the lesser performing systems indicates that some additional optimization of operating parameters is possible to increase the number of run hours. Climate Energy is continuously working to improve the performance of the Freewatt System and expects performance to improve nearly across the board in its production systems due to further improvements in the operating algorithm and the higher electrical output of the current model Honda MCHP unit. Additional power generation will result from the integration of domestic hot water heating in future Freewatt models. It is estimated that this will increase total annual power production by 20%
Comparison of Average Freewatt Gas Usage to Average of Replaced Systems at
Demonstration Sites
0
50
100
150
200
250
Septem
ber
Octobe
r
Novembe
r
Decembe
r
Janu
ary
Februa
ry
March
April
May
Gas
Usa
ge in
The
rms Freewatt System
Old Heating
Figure 4
As part of the preparation to install the Freewatt Demonstration Systems, Climate Energy collected the specifications for all of the heating systems being
Freewatt Systems have produced a total of over 52,000 kilowatt-hours of
electricity

Rev. 2 10
replaced by the Freewatt System. The operational characteristics of each old system was estimated and compared to the actual operation of the Freewatt System by assuming that each would ultimately need to provide the same amount of heat to the home. As a result of this analysis, Figure 4 shows that gas usage of the Freewatt Systems is very close to that of replaced systems. Thus, as expected for this Freewatt system, the owner will not expect to observe a change in seasonal gas consumption, but will still see a substantial reduction in his electric demand from the grid. The fact that no additional gas consumption is indicated, in spite of the production of significant electric power, stems from the overall improvement in the gas use efficiency in all modes of operation compared to the old heating systems that were replaced.
Figure 5
Comparison of Carbon Footprints for Heating Season Electricity Use
A number of homeowners reported that their Freewatt
Systems increased the thermal comfort of their
homes

Rev. 2 11
Climate Energy’s analysis indicates that the average Freewatt System owner will be able to reduce his carbon footprint significantly compared with his old system. Figure 5 shows the change associated directly with just the electrical generation. Based on the results of the Freewatt demonstration program, a homeowner could expect an overall average of 4,500 lb. reduction in the amount of CO2 produced during the winter in meeting heating and power needs. These projected reductions are based on the actual fuel and generation efficiency of the Freewatt system compared to the average reported for the New England electric grid. A reduction of this magnitude is similar to driving 6,000 fewer miles per year in a typical mid-size automobile or switching to a hybrid automobile. For a typical home, this reduction in carbon dioxide emissions would alone represent the achievement of the curtailment recommendations of the Kyoto Protocol.
Conclusions: The Freewatt Demonstration Systems have delivered a substantial amount of electric power relative to the typical home’s annual usage and have done so without an observable increase in heating fuel consumption. The program has shown that a well-designed Micro-Combined Heat and Power system can operate reliably in typical homes without any inconvenience to the homeowners. Indeed the more steady heat supply of the Freewatt system has shown to be an advantage in providing good thermal comfort. The system can be installed in about the same time as a conventional high-efficiency heating appliance by the same tradesmen. The grid interconnection process is simple and mature. Climate Energy’s Freewatt Micro-Combined Heat and Power product has been shown to save homeowners substantial amounts of energy and operating costs while also significantly lowering their carbon footprint.
The Freewatt Demonstration Systems were based on an early version of the Honda MCHP which produced 1.0 kW of electricity during operation. The current production model produces 1.2 kW – increasing most of the benefits by 20%.
Current Status of Freewatt
Following the successful completion of the demonstration program, the Freewatt Warm Air Micro-CHP System, powered by Honda, was released for general sale to the public in April of 2007. Hydronic heating versions of the system should be available in early 2008. Please see the Climate Energy website at http://www.climate-energy.com for more information on the Freewatt Micro-CHP System.
Freewatt Systems saved the energy equivalent of 313
gallons of gasoline on average per site

57
Appendix I – Chiller COP vs. Capacity

58

59
Appendix J – HTS Fan Coil Selection

60

61

62

63
Appendix K – Armstrong Pump Curve
Figure K.1 – Armstrong Pump Curve for chilled water loop

64
Appendix L – System Run Times

65
Appendix M – Utility Costs From the Enbridge website, the following cost data can be obtained for homeowners who purchase their natural gas directly from Enbridge [18]:
14.7859 ¢/m³ for the first 30m3 14.1208 ¢/m³ for the next 55m3 13.5998 ¢/m³ for the next 85m3 13.2118 ¢/m³ for over 170m3
The cost of electricity purchased from Toronto Hydro Electric System is found using the following [19]: Electricity Charges 5.0 ¢/kWh for the first 1000kWh per 30 days
5.9 ¢/kWh for the rest consumed per 30 days Delivery Charges 1.02 ¢/kWh for transmission charge 1.87 ¢/kWh for delivery charges 0.08 ¢/kWh for lost revenue adjustment charges 0.09 ¢/kWh for shared savings charges Regulatory Charges 0.62 ¢/kWh for wholesale market service charges Debt Retirement Charges 0.70 ¢/kWh for retiring the debt of the former Ontario Hydro For the purpose of this study, the $12.97 per 30 days customer charge has been
excluded because it is assumed that the homeowner already pays this fee. Toronto Hydro supports net metering. Monthly production into the grid is
permitted and Toronto Hydro will carry the cost of electricity produced to the next month, up to 10 months. After that time, they will not pay the customer but will set their balance to zero. For the purpose of this study, even if there is net electricity production, the customer will still face delivery, regulatory and debt retirement charges.

66
Appendix N – Electrical Energy Requirements

67
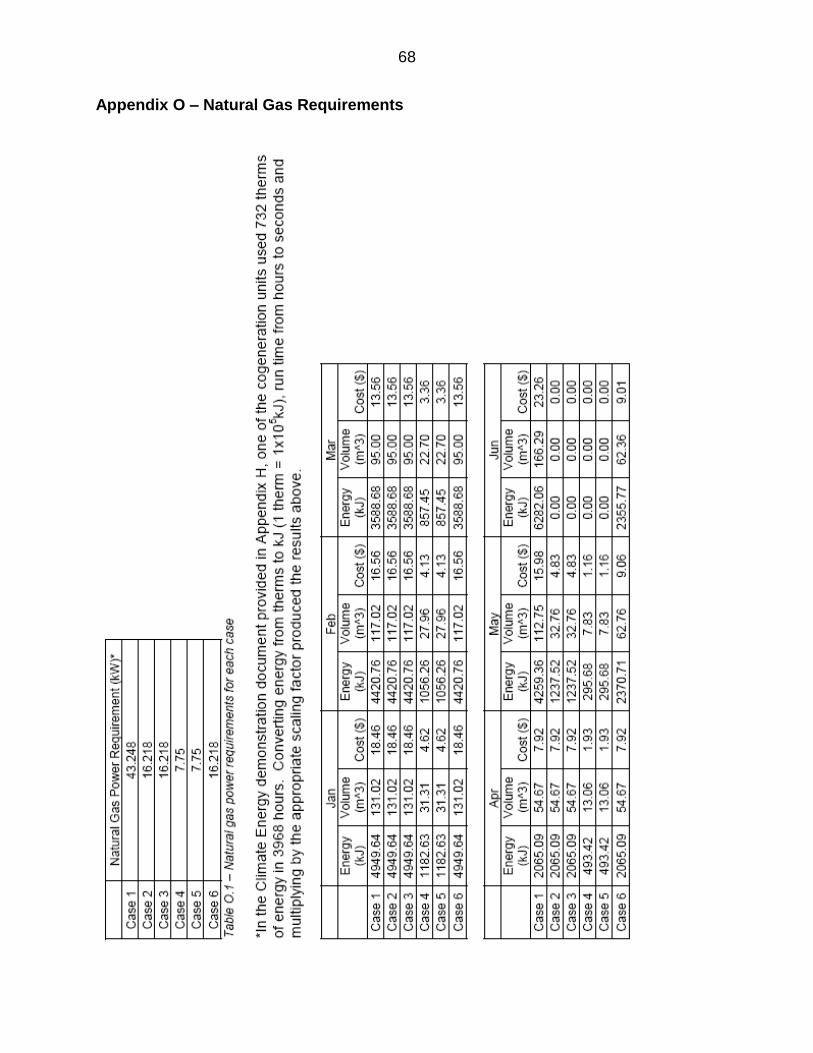
68
Appendix O – Natural Gas Requirements

69

70
Appendix P – Distributed System Costs
Distributed Costs (per year)
2 5 10 15 20 40
Case 1 $65,548.64 $26,629.64 $13,656.64 $9,332.31 $7,170.14 $3,926.89
Case 2 $28,661.11 $11,859.61 $6,259.11 $4,392.28 $3,458.86 $2,058.74
Case 3 $29,499.08 $12,157.58 $6,377.08 $4,450.25 $3,486.83 $2,041.71
Case 4 $10,829.93 $4,537.43 $2,439.93 $1,740.76 $1,391.18 $866.80
Case 5 $11,666.29 $4,833.79 $2,556.29 $1,797.13 $1,417.54 $848.17
Case 6 $28,170.55 $11,579.05 $6,048.55 $4,205.05 $3,283.30 $1,900.68
Table P.1 – Distributed System Costs over a selected number of years