the intelligence-driven prosecution model
TRANSCRIPT
The Intelligence-Driven Prosecution Model
A Case Study in the New York County District Attorney’s Office
By Jennifer A. Tallon, Dana Kralstein, Erin J. Farley, and Michael Rempel
520 Eighth Avenue, 18th Floor
New York, New York 10018
646.386.3100 fax 212.397.0985
www.courtinnovation.org

The Intelligence-Driven Prosecution Model:
A Case Study in the New York County District Attorney’s Office
By Jennifer A. Tallon, Dana Kralstein, Erin J. Farley, and Michael Rempel
© September 2016
Center for Court Innovation
520 Eighth Avenue, 18th Floor
New York, New York 10018
646.386.3100 fax 212.397.0985
www.courtinnovation.org
Acknowledgements i
Acknowledgements
The authors are deeply grateful for the cooperation and support of the District Attorney’s
Office of New York (DANY) in making this evaluation possible. Many thanks to Kerry
Chicon for her feedback on all aspects of the research design as well as her efforts in
facilitating the research on behalf of DANY. Thanks also to the 17 project staff and
stakeholders from DANY and the New York Police Department as well as several
community representatives for their participation in in-depth interviews regarding the goals,
operations, and effects of the Intelligence-Driven Prosecution Model.
At the Center for Court Innovation, we are grateful to Julius Lang and Natalie Reyes for their
assistance in coordinating the work between the evaluation and a series of coinciding
technical assistance activities that were intended to frame and highlight key elements of the
DANY model. We also thank Steve Jansen of the Association of Prosecuting Attorneys for
similar coordination. Finally, we thank Greg Berman for his comments on an earlier version
of the report.
This research was funded by a grant from the Bureau of Justice Assistance of the U.S.
Department of Justice to the District Attorney’s Office of New York, which in turn
subcontracted with the Center for Court Innovation. Any opinions and interpretations are
those of the authors or, where attributed, to staff, stakeholders, and research participants.
Moreover, where not otherwise attributed, the opinions, findings, and conclusions or
recommendations expressed in this publication are those of the authors and do not
necessarily reflect the positions or policies of the U.S. Department of Justice or the District
Attorney’s Office of New York.

Table of Contents ii
Table of Contents Acknowledgments i
Executive Summary iii
Chapter 1.
The Intelligence-Driven Prosecution Model: A New Adaptation of Community Prosecution Principles 1 Chapter 2.
Research Design and Methodology 9 Chapter 3.
Planning and Implementation of the Model 12 Chapter 4.
Communication Survey Findings 33 Chapter 5.
Impact on Prosecution Outcomes 50
Chapter 6.
Conclusions 58 References 60 Appendices
Appendix A.
Survey Instrument 62
Appendix B.
Survey Responses of the Support Staff Subsample 68
Appendix C.
Propensity Score Matching 75
Appendix D.
Outcomes for Felony Defendants Only and Misdemeanor Defendants Only 81
Executive Summary iii
Executive Summary
Designed and implemented by the New York County District Attorney’s Office (DANY), the
Intelligence-Driven Prosecution Model (IDPM) is a novel prosecutorial strategy rooted in the
rigorous collection of background information about the people, places, and problems
driving crime in specific neighborhoods. Through enhanced information gathering—
including close coordination with local law enforcement and robust community outreach—
the IDPM intends to facilitate improved prosecutorial decision-making. Though technology-
centered intelligence collection concerning the specific people and places driving crime adds
a unique dimension to data analysis, the model is better understood as a logical extension of
earlier community prosecution initiatives dating back to the late 1980s and 1990s.
With funding from the U.S. Bureau of Justice Assistance, this study aims to document how
the IDPM operates, and explore the model’s implementation and effects in New York
County, known more widely as the borough of Manhattan. Study methods included intensive
document review, interviews with key District Attorney’s Office staff and community
stakeholders, a quantitative survey of assistant district attorneys regarding their knowledge
and use of intelligence gathered in connection with the model, and an impact analysis
concerning the effects of the model on bail recommendations, charging, case disposition, and
sentencing outcomes.
Implementation of the Intelligence-Driven
Prosecution Model
The District Attorney’s Office of New York County (DANY) established the Intelligence-
Driven Prosecution Model, along with the Crime Strategies Unit (CSU), in May 2010. CSU
organized its work at the neighborhood level and divided Manhattan into five smaller
geographic areas, each containing an average of four police precincts. Major components of
the model are below.
Crime Strategies Unit (CSU) Staffing: CSU has a unit chief plus five, three-person
teams, including a coordinator from the Community Partnership Unit (CPU). Unit teams
are dedicated to one of the five designated areas of Manhattan and each team includes an
assistant district attorney, an intelligence analyst, and a community affairs coordinator.

Executive Summary iv
Every area team is responsible for developing relationships with local law enforcement
and community stakeholders, and gaining expertise in the people, places, and problems
that drive crime in each precinct.
Community Outreach: CSU staff, in conjunction with CPU, devote significant time to
attend meetings with local community groups (e.g., precinct councils, community boards,
tenant associations, etc.) to gather information about community players and their public
safety concerns. Community stakeholders who participated in research interviews said
they appreciated both the quantity and quality of work from CSU staff.
Precinct-Based Crime Assessments: Several months after CSU’s launch, area teams
completed a Briefing Book with four- to six-page summary assessments of each
Manhattan police precinct. Assessments included a precinct map, data on population
demographics and major crime problems (based on CompStat reports and other
evidence), details on homicides and/or shootings in 2009 and 2010, a narrative
description of at least two local crime problems, a list of “hot spots,” and a list of local
gangs or “crews” known to be involved in significant criminal enterprises. Area teams
continually update these assessments based on new information.
Identification of Specific Crime Drivers: At the beginning of the project, CSU area
assistant district attorneys (ADAs) collaborated with local police commanders and Field
Intelligence Officers (FIOs) to identify at least 25 priority offenders in each precinct.
ADAs then entered offender names into the Arrest Alert System (AAS) (see below), and
can continuously expand the list of priority offenders and/or record relevant intelligence.
Bureau-Based Project Teams: Based on Briefing Book information, DANY established
33 Bureau-Based Project teams (BBPs). Each team of three to six prosecutors focused on
a particular citywide crime concern to better identify the offenders who drive that type of
crime in specific neighborhoods; these BBPs then devised appropriate prosecution
strategies stemming from their research. DANY may add or disband BBPs based on
evolving priorities.
Arrest Alert System: The Arrest Alert System includes information on each priority
offender of interest. Updated numerous times since 2010, the system enables DANY to
record intelligence that is not available on a defendant’s rap sheet (e.g., criminal
associations, gang involvement, or other activities), and ensures that intelligence on
priority offenders is effectively stored for future use. A priority offender is most often
(though not exclusively) a repeat offender associated with serious and violent crimes.
Any ADA can enter an offender into the system or sign up to receive alerts on new
investigations involving offenders of interest. In addition, CSU Area ADAs automatically
receive alerts on new cases and “push out” that information to line ADAs working on bail
recommendations, charging, plea offers, or sentencing.
Executive Summary v
Additional Technology Resources: DANY established a wide range of technology-
based tools enabling ADAs throughout the office to monitor arrests, request additional
information from CSU, and/or share intelligence about priority offenders. While some of
these technology-based tools predate CSU, others were developed since its establishment.
Examples of such tools include: “DANY311”, an application allowing ADAs to submit
questions to CSU electronically, the “Glossary of Street Slang,” a system gathering
intelligence from sources such as defendant phone calls within city jail, the “Homicides
and Shootings spreadsheets,” continuously updated files containing key facts about
homicides and shootings dating back to 2008, the “Crime Prevention System,” a CSU-
maintained database highlighting relationships between persons, gangs, BBPs, and crime
incidents, and “Wiki Pages,” a database detailing intelligence on individual priority
offenders.
Survey Findings on the Communication of
Intelligence to Assistant District Attorneys
In May 2015, 285 DANY staff members, including 233 ADAs, participated in an online
survey to determine the use and effectiveness of CSU-gathered intelligence. The response
rate was 70%. Key findings are below.
Frequency: During the six months prior to the survey, 61% of responding ADAs
reported that CSU communicated with them to share intelligence related to at least one
case, and 70% reported that they initiated contact with CSU at least once to request
intelligence. Notably, 47% of respondents indicated that both events had occurred. Of
those who had communicated with CSU in the previous six months, more than 80%
reported contact on about one to five cases.
Timing: Communication with CSU most often took place in felony cases between
criminal court arraignment and presentation to the grand jury (36% of ADAs stated that
CSU staff most likely contacted them during this time). The second most common time
was pre-arraignment when prosecutors craft the original criminal complaint (28%).
Topics: The most common topics discussed were defendant/witness gang affiliations
(51%) and whether a defendant was a potential suspect in an unsolved crime (31%).
Types of Cases Involved: Communication was particularly common in connection to
violent felony cases (74%), drug felonies (31%), and non-drug, nonviolent felonies
(27%). Some ADAs reported communication on multiple types of cases in the six months
prior to the study.
Executive Summary vi
Impact of CSU Information on Decision-making: Among those ADAs reporting
communication with CSU, 11% reported that CSU information frequently or very
frequently influenced their investigations, 38% reported that the information moderately
or strongly affected their bail request decisions, and 38% reported that communication
with CSU moderately or strongly affected their plea offers or sentencing
recommendations. With regard to arrest alerts, 41% of ADAs reported that, in the six
months prior to the study, information stemming from such alerts did not lead to an
investigative step that would not otherwise have been taken, and 44% reported that the
alerts did lead to new investigative steps in one to five cases.
Impact of the Arrest Alert System on Prosecution
Outcomes
The Center for Court Innovation (CCI) conducted a quasi-experimental impact evaluation to
examine the effectiveness of the Arrest Alert System. Specifically, CCI compared a sample
of Arrest Alert cases arraigned from CSU’s start date in May 2010 through 2013 to two
groups: 1) a contemporaneous sample also arraigned from May 2010 through 2013 with
cases not involved in an arrest alert, and 2) a pre-implementation sample arraigned from
January 2009 through April 2010. Propensity score matching was used to ensure sample
comparability. Findings are below.
Seriousness of the Priority Offender Target Population: Consistent with the intended
model, defendants in Arrest Alert cases are substantially more violent than the general
defendant population. Before statistical matching, 93% of Arrest Alert defendants had a
prior arrest (compared to less than half in the two comparison samples), 25% had a prior
violent felony arrest (compared to 5% in the comparison samples), and 15% had a prior
violent felony conviction (compared to 2% in the comparison samples). Arrest Alert
defendants were more likely to be arraigned on a felony than comparison defendants
(24% v. 14%).
In the bullets that follow, reported comparisons are for statistically refined and matched
samples that no longer differ in baseline characteristics.
Impact on Bail Decisions: Arrest Alert cases were modestly but significantly more
likely to have bail set, and averaged significantly higher bail amounts than comparison
cases.
Impact on Case Disposition: Arrest Alert cases were overwhelmingly likely to be
convicted (at least 96% in all samples), reflecting the serious criminal activity of targeted
Arrest Alert System defendants. Arrest Alert cases were modestly but significantly more
Executive Summary vii
likely to be convicted of a felony than a misdemeanor or lesser offense (a difference of 3
and 4 percentage points between Arrest Alert cases and cases in the two respective
comparison samples).
Impact on Sentencing: Arrest Alert cases arraigned on a felony were more likely to
receive a prison sentence (reaching statistical significance in one of the two comparison
samples). In addition, among those sentenced to jail or prison, Arrest Alert defendants
received jail or prison sentences averaging more than 100 days longer than sentences for
defendants in either of the two comparison groups.
This evaluation demonstrates that the Intelligence-Driven Prosecution Model represents a
multi-pronged, technologically sophisticated, and replicable model for collecting and sharing
intelligence on priority offenders within designated neighborhoods. Although not all ADAs
receive or utilize intelligence obtained through the model, survey responses indicate that
DANY has integrated at least some aspects of the model into everyday decision-making.
Analysis demonstrates that, early in implementation, the Intelligence-Driven Prosecution
Model achieved modest, quantifiable changes in prosecution outcomes related to bail
decisions, charging at disposition, and length of custodial sentences.

Chapter 1. The Intelligence-Driven Prosecution Model Page 1
Chapter 1
The Intelligence-Driven Prosecution Model: A New Adaptation of Community Prosecution Principles
Intelligence-driven prosecution represents a novel prosecutorial strategy rooted in the
rigorous collection of background information about the people, places, and problems
driving crime in specific neighborhoods. Through improved information gathering on the
role of criminal suspects within local criminal enterprises, the prosecutor’s office intends to
facilitate more informed prosecutorial decision-making. These enhanced intelligence
gathering initiatives, combined with extensive community outreach designed to better
understand the people and places driving crime in local communities, create an intelligence-
driven prosecution model that marries both intelligence gathering and community outreach.
The Intelligence-Driven Prosecution Model (IDPM) is a logical extension of earlier
community prosecution efforts in the late 1980s and 1990s.
With funding from the U.S. Bureau of Justice Assistance, the current study aims to examine
the District Attorney’s Office of New York’s (DANY) implementation of the Intelligence-
Driven Prosecution Model. DANY prosecutes state and local offenses in Manhattan (also
known as New York County), one of the five boroughs of New York City.
DANY established the IDPM, along with the Crime Strategies Unit (CSU), in May 2010.
CSU divided Manhattan into five geographic areas and assigned three-person teams
(consisting of an assistant district attorney, an intelligence analyst, and a community
coordinator from the Community Partnership Unit) to coordinate a series of related initiatives
to improve information sharing, both within DANY and between DANY and external
stakeholders.
This chapter provides background on DANY’s extended community prosecution principles
and details prior research efforts from nationwide community prosecution initiatives. This
chapter also briefly introduces DANY’s IDPM. Chapter 2 presents the research methodology
and subsequent chapters report study findings.
Chapter 1. The Intelligence-Driven Prosecution Model Page 2
Community Prosecution
The origins of community prosecution can be traced to the rise of community policing in the
1980s (Stone and Turner 1999). Building on ideas such as Wilson and Kelling’s “Broken
Windows” theory (1982), community policing commonly focused on quality-of-life crimes
and minor signs of disorder, offenses thought to create an environment where serious crime
could flourish. By working closely with community groups and other agencies, community
policing initiatives sought to establish consensual crime fighting priorities, create innovative
responses to crime, and focus aggressive attention on the physical conditions of disorder
(Wilson and Kelling 1982; Wolf 2006).
Core Elements of Community Prosecution
Thompson and Wolf defined the core elements of community prosecution as “problem-
solving, community involvement, and partnerships” (2004: 4); to which the National District
Attorneys Association (NDAA) added a fourth principle- “evaluating outcomes of activities”
(2009: 4).
At the same time, Goldkamp (Goldkamp et al, 2003) identified a longer list of seven
operating principles based on analysis of actual community prosecution initiatives underway
in 36 prosecutors’ offices in the early 2000s. The seven principles were (1) target problems,
(2) identify the geographic target area, (3) define the role of the community,
(4) create appropriate responses to community problems, (5) make organizational changes
within the prosecutor’s office, (6) decide which case processing adaptations to use (e.g.,
vertical prosecution or geographic prosecution), and (7) establish interagency collaborations
and partnerships.
Work by Coles at Harvard University (Coles et al, 2000; Coles and Kelling 1998) placed the
greatest emphasis on the fifth principle: organizational changes within the prosecutor’s
office. In their view, while other principles described motivating aspirations or concrete
community outreach activities, these outcomes could only be achieved by revising the
structure of the prosecutor’s office so it could take on new tasks and use new strategies.
Coles framed community prosecution as an “organizational strategy” involving a substantial
decentralization of staff and authority in the prosecutor’s office. Related organizational
changes include increased hiring of non-lawyers with prosecution functions, enhanced
Chapter 1. The Intelligence-Driven Prosecution Model Page 3
communication with other law enforcement agencies, and increased outreach to community
stakeholders: all changes resulting in greater effectiveness. While other authors identified
community outreach and partnerships as goals in themselves, Coles placed community
prosecution squarely within the traditional bailiwick and provided a new and more efficient
strategy to prosecute cases.
Early Community Prosecution Models
Many credit the Multnomah County (Oregon) District Attorney with launching the first
community prosecution initiative in 1990, a targeted effort to reduce quality-of-life crime in
a budding commercial district (Boland 2007, Wolf and Worrall 2004). Precipitated by a
growing drug trade and related rises in drug and property crimes in three Portland
neighborhoods, and concerns that such criminal activity could hamper planned commercial
development, the Multnomah County District Attorney’s Office established a Neighborhood
District Attorney Unit. Collaborating with law enforcement, business groups, and legislators
from the three target neighborhoods in Portland, prosecutors from this new unit sought to
more aggressively and effectively enforce drug laws. Specific practices included the
enforcement of a drug-free zone to facilitate trespass arrests for anyone who, following a
drug arrest, was found in the targeted neighborhoods, and the selective deportation of
undocumented persons after any drug conviction (Boland 1998a, 2007). Over time, the
initiative also increased prosecution of other quality-of-life crimes, notably chronic public
drinking (Boland 2007).
Beginning at almost the same time as the Multnomah County initiative, then-Kings County
(Brooklyn) District Attorney, Charles Hynes, began a community prosecution strategy in
1991. Rather than assign a small number of neighborhood prosecutors to work intensively in
carefully selected neighborhoods, Hynes divided a sizable percentage of the more than 400
ADAs into five geographic zones spanning the entire county (Wolf and Worrall 2004).
Ideally these zones would then help prosecutors more efficiently prosecute cases and develop
better relationships with police officers in each area. The Brooklyn model also established an
office-wide Community Relations Bureau and utilized vertical prosecution (the same
prosecutor follows a case from intake to disposition) as standard office practice (Goldkamp
et al. 2003). The Kings County District Attorney’s Office later established an alternative to
incarceration program called Drug Treatment Alternatives- to-Prison (DTAP) for second-
time felony offenders, and assigned dedicated prosecutors to the Red Hook Community
Justice Center, a court-based project requiring low-level defendants to perform community
service or attend treatment-based social services (Lee et al. 2013). The Brooklyn District
Chapter 1. The Intelligence-Driven Prosecution Model Page 4
Attorney assigned these alternative sentencing initiatives to the community prosecution
umbrella (Wolf and Worrall 2004).
As documented in Goldkamp et al. (2003), community prosecution initiatives spread
throughout the remainder of the 1990s, particularly in major urban centers, including Denver,
Los Angeles, Philadelphia, Seattle, and Washington, D.C. However, each model typically
focused on different types of crimes, communities, and problems. For instance, whereas the
original Multnomah model combatted lower level quality-of-life crimes, the Washington,
D.C. initiative emerged in response to a sharp rise in drug-related violent crime in the early
1990s (Boland 2001). The countywide initiative in Middlesex County, Massachusetts
focused on violent crime by juvenile gangs (Goldkamp et al. 2003). The Placer County,
California initiative involved a multi-agency collaboration around elder abuse (Goldkamp et
al. 2003). The Indianapolis model included special initiatives related to prostitution and
“nuisance properties” (sites of extensive drug dealing, prostitution, or noise), but did not
limit itself to those offenses (Wolf and Worrall 2004).
A survey released in 2001 found that 49% of prosecutors nationwide reported engaging in
some form of community prosecution, but actual practices varied widely (Nugent and
Rainville 2001). A 2004 survey found that 38% of prosecutors reported practicing
community prosecution. The 2004 survey also reported that 55% of prosecutors had
implemented at least some community-based initiatives, suggesting fairly deep penetration of
basic community prosecution principles (Nugent 2004).
Early Community Prosecution Efforts in Manhattan
The Manhattan District Attorney’s Office established a Community Affairs Unit as early as
1985, five years before the Multnomah County initiative (Boland 1998a). A non-attorney
staff member in this unit conducted outreach in Washington Heights, a neighborhood in
northern Manhattan, which was confronting significant problems with illegal drug use and
crime rates at that time. The initiative relied on community residents to provide information
that would improve the quality of prosecutions against drug dealers. The Manhattan District
Attorney’s Office maintained its Community Affairs Unit, but did not incorporate greater
institutional changes until 2010.
Chapter 1. The Intelligence-Driven Prosecution Model Page 5
The Intelligence-Driven Prosecution Model
In May of 2010, the New York County (Manhattan) District Attorney, Cyrus R. Vance, Jr.,
established the Crime Strategies Unit (CSU) and charged the unit with implementing a new
Intelligence-Driven Prosecution Model (IDPM). The IDPM aimed to promote more informed
decision-making throughout the District Attorney’s Office by improving the collection and
circulation of information on the persons, places, and problems driving crime within discrete
neighborhoods.
Unlike other community prosecution models, DANY’s IDPM does not focus on one
particular type of crime. Instead, the model functions as a countywide strategy that, by
dividing the county into distinct areas, can adopt to multiple problems found at the
neighborhood level.
Importantly, DANY’s new model still fundamentally represents a place-based approach. The
model divides Manhattan into five geographic areas with boundaries falling along police
precinct lines. There are, on average, four precincts per area. Under the oversight of a newly
designated unit chief, DANY assigns three-person teams to each area, consisting of one
assistant district attorney, a CSU intelligence analyst, and a CPU area coordinator assigned to
various forms of intelligence gathering. The dedicated staff members, in theory, gain
expertise on the people, places, and problems responsible for crime within these designated
areas, and have the time and resources to forge productive relationships with local police
officers and commanders. DANY’s model introduces a new set of strategies for community
prosecution initiatives: a neighborhood-level focus, community engagement, local
information gathering, and individualized solutions to specific neighborhood-based
problems.
Rationale for a New Community Prosecution Strategy
DANY created IDPM to solve the inherent difficulties of informed decision-making in a
large prosecutorial office. Specifically, DANY employs more than 500 ADAs and handles
more than 100,000 cases each year, making it one of the largest prosecutor’s offices in the
country. Due to time constraints and limited resources, it can be challenging for DANY’s
prosecutors—or prosecutors in any large office—to gather the necessary intelligence for
effective prosecutions.

Chapter 1. The Intelligence-Driven Prosecution Model Page 6
Prior to 2010, DANY’s prosecutors generally only had access to rap sheet information when
making bail requests, plea offers, or sentencing recommendations. This information did not,
however, include data on if a defendant was the leader of a violent gang or was otherwise a
key driver of local criminal enterprises. While some prosecutors obtained valuable
information about defendants’ criminal behavior and pro-criminal associations through
investigations, without an office-wide technology to store intelligence, this information was
easily lost. For instance, if a different prosecutor opened a new criminal case involving the
same defendant, the new prosecutor may lack access to the previously collected intelligence.
Prosecutors must then either repeat the same investigatory steps or simply prosecute the case
based on information in the rap sheet- information lacking special intelligence that could
inform or modify the prosecution strategy.
The IDPM emerged as a means to gather and disseminate information within the
prosecutor’s office, enhance prosecutorial decision-making, and, ultimately promote public
safety in communities throughout Manhattan.
Although the IDPM focuses heavily on improved information flow within the prosecutor’s
office, the model also focuses on enhanced information sharing and interagency coordination
with external stakeholders, including law enforcement and representatives of local
community-based agencies. Planners believed the newly created geographic areas would
foster these external connections.
Core Elements of the DANY Model
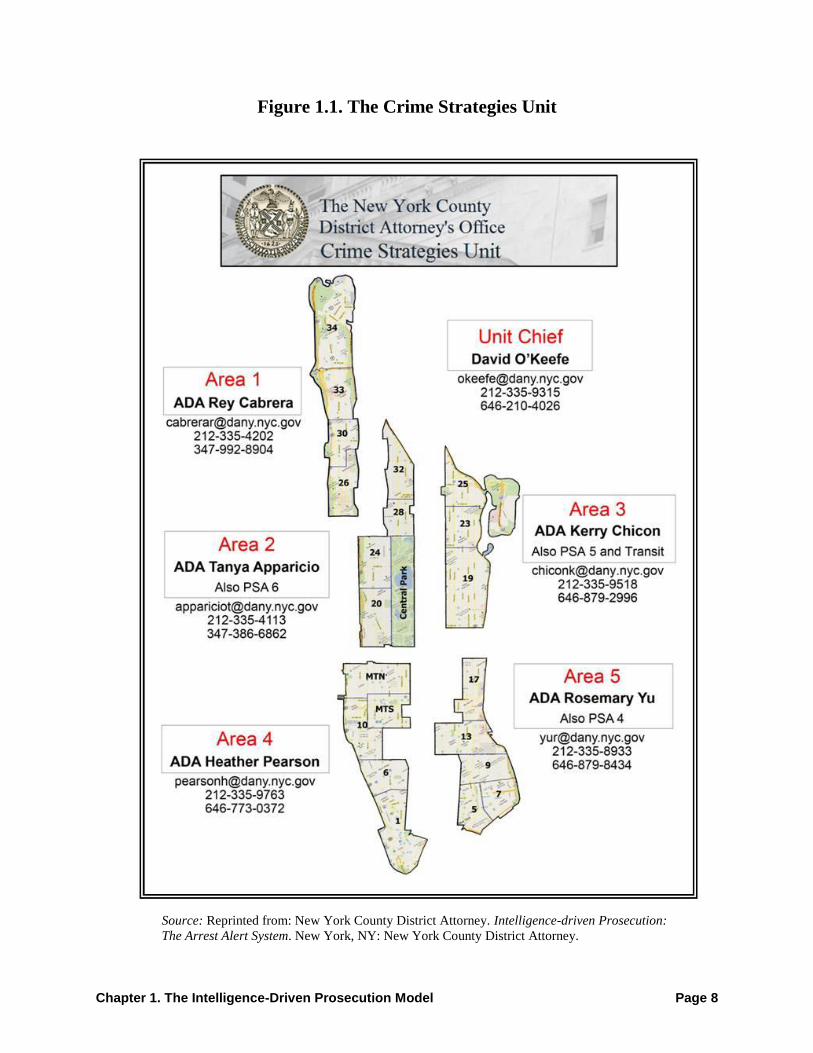
Figure 1.1 shows the structure of the Crime Strategies Unit (CSU) and its geographic
organization circa 2010, which CCI reproduced from official DANY documents. The five
areas portrayed in the figure, if fit together, create the map of Manhattan.
Each area includes an average of four police precincts. DANY assigned an area ADA, an
intelligence analyst, and a community coordinator from the Community Partnership Unit to
each area (their roles are described in Chapter 3).
DANY’s model contains all three core ingredients of “problem-solving, community
involvement, and partnerships” identified by Thompson and Wolf (2004), and utilizes
innovative strategies across all seven key dimensions identified by Goldkamp et al. (2009).
DANY’s model implements these elements, much as Coles anticipated, as an “organizational
strategy” to harness a place-based structure that fosters informed decision- making
Chapter 1. The Intelligence-Driven Prosecution Model Page 7
throughout the prosecutor’s office. IDPM’s rigorous focus on intelligence gathering,
combined with its extensive use of technology (see below), makes DANY’s model relatively
unique in the prosecutorial field today.
The Arrest Alert System
Among the many technological tools described in Chapter 3, the most central is the Arrest
Alert System (AAS), a process referred to as an automated “early warning system.” The
AAS stores information, drawn from multiple sources, on individuals identified as priority
offenders of interest. The AAS immediately notifies CSU when a priority offender is arrested
and provides additional intelligence on the defendant’s criminal associations and activities.
This system ensures that intelligence collected on priority offenders is effectively stored for
future use. While individuals on the AAS are most often repeat offenders with serious and
violent criminal history, priority offenders may also be quality-of-life recidivists. Depending
on the nature of local crime, the priority offenders list can have different characteristics
within each of the five geographic areas. In short, the AAS is a technological system that
translates data on persons, places, and problems into usable and transferable information.
The AAS is not the only technological solution falling under the IDPM umbrella, but is
arguably the most pivotal and influential. AAS was the primary subject of the SMART
prosecution federal grant award that made the current evaluation possible. For this reason,
the current report emphasizes prosecutor’s use of AAS and its impact on prosecutorial
decision-making.
Chapter 1. The Intelligence-Driven Prosecution Model Page 8
Figure 1.1. The Crime Strategies Unit
Source: Reprinted from: New York County District Attorney. Intelligence-driven Prosecution:
The Arrest Alert System. New York, NY: New York County District Attorney.
Chapter 2. Research Design and Methodology Page 9
Chapter 2
Research Design and Methodology
This report includes a process evaluation that documents key components of the IDPM, as
well as several research strategies designed to assess the practical implementation and effects
of the model on information sharing and prosecutorial decision-making. Data collection
occurred between the summer of 2014 and the spring of 2015. As a result, this report focuses
on the implementation of IDPM from 2010 through mid-2015.
Qualitative Data Collection
The Center for Court Innovation (CCI) conducted interviews to understand how staff and
stakeholders, both within and outside of the District Attorney’s Office, utilize the IDPM. All
interviews with CSU staff took place in the summer of 2014. These sessions included a joint
interview with both the current and former CSU chiefs, as well as one in-depth interview and
numerous follow-ups with the current CSU chief to clarify the nature of the model. In
addition, CCI conducted interviews with the five Area ADAs responsible for coordinating
the work within each geographic area and with four intelligence analysts, representing four
of the five geographic areas.
Other interviews, which took place over the remainder of 2014 and early 2015, involved two
assistant district attorneys who do not work within CSU, but represent a source of
information regarding how line prosecutors use the AAS, one captain from the New York
City Police Department, and two community stakeholders (community representatives who
do not work for any public agency). In addition, CSU chief provided narrative descriptions of
fourteen specific cases that utilized an arrest alert in prosecutorial decision-making. CCI
reviewed these descriptions and independently synthesized some of the original fourteen
cases to include in this report. The subset of cases provides a range of instances and
scenarios in which the model provided relevant information that influenced prosecutorial
decisions.
In addition, the Center for Court Innovation obtained and reviewed numerous documents that
describe the IDPM and its specific components, the AAS, and other related technologies
designed to enhance information sharing (see Chapter 3). Finally, as part of the same Bureau
Chapter 2. Research Design and Methodology Page 10
of Justice Assistance award funding the current evaluation report, the Center for Court
Innovation created five fact sheets that describe various elements of the model. These
products (available at www.courtinnovation.org) were reviewed, incorporated when
necessary into the current evaluation report, or cited briefly within the current report in lieu
of replicating descriptions already available elsewhere.
Communication Survey
Upon review of the qualitative data described above, the Center for Court Innovation worked
with the District Attorney’s Office to develop a thirty-four-item, closed-ended survey. The
purpose of the survey was to better understand how assistant district attorneys and other
DANY staff used the AAS and related CSU resources, particularly within the past six
months. The survey included questions to determine the nature of initial contact with CSU,
the frequency of contact, and the stages in case processing where contact most likely
occurred. CCI similarly wanted to evaluate whether information sharing effected actual
decision-making, specifically investigative choices, bail requests, and sentencing
recommendations (see Appendix A for a copy of the survey instrument).
The Center for Court Innovation administered the survey via SurveyMonkey in May 2015-
the survey took participants approximately 10 minutes to complete. David O’Keefe, Deputy
Chief of the Trial Division, contacted the six trial bureaus, Special Litigation, Violent
Criminal Enterprises, and Special Victims units via listservs at the start of the month. The
initial email instructed participants about the purpose of the project and included a link to the
survey website. Frequent reminder emails were sent out before the data collection period
closed at the end of the month.
There are currently 406 individuals working within DANY’s trial division. During the data
collection period, 285 people participated in the survey for a response rate of 70.2%.
Chapter 2. Research Design and Methodology Page 11
Analysis of the Impact of the Arrest Alert System
on Decision-making
The Center for Court Innovation obtained quantitative data from the DANY database to
compare select aspects of case processing between cases with an arrest alert and similar cases
without an arrest alert. In consultation with CSU, the impact analysis focused on cases from
two of the five geographic areas: Area 3, which encompasses the 19th, 23rd, and 25th police
precincts spanning the Upper East Side and East Harlem neighborhoods, and Area 2, which
encompasses the 20th, 24th, 28th, and 32nd police precincts covering Central Park, the Upper
West Side, and Central Harlem.
The AAS sample looked at cases arraigned from May 2010 through the end of 2013. To
maximize the validity of any findings or conclusions, CCI identified two quasi-experimental
comparison groups. The first was a “pre” comparison group consisting of cases arraigned
from January 2009 through April 2010, before DANY modified the AAS to reflect the
current structure. This “pre” comparison group draws on cases that under no circumstance
received arrest alerts since the AAS had not yet been implemented. This group also carries
the threat of historic bias because prosecutorial practices may have changed for reasons other
than the AAS. The second comparison group, a “contemporaneous” group, consisted of cases
arraigned in the same May 2010 through 2013 timeframe as the arrest alert sample, but
analyzed cases where an arrest alert was not triggered because the defendant had not yet been
identified as a person of interest in the system.
To maximize the validity of both comparison groups, CCI statistically matched potential
comparison cases to AAS cases with comparable background characteristics, utilizing
standard propensity score matching techniques (Rosenbaum and Rubin 1983; Rubin 1973).
After selecting statistically matched comparison cases, CCI deleted all other potential
comparison cases prior to final analysis to ensure all analytic findings were based on final
matched samples. Because the propensity score matching process did not eliminate all
significant differences in the baseline characteristics of AAS and comparison cases, impact
analyses controlled for select characteristics to statistically adjust for any remaining baseline
differences between the samples (see Chapter 5). Further details of the impact methodology
are provided in Appendix C.
Chapter 3. Planning and Implementation of the Model Page 12
Chapter 3
Planning and Implementation of the Model
This chapter describes key elements of the IDPM, including the roles and responsibilities of
CSU staff, technological information gathering techniques, and other resources used to
gather, organize, and “push out” intelligence to relevant parties.
Initial Planning Elements
In January 2010, Cyrus R. Vance, Jr. assumed office as the newly elected District Attorney
of New York (Manhattan). Among his first priorities was the full implementation of the
IDPM. Building off extensive planning work during the tenure of the previous District
Attorney, Robert M. Morgenthau, DANY formally established the IDPM and CSU five
months into Cyrus Vance Jr.’s term, (May 2010). Planning work and background data
collection on crime trends specific to each of CSU’s five geographic areas—and the police
precinct falling within each area—continued after the IDPM’s implementation to ensure
CSU staff remained updated on relevant sources of criminal activity. All area-based CSU
teams included an intelligence analyst who could conduct ongoing crime analysis work.
Division of Manhattan into Five Areas
To implement the IDPM, DANY had to first establish CSU’s geographic boundaries. The
District Attorney and his executive staff divided Manhattan into five areas, as shown in
Figure 1.1. DANY drew these areas along precinct lines and patrol boundaries (Patrol
Borough of Manhattan South and Patrol Borough of Manhattan North) to ensure close
coordination with the New York Police Department (NYPD). DANY also defined
geographic boundaries based on types and volumes of crime; this approach grouped precincts
with similar crime concerns in the same area and created a balanced workload for respective
Area ADAs. For example, Area 3, which spans the upper east side of Manhattan (19th
precinct) and East Harlem (23rd and 25th precincts), includes only three police precincts,
instead of four, because of overall crime volume and severity; this area likewise keeps the
East Harlem community intact instead of mixing it with other northern Manhattan precincts.
Chapter 3. Planning and Implementation of the Model Page 13
Overall, the five areas average four precincts each, although only Area 1 includes exactly
four precincts (Area 3 includes three precincts, Areas 4 and 5 include five precincts, and
Area 2 includes four numbered precincts plus Central Park). Based on expected workload,
certain areas were also expected to coordinate with non-precinct-based police bureaus,
including the Metropolitan Transport Authority, the Port Authority of New York and New
Jersey, and Police Service Areas (e.g., the NYPD Housing Bureau).
Appointing Senior ADAs to Crime Strategies Unit Areas
DANY appointed ADA David O’Keefe to serve as CSU’s chief in May 2010, while the unit
as a whole reported to Chauncey Parker, an Executive Assistant District Attorney and
Special Policy Advisor who oversees crime prevention strategies. Reporting to the unit chief,
DANY appointed five senior ADAs to lead the work in each of the five respective
geographic areas.
Crime Assessments by Precinct
Area ADAs became experts on the crime issues within their districts by researching crime
trends in their respective areas and reaching out to the precinct commanders and field
intelligence officers (FIOs) to discuss the top crime concerns of the NYPD for each precinct.
CSU Area ADAs also requested each precinct commander identify 25 priority offenders.
These priority offenders included individuals identified as crime drivers in each of the
precincts, primarily drivers of violent crime and, to a lesser extent, quality-of-life issues. By
prosecuting and incarcerating these individuals, DANY believed it could improve
community safety and quality of life. Area ADAs also reached out to community
stakeholders during the course of their intelligence gathering to better understand the
communities within each area. DANY conducted a crime assessment of all 22 police
precincts in Manhattan (Central Park was included as a precinct for the purpose of this tally)
and incorporated these assessments into a “Briefing Book.” The Briefing Book included a
four-to-six-page evaluation of each Manhattan precinct, densely packed with:
A map of the given precinct with boundaries clearly demarcated and separately noted,
A narrative overview of the demographics and major crime problems in the precinct,
Contact information for the Commanding Officer and other senior New York Police
Department (NYPD) staff assigned to the precinct,
Crime data on the seven index crimes in 2009 and up to June 27, 2010 (a month after
CSU was established),
Chapter 3. Planning and Implementation of the Model Page 14
Crime data specifically on homicides and shootings in 2009 and 2010 year-to-date,
along with specifics on one or two recent homicides or shootings in some precincts,
A narrative description of, on average, two types of crimes that briefly explained the
nature of each problem, what neighborhood factors drive it, and in what kinds of
locales or specific locations the problem had manifested,
Community concerns, as reported by residents and/or community representatives,
Specific “hot spots,” if known, (e.g., housing complexes, intersections, or other types
of places where problem crimes were known to occur), and
Information, if known, about local gangs or “crews” that were implicated in
significant criminal activity within the precinct.
Through the Briefing Book, CSU informed the District Attorney and his executive on the
program’s initial progress. Furthermore, the Briefing Book helped facilitate relationship
building within each area and provided insight for future prosecution initiatives.
Crime Strategies Unit Staff: Roles and
Responsibilities
Crime Strategies Unit Area ADAs
As described above, CSU Area ADAs became experts on the nature of crime within their
respective areas and the five geographic divisions helped ensure that law enforcement in
each area had a single point of contact within the DA’s Office. Because the areas focused on
different types of crime and geographically-based issues, law enforcement and CSU must
collaborate to effectively identify offenders and facilitate the exchange of information. For
example, Area 4 is home to several major transportation hubs (Penn Station, the Port
Authority Bus Terminal, and Grand Central Station). The CSU Area ADA must coordinate
with each agency responsible for policing these hubs to successfully prosecute non-violent
offenses such as burglaries, pickpockets, and quality-of- life offenses. Area 2 & 3 see more
incidents of violent crime than the other areas, which requires close collaboration with the
NYPD. As described by a CSU ADA, while it took time for the NYPD to understand the
new data-driven approach, both agencies worked through the “culture shift” with open
communication and collaboration. Ultimately, the number of successfully prosecuted cases
strengthened the partnership.
Chapter 3. Planning and Implementation of the Model Page 15
Finally, DANY assigned each of the five geographic areas a community coordinator from the
Community Partnership Unit of the District Attorney’s Office.1 Community coordinators
played a key role in educating CSU Area ADAs on critical information gathering work, such
as which community stakeholders to contact and what community meetings to attend.
In the early months of CSU, Area ADAs spent substantial portions of their days, and even
some weekends, at various community meetings (e.g., precinct council meetings, community
board meetings, tenant association meetings, and other meetings involving community-based
organizations, local public safety, or quality-of-life issues). Once CSU Area ADAs became
familiar with the community and its stakeholders, they decreased the number of meetings
personally attended; however, the monthly Precinct Council Meeting was, and continues to
be, a priority for all CPU Area Coordinators.
Similar to the collaboration between law enforcement and CSU ADAs, CSU and local
community partnerships collaborate to enhance public safety. As described by one CSU
ADA, the community has been receptive to working with CSU.
I find that for the most part they are excited and happy to hear that law enforcement
wants to listen to them and get to know what their concerns are. They have called 311,
they have called 911, they have met with the police precinct commanding officer, and so
they are happy to explain what they need in the community.
The relationship with law enforcement is characterized by collaborative intelligence sharing.
As one community stakeholder stated, “it was definitely not a one-way street. It was
everybody working together.” Several community leaders noted how their communities
experienced significant improvements since working with CSU. With regard to whether there
were noticeable changes in crime, one community leader stated, “I don’t want to say it’s
night and day, but it’s pretty close.” Community stakeholders have cautioned that
collaboration must continue to ensure success. As one stakeholder said, “I feel like we have
to continue. If not, in 2017 it might get to the same level where we will have to do this whole
thing all over again with a lot of pressure.” Other community members identified areas
where intelligence sharing could be strengthened. One community leader noted that,
although they share intelligence with CSU, it is sometimes unclear what ultimately happens
to specific individuals and whether they remain in the community.
1 This unit was formerly known as the Community Affairs Unit, and its existence dates back to
the 1980s.

Chapter 3. Planning and Implementation of the Model Page 16
Sometimes we provide information on a crime and I don’t know if it’s because of the law,
but we don’t get an update. I don’t know if the individual is still loose out there. So we
are giving out all this information for the better quality of life and we are sort of in the
dark.
Additionally, the community has expressed the need for youth engagement and intervention
to curb future gang violence. “Two to three years from now, we are going to get more gang
members. We really have to work with that community,” said one community leader.
Community programs sponsored through the District Attorney’s Office, such as Saturday
Night Lights, represent opportunities for CSU to engage stakeholders while also providing
youth in hotspot neighborhoods opportunities to avoid violence. Although the District
Attorney’s Office has been active in community outreach, a CSU ADA thought DANY
should also address the sources creating these gangs; the mass arrests of gang members can
be “painful for the community and you are also leaving a vortex. You don’t want someone
else to be like, ‘now I can start up a gang because there’s no one to oppose me.’” To address
this issue, one CSU ADA collaborated with administrators at a school in the middle of a
hotspot to enroll the district in DANY’s Adopt-a-School program. Through this initiative,
DANY implemented youth- specific programming (e.g., gang awareness, cyberbullying) in
conjunction with outreach activities aimed at parental engagement.
Bureau-Based Project Teams
In July 2010, CSU Area ADAs presented the Briefing Book to District Attorney Cyrus R.
Vance, Jr. Following this CSU-based research, DA Vance created thirty-three Bureau-Based
Project Teams to investigate and prosecute specific crime areas (i.e. crime types, gangs,
hotpots, or “projects”) across the city.
Bureau-Based Project teams (BBPs) consist of approximately three to six dedicated
prosecutors from the trial division. These ADAs become experts on a select crime concern or
hot spot, identify offenders believed to be the crime drivers in a particular geographic
location (the location does not have to encompass an entire “area”), and devise a plan to
target, prosecute, and eventually incapacitate these individuals through incarceration or
supervision (i.e., parole or probation). DANY primarily formed BBPs to address violent
crime, but developed additional teams to address other issues, including scammers,
prostitution, and larceny-related crimes. BBPs also require prosecutors to work closely with
NYPD specialized units (i.e. gangs, narcotics, and/ or grand larceny units). BBPs are not
Chapter 3. Planning and Implementation of the Model Page 17
permanent fixtures. DANY may dismantle a team once successful prosecutions substantially
decrease the targeted criminal behavior-if the crime issue re-emerges at a later date, DANY
creates a new BBP team. In the fall of 2014, DANY had 13 operational BBPs.
The nature of BBPs varies in different regions. One CSU ADA noted that DANY disbanded
a BBP focused on grand larceny investigations to instead monitor recidivists using the AAS.
In areas characterized by greater gang activity, BBPs must evolve to reflect current
intelligence on gangs and crews. Another CSU ADA described a situation in which two
gangs had been feuding for years within the confines of three police precincts. When a third
gang formed within the same area, a significant number of individuals “double jacked,” or
affiliated with more than one gang. As a result, this area felt a “bit more malleable, which
muddies the water a lot and makes it more complicated to try to figure out where the gang
violence is isolated.” The BBPs associated with each individual gang then merged to
centralize intelligence. This merger created a team of veteran ADAs already familiar with the
gang activity in the region. BBPs must both evolve as a function of intelligence, and ensure
the continuity of intelligence through the careful selection of team members with background
knowledge in specific areas.
Intelligence Analysts
When DANY established CSU, it assigned four intelligence analysts to the unit. Early on,
intelligence analysts worked together as a resource for all CSU ADAs. However, over time,
DANY assigned specific intelligence analysts to particular areas. In the five designated areas
of Manhattan, DANY assigned three intelligence analysts to a specific region, with a fourth
intelligence analyst split between the remaining two areas. DANY has since added an
Analyst Supervisor, who also manages the DANY311 system, and a Strategic Intelligence
Analyst, who is responsible for technology within CSU and serves as the technology trainer
and liaison to the Tech Analysts embedded in the trial bureaus. Qualifications for intelligence
analysts primarily include: an undergraduate degree, an interest in law enforcement, and a
potential or demonstrated facility with crime data. Responsibilities include: analyzing crime
data, constructing crime reports, and providing intelligence in the form of statistics and
mapping to the area ADAs, Community Coordinators, Bureau-Based Teams, and select other
ADAs throughout the DANY office.
One analyst described the job as a combination of intelligence gathering and investigative
analysis. Analysts can provide feedback to CSU on how to improve information sharing and
analysis. Analysts have worked closely with CSU Area ADAs to develop innovations, such
Chapter 3. Planning and Implementation of the Model Page 18
as DANY InPho, a program organizing intelligence gathered from recorded jail telephone
calls. Analysts likewise improved the SharePoint website to include camera mapping. As
one analyst noted, “all of the data collection that we are doing only becomes valuable if we
can understand how they intersect.”
Internship Program
Part of the New York City Department of Correction’s policy is to record all phone calls
made by defendants. These calls are a vital resource for local District Attorney’s Offices,
who use the intelligence to successfully prosecute criminal defendants. However, a single
offender can amass a large volume of phone calls, which can overwork ADAs. As a result,
CSU created an internship program through a pre-established relationship with the National
Guard, where area ROTC students listen to phone calls and document potentially useful
information as it relates to a projects, priority offenders, or requests from an ADA2. In the
early phase of CSU, these interns had top secret security clearances, were monitored by a
National Guard member, and worked off site.
In the fall of 2011, CSU restructured the internship program to resemble a college course.
The program expanded to include students attending local universities and colleges (i.e.,
Fordham University, NYU, and John Jay College of Criminal Justice). One ADA described
the internship experience at CSU as “almost like a college course. We are going to have a
curriculum. You come in, you’re going to get training, you’re going to get a briefing on the
cases that you’re going to be working on, and then we are going to assign you to help us out
with these phone calls.” In addition to processing phone calls, interns may also work on
Facebook reviews, translate documents, sit in on interviews, and organize photographic
intelligence. As of the fall of 2014, approximately 15 interns per semester worked onsite in
the DANY offices two to three days a week. Interns receive college credit for successfully
completing a certain number of hours of work within a semester. A National Guard member
still oversees the interns and continues to manage the workload.
2 ADAs with a large volume of phone calls to review in respect to a case or investigation can
request assistance from CSU to have interns review phone calls
Chapter 3. Planning and Implementation of the Model Page 19
Enhancing Information Sharing: The Arrest Alert
System
The Arrest Alert System (AAS) of the District Attorney’s Office of New York has existed in
some form for approximately 30 years. Essentially, the AAS is a means of notifying assistant
district attorneys throughout the office when a person of interest or “priority offender”—
typically an individual who is known to play a central role in creating or overseeing local
criminal activities or enterprises—has a new arrest. Through this notification system, which
also provides relevant information about the priority offender to whoever is prosecuting the
new case, ADAs can make more informed prosecutorial decisions about charging, bail
requests, appropriate case disposition, and sentencing.
A Brief History of the Purpose and Operation of the Arrest Alert System
When first created 30 years ago, the AAS was a simple database managed by the DANY
technical support staff. During the early years of the AAS, the system only partially
automated information. If a computer/management information system staff member wanted
to notify an interested ADA about a priority offender’s arrest, they had to deliver a paper
notification to the ADA’s mailbox. Such notifications were rarely delivered or received prior
to arraignment, and this delay prevented ADAs from using the system’s information to
inform their bail applications or initial charging decisions. In cases that proceeded promptly
to disposition (particularly misdemeanors that are often disposed at arraignments), this paper
notification system essentially meant that notifications would rarely, if ever, impact
disposition and sentencing recommendations.
When DANY created CSU in 2010 it simultaneously overhauled the AAS. With CSU chief
and two Area ADAs collaborating with the DA’s Information Technology Office, the system
was fully automated. Staff members reconsidered and selected the types of information
included in an arrest alert, how the information is organized, and how intelligence is visually
displayed to users. Staff members may create an arrest alert using the defendant’s unique
New York State ID (NYSID) number, which is assigned at a defendant’s first finger-
printable arrest. ADAs may request arrest alerts about persons already in the system or can
create arrest alerts about new persons of interest. Area ADAs from CSU staff play a
particularly important role in creating new arrest alerts because of their in-depth knowledge
of crime drivers in each precinct. CSU provided necessary staffing to ensure the system
Chapter 3. Planning and Implementation of the Model Page 20
remain updated, that new persons of interest are added promptly, and that non- CSU ADAs
consistently receive alerts on persons of interest.
In the fall of 2013, another AAS update expanded the capabilities of the system and allowed
staff to create alerts based on a defendant’s name (first, last), geographic location (or
hotspot), offense type, or date of birth. The new structure of the system also allowed
individuals to organize arrest alert data into subfolders. For example, instead of creating an
alert based on a single defendant, a CSU Area ADA could create an alert based on New York
City Housing Authority developments, gang involvement, and crime type.
While any ADA in the office can create an alert, CSU staff are the main users and
consumers. CSU ADAs typically receive approximately 10 to 20 arrest alerts a day. Analysts
working within CSU may be in charge of creating and modifying alerts, and the number of
arrest alerts handled by an analyst will vary across CSU areas. For example, while one
analyst described working with alerts about “twenty times a day,” an analyst in a different
CSU area noted that he processed alerts in bulk. This analyst did not work with arrest alerts
on a daily basis, but rather made around 30 to 50 information adjustments when necessary.
Only CSU staff can create arrest alerts based on geographic location and date of birth.
However, as emphasized above, the revamped AAS function to use CSU staff’s expertise
and capacity to disseminate relevant arrest alerts to DANY ADAs who need this information
to better prosecute individuals and cases.
The Mechanics of Utilizing Arrest Alerts to Prosecute Cases
Communication of Arrest Alerts from CSU to Prosecuting Assistant District
Attorneys: Although much depends upon the situation, (e.g. priority level of the offender,
nature of the alert) Figure 3.1 provides a graphic representation of potential actions and
outcomes that may occur when a priority offender is newly arrested. A CSU area ADA
receives an arrest alert and CSU area ADA communicates relevant information about the
offender to the ADA prosecuting the case.
Within two to three hours after a priority offender is arrested and fingerprinted, CSU staff
receive an automatic email notification through the AAS. This email notification includes:
the defendant’s name, date of birth, NYSID number, resident precinct, arrest date, time, and
location, the name of the arresting officer, the arresting officer’s precinct, the top charge, the
date, time and place of the incident, and a brief narrative.
Chapter 3. Planning and Implementation of the Model Page 21
CSU Area ADAs then take a variety of actions, depending on the information they received.
For example, CSU Area ADA can reach out to the ADA writing up the case in the Early
Case Assessment Bureau (ECAB) to inform the prosecutor of pertinent information related to
the defendant’s criminal activity unavailable on the rap sheet (such as whether the defendant
is a member of a violent gang). Such communication to the ADA in ECAB may alter the bail
amount requested, influence the ADA’s decision to recommend setting bail in the first place
in lieu of recommending the defendant be released on his own recognizance, may enhance
charges against a defendant, or change the disposition and/or sentencing recommendations.
CSU Area ADA may also offer the attorney in ECAB a prepared bail application with all of
the relevant intelligence entered. In addition, if a defendant is re-arrested while out on bail
(or while released without bail), the ADA can utilize the information provided in the arrest
alert to petition the judge to revoke bail and ensure speedy trial time is not sacrificed.
In the majority of cases, CSU Area ADAs work to “push out” intelligence during the pre-
arraignment phase so that ADAs obtain relevant information in time to influence a release or
bail recommendation. However, a CSU Area ADA may also wait until the post-arraignment
phase to contact the prosecuting attorney. For example, in situations where the defendant
commits a serious crime (i.e., robbery at gunpoint), CSU ADA can ensure the prosecuting
attorney pursue the case aggressively by filing a greater charge and requesting a higher bail
or a denial of bail. CSU Area ADA does not necessarily need to intervene in the pre-
arraignment phase. Instead, in such cases, CSU Area ADA will reach out to the prosecuting
attorney during the post-arraignment phase to provide useful intelligence during the
investigation. ADAs and investigators can use that intelligence at any time from post-
arraignment to the final disposition of the case. As one CSU ADA described it:
Our focus is to know everything we can know and then to push that out to the ADAs. So
every single day, I will call up an ADA and say, ‘the case you have, let me tell you a few
things.’ I will send information in an email to say ‘we found his Facebook address and
he’s bragging about this,’ or ‘he’s claiming he’s going to do this,’ or ‘I just found out
that he was the victim of a gun crime in the Bronx a year ago. Did you know that?” So, I
mean that is a constant here, getting the information where it needs to go, and where it
needs to go is to another prosecutor.
Communication of Arrest Alerts Triggered by the Prosecuting Assistant
District Attorneys: While CSU Area ADAs have greater access to the AAS and are its
primary users, members of Bureau-Based Project teams and individual ADAs can also create
Chapter 3. Planning and Implementation of the Model Page 22
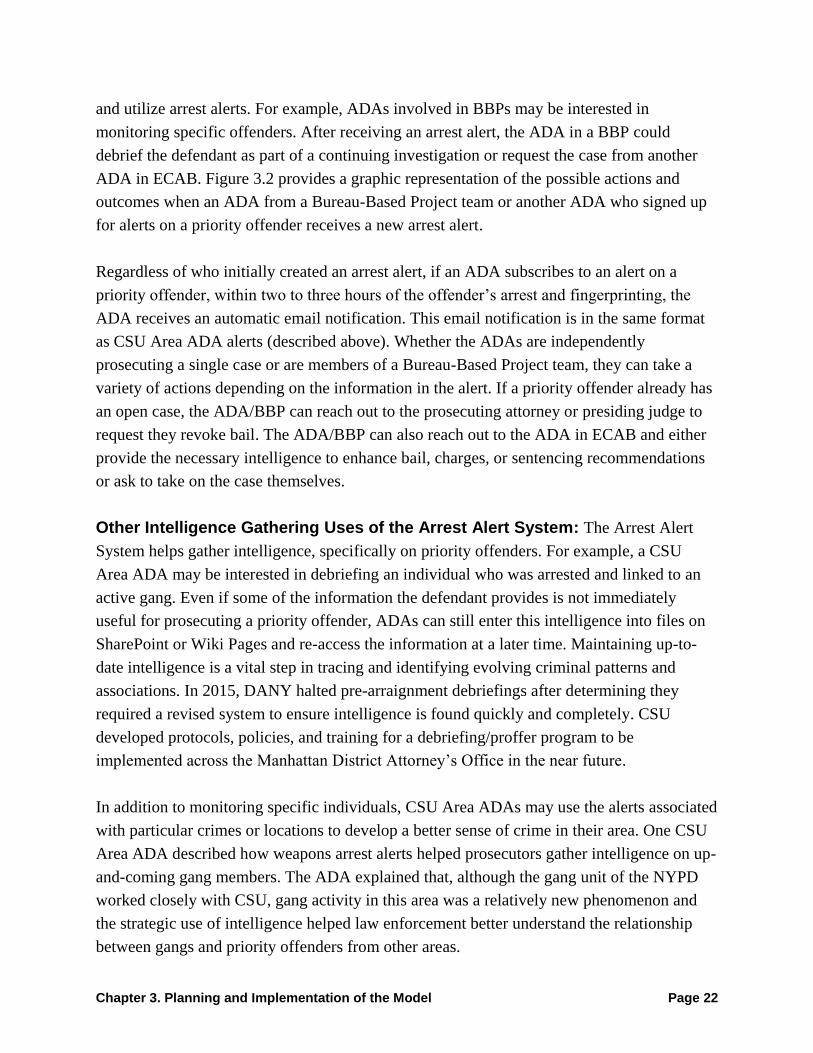
and utilize arrest alerts. For example, ADAs involved in BBPs may be interested in
monitoring specific offenders. After receiving an arrest alert, the ADA in a BBP could
debrief the defendant as part of a continuing investigation or request the case from another
ADA in ECAB. Figure 3.2 provides a graphic representation of the possible actions and
outcomes when an ADA from a Bureau-Based Project team or another ADA who signed up
for alerts on a priority offender receives a new arrest alert.
Regardless of who initially created an arrest alert, if an ADA subscribes to an alert on a
priority offender, within two to three hours of the offender’s arrest and fingerprinting, the
ADA receives an automatic email notification. This email notification is in the same format
as CSU Area ADA alerts (described above). Whether the ADAs are independently
prosecuting a single case or are members of a Bureau-Based Project team, they can take a
variety of actions depending on the information in the alert. If a priority offender already has
an open case, the ADA/BBP can reach out to the prosecuting attorney or presiding judge to
request they revoke bail. The ADA/BBP can also reach out to the ADA in ECAB and either
provide the necessary intelligence to enhance bail, charges, or sentencing recommendations
or ask to take on the case themselves.
Other Intelligence Gathering Uses of the Arrest Alert System: The Arrest Alert
System helps gather intelligence, specifically on priority offenders. For example, a CSU
Area ADA may be interested in debriefing an individual who was arrested and linked to an
active gang. Even if some of the information the defendant provides is not immediately
useful for prosecuting a priority offender, ADAs can still enter this intelligence into files on
SharePoint or Wiki Pages and re-access the information at a later time. Maintaining up-to-
date intelligence is a vital step in tracing and identifying evolving criminal patterns and
associations. In 2015, DANY halted pre-arraignment debriefings after determining they
required a revised system to ensure intelligence is found quickly and completely. CSU
developed protocols, policies, and training for a debriefing/proffer program to be
implemented across the Manhattan District Attorney’s Office in the near future.
In addition to monitoring specific individuals, CSU Area ADAs may use the alerts associated
with particular crimes or locations to develop a better sense of crime in their area. One CSU
Area ADA described how weapons arrest alerts helped prosecutors gather intelligence on up-
and-coming gang members. The ADA explained that, although the gang unit of the NYPD
worked closely with CSU, gang activity in this area was a relatively new phenomenon and
the strategic use of intelligence helped law enforcement better understand the relationship
between gangs and priority offenders from other areas.
Chapter 3. Planning and Implementation of the Model Page 23
The arrest alerts are one of the key things that helped indicate to me that there was some
violence going on that I otherwise would not have been alerted to and then made me dig
deeper to figure out what was going on. And sometimes, too, it’s uptown guys who one of
my colleagues has arrest alerts on [who] come down to the Lower East Side and commit
violence and the alerts let [my colleagues] know that they need to loop me in.
ADAs and BBPs may create arrest alerts for both witnesses and victims; the system does not
exclusively focus on defendants/perpetrators. Such alerts may be useful if victims and
witnesses “go missing.” An arrest alert can let ADAs know they need to either speak with the
victim or witness or confirm the witness’s current living situation.
Limitations in Identifying Gang-Involved Individuals
CSU can create a more comprehensive assessment of gang-related crime in each area with
the strategic use of arrest alerts combined with intelligence gathered via social media.
Although CSU works closely with the NYPD gang unit, there were challenges in identifying
new gangs in each region through arrest alerts alone.
Summary: The Impact of the Arrest Alert System
The enhanced communication and intelligence flow between CSU and prosecuting ADAs
means that bail requests, charging decisions, and disposition and sentencing
recommendations more accurately reflect a priority offender’s true criminal involvement. In
other words, ADAs obtain stronger evidence to support their sentencing recommendations
through comprehensive intelligence gathering and organization. The intermediate goal of this
intelligence-driven prosecution model is to incapacitate high priority offenders with higher
bail or more severe incarceration sentences, which results in increased prosecutorial
effectiveness and enhanced public safety.
Additional Tools for Gathering, Organizing, and
Disseminating Intelligence
CSU staff originally stored their intelligence in Excel files, but the volume of accumulated
intelligence over time prompted the unit to adopt alternative data gathering and organizing
methods. This section briefly describes the technological resources (other than arrest alerts)
that organize and “push out” CSU-gathered intelligence.
Chapter 3. Planning and Implementation of the Model Page 24
SharePoint Resources
DANY utilizes Microsoft’s SharePoint system as an internal web application to access
numerous resources. After an upgrade to SharePoint 2013 in May 2015, the DA’s Office
rebranded SharePoint as DANYNET. Because data collection concluded prior to the
upgrade, our focus is limited to the resources available during the study period.
DANY311 is an electronic form established in the fall of 2013, where ADAs can
submit a wide range of questions to CSU, primarily related to priority or violent
offenders. For example, prosecutors may contact CSU staff to identify the
whereabouts of a person of interest, review gang activity, access geographic
information, etc. The program tracks questions and responses so CSU can examine
the types of inquiries submitted to CSU Area ADAs and the response time required to
answer these inquiries. If a question arises during a conversation between an ADA
and a CSU Area ADA, whether in person, over the phone, or through email, a CSU
Area ADA can enter this question into DANY311. This process allows CSU Area
ADA to create a record of all requests or questions and route each inquiry to the
appropriate staff member. For example, if a question arises during a conversation
between an ADA and the Area 5 ADA that is best answered by the Area 3 ADA, the
Area 5 ADA will enter the question into DANY311 and send it to the Area 3 ADA.
Bureau-Based Projects (BBP) Hot Spot Reports are documents describing all
current and past BBPs and lists each BBP-assigned prosecutor’s trial bureau. The
document also includes relevant CSU contact information to ensure that anyone
viewing the document—whether CSU staff or an ADA assigned to a current or past
BBP—can immediately know who to contact. Since BBPs integrate non-CSU
prosecutors into investigative projects, distributing this information also serves as a
recruitment tool for individuals interested in volunteering for specific teams.
Glossary of Street Slang is a document providing definitions for commonly used
street slang recorded in jail phone calls or on social media forums. During
investigations, prosecutors may request tapes of jail phone conversations, which may
number in the hundreds. While prosecutors can derive valuable intelligence from
these phone calls, defendants often use terms to refer to criminal activity that are not
part of common vernacular. For example, the street slang for a gun is a hammer. If
prosecutors listen to jail phone conversations and hear an unfamiliar term, they can
refer to the glossary to help clarify what the defendant is discussing.
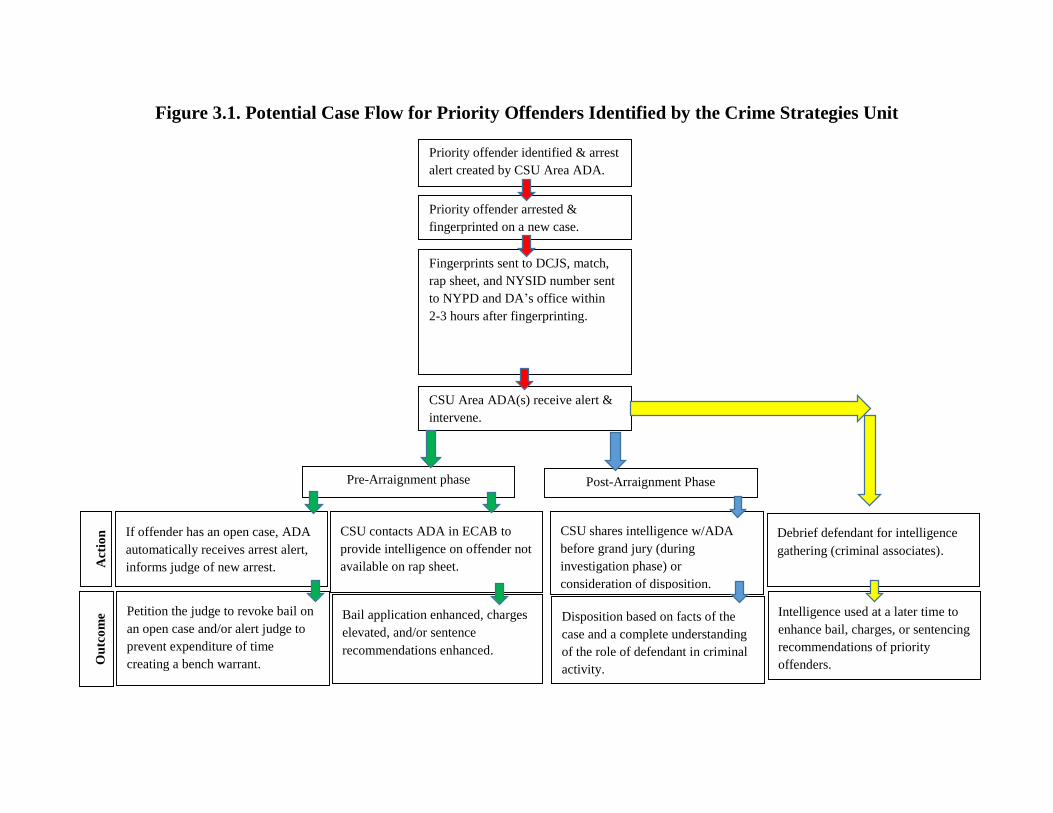
Figure 3.1. Potential Case Flow for Priority Offenders Identified by the Crime Strategies Unit
Priority offender identified & arrest
alert created by CSU Area ADA.
Priority offender arrested &
fingerprinted on a new case.
Fingerprints sent to DCJS, match,
rap sheet, and NYSID number sent
to NYPD and DA’s office within
2-3 hours after fingerprinting.
CSU Area ADA(s) receive alert &
intervene.
Pre-Arraignment phase Post-Arraignment Phase
Petition the judge to revoke bail on
an open case and/or alert judge to
prevent expenditure of time
creating a bench warrant.
If offender has an open case, ADA
automatically receives arrest alert,
informs judge of new arrest.
Bail application enhanced, charges
elevated, and/or sentence
recommendations enhanced.
CSU contacts ADA in ECAB to
provide intelligence on offender not
available on rap sheet.
CSU shares intelligence w/ADA
before grand jury (during
investigation phase) or
consideration of disposition.
Debrief defendant for intelligence
gathering (criminal associates).
Disposition based on facts of the
case and a complete understanding
of the role of defendant in criminal
activity.
Intelligence used at a later time to
enhance bail, charges, or sentencing
recommendations of priority
offenders.
Act
ion
O
utc
om
e
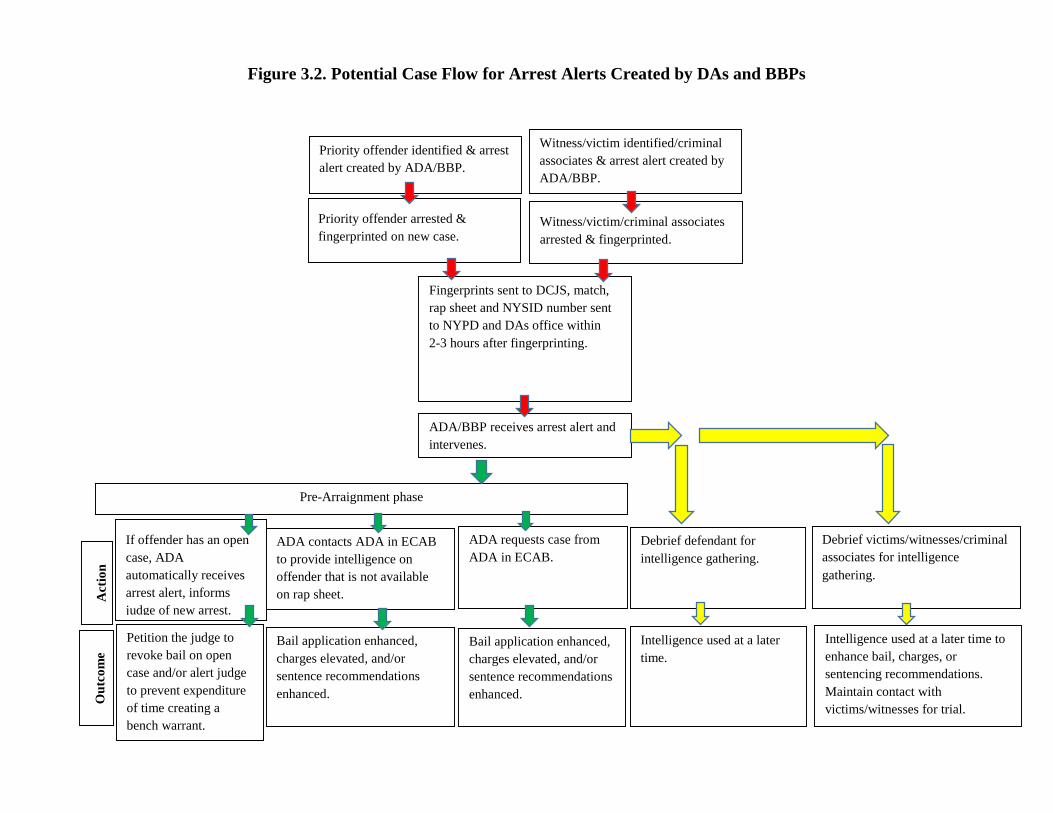
Figure 3.2. Potential Case Flow for Arrest Alerts Created by DAs and BBPs
Priority offender identified & arrest
alert created by ADA/BBP.
Priority offender arrested &
fingerprinted on new case.
Fingerprints sent to DCJS, match,
rap sheet and NYSID number sent
to NYPD and DAs office within
2-3 hours after fingerprinting.
ADA/BBP receives arrest alert and
intervenes.
Pre-Arraignment phase
Petition the judge to
revoke bail on open
case and/or alert judge
to prevent expenditure
of time creating a
bench warrant.
If offender has an open
case, ADA
automatically receives
arrest alert, informs
judge of new arrest.
Bail application enhanced,
charges elevated, and/or
sentence recommendations
enhanced.
ADA contacts ADA in ECAB
to provide intelligence on
offender that is not available
on rap sheet.
ADA requests case from
ADA in ECAB.
Debrief defendant for
intelligence gathering.
Intelligence used at a later
time.
Act
ion
O
utc
om
e
Witness/victim identified/criminal
associates & arrest alert created by
ADA/BBP.
Witness/victim/criminal associates
arrested & fingerprinted.
Bail application enhanced,
charges elevated, and/or
sentence recommendations
enhanced.
Debrief victims/witnesses/criminal
associates for intelligence
gathering.
Intelligence used at a later time to
enhance bail, charges, or
sentencing recommendations.
Maintain contact with
victims/witnesses for trial.
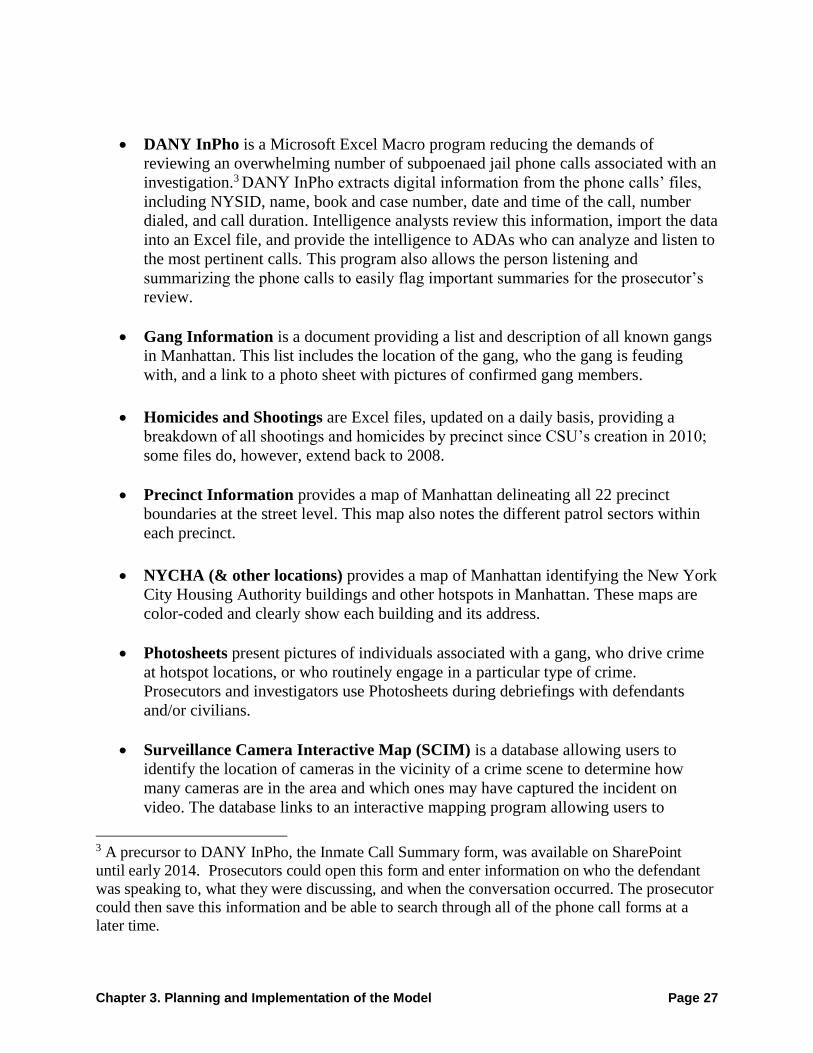
Chapter 3. Planning and Implementation of the Model Page 27
DANY InPho is a Microsoft Excel Macro program reducing the demands of
reviewing an overwhelming number of subpoenaed jail phone calls associated with an
investigation.3 DANY InPho extracts digital information from the phone calls’ files,
including NYSID, name, book and case number, date and time of the call, number
dialed, and call duration. Intelligence analysts review this information, import the data
into an Excel file, and provide the intelligence to ADAs who can analyze and listen to
the most pertinent calls. This program also allows the person listening and
summarizing the phone calls to easily flag important summaries for the prosecutor’s
review.
Gang Information is a document providing a list and description of all known gangs
in Manhattan. This list includes the location of the gang, who the gang is feuding
with, and a link to a photo sheet with pictures of confirmed gang members.
Homicides and Shootings are Excel files, updated on a daily basis, providing a
breakdown of all shootings and homicides by precinct since CSU’s creation in 2010;
some files do, however, extend back to 2008.
Precinct Information provides a map of Manhattan delineating all 22 precinct
boundaries at the street level. This map also notes the different patrol sectors within
each precinct.
NYCHA (& other locations) provides a map of Manhattan identifying the New York
City Housing Authority buildings and other hotspots in Manhattan. These maps are
color-coded and clearly show each building and its address.
Photosheets present pictures of individuals associated with a gang, who drive crime
at hotspot locations, or who routinely engage in a particular type of crime.
Prosecutors and investigators use Photosheets during debriefings with defendants
and/or civilians.
Surveillance Camera Interactive Map (SCIM) is a database allowing users to
identify the location of cameras in the vicinity of a crime scene to determine how
many cameras are in the area and which ones may have captured the incident on
video. The database links to an interactive mapping program allowing users to
3 A precursor to DANY InPho, the Inmate Call Summary form, was available on SharePoint
until early 2014. Prosecutors could open this form and enter information on who the defendant
was speaking to, what they were discussing, and when the conversation occurred. The prosecutor
could then save this information and be able to search through all of the phone call forms at a
later time.
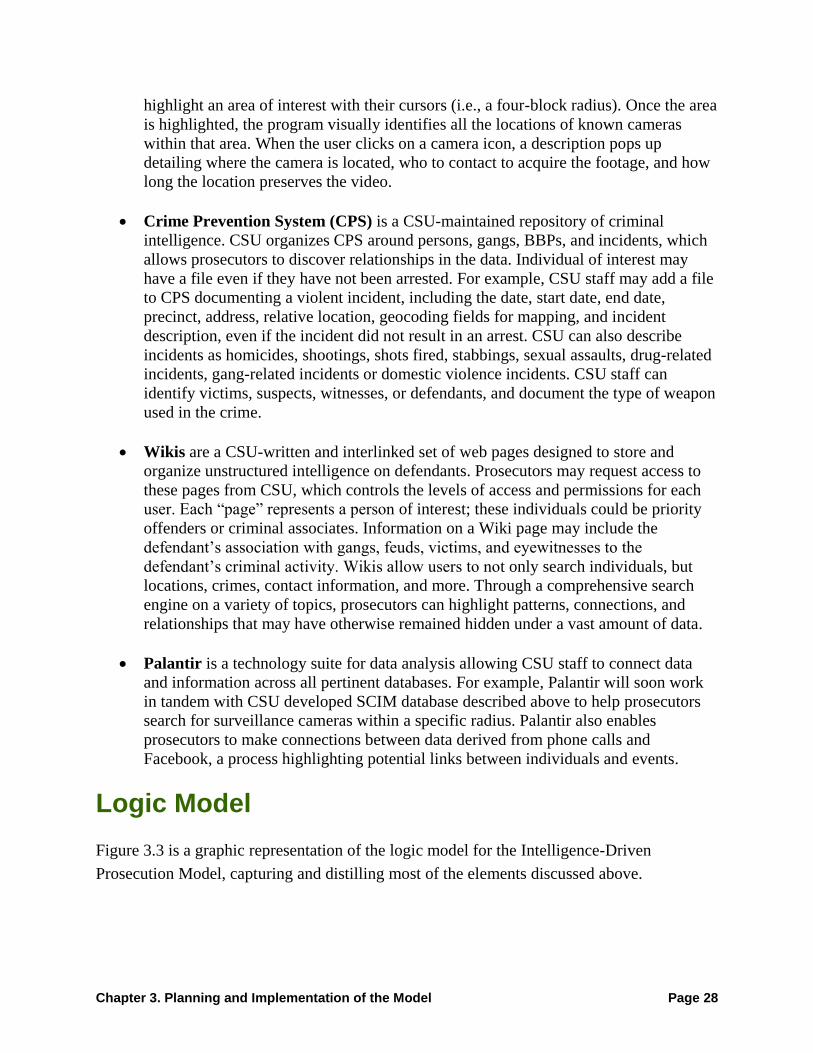
Chapter 3. Planning and Implementation of the Model Page 28
highlight an area of interest with their cursors (i.e., a four-block radius). Once the area
is highlighted, the program visually identifies all the locations of known cameras
within that area. When the user clicks on a camera icon, a description pops up
detailing where the camera is located, who to contact to acquire the footage, and how
long the location preserves the video.
Crime Prevention System (CPS) is a CSU-maintained repository of criminal
intelligence. CSU organizes CPS around persons, gangs, BBPs, and incidents, which
allows prosecutors to discover relationships in the data. Individual of interest may
have a file even if they have not been arrested. For example, CSU staff may add a file
to CPS documenting a violent incident, including the date, start date, end date,
precinct, address, relative location, geocoding fields for mapping, and incident
description, even if the incident did not result in an arrest. CSU can also describe
incidents as homicides, shootings, shots fired, stabbings, sexual assaults, drug-related
incidents, gang-related incidents or domestic violence incidents. CSU staff can
identify victims, suspects, witnesses, or defendants, and document the type of weapon
used in the crime.
Wikis are a CSU-written and interlinked set of web pages designed to store and
organize unstructured intelligence on defendants. Prosecutors may request access to
these pages from CSU, which controls the levels of access and permissions for each
user. Each “page” represents a person of interest; these individuals could be priority
offenders or criminal associates. Information on a Wiki page may include the
defendant’s association with gangs, feuds, victims, and eyewitnesses to the
defendant’s criminal activity. Wikis allow users to not only search individuals, but
locations, crimes, contact information, and more. Through a comprehensive search
engine on a variety of topics, prosecutors can highlight patterns, connections, and
relationships that may have otherwise remained hidden under a vast amount of data.
Palantir is a technology suite for data analysis allowing CSU staff to connect data
and information across all pertinent databases. For example, Palantir will soon work
in tandem with CSU developed SCIM database described above to help prosecutors
search for surveillance cameras within a specific radius. Palantir also enables
prosecutors to make connections between data derived from phone calls and
Facebook, a process highlighting potential links between individuals and events.
Logic Model
Figure 3.3 is a graphic representation of the logic model for the Intelligence-Driven
Prosecution Model, capturing and distilling most of the elements discussed above.
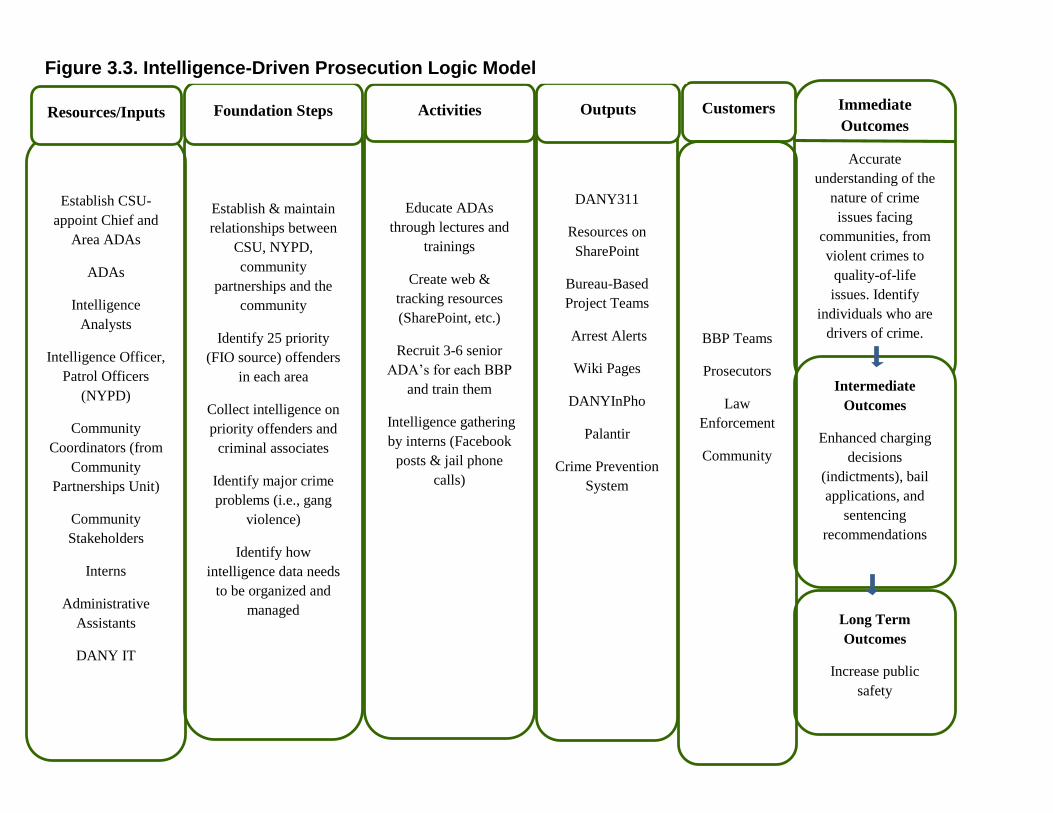
Educate ADAs
through lectures and
trainings
Create web &
tracking resources
(SharePoint, etc.)
Recruit 3-6 senior
ADA’s for each BBP
and train them
Intelligence gathering
by interns (Facebook
posts & jail phone
calls)
Establish CSU-
appoint Chief and
Area ADAs
ADAs
Intelligence
Analysts
Intelligence Officer,
Patrol Officers
(NYPD)
Community
Coordinators (from
Community
Partnerships Unit)
Community
Stakeholders
Interns
Administrative
Assistants
DANY IT
Immediate
Outcomes
Accurate
understanding of the
nature of crime
issues facing
communities, from
violent crimes to
quality-of-life
issues. Identify
individuals who are
drivers of crime.
Establish & maintain
relationships between
CSU, NYPD,
community
partnerships and the
community
Identify 25 priority
(FIO source) offenders
in each area
Collect intelligence on
priority offenders and
criminal associates
Identify major crime
problems (i.e., gang
violence)
Identify how
intelligence data needs
to be organized and
managed
DANY311
Resources on
SharePoint
Bureau-Based
Project Teams
Arrest Alerts
Wiki Pages
DANYInPho
Palantir
Crime Prevention
System
Intermediate
Outcomes
Enhanced charging
decisions
(indictments), bail
applications, and
sentencing
recommendations
Long Term
Outcomes
Increase public
safety
Customers Outputs
BBP Teams
Prosecutors
Law
Enforcement
Community
Activities Resources/Inputs Foundation Steps
Figure 3.3. Intelligence-Driven Prosecution Logic Model
Chapter 3. Planning and Implementation of the Model Page 30
CSU Resources in Practice
Use of the Arrest Alert System by CSU Assistant District Attorneys
A CSU ADA provided an example illustrating how efficient intelligence gathering can
influence cases across the five boroughs. The ADA, following initial meetings with law
enforcement and community contacts, identified two brothers as priority offenders associated
with grand larcenies, robberies, and narcotics. Soon after Hurricane Sandy, CSU received an
arrest alert indicating that the brothers had been arrested for trespassing in a business on
Staten Island. The case was weak, however, because prosecutors could not prove why the
brothers were in the store (possibly seeking shelter from the hurricane) or on Staten Island in
the first place. At the time of the trespassing arrest, one of the brothers had an open case in
special narcotics and CSU knew that his Facebook page was listed under his street narcotics
name, information otherwise unavailable to an attorney unfamiliar with the offender. Prior to
the hurricane, the offender posted on his Facebook page that, “I am going to Staten Island to
get rich tonight.” Within a matter of days, CSU coordinated with Staten Island DAs, who
used the Facebook post to support a burglary case against the offender.
Although the AAS functions as an invaluable tool in helping combat gang violence in certain
CSU areas, the system can also address broader quality-of-life issues. Each crime area
contains a group of priority recidivists tied to the specific needs of the region. For example,
some areas have to contend with “squeegee” men and women who wash the windshields of
cars stopped at intersections and then solicit money. One individual was so notorious for
such activity; he had made the front page of several local newspapers. Upon arrest, this
individual regularly told police, “I’m going to get time served. I’m going to get out.” One
day, after being arrested, arraigned, and released in the morning, this individual was arrested
less than eight hours later on a new charge. Upon receiving the arrest alert, a CSU ADA
shared this knowledge with the judge during the evening arraignment, saying, “Your Honor,
I want to explain to you who this person is because it is a huge safety hazard when he blocks
traffic on major thoroughfares and acts in a very aggressive manner. Think about when you
swerve your car to avoid hitting the man in front of you and what happens as a result. He is
cavalier and blasé about it and says, ‘I’m just going to keep doing it, because I always get
time served.’” As a result of this intervention, the judge did not offer the individual time
served at arraignment. The defendant was unable to make bail and spent 22 days in jail
before conviction, where he was ultimately sentenced to time served. According to the ADA
Chapter 3. Planning and Implementation of the Model Page 31
who relayed this story, in the eight months before the defendant’s detainment pretrial, CSU
received an arrest alert for this individual on a weekly basis. After he spent time in jail, CSU
did not receive an alert on the defendant for eight months.
In another example, CSU used the AAS to influence the case of a known recidivist identified
by the NYPD as “one of the city’s worst scammers.” The individual would walk up to
people, drop a pair of glasses, and say, “Hey, you broke my glasses. You need to pay me so I
can replace them.” After the NYPD arrested him for jostling, CSU received an arrest alert
and reached out to the ADA drafting the case in ECAB. CSU staff notified the ADA that the
individual was a known recidivist and prosecutors could possibly draft the case as a robbery
since the individual was very physically imposing. When the ADA interviewed the victim,
he could not confirm that a physical assault occurred, but the victim asserted that the “threat”
of violence had been present. Despite “basically coming in and out of our system on a daily
basis,” the CSU-provided information allowed the ADA to investigate further and enhance
the charges. The defendant went to trial, where he ultimately lost and was sentenced to three-
and-a-half years in prison.
Case Examples Provided by CSU What follows is a brief summary of several cases provided by CSU’s chief to illustrate the
AAS’ role in prosecutorial decision-making.4
Transit Recidivist: This case concerns a defendant who tampered with MetroCard
machines in the subway (Criminal Tampering in the First Degree). CSU received a
transit recidivist arrest alert and notified ECAB. Because CSU identified this
defendant as a problem for nearly five years, prosecutors charged the case as a felony;
without CSU’s intervention, prosecutors would have normally reduced the charge to a
misdemeanor. The more aggressive charging may have contributed to a $15,000 bail
request (the judge ultimately set bail at $5,000) and the defendant’s eventual plea to a
misdemeanor with a lengthy six-month jail sentence.
Enhanced Bail Application: This case concerns an individual who was arrested for
attacking a man and stealing his iPod. Prosecutors charged the defendant, who
4 It was unfeasible for researchers to view DANY maintained case files. Instead, CSU chief
provided more than a dozen examples of how the Arrest Alert System influenced decision
making, from which researchers selected six (in the last instance condensing two examples into
one) for a brief bullet form summary. Researchers intentionally selected these six examples
because they represent a range of the Arrest Alert System’s functions. The summary of each case
essentially edits and shortens a longer paragraph that CSU chief provided. In this regard, the
research team deeply appreciates the unit chief’s assistance.
Chapter 3. Planning and Implementation of the Model Page 32
committed the crime with two other perpetrators, with Robbery in the Second Degree,
a Class C Felony. After CSU staff notified the ADA writing up the case in ECAB of
the defendant’s gang affiliation and involvement in another open case, the ADA
doubled the bail request from $5,000 to $10,000.
Grand Jury Charging: CSU received an arrest alert indicating that a defendant
belonged to an identified gang in an area with recent shootings, had previously been
shot and was uncooperative, and was a possible witness to a homicide. The ADA
drafting the case enhanced the charge (brandishing a metal lock in a large group) to
Criminal Possession of a Weapon in the Third Degree, a felony, based on his previous
criminal conviction. Prosecutors subsequently added charges of Bail Jumping in the
Second Degree and Resisting Arrest when the defendant warranted and then resisted
arrest on the warrant. The defendant was ultimately sentenced to two to four years of
incarceration. Without the arrest alert, prosecutors would have likely charged the
defendant at the misdemeanor level, which carries the maximum of a one-year jail
sentence.
Enhanced Intelligence Gathering Opportunities: When CSU received an alert that
a violent gang member had been arrested for a robbery, the unit reached out to the
ADA drafting the case in ECAB and provided intelligence on the individual’s gang
affiliation and photographs of other suspected members of the gang. The ADA in
ECAB took a statement from the defendant. Although the defendant did not admit to
the robbery, he confirmed the identities of several of the individuals CSU identified as
members of the same gang. The defendant also clarified the familial relationships
between himself and other prominent gang members. Although this information did
not enhance the robbery case, it helped CSU staff gather intelligence on a violent
gang and its members.
Informing Parole Decisions: CSU received an arrest alert that an identified gang
member, who was on parole, had been arrested for a misdemeanor shoplifting
offense. CSU staff successfully requested that the State Division of Parole set
conditions barring the defendant from the gang area and from associating with
members of his gang. While the new arrest was outside the gang area, it triggered an
arrest alert, which prompted CSU to examine the co-defendant’s background. CSU
informed Parole that the co-defendant was on a list of individuals who the original
defendant was barred from associating; Parole subsequently filed a parole violation.
Informing Judges on Violations of their Orders: In two separate cases, judges
assigned youthful defendants (ages 17 and 15) curfews after robbery arrests. In both
cases, subsequent after-hours arrests triggered alerts, leading the respective judges to
remand the defendants into custody.
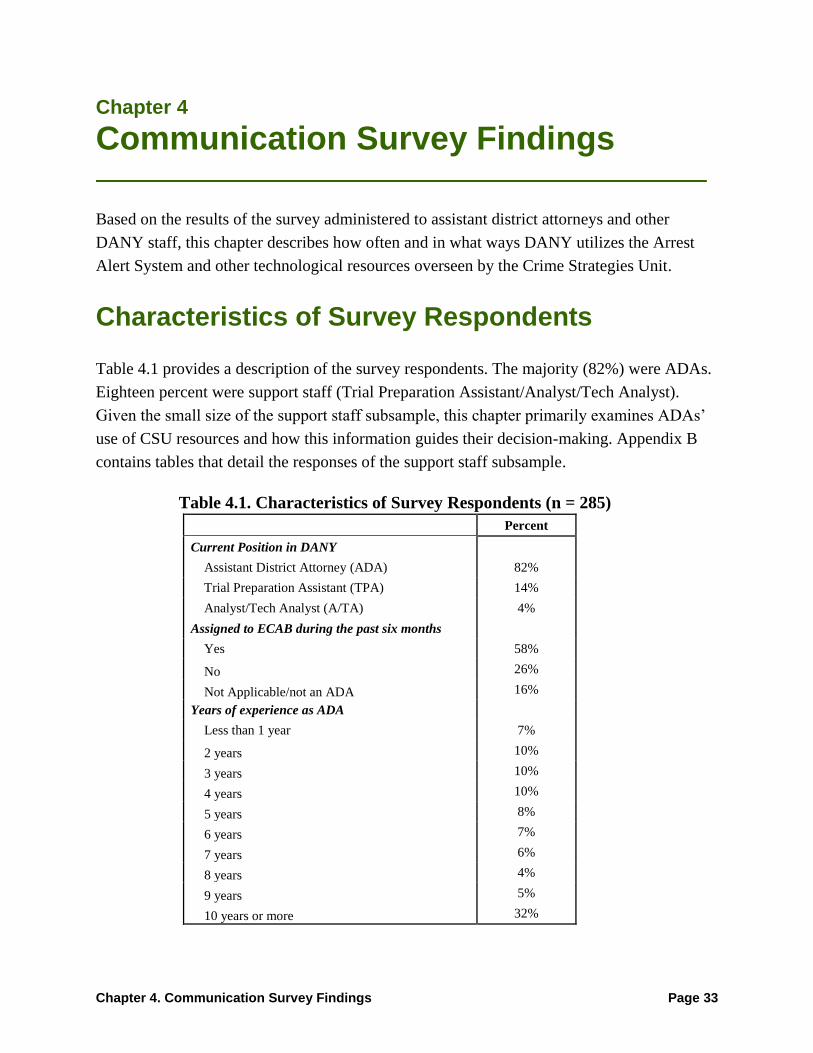
Chapter 4. Communication Survey Findings Page 33
Chapter 4
Communication Survey Findings
Based on the results of the survey administered to assistant district attorneys and other
DANY staff, this chapter describes how often and in what ways DANY utilizes the Arrest
Alert System and other technological resources overseen by the Crime Strategies Unit.
Characteristics of Survey Respondents
Table 4.1 provides a description of the survey respondents. The majority (82%) were ADAs.
Eighteen percent were support staff (Trial Preparation Assistant/Analyst/Tech Analyst).
Given the small size of the support staff subsample, this chapter primarily examines ADAs’
use of CSU resources and how this information guides their decision-making. Appendix B
contains tables that detail the responses of the support staff subsample.
Table 4.1. Characteristics of Survey Respondents (n = 285)
Percent
Current Position in DANY
Assistant District Attorney (ADA) 82%
Trial Preparation Assistant (TPA) 14%
Analyst/Tech Analyst (A/TA) 4%
Assigned to ECAB during the past six months
Yes 58%
No 26%
Not Applicable/not an ADA 16%
Years of experience as ADA
Less than 1 year 7%
2 years 10%
3 years 10%
4 years 10%
5 years 8%
6 years 7%
7 years 6%
8 years 4%
9 years 5%
10 years or more 32%
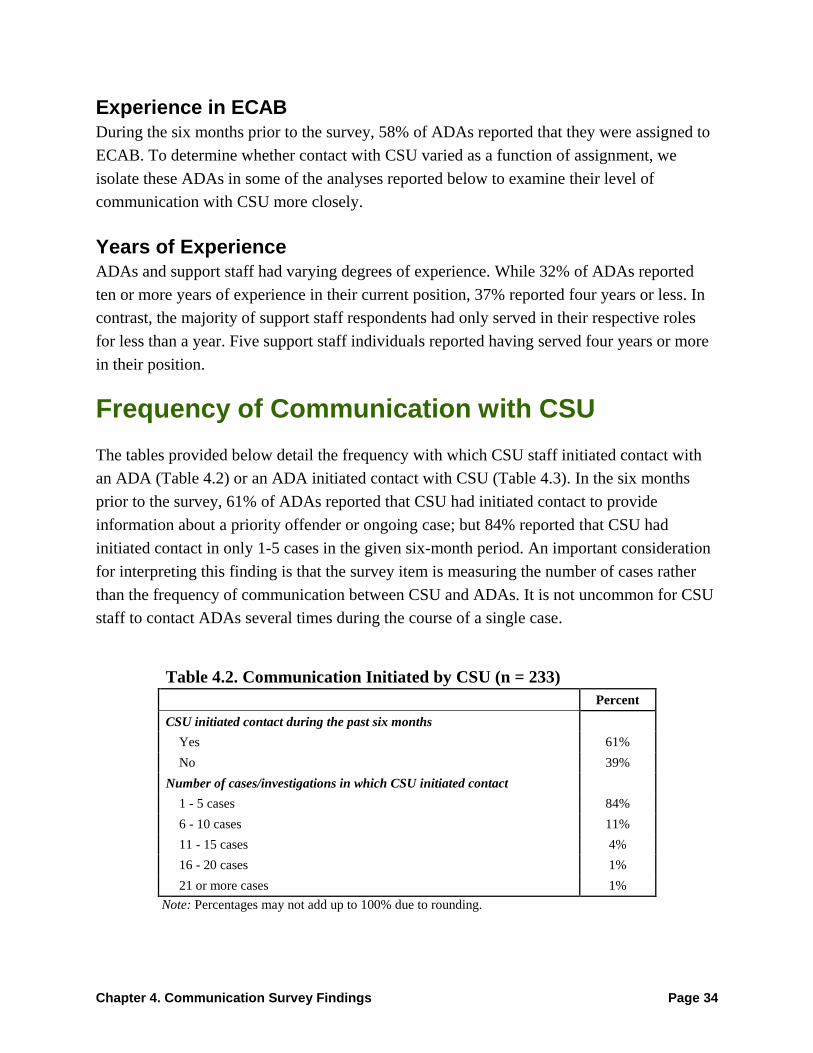
Chapter 4. Communication Survey Findings Page 34
Experience in ECAB During the six months prior to the survey, 58% of ADAs reported that they were assigned to
ECAB. To determine whether contact with CSU varied as a function of assignment, we
isolate these ADAs in some of the analyses reported below to examine their level of
communication with CSU more closely.
Years of Experience ADAs and support staff had varying degrees of experience. While 32% of ADAs reported
ten or more years of experience in their current position, 37% reported four years or less. In
contrast, the majority of support staff respondents had only served in their respective roles
for less than a year. Five support staff individuals reported having served four years or more
in their position.
Frequency of Communication with CSU
The tables provided below detail the frequency with which CSU staff initiated contact with
an ADA (Table 4.2) or an ADA initiated contact with CSU (Table 4.3). In the six months
prior to the survey, 61% of ADAs reported that CSU had initiated contact to provide
information about a priority offender or ongoing case; but 84% reported that CSU had
initiated contact in only 1-5 cases in the given six-month period. An important consideration
for interpreting this finding is that the survey item is measuring the number of cases rather
than the frequency of communication between CSU and ADAs. It is not uncommon for CSU
staff to contact ADAs several times during the course of a single case.
Table 4.2. Communication Initiated by CSU (n = 233)
Percent
CSU initiated contact during the past six months
Yes 61%
No 39%
Number of cases/investigations in which CSU initiated contact
1 - 5 cases 84%
6 - 10 cases 11%
11 - 15 cases 4%
16 - 20 cases 1%
21 or more cases 1%
Note: Percentages may not add up to 100% due to rounding.
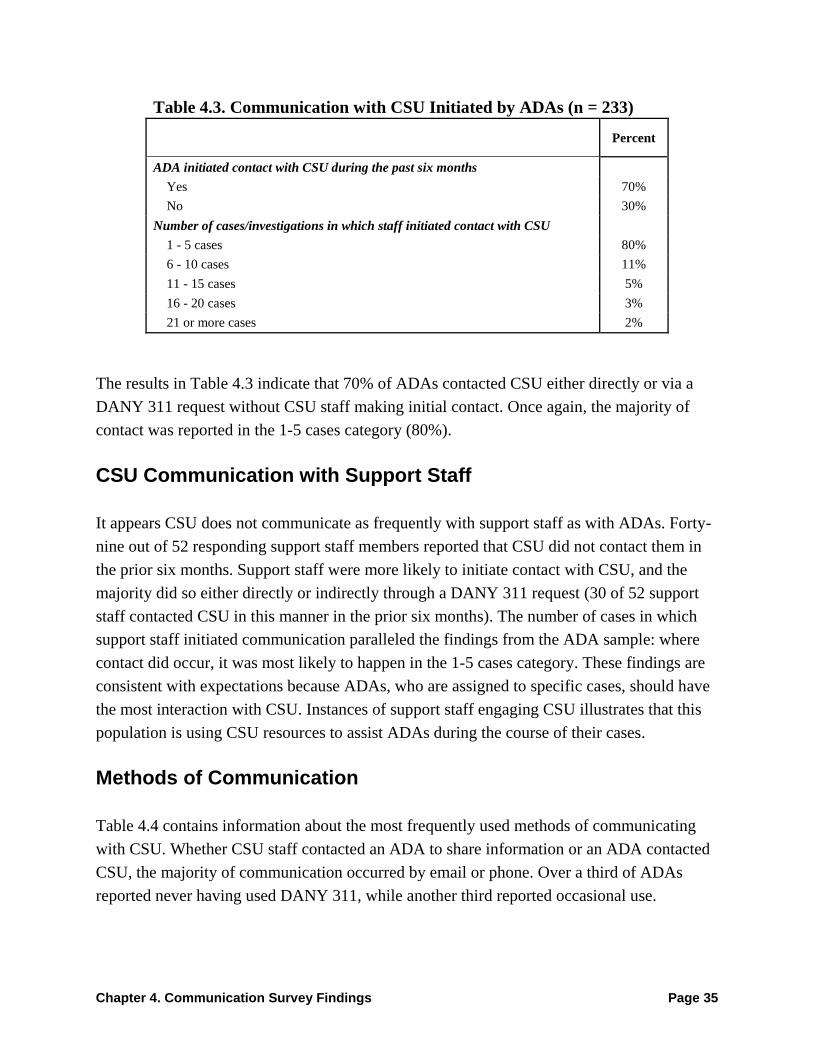
Chapter 4. Communication Survey Findings Page 35
Table 4.3. Communication with CSU Initiated by ADAs (n = 233)
Percent
ADA initiated contact with CSU during the past six months
Yes 70%
No 30%
Number of cases/investigations in which staff initiated contact with CSU
1 - 5 cases 80%
6 - 10 cases 11%
11 - 15 cases 5%
16 - 20 cases 3%
21 or more cases 2%
The results in Table 4.3 indicate that 70% of ADAs contacted CSU either directly or via a
DANY 311 request without CSU staff making initial contact. Once again, the majority of
contact was reported in the 1-5 cases category (80%).
CSU Communication with Support Staff
It appears CSU does not communicate as frequently with support staff as with ADAs. Forty-
nine out of 52 responding support staff members reported that CSU did not contact them in
the prior six months. Support staff were more likely to initiate contact with CSU, and the
majority did so either directly or indirectly through a DANY 311 request (30 of 52 support
staff contacted CSU in this manner in the prior six months). The number of cases in which
support staff initiated communication paralleled the findings from the ADA sample: where
contact did occur, it was most likely to happen in the 1-5 cases category. These findings are
consistent with expectations because ADAs, who are assigned to specific cases, should have
the most interaction with CSU. Instances of support staff engaging CSU illustrates that this
population is using CSU resources to assist ADAs during the course of their cases.
Methods of Communication
Table 4.4 contains information about the most frequently used methods of communicating
with CSU. Whether CSU staff contacted an ADA to share information or an ADA contacted
CSU, the majority of communication occurred by email or phone. Over a third of ADAs
reported never having used DANY 311, while another third reported occasional use.

Chapter 4. Communication Survey Findings Page 36
Table 4.4. Methods of Communication
Frequency of Use Phone Email Other DANY
311
CSU Methods of Communicating with ADAs (n = 233)
Never used 17% 1% 77% -
Rarely used 22% 11% 2% -
Occasionally used 39% 43% 14% -
Frequently used 18% 31% 5% -
Very frequently used 4% 14% 2% -
Frequently/Very frequently used 22% 45% 7% -
ADAs' Methods of Communicating with CSU (n = 163)
Never used 12% 9% 82% 36%
Rarely used 18% 13% 2% 19%
Occasionally used 43% 43% 9% 32%
Frequently used 19% 25% 4% 9%
Very frequently used 8% 9% 2% 4%
Frequently/Very frequently used 27% 34% 7% 13%
Communication Typology
Survey findings make clear that the exchange of information sometimes occurs in the manner
described in official Intelligence-Driven Prosecution Model documents and CSU staff
interviews: CSU “pushes out” information to ADAs. However, findings also make clear that
communication patterns are often reversed - ADAs reach out to CSU for information. Some
ADAs reported that the information flow originated from both CSU staff and the ADA.
We were interested in exploring potential differences in survey responses between ADAs
who only reported that CSU contacted them versus ADAs who at least sometimes initiated
contact with CSU of their own accord. First, we examined the reported prevalence of each
category of communication flow over the prior six months: CSU to ADA, ADA to CSU,
both, or neither. Table 4.6 illustrates the four different types of exchanges that occurred
between ADAs and CSU.
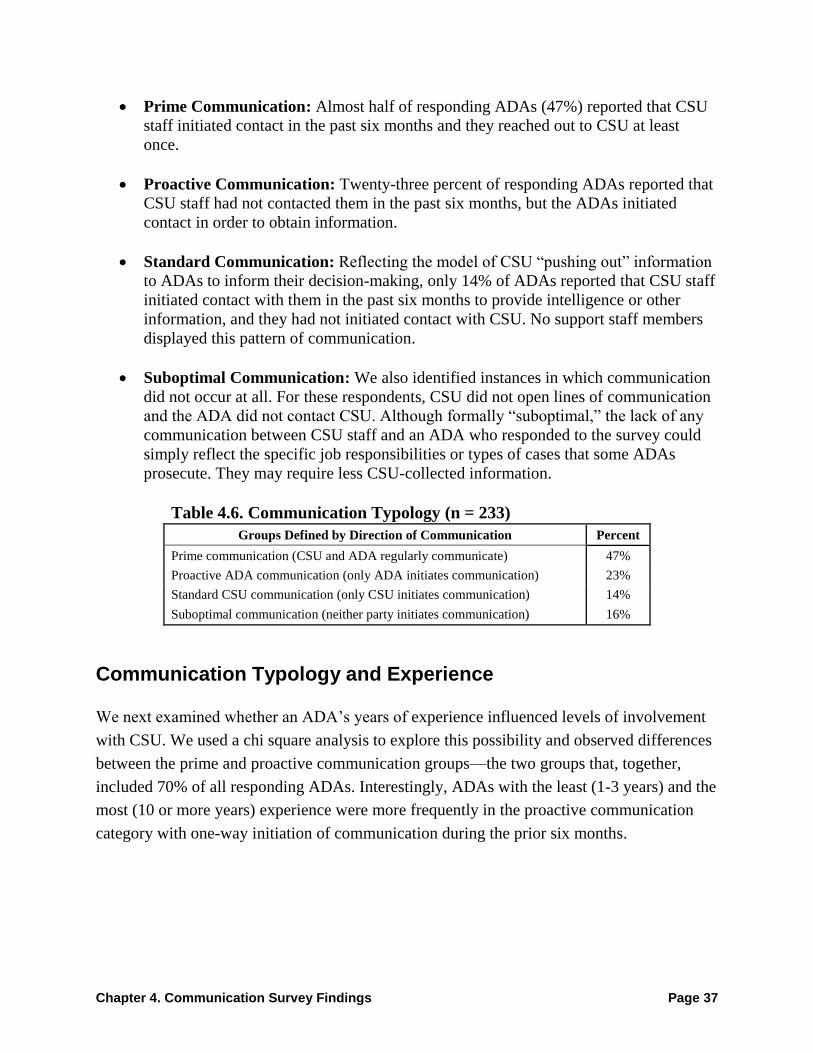
Chapter 4. Communication Survey Findings Page 37
Prime Communication: Almost half of responding ADAs (47%) reported that CSU
staff initiated contact in the past six months and they reached out to CSU at least
once.
Proactive Communication: Twenty-three percent of responding ADAs reported that
CSU staff had not contacted them in the past six months, but the ADAs initiated
contact in order to obtain information.
Standard Communication: Reflecting the model of CSU “pushing out” information
to ADAs to inform their decision-making, only 14% of ADAs reported that CSU staff
initiated contact with them in the past six months to provide intelligence or other
information, and they had not initiated contact with CSU. No support staff members
displayed this pattern of communication.
Suboptimal Communication: We also identified instances in which communication
did not occur at all. For these respondents, CSU did not open lines of communication
and the ADA did not contact CSU. Although formally “suboptimal,” the lack of any
communication between CSU staff and an ADA who responded to the survey could
simply reflect the specific job responsibilities or types of cases that some ADAs
prosecute. They may require less CSU-collected information.
Table 4.6. Communication Typology (n = 233)
Groups Defined by Direction of Communication Percent
Prime communication (CSU and ADA regularly communicate) 47%
Proactive ADA communication (only ADA initiates communication) 23%
Standard CSU communication (only CSU initiates communication) 14%
Suboptimal communication (neither party initiates communication) 16%
Communication Typology and Experience
We next examined whether an ADA’s years of experience influenced levels of involvement
with CSU. We used a chi square analysis to explore this possibility and observed differences
between the prime and proactive communication groups—the two groups that, together,
included 70% of all responding ADAs. Interestingly, ADAs with the least (1-3 years) and the
most (10 or more years) experience were more frequently in the proactive communication
category with one-way initiation of communication during the prior six months.
Chapter 4. Communication Survey Findings Page 38
Future Opportunities to Increase Communication
We looked at ways to reduce suboptimal communication and increase the frequency of
ADAs using CSU-collected intelligence. One potential solution would be for CSU staff to
increase its outreach and training of line ADAs throughout DANY. CSU regularly engages
DANY staff at various points in their careers. The Unit targets each new class of attorneys
when they start their work in criminal court and interacts with them again a year later during
a formal lecture about CSU resources when attorneys receive felony training. One CSU ADA
suggested that DANY augment these efforts by qualifying CSU lectures on intelligence-
driven prosecution as continuing legal education credits.
Although process research makes clear that CSU regularly engaged with the trial bureaus
through training and other initiatives, CSU staff also reported that experience often
determined how much attorneys engaged with CSU. As one CSU ADA pointed out:
If you are a senior person in the office, you probably understand CSU because we’ve
been in existence long enough. . . . but if you’re a low level attorney in this office or mid-
level, we maybe haven’t spoken to you as many times. . . We take that as an opportunity
to explain to them how we can help, what we can do and we have a lot of information on
our SharePoint site, which is available to them . . . We’ll say ‘you can always reach out
to me’ and ‘I can always answer this question, but there’s a lot of information we have
pushed out that’s just sitting there on your desktop waiting for you to access it.’
Although targeted outreach may encourage ADAs to reach out to CSU, an unexpected
finding from the survey shows that a great many ADAs were not contacted by CSU staff in
the prior six months. Thirty-nine percent of ADA respondents fell into the proactive and
suboptimal categories, neither of which were contacted by CSU. As noted above, some
ADAs may simply not handle the types of cases that are the subject of arrest alerts or other
kinds of CSU information resources. Other ADAs responding to the survey may have been
confused as to what constitutes formal contact. For instance, although DANY311 should
serve as a metric for capturing how many ADAs interact with CSU, communication may
occur in a much more informal manner than what the survey was designed to capture. As one
CSU ADA said:
If I reach out to someone to give then information, it’s not a DANY311. But if in the
course of reaching out to them, they ask me for something then that’s a 311. He’s like, ‘I
can never figure out what’s a 311 and what is not or he’ll say ‘you forgot to open a 311
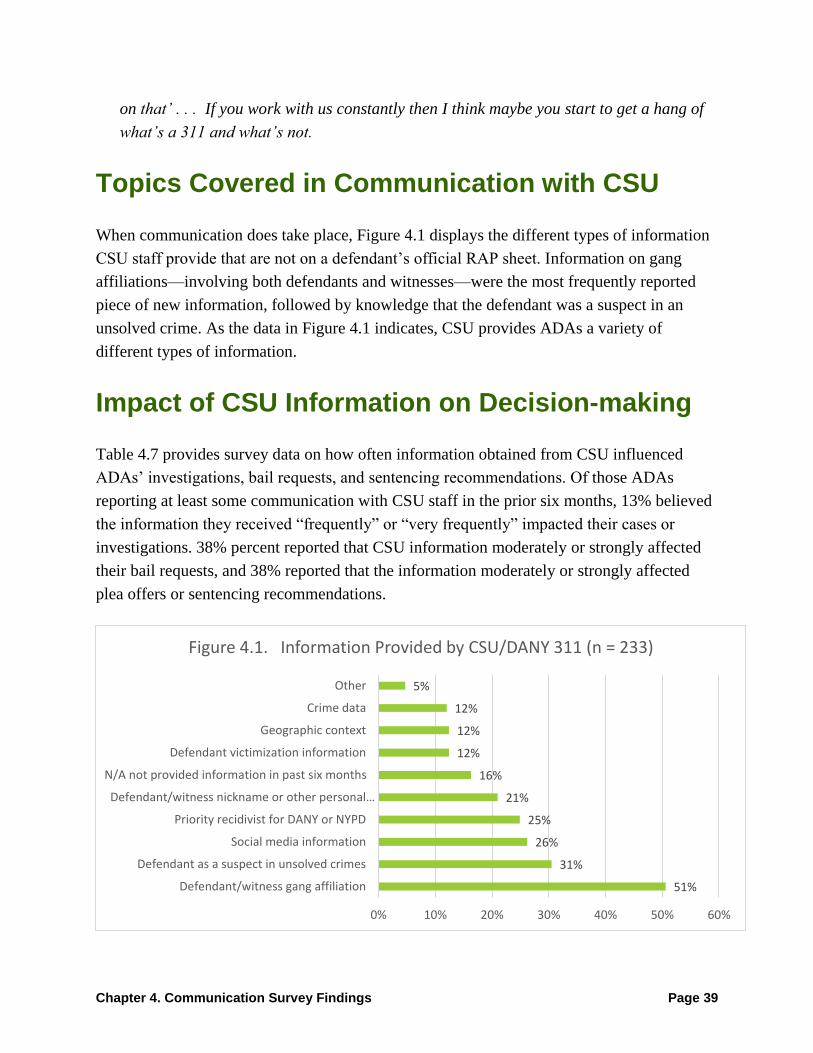
Chapter 4. Communication Survey Findings Page 39
on that’ . . . If you work with us constantly then I think maybe you start to get a hang of
what’s a 311 and what’s not.
Topics Covered in Communication with CSU
When communication does take place, Figure 4.1 displays the different types of information
CSU staff provide that are not on a defendant’s official RAP sheet. Information on gang
affiliations—involving both defendants and witnesses—were the most frequently reported
piece of new information, followed by knowledge that the defendant was a suspect in an
unsolved crime. As the data in Figure 4.1 indicates, CSU provides ADAs a variety of
different types of information.
Impact of CSU Information on Decision-making Table 4.7 provides survey data on how often information obtained from CSU influenced
ADAs’ investigations, bail requests, and sentencing recommendations. Of those ADAs
reporting at least some communication with CSU staff in the prior six months, 13% believed
the information they received “frequently” or “very frequently” impacted their cases or
investigations. 38% percent reported that CSU information moderately or strongly affected
their bail requests, and 38% reported that the information moderately or strongly affected
plea offers or sentencing recommendations.
51%
31%
26%
25%
21%
16%
12%
12%
12%
5%
0% 10% 20% 30% 40% 50% 60%
Defendant/witness gang affiliation
Defendant as a suspect in unsolved crimes
Social media information
Priority recidivist for DANY or NYPD
Defendant/witness nickname or other personal…
N/A not provided information in past six months
Defendant victimization information
Geographic context
Crime data
Other
Figure 4.1. Information Provided by CSU/DANY 311 (n = 233)
Chapter 4. Communication Survey Findings Page 40
As previously discussed, our communication typology allowed us to identify three groups
that varied in terms of how they acquired information from CSU (the fourth group–
suboptimal–did not report communication in either direction). As Table 4.8 shows, these
three groups vary in how often they applied CSU information to investigations, bail requests,
and plea offers/sentencing recommendations. The ADAs in the prime and standard
communication categories frequently reported that CSU information had a large impact on
their decision-making. In contrast, the proactive users who contacted CSU for information
but had not themselves been contacted by CSU staff, were less likely to respond that
information from CSU moderately or strongly affected their decision-making. ADAs can
reach out to CSU and request intelligence on any aspect of their case, but the unit will only
actively push out information to ADAs on individuals identified as known drivers of crime.
CSU contacted ADAs in the prime and standard groups because these ADAs prosecute more
cases related to individuals already in CSU system. ADAs in the proactive group reach out to
CSU for intelligence on defendants or witnesses who are not known crime drivers. Though
CSU will provide any intelligence they may have on these individuals, it is unlikely this
information will impact decision-making.
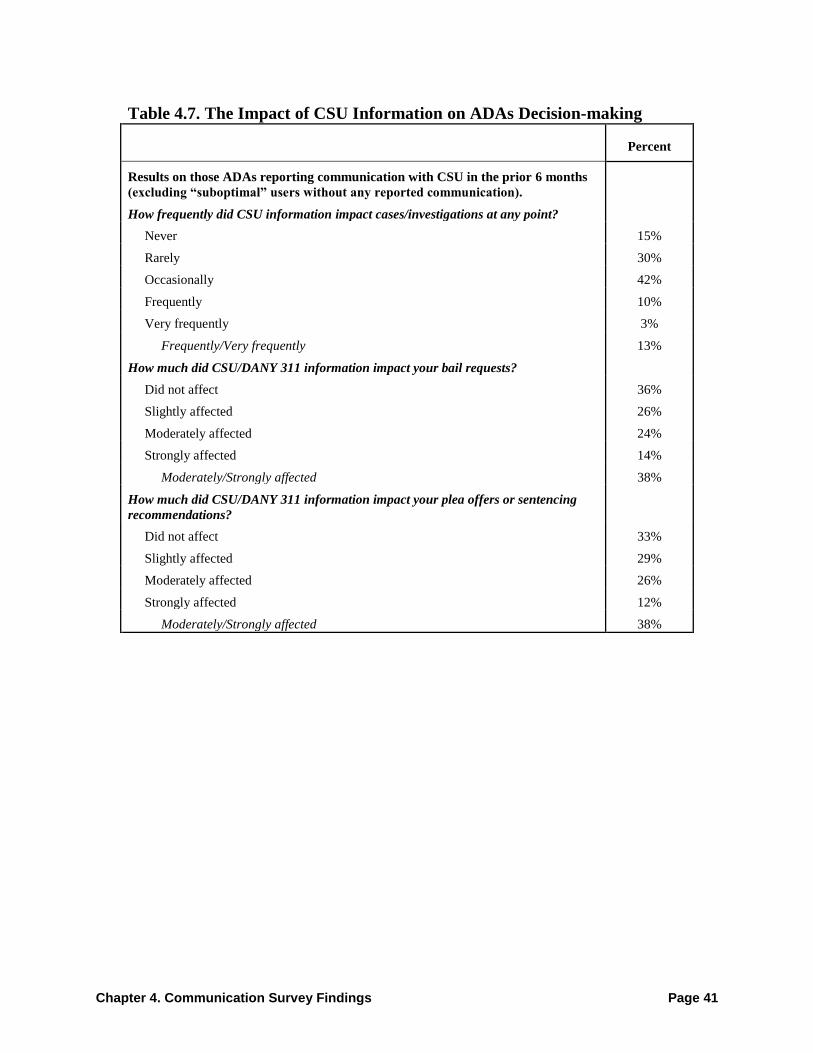
Chapter 4. Communication Survey Findings Page 41
Table 4.7. The Impact of CSU Information on ADAs Decision-making
Percent
Results on those ADAs reporting communication with CSU in the prior 6 months
(excluding “suboptimal” users without any reported communication).
How frequently did CSU information impact cases/investigations at any point?
Never 15%
Rarely 30%
Occasionally 42%
Frequently 10%
Very frequently 3%
Frequently/Very frequently 13%
How much did CSU/DANY 311 information impact your bail requests?
Did not affect 36%
Slightly affected 26%
Moderately affected 24%
Strongly affected 14%
Moderately/Strongly affected 38%
How much did CSU/DANY 311 information impact your plea offers or sentencing
recommendations?
Did not affect 33%
Slightly affected 29%
Moderately affected 26%
Strongly affected 12%
Moderately/Strongly affected 38%

Chapter 4. Communication Survey Findings Page 42
Table 4.8. Communicative Typologies and the Application of CSU Information
Prime
Users
(n = 110)
Proactive
Users
(n = 53)
Standard
Users
(n = 32)
How frequently did CSU information impact cases/investigations at any
point? +
Never 7% 26% 22%
Rarely 28% 28% 26%
Occasionally 49% 35% 44%
Frequently/Very frequently 16% 12% 9%
How much did CSU/DANY 311 information impact your bail requests? ***
Did not affect 27% 60% 28%
Slightly affected 26% 24% 24%
Moderately/Strongly affected 47% 16% 48%
How much did CSU/DANY 311 information impact your plea offers or
sentencing recommendations? *
Did not affect 24% 48% 44%
Slightly affected 34% 26% 15%
Moderately/Strongly affected 41% 26% 41%
Note: Table contains column percentages from chi square contingency table to allow for comparison across categories on each
item.
+p < .10, * p < .05, ** p < .01, ***p < .001.
Stage of Case Processing When Communication
Takes Place
The results in Table 4.9 indicate the stage of case processing when ADA respondents most
often received unsolicited information from CSU. The table provides results for all
responding ADAs and also breaks down responses for those ADAs who reported having
been assigned to ECAB in the past six months (ADAs with recent ECAB experience would
presumably have opportunities that other ADAs might not have to receive CSU information
prior to arraignment). Thirty-six percent of all respondents and 41% of those recently
assigned to ECAB reported that CSU was most likely to communicate information in felony
cases after criminal court arraignment but before the grand jury presentation. The second
most common point where CSU initiated communication was in ECAB. These findings are
consistent with the intended model, which focuses on more serious cases (i.e., felonies) and
communicating information in the earlier stages of case processing.
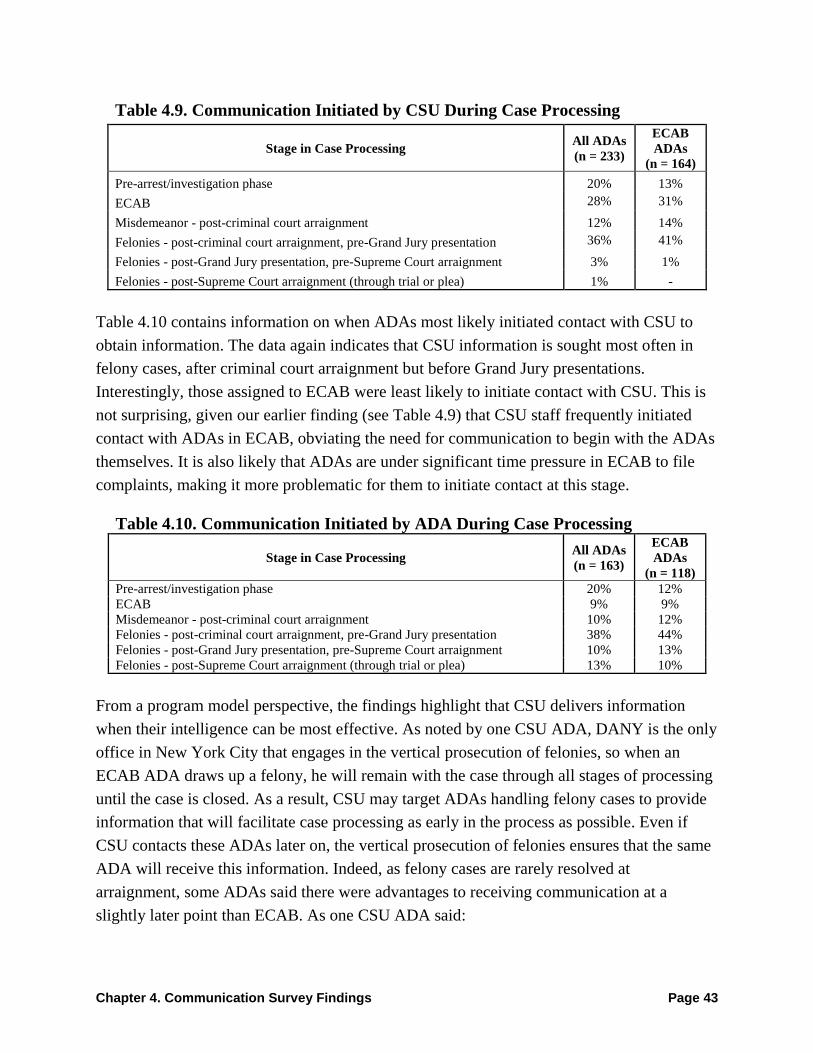
Chapter 4. Communication Survey Findings Page 43
Table 4.9. Communication Initiated by CSU During Case Processing
Stage in Case Processing All ADAs
(n = 233)
ECAB
ADAs
(n = 164)
Pre-arrest/investigation phase 20% 13%
ECAB 28% 31%
Misdemeanor - post-criminal court arraignment 12% 14%
Felonies - post-criminal court arraignment, pre-Grand Jury presentation 36% 41%
Felonies - post-Grand Jury presentation, pre-Supreme Court arraignment 3% 1%
Felonies - post-Supreme Court arraignment (through trial or plea) 1% -
Table 4.10 contains information on when ADAs most likely initiated contact with CSU to
obtain information. The data again indicates that CSU information is sought most often in
felony cases, after criminal court arraignment but before Grand Jury presentations.
Interestingly, those assigned to ECAB were least likely to initiate contact with CSU. This is
not surprising, given our earlier finding (see Table 4.9) that CSU staff frequently initiated
contact with ADAs in ECAB, obviating the need for communication to begin with the ADAs
themselves. It is also likely that ADAs are under significant time pressure in ECAB to file
complaints, making it more problematic for them to initiate contact at this stage.
Table 4.10. Communication Initiated by ADA During Case Processing
Stage in Case Processing All ADAs
(n = 163)
ECAB
ADAs
(n = 118)
Pre-arrest/investigation phase 20% 12%
ECAB 9% 9%
Misdemeanor - post-criminal court arraignment 10% 12%
Felonies - post-criminal court arraignment, pre-Grand Jury presentation 38% 44%
Felonies - post-Grand Jury presentation, pre-Supreme Court arraignment 10% 13%
Felonies - post-Supreme Court arraignment (through trial or plea) 13% 10%
From a program model perspective, the findings highlight that CSU delivers information
when their intelligence can be most effective. As noted by one CSU ADA, DANY is the only
office in New York City that engages in the vertical prosecution of felonies, so when an
ECAB ADA draws up a felony, he will remain with the case through all stages of processing
until the case is closed. As a result, CSU may target ADAs handling felony cases to provide
information that will facilitate case processing as early in the process as possible. Even if
CSU contacts these ADAs later on, the vertical prosecution of felonies ensures that the same
ADA will receive this information. Indeed, as felony cases are rarely resolved at
arraignment, some ADAs said there were advantages to receiving communication at a
slightly later point than ECAB. As one CSU ADA said:
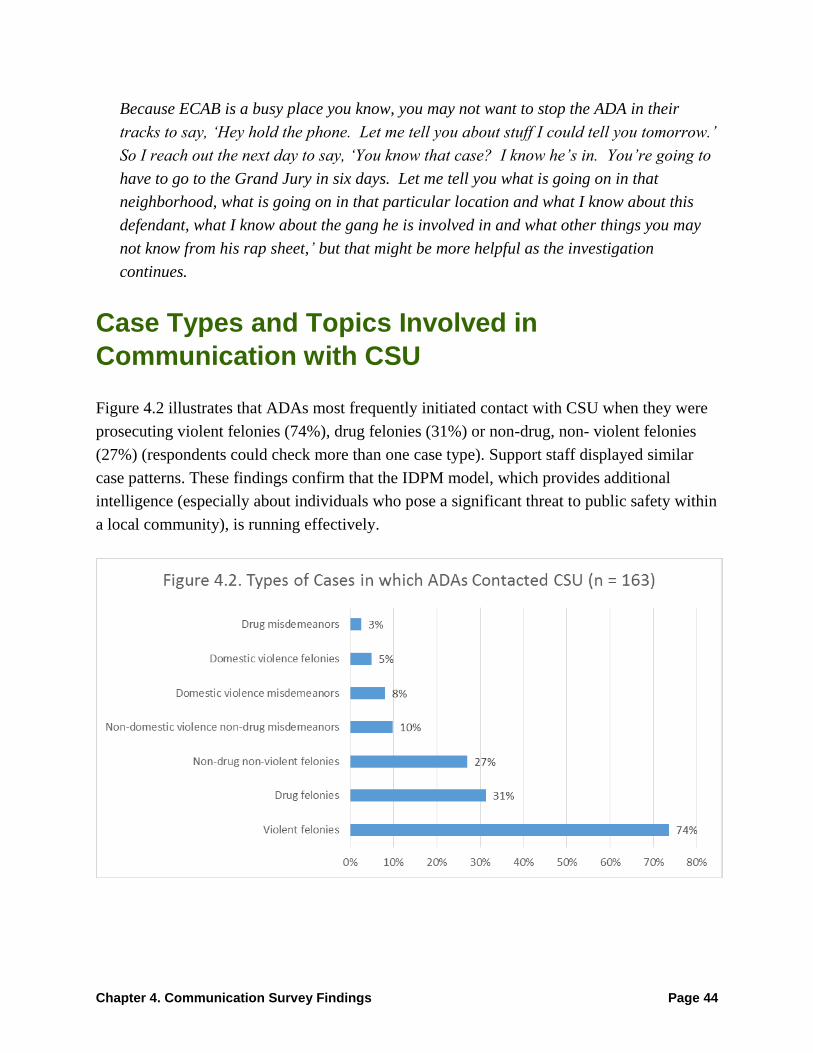
Chapter 4. Communication Survey Findings Page 44
Because ECAB is a busy place you know, you may not want to stop the ADA in their
tracks to say, ‘Hey hold the phone. Let me tell you about stuff I could tell you tomorrow.’
So I reach out the next day to say, ‘You know that case? I know he’s in. You’re going to
have to go to the Grand Jury in six days. Let me tell you what is going on in that
neighborhood, what is going on in that particular location and what I know about this
defendant, what I know about the gang he is involved in and what other things you may
not know from his rap sheet,’ but that might be more helpful as the investigation
continues.
Case Types and Topics Involved in
Communication with CSU
Figure 4.2 illustrates that ADAs most frequently initiated contact with CSU when they were
prosecuting violent felonies (74%), drug felonies (31%) or non-drug, non- violent felonies
(27%) (respondents could check more than one case type). Support staff displayed similar
case patterns. These findings confirm that the IDPM model, which provides additional
intelligence (especially about individuals who pose a significant threat to public safety within
a local community), is running effectively.
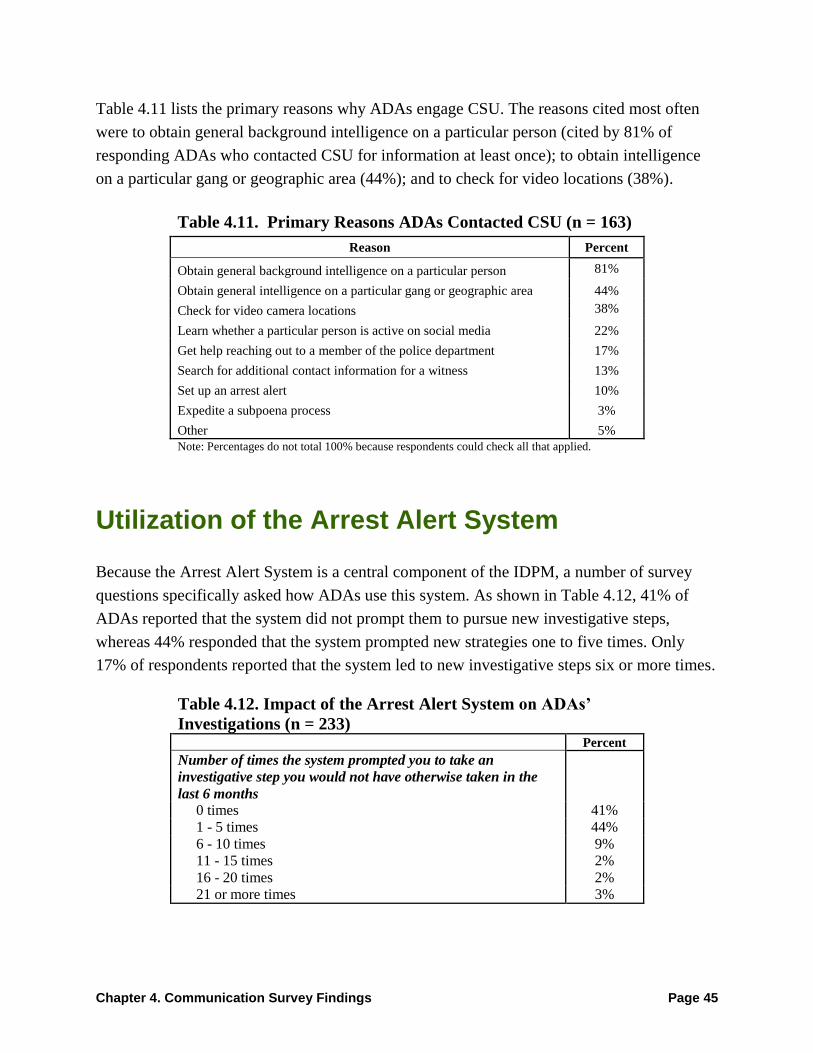
Chapter 4. Communication Survey Findings Page 45
Table 4.11 lists the primary reasons why ADAs engage CSU. The reasons cited most often
were to obtain general background intelligence on a particular person (cited by 81% of
responding ADAs who contacted CSU for information at least once); to obtain intelligence
on a particular gang or geographic area (44%); and to check for video locations (38%).
Table 4.11. Primary Reasons ADAs Contacted CSU (n = 163)
Reason Percent
Obtain general background intelligence on a particular person 81%
Obtain general intelligence on a particular gang or geographic area 44%
Check for video camera locations 38%
Learn whether a particular person is active on social media 22%
Get help reaching out to a member of the police department 17%
Search for additional contact information for a witness 13%
Set up an arrest alert 10%
Expedite a subpoena process 3%
Other 5%
Note: Percentages do not total 100% because respondents could check all that applied.
Utilization of the Arrest Alert System
Because the Arrest Alert System is a central component of the IDPM, a number of survey
questions specifically asked how ADAs use this system. As shown in Table 4.12, 41% of
ADAs reported that the system did not prompt them to pursue new investigative steps,
whereas 44% responded that the system prompted new strategies one to five times. Only
17% of respondents reported that the system led to new investigative steps six or more times.
Table 4.12. Impact of the Arrest Alert System on ADAs’
Investigations (n = 233) Percent
Number of times the system prompted you to take an
investigative step you would not have otherwise taken in the
last 6 months
0 times 41%
1 - 5 times 44%
6 - 10 times 9%
11 - 15 times 2%
16 - 20 times 2%
21 or more times 3%
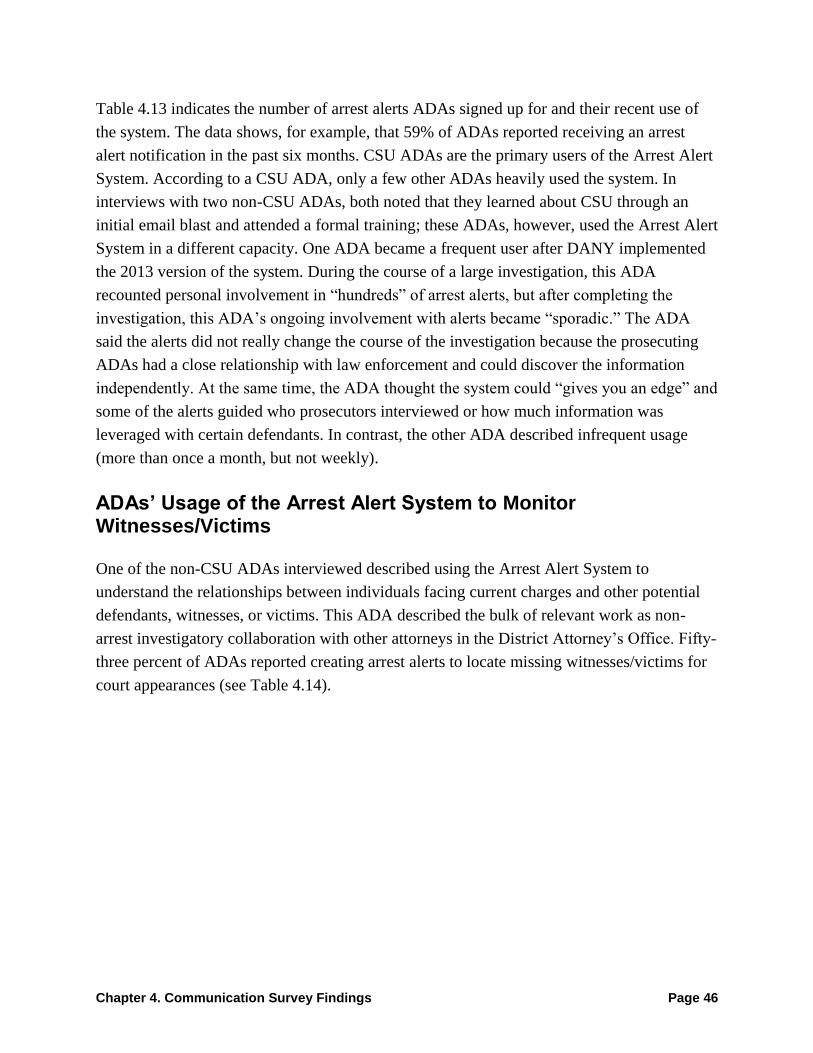
Chapter 4. Communication Survey Findings Page 46
Table 4.13 indicates the number of arrest alerts ADAs signed up for and their recent use of
the system. The data shows, for example, that 59% of ADAs reported receiving an arrest
alert notification in the past six months. CSU ADAs are the primary users of the Arrest Alert
System. According to a CSU ADA, only a few other ADAs heavily used the system. In
interviews with two non-CSU ADAs, both noted that they learned about CSU through an
initial email blast and attended a formal training; these ADAs, however, used the Arrest Alert
System in a different capacity. One ADA became a frequent user after DANY implemented
the 2013 version of the system. During the course of a large investigation, this ADA
recounted personal involvement in “hundreds” of arrest alerts, but after completing the
investigation, this ADA’s ongoing involvement with alerts became “sporadic.” The ADA
said the alerts did not really change the course of the investigation because the prosecuting
ADAs had a close relationship with law enforcement and could discover the information
independently. At the same time, the ADA thought the system could “gives you an edge” and
some of the alerts guided who prosecutors interviewed or how much information was
leveraged with certain defendants. In contrast, the other ADA described infrequent usage
(more than once a month, but not weekly).
ADAs’ Usage of the Arrest Alert System to Monitor Witnesses/Victims
One of the non-CSU ADAs interviewed described using the Arrest Alert System to
understand the relationships between individuals facing current charges and other potential
defendants, witnesses, or victims. This ADA described the bulk of relevant work as non-
arrest investigatory collaboration with other attorneys in the District Attorney’s Office. Fifty-
three percent of ADAs reported creating arrest alerts to locate missing witnesses/victims for
court appearances (see Table 4.14).
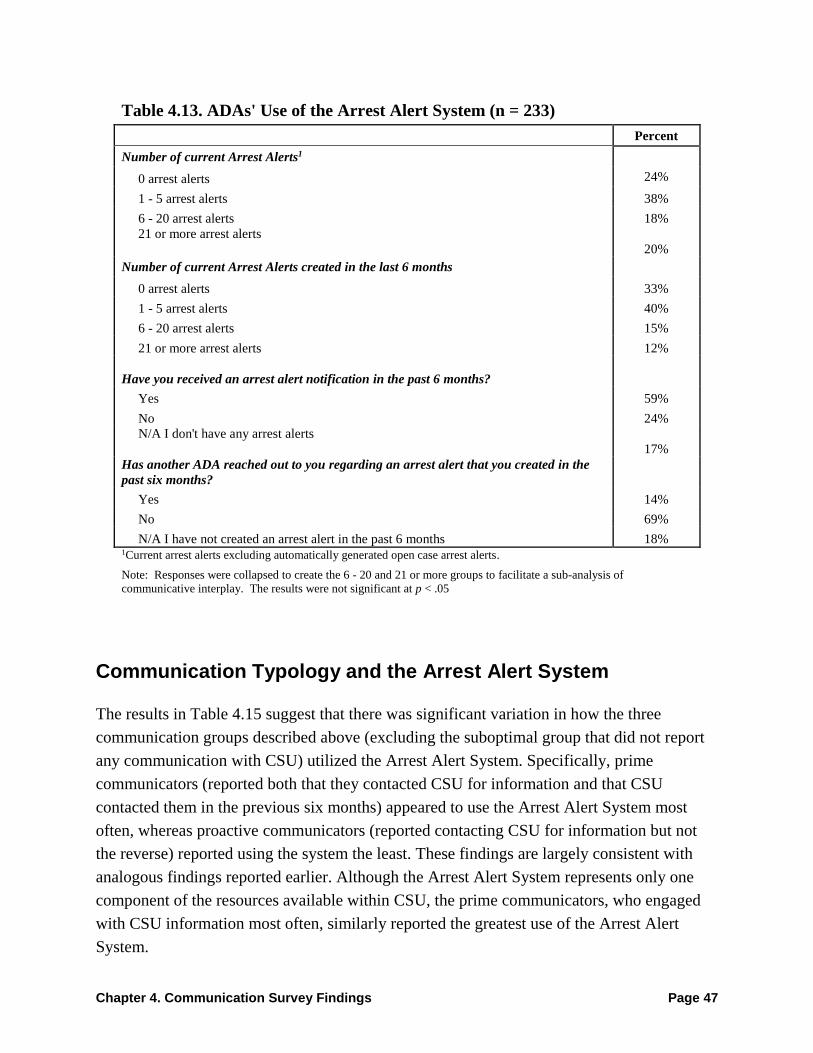
Chapter 4. Communication Survey Findings Page 47
Table 4.13. ADAs' Use of the Arrest Alert System (n = 233)
Percent
Number of current Arrest Alerts1
0 arrest alerts 24%
1 - 5 arrest alerts 38%
6 - 20 arrest alerts 18%
21 or more arrest alerts
20%
Number of current Arrest Alerts created in the last 6 months
0 arrest alerts 33%
1 - 5 arrest alerts 40%
6 - 20 arrest alerts 15%
21 or more arrest alerts 12%
Have you received an arrest alert notification in the past 6 months?
Yes 59%
No 24%
N/A I don't have any arrest alerts
17%
Has another ADA reached out to you regarding an arrest alert that you created in the
past six months?
Yes 14%
No 69%
N/A I have not created an arrest alert in the past 6 months 18% 1Current arrest alerts excluding automatically generated open case arrest alerts.
Note: Responses were collapsed to create the 6 - 20 and 21 or more groups to facilitate a sub-analysis of
communicative interplay. The results were not significant at p < .05
Communication Typology and the Arrest Alert System
The results in Table 4.15 suggest that there was significant variation in how the three
communication groups described above (excluding the suboptimal group that did not report
any communication with CSU) utilized the Arrest Alert System. Specifically, prime
communicators (reported both that they contacted CSU for information and that CSU
contacted them in the previous six months) appeared to use the Arrest Alert System most
often, whereas proactive communicators (reported contacting CSU for information but not
the reverse) reported using the system the least. These findings are largely consistent with
analogous findings reported earlier. Although the Arrest Alert System represents only one
component of the resources available within CSU, the prime communicators, who engaged
with CSU information most often, similarly reported the greatest use of the Arrest Alert
System.
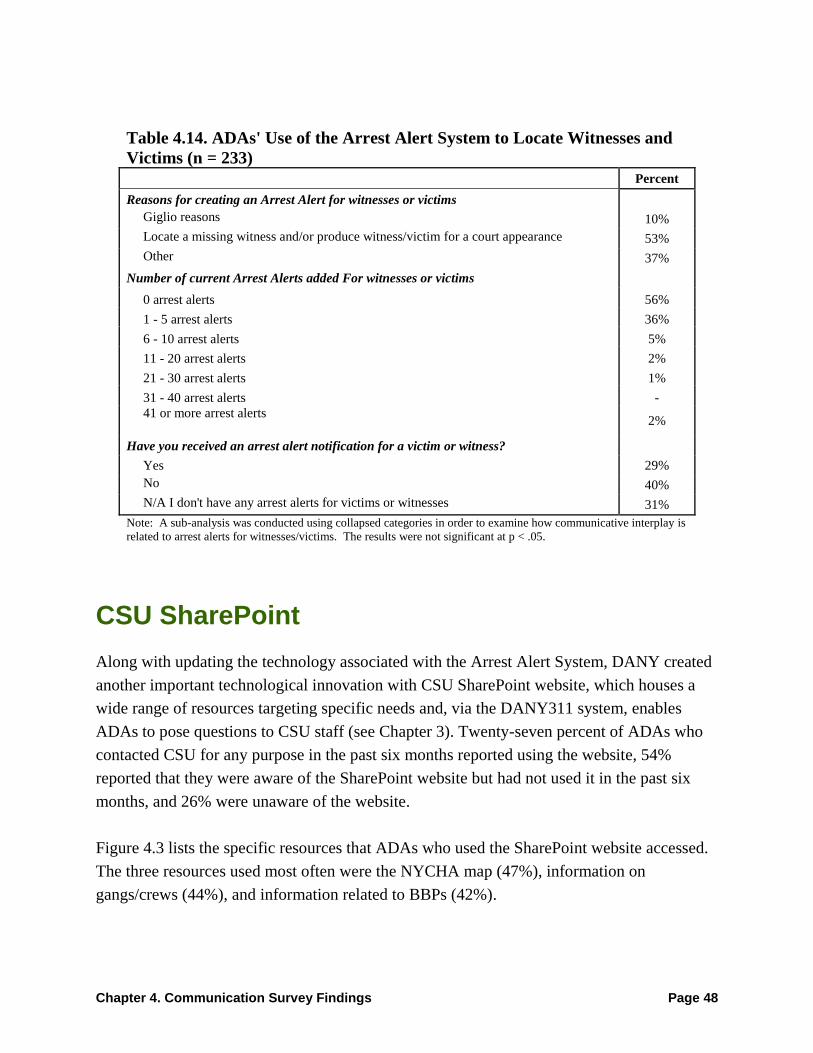
Chapter 4. Communication Survey Findings Page 48
Table 4.14. ADAs' Use of the Arrest Alert System to Locate Witnesses and
Victims (n = 233)
Percent
Reasons for creating an Arrest Alert for witnesses or victims
Giglio reasons 10%
Locate a missing witness and/or produce witness/victim for a court appearance 53%
Other 37%
Number of current Arrest Alerts added For witnesses or victims
0 arrest alerts 56%
1 - 5 arrest alerts 36%
6 - 10 arrest alerts 5%
11 - 20 arrest alerts 2%
21 - 30 arrest alerts 1%
31 - 40 arrest alerts -
41 or more arrest alerts
2%
Have you received an arrest alert notification for a victim or witness?
Yes 29%
No 40%
N/A I don't have any arrest alerts for victims or witnesses 31%
Note: A sub-analysis was conducted using collapsed categories in order to examine how communicative interplay is
related to arrest alerts for witnesses/victims. The results were not significant at p < .05.
CSU SharePoint
Along with updating the technology associated with the Arrest Alert System, DANY created
another important technological innovation with CSU SharePoint website, which houses a
wide range of resources targeting specific needs and, via the DANY311 system, enables
ADAs to pose questions to CSU staff (see Chapter 3). Twenty-seven percent of ADAs who
contacted CSU for any purpose in the past six months reported using the website, 54%
reported that they were aware of the SharePoint website but had not used it in the past six
months, and 26% were unaware of the website.
Figure 4.3 lists the specific resources that ADAs who used the SharePoint website accessed.
The three resources used most often were the NYCHA map (47%), information on
gangs/crews (44%), and information related to BBPs (42%).
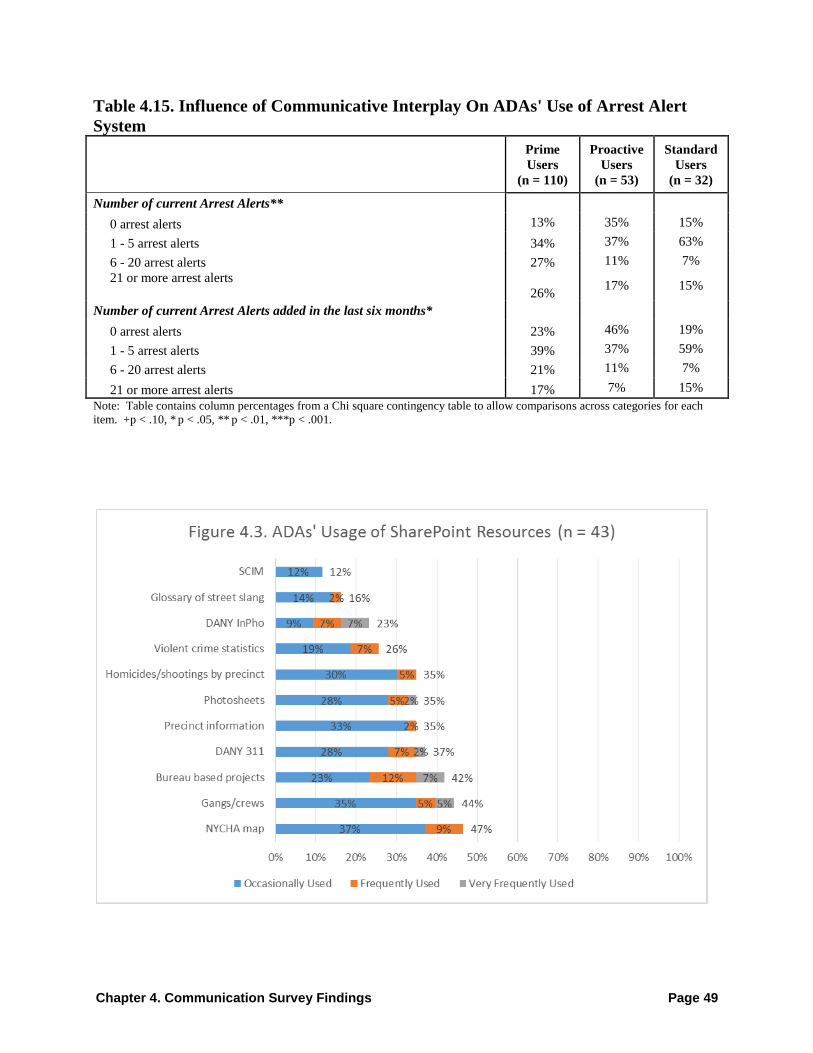
Chapter 4. Communication Survey Findings Page 49
Table 4.15. Influence of Communicative Interplay On ADAs' Use of Arrest Alert
System
Prime
Users
(n = 110)
Proactive
Users
(n = 53)
Standard
Users
(n = 32)
Number of current Arrest Alerts**
0 arrest alerts 13% 35% 15%
1 - 5 arrest alerts 34% 37% 63%
6 - 20 arrest alerts 27% 11% 7%
21 or more arrest alerts
26% 17% 15%
Number of current Arrest Alerts added in the last six months*
0 arrest alerts 23% 46% 19%
1 - 5 arrest alerts 39% 37% 59%
6 - 20 arrest alerts 21% 11% 7%
21 or more arrest alerts 17% 7% 15%
Note: Table contains column percentages from a Chi square contingency table to allow comparisons across categories for each
item. +p < .10, * p < .05, ** p < .01, ***p < .001.

Chapter 5. Impact on Prosecution Outcomes Page 50
Chapter 5
Impact on Prosecution Outcomes
This chapter reports the impact of the Arrest Alert System on bail amounts, case processing,
dispositions, charge severity at disposition, and sentences, based on a quasi-experimental
analysis. In brief, arrest alerts are triggered when a priority offender is arrested, quickly
notifying interested parties of the crime information and facts of the arrest. Priority offenders
are generally, although not exclusively, individuals with a history of involvement in serious
or violent criminal activities (see Chapter 3). With increased information about criminal
associations available through notes in the Arrest Alert System and other CSU databases,
ADAs can justify more aggressive prosecution strategies, including higher bail requests
(though judges ultimately determine bail), fewer plea offers with a reduced charge severity,
and more and longer jail sentences.
The results reported in this chapter indicate that the Arrest Alert System successfully
identified high-stakes priority offenders: defendants involved in more serious and violent
criminal activity. The analysis also demonstrates that arrest alert cases were significantly
more likely to have bail set, averaged a significantly higher bail amount, were significantly
more likely to involve a felony (as opposed to a misdemeanor or lesser offense), and
produced longer times in custody if a judge imposed a jail or prison sentence. Most of the
effect sizes were modest in magnitude, but the presence of consistently expected and
significant effects suggests that, to a certain extent, IDPM’s impacts are already felt in cases
processed under the model to date.
As described in Chapter 2, we based results on a comparison of cases arraigned from May
2010 through the end of 2013. There were two comparison samples: (1) a contemporaneous
comparison composed of cases arraigned during the target period for which arrest alerts were
not triggered, and (2) a pre-implementation comparison of cases arraigned from January
2009 through April 2010, prior to the formal launch of the IDPM and CSU. All cases in the
analysis, both arrest alert and comparison cases, were arrested in Areas 2 or 3 of Manhattan
(see Figure 1.1). CSU staff thought this research design would be the most appropriate way
to assess the model.
Chapter 5. Impact on Prosecution Outcomes Page 51
Characteristics of Arrest Alert Cases
Table 5.1 compares the background characteristics of arrest alert cases with the background
characteristics of cases in the two comparison groups prior to the implementation of
statistical matching strategies. This particular comparison reveals how arrest alert targeted
cases differ from a general sample of criminal cases originating in the same areas of
Manhattan. Since CSU staff members indicated that the Arrest Alert System is intended (not
exclusively but for the most part) to target serious and violent offenders, we hypothesized
that prior to statistical adjustments, the arrest alert sample would have a more extensive and
serious criminal history than the comparison cases.
The findings in Table 5.1 provide strong confirmation for this hypothesis across all examined
measures. The arrest alert sample defendants had far lengthier and more serious criminal
histories than defendants in the comparison samples, and faced more serious criminal
charges in their current cases. These findings confirm that CSU reached its intended serious
offender population using the arrest alert process. For example, 93% of arrest alert
defendants had a prior arrest, whereas under half of the defendants in each of the comparison
groups had a prior arrest. One-quarter (25%) of arrest alert defendants had a prior violent
felony offense (VFO) arrest and 15% had a prior VFO conviction. In the two comparison
samples, only 5% had a prior VFO arrest and 2% had a prior VFO conviction. Twenty-four
percent of the defendants in the arrest alert sample had felony arraignment charges in the
instant case, compared to 14% of defendants in each of the two comparison samples.
Additional comparisons consistently revealed that priority offenders in the Arrest Alert
System had more serious prior criminal behavior or alleged current criminal behavior than
defendants in the comparison groups.
Having confirmed that arrest alert cases differed from potential comparison cases in the
manner hypothesized, we then refined the two comparison samples to preserve only those
comparison cases with background characteristics closely matching the arrest alert cases. As
described in Chapter 2, and further detailed in Appendix D, we implemented propensity
score matching techniques to properly conduct this analysis (Rosenbaum and Rubin 1983;
Rubin 1973). By the end of the propensity score matching process, 2,318 arrest alert cases
were matched on a one-to-one basis with exactly 2,318 cases from each of the two
comparison groups.

Chapter 5. Impact on Prosecution Outcomes Page 52
Table 5.1. Background Characteristics of Arrest Alert v. Comparisons
Sample Arrest Alert Pre-Comparison Contemporaneous
Comparison
N = 2,444 N = 35,366 N = 80,076
Demographic Background
Race/Ethnicity
Black, Non-Hispanic 63% 49%*** 46%***
Black, Hispanic 11% 9%*** 9%**
White, Non-Hispanic 3% 13%*** 14%***
White, Hispanic 22% 24%** 24%***
Asian/Pacific Islander 0% 4%*** 4%***
Other 0% 0%* 0%*
Gender *** ***
Male 96% 84% 84%
Female 4% 16% 16%
Age at arrest 29.12 34.74*** 34.63***
Criminal History
Any prior arrests (in Manhattan) 93% 48%*** 45%***
No. of prior arrests (in
Manhattan) 7.03 2.47*** 1.98***
Prior violation arrests 26% 12%*** 11%***
No. of prior violation arrests 0.86 0.31*** 0.24***
Prior misdemeanor arrests 81% 43%*** 39%***
No. of prior misdemeanor arrests 4.95 1.86*** 1.45***
Prior felony arrests 63% 19%*** 18%***
No. of prior felony arrests 1.2 0.3*** 0.28***
Prior violent felony arrests 25% 5%*** 5%***
No. of prior violent felony arrests 0.3 0.05*** 0.05***
Prior weapons arrests 15% 3%** 3%***
No. of prior weapons arrests 0.17 0.04*** 0.03***
Prior gun arrests 3% 0%*** 0%***
No. of prior gun arrests 0.03 0%*** 0%***
Prior drug arrests 41% 18%*** 15%***
No. of prior drug arrests 1.2 0.47*** 0.36***
Prior marijuana arrests 34% 10%*** 10%***
No. of prior marijuana arrests 0.84 0.17*** 0.16***
Prior convictions 93% 48%*** 45%***
No. of prior convictions 7.03 2.47*** 1.98***
Prior violation convictions 63% 27%*** 26%***
# prior violation convictions 1.83 0.6*** 0.54***

Chapter 5. Impact on Prosecution Outcomes Page 53
Sample Arrest Alerts Pre-Comparison Contemporaneous
Comparison
N = 2,444 N = 35,366 N = 80,076
Criminal History (continued)
Prior misdemeanor convictions 64% 33%*** 28%***
No. of prior misdemeanor
convictions 4.33 1.67*** 1.22***
Prior felony convictions 47% 12%*** 11%***
No. of prior felony convictions 0.67 0.14*** 0.15***
Prior violent felony convictions 15% 2%*** 2%***
No. of prior violent felony
convictions 0.16 0.02*** 0.02***
Prior weapons convictions 11% 3%*** 2%***
No. of prior weapons convictions 0.12 0.03*** 0.02***
Prior gun convictions 2% 0%*** 0%***
No. of prior gun convictions 0.02 0*** 0***
Prior drug convictions 37% 17%*** 13%***
No. of prior drug convictions 1.13 0.46*** 0.34***
Prior marijuana convictions 32% 9%*** 9%***
No. of prior marijuana
convictions 0.78 0.16*** 0.15***
Arraignment Year
Year of Arraignment
2009 0% 71%*** 0%***
2010 10% 26% 17%
2011 24% 0% 24%
2012 29% 0% 25%
2013 34% 0% 27%
2014 1% 0% 1%
2015 0% 0% 0%
Current Charge Severity *** ***
Felony 24% 14%*** 14%***
A Felony 0% 0% 0%+
B Felony 10% 3%*** 3%***
C Felony 4% 2%*** 2%***
D Felony 6% 5% 6%
E Felony 4% 3%+ 3%
Misdemeanor 54% 54% 51%+
A Misdemeanor 40% 38%* 36%**
B Misdemeanor 10% 7%*** 6%***
Misdemeanor Unspecified 4% 9%*** 9%***
Infraction / Violation / Traffic 19% 29%*** 29%***
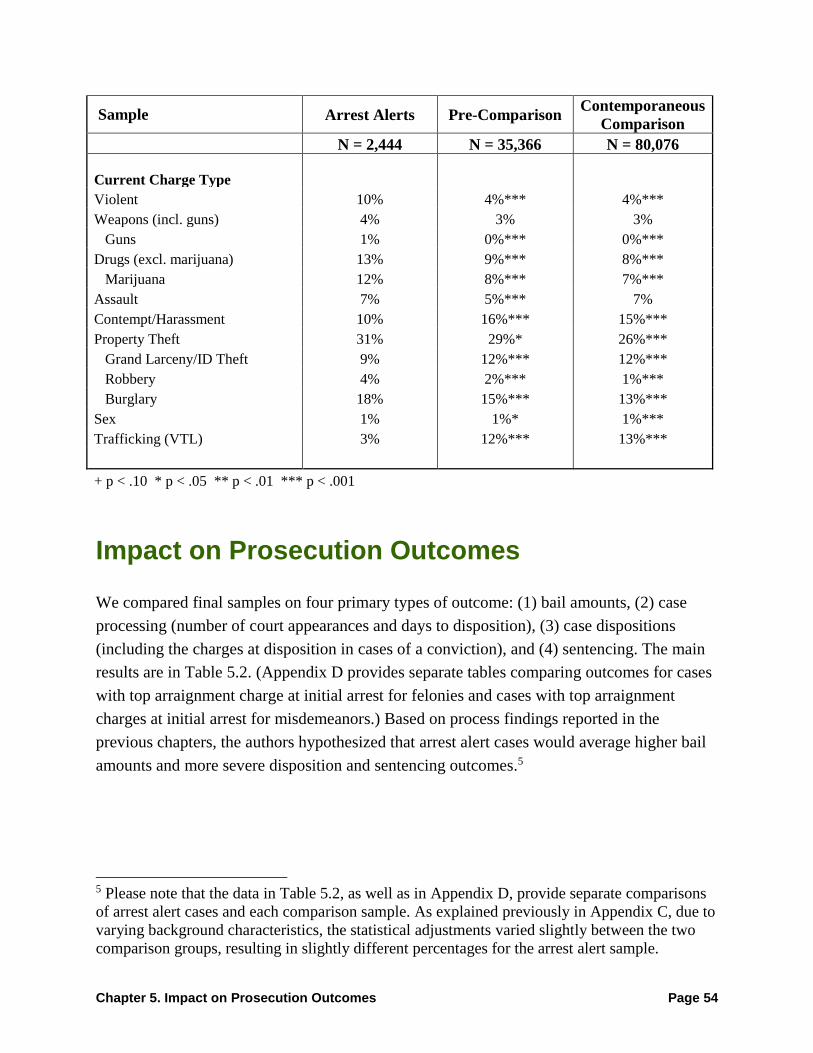
Chapter 5. Impact on Prosecution Outcomes Page 54
Sample Arrest Alerts Pre-Comparison Contemporaneous
Comparison
N = 2,444 N = 35,366 N = 80,076
Current Charge Type
Violent 10% 4%*** 4%***
Weapons (incl. guns) 4% 3% 3%
Guns 1% 0%*** 0%***
Drugs (excl. marijuana) 13% 9%*** 8%***
Marijuana 12% 8%*** 7%***
Assault 7% 5%*** 7%
Contempt/Harassment 10% 16%*** 15%***
Property Theft 31% 29%* 26%***
Grand Larceny/ID Theft 9% 12%*** 12%***
Robbery 4% 2%*** 1%***
Burglary 18% 15%*** 13%***
Sex 1% 1%* 1%***
Trafficking (VTL) 3% 12%*** 13%***
+ p < .10 * p < .05 ** p < .01 *** p < .001
Impact on Prosecution Outcomes
We compared final samples on four primary types of outcome: (1) bail amounts, (2) case
processing (number of court appearances and days to disposition), (3) case dispositions
(including the charges at disposition in cases of a conviction), and (4) sentencing. The main
results are in Table 5.2. (Appendix D provides separate tables comparing outcomes for cases
with top arraignment charge at initial arrest for felonies and cases with top arraignment
charges at initial arrest for misdemeanors.) Based on process findings reported in the
previous chapters, the authors hypothesized that arrest alert cases would average higher bail
amounts and more severe disposition and sentencing outcomes.5
5 Please note that the data in Table 5.2, as well as in Appendix D, provide separate comparisons
of arrest alert cases and each comparison sample. As explained previously in Appendix C, due to
varying background characteristics, the statistical adjustments varied slightly between the two
comparison groups, resulting in slightly different percentages for the arrest alert sample.
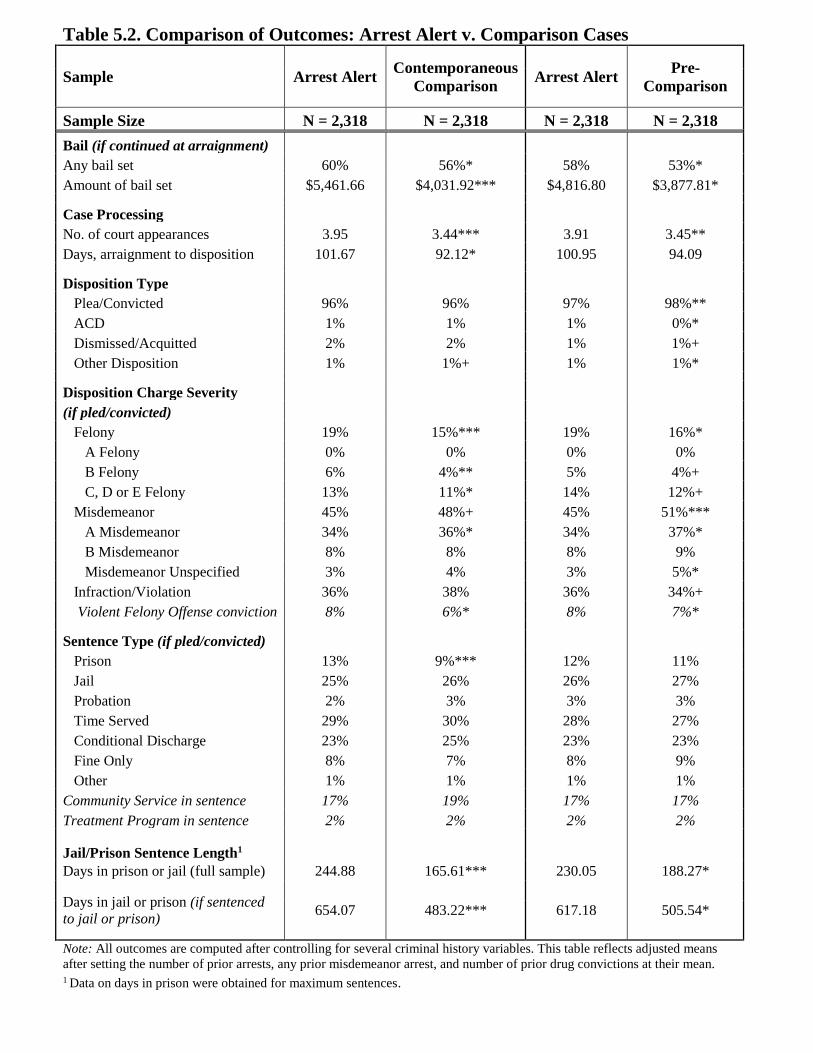
Table 5.2. Comparison of Outcomes: Arrest Alert v. Comparison Cases
Sample Arrest Alert Contemporaneous
Comparison Arrest Alert
Pre-
Comparison
Sample Size N = 2,318 N = 2,318 N = 2,318 N = 2,318
Bail (if continued at arraignment)
Any bail set 60% 56%* 58% 53%*
Amount of bail set $5,461.66 $4,031.92*** $4,816.80 $3,877.81*
Case Processing
No. of court appearances 3.95 3.44*** 3.91 3.45**
Days, arraignment to disposition 101.67 92.12* 100.95 94.09
Disposition Type
Plea/Convicted 96% 96% 97% 98%**
ACD 1% 1% 1% 0%*
Dismissed/Acquitted 2% 2% 1% 1%+
Other Disposition 1% 1%+ 1% 1%*
Disposition Charge Severity
(if pled/convicted)
Felony 19% 15%*** 19% 16%*
A Felony 0% 0% 0% 0%
B Felony 6% 4%** 5% 4%+
C, D or E Felony 13% 11%* 14% 12%+
Misdemeanor 45% 48%+ 45% 51%***
A Misdemeanor 34% 36%* 34% 37%*
B Misdemeanor 8% 8% 8% 9%
Misdemeanor Unspecified 3% 4% 3% 5%*
Infraction/Violation 36% 38% 36% 34%+
Violent Felony Offense conviction 8% 6%* 8% 7%*
Sentence Type (if pled/convicted)
Prison 13% 9%*** 12% 11%
Jail 25% 26% 26% 27%
Probation 2% 3% 3% 3%
Time Served 29% 30% 28% 27%
Conditional Discharge 23% 25% 23% 23%
Fine Only 8% 7% 8% 9%
Other 1% 1% 1% 1%
Community Service in sentence 17% 19% 17% 17%
Treatment Program in sentence 2% 2% 2% 2%
Jail/Prison Sentence Length1
Days in prison or jail (full sample) 244.88 165.61*** 230.05 188.27*
Days in jail or prison (if sentenced
to jail or prison) 654.07 483.22*** 617.18 505.54*
Note: All outcomes are computed after controlling for several criminal history variables. This table reflects adjusted means
after setting the number of prior arrests, any prior misdemeanor arrest, and number of prior drug convictions at their mean. 1 Data on days in prison were obtained for maximum sentences.
Chapter 5. Impact on Prosecution Outcomes Page 56
Among cases continued at arraignment, more than half of all samples had bail set, reflecting
the high-risk nature of the defendant populations. Arrest alert defendants were modestly, but
significantly, more likely to have bail set than comparison group defendants (a 4 or 5
percentage-point difference). In cases where the judge set bail, the bail amount was
significantly higher in arrest alert cases.
Arrest alert cases averaged modestly but significantly more court appearances than cases in
either comparison sample; and averaged significantly more days to disposition than both
comparison groups, though only reached statistical significance when compared to the
contemporaneous group. Though we had not hypothesized a case processing effect, it is
possible arrest alert cases were prosecuted more aggressively because defendants were
identified as priority offenders, which resulted in a modest but significant increase in court
appearances and processing time. This conclusion is, of course, merely speculative on our
part.
Case defendants in all samples were overwhelmingly likely to plead guilty or be convicted
on their instant case (at least 96% for all samples), presumably reflecting the severity of the
charges and criminal histories involved in nearly all of the sampled cases. Results point to a
modest but significantly greater likelihood of a felony-level conviction charge, instead of a
misdemeanor or violation level conviction, in arrest alert cases (19% vs. 15% or 16% in the
comparison groups). In misdemeanor arraignments (see Appendix D), arrest alert cases were
significantly more likely to be disposed at the original misdemeanor level than be disposed at
a lesser violation level.
The only significant difference in sentencing outcomes was an increase in the frequency of
prison sentences in arrest alert cases compared to cases in the contemporaneous comparison
sample. This one significant effect, demonstrating more severe sentencing outcomes for
arrest alert cases, was expected. Such an effect did not appear between the arrest alert cases
and the cases in the pre-implementation comparison sample. In felony cases (see Appendix
D), arrest alert defendants’ prison sentences were 9% longer than sentences for defendants in
the contemporaneous comparison group and 5% longer than sentences for defendants in the
pre-implementation comparison group (the latter comparison did not reach statistical
significance).
Finally, when all sampled cases were evaluated, arrest alert cases averaged significantly
more days sentenced to incarceration than cases in either the contemporaneous comparison
sample (245 v. 166 days) or cases in the pre-implementation comparison sample (320 v. 188

Chapter 5. Impact on Prosecution Outcomes Page 57
days). Among the subsamples of cases that were actually sentenced to jail or prison, the
average sentence length for those cases was also significantly greater among arrest alert
cases than those in the contemporaneous comparison sample (654 v. 483 days) and the pre
comparison sample (617 v. 506 days). These findings confirm expectations.
Chapter 6. Conclusions Page 58
Chapter 6
Conclusion
The District Attorney’s Office of New York (DANY) implemented a highly sophisticated
strategy known as the Intelligence-Driven Prosecution Model (IDPM). Though elements of
the model had been in place previously, the IDPM emerged as a fully institutionalized part of
DANY’s fabric when District Attorney Cyrus Vance Jr. established the Crime Strategies
Unit (CSU) in 2010.
The model encompasses a large number of components, strategies, and tools, but several
particularly significant innovations include:
The model extends community prosecution principles through a neighborhood focus,
while simultaneously expanding the initiative city-wide. In short, by dividing
Manhattan into five geographic areas, DANY created an initiative that is both
countywide and neighborhood-specific.
The IDPM zeroes in on specific problem individuals who are key drivers of crime at
the police precinct level. The initiative is rigorous and gathers intelligence that is
specific to individual persons and places.
The model collaborates with law enforcement and community partners. The IDPM
collects intelligence in tandem with the New York Police Department (and local
police precincts), while also working with community representatives.
The IDPM utilizes advanced technology, including but not limited to the Arrest Alert
System that houses important information about crime problems, criminal behavior,
and the associates of crime drivers in each neighborhood. The IDPM uses technology
to facilitate communication throughout the office and enhances the effective
communication of the intelligence.
Alongside the IDPM, DANY established the Crime Strategies Unit (CSU) to oversee
and coordinate all aspects of the model and its implementation.
During the past six months, 61% of responding assistant district attorneys (ADAs) reported
that CSU contacted them to provide information, and 70% reported that they reached out to
CSU for intelligence related to their case. Analysis identified four groups of ADAs who
differed in their contact with CSU: one-way communication (originating either from CSU or
from the ADA but not both), two-way communication, and no communication. These four
groups used CSU information to guide their decision-making in distinct ways. ADAs who
experienced two-way communication (47%) or who were contacted by CSU (14%) weighed

Chapter 6. Conclusions Page 59
the intelligence more heavily in their decision-making compared to ADAs who first initiated
contact with CSU (23%).
To interpret these findings, one must fully understand the role CSU plays as a centralized
intelligence unit. If new intelligence relates to a known crime driver, CSU staff will actively
push out that information to ADAs assigned to the crime driver’s case. This process means
CSU staff interact with the ADAs prosecuting cases associated with priority individuals at a
higher rate than ADAs working on non-priority offender cases- this information is also more
likely to influence an ADAs decision-making. All ADAs may reach out to CSU if they
require further information on any aspect of their case; while CSU will provide any known
information, this intelligence may be more generalized and, therefore, less likely to influence
an ADAs prosecutorial decision-making. As a whole, although a communication survey did
not reveal universal engagement with information originating from CSU and its many
technological resources, or reveal that ADAs acted on CSU information in all cases, the
results clearly show that a meaningful level of engagement takes place.
An impact analysis detected modest but statistically significant effects of the AAS on certain
prosecutorial decisions, such as whether bail is set, bail amounts, charge severity at
disposition, and sentence type and length. A particularly notable effect was that arrest alert
defendants sentenced to jail or prison served an average of 100 days longer than defendants
in either matched comparison sample. While these results demonstrate the impact arrest
alerts can have on case outcomes, this study did not measure the IDPM’s long-term effects
on both individual defendants and communities; these results, therefore, remain unknown.6
The immediate potential of the model is clear, however: the IDPM produces and distributes
more comprehensive intelligence to prosecutors. Moreover, other prosecutorial offices
seeking a 21st century solution to pressing crime problem should consider replicating the
IDPM’s robust formalization, quality implementation, and unique approach to criminal
justice.
6 Prior research (Listwan et al. 2013; Loeffler 2013; Lowenkamp et al. 2013; and Rempel et al.
2016) does not generally indicate that additional periods of incarceration impacts longer-term
crime reduction efforts, including recidivism. However, previous research has not exclusively
focused on primary crime drivers, and given the unique elements of the IDPM model, it cannot
be ruled out that such effects or other longer-term changes may take place.
References Page 60
References
Boland, B. 1998a. “The Manhattan Experiment” in Crime and Place: Plenary Papers of the
1997 Conference on Criminal Justice Research and Evaluation. Washington, D.C.: U.S.
Department of Justice, National Institute of Justice.
Boland, B. 1998b. “Community Prosecution: Portland’s Experience” in Community Justice,
ed. David Karp. Lanham, Maryland: Rowman & Littlefield.
Boland, B. 2001. Community Prosecution in Washington, D.C.: The U.S. Attorney’s Fifth
District Pilot Project. Washington, D.C.: U.S. Department of Justice, National Institute of
Justice.
Boland, B. 2007. The Response of Multnomah County to Neighborhood Crime: 1990-2005.
Alexandria, VA: American Prosecutors Research Institute.
Coles, C. M. 2000. Community Prosecution, Problem Solving, and Public Accountability:
The Evolving Strategy of the American Prosecutor. Working Paper #00-02-04. Program in
Criminal Justice Policy and Management of the Malcolm Wiener Center for Social Policy,
John F. Kennedy School of Government, Harvard University.
Coles, C. M., and Kelling, G. L., with Moore, M. H. 1998. Prosecution in the Community: A
Study of Emergent Strategies. Cambridge, MA: John F. Kennedy School of Government,
Harvard University.
Goldkamp, J. S., Irons-Guynn, C., and Weiland, D. 2003. Community Prosecution
Strategies. Washington, D.C.: Bureau of Justice Assistance.
Listwan, S. J., Sullivan, C., Agnew, R., Cullen, F. T., and Colvin, M. (2013). “The Pains of
Imprisonment Revisited: The Impact of Strain on Inmate Recidivism.” Justice Quarterly30:
1: 144-167.
Lee, C.G., Cheesman, F., Rottman, D., Swaner, R., Lambson, S. H., Rempel M., and Curtis,
R. 2013. A Community Court Grows in Brooklyn: A Comprehensive Evaluation of the Red
Hook Community Justice Center. Williamsburg VA: National Center for State Courts.
Loeffler, C. E. (2013). “Does Imprisonment Alter the Life Course? Evidence on Crime and
Employment from a Natural Experiment.” Criminology 51: 1: 137-167.
Lowenkamp, C., VanNostrand, M., and Holsinger, A. (2013a). The Hidden Costs of Pretrial
Detention. Houston, Texas: The Laura and John Arnold Foundation.
References Page 61
National District Attorneys Association (NDAA). 2009. Key Principles of Community
Prosecution. Washington, D.C.: Bureau of Justice Assistance. Retrieved from:
http://www.ndaa.org/apri/programs/community_pros/final_key_principles_updated_jan_200
9.pdf
Nugent, E. 2004. The Changing Nature of Prosecution: Community Prosecution vs.
Traditional Prosecution Approaches. Alexandria, VA: American Prosecutors Research
Institute.
Nugent, E., and Rainville, G. A. 2001. “The State of Community Prosecution: Results from a
National Survey.” The Prosecutor (March/April): 36-33.
Rempel, M., Kerodal, A., Spadafore, J., and Mai, C. (2016). Jail in New York City:
Evidence-Based Opportunities for Reform. New York, NY: Center for Court Innovation.
Rosenbaum, P. R. and Rubin, D. B. 1983. “The Central Role of the Propensity Score in
Observational Studies for Causal Effects.” Biometrika 70: 1: 41-55.
Rubin, D.B. 1973. “The Use of Matched Sampling and Regression Adjustment to Remove
Bias in Observational Studies.” Biometrics 29: 1: 184-203.
Stone, C., and Turner, N. 1999. Politics, Public Service, and Professionalism: Conflicting
Themes in the Invention and Evaluation of Community Prosecution. New York, NY: Vera
Institute of Justice.
Thompson, A. C., and Wolf, R. V. 2004. The Prosecutor as Problem-Solver: An Overview of
Community Prosecution: A Workshop for Prosecutors: Teacher’s Guide. New York, NY:
Center for Court Innovation.
Wilson, J. Q., and Kelling, G. L. 1982. “Broken Windows.” Atlantic Monthly (March): 29-
37.
Wolf, R. V. 2006. “Community Justice around the Globe: An International Overview.”
Crime and Justice International 22: 93: 4-22.
Wolf, R. V., and Worrall, J. L. 2004. Lessons from the Field: Ten Community Prosecution
Leadership Profiles. Alexandria, VA: American Prosecutors Research Institute.

Appendix A. Survey Instrument Page 62
Appendix A
Survey Instrument
District Attorney of New York County
Intelligence Driven Prosecution Survey 2015
With funding from the Bureau of Justice Assistance, the New York County District
Attorney’s Office is working with the Association of Prosecuting Attorneys and the Center for
Court Innovation to conduct an evaluation of the Office’s Intelligence-Driven Prosecution Model.
This evaluation focuses on the Office’s Arrest Alert System and aims to develop a program and
tools to support this model’s replication in other jurisdictions.
The purpose of this survey is to collect information regarding how ADAs and others use the
Arrest Alert System and its related resources, and how this information sharing affects decision-
making. Your responses will provide valuable feedback as to how the current system is utilized and
can help improve the Office’s ability to provide appropriate resources to ADAs in the prosecution
of their cases.
All information is anonymous. Responses will be collected, tabulated, and analyzed by the
Center for Court Innovation and included in a summary report. Individual responses will not be
disclosed. If you have any questions about this survey, please contact the Center for Court
Innovation.
Respondent Information
1. What is your current position in the Manhattan District Attorney’s Office?
Assistant District Attorney, Trial Preparation Assistant, Analyst/Tech Analyst
2. How long have you worked in this position? ____years (drop down)
<1,2,3,4,5,6,7,8,9,10+
3. In the past 6 months, have you been assigned to ECAB (excluding supervisor shifts)?
Yes, No, NA (I am not an ADA)
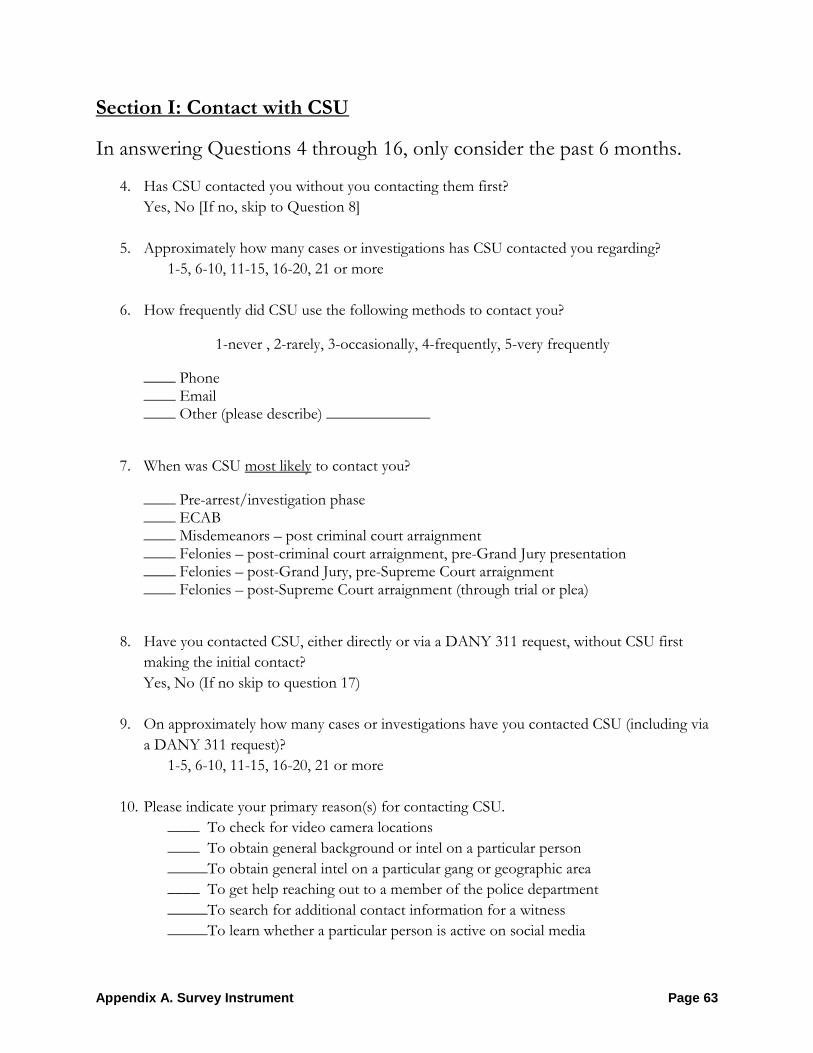
Appendix A. Survey Instrument Page 63
Section I: Contact with CSU
In answering Questions 4 through 16, only consider the past 6 months.
4. Has CSU contacted you without you contacting them first?
Yes, No [If no, skip to Question 8]
5. Approximately how many cases or investigations has CSU contacted you regarding?
1-5, 6-10, 11-15, 16-20, 21 or more
6. How frequently did CSU use the following methods to contact you?
1-never , 2-rarely, 3-occasionally, 4-frequently, 5-very frequently
____ Phone ____ Email ____ Other (please describe) _____________
7. When was CSU most likely to contact you?
____ Pre-arrest/investigation phase ____ ECAB ____ Misdemeanors – post criminal court arraignment ____ Felonies – post-criminal court arraignment, pre-Grand Jury presentation ____ Felonies – post-Grand Jury, pre-Supreme Court arraignment ____ Felonies – post-Supreme Court arraignment (through trial or plea)
8. Have you contacted CSU, either directly or via a DANY 311 request, without CSU first
making the initial contact?
Yes, No (If no skip to question 17)
9. On approximately how many cases or investigations have you contacted CSU (including via
a DANY 311 request)?
1-5, 6-10, 11-15, 16-20, 21 or more
10. Please indicate your primary reason(s) for contacting CSU.
____ To check for video camera locations
____ To obtain general background or intel on a particular person
_____To obtain general intel on a particular gang or geographic area
____ To get help reaching out to a member of the police department
_____To search for additional contact information for a witness
_____To learn whether a particular person is active on social media
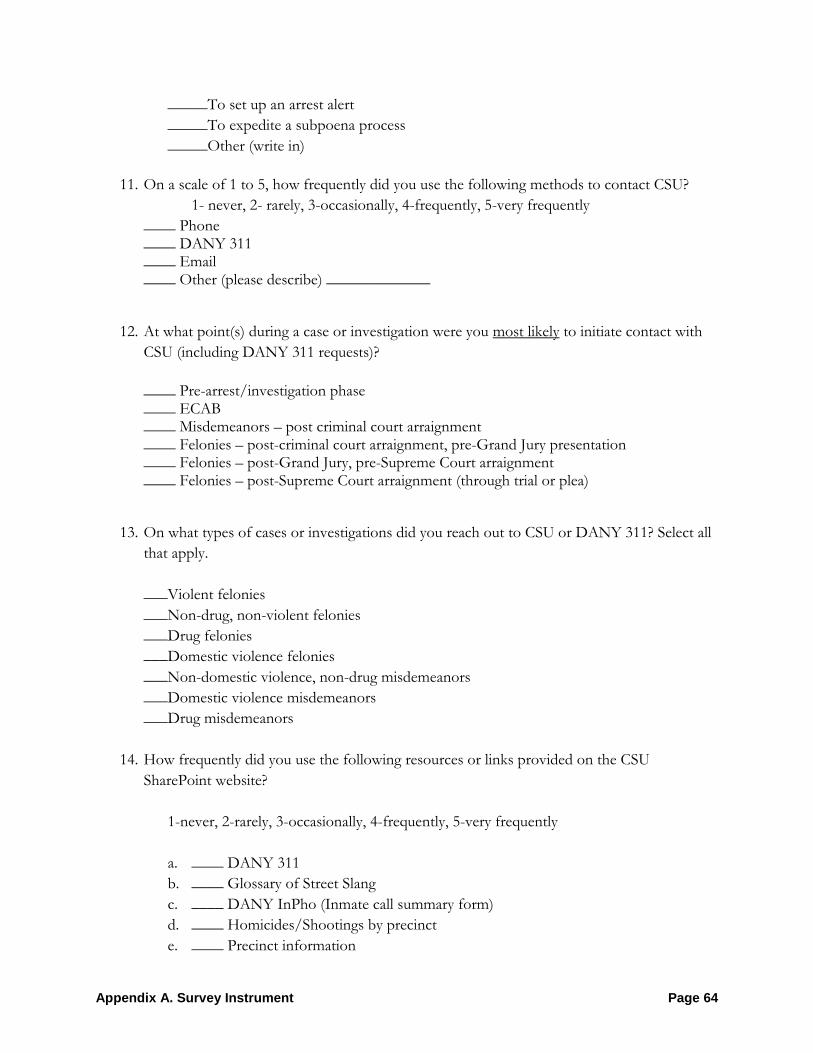
Appendix A. Survey Instrument Page 64
_____To set up an arrest alert
_____To expedite a subpoena process
_____Other (write in)
11. On a scale of 1 to 5, how frequently did you use the following methods to contact CSU?
1- never, 2- rarely, 3-occasionally, 4-frequently, 5-very frequently
____ Phone ____ DANY 311 ____ Email ____ Other (please describe) _____________
12. At what point(s) during a case or investigation were you most likely to initiate contact with
CSU (including DANY 311 requests)?
____ Pre-arrest/investigation phase ____ ECAB ____ Misdemeanors – post criminal court arraignment ____ Felonies – post-criminal court arraignment, pre-Grand Jury presentation ____ Felonies – post-Grand Jury, pre-Supreme Court arraignment ____ Felonies – post-Supreme Court arraignment (through trial or plea)
13. On what types of cases or investigations did you reach out to CSU or DANY 311? Select all
that apply.
___Violent felonies
___Non-drug, non-violent felonies
___Drug felonies
___Domestic violence felonies
___Non-domestic violence, non-drug misdemeanors
___Domestic violence misdemeanors
___Drug misdemeanors
14. How frequently did you use the following resources or links provided on the CSU
SharePoint website?
1-never, 2-rarely, 3-occasionally, 4-frequently, 5-very frequently
a. ____ DANY 311
b. ____ Glossary of Street Slang
c. ____ DANY InPho (Inmate call summary form)
d. ____ Homicides/Shootings by precinct
e. ____ Precinct information
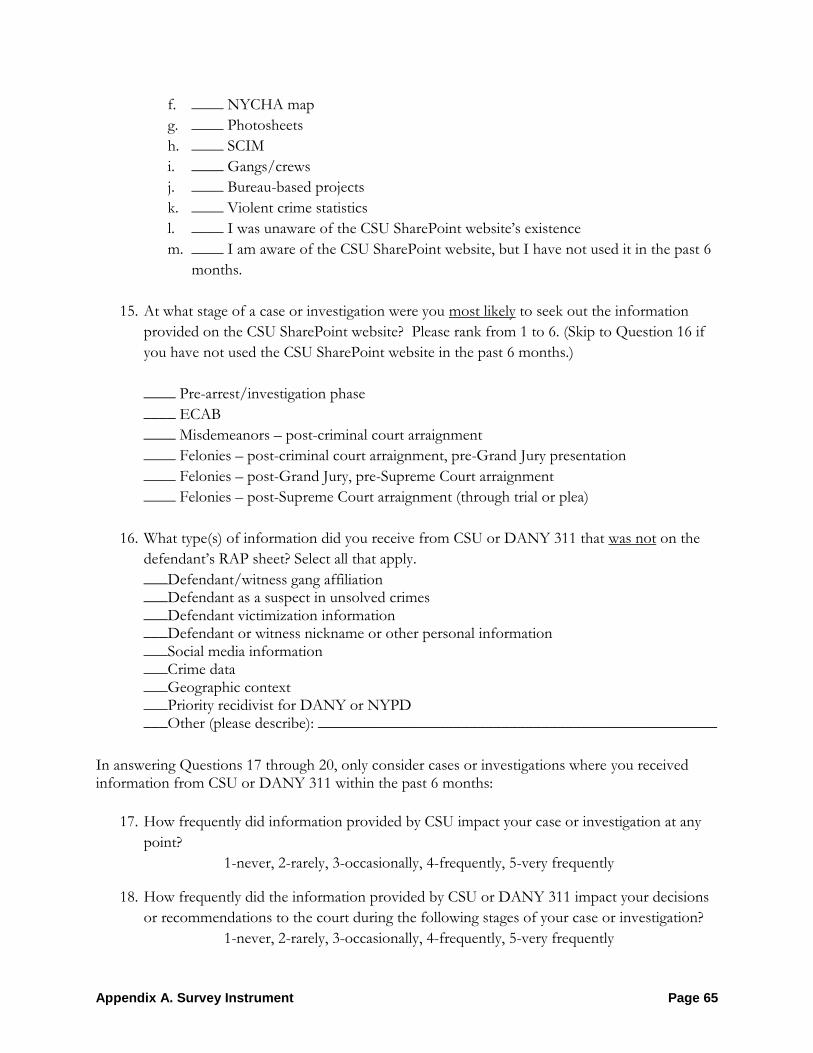
Appendix A. Survey Instrument Page 65
f. ____ NYCHA map
g. ____ Photosheets
h. ____ SCIM
i. ____ Gangs/crews
j. ____ Bureau-based projects
k. ____ Violent crime statistics
l. ____ I was unaware of the CSU SharePoint website’s existence
m. ____ I am aware of the CSU SharePoint website, but I have not used it in the past 6
months.
15. At what stage of a case or investigation were you most likely to seek out the information
provided on the CSU SharePoint website? Please rank from 1 to 6. (Skip to Question 16 if
you have not used the CSU SharePoint website in the past 6 months.)
____ Pre-arrest/investigation phase
____ ECAB
____ Misdemeanors – post-criminal court arraignment
____ Felonies – post-criminal court arraignment, pre-Grand Jury presentation
____ Felonies – post-Grand Jury, pre-Supreme Court arraignment
____ Felonies – post-Supreme Court arraignment (through trial or plea)
16. What type(s) of information did you receive from CSU or DANY 311 that was not on the
defendant’s RAP sheet? Select all that apply.
___Defendant/witness gang affiliation ___Defendant as a suspect in unsolved crimes ___Defendant victimization information ___Defendant or witness nickname or other personal information ___Social media information ___Crime data ___Geographic context ___Priority recidivist for DANY or NYPD ___Other (please describe): __________________________________________________
In answering Questions 17 through 20, only consider cases or investigations where you received information from CSU or DANY 311 within the past 6 months:
17. How frequently did information provided by CSU impact your case or investigation at any
point?
1-never, 2-rarely, 3-occasionally, 4-frequently, 5-very frequently
18. How frequently did the information provided by CSU or DANY 311 impact your decisions
or recommendations to the court during the following stages of your case or investigation?
1-never, 2-rarely, 3-occasionally, 4-frequently, 5-very frequently
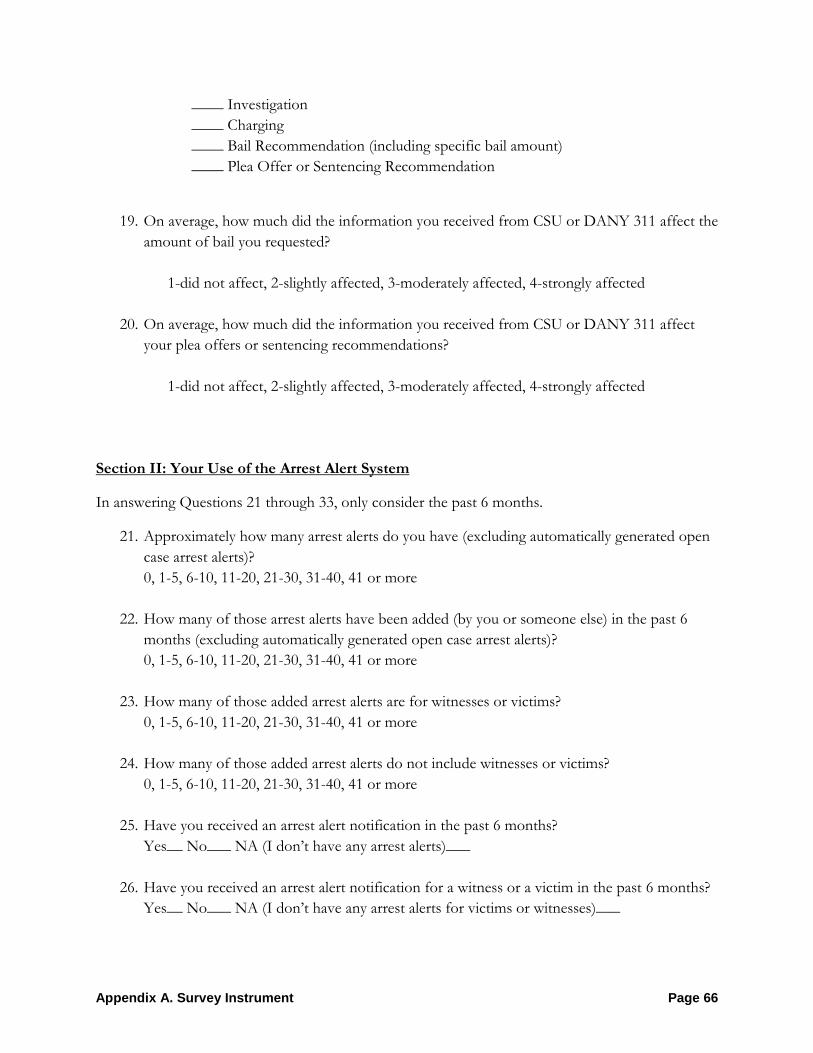
Appendix A. Survey Instrument Page 66
____ Investigation
____ Charging
____ Bail Recommendation (including specific bail amount)
____ Plea Offer or Sentencing Recommendation
19. On average, how much did the information you received from CSU or DANY 311 affect the
amount of bail you requested?
1-did not affect, 2-slightly affected, 3-moderately affected, 4-strongly affected
20. On average, how much did the information you received from CSU or DANY 311 affect
your plea offers or sentencing recommendations?
1-did not affect, 2-slightly affected, 3-moderately affected, 4-strongly affected
Section II: Your Use of the Arrest Alert System
In answering Questions 21 through 33, only consider the past 6 months.
21. Approximately how many arrest alerts do you have (excluding automatically generated open
case arrest alerts)?
0, 1-5, 6-10, 11-20, 21-30, 31-40, 41 or more
22. How many of those arrest alerts have been added (by you or someone else) in the past 6
months (excluding automatically generated open case arrest alerts)?
0, 1-5, 6-10, 11-20, 21-30, 31-40, 41 or more
23. How many of those added arrest alerts are for witnesses or victims?
0, 1-5, 6-10, 11-20, 21-30, 31-40, 41 or more
24. How many of those added arrest alerts do not include witnesses or victims?
0, 1-5, 6-10, 11-20, 21-30, 31-40, 41 or more
25. Have you received an arrest alert notification in the past 6 months?
Yes__ No___ NA (I don’t have any arrest alerts)___
26. Have you received an arrest alert notification for a witness or a victim in the past 6 months?
Yes__ No___ NA (I don’t have any arrest alerts for victims or witnesses)___

Appendix A. Survey Instrument Page 67
27. Please rank your primary reasons for creating an arrest alert for a witness or a victim.
___ Giglio reasons (i.e., to ensure that you are informed if a witness or a victim with
a prior criminal history is re-arrested.)
___ To attempt to locate a missing witness or victim and/or to produce a witness or
a victim for a court appearance.
___ Other (write in)______
28. Has another ADA reached out to you regarding an arrest alert that you created?
Yes __ No ___ NA (I have not created an arrest alert)__
29. When you are drafting a felony case in ECAB, do you routinely check to see whether an
arrest alert for that defendant exists?
Yes___ No___ NA (I do not draft felony cases)___ NA (I have not been in ECAB in the
past 6 months)___
30. When you are drafting a misdemeanor in ECAB, do you routinely check to see whether an
arrest alert for that defendant exists?
Yes___ No___ NA (I have not been in ECAB in the past 6 months)__
31. While in ECAB, approximately how many times has someone reached out to you regarding
an existing arrest alert before or while you are drafting the case associated with that alert?
NA (I have not been in ECAB in the last 6 months)
0,1-5, 6-10, 11-20, 21-30, 31-40, 41 or more
32. How many times have you found the information contained in an arrest alert useful while
you were drafting a case in ECAB?
NA (I have not been in ECAB in the last 6 months)
0, 1-5, 6-10, 11-15, 16-20, 21 or more
33. Approximately how many times has the Arrest Alert System caused you to take an
investigative step that you would not have otherwise taken (i.e., reach out to a police officer,
reach out to another ADA, reach out to a defense attorney, attempt to take a statement or
debrief the defendant)?
0, 1-5, 6-10, 11-15, 16-20, 21 or more
Section III: Suggestions
34. Do you have any suggestions about how the office’s Intelligence-Driven Prosecution Model,
CSU, or the Arrest Alert System can be of additional value?
Thank you for your cooperation!
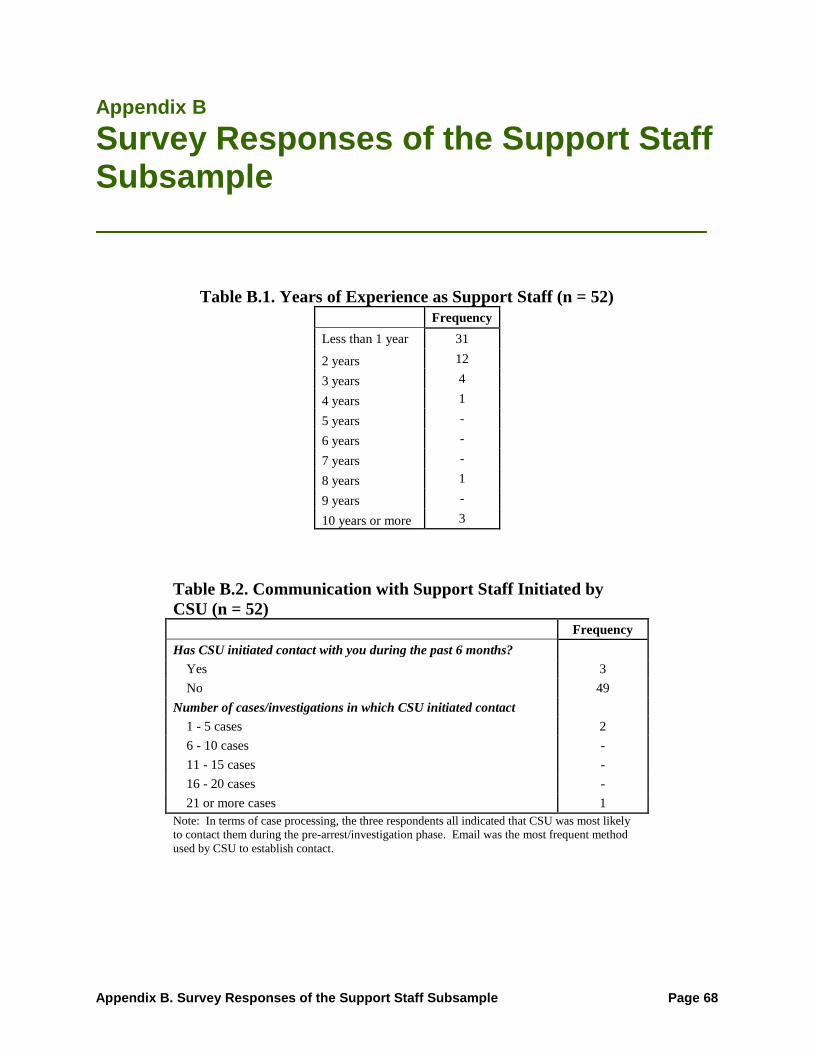
Appendix B. Survey Responses of the Support Staff Subsample Page 68
Appendix B
Survey Responses of the Support Staff Subsample
Table B.1. Years of Experience as Support Staff (n = 52)
Frequency
Less than 1 year 31
2 years 12
3 years 4
4 years 1
5 years -
6 years -
7 years -
8 years 1
9 years -
10 years or more 3
Table B.2. Communication with Support Staff Initiated by
CSU (n = 52)
Frequency
Has CSU initiated contact with you during the past 6 months?
Yes 3
No 49
Number of cases/investigations in which CSU initiated contact
1 - 5 cases 2
6 - 10 cases -
11 - 15 cases -
16 - 20 cases -
21 or more cases 1
Note: In terms of case processing, the three respondents all indicated that CSU was most likely
to contact them during the pre-arrest/investigation phase. Email was the most frequent method
used by CSU to establish contact.

Appendix B. Survey Responses of the Support Staff Subsample Page 69
Table B.3. Communication with CSU Initiated by Support Staff (n = 52)
Frequency
Have you initiated contact with CSU during the past 6 months?
Yes 30
No 22
Number of cases/investigations in which you initiated contact with CSU
1 - 5 cases 18
6 - 10 cases 2
11 - 15 cases 3
16 - 20 cases 1
21 or more cases 2
Table B.4. Communicative Exchange Between CSU and Support Staff (n = 52)
Frequency
Prime communication (CSU and TPA/A/TA regularly communicate) 3
Proactive ADA communication (only TPA/A/TA initiates communication) 27
Standard CSU communication (only CSU initiates communication) -
Suboptimal communication (neither party initiates communication) 22
Table B.5. Primary Reasons Support Staff Contacted CSU (n = 30)
Reason Frequency
Check for video camera locations 16
Obtain general background intelligence on a particular person 13
Obtain general intelligence on a particular gang or geographic area 11
Learn whether a particular person is active on social media 9
Search for additional contact information for a witness 7
Set up an arrest alert 6
Other 4
Get help reaching out to a member of the police department 2
Expedite a subpoena process 1
Note: Frequencies sum to more than n = 30 because respondents could check all that
applied.
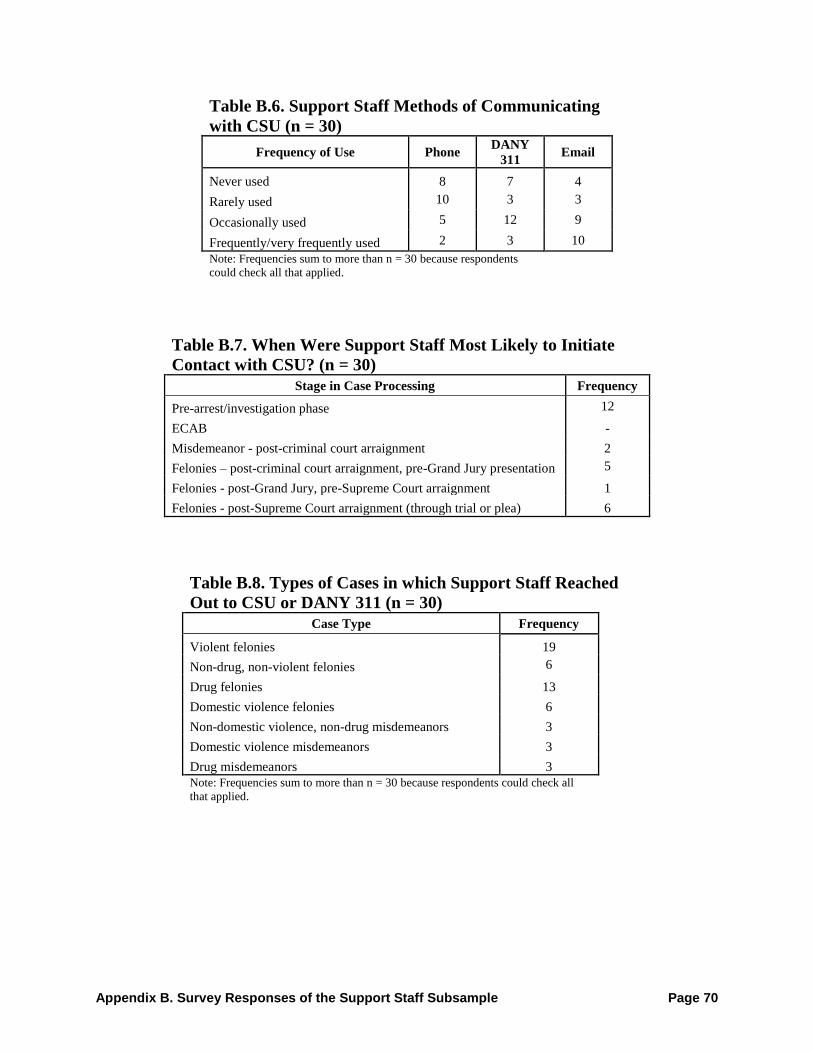
Appendix B. Survey Responses of the Support Staff Subsample Page 70
Table B.6. Support Staff Methods of Communicating
with CSU (n = 30)
Frequency of Use Phone DANY
311 Email
Never used 8 7 4
Rarely used 10 3 3
Occasionally used 5 12 9
Frequently/very frequently used 2 3 10
Note: Frequencies sum to more than n = 30 because respondents
could check all that applied.
Table B.7. When Were Support Staff Most Likely to Initiate
Contact with CSU? (n = 30)
Stage in Case Processing Frequency
Pre-arrest/investigation phase 12
ECAB -
Misdemeanor - post-criminal court arraignment 2
Felonies – post-criminal court arraignment, pre-Grand Jury presentation 5
Felonies - post-Grand Jury, pre-Supreme Court arraignment 1
Felonies - post-Supreme Court arraignment (through trial or plea) 6
Table B.8. Types of Cases in which Support Staff Reached
Out to CSU or DANY 311 (n = 30)
Case Type Frequency
Violent felonies 19
Non-drug, non-violent felonies 6
Drug felonies 13
Domestic violence felonies 6
Non-domestic violence, non-drug misdemeanors 3
Domestic violence misdemeanors 3
Drug misdemeanors 3
Note: Frequencies sum to more than n = 30 because respondents could check all
that applied.
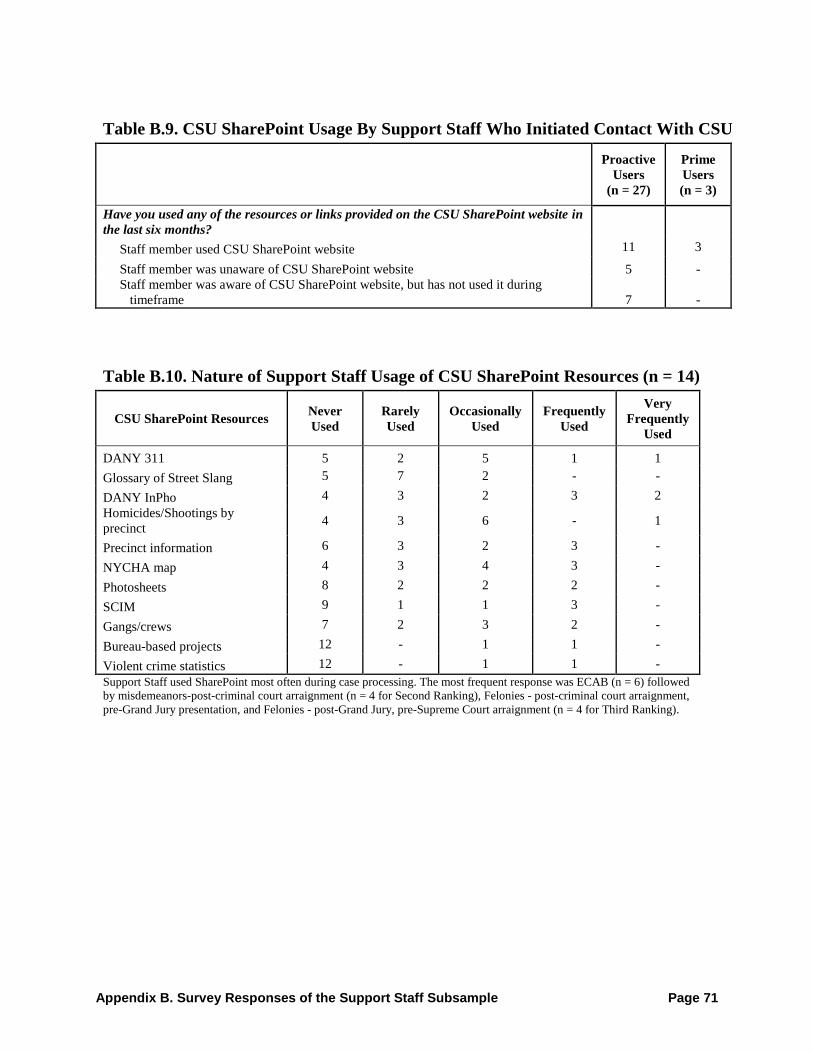
Appendix B. Survey Responses of the Support Staff Subsample Page 71
Table B.9. CSU SharePoint Usage By Support Staff Who Initiated Contact With CSU
Proactive
Users
(n = 27)
Prime
Users
(n = 3)
Have you used any of the resources or links provided on the CSU SharePoint website in
the last six months?
Staff member used CSU SharePoint website 11 3
Staff member was unaware of CSU SharePoint website 5 -
Staff member was aware of CSU SharePoint website, but has not used it during
timeframe 7 -
Table B.10. Nature of Support Staff Usage of CSU SharePoint Resources (n = 14)
CSU SharePoint Resources Never
Used
Rarely
Used
Occasionally
Used
Frequently
Used
Very
Frequently
Used
DANY 311 5 2 5 1 1
Glossary of Street Slang 5 7 2 - -
DANY InPho 4 3 2 3 2
Homicides/Shootings by
precinct 4 3 6 - 1
Precinct information 6 3 2 3 -
NYCHA map 4 3 4 3 -
Photosheets 8 2 2 2 -
SCIM 9 1 1 3 -
Gangs/crews 7 2 3 2 -
Bureau-based projects 12 - 1 1 -
Violent crime statistics 12 - 1 1 -
Support Staff used SharePoint most often during case processing. The most frequent response was ECAB (n = 6) followed
by misdemeanors-post-criminal court arraignment (n = 4 for Second Ranking), Felonies - post-criminal court arraignment,
pre-Grand Jury presentation, and Felonies - post-Grand Jury, pre-Supreme Court arraignment (n = 4 for Third Ranking).
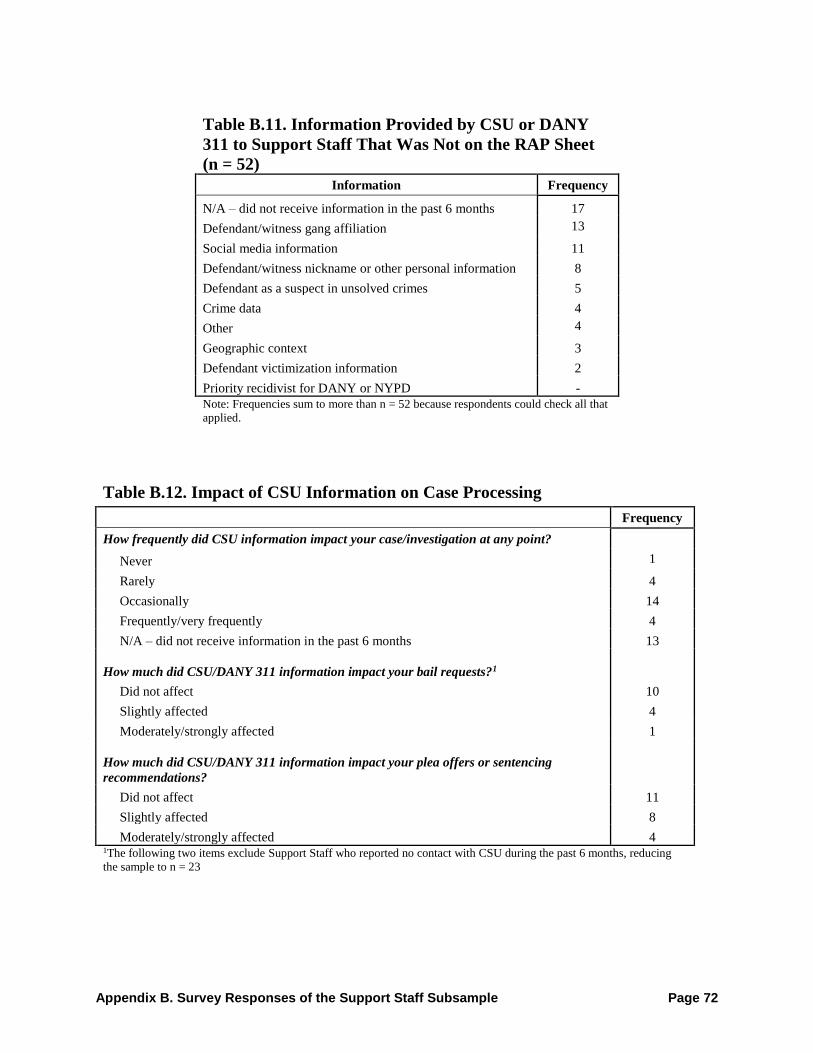
Appendix B. Survey Responses of the Support Staff Subsample Page 72
Table B.11. Information Provided by CSU or DANY
311 to Support Staff That Was Not on the RAP Sheet
(n = 52)
Information Frequency
N/A – did not receive information in the past 6 months 17
Defendant/witness gang affiliation 13
Social media information 11
Defendant/witness nickname or other personal information 8
Defendant as a suspect in unsolved crimes 5
Crime data 4
Other 4
Geographic context 3
Defendant victimization information 2
Priority recidivist for DANY or NYPD -
Note: Frequencies sum to more than n = 52 because respondents could check all that
applied.
Table B.12. Impact of CSU Information on Case Processing
Frequency
How frequently did CSU information impact your case/investigation at any point?
Never 1
Rarely 4
Occasionally 14
Frequently/very frequently 4
N/A – did not receive information in the past 6 months 13
How much did CSU/DANY 311 information impact your bail requests?1
Did not affect 10
Slightly affected 4
Moderately/strongly affected 1
How much did CSU/DANY 311 information impact your plea offers or sentencing
recommendations?
Did not affect 11
Slightly affected 8
Moderately/strongly affected 4 1The following two items exclude Support Staff who reported no contact with CSU during the past 6 months, reducing
the sample to n = 23
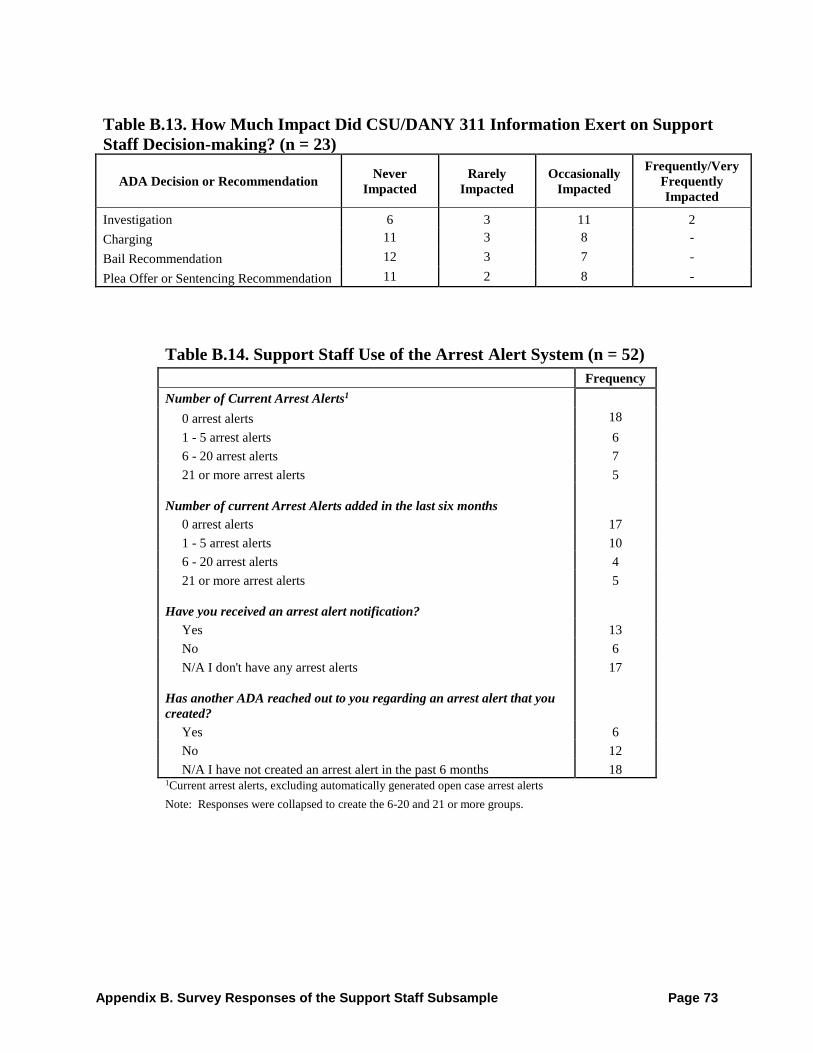
Appendix B. Survey Responses of the Support Staff Subsample Page 73
Table B.13. How Much Impact Did CSU/DANY 311 Information Exert on Support
Staff Decision-making? (n = 23)
ADA Decision or Recommendation Never
Impacted
Rarely
Impacted
Occasionally
Impacted
Frequently/Very
Frequently
Impacted
Investigation 6 3 11 2
Charging 11 3 8 -
Bail Recommendation 12 3 7 -
Plea Offer or Sentencing Recommendation 11 2 8 -
Table B.14. Support Staff Use of the Arrest Alert System (n = 52)
Frequency
Number of Current Arrest Alerts1
0 arrest alerts 18
1 - 5 arrest alerts 6
6 - 20 arrest alerts 7
21 or more arrest alerts 5
Number of current Arrest Alerts added in the last six months
0 arrest alerts 17
1 - 5 arrest alerts 10
6 - 20 arrest alerts 4
21 or more arrest alerts 5
Have you received an arrest alert notification?
Yes 13
No 6
N/A I don't have any arrest alerts 17
Has another ADA reached out to you regarding an arrest alert that you
created?
Yes 6
No 12
N/A I have not created an arrest alert in the past 6 months 18 1Current arrest alerts, excluding automatically generated open case arrest alerts
Note: Responses were collapsed to create the 6-20 and 21 or more groups.
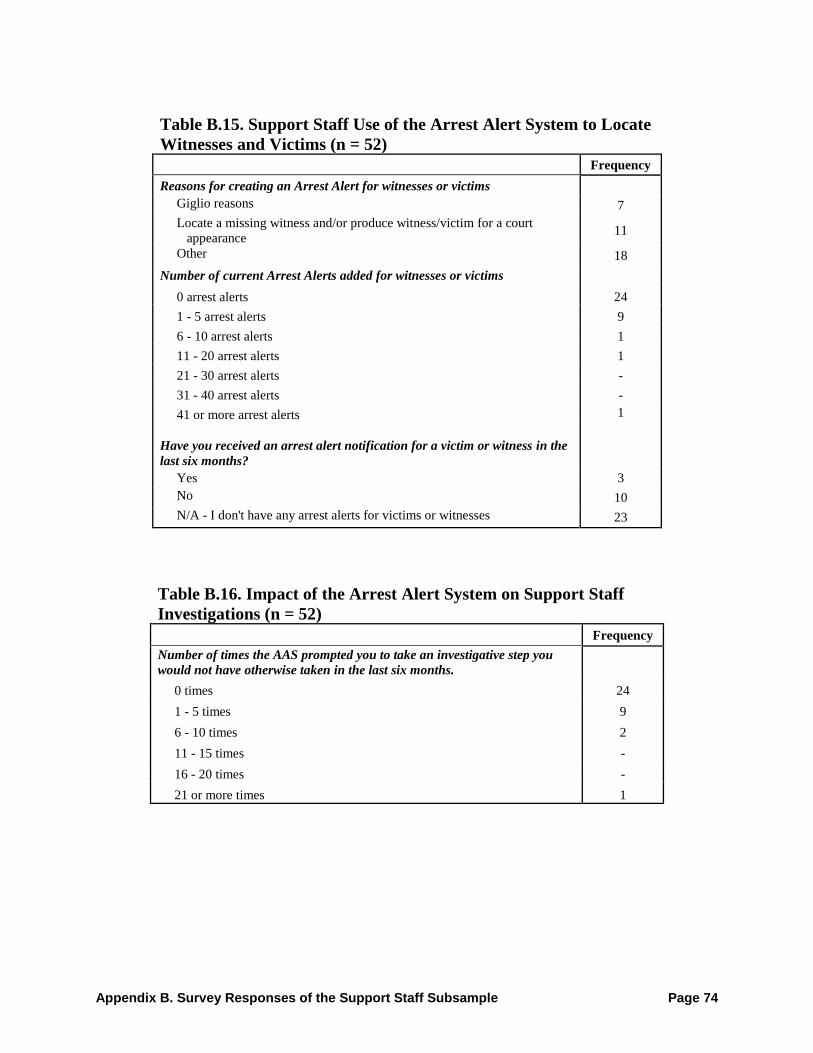
Appendix B. Survey Responses of the Support Staff Subsample Page 74
Table B.15. Support Staff Use of the Arrest Alert System to Locate
Witnesses and Victims (n = 52)
Frequency
Reasons for creating an Arrest Alert for witnesses or victims
Giglio reasons 7
Locate a missing witness and/or produce witness/victim for a court
appearance 11
Other 18
Number of current Arrest Alerts added for witnesses or victims
0 arrest alerts 24
1 - 5 arrest alerts 9
6 - 10 arrest alerts 1
11 - 20 arrest alerts 1
21 - 30 arrest alerts -
31 - 40 arrest alerts -
41 or more arrest alerts 1
Have you received an arrest alert notification for a victim or witness in the
last six months?
Yes 3
No 10
N/A - I don't have any arrest alerts for victims or witnesses 23
Table B.16. Impact of the Arrest Alert System on Support Staff
Investigations (n = 52)
Frequency
Number of times the AAS prompted you to take an investigative step you
would not have otherwise taken in the last six months.
0 times 24
1 - 5 times 9
6 - 10 times 2
11 - 15 times -
16 - 20 times -
21 or more times 1
Appendix C. Propensity Score Matching Page 75
Appendix C
Propensity Score Matching
To properly consider the impact of the Arrest Alert System, an appropriate comparison group
needed to be constructed. There were two comparison samples considered and, ultimately,
included in the evaluation. The use of two separate comparison samples constitutes a
sensitivity analysis, enabling the determination of whether impact findings vary based on the
particular type of quasi-experimental design utilized. Such variations in the substantive
findings were not, in fact, detected in the final impact analysis (see Chapter 5), which
strengthens confidence in the validity of the findings.
For the first comparison sample, a sample of Manhattan arrests was collected with an
arraignment date from 2009 through April 2010, before the initiation of the Crime Strategies
Unit. For the second comparison sample, a sample of Manhattan arrests was collected with
an arraignment date from May 2010 through 2013—i.e., contemporaneously with the arrest
alert sample but where the case was not the subject of an arrest alert.
Propensity score matching techniques were utilized to select the most comparable arrests
within each comparison group in order to provide appropriate comparisons to arrest alert
cases.
The first step in the propensity score matching process was to compare the arrest alert sample
to each comparison sample at baseline. As shown in Table 5.1 (and discussed in Chapter 5),
there were many significant differences between the arrest alert and the two respective
comparison samples. Most notably, the arrest alert defendants had significantly more serious
criminal histories and criminal charges on the instant case.
The nature and implications of all subsequent steps for the final sample size in both samples
is summarized in Table C.1.
Specifically, the second step in the process was to remove cases missing key background
characteristics from all three samples. This process resulted in the final arrest alert sample of
2,318 defendants (see Table C.1).

Appendix C. Propensity Score Matching Page 76
The third step (whose results are also shown in Table C.1) was to randomly remove from
each comparison sample a subsample of cases with less serious criminal histories (i.e., no
prior arrests) and instant case charges (i.e., violation level) in order to produce a pool of
potential comparison cases that did not deviate from the arrest alert sample in quite as large
an extent as was originally reflected in Table 5.1. Specifically, 80% of comparison
defendants with no prior arrests were removed, as well as, 20 percent of comparison
defendants with a violation or infraction level arraignment charge.
The fourth step was to develop two separate propensity models (i.e., logistic regressions
predicting sample membership), one in which the dependent variable was the arrest alert
sample as opposed to the pre comparison sample and the other in which the dependent
variable was the arrest alert sample as opposed to the contemporaneous comparison sample.
These models generated propensity scores for each case.
At this point, in the fifth step, propensity score matching was attempted to assess the
comparability of the samples. The matching process utilized a one-to-one matching
algorithm to select the 2,318 potential comparison defendants in each potential comparison
sample who were most similar to the arrest alert group (of those comparison cases not
previously matched).
In the sixth step of the process, baseline differences were then compared between the final
matched samples (arrest alert v. final pre sample and arrest alert v. final contemporaneous
sample). The results, shown in Table C.3, indicate that baseline differences were vastly
attenuated; yet, there were still significant differences between the samples, most notably in
criminal history, as shown in Table C.3. Test analyses confirmed that these final modest, yet
statistically significant, differences could be eliminated by controlling for three variables in
all impact analyses involving the final samples: the number of prior arrests, any prior
misdemeanor arrest, and the number of prior drug convictions.
Accordingly, in the seventh and final step of the process, as part of the analytic plan, all
impact analyses (whose findings are reported in Tables 5.2, 5.3, and 5.4) result in the
production of statistically adjusted outcome percentages or outcome means—generated only
after setting all samples at the mean for the three aforementioned control variables.
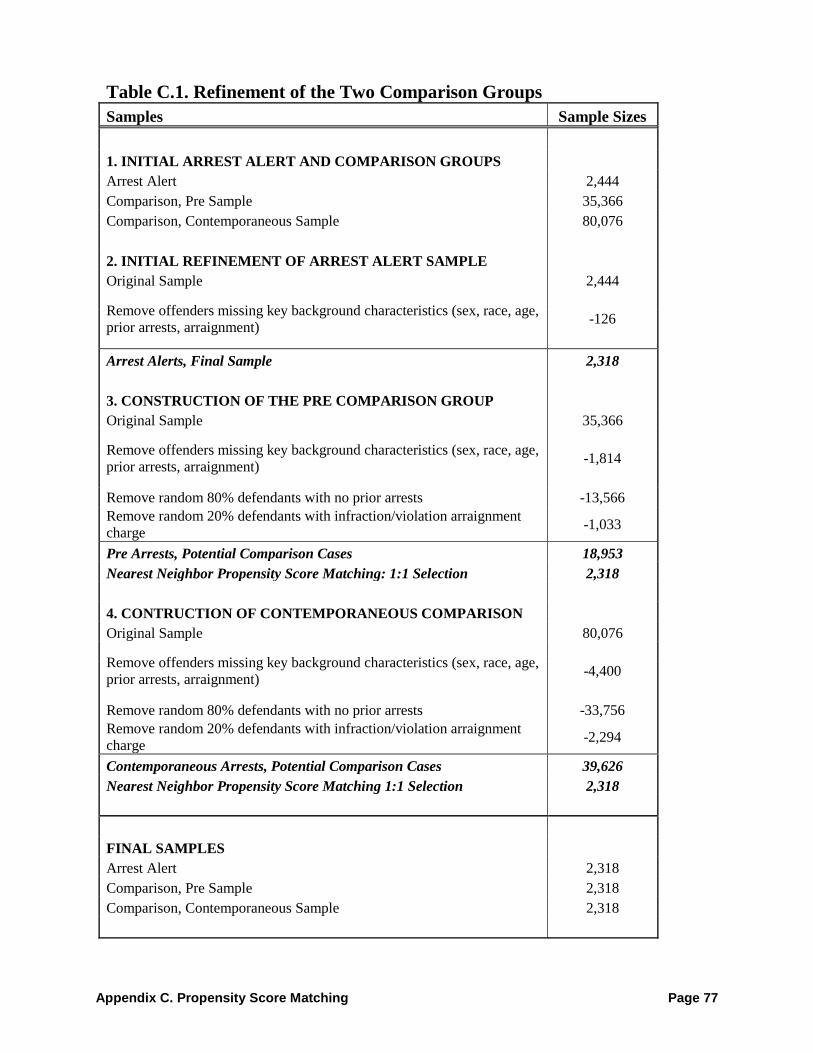
Appendix C. Propensity Score Matching Page 77
Table C.1. Refinement of the Two Comparison Groups
Samples Sample Sizes
1. INITIAL ARREST ALERT AND COMPARISON GROUPS
Arrest Alert 2,444
Comparison, Pre Sample 35,366
Comparison, Contemporaneous Sample 80,076
2. INITIAL REFINEMENT OF ARREST ALERT SAMPLE
Original Sample 2,444
Remove offenders missing key background characteristics (sex, race, age,
prior arrests, arraignment) -126
Arrest Alerts, Final Sample 2,318
3. CONSTRUCTION OF THE PRE COMPARISON GROUP
Original Sample 35,366
Remove offenders missing key background characteristics (sex, race, age,
prior arrests, arraignment) -1,814
Remove random 80% defendants with no prior arrests -13,566
Remove random 20% defendants with infraction/violation arraignment
charge -1,033
Pre Arrests, Potential Comparison Cases 18,953
Nearest Neighbor Propensity Score Matching: 1:1 Selection 2,318
4. CONTRUCTION OF CONTEMPORANEOUS COMPARISON
Original Sample 80,076
Remove offenders missing key background characteristics (sex, race, age,
prior arrests, arraignment) -4,400
Remove random 80% defendants with no prior arrests -33,756
Remove random 20% defendants with infraction/violation arraignment
charge -2,294
Contemporaneous Arrests, Potential Comparison Cases 39,626
Nearest Neighbor Propensity Score Matching 1:1 Selection 2,318
FINAL SAMPLES
Arrest Alert 2,318
Comparison, Pre Sample 2,318
Comparison, Contemporaneous Sample 2,318
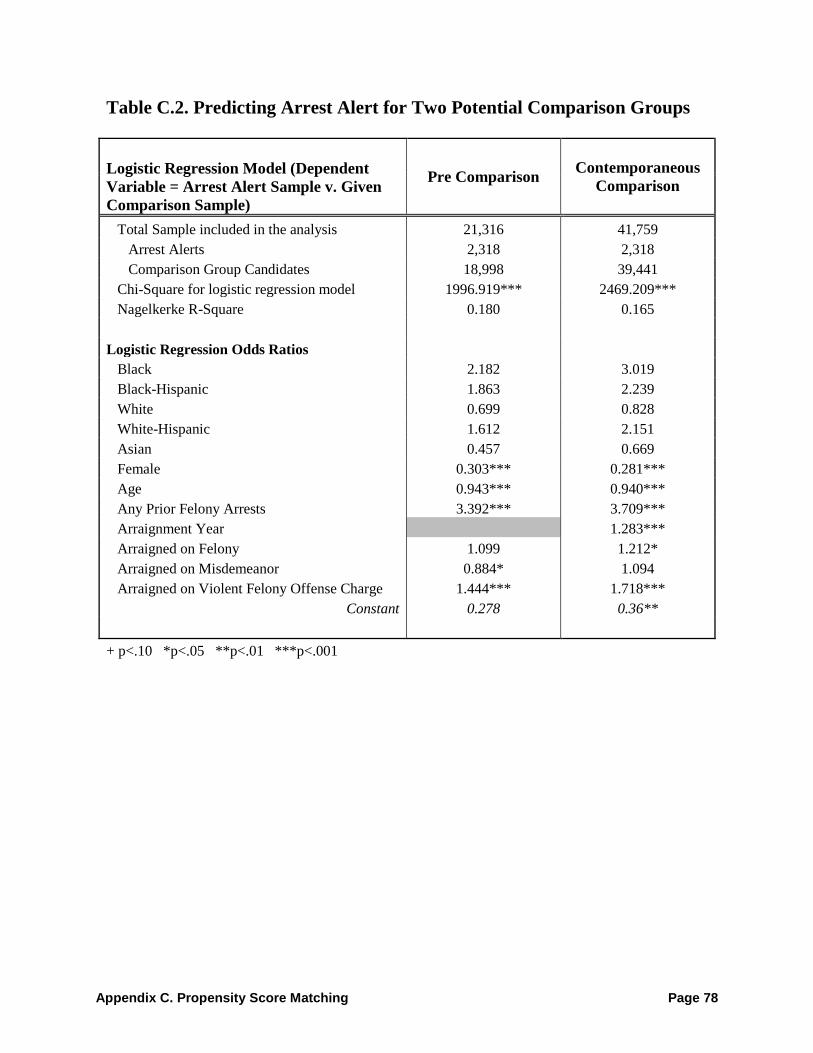
Appendix C. Propensity Score Matching Page 78
Table C.2. Predicting Arrest Alert for Two Potential Comparison Groups
Logistic Regression Model (Dependent
Variable = Arrest Alert Sample v. Given
Comparison Sample)
Pre Comparison Contemporaneous
Comparison
Total Sample included in the analysis 21,316 41,759
Arrest Alerts 2,318 2,318
Comparison Group Candidates 18,998 39,441
Chi-Square for logistic regression model 1996.919*** 2469.209***
Nagelkerke R-Square 0.180 0.165
Logistic Regression Odds Ratios
Black 2.182 3.019
Black-Hispanic 1.863 2.239
White 0.699 0.828
White-Hispanic 1.612 2.151
Asian 0.457 0.669
Female 0.303*** 0.281***
Age 0.943*** 0.940***
Any Prior Felony Arrests 3.392*** 3.709***
Arraignment Year 1.283***
Arraigned on Felony 1.099 1.212*
Arraigned on Misdemeanor 0.884* 1.094
Arraigned on Violent Felony Offense Charge 1.444*** 1.718***
Constant 0.278 0.36**
+ p<.10 *p<.05 **p<.01 ***p<.001
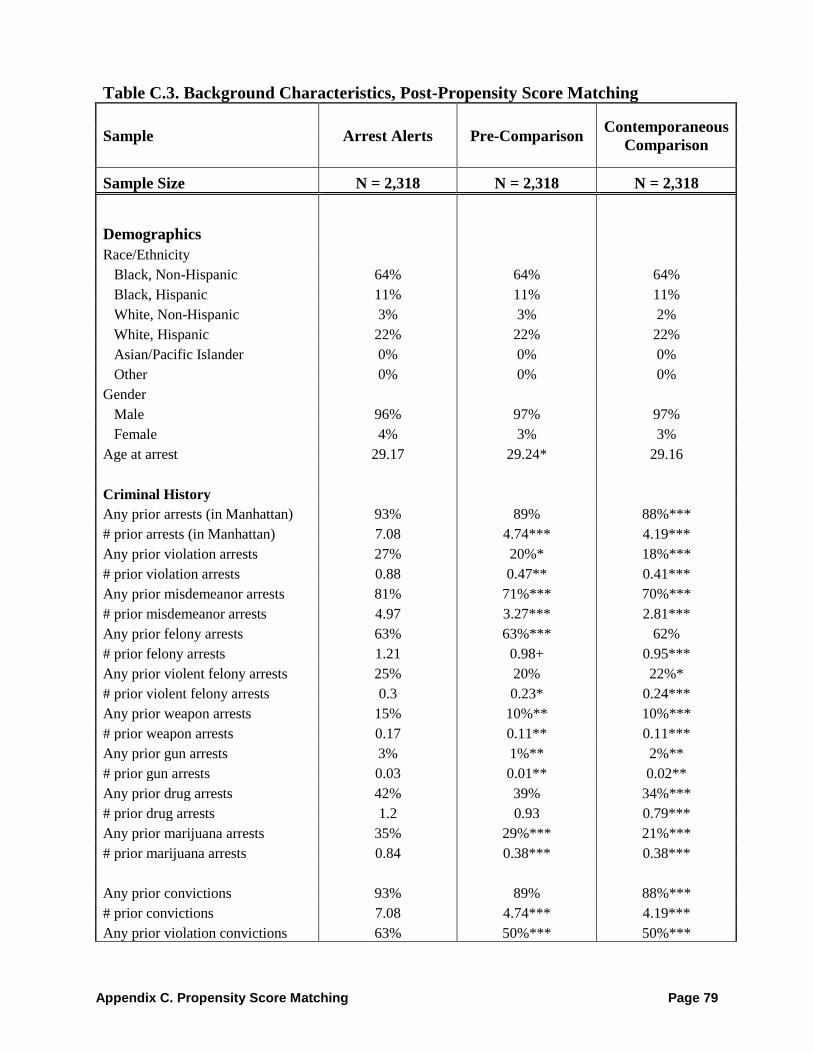
Appendix C. Propensity Score Matching Page 79
Table C.3. Background Characteristics, Post-Propensity Score Matching
Sample Arrest Alerts Pre-Comparison Contemporaneous
Comparison
Sample Size N = 2,318 N = 2,318 N = 2,318
Demographics
Race/Ethnicity
Black, Non-Hispanic 64% 64% 64%
Black, Hispanic 11% 11% 11%
White, Non-Hispanic 3% 3% 2%
White, Hispanic 22% 22% 22%
Asian/Pacific Islander 0% 0% 0%
Other 0% 0% 0%
Gender
Male 96% 97% 97%
Female 4% 3% 3%
Age at arrest 29.17 29.24* 29.16
Criminal History
Any prior arrests (in Manhattan) 93% 89% 88%***
# prior arrests (in Manhattan) 7.08 4.74*** 4.19***
Any prior violation arrests 27% 20%* 18%***
# prior violation arrests 0.88 0.47** 0.41***
Any prior misdemeanor arrests 81% 71%*** 70%***
# prior misdemeanor arrests 4.97 3.27*** 2.81***
Any prior felony arrests 63% 63%*** 62%
# prior felony arrests 1.21 0.98+ 0.95***
Any prior violent felony arrests 25% 20% 22%*
# prior violent felony arrests 0.3 0.23* 0.24***
Any prior weapon arrests 15% 10%** 10%***
# prior weapon arrests 0.17 0.11** 0.11***
Any prior gun arrests 3% 1%** 2%**
# prior gun arrests 0.03 0.01** 0.02**
Any prior drug arrests 42% 39% 34%***
# prior drug arrests 1.2 0.93 0.79***
Any prior marijuana arrests 35% 29%*** 21%***
# prior marijuana arrests 0.84 0.38*** 0.38***
Any prior convictions 93% 89% 88%***
# prior convictions 7.08 4.74*** 4.19***
Any prior violation convictions 63% 50%*** 50%***
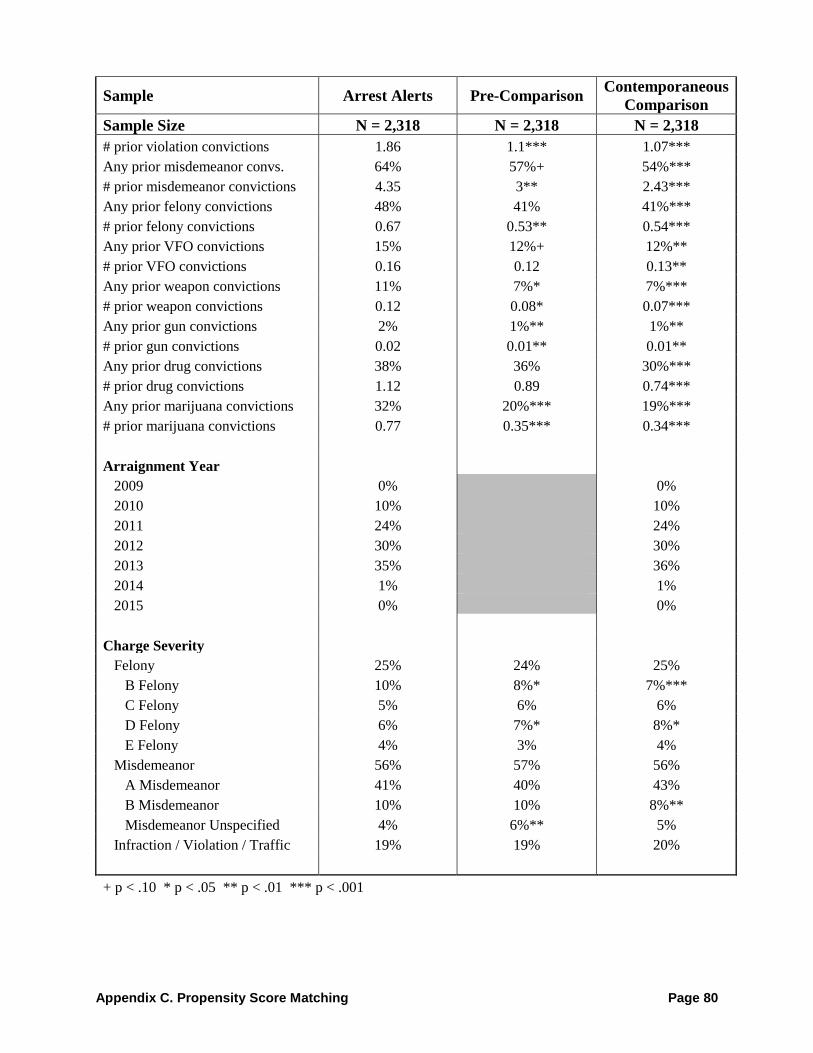
Appendix C. Propensity Score Matching Page 80
Sample Arrest Alerts Pre-Comparison Contemporaneous
Comparison
Sample Size N = 2,318 N = 2,318 N = 2,318
# prior violation convictions 1.86 1.1*** 1.07***
Any prior misdemeanor convs. 64% 57%+ 54%***
# prior misdemeanor convictions 4.35 3** 2.43***
Any prior felony convictions 48% 41% 41%***
# prior felony convictions 0.67 0.53** 0.54***
Any prior VFO convictions 15% 12%+ 12%**
# prior VFO convictions 0.16 0.12 0.13**
Any prior weapon convictions 11% 7%* 7%***
# prior weapon convictions 0.12 0.08* 0.07***
Any prior gun convictions 2% 1%** 1%**
# prior gun convictions 0.02 0.01** 0.01**
Any prior drug convictions 38% 36% 30%***
# prior drug convictions 1.12 0.89 0.74***
Any prior marijuana convictions 32% 20%*** 19%***
# prior marijuana convictions 0.77 0.35*** 0.34***
Arraignment Year
2009 0% 0%
2010 10% 10%
2011 24% 24%
2012 30% 30%
2013 35% 36%
2014 1% 1%
2015 0% 0%
Charge Severity
Felony 25% 24% 25%
B Felony 10% 8%* 7%***
C Felony 5% 6% 6%
D Felony 6% 7%* 8%*
E Felony 4% 3% 4%
Misdemeanor 56% 57% 56%
A Misdemeanor 41% 40% 43%
B Misdemeanor 10% 10% 8%**
Misdemeanor Unspecified 4% 6%** 5%
Infraction / Violation / Traffic 19% 19% 20%
+ p < .10 * p < .05 ** p < .01 *** p < .001

Appendix D. Outcomes for Felony and Misdemeanor Defendants Page 81
Appendix D
Outcomes for Felony Defendants Only and Misdemeanor Defendants Only
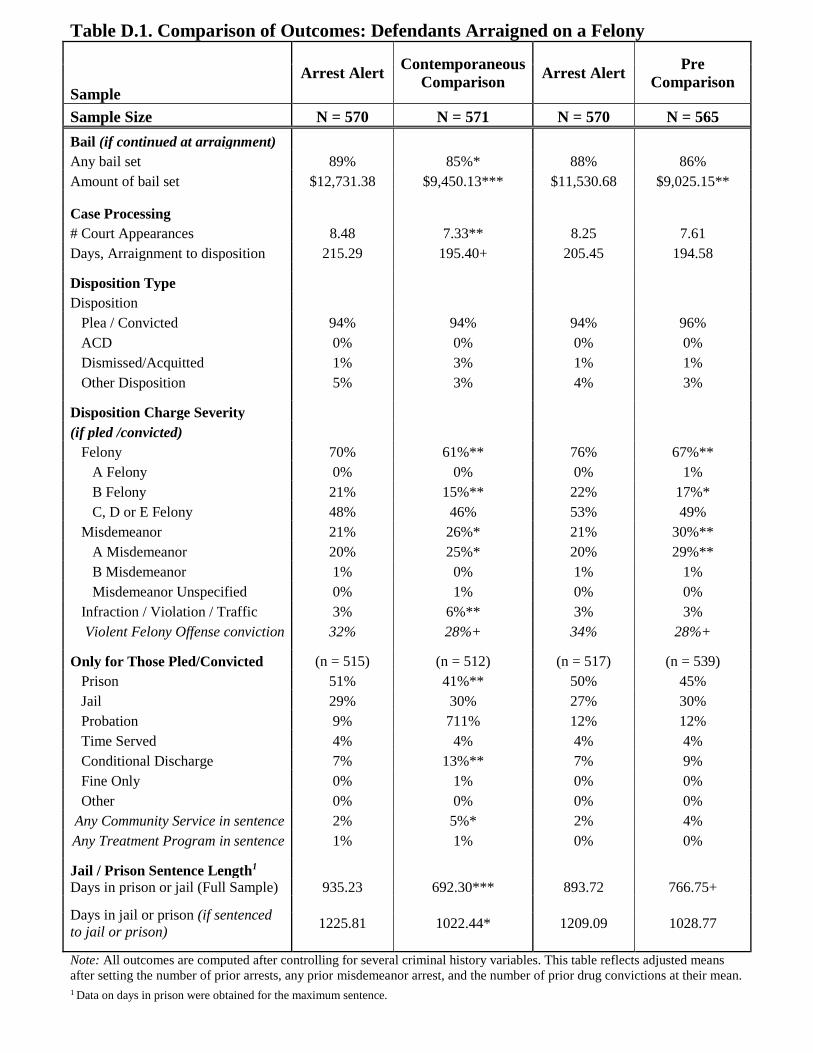
Table D.1. Comparison of Outcomes: Defendants Arraigned on a Felony
Sample
Arrest Alert Contemporaneous
Comparison Arrest Alert
Pre
Comparison
Sample Size N = 570 N = 571 N = 570 N = 565
Bail (if continued at arraignment)
Any bail set 89% 85%* 88% 86%
Amount of bail set $12,731.38 $9,450.13*** $11,530.68 $9,025.15**
Case Processing
# Court Appearances 8.48 7.33** 8.25 7.61
Days, Arraignment to disposition 215.29 195.40+ 205.45 194.58
Disposition Type
Disposition
Plea / Convicted 94% 94% 94% 96%
ACD 0% 0% 0% 0%
Dismissed/Acquitted 1% 3% 1% 1%
Other Disposition 5% 3% 4% 3%
Disposition Charge Severity
(if pled /convicted)
Felony 70% 61%** 76% 67%**
A Felony 0% 0% 0% 1%
B Felony 21% 15%** 22% 17%*
C, D or E Felony 48% 46% 53% 49%
Misdemeanor 21% 26%* 21% 30%**
A Misdemeanor 20% 25%* 20% 29%**
B Misdemeanor 1% 0% 1% 1%
Misdemeanor Unspecified 0% 1% 0% 0%
Infraction / Violation / Traffic 3% 6%** 3% 3%
Violent Felony Offense conviction 32% 28%+ 34% 28%+
Only for Those Pled/Convicted (n = 515) (n = 512) (n = 517) (n = 539)
Prison 51% 41%** 50% 45%
Jail 29% 30% 27% 30%
Probation 9% 711% 12% 12%
Time Served 4% 4% 4% 4%
Conditional Discharge 7% 13%** 7% 9%
Fine Only 0% 1% 0% 0%
Other 0% 0% 0% 0%
Any Community Service in sentence 2% 5%* 2% 4%
Any Treatment Program in sentence 1% 1% 0% 0%
Jail / Prison Sentence Length1
Days in prison or jail (Full Sample) 935.23 692.30*** 893.72 766.75+
Days in jail or prison (if sentenced
to jail or prison) 1225.81 1022.44* 1209.09 1028.77
Note: All outcomes are computed after controlling for several criminal history variables. This table reflects adjusted means
after setting the number of prior arrests, any prior misdemeanor arrest, and the number of prior drug convictions at their mean.
1 Data on days in prison were obtained for the maximum sentence.
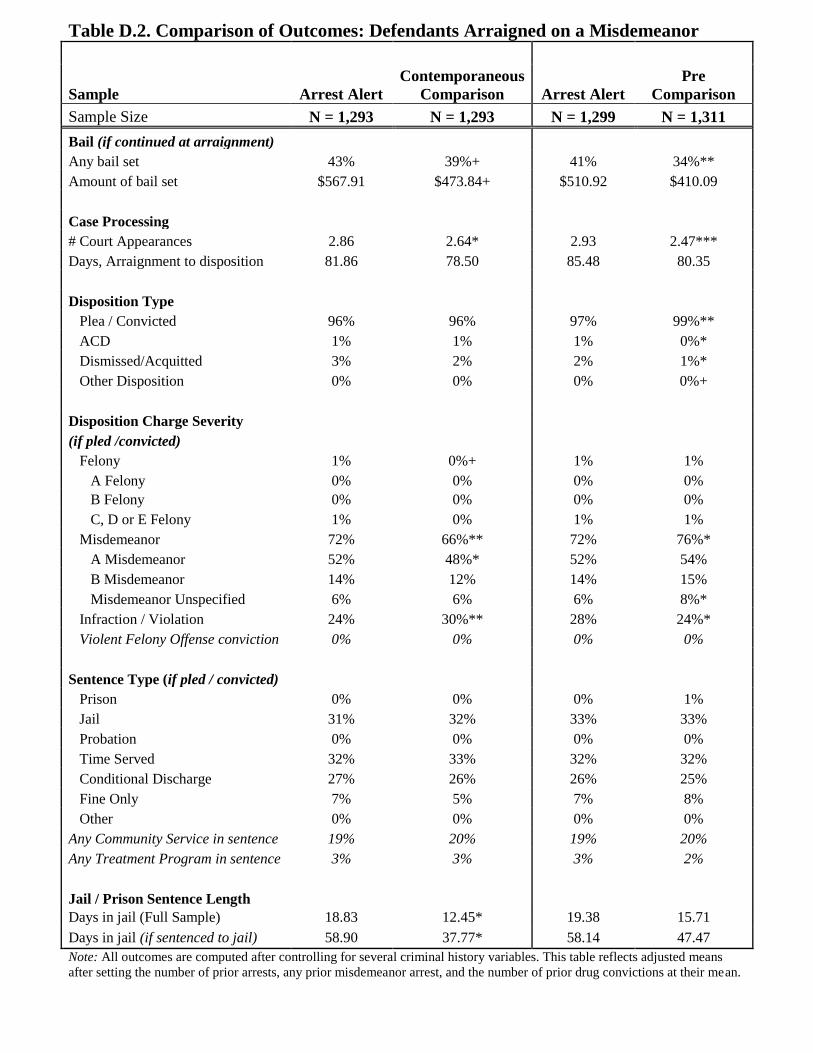
Table D.2. Comparison of Outcomes: Defendants Arraigned on a Misdemeanor
Sample Arrest Alert
Contemporaneous
Comparison Arrest Alert
Pre
Comparison
Sample Size N = 1,293 N = 1,293 N = 1,299 N = 1,311
Bail (if continued at arraignment)
Any bail set 43% 39%+ 41% 34%**
Amount of bail set $567.91 $473.84+ $510.92 $410.09
Case Processing
# Court Appearances 2.86 2.64* 2.93 2.47***
Days, Arraignment to disposition 81.86 78.50 85.48 80.35
Disposition Type
Plea / Convicted 96% 96% 97% 99%**
ACD 1% 1% 1% 0%*
Dismissed/Acquitted 3% 2% 2% 1%*
Other Disposition 0% 0% 0% 0%+
Disposition Charge Severity
(if pled /convicted)
Felony 1% 0%+ 1% 1%
A Felony 0% 0% 0% 0%
B Felony 0% 0% 0% 0%
C, D or E Felony 1% 0% 1% 1%
Misdemeanor 72% 66%** 72% 76%*
A Misdemeanor 52% 48%* 52% 54%
B Misdemeanor 14% 12% 14% 15%
Misdemeanor Unspecified 6% 6% 6% 8%*
Infraction / Violation 24% 30%** 28% 24%*
Violent Felony Offense conviction 0% 0% 0% 0%
Sentence Type (if pled / convicted)
Prison 0% 0% 0% 1%
Jail 31% 32% 33% 33%
Probation 0% 0% 0% 0%
Time Served 32% 33% 32% 32%
Conditional Discharge 27% 26% 26% 25%
Fine Only 7% 5% 7% 8%
Other 0% 0% 0% 0%
Any Community Service in sentence 19% 20% 19% 20%
Any Treatment Program in sentence 3% 3% 3% 2%
Jail / Prison Sentence Length
Days in jail (Full Sample) 18.83 12.45* 19.38 15.71
Days in jail (if sentenced to jail) 58.90 37.77* 58.14 47.47
Note: All outcomes are computed after controlling for several criminal history variables. This table reflects adjusted means
after setting the number of prior arrests, any prior misdemeanor arrest, and the number of prior drug convictions at their mean.