the interactions between the credit default swap … · the interactions between the credit default...
TRANSCRIPT
The Interactions between the Credit Default Swap and
No 201February
The Interactions between the Credit Default Swap and the Bond Markets in Financial Turmoil
_____________
Virginie Coudert
Math
11 – 02 February
DO
CU
ME
NT
DE
TR
AV
AIL
The Interactions between the Credit Default Swap and in Financial Turmoil
_____________
Virginie Coudert
hieu Gex

CEPII, WP No 2011-02 The Interactions between the Credit Default Swap …
2
Tables of contents
Non-technical summary ........................................................................................................................ 3
Résumé non technique........................................................................................................................... 4
1. Introduction ................................................................................................................................. 5
2. Links between the two markets and their relative liquidity ........................................................ 6
2.1. A basic approximation ................................................................................................................ 6
2.2. The effect of liquidity ................................................................................................................. 7
3. The data ....................................................................................................................................... 8
4. Links between the two markets ................................................................................................. 10
4.1. Preliminary steps ....................................................................................................................... 10
4.2. Method for determining the leading market .............................................................................. 11
4.3. Econometric results ................................................................................................................... 12
4.4. Discrepancies among sovereigns .............................................................................................. 14
5. The effect of the crisis ............................................................................................................... 15
5.1. Testing for non-linearities in the adjustment process................................................................ 15
5.2. Empirical results ....................................................................................................................... 16
6. Conclusion ................................................................................................................................ 17
References ........................................................................................................................................... 18
Appendix ............................................................................................................................................. 20
List of working papers released by CEPII ........................................................................................... 21
CEPII, WP No 2011-02 The Interactions between the Credit Default Swap …
3
THE INTERACTIONS BETWEEN THE CREDIT DEFAULT SWAP AND THE BOND MARKETS IN
FINANCIAL TURMOIL
NON-TECHNICAL SUMMARY
Credit default swaps (CDS) are aimed at insuring their holder against the default of a borrower. Holding a CDS and a bond on the same entity for the same maturity is therefore roughly equivalent to holding a risk-free asset. Hence there is a very close relationship between CDS premia and bond spreads. For example, if the risk of default rises, both CDS and bond spreads should increase in parallel. Here, we study how the prices of two markets adjust to each other. Does the CDS market lead the bond market? or is it the other way round? We also study the impact of the financial crisis on these interactions.
As all derivatives, CDS allow market participants to take speculative positions without holding the underlying asset (the so-called naked positions). Therefore, the pessimistic agents are more likely to intervene on the CDS market than on the bond market. Indeed, once they have sold their bonds, bearish investors are excluded from the bond market. We then expect that during financial turmoil, as more agents turn pessimistic, the CDS market takes the lead on the bond market.
We verify this hypothesis empirically. To do that, we construct a sample of daily CDS premia and bonds spreads on a generic 5-year bond, for 17 financials and 18 sovereigns (developed and emerging) over the period spanning from January 2007 to March 2010. First, we show that the CDS market has a lead over the bond market over the sample. A decomposition of the sample shows that this result holds for corporate as well as for high-yield emerging sovereigns. On the contrary, the bond market still drives the CDS market for the sovereigns in the core of the euro area; indeed there is little speculation on the default of these States and their bond market largely outsizes the CDS market. Second, we check for non-linearities in the adjustment process during the global financial crisis. Results show that the CDS market's lead has been amplified by the crisis over the whole sample. This is statistically significant for firms but not for sovereigns.
ABSTRACT
We analyse the links between credit default swap (CDS) and bond spreads and try to determine which one is the leading market in the price discovery process. To do that, we construct a sample of CDS premia and bonds spreads on a generic 5-year bond, for 17 financials and 18 sovereigns. First, we run VECM estimations, showing that the CDS market has a lead over the bond market over the whole sample. A decomposition of the sample shows that this result holds for financials as well as for the high-yield emerging sovereigns. However, the bond market still drives the CDS market for the sovereigns in the core of the euro area. Second, we check for non-linearities in the adjustment process during the current crisis. Results show that the CDS market's lead has been amplified by the crisis for financial institutions.
JEL Classification: G15; G01. Key Words: Financial crisis; credit default swaps; bonds; price discovery process.

CEPII, WP No 2011-02 The Interactions between the Credit Default Swap …
4
LES INTERACTIONS ENTRE LES MARCHÉS DES CRÉDIT DEFAUT SWAPS ET DES OBLIGATIONS
DANS LES PÉRIODES DE CRISES
RÉSUMÉ NON TECHNIQUE
Les credit default swaps (CDS) sont censés assurer leur détenteur contre le risque de défaut des emprunteurs. Détenir un CDS et une obligation sur le même emprunteur et à même maturité est donc à peu près équivalent à détenir un placement sans risque de défaut. Il en résulte une liaison très étroite entre les primes (ou spreads) de CDS et le spread de l’obligation (écart au taux sans risque). Par exemple si le risque de défaut augmente, la prime de CDS et le spread obligataire devraient monter. Nous étudions ici comment s’opère l’ajustement entre ces deux spreads. Les impulsions viennent-elles du marché des CDS ou du marché obligataire ?
Comme tous les produits dérivés, les CDS permettent de prendre des positions spéculatives sans détenir le sous-jacent (positions nues). Les investisseurs anticipant une baisse des cours sont donc susceptibles d’intervenir davantage sur le marché des CDS que sur le marché obligataire. En effet, une fois qu’ils ont vendu leurs titres, les investisseurs pessimistes sont exclus du marché obligataire. Nous nous attendons donc à ce que pendant les périodes de crise, alors que le nombre de pessimistes augmente, le marché des CDS devienne directeur dans le processus de découverte des prix.
Nous vérifions cette hypothèse par des estimations économétriques. Pour cela, nous construisons un échantillon de primes de CDS et de spreads sur des obligations à 5 ans, de 17 institutions financières et 18 émetteurs souverains (développés et émergents) au cours de la période allant de janvier 2007 à mars 2010. Tout d’abord, nous montrons que le marché des CDS dirige celui des obligations sur l’ensemble de l’échantillon. En divisant l’échantillon, nous montrons que ce résultat concerne aussi bien les entreprises financières que les émetteurs souverains jugés risqués par les marchés. En revanche, le marché des obligations reste directeur pour les émetteurs souverains du cœur de la zone euro : il y a peu de spéculation sur le défaut de ces pays et la taille de ce marché obligataire excède encore celle du marché des CDS. Nous testons ensuite les non-linéarités dans le processus d’ajustement pendant la crise. Les résultats montrent que le caractère directeur du marché des CDS a bien été renforcé par la crise. Ce résultat est significatif statistiquement pour les institutions financières, mais ne l’est pas pour les Etats.
RÉSUMÉ COURT
Nous analysons les liens entre les primes de credit default swaps (CDS) et les spreads obligataires et essayons de déterminer quel est le marché qui dirige le processus de découverte des prix. Pour cela, nous construisons un échantillon de primes de CDS et de spreads sur des obligations à 5 ans, pour 17 entreprises financières et 18 émetteurs souverains. Nous faisons d’abord des estimations VECM, montrant que le marché des CDS dirige celui des obligations sur l’ensemble de l’échantillon. Une décomposition de cet échantillon montre que ce résultat est valable aussi bien pour les institutions financières que pour les émetteurs souverains émergents. En revanche, c’est le marché obligataire qui dirige celui des CDS, pour les émetteurs souverains plus sûrs, du cœur de la zone euro. Nous testons ensuite les non-linéarités dans le processus d’ajustement pendant la crise. Les résultats montrent que pour les institutions financières, le caractère directeur du marché des CDS a été renforcé par la crise.
Classification JEL: G15; G01. Mots-clefs : Crise financière; credit default swaps; obligations ;processus de découverte des prix.

CEPII, WP No 2011-02 The Interactions between the Credit Default Swap …
5
THE INTERACTIONS BETWEEN THE CREDIT DEFAULT SWAP AND THE BOND MARKETS IN FINANCIAL TURMOIL
Virginie Couderta, Mathieu Gex
b,c
1. INTRODUCTION
Bond and credit default swap (CDS) spreads have been particularly high and volatile since the onset of the 2007-2010 crisis. They surged dramatically for financial institutions in the immediate aftermath of the bankruptcy of Lehman Brothers. Later on, spreads on sovereign debt also soared across the board. On the one hand, these movements could be attributed to the normal reactions of markets, as defaults are expected to be more frequent during crises. On the other hand, credit derivative markets have possibly overreacted during the crisis through speculation, driving the bond market into more bearish territories.
A key question is then to know whether the CDS market has a tendency to fuel rises in bond spreads during financial turmoil. This may well happen as holding long positions in CDS comes down to shorting bonds, which is not always possible on the corporate bond market. Therefore, once they have sold out their long positions in debt on a risky borrower, bearish market participants are more likely to be found trading on the CDS market. Consequently, the lead of the CDS market could be enhanced during crises.
To tackle this issue, first, we try to disentangle which market has the lead on the other in the price discovery process. Is it the CDS market? In this case, the bond price would adjust to that of the CDS. Or is it the other way round? In several previous studies, the CDS market has been evidenced to have the lead on the bond market. In other words, innovations on the CDS market have a greater tendency to spill over to bond spreads than the other way round (ECB, 2004; Norden and Weber, 2004; Blanco et al., 2005; Zhu, 2006; Baba and Inada, 2007). Here, we aim at updating these results, as the remarkable expansion of new segments of the CDS market, such as sovereign CDS, may have changed the results.
Second, we revisit the question in the light of the present crisis. Specifically, we aim at ascertaining how the crisis has affected the links between the two markets. Are the relations between markets disrupted or accentuated during episodes of financial turmoil? Indeed, some previous papers hint at an impact of financial stress on the CDS market. For example, Alexander and Kaeck (2006) evidenced that the implied volatility of the DJ Eurostoxx 50 has an impact over the sectoral components of the iTraxx, the European CDS index. Andritsky and Singh (2006) also show that the pricing of CDS could be affected by financial turmoil, especially concerning recovery rates, that turn out to be a key determinant in distressed periods.
In the first half of 2010, while CDS and bond spreads soared for several European States, some observers blamed the CDS market and called for a ban on naked positions, arguing that they can result in rising costs for government debt (see for example, Portes, 2010). Our work does not provide direct evidence for this view. We investigate which market is the most important in the price discovery
a Banque de France, DGO, Direction de la Stabilité Financière; Economix, Université de Paris Ouest Nanterre la Défense et
CEPII. E-mail: [email protected] b Banque de France, DGO, Direction de la Stabilité Financière, SEMASFI et CERAG, Université Grenoble 2. E-mail:
[email protected] c We thank Agnès-Bénassy-Quéré and Gunther Capelle-Blancard for helpful remarks.
CEPII, WP No 2011-02 The Interactions between the Credit Default Swap …
6
process. As a matter of fact, this is a relevant issue, as the information conveyed by bearish participants on the CDS market may accelerate the process of rising interest rates.
As regards to methodological issues, we run vector error correction models (VECM). This method aligns with previous studies such as Blanco et al. (2005) who have tested the non-arbitrage relationship of Duffie (1999) on a sample of 33 pairs of corporate bonds and CDS for American and European entities. The contribution of the paper is twofold. First we run panel estimations over a sample of daily bond and CDS spreads, including banks and sovereigns from different areas. To do that, we construct the matching bond spreads for the same entities as the CDS and on the same 5-year maturity, by interpolating bonds of close maturities. Second, we test for ruptures in the relationship between the two markets during the crisis, using Gonzalo-Pitarakis (2006) approach of non-linear cointegration systems.
The remainder of the paper is organized as follows. Section 2 describes the expected links between the two markets and analyses the issue of their relative liquidity. Section 3 describes our sample of CDS and bonds, including banks and sovereigns from different areas. Section 4 analyses the links between the CDS and bond spreads on different panels. Section 5 tests for non-linearities in the adjustment process. We set out the conclusion in Section 6.
2. L INKS BETWEEN THE TWO MARKETS AND THEIR RELATIVE LIQUIDITY
2.1. A basic approximation
In theory, the CDS and bond spreads should be approximately equal for the same borrower and maturity (Duffie, 1999; Hull and White, 2000; Hull et al. 2004; Cossin et Lu, 2005). To see this, let us consider the arbitrages between these two markets: a bond with a yield of ty and a CDS with a
premium of tc issued by the same entity and with the same maturity T. By purchasing both assets simultaneously, an investor is covered against the default risk linked to the bond; her annual return is
tt cy − . By arbitrage, this return should be equal to the risk-free rate of the same maturity denoted tr . This means that the CDS premium should be equal to the bond yield minus the risk-free rate.
ttt ryc −= (1)
As the bond spread ts is defined as the bond yield less the risk-free rate, equation (1) is equivalent to
the equality between the two spreads:
.tt sc = (2)
In reality, the strict equalities (1) and (2) do not hold, due to the imperfect match between the two types of contracts (O’Kane and McAdie, 2001; Blanco et al., 2005) and liquidity effects (Cossin and Lu, 2005; Longstaff et al. 2005). The “basis” tb , defined as the difference between a bond spread and
the CDS premium on the same entity and same maturity, is generally different from zero, although close to it.
ttt scb −= (3)
CEPII, WP No 2011-02 The Interactions between the Credit Default Swap …
7
In particular, Hull and White (2000) and Hull et al. (2004) emphasised the role of accrued interests. In case of default, CDS holders can get the par value of the bond but not the accrued interests. The arbitrage relationship must be adjusted for this factor:
*)1( A
ryc tt
t +−
= (4)
where A* is the expected accrued interest on the par yield bond at the time of the default. For example, for bonds paying coupons quarterly, A* is equal to y/8. As A* is small relatively to 1, we can consider equation (2) as an acceptable approximation.
Other factors also hinder complete arbitrage (O’Kane and McAdie, 2001; Bruyère, 2004; Olléon-Assouan, 2004; De Wit, 2006). Some factors make the basis positive: (i) in the event of borrower default, the CDS holder may supply the cheapest to deliver bond; the seller therefore ends up with the most discounted securities. In this case, the CDS seller suffers a loss. To compensate for it, she will ask for a premium higher than the spread. (ii) Short positions are difficult and costly to take on the bond market. If economic agents expect the borrower to default, it is easier to buy a CDS. (iii) The CDS contract makes a provision for payment in the event that the borrower should default; however, the default may concern only part of the bonds, which implies that the CDS seller is more exposed to risk than the bond holder.
Conversely, apart from accrued interests, other factors make the basis negative. (i) The CDS buyer is exposed to counterparty risk, if the protection seller defaults; this risk is all the more high as defaults may be correlated, preventing sellers from meeting their payments. (ii) On the CDS market, investors may sell protection at a price tc without any initial outlay (apart from margins); this is not the case for an investment on the bond market, which must be financed through a loan. The plain arbitrage described by equations (1) and (2) assumes that investors are able to borrow at risk free-rate. In reality, it depends on the cost of the loan. The higher the cost, the less profitable the investment in bonds. For high-yield investors, it may be more profitable to sell protection than to buy a bond. The CDS premium should therefore be lower than the bond spread. (iv) Securitisation via collateralized debt obligation (CDO) issuance may have encouraged banks to sell CDS and contributed to reducing the basis, although this activity has been reduced since the present crisis.
2.2. The effect of liquidity
Liquidity effects can also explain the differences between CDS and bond spreads. Generally speaking, CDS are much less affected by liquidity effects than bonds (Longstaff et al., 2005). For the corporate segment, this matches the fact that the CDS market has nearly outsized the underlying bond market, as it reached $9.5 trillion versus $10.0 trillion for their long-term debt securities in September 2009.1 For sovereigns, the size of the CDS market ($2.1 trillion) is relatively much smaller, as the bond market has long been fuelled by regular issuances, reaching $36 trillion. However, the size of underlying notional do not necessarily reflects all liquidity factors.
Generally speaking, several factors underpin a greater liquidity of the CDS market. First, when an investor wants to liquidate a CDS position, she does not have to sell it back on the market, she can write another contract in the opposite direction, which is of course not possible for bonds. Second, CDS contracts are not in limited supply like bonds, so they can be sold in arbitrarily large amounts.
1 CDS figures concern gross notional amounts of single-name CDS for non-financial corporates, source: DTCC, those for
long-term securities are extracted from the BIS.
CEPII, WP No 2011-02 The Interactions between the Credit Default Swap …
8
Third, the CDS market on a given borrower is not fragmented as the bond market which is made up of all its successive issuances bearing different rates. Fourth, a number of investors, such as insurance companies or pension funds, purchase bonds as part of a “buy and hold” strategy, whereas CDS sellers are more active on the market.
Several empirical studies have evidenced that CDS spreads incorporate a lower liquidity premium than bonds (for example, Longstaff et al. 2004; Cossin and Lu, 2005; Crouch and Marsh, 2005; Zhu, 2006).
2 This is especially true for fixed maturity CDS, in particular 5-year CDS, and to a lesser extent,
3, 7 and 10-year CDS. The CDS premium could therefore be lower than the bond spread.
These liquidity effects are also decisive when determining which is the leading market. Indeed, it is the market investors are likely to turn to when they want to liquidate their positions. They are expected to favour the more liquid market.
3. THE DATA
To investigate the relationship between the two markets, we need a sample containing data on CDS and bonds on the same entity that are exactly matched in terms of maturity. There are two difficulties to overcome: to have liquid CDS, with reliable prices and without missing data; and to construct a generic bond of the same maturity, which requires a whole range of bonds available. These constraints lead us to consider only top issuers on the bond markets, namely some governments and major financial institutions.
5-year senior CDS premia are extracted from Bloomberg for financials and Datastream for sovereigns. The 5-year maturity is chosen because it is the most traded maturity for CDS. Bond yields are taken from Bloomberg for sovereigns and Datastream for banks. For sovereigns, we use the 5-year benchmark bond yield. For financials, we have to construct a synthetic 5-year bond yield, by interpolating the yields of two bonds with lower and higher maturities.
Given all the constraints, we retain a sample of pairs of CDS and bond yields for 18 sovereigns and 17 financials. The sovereign issuers are the following: Austria, Belgium, Denmark, Finland, France, Netherlands, Greece, Ireland, Italy, Portugal and Spain for the advanced European countries; Argentina, Brazil, Mexico, Lithuania, Poland, Turkey and Philippines for the emerging countries. The financial institutions in the sample include European and US banks: Abbey, Bank of America, Barclays, Bayerische Hypo- und Vereinsbank, BBVA, Citibank, Crédit Agricole, Deutsche Bank, Goldman Sachs, HBOS, ING, JPMorgan; San Paolo, Société Générale, Morgan Stanley, Santander and Wells Fargo.
As the CDS market for sovereigns is quite recent and lacked liquidity prior to 2007, we start from 2 January 2007. All data are daily and end on 18 March 2010. The bond spread is calculated as the difference between the bond yield and a risk-free rate. The 5-year risk-free rate that we retain is the 5-year yield on government bonds, which is considered as having the lowest risk in the area. It is the bond yield on the German Bund for all countries in the euro area as well as for Turkey; the one on gilts for the UK, and the US Treasury bond rate for the other areas.
2 As shown by Vaihekoski (2009) for the stock market, the liquidity effect tends to be priced as a systematic source of risk for
the whole market.

CEPII, WP No 2011-02 The Interactions between the Credit Default Swap …
9
We end up with 35 pairs of CDS and bond spreads of the same maturity. Two of these pairs are depicted by way of example in Chart 1. As expected, the developments are fairly parallel on the two markets.
Chart 1: Examples of CDS and bond spreads in the sample, in basis points.
Ireland
Morgan Stanley
0
100
200
300
400
02/01/2007 02/01/2008 02/01/2009 02/01/2010
CDS
Bond
0
400
800
1200
1600
2000
07/06 01/07 07/07 01/08 07/08 01/09 07/09 01/10
CDS
Bond

CEPII, WP No 2011-02 The Interactions between the Credit Default Swap …
10
4. L INKS BETWEEN THE TWO MARKETS
To highlight the links between the bond and the CDS markets, we use the general framework of VECMs in order to estimate the CDS premium and bond spread for each entity. This method has the advantage of estimating the long-term relationship as well as the short-run adjustment between the two markets. It has already been adopted in several studies on the CDS and bond markets (ECB, 2004; Blanco et al., 2005; Zhu, 2006; Baba and Inada, 2007).
4.1. Preliminary steps
We start from a general cointegration framework.
tjt
L
jjtt uXXX ++∆Γ+Π=∆ −
=− ∑ µ
11 (5)
where )',( ttt scX = is a 2-dimensional time-series vector made up of the CDS premia tc and bond
spreads ts for a given entity. Π , jΓ are 2x2 parameter matrices, and µ is an intercept vector.
Provided that tt sc , are non-stationary and cointegrated pairwise, Π is then ranked 1 and the model
is a full VECM.
In our bivariate case, the model can be written as a cointegration relationship such as:
ttt sc εηα ++= (6)
where α is the cointegration parameter to estimate; η , an intercept and tε , the residual of the
equation. To be consistent with Equation (2), the cointegration coefficient should be close to 1. The error correction termtε is then collinear to the basis as defined in equation (3).
Here, in order to get synthetic results and to increase our number of observations, we run the estimations in a panel framework on the period 01/02/2007 until 03/18/2010. First, we run the standard panel unit-root tests and cointegration tests on our sample. We find that both CDS premia and spreads follow individual unit-root processes at a 99% confidence level according to the augmented-Dickey-Fuller, Phillips-Perron and Im-Pesaran-Shin (2003) tests (Table A1 in the Appendix). This result aligns with previous studies.
We then test for cointegration. Both series are found cointegrated by using the panel group mean estimator from Pedroni (1999, 2004) tests, as shown by the strong rejection of the null hypothesis of no cointegration (Table A2 in the Appendix). To find the cointegrating vector, we run a fully modified OLS (FMOLS) for heterogeneous panels as proposed by Pedroni (2000). The estimated vector is equal to (1, 0.91), using a maximum of 20 possible lags. As this is not very different from the theoretical value (1, 1) expected from equation (2), we retain this theoretical value in estimating the adjustment process. In this framework, the error-correction term 1ˆ −tε can be straightforwardly interpreted as the
basis of the previous day.
In the following, we will focus on the adjustments to the long-run relationship to assess which market adjusts on the other. However, it is worth noticing that there are also strong short-term interactions between the two markets. These short-term relationships can be assessed by Granger causality tests performed on an individual basis. Results of these tests show that short-run interactions are mostly bi-

CEPII, WP No 2011-02 The Interactions between the Credit Default Swap …
11
directional. Two-way causality is found for all the considered sovereigns at a 90% confidence level, and for 12 out of 17 financials
3.
4.2. Method for determining the leading market
Once the two variables have been found cointegrated, we can consider Equation (5) as a two-step estimation: (i) the estimation of the cointegration relationship in level (6) by FMOLS; and (ii) the adjustment process in evolution. In our bivariate framework, the adjustment process of the two markets can be written as:
t
lag
jjtj
lag
jjtjtt
t
lag
jjtj
lag
jjtjtt
uscs
uscc
,221
,21
,212
,111
,11
,111
ˆ
ˆ
++∆+∆+=∆
++∆+∆+=∆
∑∑
∑∑
=−
=−−
=−
=−−
µγβελ
µγβελ
(7)
where kλ stands for speed of adjustment of market k to the long-run relationship, 1ˆ −tε is the lagged
estimated residual of cointegration relation (6) and ijβ and ijγ , coefficients to estimate. The values of
the estimated coefficients kλ allow us to determine how the adjustment takes place.
First, we have to consider their signs. Given the sense of our cointegration relationship
ηαε +−= ttt sc , 1λ must be negative for the CDS market to adjust on the bond market; 2λ
positive, for the bond market to adjust on the CDS market. If one coefficient kλ has the wrong sign or
is non-significant, then we will conclude that market k does not adjust to the long run relationship. Therefore, if the other market adjust to the long-run relationship, market k has a lead over the other market.
Second, if both coefficients kλ have the right signs to adjust 1λ <0 and 2λ >0, we compare their
absolute value. A higher kλ in absolute value means that market k adjusts more rapidly to the other
market, than the other way round. This implies that market k follows the other. Reversely, a lower absolute value of kλ indicates that market k adjusts less rapidly to the other market. This implies that
market k leads the other if and only if jk λλ < . These conditions are similar to those used by
Blanco et al. (2005), the European Central Bank (2004) and Zhu (2006). Indeed, these former papers use a measure proposed by Gonzalo and Granger (1995), that is
12
12
λλλ−
=GG , to compare these speeds
of adjustments. The first market is considered to have a lead over the second market if and only if 5.0>GG . If both markets adjust on the long term relationship, (ie if 1λ <0 and 2λ >0), the condition
5.0>GG boils down to a greater adjustment speed on the second market, i.e. 12 λλ > . However, these
former papers do not provide a confidence level for their results. Here, to provide for the confidence level of the results, we re-formulate the criteria in the following way.
3 For the other 5 financials, CDS spreads “cause” bond spreads in 4 cases, the reverse being found in only one case. Results
of the tests are not reported for the sake of brevity, but are available from the authors upon request.
CEPII, WP No 2011-02 The Interactions between the Credit Default Swap …
12
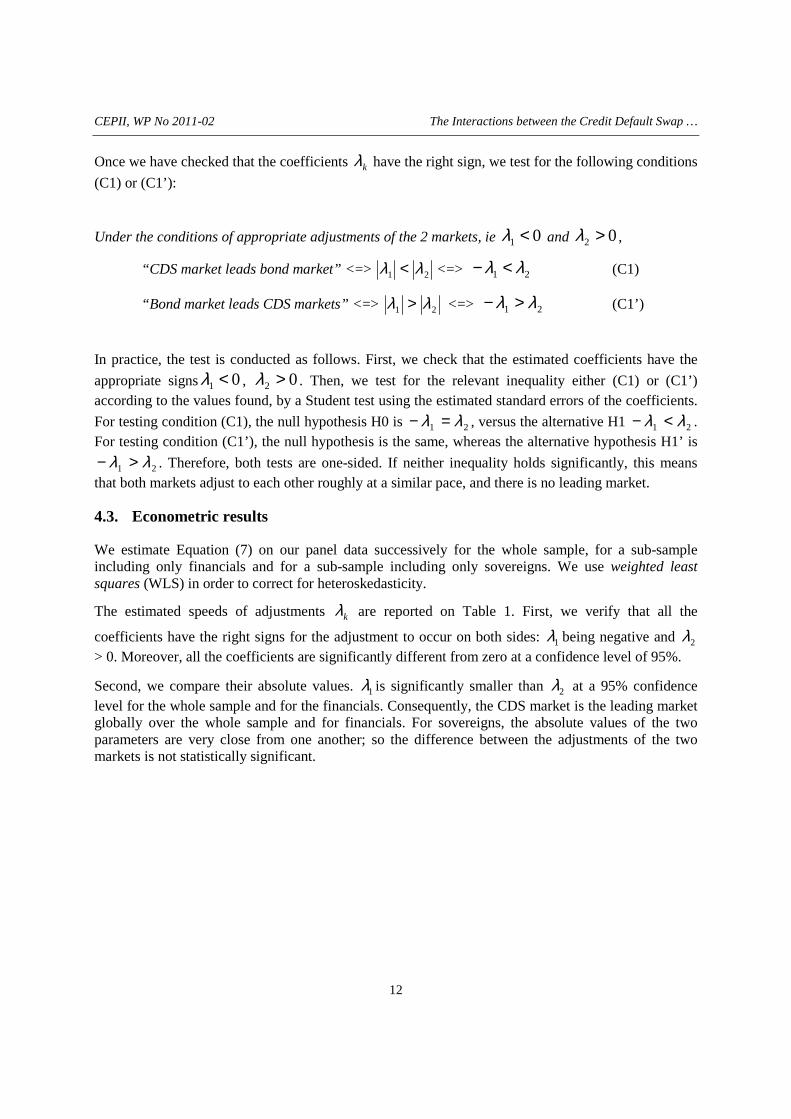
Once we have checked that the coefficients kλ have the right sign, we test for the following conditions
(C1) or (C1’):
Under the conditions of appropriate adjustments of the 2 markets, ie 01 <λ and 02 >λ ,
“CDS market leads bond market” <=> 21 λλ < <=> 21 λλ <− (C1)
“Bond market leads CDS markets” <=> 21 λλ > <=> 21 λλ >− (C1’)
In practice, the test is conducted as follows. First, we check that the estimated coefficients have the
appropriate signs 01 <λ ,
02 >λ . Then, we test for the relevant inequality either (C1) or (C1’) according to the values found, by a Student test using the estimated standard errors of the coefficients.
For testing condition (C1), the null hypothesis H0 is 21 λλ =− , versus the alternative H1 21 λλ <− .
For testing condition (C1’), the null hypothesis is the same, whereas the alternative hypothesis H1’ is
21 λλ >− . Therefore, both tests are one-sided. If neither inequality holds significantly, this means that both markets adjust to each other roughly at a similar pace, and there is no leading market.
4.3. Econometric results
We estimate Equation (7) on our panel data successively for the whole sample, for a sub-sample including only financials and for a sub-sample including only sovereigns. We use weighted least squares (WLS) in order to correct for heteroskedasticity.
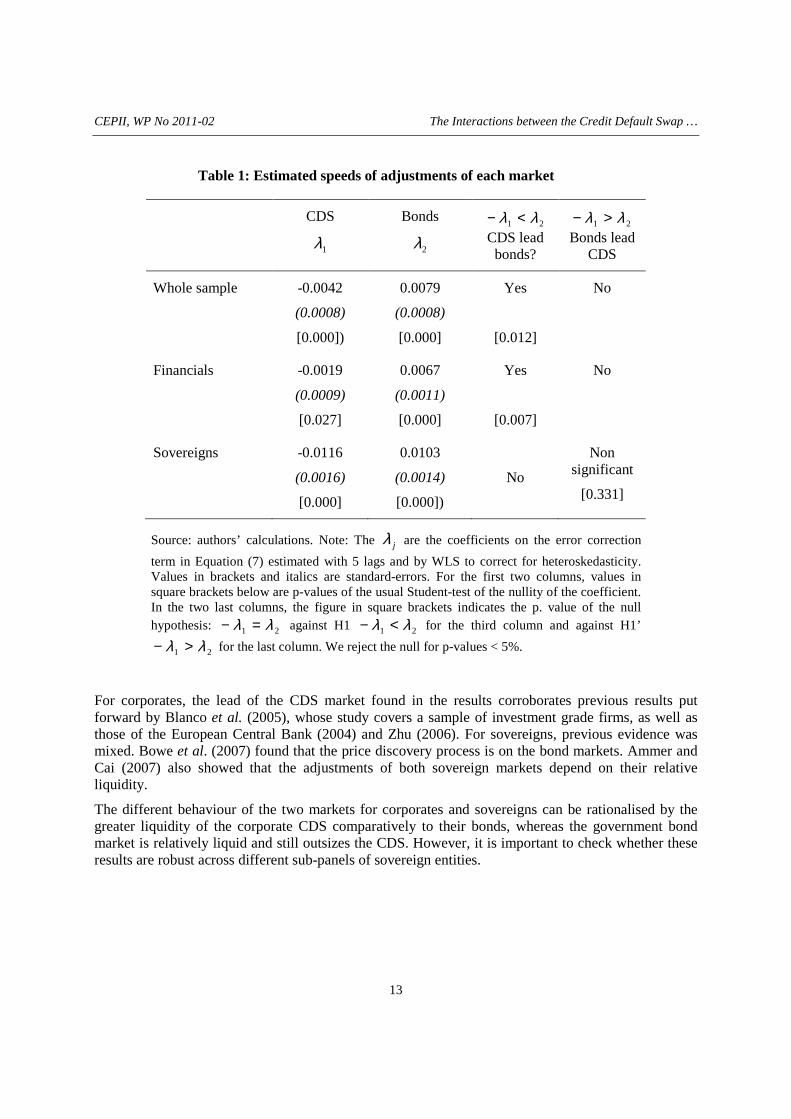
The estimated speeds of adjustments kλ are reported on Table 1. First, we verify that all the
coefficients have the right signs for the adjustment to occur on both sides: 1λ being negative and 2λ > 0. Moreover, all the coefficients are significantly different from zero at a confidence level of 95%.
Second, we compare their absolute values. 1λ is significantly smaller than 2λ at a 95% confidence level for the whole sample and for the financials. Consequently, the CDS market is the leading market globally over the whole sample and for financials. For sovereigns, the absolute values of the two parameters are very close from one another; so the difference between the adjustments of the two markets is not statistically significant.
CEPII, WP No 2011-02 The Interactions between the Credit Default Swap …
13
Table 1: Estimated speeds of adjustments of each market
CDS
1λ
Bonds
2λ
21 λλ <−CDS lead bonds?
21 λλ >−Bonds lead
CDS
Whole sample
-0.0042
(0.0008)
[0.000])
0.0079
(0.0008)
[0.000]
Yes
[0.012]
No
Financials
-0.0019
(0.0009)
[0.027]
0.0067
(0.0011)
[0.000]
Yes
[0.007]
No
Sovereigns -0.0116
(0.0016)
[0.000]
0.0103
(0.0014)
[0.000])
No
Non significant
[0.331]
Source: authors’ calculations. Note: The jλ are the coefficients on the error correction
term in Equation (7) estimated with 5 lags and by WLS to correct for heteroskedasticity. Values in brackets and italics are standard-errors. For the first two columns, values in square brackets below are p-values of the usual Student-test of the nullity of the coefficient. In the two last columns, the figure in square brackets indicates the p. value of the null hypothesis:
21 λλ =− against H1 21 λλ <− for the third column and against H1’
21 λλ >− for the last column. We reject the null for p-values < 5%.
For corporates, the lead of the CDS market found in the results corroborates previous results put forward by Blanco et al. (2005), whose study covers a sample of investment grade firms, as well as those of the European Central Bank (2004) and Zhu (2006). For sovereigns, previous evidence was mixed. Bowe et al. (2007) found that the price discovery process is on the bond markets. Ammer and Cai (2007) also showed that the adjustments of both sovereign markets depend on their relative liquidity.
The different behaviour of the two markets for corporates and sovereigns can be rationalised by the greater liquidity of the corporate CDS comparatively to their bonds, whereas the government bond market is relatively liquid and still outsizes the CDS. However, it is important to check whether these results are robust across different sub-panels of sovereign entities.

CEPII, WP No 2011-02 The Interactions between the Credit Default Swap …
14
4.4. Discrepancies among sovereigns
An interesting issue is to compare the adjustment of markets across sovereigns bearing different risks. This allows us to see if the adjustment between markets depends on the perceived risk.
We construct three panels of countries of increasing risk. To do this, we consider their average CDS premia on the sample. The first group includes the countries perceived as the safest, defined by an average CDS spread below 50 bp over the whole period. Given our initial sample, it includes six euro area countries, which are often considered as the “core” of the euro zone (Austria, Belgium, Denmark, Finland, France, Netherlands). The second group brings together euro-area countries with higher spreads (Greece, Ireland, Italy, Portugal, Spain), sometimes referred to as “peripheral countries”. The third group is composed of emerging countries (Argentina, Brazil, Mexico Lithuania, Poland, Turkey, Philippines).
We estimate Equation (7) successively on these three panels of countries. The speeds of adjustments are displayed on Table 2. All of them have the expected sign and are significant at a 99%, except one, the coefficient 2λ for the first group of countries.
Table 2: Estimated speeds of adjustments of each market, by groups of sovereigns.
CDS
1λ
Bonds
2λ
21 λλ <−CDS lead bonds?
21 λλ >−Bonds lead
CDS?
Group1: Austria, Belgium, Denmark, Finland, France, Netherlands
-0.0110
(0.0021)
[0.000]
0.0032
(0.0017)
[0.058]
No
Yes
[0.020]
Group 2: Greece, Ireland, Italy, Spain, Portugal
-0.0097
(0.0033)
[0.004]
0.0128
(0.0028)
[0.000]
Non significant
[0.306]
No
Group 3: Argentina, Brazil, Mexico, Lithuania, Poland, Turkey, Philippines
-0.0144
(0.0038)
[0.000]
0.0260
(0.0032)
[0.000]
Yes
[0.049]
No
Source: authors’ calculations. Note: See Table 1.
In the first group of low-yield countries, the bond spread hardly adjusts to the CDS premium; the adjustment is made mainly by the CDS market. This is evidenced by the small speed of adjustment2λ
(0.0032), which is significantly smaller than the absolute value of 1λ . Consequently, CDS spreads do not drive the borrowing costs of States in these low-yield countries; they just follow the prices

CEPII, WP No 2011-02 The Interactions between the Credit Default Swap …
15
discovered on the bond market. Conversely, the bond market has the lead on the CDS market. This result holds at a conventional 95% confidence level. This can be rationalized by the CDS market being less useful for the sovereigns that have a very low probability of default. The bond market outsizes the CDS market by far for these borrowers.
The situation is very different for the two other groups of countries, which are perceived as riskier by markets. In both groups, we see that 1λ < 2λ , hence the adjustment is more rapid for bond yields than CDS spreads, meaning a lead of the CDS market. The difference is not significant for high-yield European countries where both markets adjust to each other, at a roughly comparable speed. However, in the third group of emerging countries, which include the riskiest countries in the sample, the CDS market leads the bond market at a 95% confidence level.
5. THE EFFECT OF THE CRISIS
5.1. Testing for non-linearities in the adjustment process
The previous results hint at a possible rupture of the adjustment process during the crisis. To detect these ruptures, we use the work by Gonzalo and Pitarakis (2006) on non linear cointegrating relationships.
[ ] tjt
lag
jjttttt uXqIXqIXX ++∆Γ+<−Π+<Π=∆ −
=−− ∑ µχχ
11211 )(1)(
(8)
Where 1Π , 2Π , jΓ are 2x2 parameter matrices, I is the indicator function, equal to one when the
scalar variable tq is below a given thresholdχ , and 0 otherwise. More precisely, we define the
indicator function tI exogenously as equal to 1 during the crisis and 0 elsewhere. We date the start of
the crisis by the collapse of Lehman Brothers on 15 September 2008.
Here, the long-run cointegration relationship itself is linear, as the cointegrating vector is the same for the two periods, before or after the crisis. We therefore check for a non-linearity in the adjustment process.
This comes down to estimating the same cointegration relationship as in (6) and the following non linear-VECM:
t
lag
jjtj
lag
jjtjtt
Ct
t
lag
jjtj
lag
jjtjtt
Ct
uscIs
uscIc
,21
,21
,2122
,11
,11
,1111
ˆ][
ˆ][
+∆+∆++=∆
+∆+∆++=∆
∑∑
∑∑
=−
=−−
=−
=−−
γβελλ
γβελλ
(9)
where the parameters are the same as in equation (7), except for the coefficients Ckλ . These latter
coefficients will allow us to gauge the impact of the crisis on the adjustment of both markets. In this
equation, the speed of adjustment of market k is kλ during the tranquil period and (kλ + Ckλ ) during
the crisis. Applying condition (C1), we immediately deduce that if coefficients have the “right signs:

CEPII, WP No 2011-02 The Interactions between the Credit Default Swap …
16
022 >+ Cλλ , 011 <+ Cλλ , the CDS market has the lead over the bond market during the crisis if
CC1122 λλλλ +>+
.
More generally, it is easy to see that the relative adjustment of the bond market is increased during the
crisis if both C2λ and C
1λ are positive. Consequently, the role of the CDS market in the price discovery
process is enhanced by the crisis, if [C1λ > 0 ∧ C
2λ > 0]. We will then test for the following condition (C2):
[ C1λ > 0 ∧ C
2λ > 0] => ”The role of the CDS market is increased by the crisis” (C2)
In practice, this condition will be fulfilled at a conventional 95% confidence level, as soon as one of the C
kλ is significantly positive at a 95% confidence level, the other being ≥ 0. We use Student-t on
the estimated parameters Ckλ for testing this condition. Therefore, we will use condition (C2*).
[ 01 ≥Cλ ∧ C2λ > 0] ∨ [ 01 >Cλ ∧ 02 ≥Cλ ] =>
”The role of the CDS market is increased by the crisis” (C2*)
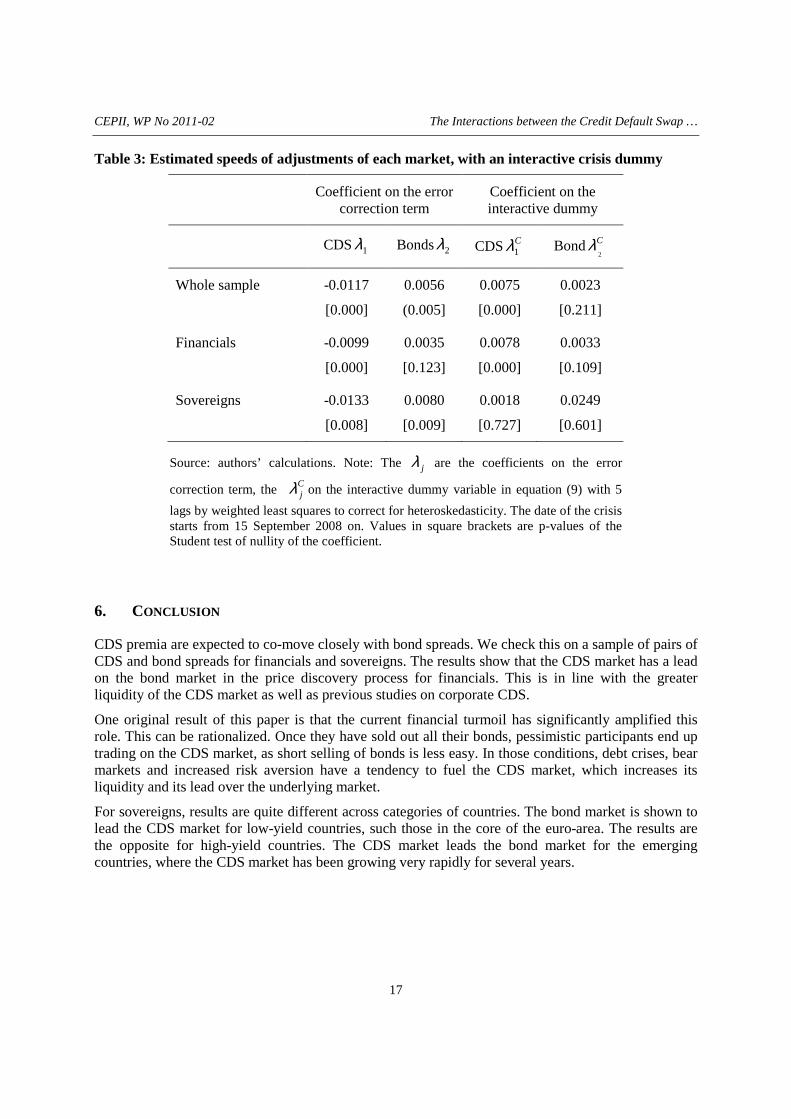
5.2. Empirical results
We estimate equation (9) successively over the whole sample and over the two sub-samples including
only financials and sovereigns. The estimated values of the coefficients kλ and Ckλ
are reported on
Table 3. All coefficients kλ have the right sign, 01 <λ and 02 >λ , meaning that both markets adjust
to each other in the tranquil period. All coefficients Ckλ
are positive, C1λ > 0 and C
2λ ≥ 0 for the three
estimations, which suggests an increase in the lead of the CDS market during the crisis. However, not
all these Ckλ are significantly positive.
For the whole sample and the financials, the adjustment of the bond market on the CDS market is increased as C
2λ ≥ 0 though not significantly, whereas the one of the CDS market is lessened
significantly, C1λ > 0. These results meet condition (C2*). We can therefore conclude that the lead of
the CDS market is enhanced by the crisis for these entities. For sovereigns, both adjustments are increased by the crisis, but neither coefficient C
kλ is significantly different from zero; hence, we cannot
conclude to an effect of the crisis for this sub-sample.
Overall, financial turmoil amplifies the role of the CDS market for the whole sample, especially for financial institutions. Indeed, in troubled times, bearish participants tend either to protect themselves against the mounting default risk or benefit from it by speculating, both strategies inciting them to buy CDS. On the other side, bearish investors, once they sold out their bonds, tend to withdraw from the bond market.
CEPII, WP No 2011-02 The Interactions between the Credit Default Swap …
17
Table 3: Estimated speeds of adjustments of each market, with an interactive crisis dummy
Coefficient on the error correction term
Coefficient on the interactive dummy
CDS 1λ Bonds 2λ CDS C1λ Bond C
2λ
Whole sample -0.0117
[0.000]
0.0056
(0.005]
0.0075
[0.000]
0.0023
[0.211]
Financials -0.0099
[0.000]
0.0035
[0.123]
0.0078
[0.000]
0.0033
[0.109]
Sovereigns -0.0133
[0.008]
0.0080
[0.009]
0.0018
[0.727]
0.0249
[0.601]
Source: authors’ calculations. Note: The jλ are the coefficients on the error
correction term, the Cjλ on the interactive dummy variable in equation (9) with 5
lags by weighted least squares to correct for heteroskedasticity. The date of the crisis starts from 15 September 2008 on. Values in square brackets are p-values of the Student test of nullity of the coefficient.
6. CONCLUSION
CDS premia are expected to co-move closely with bond spreads. We check this on a sample of pairs of CDS and bond spreads for financials and sovereigns. The results show that the CDS market has a lead on the bond market in the price discovery process for financials. This is in line with the greater liquidity of the CDS market as well as previous studies on corporate CDS.
One original result of this paper is that the current financial turmoil has significantly amplified this role. This can be rationalized. Once they have sold out all their bonds, pessimistic participants end up trading on the CDS market, as short selling of bonds is less easy. In those conditions, debt crises, bear markets and increased risk aversion have a tendency to fuel the CDS market, which increases its liquidity and its lead over the underlying market.
For sovereigns, results are quite different across categories of countries. The bond market is shown to lead the CDS market for low-yield countries, such those in the core of the euro-area. The results are the opposite for high-yield countries. The CDS market leads the bond market for the emerging countries, where the CDS market has been growing very rapidly for several years.

CEPII, WP No 2011-02 The Interactions between the Credit Default Swap …
18
REFERENCES
Alexander, C., Kaeck., A. (2006). “Regimes in CDS Spread:A Markov Switching Model of iTraxx Europe Indices”, ICMA Centre Discussion Papers in Finance DP2006-08.
Ammer, J., Cai, F. (2007). “Sovereign CDS and Bond Pricing Dynamics in Emerging Markets: Does the Cheapest-to-Deliver Option Matter? ” International International Finance Discussion Papers, Board of Governors of the Federal Reserve System, N°912.
Andritsky, J.R., Singh, M. (2006). “The pricing of credit default swaps during distress”, Working Paper 06/254, International Monetary Fund.
Baba, N., Inada, M. (2007). “Price discovery of credit spreads for Japanese mega-banks: Subordinated bond and CDS”, Discussion Paper 2007-E-6, Institute for Monetary and Economic Studies, Bank of Japan.
Blanco, R., Brennan, S., Marsh, I.W. (2005). “An empirical analysis of the dynamic relationship between investment grade bonds and credit default swaps”, Journal of Finance 60, no. 5, p. 2255-2281.
Bowe, M., Klimaviciene, A., Taylor, A. (2007). “Information Transmission and Price Discovery in Emerging Sovereign Credit Risk Markets”, mimeo.
Coudert, V., Gex, M. (2010). “Contagion inside the CDS market: the case of GM and Ford crisis in 2005”, Journal of International Markets, Money, Finance and Institutions, n°20, p. 109-134.
Cossin, D., Lu, H. (2005). “Are European corporate bonds and default swap markets segmented?”, Working Paper 153, FAME.
Crouch, P., Marsh, I.W. (2005). “Arbitrage relationships and price discovery in the Autos sector of the credit market”, Working Paper, Cass Business School.
De Wit, J. (2006). “Exploring the CDS-bond basis”, Working Paper Research 104, National Bank of Belgium.
Duffie, D. (1999). “Credit swap valuation”, Financial Analysts Journal 55, p. 73-87.
European Central Bank, (2004). “Empirical evidence of price discovery in the CDS and bonds markets”, The euro bond market study, 2004.
Gonzalo, J., Pitarakis, J.-Y. (2006). “Threshold effects in cointegrating relationships”, Oxford Bulletin of Economics and Statistics 68, no. S1, p. 813-833
Hull, J., White, A. (2000). “Valuing credit default swaps I: No counterparty default risk”, Journal of Derivatives 8, p. 29-40.
Hull, J., Predescu, M., White, A. (2004). “The relationship between credit default swap spreads, bond yields, and credit rating announcements”, Journal of Banking and Finance 28, no. 11, p. 2789-2811.
Im, K.S., Pesaran, M.H., Shin (2003). “Testing for unit roots in heterogeneous panels”, Journal of Econometrics 115, p. 53-74.
Longstaff, F.A., Mithal, S., Neis E. (2005). “Corporate Yield Spreads: Default Risk or Liquidity? New Evidence from the Credit-Default Swap”, Journal of Finance 60, no. 5, p. 2213-2253.
CEPII, WP No 2011-02 The Interactions between the Credit Default Swap …
19
Norden, L., Weber, M. (2004). “The comovement of credit default swap, bond and stock markets: An empirical analysis”, CEPR Discussion Paper no. 4674.
O’Kane, D., McAddie, R. (2001). “Explaining the Basis: Cash versus Default Swaps”, Lehman Brothers Fixed Income Research, May.
Olléon-Assouan, E. (2004). “Techniques used on the credit derivatives market: credit default swaps”, Financial Stability Review 4, Banque de France.
Pedroni, P. (1999). “Critical values for cointegration tests in heterogeneous panels with multiple regressors”, Oxford Bulletin of Economics and Statistics, S1, 61, p. 653-670.
Pedroni, P. (2000). “Fully Modified OLS for Heterogeneous Cointegrated Panels," Advances in Econometrics, Vol. 15, p. 93-130.
Pedroni, P. (2004). “Panel cointegration. Asymptotic and finite sample properties of pooled time series tests with an application to the PPP hypothesis”, Econometric Theory, 20, p. 597-625.
Portes, R. (2010). “Ban Naked CDS”, eurointelligence.com, 18 March.
Zhu, H. (2006). “An empirical comparison of credit spreads between the bond market and the credit default swap market”, Journal of Financial Services Research, vol 29 n°3, June, p. 211-235.

CEPII, WP No 2011-02 The Interactions between the Credit Default Swap …
20
APPENDIX
Table A1. Panel unit root tests on the CDS and bond spreads, Sample: 1/02/2007 3/18/2010, cross-section: 35, individual effects, individual linear trends; lags selected by AIC, Newey-West bandwidth selection using Bartlett kernel. Null hypothesis: Unit root (*) common unit root process, (**) individual unit root process kernel.
CDS Bond
Statistic p-value Statistic p-value
Levin, Lin & Chu t* 1.12 0.869 1.96 0.975
Breitung t-stat* -2.90 0.002 1.28 0.900
Im, Pesaran and Shin W-stat ** 0.64 0.739 5.40 1.000
ADF - Fisher Chi-square ** 47.60 0.982 15.89 1.000
PP - Fisher Chi-square ** 46.80 0.985 12.89 1.000
Table A2. Cointegration Tests between CDS and bond spreads. Sample: 1/02/2007 3/18/2010, cross section: 35; Deterministic intercept and trend; lags selected by AIC; Newey-West bandwidth selection with Bartlett kernel. Null Hypothesis: No cointegration. Alternative hypothesis: (*) common AR coefs; (**): individual AR coefs.
Statistic p-value
Panel v-Statistic* 38.36 0.000
Panel rho-Statistic* -33.80 0.000
Panel PP-Statistic* -30.99 0.000
Panel ADF-Statistic* -13.84 0.000
Group rho-Statistic -10.41 0.000
Group PP-Statistic -16.41 0.000
Group ADF-Statistic -13.67 0.000
CEPII, WP No 2011-02 The Interactions between the Credit Default Swap …
21
L IST OF WORKING PAPERS RELEASED BY CEPII
An Exhaustive list is available on the website: \\www.cepii.fr.
No Tittle Authors
2011-01 Comparative Advantage and Within-Industry Firms Performance
M. Crozet & F. Trionfetti
2010-33 Export Performance and Credit Constraints in China J. Jarreau & S. Poncet
2010-32 Export Performance of China’s Domestic Firms: the Role of Foreign Export Spillovers
F. Mayneris & S. Poncet
2010-31 Wholesalers in International Trade M. Crozet, G. Lalanne & S. Poncet
2010-30 TVA et taux de marge: une analyse empirique sur données d’entreprises
P. Andra, M. Carré & A. Bénassy-Quéré
2010-29 Economic and cultural assimilation and integration of immigrants in europe
M. Aleksynska & Y. Algan
2010-28 Les firmes françaises dans le commerce de service G. Gaulier, E. Milet & D. Mirza
2010-27 The world Economy in 2050: a Tentative Picture J. Fouré, A. Bénassy-Quéré
& L. Fontagné
2010-26 Determinants and Pervasiveness of the Evasion of Customs Duties
S. Jean & C. Mitaritonna
2010-25 On the Link between Credit Procyclicality and Bank Competition
V. Bouvatier, A. Lopez-Villavicencio
& V. Mignon
2010-24 Are Derivatives Dangerous? A Literature Survey G. Capelle-Blancard
2010-23 BACI: International Trade Database at the Product-Level – The 1994-2007 Version
G. Gaulier & S. Zignago
2010-22 Indirect Exporters F. McCann
CEPII, WP No 2011-02 The Interactions between the Credit Default Swap …
22
No Tittle Authors
2010-21 Réformes des retraites en France : évaluation de la mise en place d’un système par comptes notionnels
X. Chojnicki & R. Magnani
2010-20 The Art of Exceptions: Sensitive Products in the Doha Negotiations
C. Gouel, C. Mitaritonna & M.P. Ramo
2010-19 Measuring Intangible Capital Investment: an Application to the “French Data
V. Delbecque & L. Nayman
2010-18 Clustering the Winners: The French Policy of Competitiveness Clusters
L. Fontagné, P. Koenig, F. Mayneris & S. Poncet
2010-17 The Credit Default Swap Market and the Settlement of Large Defauts
V. Coudert & M. Gex
2010-16 The Impact of the 2007-10 Crisis on the Geography of Finance
G. Capelle-Blancard & Y. Tadjeddine
2010-15 Socially Responsible Investing: It Takes more than Words G. Capelle-Blancard & S. Monjon
2010-14 A Case for Intermediate Exchange-Rate Regimes V. Salins & A. Bénassy-Quéré
2010-13 Gold and Financial Assets: Are they any Safe Havens in Bear Markets?
V. Coudert & H. Raymond
2010-12 European Export Performance A. Cheptea, L. Fontagné & S. Zignago
2010-11 The Effects of the Subprime Crisis on the Latin American Financial Markets: An Empirical Assessment
G. Dufrénot, V. Mignon & A. Péguin-Feissolle
2010-10 Foreign Bank Presence and its Effect on Firm Entry and Exit in Transition Economies
O. Havrylchyk
2010-09 The Distorted Effect of Financial Development on International Trade Flows
A. Berthou
2010-08 Exchange Rate Flexibility across Financial Crises V. Coudert, C. Couharde & V. Mignon
2010-07 Crises and the Collapse of World Trade: the Shift to Lower Quality
A. Berthou & C. Emlinger
2010-06 The heterogeneous effect of international outsourcing on firm productivity
F. McCann
CEPII, WP No 2011-02 The Interactions between the Credit Default Swap …
23
No Tittle Authors
2010-05 Fiscal Expectations on the Stability and Growth Pact: Evidence from Survey Data
M. Poplawski-Ribeiro & J.C. Rüle
2010-04 Terrorism Networks and Trade: Does the Neighbor Hurt J. de Sousa, D. Mirza & T. Verdier
2010-03 Wage Bargaining and the Boundaries of the Multinational Firm
M. Bas & J. Carluccio
2010-02 Estimation of Consistent Multi-Country FEERs B. Carton & K. Hervé
2010-01 The Elusive Impact of Investing Abroad for Japanese Parent Firms: Can Disaggregation According to FDI Motives Help
L. Hering, T. Inui & S. Poncet

Organisme public d’étude et de recherche en économie internationale, le CEPII est placé auprès du Centre d’Analyse Stratégique. Son programme de travail est fixé par un conseil composé de responsables de l’administration et de personnalités issues des entreprises, des organisations syndicales et de l’Université.
Les documents de travail du CEPII mettent à disposition du public professionnel des travaux effectués au CEPII, dans leur phase d’élaboration et de discussion avant publication définitive. Les documents de travail sont publiés sous la responsabilité de la direction du CEPII et n’engagent ni le conseil du Centre, ni le Centre d’Analyse Stratégique. Les opinions qui y sont exprimées sont celles des auteurs.
Les documents de travail du CEPII sont disponibles sur le site : http//www.cepii.fr