the interest group theory of financial development: … interest group theory of financial...
TRANSCRIPT

The interest group theory of financial
development: evidence from regulation
Cagatay Bircan, David Hauner and Alessandro Prati
Abstract
We use a new dataset of de jure measures of trade, capital account, product market and domestic financial regulation for 91 countries from 1973 to 2005 to test Rajan and Zingales’s (2003) interest group theory of financial development. In line with the theory, we find strong evidence that trade liberalisation is a leading indicator of domestic financial liberalisation. This result is robust to the use of different data frequencies, estimation methods and a check for non-linear effects. However, in contrast to the theory, we do not find consistent evidence of an effect of capital account liberalisation on financial development.
Keywords: Financial development, financial liberalisation, trade liberalisation
JEL Classification Number: F13, G00, O16
Contact details: Cagatay Bircan, One Exchange Square, London EC2A 2JN, UK.
Phone: +44 20 7338 8508; Fax: +44 20 7338 6111; email: [email protected].
Cagatay Bircan is a Research Economist at the EBRD. David Hauner and Alessandro Prati are economists at the IMF.
Cagatay Bircan and David Hauner would like to devote this article to Alessandro Prati, who passed away while the authors were completing this paper. We are grateful to Abdul Abiad, Stijn Claessens, Mark De Broeck, Xavier Debrun, Enrica Detragiache, Allan Drazen, Francesco Giavazzi, Simon Johnson, Ronald McKinnon, Jonathan Ostry, Chris Papageorgiou, Dennis Quinn, Raghuram Rajan, Rodney Ramcharan, Alessandro Rebucci, Martin Schindler, Antonio Spilimbergo, Guido Tabellini, Thierry Tressel, an anonymous referee, and seminar participants at the 2008 Annual Meetings of the American Economic Association and at the “Causes and Consequences of Structural Reforms” conference in 2008 at the International Monetary Fund for helpful comments, including on previous drafts. Manzoor Gill provided outstanding research assistance.
The working paper series has been produced to stimulate debate on the economic transformation of central and eastern Europe and the CIS. The views expressed herein are those of the authors and should not be attributed to the EBRD or the IMF, its Executive Board, or its management.
Working Paper No. 150 Prepared in October 2012
1
1. Introduction
The role of economic openness in financial development has received particular attention
since the contribution by Rajan and Zingales (2003). Their “interest group theory” stresses
the role of trade and financial openness in reducing the influence of interest groups that
oppose financial development. In a closed economy, incumbents benefit from financial
repression and the resulting low financial development because it denies potential
competitors the financial resources to enter the market. Increasing both trade and capital
account openness undermines this status quo. Foreign entry in the domestic goods markets
reduces rents and creates more investment needs for incumbents to counter competition and
take advantage of new opportunities.1 At the same time, opening up capital flows renders
financial repression increasingly impossible to implement. Studies have tested the effect of
trade and financial openness on the liberalisation and development of the financial sector
from various angles.
So far, tests of the interest group theory have relied on de facto measures of openness or
financial development, for example trade/GDP or credit/GDP. However, lack of a consistent
dataset of regulations across sectors has prevented the possibly most compelling test, namely
to examine the effect of liberalisation in other sectors on domestic financial liberalisation.2
Such a test may be more appropriate than those based on de facto measures for several
reasons. First, de facto openness may rise without any trade liberalisation or reduction in
rents: for example, higher commodity prices would tend to increase de facto openness in both
importing and exporting countries with no change in trade policies and, possibly, even with
an increase of rents in commodity exporting countries. Similarly, higher de facto financial
depth indicators may not be an indication of domestic financial reform or of a smaller role of
incumbents in domestic credit markets. For example, China’s high deposit-to-GDP ratio co-
exists with – or may even be partly explained by – financial repression and lack of domestic
financial reform. Lastly, de facto financial development measures are likely to rise when
capital inflows are buoyant, making the coefficient of de jure openness on de facto financial
development endogenous if politicians prefer to liberalise in good times (Henry, 2007).
Testing the interest group theory with de jure measures (which, as we acknowledge, have
their own shortcomings3) is the first main innovation of this paper.
As our second key innovation – and an extension of the original interest group theory – we
examine whether product market liberalisation has a positive effect on domestic financial
liberalisation, over and above the one of openness. We see this as an important complement
to the role of openness in the interest group theory, because product market reform can be
expected to trigger domestic financial sector reform for the same reasons as trade
liberalisation, by tilting the cost-benefit balance of financial liberalisation for incumbent
firms: product market liberalisation is likely to increase the demand for external financing by
creating new expansion opportunities; a need to invest to fend off new competitors; and lower
profitability and thus reduced scope for internal financing of investment. We expect such an
effect that undermines the status quo in favour of financial repression to be particularly
1 Tressel (2008) shows that trade reforms foster output growth in export sectors that rely more intensively on
imported intermediated goods. 2 Barlow and Radulescu (2005) examine the effect of de jure trade liberalisation on de jure domestic financial
liberalisation, but only for a relatively limited sample of transition countries over a 10-year period. 3De jure measures do not capture the degree of enforcement of capital controls, which can change over time
even if the legal restrictions themselves remain unchanged, and they do not always reflect the actual degree of
integration of an economy into international capital markets. For example, China, despite extensive capital
controls, has not been able to stop inflows of speculative capital (Kose et al., 2006).

2
pronounced for agriculture that in most developing countries constitutes the largest part of the
population, electorate and economy. Indeed, Rajan and Ramcharan (2008) show that financial
liberalisation is negatively affected by the importance of incumbent farmers, in line with the
interest group theory.
If trade liberalisation follows, or is part of, a broader process of product market liberalisation,
and we do not control for the latter, we risk attributing to openness an effect on domestic
financial reforms that should be attributed to domestic product market policies. However, if
we can confirm that both openness and product market deregulation positively affect
domestic financial liberalisation, this strengthens the evidence in favour of the role of
openness – and highlights an additional role of domestic product market liberalisation in the
process of financial liberalisation that has not been examined so far.
We present evidence on the effect of trade, capital account and product market (in fact,
agriculture, electricity and telecommunications) liberalisation on domestic financial
liberalisation based on a new dataset on structural reforms, including yearly observations for
91 countries during 1973-2005. While this dataset obviously builds on existing indices and
methodology, most of the data are entirely new, and our dataset is – to the best of our
knowledge – the largest existing dataset on structural reforms in high-, middle- and low-
income countries.
Our results provide further evidence in favour of the interest group theory as far as trade and
domestic product market liberalisation are concerned. Trade liberalisation helps to predict
domestic financial liberalisation as long as five years ahead. This result is robust to
controlling for product market liberalisation. In contrast, there is little evidence that capital
account liberalisation helps to predict domestic financial liberalisation beyond a one-year
horizon, and even this effect is limited to its securities markets component. However, product
market liberalisation is a robust leading indicator of domestic financial liberalisation at short
and long horizons: specifically, agriculture liberalisation leads domestic financial
liberalisation in low- and middle-income countries, and liberalisation of the energy and
telecoms sectors has a positive significant effect at low levels of domestic financial
liberalisation.
Our contribution adds to a rich literature that aims to explain the variation in financial
development between countries and across time. Some of the main strands of the literature
have focused on legal institutions (for example, La Porta et al., 1997; Claessens and Laeven,
2003), economic institutions (Acemoglu et al., 2005), endowments (Beck et al., 2000;
Acemoglu et al., 2001), culture (Stulz and Williamson, 2003), social capital (Guiso et al.,
2004), and macro factors such as inflation (Boyd et al., 2001) and public debt (Hauner, 2008).
Several studies have tested the effect of trade and financial openness on the liberalisation and
development of the financial sector from various angles. Rajan and Zingales (2003) measured
both openness (trade and capital flows) and financial development in de facto terms.
Subsequent research has estimated the effects of de jure openness, specifically trade and
capital account liberalisation, on de facto financial development (Baltagi et al., 2009; Chinn
and Ito, 2006). In a study that is particularly closely related to our approach, Braun and
Raddatz (2008) established that countries where trade liberalisation results in an increase in
the relative strength of sectors that benefit from financial liberalisation experience faster
subsequent financial development than others. This finding is essentially the micro (sector-
level) complement of our macro (country-level) analysis here. The literature has also
established that de facto trade openness leads to financial liberalisation (without distinction
between domestic and capital account liberalisation, see Abiad and Mody, 2005) and equity
market liberalisation (Kim and Kenny, 2007).

3
In the rest of the paper, Section 2 presents our novel dataset of structural reforms; Section 3
discusses the estimation strategy; Section 4 reports the results; and Section 5 concludes.
4
2. Data
We use a new dataset of indices of liberalisation in trade, capital account, the domestic
financial sector and product markets – namely agriculture, electricity and telecommunications
– with annual observations from 1973 to 2005 for 91 countries of all income levels, selected
on the basis of data availability. In this paper we only briefly describe the data; see IMF
(2009) for more detail.
Trade openness is measured by average tariff rates.4 Our data are unique in that: (i) they
cover a large sample of countries on an annual basis for more than three decades; (ii) the
index is constructed to be comparable over time and across countries; and (iii) it offers a
continuous measure of the level of liberalisation. The index provides an alternative to the
widely used index by Sachs and Warner (1995) which has been criticised (Rodríguez and
Rodrik, 2001) as dominated by information that is not necessarily capturing trade restrictions,
namely the black market premium and the existence of an export marketing board. In our
dataset, the presence of export marketing boards is more appropriately considered in the
agriculture index (see below).
Financial openness is measured by qualitative indicators of restrictions on financial credits
and personal capital transactions of residents and financial credits to non-residents, as well as
the use of multiple exchange rates. Domestic financial liberalisation is measured by the
simple average of six sub-indices: (i) credit controls, such as directed credit; (ii) interest rate
controls, such as floors or ceilings; (iii) entry barriers in the banking sector, such as licensing
requirements or limits on the participation of foreign banks; (iv) competition restrictions,
such as limits on branches; (v) the degree of state ownership; and (vi) aggregate credit
ceilings. These data come from the database by Abiad et al. (2010) which follows the
methodology in Abiad and Mody (2005) but provides for a tripling of the information
through greater coverage and an additional index for aggregate credit ceilings.5
Product market liberalisation is measured by two separate indices for the network industries
and agriculture. The networks index is the simple average of the electricity and
telecommunications markets sub-indices, which are constructed, in turn, from scores along
three dimensions.6 All these data, which were coded based on legislation, are entirely new
and improve on the existing dataset not only in coverage, but also by including information
on local services and interconnection charges, and by considering also the effective powers of
regulators, not only their mere establishment.
Given that developing countries constitute most of our sample, the degree of regulation in
agriculture, which continues to account for a large part of many of these economies, is an
4 Tariff rates come from various sources, including IMF, World Bank, WTO, UN and the academic literature
(particularly Clemens and Willamson, 2004). The index uses average tariff rates when they are available and
implicit weighted tariff rates to extrapolate the missing values. The index is normalised to be between zero and
one: zero means the tariff rates are 60 per cent or higher, while one means the tariff rates are zero. 5 As in Abiad and Mody (2005), the sub-indices are aggregated with equal weights. The original sources of the
coded information are mostly various IMF reports and working papers, but also central bank web sites, etc. Each
sub-index is coded from zero (fully repressed) to three (fully liberalised). 6 For electricity, the sub-indices capture (i) the degree of unbundling of generation, transmission and
distribution; (ii) whether a regulator other than government has been established; and (iii) whether the wholesale
market has been liberalised. For telecommunications, they capture (i) the degree of competition in local
services; (ii) whether a regulator other than government has been established; and (iii) the degree of
liberalisation of interconnection changes. The indices are coded with values ranging from zero (not liberalised)
to two (completely liberalised).
5
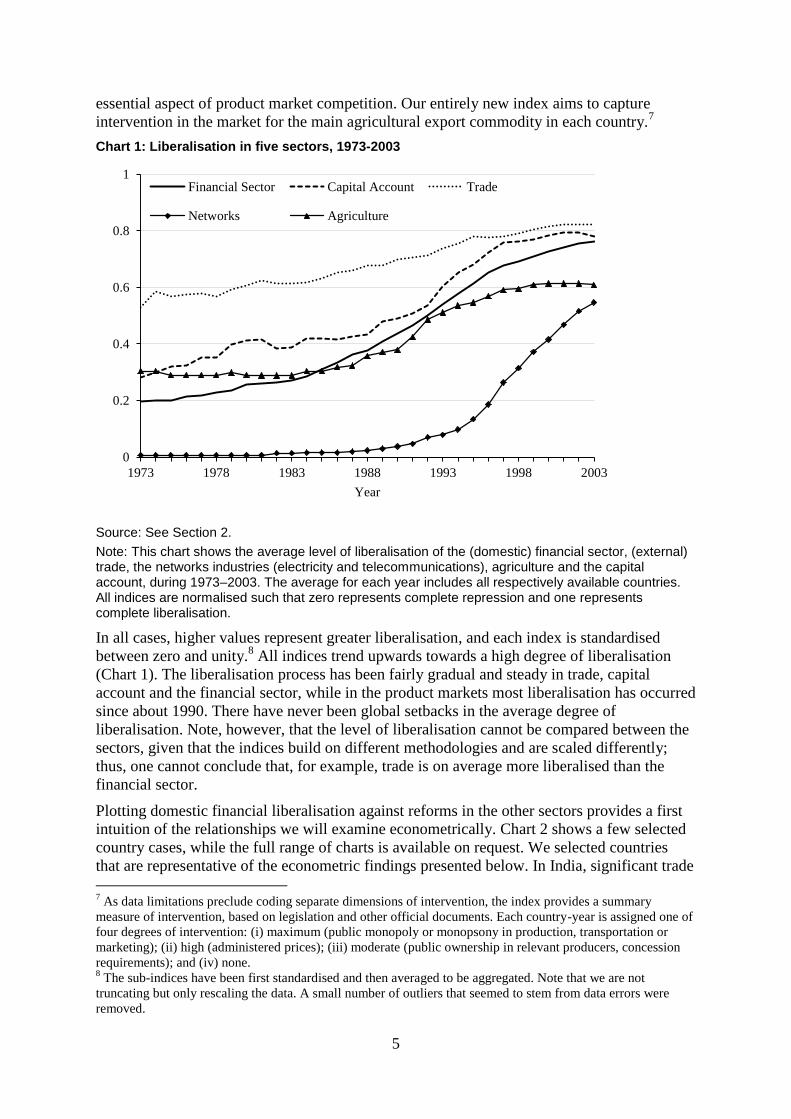
essential aspect of product market competition. Our entirely new index aims to capture
intervention in the market for the main agricultural export commodity in each country.7
Chart 1: Liberalisation in five sectors, 1973-2003
0
0.2
0.4
0.6
0.8
1
1973 1978 1983 1988 1993 1998 2003
Year
Financial Sector Capital Account Trade
Networks Agriculture
Source: See Section 2.
Note: This chart shows the average level of liberalisation of the (domestic) financial sector, (external) trade, the networks industries (electricity and telecommunications), agriculture and the capital account, during 1973–2003. The average for each year includes all respectively available countries. All indices are normalised such that zero represents complete repression and one represents complete liberalisation.
In all cases, higher values represent greater liberalisation, and each index is standardised
between zero and unity.8 All indices trend upwards towards a high degree of liberalisation
(Chart 1). The liberalisation process has been fairly gradual and steady in trade, capital
account and the financial sector, while in the product markets most liberalisation has occurred
since about 1990. There have never been global setbacks in the average degree of
liberalisation. Note, however, that the level of liberalisation cannot be compared between the
sectors, given that the indices build on different methodologies and are scaled differently;
thus, one cannot conclude that, for example, trade is on average more liberalised than the
financial sector.
Plotting domestic financial liberalisation against reforms in the other sectors provides a first
intuition of the relationships we will examine econometrically. Chart 2 shows a few selected
country cases, while the full range of charts is available on request. We selected countries
that are representative of the econometric findings presented below. In India, significant trade
7 As data limitations preclude coding separate dimensions of intervention, the index provides a summary
measure of intervention, based on legislation and other official documents. Each country-year is assigned one of
four degrees of intervention: (i) maximum (public monopoly or monopsony in production, transportation or
marketing); (ii) high (administered prices); (iii) moderate (public ownership in relevant producers, concession
requirements); and (iv) none. 8 The sub-indices have been first standardised and then averaged to be aggregated. Note that we are not
truncating but only rescaling the data. A small number of outliers that seemed to stem from data errors were
removed.

6
liberalisation during the mid-1980s to mid-1990s was followed by substantial domestic
financial liberalisation within a few years. For Uganda, the chart suggests a similarly close
relationship between agriculture and domestic financial liberalisation during the 1990s.
Chart 2: Some cases of sequencing domestic financial liberalisation and other reforms
Trade liberalisation Agriculture liberalisation
0
0.2
0.4
0.6
0.8
1
1975 1980 1985 1990 1995 2000 2005
Year
IND
DF
TR
0
0.2
0.4
0.6
0.8
1
1975 1980 1985 1990 1995 2000 2005
Year
UGA
DF
AG
Capital account liberalisation
0
0.2
0.4
0.6
0.8
1
1975 1980 1985 1990 1995 2000 2005
Year
KOR
DF
CA
0
0.2
0.4
0.6
0.8
1
1975 1980 1985 1990 1995 2000 2005
Year
THA
DF
CA
0
0.2
0.4
0.6
0.8
1
1975 1980 1985 1990 1995 2000 2005
Year
POL
DF
CA
Source: See Section 2.
Note: This chart shows selected but representative country cases of the sequencing of domestic financial liberalisation and reforms in the other sectors included in our analysis. Specifically, the charts show the relationship with trade liberalisation in India, with agriculture liberalisation in Uganda, and with capital account liberalisation in Korea, Thailand, and Poland.

7
While the sequencing between trade and agriculture on the one hand and domestic financial
sector on the other hand is comparatively homogenous, countries have chosen very different
paths in the sequencing of domestic financial and capital account liberalisation: Korea kept
its capital account fairly closed until 1990 while continuously liberalising the domestic
financial sector during that period. In contrast, Thailand implemented substantial domestic
financial liberalisation only after a rapid liberalisation of the capital account during the
second half of the 1980s. Poland, finally, is an intermediate case: it started with liberalising
the domestic financial sector, but then opened up the capital account extremely rapidly with
the domestic financial sector catching up gradually.
Among the controls, GDP per capita is from the Penn World Tables (PWT6.1, series rgdpch).
Commodities terms of trade are calculated for 32 commodities.9 Among three measures of
“distance” between countries, trade intensity (imports plus exports) comes from the World
Integrated Trade Solution (WITS) database, military alliances from Johnson et al. (2007), and
geographical distance from www.cepii.fr/anglaisgraph/bdd/distances.htm, respectively. As
Giavazzi and Tabellini (2005) found that political reforms lead to economic reforms, we also
include two controls of political liberalisation. The “Polity IV” score from
www.systemicpeace.org/polity/polity4.htm is a time-varying measure that captures the
“concomitant qualities of democratic autocratic authority in governing institutions”, ranging
from -10 (hereditary monarchy) to +10 (consolidated democracy). In addition, we include the
durability of a political regime from the same database to control for within-country stability
and the time trend for reforms.
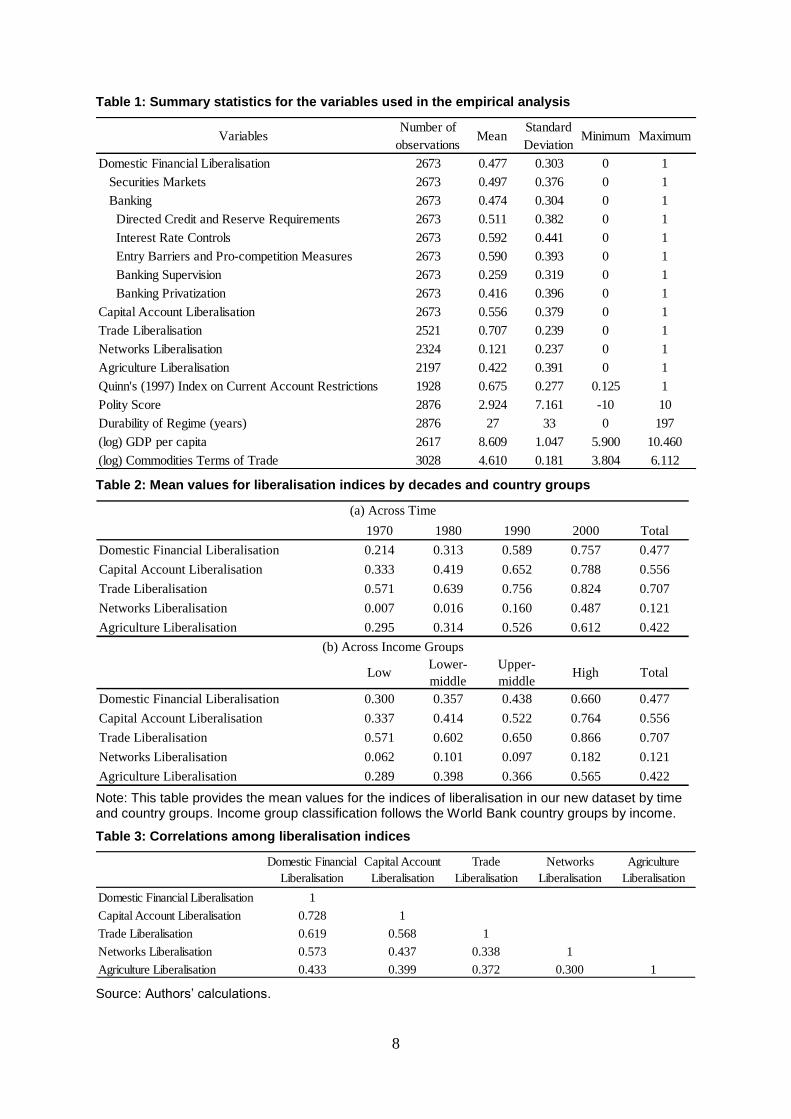
Tables 1 and 2 show the descriptive statistics as well as the mean values of the liberalisation
indices by decade and by country group. Table 3 presents the correlations between the
liberalisation indices. It seems likely that many of the sectors within a country get liberalised
simultaneously, which points to a potentially high degree of correlation between the indices
that could bias inference if the indices were included in the same regression.10
However, the
only pair of variables that has a correlation greater than 0.5 is that of trade and capital account
liberalisation (0.57). To be sure, we estimated the impact of these variables individually in
separate regressions in the specifications discussed below and found that our results are
unchanged, thereby confirming that multicollinearity should not be a concern.
9 According to the formula
, ,
, , ,( / ) / ( / )i j i jX M
j t i t t i t t
i i
TOT P MUV P MUV , where Pi is the price of
commodity i from the IMF’s Commodity Price System, MUV is the manufacturing unit value index from the
IMF’s World Economic Outlook database, Xi,j is the share of exports of commodity i in country j’s total trade
averaged over 1980–2001, and Mi,j is the share of imports of commodity i in country j’s total trade averaged
over 1980–2001. Export and import figures come from the World Integrated Trade Solution (WITS) database. 10
To guard against any distortion in inference due to multicollinearity, we check the condition index and
variance inflation factors (VIFs) for each of our explanatory liberalisation indices and confirm that none of them
exceeds the rule-of-thumb value of 10. In fact, the maximum VIF is 2.99 and the mean VIF is 2.18.
8
Table 1: Summary statistics for the variables used in the empirical analysis
VariablesNumber of
observationsMean
Standard
DeviationMinimum Maximum
Domestic Financial Liberalisation 2673 0.477 0.303 0 1
Securities Markets 2673 0.497 0.376 0 1
Banking 2673 0.474 0.304 0 1
Directed Credit and Reserve Requirements 2673 0.511 0.382 0 1
Interest Rate Controls 2673 0.592 0.441 0 1
Entry Barriers and Pro-competition Measures 2673 0.590 0.393 0 1
Banking Supervision 2673 0.259 0.319 0 1
Banking Privatization 2673 0.416 0.396 0 1
Capital Account Liberalisation 2673 0.556 0.379 0 1
Trade Liberalisation 2521 0.707 0.239 0 1
Networks Liberalisation 2324 0.121 0.237 0 1
Agriculture Liberalisation 2197 0.422 0.391 0 1
Quinn's (1997) Index on Current Account Restrictions 1928 0.675 0.277 0.125 1
Polity Score 2876 2.924 7.161 -10 10
Durability of Regime (years) 2876 27 33 0 197
(log) GDP per capita 2617 8.609 1.047 5.900 10.460
(log) Commodities Terms of Trade 3028 4.610 0.181 3.804 6.112
Table 2: Mean values for liberalisation indices by decades and country groups
1970 1980 1990 2000 Total
Domestic Financial Liberalisation 0.214 0.313 0.589 0.757 0.477
Capital Account Liberalisation 0.333 0.419 0.652 0.788 0.556
Trade Liberalisation 0.571 0.639 0.756 0.824 0.707
Networks Liberalisation 0.007 0.016 0.160 0.487 0.121
Agriculture Liberalisation 0.295 0.314 0.526 0.612 0.422
LowLower-
middle
Upper-
middleHigh Total
Domestic Financial Liberalisation 0.300 0.357 0.438 0.660 0.477
Capital Account Liberalisation 0.337 0.414 0.522 0.764 0.556
Trade Liberalisation 0.571 0.602 0.650 0.866 0.707
Networks Liberalisation 0.062 0.101 0.097 0.182 0.121
Agriculture Liberalisation 0.289 0.398 0.366 0.565 0.422
(a) Across Time
(b) Across Income Groups
Note: This table provides the mean values for the indices of liberalisation in our new dataset by time and country groups. Income group classification follows the World Bank country groups by income.
Table 3: Correlations among liberalisation indices
Domestic Financial
Liberalisation
Capital Account
Liberalisation
Trade
Liberalisation
Networks
Liberalisation
Agriculture
Liberalisation
Domestic Financial Liberalisation 1
Capital Account Liberalisation 0.728 1
Trade Liberalisation 0.619 0.568 1
Networks Liberalisation 0.573 0.437 0.338 1
Agriculture Liberalisation 0.433 0.399 0.372 0.300 1
Source: Authors’ calculations.

9
3. Estimation strategy
We estimate the following dynamic equation:
, , 1 , 1 , 1 , 1
2
, ,
1
k l m
i t i t k i t l i t m i t
k l m
t i j i t j i t
j
DF DF y x z
DF v
( 1 )
where
DF = domestic financial liberalisation;
k = TR (trade), CA (capital account), AG (agriculture), and PR (energy, telecom)
liberalisation;
,
k
i ty = liberalisation index of sector k in country i in year t;
,
l
i tx = other determinants of reforms varying across countries and years;
,
m
i tz = other determinants of reforms varying across countries and years;
t = time effects;
i = country effects;
,i tv = serially uncorrelated errors.
Our focus is on the parameters and k that measure the state dependence of the
liberalisation within and across sectors. The parameter controls for the tendency of
liberalisation levels to converge across countries. The more negative it is, the larger will be
the gap between the pace of liberalisation of a country at a low level of liberalisation and that
of a country at a high level of liberalisation, with the former being greater than the latter. We
estimate the model in differences because, as Chart 1 demonstrates, there is strong
autoregressive correlation in our panel.
Given the dynamic and feedback effects that characterise model (1), we cannot consider the
regressors , 1i ty strictly exogenous. However, in the absence of omitted variable bias (as well
as other possible sources of endogeneity bias such as measurement error) and with serially
uncorrelated errors thanks to including2
,
1
j i t j
j
y
, the , 1i ty are predetermined. Under these
assumptions, OLS estimates of the parameters in model (1) are consistent because the
sequential moment restrictions hold and T is large (see Arellano, 2003, pp. 149–150).
However, if there were omitted variables correlated with the regressors, the , 1i ty would not
be predetermined but endogenous and the parameter estimates would no longer be consistent.
At the same time, the risk of weak instrument bias implies that abandoning OLS for
instrumental variable estimators is not costless. Thus, we present results for both OLS and
instrumental variable estimators, specifically 2SLS and system GMM, as we will discuss
shortly.

10
To reduce omitted variable bias, we control for year and country fixed effects that account for
highly persistent characteristics such as institutions, property rights and the broad relative
income level. However, we also present results without them because the interpretation of our
parameters of interest k varies with t and i .11
We also control for other lagged
determinants of reforms varying across countries and years, , 1
l
i tx , such as output per capita
and commodities terms of trade, and other determinants of reforms varying across sectors,
countries and years, ,
m
i tz , such as political liberalisation. We also control for the liberalisation
levels in the same sector of all other countries in the sample, averaged with weights based on
three alternative measures of distance, as discussed in Section 2.
We cannot control, however, for one other potentially important source of omitted variable
bias related to domestic omitted factors varying across countries and years that influence the
timing of reforms: a reform-minded policy-maker may implement reforms according to a
sequence dictated not by the desire to weaken interest group – in which case we would still
be able to test whether some reforms were more effective than others in this respect – but
because of constraints in “reform technology”. For example, some forms of capital account
reform may be adopted earlier than trade liberalisation because they only require a change in
regulation that the central bank or the government can introduce without the legislature, while
tariff reductions need to be approved by parliament and may require an international
agreement. In this case, although the political consensus to reform both the capital account
and trade is possibly reached at the same time and there is no relevant information in the
observed sequencing, we risk concluding that capital account liberalisation causes trade
liberalisation. Similar spurious sequencing may emerge for any other factor leading to reform
one sector before another in the presence of unchanged social and political support and no
causal effect from one reform to the other.
To address such possible residual omitted variable bias, we adopt a three-pronged strategy to
be able to make causal inferences. First, we run estimates on five-year intervals under the
assumption that five-year lags of liberalisation indices are uncorrelated with current omitted
time-varying liberalisation drivers at the country level. These long lags should take care of
non-lasting omitted causes of spurious sequencing like those discussed in the previous
paragraph.
Second, we use our weighted average levels of liberalisation in all other countries in the
sample, ,
m
i tz , as instrumental variables in 2SLS regressions. This identification strategy hinges
on cross-border imitation of policies – which is well-established in the literature (Benmelech
and Moskowitz, 2007; Giuliano et al., 2010; Simmons and Elkins, 2004) – as an exogenous
source of variation. The identifying assumptions are that: (i) the rest of the world will not
introduce reforms in response to those of any individual country; and (ii) imitation effects
work only through same-sector reforms (that is, we impose the exclusion restriction that a
capital account reform among neighbours makes the country more willing to liberalise the
11
For example, controlling for year fixed effects implies that the effect of a given liberalisation level , 1i ty
declines as time passes because all reforms trend upwards and, as a result, the difference of a given liberalisation
level from the yearly mean diminishes as time goes by. However, it is not obvious that the effects of
liberalisation should be assessed only in relative terms. Similarly, allowing for country dummies implies that we
rely only on the within variation in the data to investigate whether one reform is conducive to another. While
country dummies are important to control for unobservable invariant country specific effects correlated with the
liberalisation indicators, they preclude us from using between country variation in the data for inference and,
therefore, assessing whether countries with higher levels of liberalisation in one sector are more likely to reform
another.

11
capital account but not other sectors). In other words, we achieve identification by excluding
from each reform equation in (1) the ,
m
i tz associated with the other reforms. Under the
additional assumption that five-year-lags of liberalisation are predetermined, we use the over-
identifying restriction test to verify instrument validity. To check for weak instruments, we
inspect the first stage regressions and the Anderson’s likelihood ratio.
Third, to check whether our results hold when the specification is estimated in levels, we use
system GMM which allows for dynamics and thus can handle the serial correlation more
easily. We use the five-year intervals here as annual data produce too many instruments and
can weaken the Hansen over-identification test to the point that it becomes meaningless
(Roodman, 2009). Indeed, dynamic GMM is primarily intended for panels with small T and
large N.
Note that our identification strategy requires the assumption that any heterogeneity in the
effects of liberalisation in other sectors is not correlated with domestic financial reforms.12
This would fail if countries self-selected into domestic financial reforms based on the
expected effect on another sector, for example, if many policy-makers had read Rajan-
Zingales and believed that liberalising trade could be used as a means towards the end of
domestic financial liberalisation.
12
See Persson and Tabellini (2007) for a broader discussion of this issue.
12
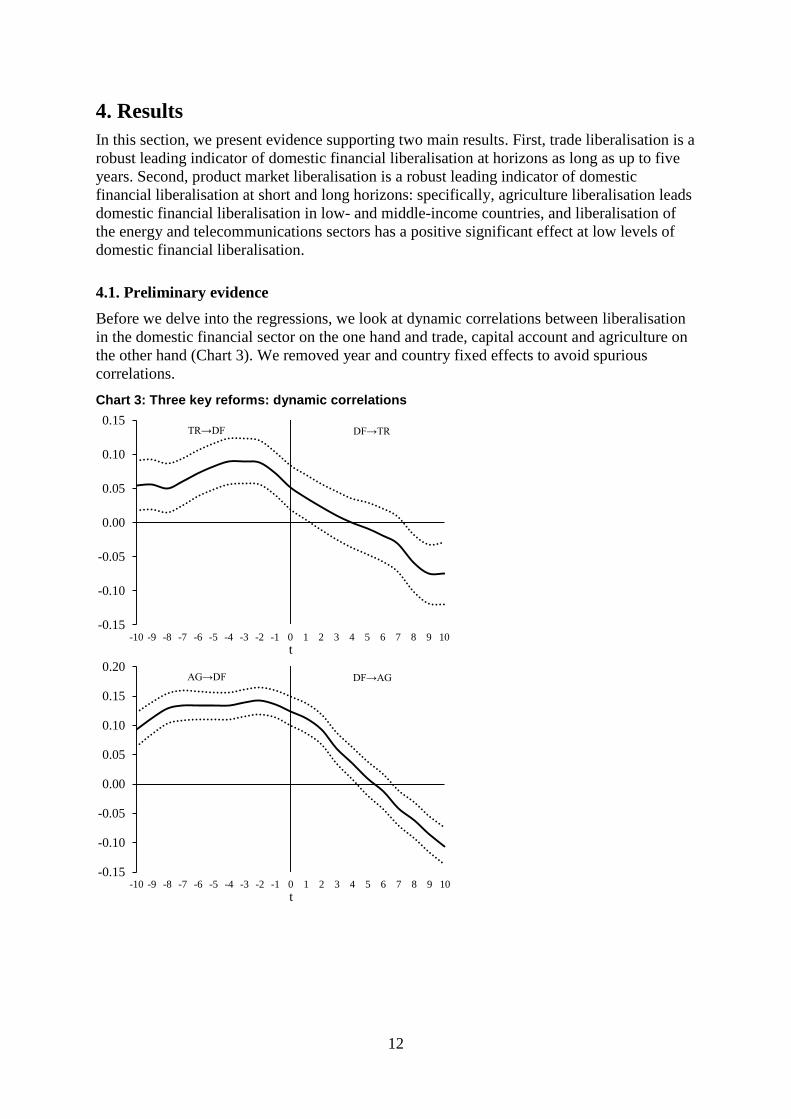
4. Results
In this section, we present evidence supporting two main results. First, trade liberalisation is a
robust leading indicator of domestic financial liberalisation at horizons as long as up to five
years. Second, product market liberalisation is a robust leading indicator of domestic
financial liberalisation at short and long horizons: specifically, agriculture liberalisation leads
domestic financial liberalisation in low- and middle-income countries, and liberalisation of
the energy and telecommunications sectors has a positive significant effect at low levels of
domestic financial liberalisation.
4.1. Preliminary evidence
Before we delve into the regressions, we look at dynamic correlations between liberalisation
in the domestic financial sector on the one hand and trade, capital account and agriculture on
the other hand (Chart 3). We removed year and country fixed effects to avoid spurious
correlations.
Chart 3: Three key reforms: dynamic correlations
-0.15
-0.10
-0.05
0.00
0.05
0.10
0.15
-10 -9 -8 -7 -6 -5 -4 -3 -2 -1 0 1 2 3 4 5 6 7 8 9 10
t
TR→DF DF→TR
-0.15
-0.10
-0.05
0.00
0.05
0.10
0.15
0.20
-10 -9 -8 -7 -6 -5 -4 -3 -2 -1 0 1 2 3 4 5 6 7 8 9 10
t
AG→DF DF→AG
13
-0.10
-0.05
0.00
0.05
0.10
0.15
0.20
-10 -9 -8 -7 -6 -5 -4 -3 -2 -1 0 1 2 3 4 5 6 7 8 9 10
t
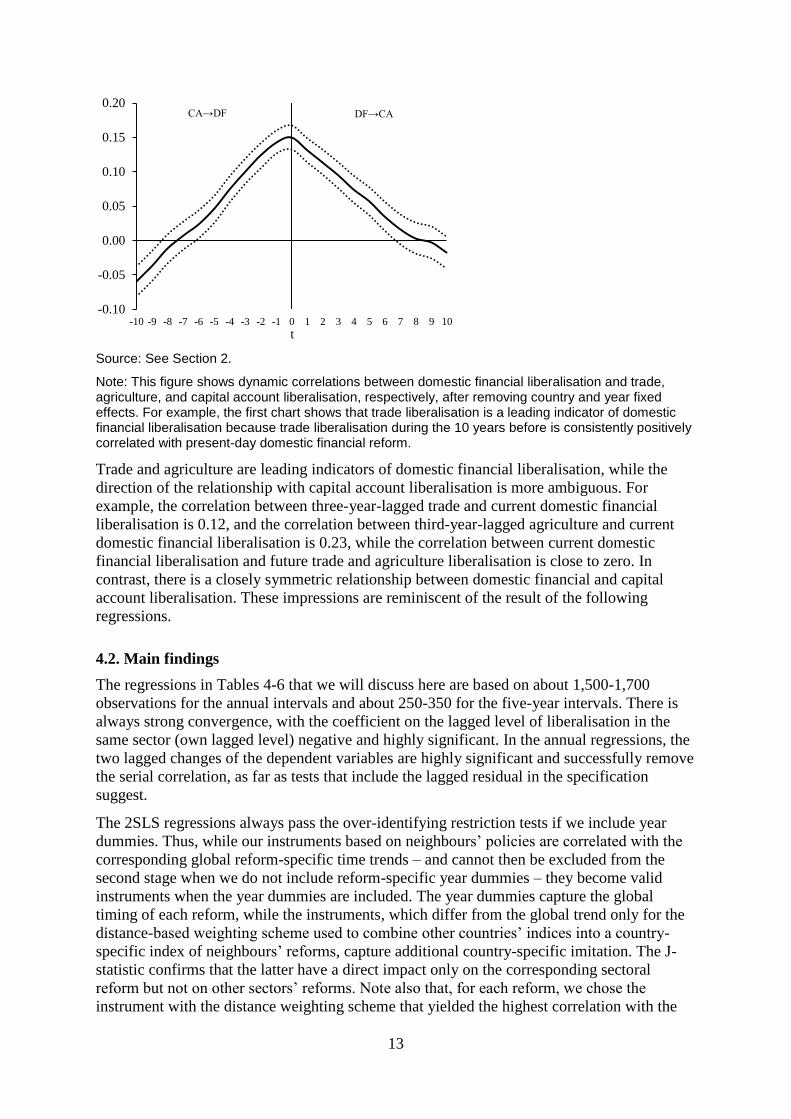
CA→DF DF→CA
Source: See Section 2.
Note: This figure shows dynamic correlations between domestic financial liberalisation and trade, agriculture, and capital account liberalisation, respectively, after removing country and year fixed effects. For example, the first chart shows that trade liberalisation is a leading indicator of domestic financial liberalisation because trade liberalisation during the 10 years before is consistently positively correlated with present-day domestic financial reform.
Trade and agriculture are leading indicators of domestic financial liberalisation, while the
direction of the relationship with capital account liberalisation is more ambiguous. For
example, the correlation between three-year-lagged trade and current domestic financial
liberalisation is 0.12, and the correlation between third-year-lagged agriculture and current
domestic financial liberalisation is 0.23, while the correlation between current domestic
financial liberalisation and future trade and agriculture liberalisation is close to zero. In
contrast, there is a closely symmetric relationship between domestic financial and capital
account liberalisation. These impressions are reminiscent of the result of the following
regressions.
4.2. Main findings
The regressions in Tables 4-6 that we will discuss here are based on about 1,500-1,700
observations for the annual intervals and about 250-350 for the five-year intervals. There is
always strong convergence, with the coefficient on the lagged level of liberalisation in the
same sector (own lagged level) negative and highly significant. In the annual regressions, the
two lagged changes of the dependent variables are highly significant and successfully remove
the serial correlation, as far as tests that include the lagged residual in the specification
suggest.
The 2SLS regressions always pass the over-identifying restriction tests if we include year
dummies. Thus, while our instruments based on neighbours’ policies are correlated with the
corresponding global reform-specific time trends – and cannot then be excluded from the
second stage when we do not include reform-specific year dummies – they become valid
instruments when the year dummies are included. The year dummies capture the global
timing of each reform, while the instruments, which differ from the global trend only for the
distance-based weighting scheme used to combine other countries’ indices into a country-
specific index of neighbours’ reforms, capture additional country-specific imitation. The J-
statistic confirms that the latter have a direct impact only on the corresponding sectoral
reform but not on other sectors’ reforms. Note also that, for each reform, we chose the
instrument with the distance weighting scheme that yielded the highest correlation with the

14
corresponding sectoral liberalisation index, because the three distance-weighting schemes
yield measures that are too correlated to be all included in the regression at the same time.13
The Anderson likelihood ratio statistic and other standard tests on first-stage results, such as
the Hausman et al. (2005) tests, confirm that the instruments are not weak.
Among the controls, the two democratisation scores are those relatively most influential.
Though not consistently significant, they always have a positive sign, confirming the finding
in the literature that political reforms lead to financial reforms. The commodities terms of
trade and GDP per capita are significant only in a few regressions, and never at the 5 per cent
level.
4.2.1. Trade leads domestic financial liberalisation
The top lines in Tables 4-6 document our first key result: trade liberalisation helps to predict
domestic financial liberalisation. This effect is statistically significant across 24 regressions,
whether we look at OLS regressions where the dependent variable is the one-year change
(Table 4) or the five-year change (Table 5), or 2SLS regressions (Table 6). It holds
irrespectively of whether we allow for a constant, year dummies, country dummies, or
country and year dummies, and whether we do or do not include lagged GDP per capita and
commodities terms of trade.
The size of the effects is substantial, considering that we control for year and country fixed
effects, as well as several other factors: a one-standard-deviation increase in the trade
liberalisation index increases the domestic financial development index by 0.10-0.15 standard
deviations in the long run. In a real-world example, according to these estimates, Korea’s
trade liberalisation during the 1980s and 1990s would account for roughly 0.1 of the 0.5 point
increase of the domestic financial liberalisation index during that period.
The statistical significance of trade liberalisation also in Table 5 which shows five-year
intervals is an indication that the effects of trade liberalisation are long-lasting and not due to
spurious cyclical fluctuations. Even several years after its occurrence, a step towards trade
liberalisation is followed by more domestic financial reform than there would be without
trade opening.14
To the extent that domestic financial liberalisation is associated with
financial development and the latter with higher growth, these findings are consistent with
Quinn and Toyoda (2008), who have shown that current account liberalisation has a greater
effect on growth than capital account liberalisation.
4.2.2. Capital account leads domestic financial liberalisation only in short term
The second line in Tables 4-6 shows the effect of capital account liberalisation on domestic
financial reform. In the OLS regressions, the coefficient is significant at the 5 per cent level
only in the annual estimates under the largest set of dummies and controls (column 8 of Table
4). At best, this would suggest a short-lived positive effect of capital account liberalisation on
domestic financial reform. In the 2SLS and GMM regressions, capital account liberalisation
enters with a consistently negative coefficient; though not highly statistically significant, this
13
Specifically, we used the weighting scheme based on geographical distance for the trade, capital account and
agriculture indices, and trading partners for the networks index. 14
The larger coefficients in the annual than in the five-year regressions are entirely due to the dynamic
estimation and the different frequency. The long-run multipliers of the coefficients from each regression –
obtained by dividing each coefficient by the coefficient on the own lagged level – are actually very similar. Also
the larger explanatory power of the regressions on five-year intervals is due only in part to the fact that it might
be easier to predict reforms over a five-year horizon than in any specific year. Most of the difference in the R-
squared is, in fact, due to the greater explanatory power of time dummies in the five-year regressions.

15
would suggest that capital account liberalisation even constitutes an obstacle to domestic
financial reform. This result holds also when we allow for a non-linear effect as we will
discuss below.
These findings are also interesting to view against the background of increasing evidence that
rapid financial liberalisation, particularly in the capital account, is often followed by boom-
bust cycles (Kaminsky and Reinhart, 1999; Glick and Hutchinson, 2001), where the ensuing
financial crises might then lead to a reversal of at least part of the earlier liberalisation, and
that capital account liberalisation in the absence of a sufficiently reformed domestic financial
sector increases volatility and crisis risk (Bekaert et al., 2006; Martin and Rey, 2006).
Rousseau and Wachtel (2008) found that this effect reduces the benefits of financial
development for growth. This empirical evidence is also in line with the argument in the
earlier sequencing literature (Edwards, 1984; McKinnon, 1991) that as long as the domestic
financial system is distorted by interest rate regulations and directed credit, it is pointless –
indeed destructive – to allow capital mobility, because it would lead to capital flight that
erodes the domestic deposit base or over-borrowing in foreign currency that is risky and
would only be misallocated domestically.
4.2.3. Product market leads domestic financial liberalisation
The first result from including product market liberalisation we have already discussed: the
effect of trade is robust to including it and thus has an autonomous effect on domestic
financial reform. As a new key result, we also find conclusive evidence of a positive effect of
agriculture liberalisation on domestic financial reform. Agriculture liberalisation has a highly
significant positive coefficient no matter what dummies we include and what estimation
method we apply. Estimating separate agriculture coefficients by income group (available on
request), we find that the effect for low- and middle-income countries is bigger and more
significant than that for high-income countries, as it could be expected in light of the
respective role of the agriculture sector.
For the networks industries (energy and telecommunications), there is prima facie no
consistent evidence of an effect on domestic financial reform. In the next subsection, we
show, however, that this effect is positive and highly significant when domestic financial
liberalisation is in its initial stages. We also find that the network industries coefficient
becomes positive and significant when we allow for the significantly negative interaction
between trade and networks liberalisation (available on request). In other words, trade and
product market liberalisation are substitutes in determining domestic financial liberalisation.
That is, when there is not much trade liberalisation, product market liberalisation has a
positive effect on domestic financial reform. Given that both reforms would likely lead to
greater product market competition, which is the channel through which the interest group
theory foresees the shift in domestic political economy equilibrium occurring, their
substitutability is consistent with Rajan and Zingales’s hypothesis.
4.3. Extensions and robustness
In this sub-section we present additional evidence on (1) sub-indices of domestic financial
liberalisation; (2) non-linear effects; and (3) robustness to the use of alternative estimators.
4.3.1. Primacy of securities markets liberalisation
Our dataset allows us also to study the impact of trade liberalisation on the components of the
domestic financial liberalisation index, distinguishing first between its banking and securities

16
markets components and then considering separately the five banking sub-indices. Table 7
shows that the impact of trade liberalisation on domestic financial liberalisation occurs
primarily through securities markets liberalisation. Also the aforementioned negative impact
of capital account liberalisation on domestic financial liberalisation occurs primarily through
the securities markets component, rather than through the banking components.
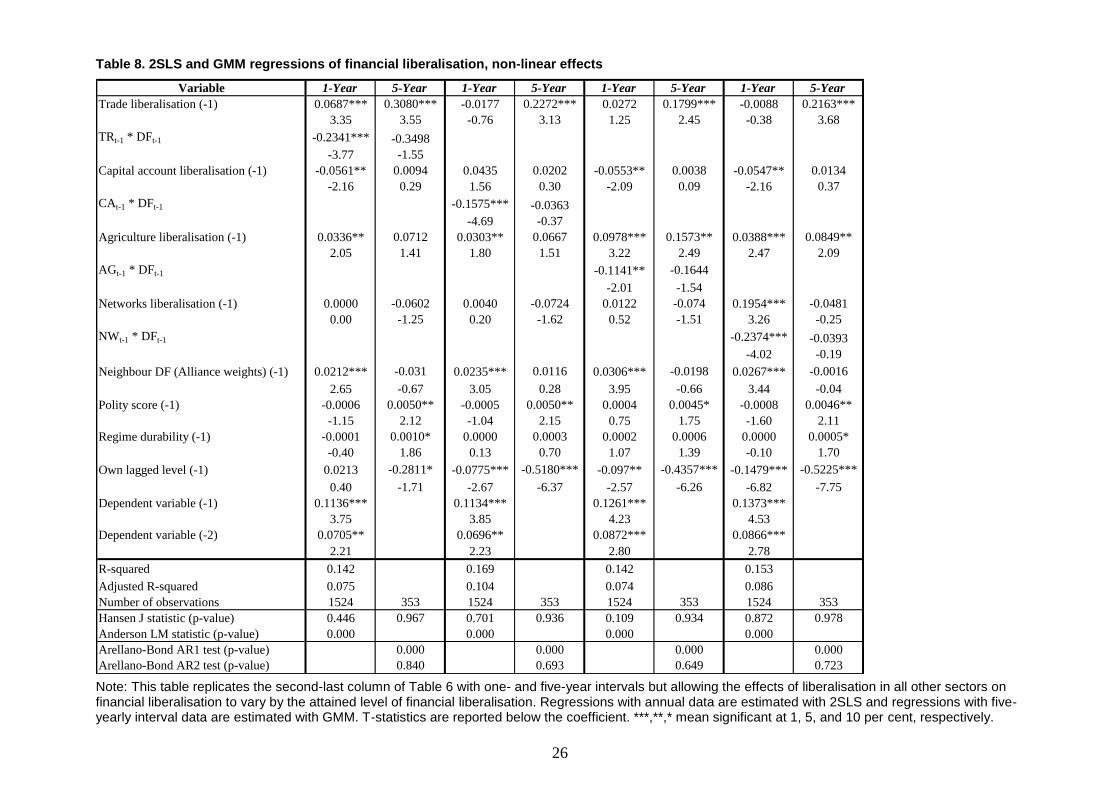
4.3.2. Non-linear effect of networks liberalisation
Liberalising other sectors may have a bigger impact on domestic financial liberalisation when
the latter is in its initial stages than when it is well advanced. If so, parameters k in equation
(1), which measure the state dependence of domestic liberalisation across sectors, should be a
declining function of domestic financial liberalisation. Evidence of such non-linear effect
would be a negative coefficient on the interaction between each sector’s liberalisation index
and the domestic financial liberalisation index and a positive direct effect of each index.15
As expected, Table 8 shows that the interaction term is negative for all types of reforms and
at all frequencies. However, only in the case of networks liberalisation the non-linear
specification uncovers a new result. While it had no significant positive effect in Tables 4-7,
it now has a positive and highly significant direct coefficient with a highly negative and
significant interaction term in the annual interval regressions, suggesting strong effects of
networks liberalisation at low levels of domestic financial liberalisation (column 7 in
Table 8).
4.3.3. Alternative estimators
We applied alternative estimators to check two potential issues. First, to ensure the robustness
of our system GMM results in the five-year interval regressions, we estimate them with
difference GMM and with various lag lengths as instruments. We find again that trade and
agriculture liberalisation have a highly significantly positive effect on domestic financial
liberalisation, while there is no significant effect from capital account liberalisation. Second,
although we are not actually truncating the data (see Section 2), to be sure that the [0,1]
bounds on our indices do not bias our conclusions, we run all regressions with the maximum
likelihood estimator assuming a truncated distribution, and results are unchanged.16
4.3.4. Other extensions
The results of several further extensions are available on request. First, we replaced in the
regressions of Tables 4–6 the capital account liberalisation index we used so far with Quinn’s
(1997) index (extended to 2005, available for about 60 countries) to verify whether our weak
results about the effects of capital account liberalisation might depend on the index we use.
Quinn’s overall index is not significant in all our regressions, failing to confirm even the
short-term leading indicator effect we had detected with our index.
15
A non-linear specification may unveil the effect of reforms that tend to take place later in the sample and,
therefore, at relatively high levels of domestic financial liberalisation. For these reforms, in a simple linear
specification, the preponderance of observations where there is no scope for further domestic financial
liberalisation may obscure a potential positive role in the early stages of domestic financial liberalisation.
Moreover, a negative interaction term could also be considered a sign that reforms in other sectors could
accelerate the speed of convergence to the steady state level of domestic financial sector liberalisation.
According to this alternative interpretation,,DF DF (the convergence term) would be a negative function of
reforms in other sectors. 16
See Simar and Wilson (2007) for a discussion of truncation issues arising from a finite number of
observations.

17
We also explored the potential effect of the interaction between trade and capital account
liberalisation on domestic financial reform. In a strict interpretation of Rajan and Zingales’s
interest group theory, a combination of trade and capital account liberalisation should have a
greater impact than each of them separately, as discussed in Section 1. However, the
estimated interaction term is not statistically significant.
18
5. Conclusions
We have provided a new test of the interest group theory of financial development based on
regulation. Moreover, we have suggested and tested an extension to the theory in that product
market liberalisation may have similar effects on financial liberalisation as stipulated for
trade by Rajan and Zingales (2003) by shifting the relative costs and benefits of financial
liberalisation for incumbents. In doing so we have for the first time examined the sequencing
of trade, product market, capital account and domestic financial liberalisation for an
encompassing country panel.
Our findings support the primacy of trade implied by Rajan and Zingales’s (2003) interest
group theory: trade liberalisation is a significant leading indicator of domestic financial
liberalisation. However, we do not find evidence in favour of the view that capital account
liberalisation – or its interaction with trade – is a leading indicator of domestic financial
liberalisation. Our additional new result that product market liberalisation is a leading
indicator of domestic financial reform is consistent with Rajan and Zingales’s view that the
opposition of interest groups to domestic financial liberalisation weakens as product markets
become more competitive.

19
References
A. Abiad and A. Mody (2005), “Financial Reform: What Shakes It? What Shapes It?”,
American Economic Review 95, 66–88.
A. Abiad, E. Detragiache and T. Tressel (2010), “A New Database of Financial Reforms”,
IMF Staff Papers 57, 281–302.
D. Acemoglu, S. Johnson and J.A. Robinson (2001), “The Colonial Origins of Comparative
Development: An Empirical Investigation”, American Economic Review 91, 1369–
1401.
D. Acemoglu, S. Johnson and J.A. Robinson (2005), “Institutions as the Fundamental Cause
of Long-run Growth”, in P. Aghion and S.N. Durlauf (eds.), Handbook of Economic
Growth, North-Holland, Amsterdam.
M. Arellano (2003), Panel Data Econometrics, Oxford University Press, Oxford.
B.H. Baltagi, P.O. Demetriades and S.H. Law (2009), “Financial Development and
Openness: Evidence from Panel Data”, Journal of Development Economics 89, 285–
296.
D. Barlow and R. Radulescu (2005), “The Sequencing of Reform In Transition Economies”,
Journal of Comparative Economics 33, 835–850.
T. Beck, R. Levine, and N. Loayza (2000), “Finance and the Sources of Growth”, Journal of
Financial Economics 58, 261–300.
G. Bekaert, H.R. Campbell, and C. Lundblad, (2006), “Growth Volatility and Financial
Liberalization”, Journal of International Money and Finance 25, 370–403.
E. Benmelech and T.J. Moskowitz (2007), “The Political Economy of Financial Regulation:
Evidence from U.S. State Usury Laws in the 19th Century”, Journal of Finance 65,
1029–1073.
J.H. Boyd, R. Levine, and B. Smith (2001), “The Impact of Inflation on Financial Sector
Performance”, Journal of Monetary Economics 47, 221–248.
M. Braun and C. Raddatz (2008), “The Politics of Financial Development: Evidence from
Trade Liberalization”, Journal of Finance 63, 1469–1508.
M.D. Chinn and H. Ito (2006), “What Matters for Financial Development? Capital Controls,
Institutions, and Interactions”, Journal of Development Economics 81, 163–92.
S. Claessens and L. Laeven (2003), “Financial Development, Property Rights, and Growth”,
Journal of Finance 58, 2401–2436.
M.A. Clemens and J.G. Williamson (2004), “Why Did the Tariff-Growth Correlation Change
After 1950?”, Journal of Economic Growth 9, 5–46.
S. Edwards (1984), “The Order of Liberalization of the External Sector in Developing
Countries”, Princeton Essay in International Finance No. 156. Princeton University,
Princeton.

20
F. Giavazzi and G. Tabellini (2005), “Economic and Political Liberalizations”, Journal of
Monetary Economics 52, 1297–1330.
P. Giuliano, P. Mitra, and A. Spilimbergo (2010), “Democracy and Reforms: Evidence from
a New Dataset”, IMF Working Papers 10/173, International Monetary Fund,
Washington.
R. Glick and M. Hutchison (2001), Financial Crises in Emerging Markets, Cambridge
University Press, Cambridge.
L. Guiso, P. Sapienza, and L. Zingales (2004), “The Role of Social Capital in Financial
Development”, American Economic Review 94, 526–556.
D. Hauner (2008), “Public Debt and Financial Development”, Journal of Development
Economics 88, 171–183.
J. Hausman, J.H. Stock, and M. Yogo (2005), “Asymptotic Properties of the Hahn-Hausman
Test for Weak Instruments”, Economics Letters 89, 333–342.
P.B. Henry (2007), “Capital Account Liberalization: Theory, Evidence, and Speculation”,
Journal of Economic Literature 45, 887–935.
International Monetary Fund (2009), Structural Reforms and Economic Performance in
Advanced and Developing Countries (Washington: International Monetary Fund),
available at www.imf.org/external/np/res/docs/2008/pdf/061008.pdf (last accessed
8/12/12).
S. Johnson, J.D. Ostry, and A. Subramanian (2007), “The Prospects for Sustained Growth in
Africa: Benchmarking the Constraints”, IMF Working Paper No. 07/52, International
Monetary Fund, Washington.
G.L. Kaminsky and C.M. Reinhart (1999), “The Twin Crises: The Causes of Banking and
Balance-of-Payments Problems”, American Economic Review 89, 473–500.
B. Kim and L.W. Kenny (2007), “Explaining When Developing Countries Liberalize Their
Financial Equity Markets”, Journal of International Financial Markets, Institutions
and Money 17, 387–402.
M.A. Kose, E. Prasad, K. Rogoff, and S. Wei (2006), “Financial Globalization: A
Reappraisal”, IMF Working Paper No. 06/189, International Monetary Fund,
Washington.
R. La Porta, F. Lopez-de-Silanes, A. Shleifer, and R.W. Vishny (1997), “Legal Determinants
of External Finance”, Journal of Finance 52, 1131–1150.
P. Martin and H. Rey (2006), “Globalization and Emerging Markets: With or Without
Crash”, American Economic Review 96, 1631–1651.
R.I. McKinnon (1991), The Order of Economic Liberalization: Financial Control in the
Transition to a Market Economy, Johns Hopkins University Press, Baltimore.
T. Persson and G. Tabellini (2007), “The Growth Effect of Democracy: Is It Heterogenous
and How Can It Be Estimated”, Working Paper No. 13150, National Bureau of
Economic Research, Cambridge.

21
D. Quinn (1997), “The Correlates of Change in International Financial Regulation”,
American Political Science Review 91, 531–551.
D. Quinn and A.M. Toyoda (2008), “Does Capital Account Liberalization Lead to Growth?”,
Review of Financial Studies 21, 1403–1449.
R.G. Rajan and R. Ramcharan (2008), “Landed Interests and Financial Underdevelopment in
the United States”, Working Paper No. 14347, National Bureau of Economic
Research, Cambridge.
R.G. Rajan and L. Zingales (2003), “The Great Reversals: The Politics of Financial
Development in the Twentieth Century”, Journal of Financial Economics 69, 5–50.
F. Rodríguez and D. Rodrik (2001), “Trade Policy and Economic Growth: A Skeptic’s Guide
to the Cross-National Evidence”, in: B. Bernanke and K. Rogoff (eds.), NBER
Macroeconomics Annual 2000, National Bureau of Economic Research, Cambridge.
D. Roodman (2009), “A Note on the Theme of Too Many Instruments”, Oxford Bulletin of
Economics and Statistics 71, 135-158.
P.L. Rousseau and P. Wachtel (2008), “What Is Happening to the Impact of Financial
Deepening on Economic Growth?”, Economic Inquiry 49, 276–288.
J.D. Sachs and A. Warner (1995), “Economic Reform and the Process of Global Integration”,
Brookings Papers on Economic Activity 1, 1–118.
L. Simar and P. Wilson (2007), “Estimation and Inference in Two-Stage, Semi-Parametric
Models of Production Processes”, Journal of Econometrics 136, 31-64.
B.A. Simmons and Z. Elkins (2004), “The Globalization of Liberalization: Policy Diffusion
in the International Policy Economy”, American Political Science Review 98, 171–
189.
R. Stulz and R. Williamson (2003), “Culture, Openness, and Finance”, Journal of Financial
Economics 70, 313–349.
T. Tressel (2008), “Unbundling the Effects of Reform”, Mimeo, International Monetary Fund.

22
Table 4. OLS regressions of financial liberalisation, annual intervals
Basic Controls Basic Controls Basic Controls Basic Controls
Trade liberalisation (-1) 0.0306*** 0.0312*** 0.0283*** 0.0267*** 0.0565*** 0.0541*** 0.0317*** 0.0324***
4.23 4.21 4.10 3.77 5.07 4.82 2.95 3.02
Capital account liberalisation (-1) 0.0027 0.0047 0.0062 0.0056 0.0121* 0.014* 0.0095 0.0136**
0.48 0.83 1.16 1.00 1.72 1.93 1.40 1.97
Agriculture liberalisation (-1) 0.0051 0.0055 0.0080** 0.0079** 0.0291*** 0.0262*** 0.0263*** 0.0213**
1.45 1.55 2.28 2.25 3.38 3.05 3.18 2.56
Networks liberalisation (-1) -0.0024 -0.0036 -0.0049 -0.0048 -0.002 -0.0035 -0.0005 -0.0078
-0.54 -0.81 -0.94 -0.92 -0.32 -0.53 -0.07 -1.06
Neighbour DF (Alliance weights) (-1) 0.0114*** 0.0118*** 0.0104** 0.0090* 0.0216*** 0.0199*** 0.0274*** 0.0247***
3.12 3.17 2.24 1.94 4.56 4.21 3.92 3.56
Polity score (-1) 0.0003 0.0004* 0.0003 0.0002 0.0013*** 0.0014*** -0.0001 0.0004
1.22 1.74 1.34 0.88 2.79 2.93 -0.19 0.03
Regime durability (-1) 0.0000 0.0000 0.0001*** 0.0001** 0.0006*** 0.0006*** 0.0000 0.0001
0.62 1.07 2.63 2.09 3.39 3.13 -0.08 0.72
GDP per capita (-1) -0.0025 0.0019 -0.0012 -0.0263***
-1.20 0.87 -0.15 -3.11
Commodities terms of trade (-1) -0.0082 -0.0075 -0.0272** -0.016
-1.44 -1.31 -2.35 -1.45
-0.0477*** -0.0469*** -0.0765*** -0.0779*** -0.0957*** -0.0954*** -0.1710*** -0.1717***
-6.34 -6.18 -8.79 -8.63 -7.73 -7.72 -10.82 -10.81
Dependent variable (-1) 0.1212*** 0.1164*** 0.0970*** 0.0972*** 0.1156*** 0.1122*** 0.1177*** 0.1116***
4.40 4.19 3.57 3.54 4.19 4.08 4.34 4.15
Dependent variable (-2) 0.0839*** 0.0828*** 0.0658** 0.0694** 0.0786** 0.0796*** 0.0851*** 0.0822***
2.83 2.76 2.25 2.35 2.56 2.58 2.86 2.77
R-squared 0.062 0.064 0.127 0.127 0.108 0.110 0.191 0.196
0.057 0.057 0.108 0.106 0.062 0.064 0.136 0.14
1738 1728 1738 1728 1738 1728 1738 1728
Adjusted R-squared
ConstantVariable
Year Dummies Country Dummies Country, Year Dummies
Own lagged level (-1)
Number of observations Note: This table reports OLS regressions of the change in domestic financial liberalisation with annual data. In columns labelled “basic,” the independent variables are the lagged liberalisation in the other four sectors, the weighted level of financial liberalisation in other countries, polity score, regime durability, own lagged level (of financial liberalisation) to control for convergence, and two lags of the dependent variable to account for serial correlation. In the columns labelled “controls”, the regressions also include per capita income and the commodities terms of trade. We report regressions including only a constant, year, country and combined year and country dummies to allow for various fixed effects. T-statistics are reported below the coefficient. ***,**,* mean significant at 1, 5, and 10 per cent, respectively.

23
Table 5. OLS regressions of financial liberalisation, five-year intervals
Basic Controls Basic Controls Basic Controls Basic Controls
Trade liberalisation (-1) 0.1385*** 0.1337*** 0.1266*** 0.1156*** 0.1972*** 0.1844*** 0.106*** 0.0979**
4.07 3.59 4.55 3.74 4.29 3.27 2.74 1.99
Capital account liberalisation (-1) -0.0371 -0.0397 -0.0157 -0.0267 -0.0208 -0.0123 -0.0302 -0.0177
-1.19 -1.11 -0.58 -0.84 -0.56 -0.27 -0.96 -0.44
Agriculture liberalisation (-1) 0.0209 0.0201 0.0360** 0.0354* 0.1154** 0.1333** 0.1154*** 0.0964**
1.16 0.93 2.22 1.78 2.87 2.36 3.43 2.19
Networks liberalisation (-1) -0.0493** -0.0187 -0.0211 -0.0206 -0.075** -0.0954 -0.0023 -0.0220
-2.38 -0.45 -0.87 -0.47 -2.57 -1.52 -0.07 -0.35
Neighbour DF (Alliance weights) (-1) 0.0535*** 0.0887*** 0.0338* 0.0427 0.1327*** 0.1843*** 0.1009*** 0.1049*
2.74 3.00 1.86 1.56 3.25 2.87 2.84 1.79
Polity score (-1) 0.0019* 0.0031** 0.0019* 0.0013 0.0067** 0.0086** 0.0009 0.0018
1.72 2.10 1.93 1.06 2.93 3.10 0.50 0.88
Regime durability (-1) 0.0001 0.0002 0.0004** 0.0005** 0.0028*** 0.0031* -0.0001 0.0001
0.83 0.79 2.40 1.98 2.75 1.79 -0.11 0.09
GDP per capita (-1) -0.0029 0.0043 0.0154 -0.0211
-0.87 1.37 0.95 -1.55
Commodities terms of trade (-1) -0.0104 -0.0121 -0.0357* -0.0132
-0.92 -1.15 -1.70 -0.71
Own lagged level (-1) -0.1971*** -0.1784*** -0.3228*** -0.3688*** -0.4033*** -0.4317*** -0.6937*** -0.7706***
-5.07 -3.72 -7.48 -6.56 -6.38 -4.90 -9.45 -8.29
R-squared 0.170 0.140 0.370 0.350 0.340 0.350 0.580 0.590
Adjusted R-squared 0.150 0.100 0.350 0.320 0.140 0.090 0.440 0.410
Number of observations 353 278 353 278 353 278 353 278
VariableConstant Year Dummies Country Dummies Country, Year Dummies
Note: This table reports OLS regressions of the change in domestic financial liberalisation with five-year intervals. The interval aside, the structure of the regressions is the same as in Table 4, except that no lagged dependent variables are needed given the greater intervals. T-statistics are reported below the coefficient. ***,**,* mean significant at 1, 5, and 10 per cent, respectively.

24
Table 6. 2SLS regressions of financial liberalisation, annual intervals
Basic Controls Basic Controls Basic Controls Basic Controls
Trade liberalisation (-1) 0.0324*** 0.0304*** 0.0292*** 0.0261*** 0.0855*** 0.0778*** 0.0373** 0.0331*
3.20 3.00 2.97 2.65 4.36 3.88 1.98 1.72
Capital account liberalisation (-1) -0.0188 -0.0141 -0.0122 -0.016 -0.0222 -0.0205 -0.0435* -0.0278
-1.54 -1.10 -1.06 -1.28 -0.92 -0.73 -1.78 -1.04
Agriculture liberalisation (-1) 0.0017 0.0015 0.0054 0.0054 0.0411*** 0.0416*** 0.0399*** 0.0351**
0.41 0.35 1.33 1.33 2.72 2.72 2.58 2.24
Networks liberalisation (-1) 0.0009 0.0007 -0.0101 -0.0097 0.0165 0.0185 -0.0133 -0.0208
0.14 0.11 -1.37 -1.30 1.37 1.57 -0.72 -1.10
Neighbour DF (Alliance weights) (-1) 0.0126*** 0.012*** 0.0124** 0.0099** 0.0255*** 0.0251*** 0.0293*** 0.0273***
3.22 3.11 2.51 2.03 4.56 4.43 3.81 3.61
Polity score (-1) 0.0005** 0.0005** 0.0005** 0.0003 0.0013*** 0.0014*** -0.0003 -0.0001
2.09 1.96 2.21 1.39 2.83 2.88 -0.75 -0.32
Regime durability (-1) 0.0000 0.0000 0.0001** 0.0001 0.0006*** 0.0005** 0.0000 0.0002
0.58 0.42 2.34 1.50 2.94 2.51 0.20 0.89
GDP per capita (-1) 0.0001 0.0044* 0.003 -0.024**
0.06 1.87 0.28 -2.10
Commodities terms of trade (-1) -0.0118* -0.0119* -0.0234* -0.0152
-1.74 -1.77 -1.72 -1.13
Own lagged level (-1) -0.0351*** -0.0382*** -0.0596*** -0.0631*** -0.1055*** -0.1079*** -0.1545*** -0.1619***
-3.26 -3.55 -5.55 -5.87 -4.83 -4.78 -7.02 -7.12
Dependent variable (-1) 0.1284*** 0.128*** 0.1041*** 0.1086*** 0.1319*** 0.1323*** 0.1285*** 0.121***
4.33 4.26 3.57 3.68 4.38 4.36 4.35 4.15
Dependent variable (-2) 0.082** 0.0831** 0.0601* 0.0663** 0.0937*** 0.0956*** 0.0903*** 0.0853***
2.51 2.53 1.91 2.09 2.88 2.90 2.89 2.76
R-squared 0.057 0.062 0.121 0.121 0.097 0.103 0.168 0.191
Adjusted R-squared 0.051 0.055 0.099 0.098 0.045 0.050 0.103 0.127
Number of observations 1524 1518 1524 1518 1524 1518 1524 1518
Hansen J statistic (p-value) 0.000 0.000 0.135 0.184 0.000 0.000 0.333 0.402
Anderson LM statistic (p-value) 0.000 0.000 0.000 0.000 0.000 0.000 0.000 0.000
VariableConstant Year Dummies Country Dummies Country, Year Dummies
Note: This table reports 2SLS regressions of the change in domestic financial liberalisation with annual intervals. The estimator aside, the structure of the regressions is the same as in Table 4. All liberalisation variables are treated as endogenous; each endogenous variable is instrumented by a weighted degree of the corresponding liberalisation level in other countries and a five-year lag of its own level. T-statistics are reported below the coefficient. ***,**,* mean significant at 1, 5, and 10 per cent, respectively.

25
Table 7. 2SLS regressions of financial liberalisation, sub-indices, annual intervals
DF SM BK DCRQ INTC EBCM BKSP PRIV
Trade liberalisation (-1) 0.0373** 0.0970*** 0.0308 0.0633 0.0541 0.0619 -0.0124 0.0295
1.98 2.66 1.49 1.42 0.91 1.56 -0.34 0.61
Capital account liberalisation (-1) -0.0435* -0.0769** -0.0428 -0.0925 -0.0791 -0.0427 -0.0003 -0.0449
-1.78 -2.10 -1.51 -1.58 -1.10 -0.95 -0.01 -0.87
Agriculture liberalisation (-1) 0.0399*** 0.0091 0.0494*** 0.0239 0.0352 0.0418 0.0677** 0.1050***
2.58 0.41 2.72 0.67 0.79 1.21 2.47 3.08
Networks liberalisation (-1) -0.0133 -0.0482 -0.0076 0.0182 -0.0456 -0.0795** 0.0741 -0.0076
-0.72 -1.60 -0.36 0.43 -0.97 -2.24 1.51 -0.19
Neighbour DF (Alliance weights) (-1) 0.0293*** 0.0169 0.0348*** 0.0793*** 0.057** 0.017 0.0332* 0.0309
3.81 1.40 3.90 4.45 2.47 1.02 1.86 1.48
Polity score (-1) -0.0003 0.0008 -0.0006 0.0001 0.0004 -0.0023** -0.0013* -0.0012
-0.75 0.98 -1.19 0.12 0.27 -2.26 -1.93 -1.41
Regime durability (-1) 0.0000 0.0001 0.0000 -0.0001 -0.0001 -0.0003 0.0003 0.0002
0.20 0.16 0.15 -0.26 -0.14 -0.52 0.83 0.59
Own lagged level (-1) -0.1545*** -0.1786*** -0.1662*** -0.1838*** -0.2471*** -0.1706*** -0.2284*** -0.1749***
-7.02 -6.27 -7.31 -7.82 -7.43 -7.31 -8.67 -5.31
Dependent variable (-1) 0.1285*** 0.0277 0.1063*** 0.0475* 0.0678*** 0.0351 -0.0318 0.0134
4.35 1.34 3.90 1.95 2.68 1.46 -1.43 0.47
Dependent variable (-2) 0.0903*** 0.0361 0.0739*** 0.0419 0.0292 0.0658*** -0.0198 0.0368
2.89 1.41 2.36 1.63 0.92 2.58 -0.88 1.04
R-squared 0.168 0.086 0.168 0.100 0.178 0.139 0.172 0.120
Adjusted R-squared 0.103 0.015 0.103 0.030 0.114 0.072 0.108 0.051
Number of observations 1524 1524 1524 1524 1524 1524 1524 1524
Hansen J statistic (p-value) 0.333 0.090 0.609 0.008 0.107 0.492 0.343 0.893
Anderson LM statistic (p-value) 0.000 0.000 0.000 0.000 0.000 0.000 0.000 0.000
Dependent Variable
Note: This table reports 2SLS regressions of the change in domestic financial liberalisation with annual data. The first column replicates the second-last column of Table 6, while the other columns replace, respectively, DF with the seven sub-indices of our financial liberalisation index. These sub-indices are securities markets (SM) and banking (BK) which, in turn, are split into directed credit and reserve requirements (DCRQ), interest rate controls (INTC), entry barriers and pro-competition measures (EBCM), banking supervision (BKSP) and banking privatisation (PRIV). All regressions include country and year fixed effects. T-statistics are reported below the coefficient. ***,**,* mean significant at 1, 5, and 10 per cent, respectively.
26
Table 8. 2SLS and GMM regressions of financial liberalisation, non-linear effects
Variable 1-Year 5-Year 1-Year 5-Year 1-Year 5-Year 1-Year 5-Year
Trade liberalisation (-1) 0.0687*** 0.3080*** -0.0177 0.2272*** 0.0272 0.1799*** -0.0088 0.2163***
3.35 3.55 -0.76 3.13 1.25 2.45 -0.38 3.68
TRt-1 * DFt-1 -0.2341*** -0.3498
-3.77 -1.55
Capital account liberalisation (-1) -0.0561** 0.0094 0.0435 0.0202 -0.0553** 0.0038 -0.0547** 0.0134
-2.16 0.29 1.56 0.30 -2.09 0.09 -2.16 0.37
CAt-1 * DFt-1 -0.1575*** -0.0363
-4.69 -0.37
Agriculture liberalisation (-1) 0.0336** 0.0712 0.0303** 0.0667 0.0978*** 0.1573** 0.0388*** 0.0849**
2.05 1.41 1.80 1.51 3.22 2.49 2.47 2.09
AGt-1 * DFt-1 -0.1141** -0.1644
-2.01 -1.54
Networks liberalisation (-1) 0.0000 -0.0602 0.0040 -0.0724 0.0122 -0.074 0.1954*** -0.0481
0.00 -1.25 0.20 -1.62 0.52 -1.51 3.26 -0.25
NWt-1 * DFt-1 -0.2374*** -0.0393
-4.02 -0.19
Neighbour DF (Alliance weights) (-1) 0.0212*** -0.031 0.0235*** 0.0116 0.0306*** -0.0198 0.0267*** -0.0016
2.65 -0.67 3.05 0.28 3.95 -0.66 3.44 -0.04
Polity score (-1) -0.0006 0.0050** -0.0005 0.0050** 0.0004 0.0045* -0.0008 0.0046**
-1.15 2.12 -1.04 2.15 0.75 1.75 -1.60 2.11
Regime durability (-1) -0.0001 0.0010* 0.0000 0.0003 0.0002 0.0006 0.0000 0.0005*
-0.40 1.86 0.13 0.70 1.07 1.39 -0.10 1.70
Own lagged level (-1) 0.0213 -0.2811* -0.0775*** -0.5180*** -0.097** -0.4357*** -0.1479*** -0.5225***
0.40 -1.71 -2.67 -6.37 -2.57 -6.26 -6.82 -7.75
Dependent variable (-1) 0.1136*** 0.1134*** 0.1261*** 0.1373***
3.75 3.85 4.23 4.53
Dependent variable (-2) 0.0705** 0.0696** 0.0872*** 0.0866***
2.21 2.23 2.80 2.78
R-squared 0.142 0.169 0.142 0.153
Adjusted R-squared 0.075 0.104 0.074 0.086
Number of observations 1524 353 1524 353 1524 353 1524 353
Hansen J statistic (p-value) 0.446 0.967 0.701 0.936 0.109 0.934 0.872 0.978
Anderson LM statistic (p-value) 0.000 0.000 0.000 0.000
Arellano-Bond AR1 test (p-value) 0.000 0.000 0.000 0.000
Arellano-Bond AR2 test (p-value) 0.840 0.693 0.649 0.723 Note: This table replicates the second-last column of Table 6 with one- and five-year intervals but allowing the effects of liberalisation in all other sectors on financial liberalisation to vary by the attained level of financial liberalisation. Regressions with annual data are estimated with 2SLS and regressions with five-yearly interval data are estimated with GMM. T-statistics are reported below the coefficient. ***,**,* mean significant at 1, 5, and 10 per cent, respectively.