the interface between science and technology in …
TRANSCRIPT
THE INTERFACE BETWEEN SCIENCE AND TECHNOLOGY IN RESEARCH INFRASTRUCTURES
Abstract
This study aims to understand the relationship between the scientific and technological
collaboration networks of inventors in different types of research infrastructures. Thus, we
sought to understand how the organization of scientific and technological production at the
collective level affects the inventors position in both networks. The study was based on a sample
of 1,756 Brazilian research infrastructures in which 7,714 different researchers are allocated.
Firstly, a Multiple Correspondence Analysis was carried out followed by the Hierarchical
Cluster Analysis for the proposition of a typology to represent different types of infrastructures.
Next, the inventors were mapped, from which two collaborative networks were produced: one
including their co-invention links and another including their co-authorship links. From a
multinomial logit model with ordered results, we estimated the effects of the infrastructures
types to which the inventors are related based on the importance they have in both networks.
The results revealed that the characteristics of the infrastructures are associated to the
researchers’ collaboration strategies, which in turn are related not only to the levels but also to
their ability to articulate scientific and technological production.
Keywords: Science and technology. Research networks. Scientific and technological
production. Research organizations. Economics of science.
Dias, Alexandre; Kannebley, Sérgio
University of São Paulo, Brazil
1 Introduction
In the National Innovation Systems perspective, the technological advance is related to
the result of new science discoveries, that progress through development stages until turning
into marketable goods and services. This connection between science and technology (S&T)
occurs through an efficient network of public and private institutions that perform activities to
develop and diffuse new technologies (FREEMAN, 1987), through which the innovation
process is made possible. In this dynamic, we emphasize the role of companies and their
research and development (R&D) laboratories, universities, research institutes, financial system
structure and intellectual property (IP) laws (PÓVOA, 2008). Thus, each country organizes and
manages its national research system with the objective of increasing the production and
dissemination of knowledge, which is necessary for competitiveness and economic growth
(ROMER, 1990), as well as allowing the government to decide the scientific priorities and
define funding policies for research (KING, 2004).
With this in mind, the interface between S&T has been analyzed based on different
approaches. In particular, this phenomenon intensified with the Bayh-Dole Act promulgation
in 1980, which allowed US universities to exploit patent rights resulting from government-
funded research (SAMPAT; MOWERY; ZIEDONIS, 2003). From this, many studies sought to
test the effects of patenting on the scientific productivity of researchers, arguing that the
orientation to technological development would occur at the expense of the marginalization of
scientific research (BRESCHI; CATALINI, 2010). However, despite the lack of consensus,
several evidences point to the complementarity between scientific and technological outputs
(FABRIZIO; DI MININ, 2008; BRESCHI; LISSONI; MONTOBBIO, 2008; CALDERINI;
FRANZONI; VEZZULLI, 2007).
More recently, social network analysis has been applied to understand how researchers
collaborate to produce S&T. Modern science is strongly supported in a collective production
structure, in which teamwork, collaboration and interdisciplinarity are some of its main
characteristics (REY-ROCHA; MARTÍN-SEMPERE; GARZÓN-GARCÍA, 2002). Although
most applications of collaboration networks have adopted the classical formulation, that is,
contemplating a single basis of interaction, an emerging trend has sought to understand the
intersection between both scientific and technological collaboration networks. The argument is
that the knowledge production implies the collective participation of researchers with multiple
skills and competences, which results in networks capable of dealing with the complexity of
relations between S&T (DE STEFANO; ZACCARIN, 2013).
This is the panorama of this paper, whose objective is to understand the interdependence
between the scientific and technological collaboration networks of the researchers given that
they produced patents, having the characteristics of the research infrastructures in which they
work as the background. The research infrastructure is defined as the set of physical facilities
and material support conditions (equipment, resources and services) used by the researchers to
carry out R&D activities (MAPPING OF THE EUROPEAN RESEARCH
INFRASTRUCTURE LANDSCAPE (MERIL), 2013). From this, several aspects could be
explored, for example, how different are the networks characteristics, how knowledge flows
through different types of infrastructures and how would they be associated with the importance
that inventors have in both networks.
This paper can be considered a pioneering effort for some reasons. First, it involved a
significant sample of 1,756 research infrastructures, in which 7,714 different researchers are
allocated. Secondly, it took into account the collective characteristics as mediators of the
articulation between S&T networks. According to Fenwick and Edwards (2014), the human
intention governing interactions is only one dimension of the collaboration networks
characteristics, whose success also depends on the connection of a set of resources that allow
these associations to form. Thus, a major contribution to this line of studies is to consider some
collective level of organization.
2 Background
2.1 Organization of scientific and technological production
Usually the laboratory is the place where researchers work collaboratively to carry out
research activities, develop projects, or handle specific equipment, materials or animals
(STEPHAN, 2012). The laboratory environment not only facilitates the exchange of ideas but
also encourages specialization. The labor division in the research activity occurs by assigning
responsibilities among the research team, allowing the exploration of economies of scope. Thus,
the synergy created tends to increase academic productivity insofar as a common body of
knowledge is shared among several works that complement each other.
Given the need to understand the social organization of science and its fundamental unit
of analysis, it is possible to highlight the staff’s composition and size as characteristics that
impact on collective productivity. Carayol and Matt (2004) classify the laboratories’ staff into
permanent researchers, non-permanent researchers and non-researchers. Permanent researchers
are made up of professors (dedicated to teaching and research) and researchers dedicated
exclusively to research, while non-permanent researchers involve postdoctoral researchers and
graduate students. Non-researchers correspond to technicians and administrative staff. The
authors gathered evidence that the permanent researchers tend to have a strong insertion in the
international scientific community and are strongly related to the number of publications and
patents production. PhD students and postdoctoral researchers have a positive impact on
technological productivity and, to a lesser extent, on scientific productivity, which has also been
supported by Gurmu, Black and Stephan (2010) study. Non-researchers were associated with a
significant increase in scientific production, indicating the possibility of substitution between
them and non-permanent researchers in some types of laboratories.
However, these results should be interpreted with attention, since the research groups
combine inputs such as human capital in different ways, which can vary widely according to
the area (STEPHAN, 2012). This can lead to different impacts, such as the size of staff. While
the evidence produced by Rey-Rocha, Garzón-García and Martin-Sempere (2006) leads to the
conclusion that team size benefits productivity, Carayol and Matt (2006) and Braun, Glänzel
and Schubert (2001) found a negative association. Horta and Lacy (2011), for example, found
that although the research group size does not seem to influence the total outputs volume,
academics belonging to larger groups are more likely to publish in international journals.
In addition, we recognize the multidimensional nature of teaching and research
institutions in which research groups are often inserted, which implies the desing of their scope.
According to Cohn, Rhine and Santos (1989), although some private institutions are specialized
mainly in human resources training, public ones are usually larger, more complex and have to
reach a multiplicity of objectives simultaneously. The typical contrast is between teaching and
research activities, but in practice, many other activities can be carried out by them, such as
technological development, service delivery, interaction with industry and extension
(BOZEMAN, BOARDMAN, 2003).
According to Worthington and Higgs (2011), a possible long-term goal for an S&T
institution is to be able to produce the desired results at the lowest possible cost. In this view,
some seminal studies to estimate economies of scale and scope in universities were published
in the 1980s and 1990s. Cohen, Rhine and Santos (1989), for example, found that complex
higher education institutions engaged in undergraduate teaching, graduate teaching and
research activities tend to be more efficient than those specializing in one or two of these
missions. Dundar and Lewis (1995) also found that most departments of American public
research institutions benefit from efficiency while simultaneously expanding their teaching and
research outputs to the highest levels of production because of the presence of economies of
scale.
2.2 Collaboration networks and their relationship with scientific and technological
production
Several studies suggest that collaboration between researchers positively affects
scientific productivity, whether in the number of publications (BRAUN; GLÄNZEL;
SCHUBERT, 2001; HERNÁNDEZ, 2013), impact on citations (IVANOV; LIBKIND;
MARKUSOVA, 2014; BOSQUET; COMBES, 2013) or in both (GONZALEZ-BRAMBILA;
VELOSO; KRACKHARDT, 2013; LISSONI et al., 2011).
Specifically, empirical evidence suggests that co-authorship networks tend to have a
structure associated with the small world model, whose configuration has high node
connectivity and, at the same time, a small average distance between network regions (DE
STEFANO et al., 2013). Thus, the simultaneous presence of dense clusters characterized by
small distances between them, indicates a mechanism by which knowledge flows between
nodes.
However, technological collaboration networks are strongly influenced by geographical
proximity and, more than that, inventors tend to invest in social ties with individuals from their
previous location (BRESCHI; LISSONI, 2004). This may be a reflection of the need to build
and maintain trust ties that technological development requires, mainly due to the expectations
of commercial exploitation of this type of knowledge. Thus, two inventors who have worked
together on at least one patent will be predisposed to keep in touch thereafter, or will be able to
contact again to exchange information or share knowledge assets. In this way, co-invention
networks tend to be fragmented with a large number of small disconnected components
(BRESCHI; CATALINI, 2010), since inventions are made by more "closed" groups compared
to articles (DE STEFANO; ZACCARIN, 2013).
The reports that have approached the connection between the scientists’ S&T
collaboration networks sought to characterize the importance of the inventor-authors to connect
these two communities. This intersection has been captured by actors who have collaborated to
develop patents and articles simultaneously. Evidence suggests that academic authors-inventors
play a crucial role in this process. The formation of this type of connection benefits mainly from
the complementarity and non-redundancy of the technical and scientific competences. In
addition, they consider not only their own possibilities for exchange, but also the potential for
partner exchange, which involves sharing a similar resource base (DE STEFANO;
ZACCARIN, 2013).
Breschi and Catalini (2010) concluded that inventors play an essential role in connecting
the scientific and technological communities, acting as a bridge between the two domains.
These individuals occupy prominent positions in scientific and technological networks,
fulfilling the crucial function of knowledge intermediaries between the two worlds. However,
the evidence suggests that maintaining a highly central position in the scientific network occurs
at the expense of being able to assert the same importance in the technological network (and
vice versa).
When analyzing the interaction between scientific activity and technological outputs in
nanotechnology in China, Wang and Guan (2011) found that both co-authorship and co-
invention networks were fragmented separately. However, when combined in a single network,
the extent of connectivity increased not only among the inventors but also among the authors.
It was observed that most of the productive inventors and the most cited authors belong to the
group of authors-inventors, suggesting complementarity effects between patenting and
publication. Therefore, it is possible to affirm that the relationship between S&T is complex,
dynamic and non-linear. By understanding how these domains interact, it is necessary to make
explicit the complexity that governs the relations of these actors. This involves interpreting how
the collective organization which researchers are linked with is associated with their ability to
articulate S&T production. Thus, this paper sought to shed new lights about how this process
occurs.
3 The data and the proposed tipology
This study was based on a sample of 1,756 Brazilian research infrastructures, whose
primary data were obtained through the application of a questionnaire to their respective
coordinators with reference to 2012 base year. This database is a result of a set of Brazilian
public organs efforts, provided by the Applied Economic Research Institute (IPEA) which
gathered and published a wide information survey on the research infrastructures conditions
available in the country. Given that no statistics on its universe are present in literature, it is
unable to specify the sample representativity, which even motivated to perform this survey.
However, a response rate of 40% is calculated in relation to the 4,500 infrastructures identified.
The average profile of the infrastructures is reflected in the laboratories that are located
in the south-eastern region of the country - São Paulo (24%), Rio de Janeiro (19%) and Minas
Gerais (13%). The average area varies according to the region of the country in which the
infrastructure is located. Infrastructures in the north have the highest average area (1,461.97
m²), followed by the north-eastern (412.31 m²), south-eastern (344.77 m²), southern (262.60
m²) and midwest (228.49 m²) regions. In relation to the major areas of knowledge,
infrastructures are concentrated in the areas of engineering (28%), exact and earth sciences
(21%), biological sciences (18%) and agrarian sciences (12%), in addition to 18.5% with more
than one area of knowledge (multi area), which is significant.
According to Table 1, the total infrastructures’ staff of the sample is consisted of 15.52
people, on average. Regarding the structure of the staff, an average of 5.13 is formed by
permanent researchers, 7.02 by students and 3.37 by technicians. Infrastructures mainly
comprise permanent researchers (mean of 41.53%), followed by non-permanent researchers
(mean of 38.68%) and technicians (mean of 19.89%).
Table 1 – Infrastructures’ staff descriptive statistics
Staff structure Mean SD
Permanent researchers 5.13 5.00
Non-permanent researchers 7.02 10.19
Non-researchers 3.37 9.28
Total staff 15.52 16.98
According Table 2, it is possible to verify that while the research activity is carried out
continuously by 80.69% of the infrastructures, the technological activities are not developed,
or are performed sporadically, by a large part of the sample. Specifically, a rate of 48.86%,
81.61% and 68.91% stated that they do not carry out, or perform sporadically, activities related
to technological development, extension and services, respectively. Teaching activity, although
not carried out continuously by 39.35%, is performed by 31.38% of the infrastructures.
Table 2 – Activities performed by the infrastructures
Activities
Do not/
sporadically
(%)
A few days per
week/month
(%)
Continuously
(%)
Teaching 29.27 31.38 39.35
Research 7.29 12.02 80.69
Technological development 48.86 15.83 35.31
Technological extension 81.61 10.54 7.86
Technological services 68.91 13.15 17.94
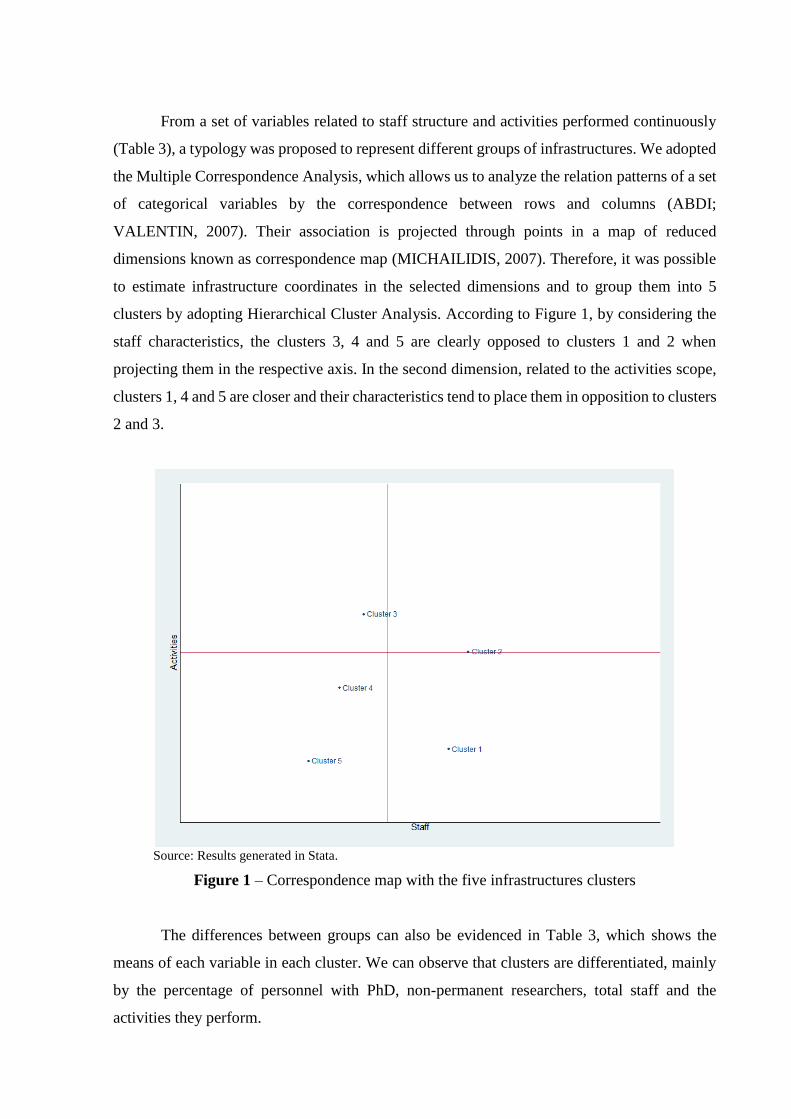
From a set of variables related to staff structure and activities performed continuously
(Table 3), a typology was proposed to represent different groups of infrastructures. We adopted
the Multiple Correspondence Analysis, which allows us to analyze the relation patterns of a set
of categorical variables by the correspondence between rows and columns (ABDI;
VALENTIN, 2007). Their association is projected through points in a map of reduced
dimensions known as correspondence map (MICHAILIDIS, 2007). Therefore, it was possible
to estimate infrastructure coordinates in the selected dimensions and to group them into 5
clusters by adopting Hierarchical Cluster Analysis. According to Figure 1, by considering the
staff characteristics, the clusters 3, 4 and 5 are clearly opposed to clusters 1 and 2 when
projecting them in the respective axis. In the second dimension, related to the activities scope,
clusters 1, 4 and 5 are closer and their characteristics tend to place them in opposition to clusters
2 and 3.
Source: Results generated in Stata.
Figure 1 – Correspondence map with the five infrastructures clusters
The differences between groups can also be evidenced in Table 3, which shows the
means of each variable in each cluster. We can observe that clusters are differentiated, mainly
by the percentage of personnel with PhD, non-permanent researchers, total staff and the
activities they perform.
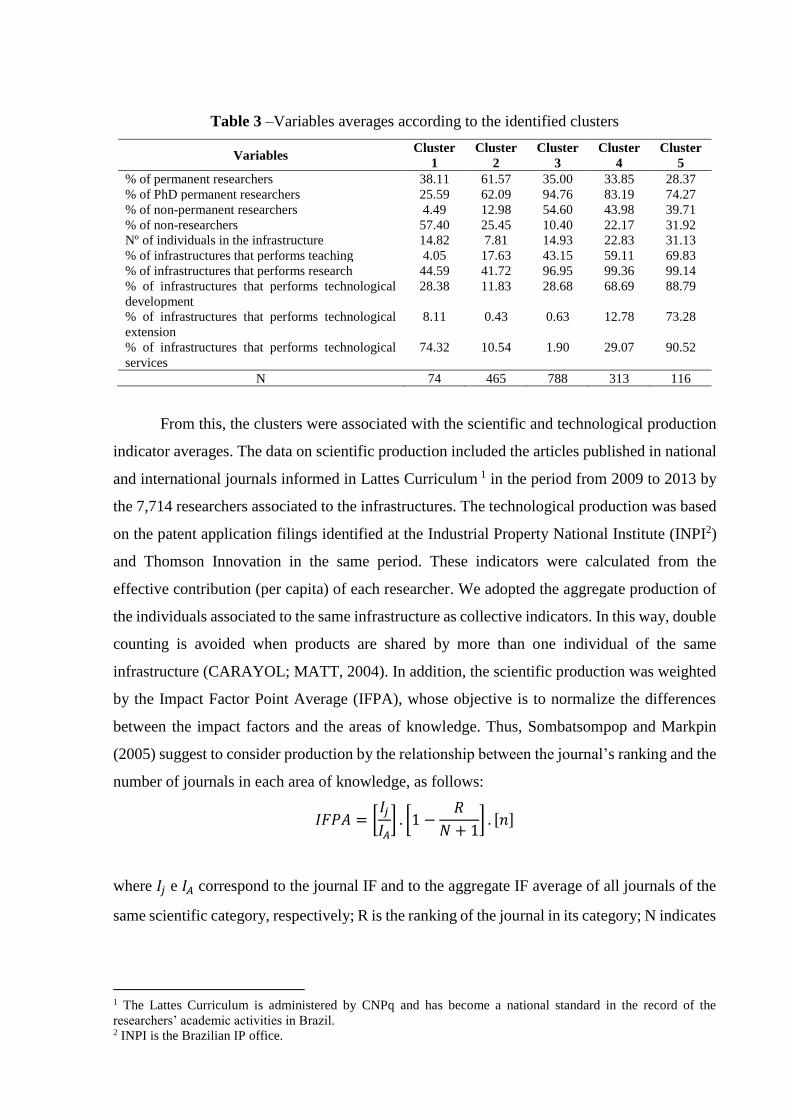
Table 3 –Variables averages according to the identified clusters
Variables Cluster
1
Cluster
2
Cluster
3
Cluster
4
Cluster
5
% of permanent researchers 38.11 61.57 35.00 33.85 28.37
% of PhD permanent researchers 25.59 62.09 94.76 83.19 74.27
% of non-permanent researchers 4.49 12.98 54.60 43.98 39.71
% of non-researchers 57.40 25.45 10.40 22.17 31.92
Nº of individuals in the infrastructure 14.82 7.81 14.93 22.83 31.13
% of infrastructures that performs teaching 4.05 17.63 43.15 59.11 69.83
% of infrastructures that performs research 44.59 41.72 96.95 99.36 99.14
% of infrastructures that performs technological
development
28.38 11.83 28.68 68.69 88.79
% of infrastructures that performs technological
extension
8.11 0.43 0.63 12.78 73.28
% of infrastructures that performs technological
services
74.32 10.54 1.90 29.07 90.52
N 74 465 788 313 116
From this, the clusters were associated with the scientific and technological production
indicator averages. The data on scientific production included the articles published in national
and international journals informed in Lattes Curriculum 1 in the period from 2009 to 2013 by
the 7,714 researchers associated to the infrastructures. The technological production was based
on the patent application filings identified at the Industrial Property National Institute (INPI2)
and Thomson Innovation in the same period. These indicators were calculated from the
effective contribution (per capita) of each researcher. We adopted the aggregate production of
the individuals associated to the same infrastructure as collective indicators. In this way, double
counting is avoided when products are shared by more than one individual of the same
infrastructure (CARAYOL; MATT, 2004). In addition, the scientific production was weighted
by the Impact Factor Point Average (IFPA), whose objective is to normalize the differences
between the impact factors and the areas of knowledge. Thus, Sombatsompop and Markpin
(2005) suggest to consider production by the relationship between the journal’s ranking and the
number of journals in each area of knowledge, as follows:
𝐼𝐹𝑃𝐴 = [𝐼𝑗
𝐼𝐴] . [1 −
𝑅
𝑁 + 1] . [𝑛]
where 𝐼𝑗 e 𝐼𝐴 correspond to the journal IF and to the aggregate IF average of all journals of the
same scientific category, respectively; R is the ranking of the journal in its category; N indicates
1 The Lattes Curriculum is administered by CNPq and has become a national standard in the record of the
researchers’ academic activities in Brazil. 2 INPI is the Brazilian IP office.
the number of journals in the same category; and n is the number of articles published by the
researcher, which in this case corresponds to the quantity per capita.
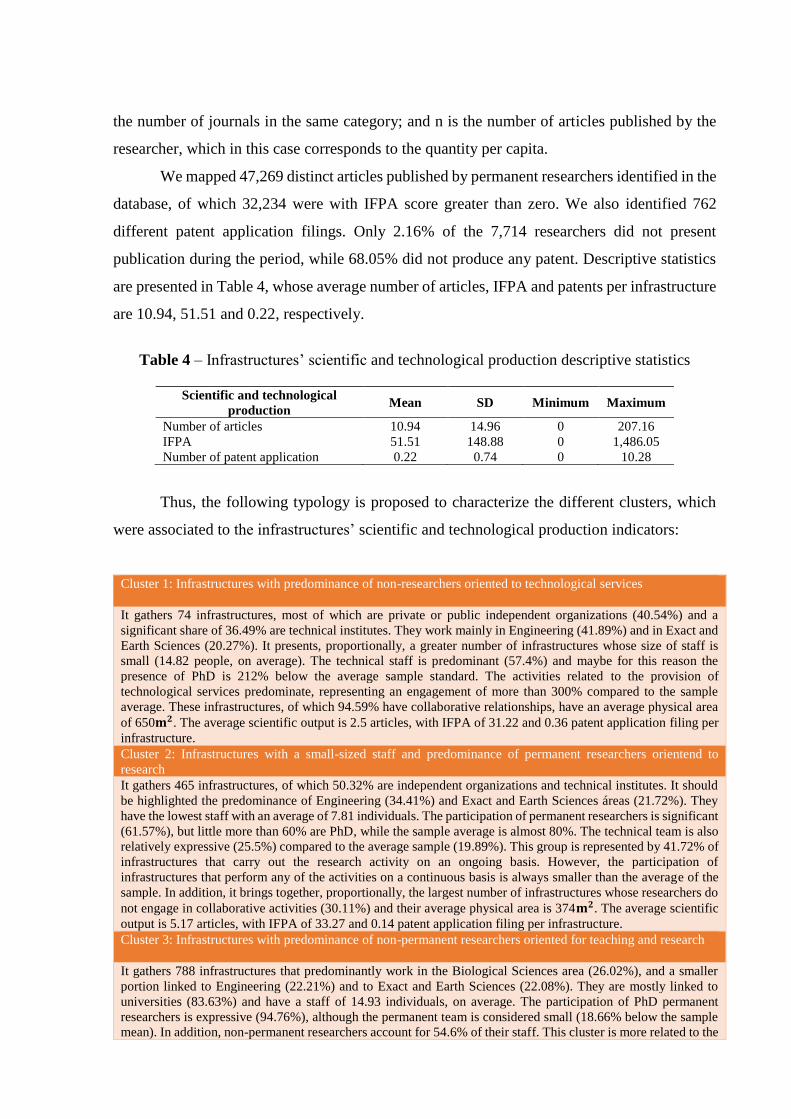
We mapped 47,269 distinct articles published by permanent researchers identified in the
database, of which 32,234 were with IFPA score greater than zero. We also identified 762
different patent application filings. Only 2.16% of the 7,714 researchers did not present
publication during the period, while 68.05% did not produce any patent. Descriptive statistics
are presented in Table 4, whose average number of articles, IFPA and patents per infrastructure
are 10.94, 51.51 and 0.22, respectively.
Table 4 – Infrastructures’ scientific and technological production descriptive statistics
Scientific and technological
production Mean SD Minimum Maximum
Number of articles 10.94 14.96 0 207.16
IFPA 51.51 148.88 0 1,486.05
Number of patent application 0.22 0.74 0 10.28
Thus, the following typology is proposed to characterize the different clusters, which
were associated to the infrastructures’ scientific and technological production indicators:
Cluster 1: Infrastructures with predominance of non-researchers oriented to technological services
It gathers 74 infrastructures, most of which are private or public independent organizations (40.54%) and a
significant share of 36.49% are technical institutes. They work mainly in Engineering (41.89%) and in Exact and
Earth Sciences (20.27%). It presents, proportionally, a greater number of infrastructures whose size of staff is
small (14.82 people, on average). The technical staff is predominant (57.4%) and maybe for this reason the
presence of PhD is 212% below the average sample standard. The activities related to the provision of
technological services predominate, representing an engagement of more than 300% compared to the sample
average. These infrastructures, of which 94.59% have collaborative relationships, have an average physical area
of 650𝐦𝟐. The average scientific output is 2.5 articles, with IFPA of 31.22 and 0.36 patent application filing per
infrastructure.
Cluster 2: Infrastructures with a small-sized staff and predominance of permanent researchers orientend to
research
It gathers 465 infrastructures, of which 50.32% are independent organizations and technical institutes. It should
be highlighted the predominance of Engineering (34.41%) and Exact and Earth Sciences áreas (21.72%). They
have the lowest staff with an average of 7.81 individuals. The participation of permanent researchers is significant
(61.57%), but little more than 60% are PhD, while the sample average is almost 80%. The technical team is also
relatively expressive (25.5%) compared to the average sample (19.89%). This group is represented by 41.72% of
infrastructures that carry out the research activity on an ongoing basis. However, the participation of
infrastructures that perform any of the activities on a continuous basis is always smaller than the average of the
sample. In addition, it brings together, proportionally, the largest number of infrastructures whose researchers do
not engage in collaborative activities (30.11%) and their average physical area is 374𝐦𝟐. The average scientific
output is 5.17 articles, with IFPA of 33.27 and 0.14 patent application filing per infrastructure.
Cluster 3: Infrastructures with predominance of non-permanent researchers oriented for teaching and research
It gathers 788 infrastructures that predominantly work in the Biological Sciences area (26.02%), and a smaller
portion linked to Engineering (22.21%) and to Exact and Earth Sciences (22.08%). They are mostly linked to
universities (83.63%) and have a staff of 14.93 individuals, on average. The participation of PhD permanent
researchers is expressive (94.76%), although the permanent team is considered small (18.66% below the sample
mean). In addition, non-permanent researchers account for 54.6% of their staff. This cluster is more related to the
research and teaching activities, with the engagement of 96.95% and 43.15% of the infrastructures, respectively.
Finally, 93.65% of the them maintain collaborative relationships. The average physical area is 197𝐦𝟐. The
average scientific output is 12.59 articles, with IFPA of 59.07 and 0.19 patent application filing per infrastructure.
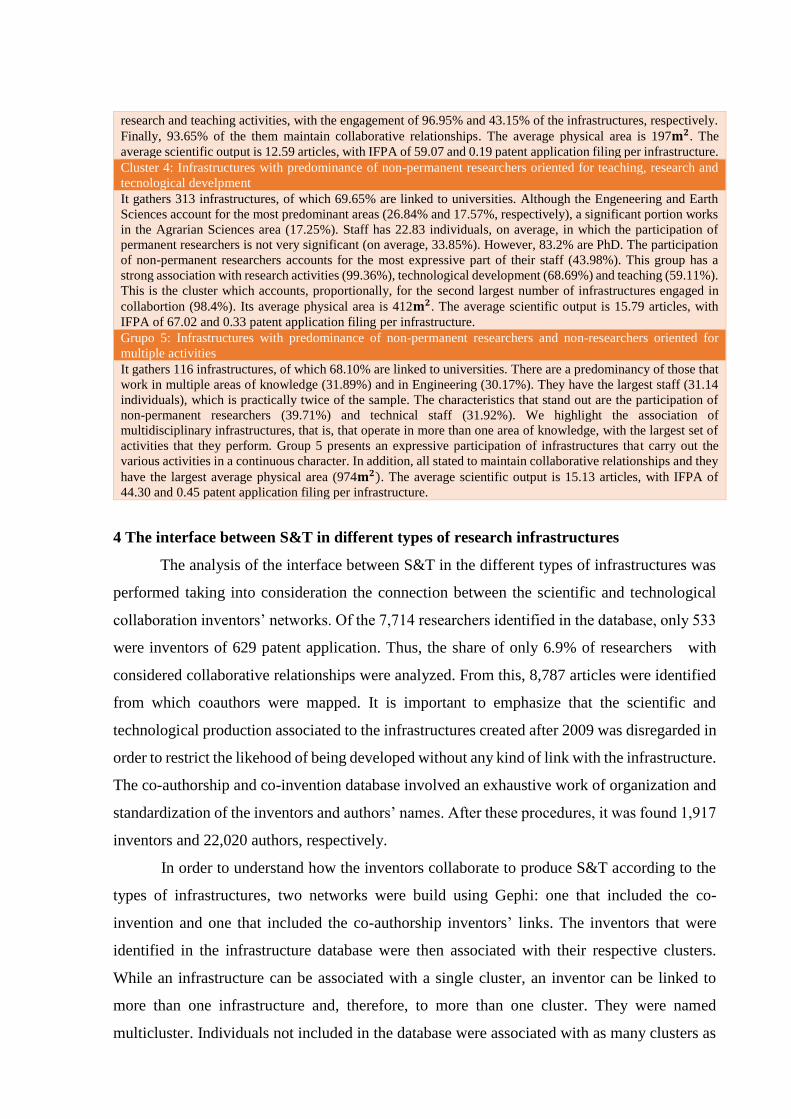
Cluster 4: Infrastructures with predominance of non-permanent researchers oriented for teaching, research and
tecnological develpment
It gathers 313 infrastructures, of which 69.65% are linked to universities. Although the Engeneering and Earth
Sciences account for the most predominant areas (26.84% and 17.57%, respectively), a significant portion works
in the Agrarian Sciences area (17.25%). Staff has 22.83 individuals, on average, in which the participation of
permanent researchers is not very significant (on average, 33.85%). However, 83.2% are PhD. The participation
of non-permanent researchers accounts for the most expressive part of their staff (43.98%). This group has a
strong association with research activities (99.36%), technological development (68.69%) and teaching (59.11%).
This is the cluster which accounts, proportionally, for the second largest number of infrastructures engaged in
collabortion (98.4%). Its average physical area is 412𝐦𝟐. The average scientific output is 15.79 articles, with
IFPA of 67.02 and 0.33 patent application filing per infrastructure.
Grupo 5: Infrastructures with predominance of non-permanent researchers and non-researchers oriented for
multiple activities
It gathers 116 infrastructures, of which 68.10% are linked to universities. There are a predominancy of those that
work in multiple areas of knowledge (31.89%) and in Engineering (30.17%). They have the largest staff (31.14
individuals), which is practically twice of the sample. The characteristics that stand out are the participation of
non-permanent researchers (39.71%) and technical staff (31.92%). We highlight the association of
multidisciplinary infrastructures, that is, that operate in more than one area of knowledge, with the largest set of
activities that they perform. Group 5 presents an expressive participation of infrastructures that carry out the
various activities in a continuous character. In addition, all stated to maintain collaborative relationships and they
have the largest average physical area (974𝐦𝟐). The average scientific output is 15.13 articles, with IFPA of
44.30 and 0.45 patent application filing per infrastructure.
4 The interface between S&T in different types of research infrastructures
The analysis of the interface between S&T in the different types of infrastructures was
performed taking into consideration the connection between the scientific and technological
collaboration inventors’ networks. Of the 7,714 researchers identified in the database, only 533
were inventors of 629 patent application. Thus, the share of only 6.9% of researchers with
considered collaborative relationships were analyzed. From this, 8,787 articles were identified
from which coauthors were mapped. It is important to emphasize that the scientific and
technological production associated to the infrastructures created after 2009 was disregarded in
order to restrict the likehood of being developed without any kind of link with the infrastructure.
The co-authorship and co-invention database involved an exhaustive work of organization and
standardization of the inventors and authors’ names. After these procedures, it was found 1,917
inventors and 22,020 authors, respectively.
In order to understand how the inventors collaborate to produce S&T according to the
types of infrastructures, two networks were build using Gephi: one that included the co-
invention and one that included the co-authorship inventors’ links. The inventors that were
identified in the infrastructure database were then associated with their respective clusters.
While an infrastructure can be associated with a single cluster, an inventor can be linked to
more than one infrastructure and, therefore, to more than one cluster. They were named
multicluster. Individuals not included in the database were associated with as many clusters as
the inventors with whom they collaborated. By assuming the links among network actors, it is
assumed that they are connected by some kind of knowledge exchange, which in turn is
supported by an exchange of resources from the organizations to which they are linked
(BRESCHI; CATALINI, 2010).
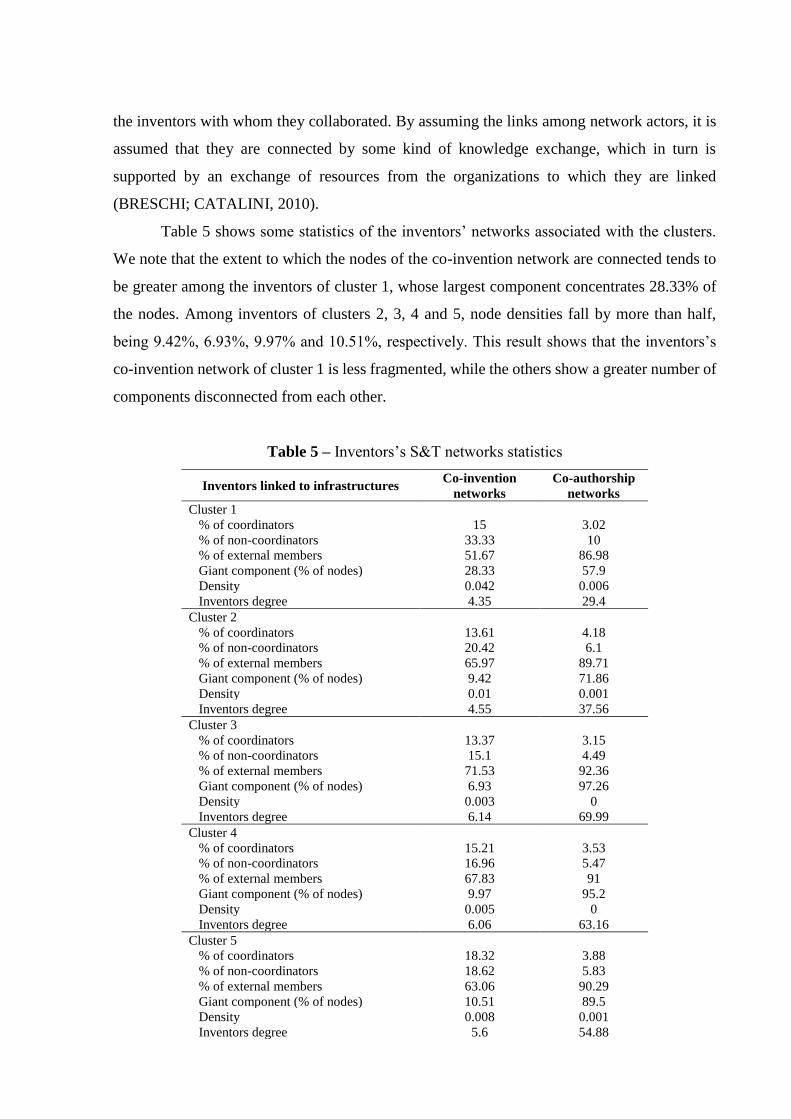
Table 5 shows some statistics of the inventors’ networks associated with the clusters.
We note that the extent to which the nodes of the co-invention network are connected tends to
be greater among the inventors of cluster 1, whose largest component concentrates 28.33% of
the nodes. Among inventors of clusters 2, 3, 4 and 5, node densities fall by more than half,
being 9.42%, 6.93%, 9.97% and 10.51%, respectively. This result shows that the inventors’s
co-invention network of cluster 1 is less fragmented, while the others show a greater number of
components disconnected from each other.
Table 5 – Inventors’s S&T networks statistics
Inventors linked to infrastructures Co-invention
networks
Co-authorship
networks
Cluster 1
% of coordinators 15 3.02
% of non-coordinators 33.33 10
% of external members 51.67 86.98
Giant component (% of nodes) 28.33 57.9
Density 0.042 0.006
Inventors degree 4.35 29.4
Cluster 2
% of coordinators 13.61 4.18
% of non-coordinators 20.42 6.1
% of external members 65.97 89.71
Giant component (% of nodes) 9.42 71.86
Density 0.01 0.001
Inventors degree 4.55 37.56
Cluster 3
% of coordinators 13.37 3.15
% of non-coordinators 15.1 4.49
% of external members 71.53 92.36
Giant component (% of nodes) 6.93 97.26
Density 0.003 0
Inventors degree 6.14 69.99
Cluster 4
% of coordinators 15.21 3.53
% of non-coordinators 16.96 5.47
% of external members 67.83 91
Giant component (% of nodes) 9.97 95.2
Density 0.005 0
Inventors degree 6.06 63.16
Cluster 5
% of coordinators 18.32 3.88
% of non-coordinators 18.62 5.83
% of external members 63.06 90.29
Giant component (% of nodes) 10.51 89.5
Density 0.008 0.001
Inventors degree 5.6 54.88
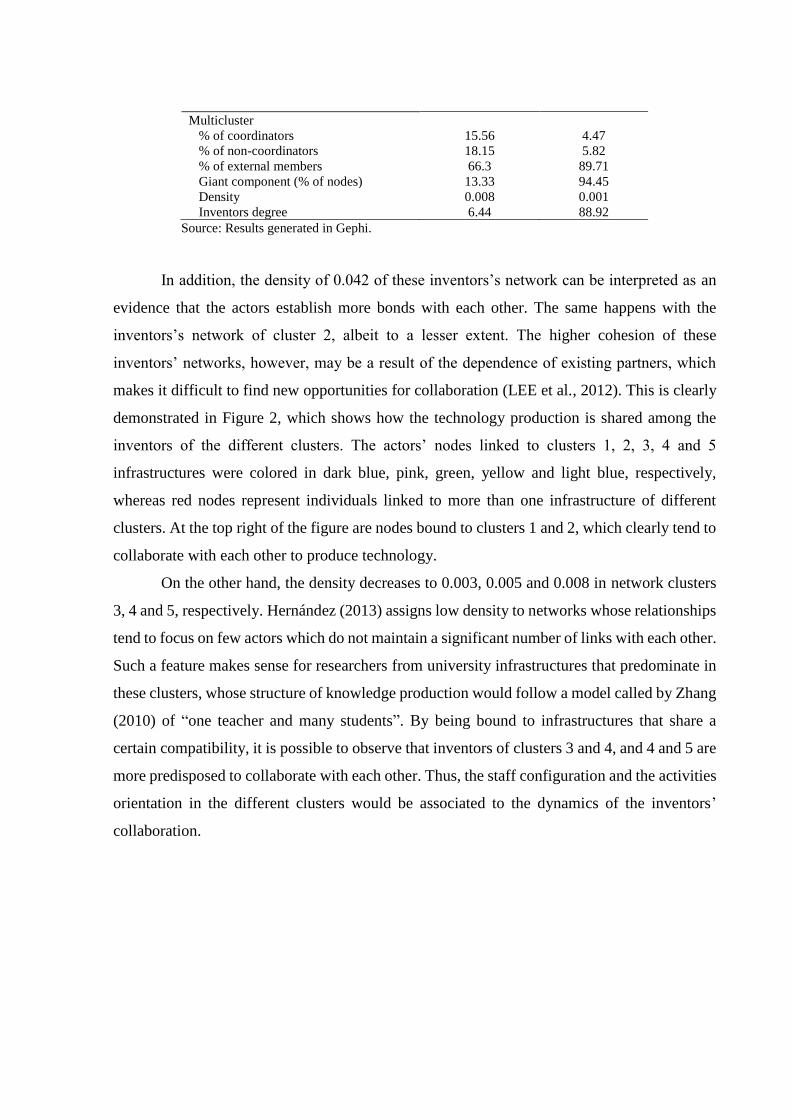
Multicluster
% of coordinators 15.56 4.47
% of non-coordinators 18.15 5.82
% of external members 66.3 89.71
Giant component (% of nodes) 13.33 94.45
Density 0.008 0.001
Inventors degree 6.44 88.92
Source: Results generated in Gephi.
In addition, the density of 0.042 of these inventors’s network can be interpreted as an
evidence that the actors establish more bonds with each other. The same happens with the
inventors’s network of cluster 2, albeit to a lesser extent. The higher cohesion of these
inventors’ networks, however, may be a result of the dependence of existing partners, which
makes it difficult to find new opportunities for collaboration (LEE et al., 2012). This is clearly
demonstrated in Figure 2, which shows how the technology production is shared among the
inventors of the different clusters. The actors’ nodes linked to clusters 1, 2, 3, 4 and 5
infrastructures were colored in dark blue, pink, green, yellow and light blue, respectively,
whereas red nodes represent individuals linked to more than one infrastructure of different
clusters. At the top right of the figure are nodes bound to clusters 1 and 2, which clearly tend to
collaborate with each other to produce technology.
On the other hand, the density decreases to 0.003, 0.005 and 0.008 in network clusters
3, 4 and 5, respectively. Hernández (2013) assigns low density to networks whose relationships
tend to focus on few actors which do not maintain a significant number of links with each other.
Such a feature makes sense for researchers from university infrastructures that predominate in
these clusters, whose structure of knowledge production would follow a model called by Zhang
(2010) of “one teacher and many students”. By being bound to infrastructures that share a
certain compatibility, it is possible to observe that inventors of clusters 3 and 4, and 4 and 5 are
more predisposed to collaborate with each other. Thus, the staff configuration and the activities
orientation in the different clusters would be associated to the dynamics of the inventors’
collaboration.
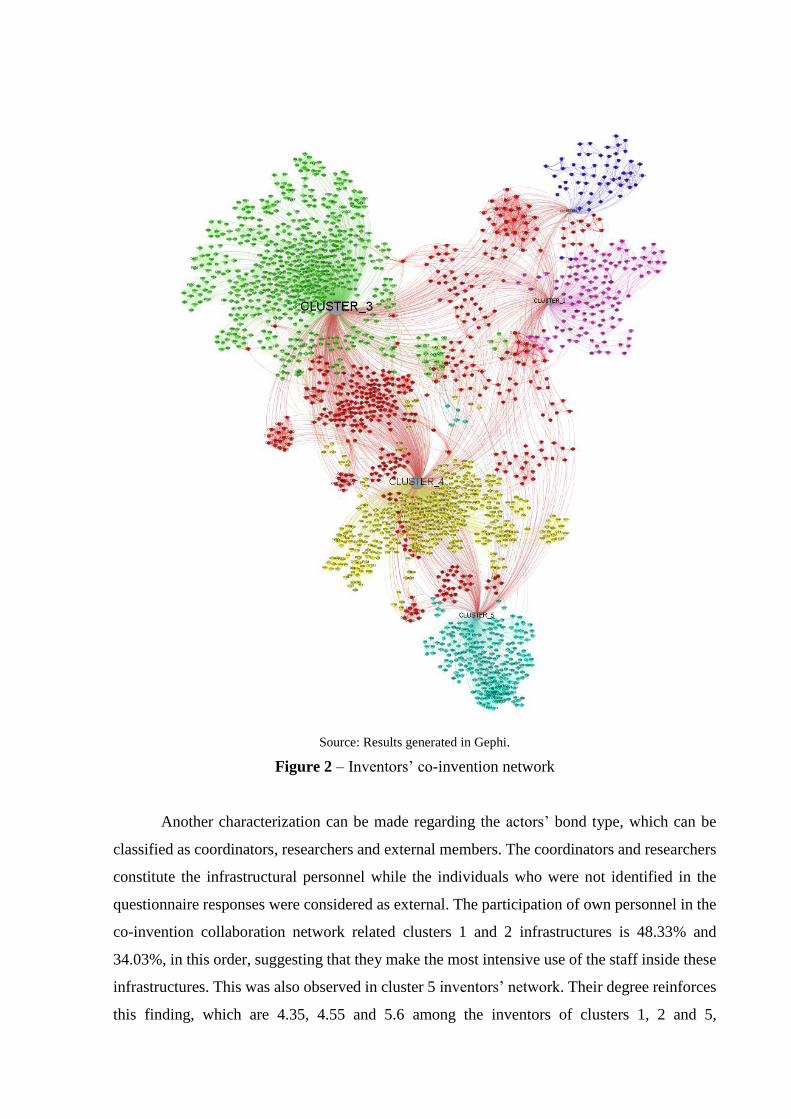
Source: Results generated in Gephi.
Figure 2 – Inventors’ co-invention network
Another characterization can be made regarding the actors’ bond type, which can be
classified as coordinators, researchers and external members. The coordinators and researchers
constitute the infrastructural personnel while the individuals who were not identified in the
questionnaire responses were considered as external. The participation of own personnel in the
co-invention collaboration network related clusters 1 and 2 infrastructures is 48.33% and
34.03%, in this order, suggesting that they make the most intensive use of the staff inside these
infrastructures. This was also observed in cluster 5 inventors’ network. Their degree reinforces
this finding, which are 4.35, 4.55 and 5.6 among the inventors of clusters 1, 2 and 5,
respectively. By concentrating more efforts on internal relationships, individuals would no
longer participate in more comprehensive networks (HORTA, 2013). Consequently, we may
expect fewer connections.
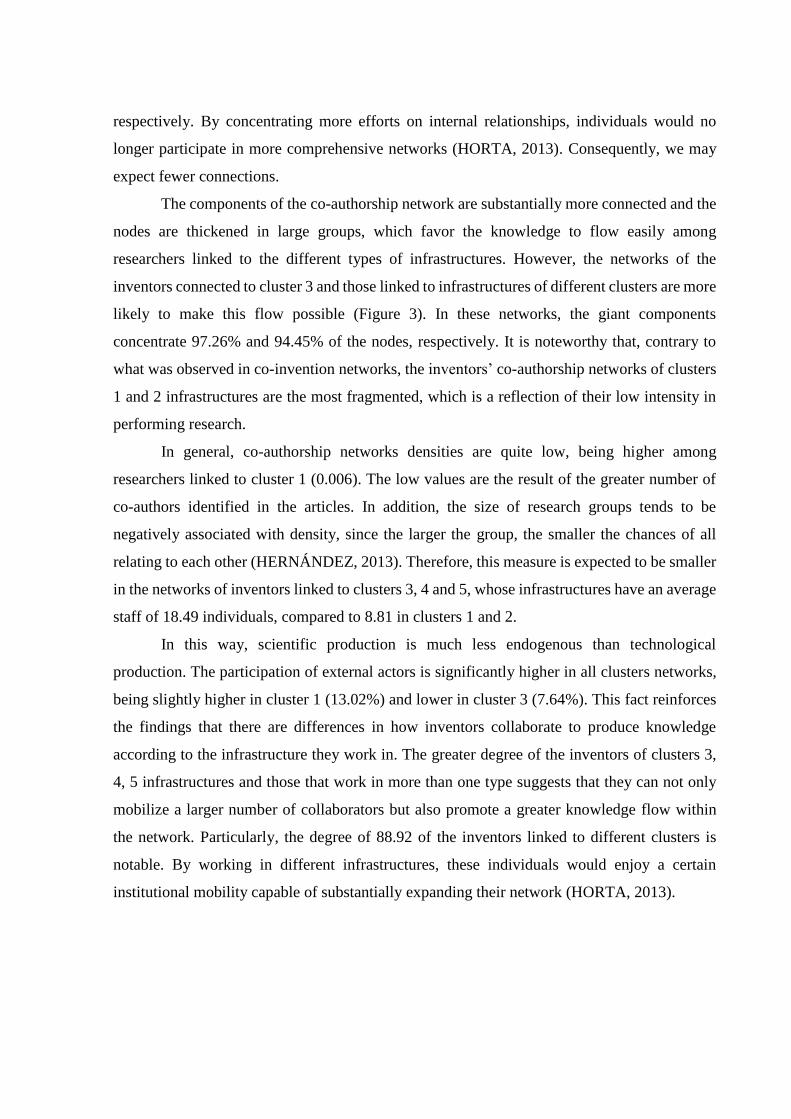
The components of the co-authorship network are substantially more connected and the
nodes are thickened in large groups, which favor the knowledge to flow easily among
researchers linked to the different types of infrastructures. However, the networks of the
inventors connected to cluster 3 and those linked to infrastructures of different clusters are more
likely to make this flow possible (Figure 3). In these networks, the giant components
concentrate 97.26% and 94.45% of the nodes, respectively. It is noteworthy that, contrary to
what was observed in co-invention networks, the inventors’ co-authorship networks of clusters
1 and 2 infrastructures are the most fragmented, which is a reflection of their low intensity in
performing research.
In general, co-authorship networks densities are quite low, being higher among
researchers linked to cluster 1 (0.006). The low values are the result of the greater number of
co-authors identified in the articles. In addition, the size of research groups tends to be
negatively associated with density, since the larger the group, the smaller the chances of all
relating to each other (HERNÁNDEZ, 2013). Therefore, this measure is expected to be smaller
in the networks of inventors linked to clusters 3, 4 and 5, whose infrastructures have an average
staff of 18.49 individuals, compared to 8.81 in clusters 1 and 2.
In this way, scientific production is much less endogenous than technological
production. The participation of external actors is significantly higher in all clusters networks,
being slightly higher in cluster 1 (13.02%) and lower in cluster 3 (7.64%). This fact reinforces
the findings that there are differences in how inventors collaborate to produce knowledge
according to the infrastructure they work in. The greater degree of the inventors of clusters 3,
4, 5 infrastructures and those that work in more than one type suggests that they can not only
mobilize a larger number of collaborators but also promote a greater knowledge flow within
the network. Particularly, the degree of 88.92 of the inventors linked to different clusters is
notable. By working in different infrastructures, these individuals would enjoy a certain
institutional mobility capable of substantially expanding their network (HORTA, 2013).
Source: Results generated in Gephi.
Figure 3 – Inventors’ co-authorship network
In order to understand how the co-authorship and co-invention networks are related
according to the different types of infrastructures, we estimated the effects of the inventors’
infrastructure clusters on the importance they have in both networks. We considered the
following measures of importance:
• Betweenness centrality: indicates how much a node acts as a connector and expresses
the control that a node exerts over the information flow and other resources (NEWMAN,
2008). It is determined by:
𝐶𝑒𝑖𝐵(𝑔) = ∑
𝑃𝑖(𝑘𝑗)/ 𝑃(𝑘𝑗)
(𝑛 − 1)(𝑛 − 2)/2𝑘≠𝑗:𝑖∉{𝑘,𝑗}
,
where 𝑃𝑖(𝑘𝑗) represents the number of geodesics (shorter paths) that connect nodes k and j
between which is i and 𝑃(𝑘𝑗) refers to the total number of geodesics between k and j and n
corresponds to the number of nodes (JACKSON, 2008).
• Eigenvector centrality: considers not only the connectivity or the density of the node
connections, but also the importance of the neighboring nodes. Therefore, the relevance
attributed to a particular node is determined by both the number of connections and the
proportion with which it is related to influential nodes (CHERVEN, 2015). It is
determined by the equation:
𝜆𝐶𝑖𝑒(𝑔) = ∑ 𝑔𝑖𝑗𝑗
𝐶𝑖𝑒(𝑔) ,
Where the node centrality is proportional to the sum of the neighbors’ centrality and λ is the
proportionality factor, also called eigenvalue. The network equation element (g) called
eigenvector is represented by 𝐶𝑖𝑒(𝑔) (JACKSON, 2008).
• Closeness centrality: expresses how much a node is close to the others and can be
interpreted as a measure of how long it takes for the information to spread in the network
(BRESCHI; CATALINI, 2010). Formally, closeness centrality is only the inverse of the
mean distance between i and any other node j: (𝑛 − 1)/ ∑ ℓ(𝑖, 𝑗)𝑗≠𝑖 , where ℓ(𝑖, 𝑗) is the
number of links in the shorther path between i and j (JACKSON, 2008). In Gephi larger
closeness indicators mean that nodes are more distant (CHERVEN, 2015).
The econometric model also included seniority and gender as control variables.
Seniority corresponds to the difference between 2013 and the year of the PhD degree obtaining.
Thus, only the nodes of the inventors whose doctoral degree was obtained in 2009 or earlier
were selected, ensuring that the centrality measures were counted only by individuals qualified
for research. The sample cutout resulted in 455 inventors, of whom 15 were linked to the
infrastructures of cluster 1, 28 of cluster 2, 171 of cluster 3, 122 of cluster 4, 72 of cluster 5 and
47 to more than one cluster.
Given the empirical distributions of the variables, three categories were created for the
inventors’ betweenness, eigenvector and closeness centralities in both co-authorship and co-
invention networks (Table 6). It should be noted that, in general, only the last 10% of the
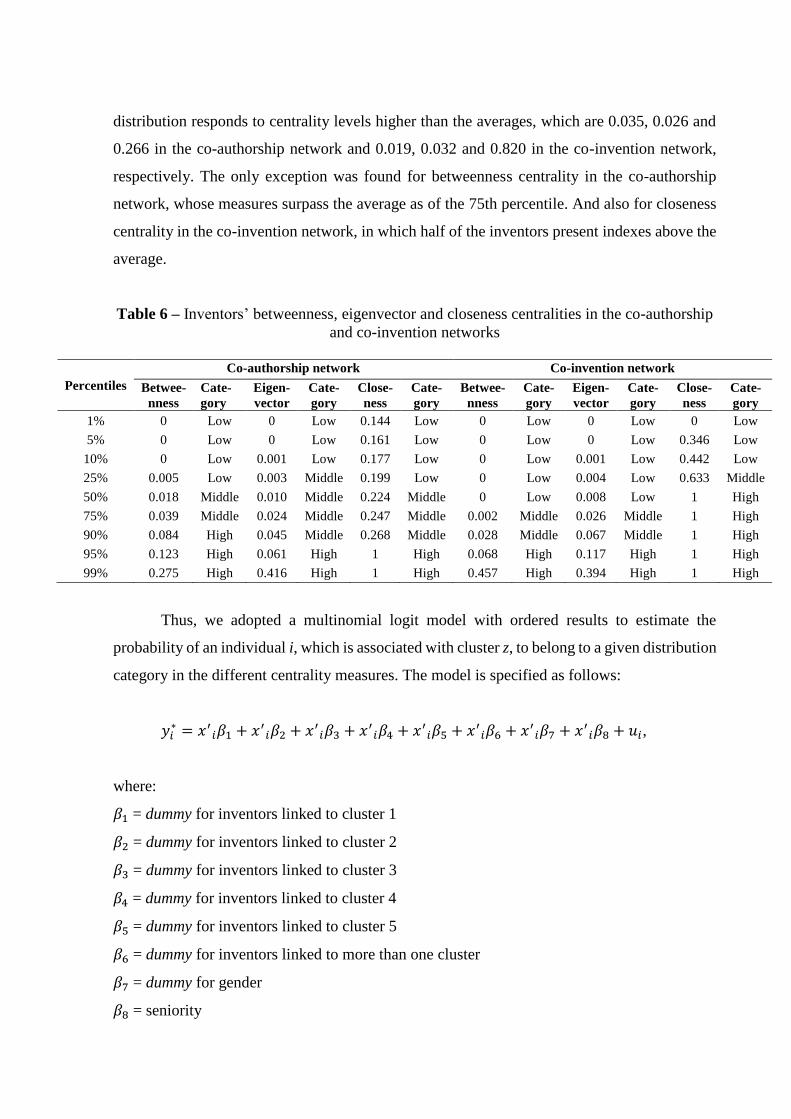
distribution responds to centrality levels higher than the averages, which are 0.035, 0.026 and
0.266 in the co-authorship network and 0.019, 0.032 and 0.820 in the co-invention network,
respectively. The only exception was found for betweenness centrality in the co-authorship
network, whose measures surpass the average as of the 75th percentile. And also for closeness
centrality in the co-invention network, in which half of the inventors present indexes above the
average.
Table 6 – Inventors’ betweenness, eigenvector and closeness centralities in the co-authorship
and co-invention networks
Percentiles
Co-authorship network Co-invention network
Betwee-
nness
Cate-
gory
Eigen-
vector
Cate-
gory
Close-
ness
Cate-
gory
Betwee-
nness
Cate-
gory
Eigen-
vector
Cate-
gory
Close-
ness
Cate-
gory
1% 0 Low 0 Low 0.144 Low 0 Low 0 Low 0 Low
5% 0 Low 0 Low 0.161 Low 0 Low 0 Low 0.346 Low
10% 0 Low 0.001 Low 0.177 Low 0 Low 0.001 Low 0.442 Low
25% 0.005 Low 0.003 Middle 0.199 Low 0 Low 0.004 Low 0.633 Middle
50% 0.018 Middle 0.010 Middle 0.224 Middle 0 Low 0.008 Low 1 High
75% 0.039 Middle 0.024 Middle 0.247 Middle 0.002 Middle 0.026 Middle 1 High
90% 0.084 High 0.045 Middle 0.268 Middle 0.028 Middle 0.067 Middle 1 High
95% 0.123 High 0.061 High 1 High 0.068 High 0.117 High 1 High
99% 0.275 High 0.416 High 1 High 0.457 High 0.394 High 1 High
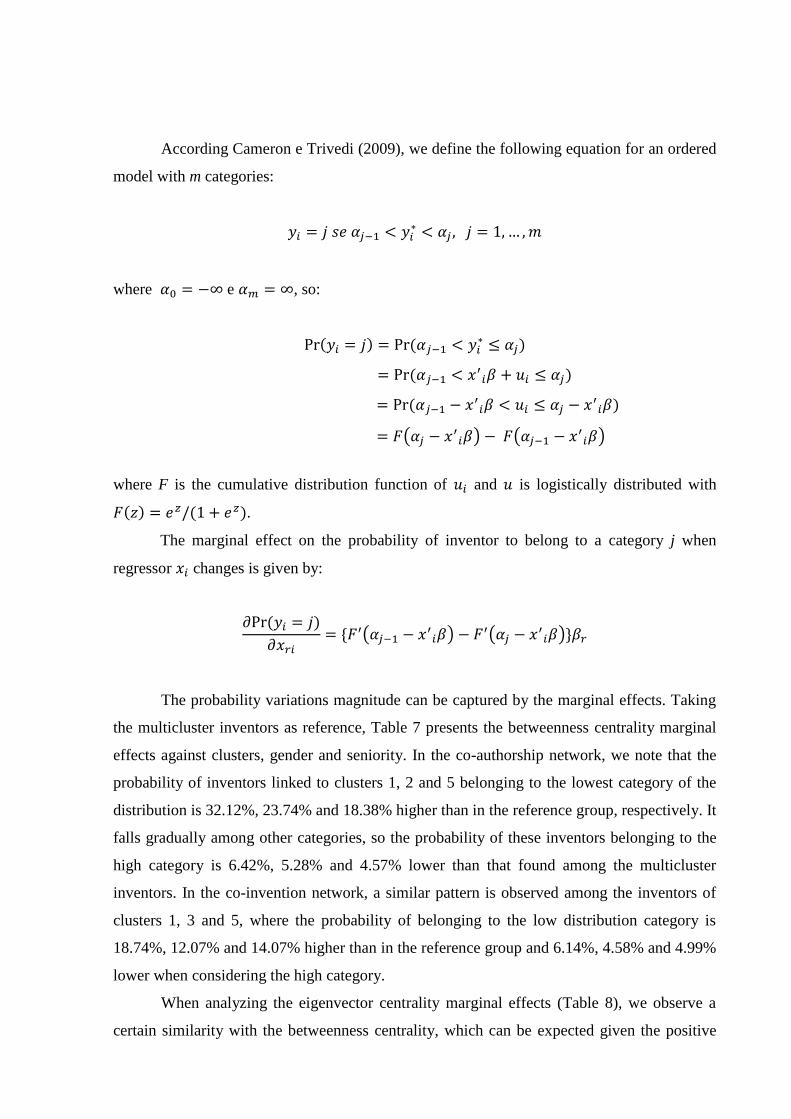
Thus, we adopted a multinomial logit model with ordered results to estimate the
probability of an individual i, which is associated with cluster z, to belong to a given distribution
category in the different centrality measures. The model is specified as follows:
𝑦𝑖∗ = 𝑥′
𝑖𝛽1 + 𝑥′𝑖𝛽2 + 𝑥′
𝑖𝛽3 + 𝑥′𝑖𝛽4 + 𝑥′
𝑖𝛽5 + 𝑥′𝑖𝛽6 + 𝑥′
𝑖𝛽7 + 𝑥′𝑖𝛽8 + 𝑢𝑖,
where:
𝛽1 = dummy for inventors linked to cluster 1
𝛽2 = dummy for inventors linked to cluster 2
𝛽3 = dummy for inventors linked to cluster 3
𝛽4 = dummy for inventors linked to cluster 4
𝛽5 = dummy for inventors linked to cluster 5
𝛽6 = dummy for inventors linked to more than one cluster
𝛽7 = dummy for gender
𝛽8 = seniority
According Cameron e Trivedi (2009), we define the following equation for an ordered
model with m categories:
𝑦𝑖 = 𝑗 𝑠𝑒 𝛼𝑗−1 < 𝑦𝑖∗ < 𝛼𝑗 , 𝑗 = 1, … , 𝑚
where 𝛼0 = −∞ e 𝛼𝑚 = ∞, so:
Pr(𝑦𝑖 = 𝑗) = Pr(𝛼𝑗−1 < 𝑦𝑖∗ ≤ 𝛼𝑗)
= Pr(𝛼𝑗−1 < 𝑥′𝑖𝛽 + 𝑢𝑖 ≤ 𝛼𝑗)
= Pr(𝛼𝑗−1 − 𝑥′𝑖𝛽 < 𝑢𝑖 ≤ 𝛼𝑗 − 𝑥′
𝑖𝛽)
= 𝐹(𝛼𝑗 − 𝑥′𝑖𝛽) − 𝐹(𝛼𝑗−1 − 𝑥′
𝑖𝛽)
where F is the cumulative distribution function of 𝑢𝑖 and 𝑢 is logistically distributed with
𝐹(𝑧) = 𝑒𝑧/(1 + 𝑒𝑧).
The marginal effect on the probability of inventor to belong to a category j when
regressor 𝑥𝑖 changes is given by:
𝜕Pr (𝑦𝑖 = 𝑗)
𝜕𝑥𝑟𝑖= {𝐹′(𝛼𝑗−1 − 𝑥′
𝑖𝛽) − 𝐹′(𝛼𝑗 − 𝑥′𝑖𝛽)}𝛽𝑟
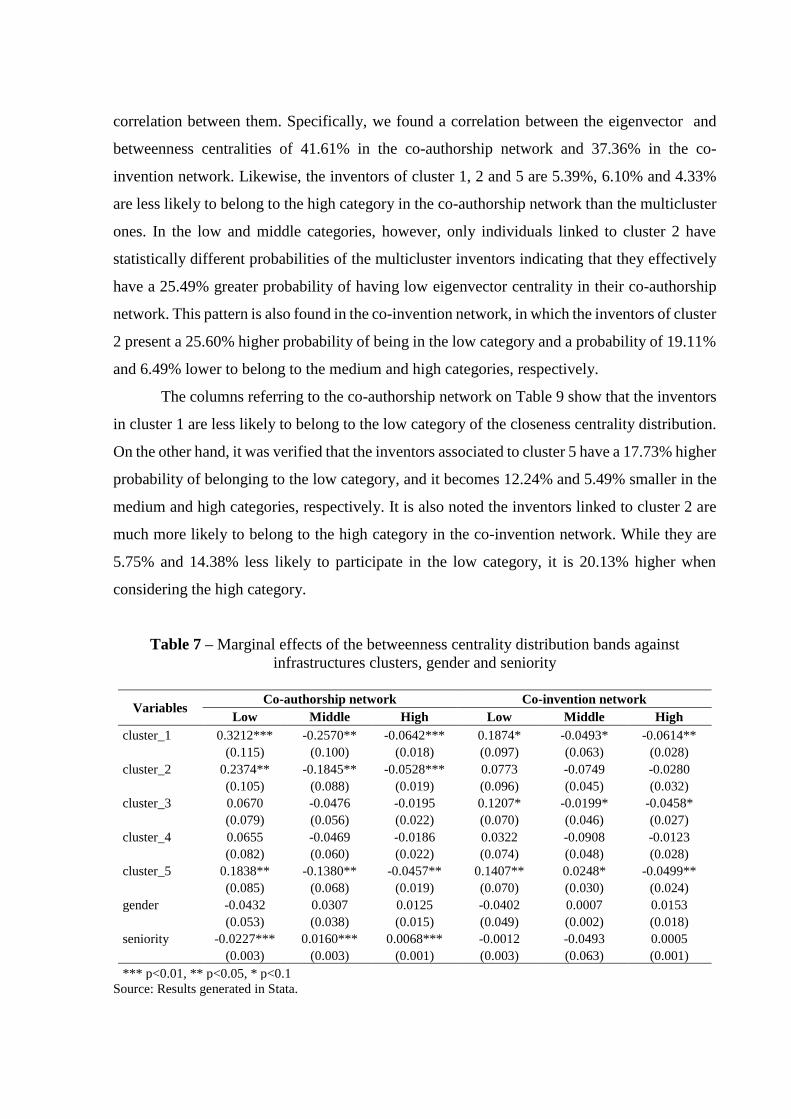
The probability variations magnitude can be captured by the marginal effects. Taking
the multicluster inventors as reference, Table 7 presents the betweenness centrality marginal
effects against clusters, gender and seniority. In the co-authorship network, we note that the
probability of inventors linked to clusters 1, 2 and 5 belonging to the lowest category of the
distribution is 32.12%, 23.74% and 18.38% higher than in the reference group, respectively. It
falls gradually among other categories, so the probability of these inventors belonging to the
high category is 6.42%, 5.28% and 4.57% lower than that found among the multicluster
inventors. In the co-invention network, a similar pattern is observed among the inventors of
clusters 1, 3 and 5, where the probability of belonging to the low distribution category is
18.74%, 12.07% and 14.07% higher than in the reference group and 6.14%, 4.58% and 4.99%
lower when considering the high category.
When analyzing the eigenvector centrality marginal effects (Table 8), we observe a
certain similarity with the betweenness centrality, which can be expected given the positive
correlation between them. Specifically, we found a correlation between the eigenvector and
betweenness centralities of 41.61% in the co-authorship network and 37.36% in the co-
invention network. Likewise, the inventors of cluster 1, 2 and 5 are 5.39%, 6.10% and 4.33%
are less likely to belong to the high category in the co-authorship network than the multicluster
ones. In the low and middle categories, however, only individuals linked to cluster 2 have
statistically different probabilities of the multicluster inventors indicating that they effectively
have a 25.49% greater probability of having low eigenvector centrality in their co-authorship
network. This pattern is also found in the co-invention network, in which the inventors of cluster
2 present a 25.60% higher probability of being in the low category and a probability of 19.11%
and 6.49% lower to belong to the medium and high categories, respectively.
The columns referring to the co-authorship network on Table 9 show that the inventors
in cluster 1 are less likely to belong to the low category of the closeness centrality distribution.
On the other hand, it was verified that the inventors associated to cluster 5 have a 17.73% higher
probability of belonging to the low category, and it becomes 12.24% and 5.49% smaller in the
medium and high categories, respectively. It is also noted the inventors linked to cluster 2 are
much more likely to belong to the high category in the co-invention network. While they are
5.75% and 14.38% less likely to participate in the low category, it is 20.13% higher when
considering the high category.
Table 7 – Marginal effects of the betweenness centrality distribution bands against
infrastructures clusters, gender and seniority
Variables Co-authorship network Co-invention network
Low Middle High Low Middle High
cluster_1 0.3212*** -0.2570** -0.0642*** 0.1874* -0.0493* -0.0614**
(0.115) (0.100) (0.018) (0.097) (0.063) (0.028)
cluster_2 0.2374** -0.1845** -0.0528*** 0.0773 -0.0749 -0.0280
(0.105) (0.088) (0.019) (0.096) (0.045) (0.032)
cluster_3 0.0670 -0.0476 -0.0195 0.1207* -0.0199* -0.0458*
(0.079) (0.056) (0.022) (0.070) (0.046) (0.027)
cluster_4 0.0655 -0.0469 -0.0186 0.0322 -0.0908 -0.0123
(0.082) (0.060) (0.022) (0.074) (0.048) (0.028)
cluster_5 0.1838** -0.1380** -0.0457** 0.1407** 0.0248* -0.0499**
(0.085) (0.068) (0.019) (0.070) (0.030) (0.024)
gender -0.0432 0.0307 0.0125 -0.0402 0.0007 0.0153
(0.053) (0.038) (0.015) (0.049) (0.002) (0.018)
seniority -0.0227*** 0.0160*** 0.0068*** -0.0012 -0.0493 0.0005
(0.003) (0.003) (0.001) (0.003) (0.063) (0.001)
*** p<0.01, ** p<0.05, * p<0.1
Source: Results generated in Stata.
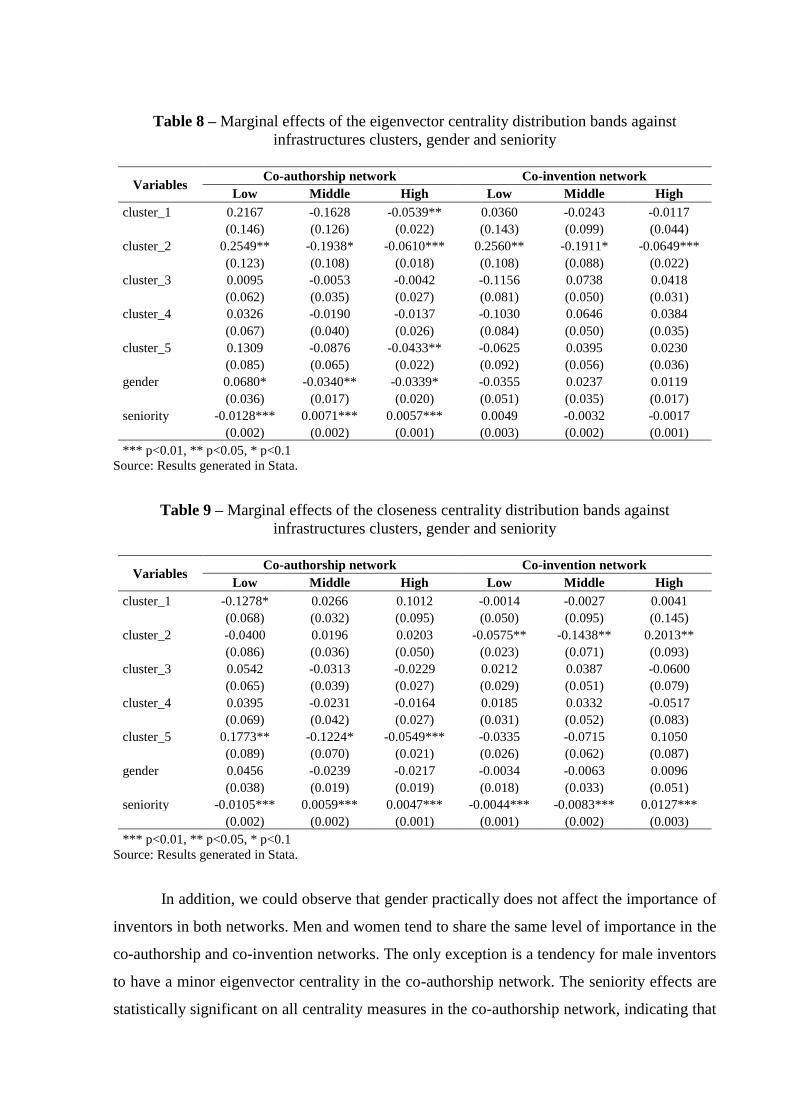
Table 8 – Marginal effects of the eigenvector centrality distribution bands against
infrastructures clusters, gender and seniority
Variables Co-authorship network Co-invention network
Low Middle High Low Middle High
cluster_1 0.2167 -0.1628 -0.0539** 0.0360 -0.0243 -0.0117
(0.146) (0.126) (0.022) (0.143) (0.099) (0.044)
cluster_2 0.2549** -0.1938* -0.0610*** 0.2560** -0.1911* -0.0649***
(0.123) (0.108) (0.018) (0.108) (0.088) (0.022)
cluster_3 0.0095 -0.0053 -0.0042 -0.1156 0.0738 0.0418
(0.062) (0.035) (0.027) (0.081) (0.050) (0.031)
cluster_4 0.0326 -0.0190 -0.0137 -0.1030 0.0646 0.0384
(0.067) (0.040) (0.026) (0.084) (0.050) (0.035)
cluster_5 0.1309 -0.0876 -0.0433** -0.0625 0.0395 0.0230
(0.085) (0.065) (0.022) (0.092) (0.056) (0.036)
gender 0.0680* -0.0340** -0.0339* -0.0355 0.0237 0.0119
(0.036) (0.017) (0.020) (0.051) (0.035) (0.017)
seniority -0.0128*** 0.0071*** 0.0057*** 0.0049 -0.0032 -0.0017
(0.002) (0.002) (0.001) (0.003) (0.002) (0.001)
*** p<0.01, ** p<0.05, * p<0.1
Source: Results generated in Stata.
Table 9 – Marginal effects of the closeness centrality distribution bands against
infrastructures clusters, gender and seniority
Variables Co-authorship network Co-invention network
Low Middle High Low Middle High
cluster_1 -0.1278* 0.0266 0.1012 -0.0014 -0.0027 0.0041
(0.068) (0.032) (0.095) (0.050) (0.095) (0.145)
cluster_2 -0.0400 0.0196 0.0203 -0.0575** -0.1438** 0.2013**
(0.086) (0.036) (0.050) (0.023) (0.071) (0.093)
cluster_3 0.0542 -0.0313 -0.0229 0.0212 0.0387 -0.0600
(0.065) (0.039) (0.027) (0.029) (0.051) (0.079)
cluster_4 0.0395 -0.0231 -0.0164 0.0185 0.0332 -0.0517
(0.069) (0.042) (0.027) (0.031) (0.052) (0.083)
cluster_5 0.1773** -0.1224* -0.0549*** -0.0335 -0.0715 0.1050
(0.089) (0.070) (0.021) (0.026) (0.062) (0.087)
gender 0.0456 -0.0239 -0.0217 -0.0034 -0.0063 0.0096
(0.038) (0.019) (0.019) (0.018) (0.033) (0.051)
seniority -0.0105*** 0.0059*** 0.0047*** -0.0044*** -0.0083*** 0.0127***
(0.002) (0.002) (0.001) (0.001) (0.002) (0.003)
*** p<0.01, ** p<0.05, * p<0.1
Source: Results generated in Stata.
In addition, we could observe that gender practically does not affect the importance of
inventors in both networks. Men and women tend to share the same level of importance in the
co-authorship and co-invention networks. The only exception is a tendency for male inventors
to have a minor eigenvector centrality in the co-authorship network. The seniority effects are
statistically significant on all centrality measures in the co-authorship network, indicating that
the research experience positively affects the inventors’ importance. This corroborates the
researchers life-cycle theory, whose scientific productivity tends to increase over time until
reaching a peak (GONZALEZ-BRAMBILA; VELOSO, 2007). In the co-invention network,
effects are felt only by weighing the individuals’ importance by the closeness centrality.
Possibly, unobservable biographical factors, such as individual heterogeneity and the
persistence of the researcher may be more important for patent production, a feature that do not
change easily with time.
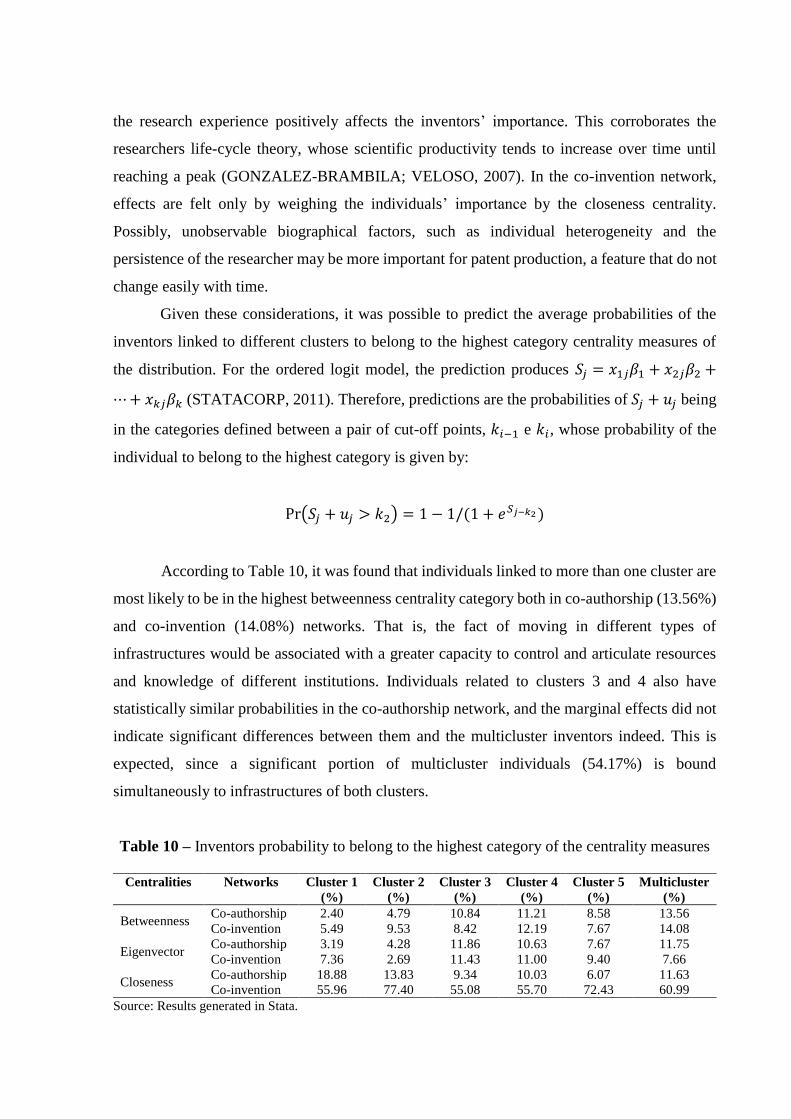
Given these considerations, it was possible to predict the average probabilities of the
inventors linked to different clusters to belong to the highest category centrality measures of
the distribution. For the ordered logit model, the prediction produces 𝑆𝑗 = 𝑥1𝑗𝛽1 + 𝑥2𝑗𝛽2 +
⋯ + 𝑥𝑘𝑗𝛽𝑘 (STATACORP, 2011). Therefore, predictions are the probabilities of 𝑆𝑗 + 𝑢𝑗 being
in the categories defined between a pair of cut-off points, 𝑘𝑖−1 e 𝑘𝑖, whose probability of the
individual to belong to the highest category is given by:
Pr(𝑆𝑗 + 𝑢𝑗 > 𝑘2) = 1 − 1/(1 + 𝑒𝑆𝑗−𝑘2 )
According to Table 10, it was found that individuals linked to more than one cluster are
most likely to be in the highest betweenness centrality category both in co-authorship (13.56%)
and co-invention (14.08%) networks. That is, the fact of moving in different types of
infrastructures would be associated with a greater capacity to control and articulate resources
and knowledge of different institutions. Individuals related to clusters 3 and 4 also have
statistically similar probabilities in the co-authorship network, and the marginal effects did not
indicate significant differences between them and the multicluster inventors indeed. This is
expected, since a significant portion of multicluster individuals (54.17%) is bound
simultaneously to infrastructures of both clusters.
Table 10 – Inventors probability to belong to the highest category of the centrality measures
Centralities Networks Cluster 1
(%)
Cluster 2
(%)
Cluster 3
(%)
Cluster 4
(%)
Cluster 5
(%)
Multicluster
(%)
Betweenness Co-authorship 2.40 4.79 10.84 11.21 8.58 13.56
Co-invention 5.49 9.53 8.42 12.19 7.67 14.08
Eigenvector Co-authorship 3.19 4.28 11.86 10.63 7.67 11.75
Co-invention 7.36 2.69 11.43 11.00 9.40 7.66
Closeness Co-authorship 18.88 13.83 9.34 10.03 6.07 11.63
Co-invention 55.96 77.40 55.08 55.70 72.43 60.99
Source: Results generated in Stata.
Nevertheless, the cluster 4 inventors, with multicluster individuals, accounts for the
S&T articulation in the highest category of this measure. The probability of belonging to it is
11.21% in the co-authorship and 12.19% in the co-invention networks. Thus, the inventors
linked to cluster 3 infrastructures tend to increase their betweenness centrality in the co-
invention network only when they are linked to cluster 4 infrastructures. This result is quite
revealing, since the technological superiority of cluster 4 infrastructures possibly complements
the cluster 3 ones gaps, since they tend to share similarities in terms of personnel configuration.
By observing the probabilities for the eigenvector centrality, inventors linked to clusters
3, 4 and multicluster have a probability of 11.86%, 10.63% and 11.75% belonging to the highest
category in the co-authorship network, respectively. In the co-invention network, they represent
11.43%, 11% and 7.66%. In all these cases, there are no statistically significant differences
among them, indicating that these individuals are the most likely to belong to the highest
eigenvector centrality category in both co-authorship co-invention networks. This can be
explanained due the influence of these inventors collaborators and can be attributed as well to
the greater proportion of PhD researchers in the permanent staff who, being in a more advanced
stage in the career, would be predisposed to establish links with well connected researchers
(BORDONS et al., 2015). We should mention that in the co-invention network clusters 1 and 5
infrastructures’ inventors have probabilities statistically similar to the reference group, so their
detachable technological production can be attributed to their capacity to establish more and
influential links.
The high probabilities in the betweenness and eigenvector centralities among clusters
3, 4 and multicluster inventors indicate a collaboration strategy based on many non-redundant
connections made with several research collaborators which, according to Contandriopoulos et
al. (2016), would be associated with significant performance standards. The betweenness
centrality importance is attributed, mainly, to the fact that a researcher in this position tends to
have access to more resources than those who maintain redundant connections with a restricted
set of individuals which, in turn, proved to be a feature of inventors linked to the clusters 1 and
2 infrastructures.
Regarding the interpretation of the results related to closeness centrality, it is important
to highlight that higher probabilities of belonging to the high category mean that individuals
are more likely to be distant from all others in the network. Thus, the inventors linked to clusters
1 and 2, whose odds of 18.88% and 13.83%, respectively, are likely to be more distant from the
other actors in the co-authorship network. Although the marginal effects are not significant for
the highest category, they are for the low one. The probability of cluster 1 inventors of
belonging to it is 12.78% smaller than the reference group. Thus, these inventors are actually
less likely to be close to the other nodes.
On the other hand, inventors linked to cluster 5 infrastructures have probability of 6.07%
to belong to the high category. This suggests they tend to be less distant from the other actors.
In fact, they have a 17.73% higher probability of belonging to the low category and, therefore,
are the most likely to be close to other actors in the scientific collaboration network. Its staff,
which consists of a large number of individuals (31,13, on average) is likely to make more self-
sufficient groups, reducing the need for so many intermediaries. This could explain their
performance in research which, according to Lee et al. (2012), was considered the best
collaboration strategy for scientific production adopted by Korean research institutions. For
Bordons et al. (2015) closeness centrality would increase the opportunity to find new
partnerships by requiring less effort to reach other individuals in the network. On the other
hand, it is important to make clear that proximity to other nodes necessarily implies less
dependence on intermediate actors, resulting in shorter paths and less transmission of
information and knowledge (BRANDES; BORGATTI; FREEMAN, 2016). In this sense, the
proximity mantained by inventors linked to cluster 5 infrastructures would occur at the expense
of the redundancy of relations and knowledge that characterizes their scientific collaboration
network, which could explain why their IFPA is smaller compared to clusters 3 and 4 inventors.
Thus, the interface between S&T is made possible by different collaboration strategies, so these
inventors benefit from the proximity with other nodes to produce science and rely on the
establishment of direct and influential connections to produce technology.
In the co-invention network, it is important to consider that the probabilities are high
among the inventors in all clusters. This is a huge evidence of the low connectivity in the
technology network in which knowledge and resources do not flow easily among actors.
However, the inventors linked to cluster 2 infrastructures have a probability of 77.40%
belonging to the high category whose statistical significance shows that they are more distant
from the other nodes. This result only reinforces how difficulty is to them to build and maintain
S&T links in relation to other clusters inventors.
In summary, the results show that there are strong differences in the inventors position
in the co-authorship and co-invention networks according to different infrastructures types to
which they are linked. In addition, they indicate distinct collaboration strategies so that better
structured infrastructures that develop a larger set of activities would be made up of more
central individuals in both their S&T networks. This is a particularly important finding which
shows that S&T network positions also relies on collective aspects.
5 Conclusion
This research sought to understand relationship between the scientific and technological
collaboration networks of inventors in different types of research infrastructures. This can be
considered a pioneering effort for several reasons. First because the study involved a
considerable sample compared to the size used in other studies. Secondly because it took into
consideration the collective characteristics as mediators of S&T outputs, which according to
Carayol and Matt (2004) and Stephan (2010) should be further explored by studies in this area.
In addition, it brings an important and original contribution to the understanding of the Brazilian
research units characteristics, whose data are scarce and fragmented.
As a result, we sought to construct a typology to represent different profiles of research
infrastructures based on the characteristics of their activities and staff. In other words, this
characterization was made based on the scope and scale of the infrastructures. They were
classified into five groups that distinguished them quite well as to the variables selected to
characterize them. In general, the infrastructures belonging to clusters 1 and 2 have a staff 110%
smaller than clusters 3, 4 and 5, which proportionally includes 56% fewer doctors among
permanent researchers. What differentiates infrastrucutures from clusters 1 and 2, however, is
the predominance of technicians in the former and their orientation to technological services
activities.
In clusters 3, 4 e 5 infrastructures the participation of non-permanent researchers
represented by graduate students constitutes the main composition of their staff reflecting on a
larger scale. Thus, although the country’s research infrastructures are evaluated by Squeff and
De Negri (2014) as very low scale, there are significant differences that would even be
associated with their research performance. In addition, they presentend a greater dynamism in
the performance of teaching, research, technological development, technological services and
technological extension. However, while in cluster 3 teaching and research are the most
frequently performed activities, cluster 4 also performs technological development and in
cluster 5 all activities are carried out intensively by the infrastructures.
Once the typology was proposed, it was possible to establish the relationship between
the inventor scientific and technological collaboration networks. The unprecedented conclusion
is that the infrastructures characteristics in which they work are strongly associated with the
way in which they collaborate to produce S&T. First, we concluded that the inventors connected
to smaller infrastructures and with a low percentage of PhD permanent researchers are more
predisposed to cooperate with each other. On the other hand, the number of connections
between individuals linked to clusters 3, 4 and 5 infrastructures are more frequent. That is, the
need to share a compatible resource base is key to bringing researchers closer together and
enabling them to develop collaborative projects. Thus, even if the complementarity of resources
and knowledge is one of the presuppositions of modern scientific and technological production,
the compatibility between research structures would allow the different groups of researchers
to communicate. In other words, inventors linked to “weaker” infrastructures tend to collaborate
with peers under the same condition while those linked to the “stronger” infrastructures
collaborate more to partners linked to infrastructures equally robust.
In addition, the results allow us to conclude that infrastructures characteristics are
associated with the importance that the individuals have in the both networks. Inventors linked
to clusters 3 and 4 infrastructures are more likely to take a leading position in S&T networks
by weighing their importance by betweenness and eigenvector centralities. Inventors linked to
the cluster 3 infrastructures, specifically, tend to increase their betweenness capacity in the co-
invention network when they are linked to cluster 4 infrastructures, which probably occurs due
to their technological superiority. In this way, inventors linked to more than one cluster are also
more likely to be considered important actors in S&T networks. Thus, we can attribute that the
inventors’ collaboration strategy is strongly influenced by characteristics of these
infrastructures. Specifically, the expressive non-permanent and doctor permanent researchers
share in the staff make it more likely to adopt a collaborative strategy based on many non-
redundant connections made with several research collaborators.
On the other hand, the high levels of scientific and technological production observed
in cluster 5 infrastructures can be attributed to a strategy of hybrid collaboration. While these
inventors rely on a strategy based on more and better links to produce technology, they enjoy
proximity to produce science. Thus, when using a large staff, its co-authorship network would
imply less dependence on intermediary actors, resulting in shorter paths and less transmission
of information and knowledge (BRANDES; BORGATTI; FREEMAN, 2016). Although this
strategy is associated with high performance in research (LEE et al., 2012), the closeness
centrality in the co-authorship network would result in redundant connections, which would
explain why the IFPA of its production is comparatively smaller to clusters 3 and 4
infrastructure’s inventors. Nevertheless, it is possible to conclude that cluster 5 infrastuctures
characteristics are also associated to some S&T articulation ability, which is not experienced
by the inventors linked to clusters 1 and 2 infrastructures.
So, it can be pointed out that while collaborative knowledge production has become the
dominant and most promising way to produce high-quality research (AHRWEILER; KEANE,
2013), researchers may not be able to exploit this potential by working in infrastructures with
low scale or limited scope. Thus, their characteristics would be associated with researchers’
collaborative strategies, which in turn would be related not only to the production levels but
also to their ability to articulate S&T.
References
ABDI, H.; VALENTIN, D. Multiple correspondence analysis. In: SALKIND, N. J (Org.).
Encyclopedia of measurement and statistics. Thousand Oaks: SAGE Publications, 2007, p.
651-657.
AHRWEILER, P.; KEANE, M. T. Innovation networks. Mind & Society, v. 12, p. 73-90, 2013.
BORDONS, M.; APARICIO, J.; GONZÁLEZ-ALBO, B.; DÍAZ-FAES, A. A. The relationship
between the research performance of scientists and their position in co-autorship networks in
three fields. Journal of Informetrics, v. 9, p. 135-144, 2015.
BOSQUET, C.; COMBES, P. Are academics who publish more also more cited? Individual
determinants of publication and citation records. Scientometrics, v. 97, p. 831-857, 2013.
BOZEMAN, B.; BOARDMAN, C. Managing the new multipurpose, multidiscipline
university research center: institutional innovation in the academic community. Washington:
IBM Endowment for the Business of Government, 2003. 55p. Disponível em:
<http://archive.cspo.org/rvm/reports/reports_docs/IBM_Centers.pdf>. Acesso em: 30 mar.
2015.
BRANDES, U.; BORGATTI, S. P.; FREEMAN, L. C. Maitaining the duality of closeness and
betwenness centrality. Social Networks, v. 44, p. 153-159, 2016.
BRAUN, T.; GLÄNZEL, W.; SCHUBERT, A. Publication and cooperation patterns of the
authors of neuroscience journals. Scientometrics, v. 50, p. 499-510, 2001.
BRESCHI, S.; LISSONI, F. Knowledge networks from patent data. In: HENK, F. M.;
GLÄNZEL, W.; SCHMOCH, U. Handbook of quantitative science and technology
research: the use of publication and patent statistics in studies of S&T systems. Dordrecht:
Kluwer Academic Publishers, 2004. 799 p.
BRESCHI, S.; CATALINI C. Tracing the links between science and technology: an exploratory
analysis of scientists’ and inventors’ networks. Research Policy, v. 39, p. 14-26, 2010.
BRESCHI, S.; LISSONI, F.; MONTOBBIO, F. University pateting and scientific productivity:
a quantitative study of Italian academic inventors. European Management Review, v. 5, p.
91-109, 2008.
CALDERINI, M.; FRANZONI, C.; VEZZULLI, A. If star scientists do not patent: the effect
of productivity, basicness and impact on the decision to patent in the academic world. Research
Policy, v. 36, p. 303-319, 2007.
CAMERON, A. C.; TRIVEDI, P. K. Microeconometrics using Stata. College Station: Stata
Press, 2009. 692 p.
CARAYOL, N.; MATT, M. Does research organization influence academic production?
Laboratory level evidence from a large European university. Research Policy, v. 33, p. 1081-
1102, 2004.
CARAYOL, N.; MATT, M. Individual and collective determinants of academic scientists’
productivity. Information Economics and Policy, v. 18, p. 55-72, 2006.
CHERVEN, K. Mastering Gephi network visualization. Birmingham: Packt Publishing,
2015. 357 p.
COHEN, E.; RHINE, S. L. W.; SANTOS, M. C. Institutions of higher education as multi-
product firms: economies of scale and scope. Review of Economics and Statistics, v. 71, p.
284-290, 1989.
CONTANDRIOPOULOS, D.; DUHOUX, A.; LAROUCHE, C.; PERROUX, M. The impact
of a researcher’s structural position on scientific performance: an empirical analysis. PLoS
ONE, v. 11, p. 1-16, 2016.
DE STEFANO, D. D.; FUCCELLA, V.; VITALE, M. P.; ZACCARIN, S. The use of different
data sources in the analysis of co-autorship networks and scientific performance. Social
Networks, v. 35, p. 370-381, 2013.
DE STEFANO, D. D.; ZACCARIN, S. Modelling multiple interactions in science and
technology networks. Industry and Innovation, v. 20, p. 221-240, 2013.
DUNDAR, H.; LEWIS, D. R. Departmental productivity in American universities: economies
of scale and scope. Economics of Education Review, v. 14, p. 119-144, 1995.
FABRIZIO, K. R.; DI MININ, A. Commercializing the laboratory: faculty pateting and the
open Science environment. Research Policy, v. 37, p. 914-931, 2008.
FENWICK, T.; EDWARDS, R. Networks of knowledge, matters of learning, and criticality in
higher education. Higher Education, v. 67, p. 35-50, 2014.
FREEMAN, C. Technology policy and innovation performance: lessons from Japan.
London: Pinter, 1987.
GONZALEZ-BRAMBILA, C. N.; VELOSO, F. M. The determinants of research output and
impact: a study of Mexican researchers. Research Policy, v. 36, p. 1035-1051, 2007.
GONZALEZ-BRAMBILA, C. N.; VELOSO, F. M.; KRACKHARDT, D. The impact of
network embeddedness on research output. Research Policy, v. 42, p. 1555-1567, 2013.
GURMU, S; BLACK, G. C.; STEPHAN, P. E. The knowledge production function for
university patenting. Economic Inquiry, v. 49, p. 192-213, 2010.
HERNÁNDEZ, A. G. Las redes de colavoración científica e su efecto em la productividad. Un
análisis bibliométrico. Investigación Bibliotecnológica, v. 27, p. 159-175, 2013.
HORTA, H. Deepening our understanding of academic inbreeding effects on research
information exchange and scientific output: new insights for academic based research. Higher
Education, v. 65, p. 487-510, 2013.
HORTA, H.; LACY, T. A. How does size matter for science? Exploring the effects of research
unit size on academics’ scientific productivity and information exchange behaviors. Science
and Public Policy, v. 38, p. 449-460, 2011.
IVANOV, V. V.; LIBKIND, A. N.; MARKUSOVA, V. A. Publication activity and research
cooperation between higher education institutions and the Russian Academy of Sciences.
Herald of the Russian Academy of Sciences, v. 84, p. 32-38, 2014.
JACKSON, M. O. Social and economic networks. New Jersey: Princeton University Press,
2008. 504 p.
KING, D. A. The scientific impact of nations. Nature, v. 430, p. 311-316, 2004.
LEE, D. H.; SEO, I. W.; CHOE, H. C.; KIM, H. D. Collaboration network patterns and research
performance: the case of Korean public research institutions. Scientometrics, v. 91, p. 925-
942, 2012.
LISSONI, F.; MAIRESSE, J.; MONTOBBIO, F.; PEZZONI, M. Scientific productivity and
academic promotion: a study on French and Italian physicists. Industrial and Corporate
Change, v. 20, p. 253-294, 2011.
MAPPING OF THE EUROPEAN RESEARCH INFRASTRUCTURE LANDSCAPE
(MERIL). 2013. Disponível em:
<http://www.esf.org/fileadmin/Public_documents/MERIL/Conf_summary_Dec13.pdf>.
Acesso em: 22 set. 2014.
MICHAILIDIS, G. Correspondence analysis. In: SALKIND, N. J (Org.). Encyclopedia of
measurement and statistics. Thousand Oaks: SAGE Publications, 2007, p. 191-194.
NEWMAN, M. The mathematics of networks. In: BLUME, L. The new palgrave
encyclopedia of economics. 2. ed. 2008. Disponível em: <http://www-
personal.umich.edu/~mejn/papers/palgrave.pdf>. Acesso em: 23 set. 2014.
PÓVOA, L. M. C. A crescente importância das universidades e institutos públicos de pesquisa
no processo de catching-up tecnológico. Revista de Economia Contemporânea, v. 12, p. 273-
300, 2008.
REY-ROCHA, J.; GARZÓN-GARCÍA, B.; MARTÍN-SEMPERE, M. Scientists’ performance
and consolidation of research teams in Biology and Biomedicine at the Spanish Council for
Scientific Research. Scientometrics, v. 69, p. 183-212, 2006.
REY-ROCHA, J.; MARTÍN-SEMPERE, M.; GARZÓN-GARCÍA, B. Research productivity
of scientists in consolidated vs. non-consolidated teams: the case of Spanish university
geologists. Scientometrics, v. 55, p. 137-156, 2002.
ROMER, P. Endogenous technology change. Journal of Political Economy, v. 98, p. S71-
S102, 1990.
SAMPAT, B. N.; MOWERY, D. C.; ZIEDONIS, A. A. Changes in university patents quality
after the Bayh-Dole Act: a re-examination. International Journal of Industrial
Organization, v. 21, p. 1371-1390, 2003.
SQUEFF, F. H. S.; DE NEGRI, F. Infraestrutura científica e tecnológica no Brasil: análises
preliminares. Nota técnica nº 21. Instituto de Pesquisa Econômica e Aplicada (IPEA). 2014.
Disponível em:
<http://www.ipea.gov.br/portal/images/stories/PDFs/nota_tecnica/140627_nt_diset_21.pdf>.
Acesso em: 23 jul. 2015.
SOMBATSOMPOP, N.; MARKPIN, T. Making an equality of ISI impact factors for different
subject fields. Journal of the American Society for Information Science and Technology,
v. 56, p. 676-683, 2005.
STATACORP. Stata: release 12. College Station, TX: StataCorp LP, 2011.
STEPHAN, P. E. How economics shapes science. Cambridge: Harvard University Press, 2012.
367 p.
STEPHAN, P. E. The economics of science. Handbook of the Economics of Innovation, v.
1, p. 217-273, 2010.

WANG, G.; GUAN, J. Measuring science-technology interactions using patente citations and
author-inventor links: an exploration analysis from Chinese nanotechnology. Journal of
Nanoparticle Research, v. 13, p. 6245-6262, 2011.
WORTHINGTON, A. C.; HIGGS, H. Economies of scale and scope in Australian higher
education. Higher Education, v. 61, p. 387-414, 2011.
ZHANG, J. Y. The organization of scientists and its relation to scientific productivity:
perceptions of Chinese stem cell researchers. BioSocities, v. 5, p. 219-235, 2010.