the international aluminium institute report on the aluminium
TRANSCRIPT

International Aluminium Institute
19 June 2006
THE INTERNATIONAL ALUMINIUM INSTITUTE REPORT ON
THE ALUMINIUM INDUSTRY’S GLOBAL PERFLUOROCARBON GAS EMISSIONS REDUCTION
PROGRAMME
RESULTS OF THE 2004 ANODE EFFECT SURVEY

IAI 2004 Anode Effect Survey Results and Analysis
Published by: INTERNATIONAL ALUMINIUM INSTITUTE New Zealand House Haymarket London SW1Y 4TE United Kingdom Tel: + 44 (0) 20 7930 0528 Fax: + 44 (0) 20 7321 0183 Email: [email protected] Website: www.world-aluminium.org © International Aluminium Institute A company limited by guarantee. Registered in London no. 1052007 Registered Office New Zealand House, Haymarket, London SW1Y 4TE, United Kingdom

International Aluminium Institute
IAI 2004 Anode Effect Survey Results and Analysis
TABLE OF CONTENTS
1. Introduction 1
2. Survey Results 1
3. Comparison of Emission Results of OECD and non-OECD Countries
6
4. Impact of Anticipated Changes in IPCC Equation Coefficients
7
5. Uncertainty in Emissions Projections 8
6. Benchmark Data 11
7. SWPB Initiative 14
8. Summary and Conclusions 16
Appendix 2004 Benchmark Data 17
Date of Report: 19 June 2006
International Aluminium Institute
IAI 2004 Anode Effect Survey Results and Analysis 1
1. Introduction The results of the analysis of the 2004 IAI anode effect survey data are presented here. The 2004 survey continues the series of surveys covering anode effect data from global aluminium producers over the period from 1990 through 2004. The first survey covered the period from 1990 through 1993. The second survey covered the period 1994 through 1997. The third survey covered the period from 1998 through 2000, and, also requested data for the base year 1990 and for 1995 to improve the rate of data collection from these earlier years. Survey data have been requested annually after 2000. The survey results have proven to be a useful tool in communicating the excellent results that the primary aluminium industry has made over the period from 1990 in reducing greenhouse gas emissions and has provided survey participants with valuable benchmarking information with which to judge current anode effect performance and to set improvement objectives. 2. Survey Results Table 1 shows a breakdown of production by reduction technology type for 2004. Participation in the 2004 survey accounted for just over 60 percent of overall global primary production, continuing the slight downward trend in participation in the anode effect survey in recent years. The deterioration in participation has been the result of the growing global share of Chinese production. Chinese and Russian producers do not yet participate in the survey and account for the major part of the gap in coverage.
PFPB CWPB SWPB VSS HSS All
Participating in Survey (tonnes)
14,028,921 1,041,854 690,324 1,894,801 370,672 18,026,572
Non- Participants (tonnes)
7,133,750 816,040 286,000 2,467,000 1,124,950 11,827,740
Participation (Percent of total)
66.3% 56.1% 70.7% 43.4% 24.8% 60.4%
PFPB – Point Feed Prebake; CWPB – Bar Broken Center Work Prebake; SWPB – Side Work Prebake; VSS – Vertical Stud Søderberg; HSS – Horizontal Stud Søderberg
Table 1 - 2004 Anode Effect Survey Participation by Technology Type
Figure 1 shows the growth in global annual primary aluminium production over the period from 1990, when total primary production was 19.5 million tonnes, to 29.9 million tonnes in 2004. Chinese and Russian productions are included in Figure 1 from expert estimates. Figure 1 also illustrates that the increases in production between 1990 and 2004 are mainly due to increases in the lowest PFC emitting PFPB technology.

IAI 2004 Anode Effect Survey Results and Analysis 2
0
5
10
15
20
25
30
35
1990 1995 1998 1999 2000 2001 2002 2003 2004
HSS
VSS
SWPB
PFPB
CWPB
Year
Prim
ary
Pro
duct
ion
(Mill
ion
s to
nne
s)
Figure 1 – Global Primary Aluminium Production by Technology Type,
from 1990 through 2004 Figure 2 shows a more detailed look at the changes in production by technology type. The figure shows the change in production by technology type with 1990 as a baseline.
53%
246%
-43%
-73%
-40%
-7%
-100%
-50%
0%
50%
100%
150%
200%
250%
PFPB
CWPB SWPB VSSHSS
All
Cha
nge
in P
rimar
y A
lum
iniu
m T
echn
olog
y M
ix (P
erce
nt c
hang
e fro
m 1
990
to 2
004)
Figure 2 – Changes in Production by Technology Type from 1990 through 2004
Figure 2 shows that the production for CWPB and HSS technologies has decreased by approximately 40% over the period from 1990 to 2004. Over the same period production SWPB technology decreased by 73% while VSS production has decreased only slightly by 7 percent. The PFPB technology has grown by almost 2.5 times from 1990 to 2004, accounting for the overall growth in primary production of 53% over the same period.

IAI 2004 Anode Effect Survey Results and Analysis 3
Participation rate in the 2004 survey is highest for the facilities operating with Point Feed Prebake technology while survey participation from Søderberg producers represented less than half of global Søderberg production. The low Søderberg participation rate results from the fact that Russian producers, which operate predominately with Søderberg technology, do not yet participate in the survey. Figure 3 shows the breakdown of the 112 reporting facilities by technology type. The PFPB technology is the largest group accounting for 72 of the reporting facilities. There is some double counting of facilities where survey data from two different technologies within the same plant boundary are reported. Reporting by individual reduction line is encouraged to provide as full a data set as possible. The data in figure 3 have been corrected to adjust for the facilities reporting data from multiple reduction lines of the same technology type.
725
9
7
19 PFPB
CWPB
SWPB
HSS
VSS
Figure 3 – Breakdown of 2004 Survey Reporting Facilities by Technology Type
The survey requested participants to report annual primary production, average anode effect frequency, average anode effect duration and, if applicable, average overvoltage. Overvoltage was specifically requested if operators employed AP-18, AP-30 Point Feed Prebake cells and if Sidework cells utilized Alcan Pechiney control technology recording overvoltage. This anode effect performance data allow for the calculation of tetrafluoromethane, CF4, and hexafluoroethane, C2F6 emission rates per tonne aluminium produced by the Intergovernmental Panel on Climate Change (IPCC) Tier 2 method1. Total PFC emissions were then calculated for each participating facility by multiplying emissions per tonne primary aluminium times the production level in tonnes. In a continuing effort to improve the accuracy of the survey results, participants were also asked to report if a facility specific PFC measurement had been conducted and if an IPCC Tier 3b coefficient were available for calculating PFC emissions for the facility. Of the 112 reporting facilities, 24 respondents reported facility specific Tier 3b coefficients and these data were used in calculating PFC emissions per tonne aluminium produced for those facilities. The remainder of the PFC emissions data were calculated using IPCC Tier 2 methodology with industry average coefficients2.
1 IPCC Good Practice Guidance and Uncertainty Management in National Greenhouse Gas Inventories, Section 3.39, http://www.ipcc-nggip.iges.or.jp/public/gp/english/3_Industry.pdf 2 Greenhouse Gas Emissions Monitoring and Reporting by the Aluminium Industry, http://www.world-aluminium.org/environment/climate/ghg_protocol.pdf, p22, May 2003.

IAI 2004 Anode Effect Survey Results and Analysis 4
Overall progress in reducing PFC emissions per tonne aluminium produced is shown in Figure 4.
0.0
0.5
1.0
1.5
2.0
2.5
3.0
3.5
4.0
4.5
19901992
19941996
19982000
20022004
20062008
2010
PF
C E
mis
sion
s (t
CO
2 -eq
/t A
l)
Year
1.160.88
2010 Reduction Objective
Figure 4 – Progress in Reducing PFC Emissions per Tonne Aluminium Produced
Figure 4 shows that global emissions have been reduced from 4.42 tonne equivalents CO2 per tonne aluminium in 1990 to 1.16 in 2004, a reduction of 74%. The reductions achieved to date are measured against a goal set by the IAI Board of Directors to reduce PFC emissions per tonne aluminium by 80% by 2010 from the 1990 baseline. Good progress has been made to date; however, further reductions amounting to 24% of the 2004 PFC emissions must be achieved by 2010 to meet the Board’s objective. The global average PFC emissions per tonne aluminium produced was calculated as follows. First, the total tonnes of CF4 and C2F6 emitted by survey participants for each technology category were calculated by multiplying the emissions per tonne aluminium by the aluminium production for each reporting facility. Next, the total tonnes CO2 equivalent emissions for survey participants were calculated by multiplying the total tonnes of each PFC component emissions by the Global Warming Potential (GWP) values reported in the IPCC Second Assessment Report, 6500 for CF4 and 9200 for C2F6. Next, PFC emissions were estimated for primary production that did not report in the survey. The principle used was to apply the median PFC emissions calculated for survey participants for each technology group to estimate total emissions from survey non-participants. Specifically, the median CF4 emissions per tonne aluminium for survey participants were calculated for each technology type. The corresponding C2F6 emissions per tonne aluminium for each technology type were then calculated by multiplying the median CF4 emissions per tonne aluminium by the weight fraction of C2F6 to CF4. These weight fractions were calculated for each technology category by dividing the slope values for C2F6 by the slope for CF4. These median emissions for CF4 and C2F6 were then converted to CO2 equivalent emissions per tonne aluminium by multiplying by the GWPs, 6500 for CF4 and 9200 for C2F6. For each technology category the tonnes aluminium from non-participating

IAI 2004 Anode Effect Survey Results and Analysis 5
facilities were multiplied by the median PFC emissions in tonnes CO2 equivalent per tonne aluminium to obtain the estimate of total CO2 equivalent emissions for the non-participating production. Total CO2 equivalents for participants and non-participants were calculated by summing emissions from survey participants and non-participants. The global average CO2 equivalents per tonne aluminium shown in Figure 4 were calculated by dividing the total CO2 equivalents for participants and non-participants by the total global primary production. Total global PFC emissions per year released to the atmosphere, including emissions from survey participants and non-participants, over the period from 1990 through 2004 are shown in Figure 5.
58.061.8
57.553.1
37.7 40.035.2 34.7
86.1
0
10
20
30
40
50
60
70
80
90
100
1990 1995 1998 1999 2000 2001 2002 2003 2004
Year
Glo
bal
PF
C E
mis
sio
ns
(mill
ion
s to
nn
es C
O2-
eq)
Figure 5 – Total PFC Emissions from Primary Aluminium Production by Year
The total emissions are a function of both the annual emissions per tonne aluminium of the two PFCs and the total primary aluminium production levels for each year. It is notable that the total emissions have been reduced from 86.1 million tonnes CO2 equivalents in 1990 to 34.7 million tonnes CO2 equivalents in 2004, a reduction of 60 percent, even though the total primary production has increased over that same period from 19.5 to 29.9 million tonnes, an increase of 53 percent. The PFC emissions calculated for 2004 are the lowest annual PFC emissions yet recorded for the period beginning in 1990. Figure 6 shows the trend in median emissions of CF4 per tonne aluminium produced over the period from 1990 through 2004 for each of the major 5 aluminium production cell types. Record low emissions performance was recorded for both PFPB and CWPB technology groups in 2004 with the lowest median emissions recorded since 1990. The median VSS PFC emissions per tonne aluminium remained essentially unchanged from 2003 and the SWPB and HSS technologies showed significant increases in emissions per tonne aluminium over 2003.

IAI 2004 Anode Effect Survey Results and Analysis 6
0.0
0.2
0.4
0.6
0.8
1.0
1.2
1.4
1.6
1.8
1990 1992 1994 1996 1998 2000 2002 2004
PFPB
CWPB
SWPB
HSS
VSS
Med
ian
kg C
F 4/t
Al
2004 Median (kg CF4/t Al)
0.0470.0681.390.700.23
Figure 6 – Median CF4 Emissions per Tonne Aluminium Produced by Reduction Technology
Type from 1990 through 2004 3. Comparison of Emission Results of OECD and non-OECD Countries Outside stakeholders unfamiliar with the global aluminium industry often expect better PFC emissions performance from producers in OECD countries and assume that producers in non-OECD countries operate with technology that is less efficient than operations in OECD countries. Analysis of the IAI anode effect survey data shows that performances of non-OECD operators are very comparable with OECD-based operators. For those producers that responded to the IAI survey, 7.7 million tonnes were from non-OECD countries as compared with 10.3 million tonnes from OECD countries. Producers in non-OECD countries set benchmarks for the PFPB and CWPB facilities in 2004. These benchmarks, 0.020 t CO2-eq/t Al for PFPB and 0.16 t CO2-eq/t Al, can be compared with median emissions for all survey respondents of 0.36 t CO2-eq/t Al for PFPB and 0.57 t CO2-eq/t Al for CWPB technology. The PFPB and CWPB are the most modern production technologies, capable of highest efficiency and lowest GHG emissions. The results are shown in Figure 7. Figure 7 is the result of analyzing for each technology group the tonnes primary aluminium production that was in each of four quartiles from lowest PFC emitting to highest PFC emitting per tonne of aluminium produced. The sum of the production in each quartile for OECD countries was divided by the total production for OECD countries. Similarly, the sum of the non-OECD production in each quartile was divided by the total production from non-OECD countries. Figure 1 shows that non-OECD countries have a considerably larger share of production, 39.1% as compared with 27.0%, in the highest performing, lowest emitting quartile. There is still potential for improvement in the non-OECD producers in that the percent of non-OECD producers in the highest emitting quartile is also higher than that for OECD producers.

IAI 2004 Anode Effect Survey Results and Analysis 7
27.0%
30.2%
33.8%
9.0%
39.1%
18.9%20.9%21.1%
0%
5%
10%
15%
20%
25%
30%
35%
40%
45%
1st (lowest emitting) 2nd 3rd 4th (highest emitting)
Quartile for PFC Emissions Performance
Per
cen
t of T
ota
l OE
CD
or
no
n-O
EC
D P
rod
uct
ion
OECD Producers
non-OECD Producers
Figure 7 – Comparison of PFC Emission Performance of OECD and non-OECD Producers by
Production 4. Impact of Anticipated Changes in IPCC Equation Coefficients The Intergovernmental Panel on Climate Change (IPCC) sets standards for methodology for inventory of greenhouse gases. The intent of these methods is to provide national governments guidance on good practices for developing annual national inventories of greenhouse gases as required under the United Nations Framework Convention on Climate Change (UNFCCC). These good practices are also influential in guiding the standard setting for many non-governmental entities for inventory of greenhouse gases. The last update to the IPCC Good Practices, published in 2000, has served as the basis for PFC calculations for this report. The IPCC 2000 good practices are also reflected in the IAI Protocol for Inventory of Greenhouse Gases from the Aluminium Sector.3 The IPCC Good Practices are currently under revision. The IAI Climate Change Task Force, with the invitation of IPCC, has been working on the revision to the Good Practices for inventory of greenhouse gases from aluminium production. The revised document is scheduled to be adopted later in 2006. One outcome of the revision is an update to the equations that have been used to calculate PFC emissions. The revision takes into account a considerable number of new PFC measurements made at aluminium production facilities since the 2000 Good Practices were issued. The expanded database of measurements has resulted in a revision to the IPCC Tier 2 coefficients that have been used to calculate PFC emission rates in this annual report. To assess the potential impact of the revised Tier 2 coefficients on the IAI objective of reducing PFC emissions per tonne aluminium by 80% by 2010 from the 1990 baseline the anode effect data from 1990 and from 2004 were recalculated using the
3 International Aluminium Institute, The Aluminium Sector Greenhouse Gas Protocol, http://www.world-aluminium.org/environment/climate/ghg_protocol.pdf, 2005.

IAI 2004 Anode Effect Survey Results and Analysis 8
coefficients in the latest draft of the revised Good Practices.4 The results of the calculations are shown in Figure 8.
5.03
1.011.170.88
4.42
1.16
0
1
2
3
4
5
6
1990 2004 2010 Objective
Revised IPCC Tier 2 Coefficients
Current IPCC Tier 2 Coefficients
PF
C E
mis
sion
s pe
r Ton
ne A
lum
iniu
m (t
CO
2-e/
t AL)
Figure 8 – Impact of Revised IPCC Tier 2 Coefficients on IAI Objective to Reduce PFC
Emissions by 80% by 2010 from 1990 Base The impact of the revised coefficients is to raise the 1990 baseline from 4.42 to 5.03 tonnes CO2-e per tonne aluminium, an increase of 14%. In contrast, the impact of the revisions on the 2004 PFC emissions is much lower, only 9%. The difference in impacts of the revisions between 1990 and 2004 is due in major part to the relative change in technology mix from 1990 to 2004. As was seen in Figure 2 there has been a 246% increase in the PFPB production and over the same time there was a decrease in SWPB production of 73%. There were insignificant change in the Tier 2 coefficients for the PFPB cells; however, there were significant increases in the overvoltage coefficient for SWPB cells and also an increase in the fraction of C2F6 for SWPB cells. Both these factors act to increase the 1990 baseline while having little effect on the 2004 calculation. Also, the 2010 objective, as stated as an 80% reduction from the 1990 baseline, is also increased from 0.88 to 1.01 tonnes CO2-eq per tonne aluminium produced. 5. Uncertainty in Emissions Projections This section considers the uncertainty in calculations of PFC emissions from IAI survey participants, and, the uncertainty in projecting PFC emissions globally. Understanding sources of, and, magnitude of, uncertainty is important because the global Industry has made specific commitments to reduce PFC emissions per tonne aluminium produced by 80% by 2010 from the 1990 baseline. A high level of uncertainty has the potential of discounting the credibility of claims of emissions reduction. Potential significant sources of uncertainty include:
a. the uncertainty in the average industry IPCC Tier 2 calculation factors, b. use of Tier 2 factors for calculating PFC emissions for survey participants
where suitable facility specific measurements are not available, and,
4 The revised Good Practices is at the time of this report available as a pre-publication draft from http://www.ipcc-nggip.iges.or.jp/public/2006gl/ppd.htm.

IAI 2004 Anode Effect Survey Results and Analysis 9
c. estimates of emissions for producers that do not participate in the survey.
Uncertainty arises from the use of IPCC Tier 2 average industry factors due to the uncertainty in the mean slope and overvoltage coefficients. Additional PFC measurements will reduce the uncertainty of the mean coefficient values. However, for all technology groups there is considerable variance in the individual values of slope and overvoltage coefficients from which the means are calculated. For this reason calculations of PFC emissions with Tier 2 coefficients will be more uncertain than calculations made with Tier 3 coefficients calculated from PFC measurements made using good measurement practices. A Monte Carlo simulation was done comparing the 2004 IAI anode effect survey data with the survey data from 1990. Rather than using constant values for the IPCC Tier 2 coefficients in the equations for calculation of CF4 and C2F6 emissions per tonne aluminium for survey participants, the Monte Carlo simulation uses multiple iterations of random possible values from a predefined distribution of potential values. The distributions for this analysis were determined from an analysis of the measurement database from which the 2006 revised IPCC Tier 2 coefficients were calculated. For non-participants, a uniform distribution of potential values of kg CF4 per tonne aluminium was assumed with a minimum equal to the lowest CF4 emissions per tonne aluminium reported in the survey and a maximum equal to the highest in the survey. The corresponding C2F6 per tonne aluminium was calculated by multiplying each calculated value for kg CF4 per tonne aluminium by a randomly selected value for weight fraction C2F6 to CF4 selected from the defined distribution of C2F6/CF4 weight fractions by technology type. The results of the simulation are shown in Figures 9 and 10. Figure 9 shows a comparison of 1990 and 2004 total emissions of PFCs as CO2 equivalents.
Frequency Comparison
.000
.015
.030
.045
.060
25,000,000 62,500,000 100,000,000 137,500,000 175,000,000
1990 Grand Total CO2 eq
2004 Grand Tot CO2e
Figure 9 – Simulation Comparing 1990 and 2004 Total PFC Emissions Based on Proposed IPCC Factors
The analysis predicts that, with 95% confidence, 2004 PFC emissions lie between 34.6 and 71.3 tonnes CO2-eq and 1990 PFC emissions lie between 85.7 and 158.7 tonnes CO2-eq. Considering the mean values as most probable, the simulation predicts total emissions have been reduced by 56.3%. The simulation results can be compared with the mean results using the calculation methodology described on pages 4 and 5. In that calculation the projected total PFC emissions were 86.1
Mean = 121.2 million t CO2-eq
Mean = 52.9 million t CO2-eq
Total PFC Emissions (tonnes CO2-eq)

IAI 2004 Anode Effect Survey Results and Analysis 10
million t CO2-eq in 1990 reduced to 34.7 million t CO2-eq in 2004 for a reduction of 60%. Simulations for PFC emissions per tonne aluminium produced are shown in Figure 10. The simulations result in means of 6.7 tonnes CO2-eq per tonne aluminium for 1990 and 1.8 t CO2-eq/t Al in 2004.
Frequency Comparison
.000
.029
.058
.086
.115
0.00 2.50 5.00 7.50 10.00
1990 Global avg t CO2-e/t Al
2004 Global avg t CO2-e/t Al
Figure 10 – Simulation Comparing 1990 and 2004 PFC Emissions per tonne Aluminium Based
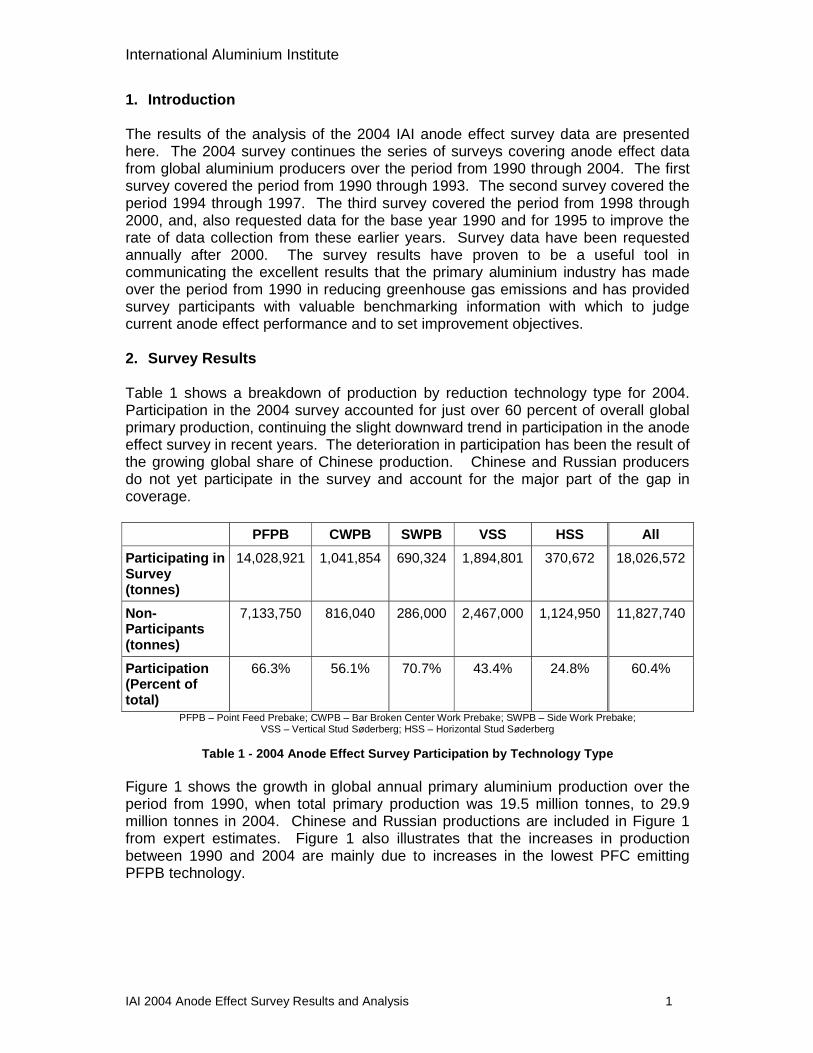
on Proposed IPCC Factors The simulations illustrated in Figures 9 and 10 show the certainty of calculations of PFC emissions improving from 1990 to 2004. This increase in certainty is the combined result of several factors. First, the mix of technologies has changed substantially from 1990 to 2004 with a major increase in the percent of PFPB production technology. The uncertainty in the Tier 2 coefficients for PFPB technology is lower than for other technologies. In addition, the uncertainty in calculating the PFC emissions is lower for PFPB technology because the range of emissions from reporting survey participants is lower for this technology category than for the Søderberg and SWPB technology groups. Another factor reducing the uncertainty over time has been the incorporation of a larger number of producers that have made PFC measurements, thus allowing calculation of PFCs by the IPCC Tier 3 method with inherently higher certainty than the Tier 2 methods. Finally, the certainty of the results is greatly affected by the percent of global aluminium production included in the survey. After participation steadily increased from 60.7% in 1990 to 68.8% in 1999, the lack of participation by Russian and Chinese producers has resulted in a steady decline in participation since 1999 to 60.4% in 2004. Survey participation dropped below the 1990 level for the first time in 2004. Certainty in calculations can be greatly improved with participation of these two major producers in the survey. Figure 11 shows the result of a simulation in which the percent reduction in PFC emissions per tonne aluminium from 1990 to 2004 is calculated. The result of this simulation is a mean reduction of 75.6% with 95% confidence range from 66.2% reduction to 82.5% reduction. The mean reduction of 75.6% calculated from the simulation compares with 75.2% calculated by the established method described on pages 4 to 5.
Pro
babi
lity
Mean = 6.67 t CO2e/t Al
Mean = 1.77 t CO2e/t Al
PFC Emissions (tonnes CO2-eq/t Al)
IAI 2004 Anode Effect Survey Results and Analysis 11
Frequency Chart
Certainty is 95.00% f rom 66.2% to 82.5%
Mean = 75.6%.000
.008
.016
.024
.032
0
8
16
24
32
63.6% 69.0% 74.3% 79.6% 84.9%
1,000 Trials 989 Displayed
Forecast: Percent reduction in t CO2/t Al
Figure 11 – Simulation of the Percent Reduction in PFC Emissions per Tonne Aluminium from
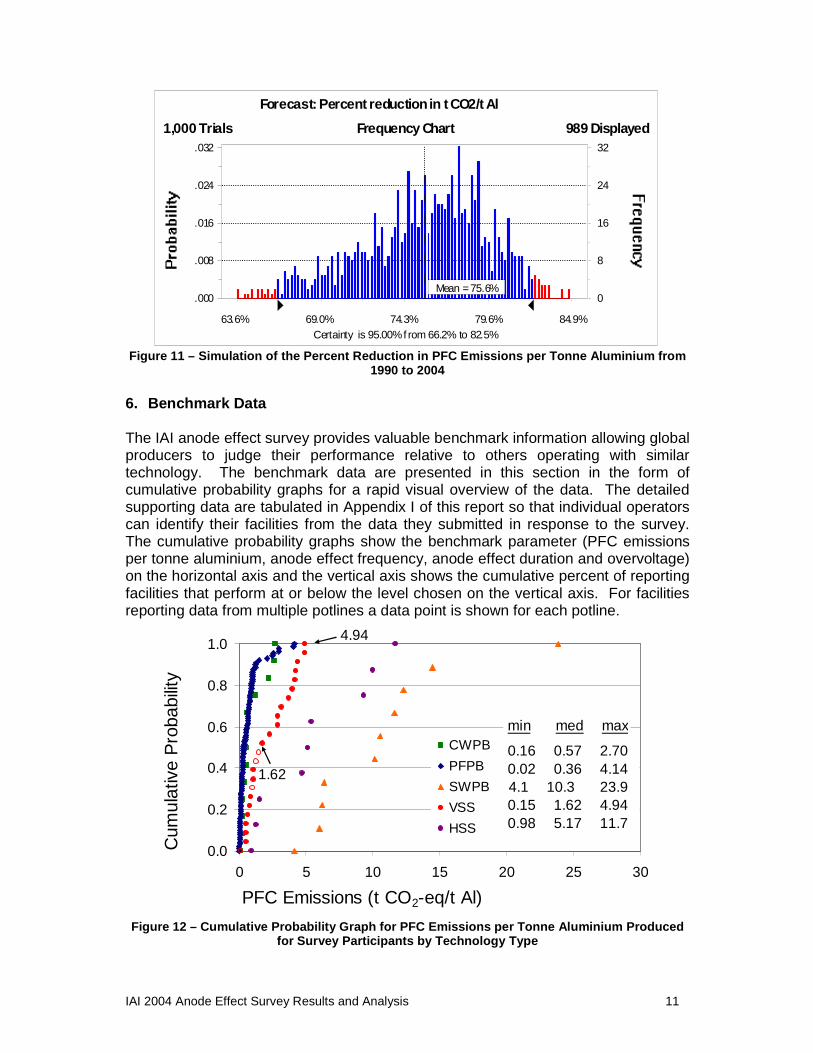
1990 to 2004 6. Benchmark Data The IAI anode effect survey provides valuable benchmark information allowing global producers to judge their performance relative to others operating with similar technology. The benchmark data are presented in this section in the form of cumulative probability graphs for a rapid visual overview of the data. The detailed supporting data are tabulated in Appendix I of this report so that individual operators can identify their facilities from the data they submitted in response to the survey. The cumulative probability graphs show the benchmark parameter (PFC emissions per tonne aluminium, anode effect frequency, anode effect duration and overvoltage) on the horizontal axis and the vertical axis shows the cumulative percent of reporting facilities that perform at or below the level chosen on the vertical axis. For facilities reporting data from multiple potlines a data point is shown for each potline.
0.0
0.2
0.4
0.6
0.8
1.0
0 5 10 15 20 25 30
CWPB
PFPB
SWPB
VSS
HSS
Cum
ulat
ive
Pro
babi
lity
PFC Emissions (t CO2-eq/t Al)
4.94
1.62
min med max
0.16 0.57 2.700.02 0.36 4.144.1 10.3 23.90.15 1.62 4.940.98 5.17 11.7
Figure 12 – Cumulative Probability Graph for PFC Emissions per Tonne Aluminium Produced
for Survey Participants by Technology Type

IAI 2004 Anode Effect Survey Results and Analysis 12
Figure 12 shows the 2004 benchmark data for PFC emissions per tonne aluminium produced by technology type. To illustrate how the graph is interpreted, take for example in Figure 12 the 0.50 point on the vertical axis the VSS data point is 1.62 tonne CO2-eq/tonne Al. The interpretation is that 50% of all operators reporting VSS anode effect data operate at or below PFC emissions per tonne aluminium produced of 1.62 tonne CO2-eq/tonne Al. At 1.00 on the vertical axis the VSS point is 4.94. The interpretation is that all VSS facilities reported anode effect data that reflected PFC emissions performance at or below 4.94 tonne CO2-eq/tonne Al, or, the maximum value calculated for VSS operators in 2004 was 4.94 tonne CO2-eq/tonne Al. Figure 12 shows that the lowest PFC emissions per tonne aluminium produced are obtained from PFPB and CWPB operators. The Søderberg facilities show a distribution of values for PFC emissions per tonne aluminium higher than the PFPB and CWPB facilities and the highest PFC emissions per tonne aluminium produced result from the SWPB cells. Figure 13 shows the distribution of anode effect frequency data for reporting facilities in 2004. As can be expected from the greater degree of control capability the PFPB anode effect frequency distribution is the lowest of the five technology groups. The remaining four technology groups show considerable overlap. The VSS facility with the lowest anode effect frequency, 0.13 anode effects per cell day, operates with point feeders and demonstrates the impact that installation of point feeders can have on anode effect frequency for Søderberg cells.
0.0
0.1
0.2
0.3
0.4
0.5
0.6
0.7
0.8
0.9
1.0
0.0 0.5 1.0 1.5 2.0 2.5 3.0 3.5 4.0
Anode Effect Frequency (Anode Effects/Cell Day)
Cu
mu
lativ
e P
rob
abili
ty
PFPB
CWPB
SWPB
VSS - Open circles PF facilities
HSS
Figure 13 - Cumulative Probability Graph for Anode Effect Frequency for Survey Participants
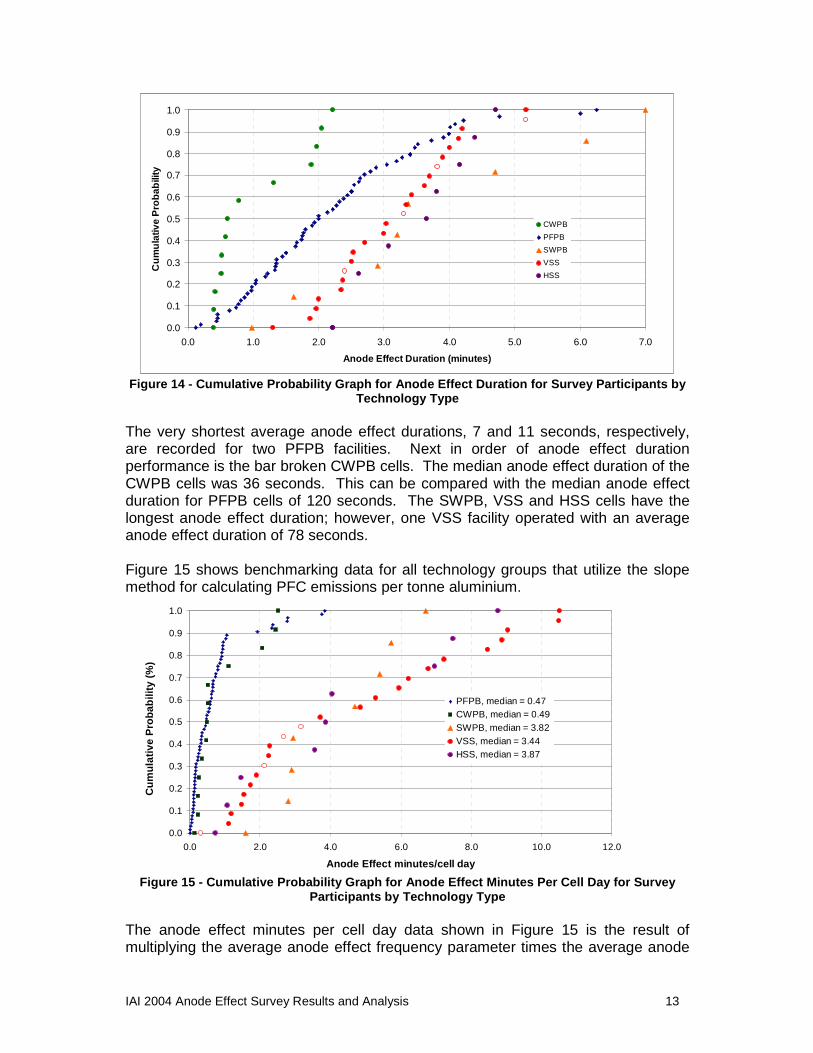
by Technology Type Figure 14 shows comparative performance for anode effect duration performance for all reporting facilities.
IAI 2004 Anode Effect Survey Results and Analysis 13
0.0
0.1
0.2
0.3
0.4
0.5
0.6
0.7
0.8
0.9
1.0
0.0 1.0 2.0 3.0 4.0 5.0 6.0 7.0
Anode Effect Duration (minutes)
Cu
mu
lativ
e P
rob
abili
ty
CWPB
PFPB
SWPB
VSS
HSS
Figure 14 - Cumulative Probability Graph for Anode Effect Duration for Survey Participants by
Technology Type The very shortest average anode effect durations, 7 and 11 seconds, respectively, are recorded for two PFPB facilities. Next in order of anode effect duration performance is the bar broken CWPB cells. The median anode effect duration of the CWPB cells was 36 seconds. This can be compared with the median anode effect duration for PFPB cells of 120 seconds. The SWPB, VSS and HSS cells have the longest anode effect duration; however, one VSS facility operated with an average anode effect duration of 78 seconds. Figure 15 shows benchmarking data for all technology groups that utilize the slope method for calculating PFC emissions per tonne aluminium.
0.0
0.1
0.2
0.3
0.4
0.5
0.6
0.7
0.8
0.9
1.0
0.0 2.0 4.0 6.0 8.0 10.0 12.0
Anode Effect minutes/cell day
PFPB, median = 0.47CWPB, median = 0.49SWPB, median = 3.82VSS, median = 3.44HSS, median = 3.87
Cu
mu
lati
ve P
rob
abili
ty (
%)
Figure 15 - Cumulative Probability Graph for Anode Effect Minutes Per Cell Day for Survey
Participants by Technology Type The anode effect minutes per cell day data shown in Figure 15 is the result of multiplying the average anode effect frequency parameter times the average anode

IAI 2004 Anode Effect Survey Results and Analysis 14
effect duration. Anode effect minutes per cell day relates directly to PFC emissions per cell day through the slope factor. Figure 15 shows that anode effect minutes per cell day form two broad families of data. There is similarity between the anode effect minutes per cell day data for PFPB and CWPB. Both these technology groups have the same value for slope, 0.14 kg CF4/anode effect minute per cell day. Similarly, there is comparability in the anode effect minutes per cell day data for the SWPB, VSS and HSS cell technology groups; however, there are considerable differences in the slope parameter for these three technology groups. The slope value is highest for the SWPB technology group, 0.29 kg CF4/anode effect minute per cell day. The comparable slope values for VSS and HSS are 0.068 and 0.18, respectively. Figure 16 shows the benchmarking graph for anode effect overvoltage for PFPB cells operating with Alcan AP technology. For these operators the overvoltage parameter relates directly to PFC emissions per tonne aluminium produced. Operators recording positive overvoltage reported a considerably larger range of overvoltage than do operators measuring algebraic overvoltage. This is to be expected since long anode effects requiring multiple bridge movements are more likely to have subtracted voltage.
0.0
0.2
0.4
0.6
0.8
1.0
0 2 4 6 8 10 12
Overvoltage (mV)
Cu
mu
lati
ve P
rob
abil
ity
Algebraic OV
Positive OV
Figure 16 - Cumulative Probability Graph for Anode Effect Overvoltage for Survey Participants
Operating with Alcan AP Technologies 7. SWPB Initiative Analysis of 2004 survey data shows, as did the 2003 survey, that the SWPB technology group results in emissions that are disproportionate to the tonnes aluminium produced. Figure 3 showed the breakdown of total production by technology type. In Figure 3 SWPB technology makes up just 3% of global primary aluminium production. A similar breakdown in Figure 17 for global PFC emissions

IAI 2004 Anode Effect Survey Results and Analysis 15
by technology type shows that SWPB producers account for 26% of total PFC emissions from aluminium production.
27%
4%
26%
21%
22%
PFPBCWPBSWPBHSSVSS
Figure 17 – Breakdown of Global PFC Emissions from Primary Aluminium Production by
Technology Type Figures 12 to 15 show the performance of the SWPB cells relative to other technologies for parameters affecting PFC emissions. During 2005 a special focus was placed on SWPB facilities to achieve reductions at these facilities to accelerate emissions reductions. As part of the initiative, SWPB producers were surveyed as to factors that might contribute to the high rate of PFC emissions from these cells. The key findings from the SWPB study are:
• SWPB cells differ considerably in cell design among the facilities and are inherently unstable and difficult to operate.
• Implementation of cell control algorithms that anticipate anode effects and initiate feeding action prior to the occurrence of anode effects can reduce the frequency of occurrence of anode effects.
• Bath chemistry control is important, particularly for those operators who use lithium fluoride in the bath.
• Location specific work practices can impact anode effect duration substantially with a direct impact on PFC emissions.
• PFC measurements and Tier 3 calculation methods are particularly important for SWPB facilities because the equation coefficients give the highest emissions per unit time on anode effect for any technology.
• There is still considerable potential for PFC emissions performance improvement within the SWPB technology group.
• Retrofitting SWPB facilities with point feeders offers dramatic reductions in PFC emissions not only because of a reduction in the frequency and duration of anode effects, but, also because the PFC emissions per minute of anode effect are halved.
The producers focus on reducing emissions from the SWPB technology group should be visible in the 2005 anode effect survey results. A similar focus is planned for Søderberg cell technology in 2006.

IAI 2004 Anode Effect Survey Results and Analysis 16
8. Summary and Conclusions The 2004 IAI anode effect performance survey results continue the trend of reduced global PFC emissions. Projections of global PFC emissions per tonne aluminium produced based on applying the participants’ median anode effect performance levels to non-participating production show a improvement to 1.16 t CO2 equivalents/t Al. Calculation of total global emissions of PFCs to the atmosphere in 2004 from primary aluminium production showed the lowest emissions of PFCs to the atmosphere over the period of the study from 1990, 34.7 million tonnes CO2 equivalents. IPCC Tier 2 coefficients used to calculate PFC emissions per tonne aluminium are being revised and will impact IAI emissions projections for those facilities that have not yet made PFC measurements. Using the current proposed values for the revised IPCC Tier 2 coefficients analysis of 1990 and 2004 anode effect data were made. The results showed that the 1990 emissions were impacted more than 2004 emissions, raising the 1990 baseline from 4.42 to 5.03 tonnes CO2-e per tonne aluminium, an increase of 14% while the 2004 emissions were essentially unchanged. The overall impact of the revised coefficients is a slightly improved position toward meeting the IAI goal of an 80% reduction in PFC emissions per tonne aluminium by 2010 from the 1990 baseline with 2004 reductions at 76.7% with the revised coefficients as compared with 73.8% with the current calculations. Uncertainty in global aluminium PFC emissions can be reduced by getting higher participation in the anode effect survey. In 2004 survey participation fell for the first time to a level lower than for the 1990 survey. Participation in the anode effect survey by Russian and Chinese producers is needed to reduce uncertainty in emissions calculations and maintain credibility of results. Also, making PFC measurements at those facilities that have not yet made measurements will increase the accuracy of results by enabling the use of Tier 3 methods for those facilities. There is still a considerable range of anode effect performance seen in the benchmark data for facilities operating with similar reduction technologies. This would indicate that there is still an excellent opportunity for making progress in reducing anode effects and the resulting PFC emissions through driving toward best work practices. A good record of PFC emissions reduction has been achieved by the global industry to date. Aggressive efforts are still necessary to hold the gains made to date and make the further reductions necessary to achieve the IAI Board’s goal of an 80% reduction in PFC emissions by 2010 from the 1990 baseline.

IAI 2004 Anode Effect Survey Results and Analysis 17
Appendix – 2004 Benchmark Data
A. PFPB Rankings
Data Point Rank AEF Cum Frac. Data Point Rank t CO2/t Al Cum frac. Data Point Rank AE Dur Cum frac.1 0.02 0.00 136 1 0.020 0.000 53 1 0.12 0.00
35 0.02 0.00 65 2 0.023 0.011 65 2 0.19 0.0288 0.02 0.00 53 3 0.023 0.022 84 3 0.44 0.03
135 2 0.03 0.04 14 4 0.046 0.033 64 4 0.46 0.05123 3 0.03 0.05 44 5 0.050 0.044 136 5 0.46 0.06136 4 0.04 0.06 76 6 0.052 0.056 52 6 0.63 0.0838 5 0.05 0.07 35 7 0.054 0.067 79 7 0.74 0.09
100 6 0.06 0.08 57 8 0.065 0.078 151 8 0.78 0.1163 7 0.06 0.10 32 9 0.066 0.089 127 9 0.81 0.13
101 8 0.06 0.11 110 10 0.068 0.101 32 10 0.87 0.1422 9 0.07 0.12 1 11 0.075 0.112 73 11 0.92 0.1632 0.07 0.13 56 12 0.077 0.123 156 12 0.97 0.17
125 0.07 0.13 13 13 0.077 0.134 70 13 0.98 0.1924 0.07 0.13 123 14 0.084 0.146 112 14 1.03 0.2057 0.07 0.13 125 15 0.100 0.157 23 15 1.05 0.224 11 0.07 0.18 64 16 0.104 0.168 18 16 1.18 0.23
121 0.08 0.19 52 17 0.114 0.179 93 17 1.22 0.2556 0.08 0.19 63 18 0.114 0.191 125 18 1.33 0.2790 13 0.084 0.22 73 19 0.117 0.202 120 19 1.34 0.2877 14 0.09 0.23 12 20 0.138 0.213 2 20 1.35 0.3089 15 0.10 0.24 79 21 0.146 0.224 92 21 1.36 0.3165 0.11 0.25 135 22 0.150 0.235 27 22 1.44 0.3327 0.11 0.25 38 23 0.150 0.247 118 1.50 0.3466 0.11 0.25 84 24 0.152 0.258 155 1.50 0.3476 0.11 0.25 101 25 0.161 0.269 51 24 1.65 0.38
110 0.11 0.25 86 26 0.165 0.280 116 25 1.67 0.3973 17 0.12 0.31 27 27 0.170 0.292 99 26 1.74 0.41
118 0.15 0.33 109 28 0.180 0.303 48 27 1.75 0.42109 0.15 0.33 100 29 0.183 0.314 63 28 1.77 0.4456 0.15 0.33 127 30 0.190 0.325 152 29 1.80 0.4586 0.15 0.33 137 31 0.194 0.337 153 30 1.90 0.4787 19 0.16 0.37 4 32 0.200 0.348 37 31 1.94 0.48
127 0.16 0.39 124 33 0.228 0.359 126 32 2.00 0.5099 0.16 0.39 56 34 0.229 0.370 62 33 2.00 0.52
52 21 0.17 0.41 118 35 0.242 0.382 132 34 2.13 0.53
61 22 0.17 0.42 156 36 0.256 0.393 129 35 2.22 0.55
156 0.18 0.43 24 37 0.256 0.404 82 36 2.27 0.56
53 0.18 0.43 77 38 0.279 0.415 131 37 2.32 0.58
78-3 0.18 0.43 88 39 0.295 0.426 101 38 2.38 0.5979 24 0.19 0.47 99 40 0.299 0.438 111 39 2.44 0.616 25 0.19 0.48 66 41 0.300 0.449 35 2.50 0.63
64 0.21 0.49 121 42 0.303 0.460 130 2.50 0.6330 0.21 0.49 106 43 0.310 0.471 134 41 2.54 0.66
78-4 0.21 0.49 22 44 0.349 0.483 4 42 2.62 0.6751 27 0.22 0.53 18 45 0.355 0.494 128 43 2.63 0.6910 28 0.23 0.54 90 46 0.360 0.505 154 44 2.70 0.7062 29 0.24 0.55 51 47 0.383 0.516 38 45 2.79 0.72
126 30 0.24 0.57 89 48 0.438 0.528 77 46 2.88 0.7382 31 0.25 0.58 98 49 0.449 0.539 100 47 3.04 0.75
78-2 32 0.27 0.59 120 50 0.490 0.550 30 48 3.19 0.7718 33 0.28 0.60 62 51 0.508 0.561 47 49 3.28 0.78
106 34 0.28 0.61 126 52 0.516 0.573 24 3.40 0.80152 35 0.30 0.63 155 53 0.532 0.584 123 3.40 0.8078-1 0.31 0.64 18 54 0.589 0.595 1 51 3.47 0.8318 0.31 0.64 82 55 0.621 0.606 121 52 3.52 0.8437 37 0.32 0.66 92 56 0.651 0.617 10 53 3.72 0.8684 38 0.33 0.67 37 57 0.668 0.629 61 54 3.91 0.88
111 39 0.33 0.69 152 58 0.669 0.640 89 3.99 0.89155 40 0.33 0.70 112 59 0.673 0.651 90 3.99 0.89120 0.34 0.71 87 60 0.691 0.662 149 56 4.01 0.92124 0.34 0.71 23 61 0.700 0.674 31 57 4.09 0.94132 42 0.34 0.73 61 62 0.715 0.685 71 58 4.22 0.95128 43 0.35 0.75 30 63 0.721 0.696 22 59 4.77 0.97153 44 0.35 0.76 6 64 0.745 0.707 72 60 6.00 0.98154 45 0.39 0.77 132 65 0.784 0.719 150 61 6.25 1.00131 46 0.40 0.78 78-3 66 0.802 0.73092 47 0.41 0.80 70 67 0.802 0.741
130 48 0.41 0.81 153 68 0.824 0.752129 49 0.42 0.82 111 69 0.856 0.764
2 50 0.43 0.83 116 70 0.862 0.77531 51 0.47 0.84 10 71 0.920 0.786
116 52 0.48 0.86 48 72 0.960 0.79748 53 0.51 0.87 151 73 0.967 0.808
150 54 0.60 0.88 131 74 0.986 0.820112 55 0.61 0.89 128 75 0.987 0.83123 56 0.62 0.90 78-4 76 1.000 0.84272 57 0.64 0.92 129 77 1.012 0.85371 58 0.66 0.93 93 78 1.029 0.865
149 59 0.69 0.94 130 79 1.111 0.87647 60 0.71 0.95 78-2 80 1.245 0.88770 61 0.77 0.96 2 81 1.249 0.89893 62 0.78 0.98 154 82 1.305 0.910
134 63 0.93 0.99 78-1 83 1.477 0.921151 64 1.22 1.00 31 84 2.068 0.932
47 85 2.505 0.943134 86 2.541 0.955149 87 2.981 0.96671 88 2.992 0.977150 89 4.036 0.98872 90 4.136 1.000
40
1
10
16
20
12
18
23
50
23
26
36
41
55

IAI 2004 Anode Effect Survey Results and Analysis 18
PFPB Rankings (Continued)
Data Point Rank AE min/cell da Cum frac. Data Point Rank OV (mV) Cum frac. Alg/Pos136 1 0.018 0.00 86 1 0.909 0.00 A65 2 0.021 0.02 135 2 0.975 0.20 A53 3 0.022 0.03 88 3 1.92 0.40 A35 4 0.050 0.05 66 4 2.26 0.60 A32 5 0.061 0.06 124 5 3 0.80 A1 6 0.069 0.08 87 6 4.5 1.00 A
125 7 0.093 0.0964 8 0.096 0.11 14 1 0.3 0.00 P52 0.106 0.13 57 2 0.42 0.06 P63 0.106 0.14 13 0.5 0.11 P73 10 0.109 0.16 56 0.5 0.11 P123 11 0.116 0.17 44 4 0.6493 0.22 P127 12 0.130 0.19 106 5 0.74 0.28 P79 13 0.136 0.20 76 6 0.77 0.33 P38 14 0.140 0.22 12 7 0.9 0.39 P84 15 0.141 0.23 137 8 1.26 0.44 P101 16 0.150 0.25 110 9 1.44 0.50 P27 17 0.158 0.27 56 10 1.49 0.56 P100 18 0.170 0.28 18 11 2.89 0.61 P156 19 0.175 0.30 98 12 2.923 0.67 P4 20 0.186 0.31 109 13 3.3 0.72 P
118 21 0.225 0.33 6 14 4.85 0.78 P24 22 0.238 0.34 78-3 15 5.22 0.83 P77 23 0.259 0.36 78-4 16 6.51 0.89 P99 24 0.278 0.38 78-2 17 8.1 0.94 P121 25 0.282 0.39 78-1 18 9.61 1.00 P22 26 0.324 0.4118 27 0.330 0.4290 28 0.335 0.4451 29 0.356 0.4589 30 0.407 0.47120 31 0.456 0.4862 32 0.473 0.50126 33 0.480 0.52
155 34 0.495 0.53
152 35 0.540 0.55
92 36 0.558 0.56
82 37 0.577 0.58
2 38 0.581 0.5937 39 0.621 0.61112 40 0.625 0.6323 41 0.651 0.6461 42 0.665 0.66153 43 0.665 0.6730 44 0.670 0.69132 45 0.728 0.7070 46 0.746 0.72111 47 0.796 0.73116 48 0.802 0.7510 49 0.856 0.7748 50 0.893 0.78131 51 0.916 0.80128 52 0.918 0.81129 53 0.941 0.83151 54 0.947 0.8493 55 0.956 0.86130 56 1.033 0.88154 57 1.053 0.8931 58 1.922 0.9147 59 2.329 0.92134 60 2.362 0.94149 61 2.772 0.9571 62 2.782 0.97150 63 3.752 0.9872 64 3.845 1.00
93

IAI 2004 Anode Effect Survey Results and Analysis 19
B. CWPB Rankings
Data Point Rank AEF Cum Frac. Data Point Rank t CO2/t Al Cum frac. Data Point Rank AED Cum frac. Data Point Rank AE min/cell da Cum frac.15 1 0.31 0.00 146 1 0.16 0.00 148 1 0.39 0.00 146 1 0.147 0.00146 2 0.35 0.08 148 2 0.26 0.08 40 2 0.40 0.08 148 2 0.238 0.0817 3 0.40 0.15 15 3 0.28 0.17 146 3 0.42 0.17 15 3 0.242 0.1784 4 0.50 0.23 147 4 0.29 0.25 43 4 0.52 0.25 147 4 0.270 0.25147 5 0.52 0.31 40 5 0.41 0.33 147 5 0.52 0.33 40 5 0.357 0.33148 6 0.61 0.38 43 6 0.55 0.42 42 6 0.58 0.42 43 6 0.472 0.4242 7 0.85 0.46 42 7 0.57 0.50 41 7 0.60 0.50 42 7 0.488 0.5041 8 0.87 0.54 17 8 0.60 0.58 15 8 0.78 0.58 41 8 0.523 0.5840 9 0.90 0.62 41 9 0.61 0.67 17 9 1.31 0.67 17 9 0.524 0.6743 10 0.91 0.69 84 10 1.19 0.75 29c 10 1.89 0.75 84 10 1.110 0.7529d 11 1.01 0.77 29d 11 2.23 0.83 29b 11 1.97 0.83 29d 11 2.071 0.8338 12 1.20 0.85 29b 12 2.63 0.92 29d 12 2.05 0.92 29b 12 2.443 0.9229b 13 1.24 0.92 29c 13 2.70 1.00 84 13 2.22 1.00 29c 13 2.514 1.0029c 14 1.33 1.00
C. SWPB Rankings
Data Point Rank AEF Cum Frac. Data Point Rank t CO2/t Al Cum frac. Data Point Rank AED Cum frac. Data Point Rank AE min/cell da Cum frac.55 1 0.55 0.00 55 1 4.09 0.00 119 1 0.98 0.00 55 1 1.595 0.00
141 2 0.67 0.11 119 2 6.02 0.11 108 2 1.62 0.14 119 2 2.798 0.1454 3 0.92 0.22 108 3 6.24 0.22 55 3 2.90 0.29 108 3 2.900 0.29
133 4 1.10 0.33 54 4 6.33 0.33 54 4 3.20 0.43 54 4 2.944 0.43140 5 1.15 0.44 141 5 10.11 0.44 80 5 3.37 0.57 141 5 4.697 0.5780 6 1.70 0.56 39 6 10.55 0.56 140 6 4.70 0.71 140 6 5.405 0.71
108 7 1.79 0.67 140 7 11.63 0.67 133 7 6.10 0.86 80 7 5.729 0.8639 8 2.61 0.78 80 8 12.33 0.78 141 8 7.00 1.00 133 8 6.710 1.00
119 9 2.85 0.89 133 9 14.44 0.8995 10 3.65 1.00 95 10 23.85 1.00
D. VSS Rankings
Data Point Rank AEF Cum Frac. Data Point Rank t CO2/t Al Cum frac. Data Point Rank AED Cum frac. Data Point Rank AE min/cell da Cum frac.139 1 0.13 0.00 139 1 0.15 0.00 3c 1 1.30 0.00 139 1 0.312 0.00102 2 0.41 0.043 3c 2 0.52 0.04 3a 2 1.87 0.04 3c 2 1.105 0.0483 3 0.50 0.09 83 3 0.56 0.09 3b 3 1.96 0.09 83 3 1.183 0.0994 4 0.55 0.13 34 4 0.56 0.13 3d 4 2.00 0.13 94 4 1.477 0.1334 5 0.62 0.17 94 5 0.69 0.17 83 5 2.35 0.17 34 5 1.550 0.17
117 6 0.70 0.22 103 6 0.81 0.22 103 6 2.37 0.22 103 6 1.730 0.22103 7 0.73 0.26 3b 7 0.89 0.26 139 7 2.40 0.26 3b 7 1.901 0.263c 8 0.85 0.30 102 8 1.00 0.30 34 8 2.50 0.30 102 8 2.120 0.3055 9 0.96 0.35 3a 9 1.05 0.35 49 9 2.53 0.35 3a 9 2.244 0.353b 10 0.97 0.39 3d 10 1.07 0.39 94 10 2.71 0.39 3d 10 2.280 0.3957 11 1.01 0.43 117 11 1.26 0.43 33 11 3.00 0.43 117 11 2.674 0.433d 12 1.14 0.48 55 12 1.49 0.48 122 12 3.04 0.48 55 12 3.168 0.48
105 13 1.15 0.52 57 13 1.74 0.52 55 13 3.30 0.52 57 13 3.711 0.523a 14 1.20 0.57 45 14 2.28 0.57 145 14 3.34 0.57 45 14 4.851 0.5745 15 1.34 0.61 24 15 2.92 0.61 144 15 3.43 0.61 49 15 5.288 0.6124 16 1.48 0.65 122 16 2.94 0.65 45 16 3.62 0.65 105 16 5.957 0.65
142 17 1.74 0.70 142 17 3.18 0.70 57 17 3.69 0.70 24 17 6.216 0.7049 18 2.09 0.74 105 18 3.73 0.74 117 18 3.82 0.74 142 18 6.782 0.74
143 19 2.22 0.78 144 19 3.98 0.78 142 19 3.90 0.78 122 19 7.231 0.78122 20 2.38 0.83 143 20 4.17 0.83 143 20 4.00 0.83 144 20 8.472 0.83144 21 2.47 0.87 145 21 4.25 0.87 15 21 4.14 0.87 143 21 8.880 0.8715 22 2.54 0.91 49 22 4.37 0.91 24 22 4.20 0.91 145 22 9.051 0.91
145 23 2.71 0.96 33 23 4.93 0.96 102 23 5.17 0.96 33 23 10.500 0.9633 24 3.50 1.00 15 24 4.94 1.00 105 24 5.18 1.00 15 24 10.516 1.00

IAI 2004 Anode Effect Survey Results and Analysis 20
E. HSS Rankings
Data Point Rank AEF Cum frac. Data Point Rank t CO2/t Al Cum frac. Data Point Rank AED Cum frac. Data Point Rank AE min/cell da Cum frac.138 1 0.33 0.00 138 1 0.98 0.00 66 2.22 0.00 138 1 0.733 0.0066 2 0.48 0.13 66 2 1.30 0.13 138 2.22 0.00 66 2 1.066 0.1397 3 0.56 0.25 97 3 1.57 0.25 97 2 2.62 0.25 97 3 1.467 0.2581 4 0.81 0.38 81 4 4.76 0.38 6b 3 3.07 0.38 81 4 3.564 0.3846 5 0.86 0.50 85 5 5.17 0.50 6c 4 3.65 0.50 85 5 3.869 0.5085 6 0.93 0.63 46 6 5.41 0.63 6a 5 3.81 0.63 46 6 4.051 0.636c 7 1.91 0.75 6c 7 9.29 0.75 85 6 4.16 0.75 6c 7 6.957 0.756a 8 2.30 0.88 6b 8 10.00 0.88 81 7 4.39 0.88 6b 8 7.491 0.886b 9 2.44 1.00 6a 9 11.70 1.00 46 8 4.71 1.00 6a 9 8.763 1.00
1