the intervention of saturated hydrogen the glyoxylic acid
TRANSCRIPT

Page 1/22
Effects of high-fat diet on the epithelial-mesenchymal transition of respiratory tract throughthe glyoxylic acid cycle of pulmonary microbes andthe intervention of saturated hydrogenXiangjie Qiu
Central South University Xiangya School of MedicineOusman Bajinka
Central South University Xiangya School of MedicineLili Wang
Central South University Xiangya School of MedicineGuojun Wu
Central South University Xiangya School of MedicineYurong Tan ( [email protected] )
Central South University https://orcid.org/0000-0002-2871-4078
Research
Keywords: high-fat diet, pulmonary microecology, glyoxylic acid cycle, epithelial-mesenchymal transition,saturated hydrogen
Posted Date: March 17th, 2020
DOI: https://doi.org/10.21203/rs.3.rs-17519/v1
License: This work is licensed under a Creative Commons Attribution 4.0 International License. Read Full License

Page 2/22
AbstractBackground High fat diet is extensively studied to be associated with trending metabolic diseases. Inaddition to type 2 diabetes and hypertension, high fat diet is strongly associated with asthma and otherrespiratory diseases among children however, the pathogenicity regarding these pulmonary diseasesbegs for extensive research. This study investigated the mechanism of the epithelial-mesenchymaltransition of respiratory tract, induced by changes in lung microecology with the intake of high-fat diet. 80�ve-week-old C57BL6/J male mice were randomly divided into normal control group, normal hydrogengroup, high-fat group and high-fat hydrogen group, making 20 mice in each group. The weight of the micewere measured on weekly basis. 6 mice from each group were executed at every second week. Bloodsample was collected for lipid testing, lung tissues were collected for 16SrRNA gene sequencing, HEstaining, immuno�uorescence and quantitative real-time PCR (qPCR).
Results Compared with the normal diet group, mice on the high-fat diet group showed increasedin�ammatory cell in�ltration, decreased expression of e-cadherin (E-cad) and increased expression ofTwist. There were signi�cant differences in the composition of bacteria in the lung, and the expression ofisocitrate lyase (ICL) gene in Pseudomonas aeruginosa , Staphylococcus aureus and Acinetobacterbaumannii , which were signi�cantly associated with asthma were seen with a signi�cant increasingtrend. After the treatment of saturated hydrogen, the changes in lung microbial population, lung tissuein�ltration of in�ammatory cells and the transformation of epithelial stroma caused by high-fat diet weremoderately alleviated.
Conclusion High fat diet can affect the process of airway epithelial stroma by altering the glyoxylatecycle of pulmonary microbes while the pathological process are alleviated by saturated hydrogen byacting on glyoxylate cycle.
IntroductionHigh fat diet is not only associated with type 2 diabetes (T2DM), hypertension and other metabolicdiseases, but is also studied to be correlating signi�cantly with asthma and other respiratory diseases.Based on the previous studies, the incidence of asthma and asthmatic diseases in children with high-fatdiet is signi�cantly higher than children without high-fat diet [1, 2] however, the pathogenicityunderpinning high-fat diet with asthma is still in the mystery. Asthma is a chronic airway in�ammatorydisease, which often occurs with airway remodeling [3, 4]. Airway remodeling is based on chronic airwayin�ammation, which leads to the irreversible changes of airway structure. Subepithelial �brosis is one ofthe core characteristics of airway remodeling, which is associated with the severity of asthma and one ofthe main causes of death in patients with severe asthma [5, 6]. Airway epithelial mesenchymal transition(EMT) is a cell biological process in which epithelial cells are transformed into stromal phenotypesthrough a speci�c process, which plays an important role in airway remodeling of asthma. Airwayremodeling can improve the degree of subepithelial �brosis of airway through EMT [7]. Early prevention

Page 3/22
and treatment of airway remodeling and reduction of �brosis in asthmatic patients is an intervention thatdo not only control the level of asthma but also enhance the prognosis.
Modern day science is blessed with 16SrRNA gene sequencing technology that enhanced microbialcharacterization and ascertained more than 30 bacterial species planted in the lungs [8]. Going by thepublished studies, the diversity of microbes in the lung is biological imperative in maintaining the normalairway function, and in addition to bacterial, fungi and viruses constitute the intrapulmonarymicroecology. Studies based on common respiratory diseases, alteration or changes in the diversity ofmicrobes are associated with asthma and pulmonary �brosis [9–11]. A number of studies meet aconsensus that in respiratory diseases such as asthma and chronic obstructive pulmonary diseases(COPD), abnormal increase in abundance of species such as Pseudomonas aeruginosa, Acinetobacterbaumannii, Staphylococcus aureus, Klebsiella pneumoniae, and Haemophilus in�uenzae was observed[12, 13].
The glyoxylic acid cycle is a metabolic pathway in prokaryotes, lower eukaryotes, and plants, and it isessential for the energy metabolism. Studies have shown that the glyoxylate cycle also exists in manyopportunistic pathogens. These opportunistic pathogens use the host's fatty acid degradation productsto synthesize substances required for their normal growth and reproduction, split macrophages from theinside, and then expand in abundance in the host [14]. Fatty acids are decomposed into acetyl-CoA bybeta-oxidation, which form citric acid with oxaloacetate produced from two acetates through the glyoxyliccycle. Under the action of aconitase, citric acid produces isocitrate, which is broken by isocitrate lyase(ICL) to produce glyoxylic acid and succinic acid. Next, glyoxylic acid and acetyl-CoA produce malic acidunder the catalysis of malic acid synthetase and malic acid is dehydrogenated to oxaloacetic acid underthe catalysis of malic acid dehydrogenase. The succinic acid produced in this cycle can be used tosynthesize sugars and other cellular components, which de�ned ICL as the most critical enzyme in theglyoxylic acid cycle [15].
Number of studies have shown that viral infection and high-fat diet can lead to the accumulation of fattyacids in cells. Therefore, we speculate that the high-fat airway microenvironment caused by high-fat dietleads to an imbalance of airway microecology through the promotion of the glyoxylate cycle of microbes.We further hypothesized that the abnormal increase of opportunistic pathogens mediate chronic airwayin�ammation, thus promoting the occurrence of asthma and airway remodeling.
Hydrogen (H2) has antioxidant, anti-in�ammatory, and anti-apoptotic properties and is the most abundantchemical element in the world [16]. In 2007, Ohsawa et al [17] con�rmed that inhaling 2% hydrogen couldlead to selective scavenging of hydroxyl radicals (OH) and peroxynitrite anions (ONOO−), whichsigni�cantly enhance cerebral ischemia-reperfusion injury in rats. After long-term drinking of hydrogen-rich water by obese mice with T2DM, liver malondialdehyde level, fat content, blood sugar, and blood totalglyceride (TG) levels all decreased [18, 19], suggesting that hydrogen could improve metabolic disordersof lipids and glucose, as well as the metabolic syndrome. Therefore, we use saturated hydrogen as a

Page 4/22
treatment factor to explore whether it can improve the effect of lipid metabolism disorder caused by high-fat diet on the transformation of respiratory epithelial stroma.
ResultsThe mice on the high-fat diet show signi�cant increase in body weights and dyslipidemia, which wasaborogated by saturated hydrogen.
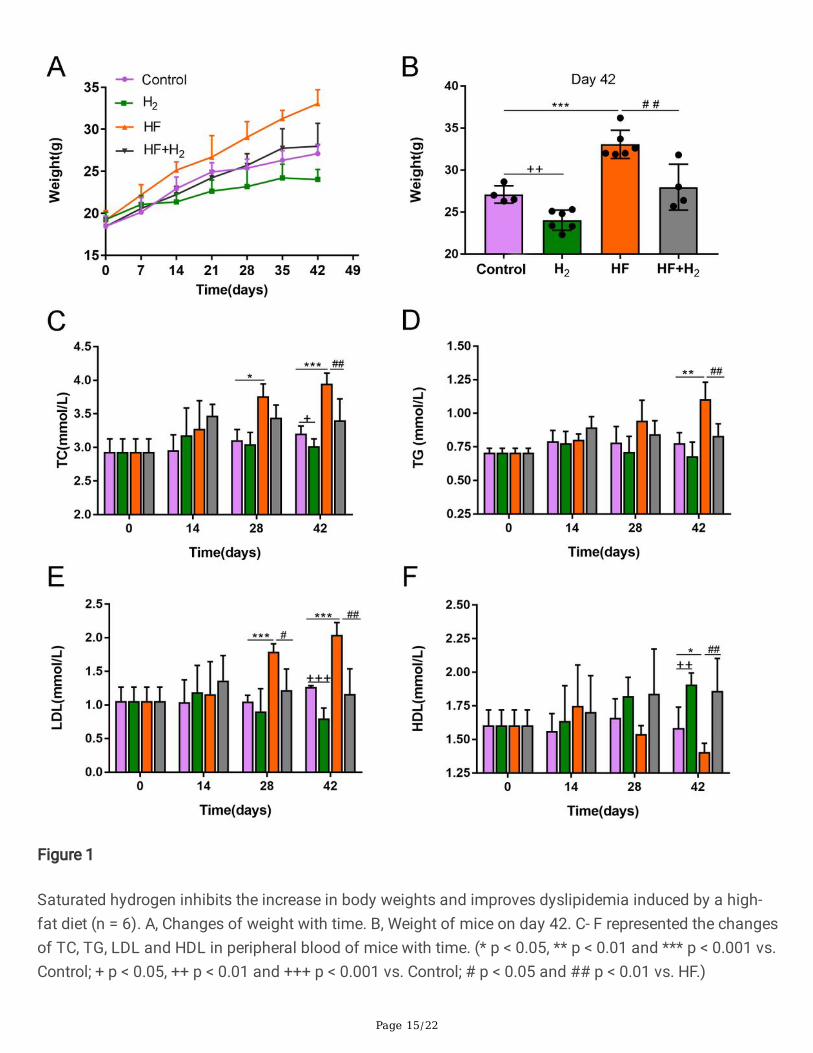
As shown in Figure 1A, the average weight of mice in the HF+H2 group on the 42nd day was 34.05 ± 2.15g, 20% higher than that of mice in the Control group, which was 27.45 ± 1.15 g, meaning that the averageweight of mice in the HF+H2 group meet the weight standard of obese mice. The average weights of micein the H2 and HF+H2 groups decreased after treatment with saturated hydrogen when compared withthose in the corresponding Control and HF groups, as shown in Figure 1B, indicating that saturatedhydrogen inhibited the increase in body weights of mice.
On day 28, total cholesterol (TC) and low-density lipoprotein (LDL) in the HF group increased signi�cantlycompared with those in the Control group, and LDL in the HF+H2 group decreased considerably comparedwith the HF group (Figure 1 C, E). On day 42, TG, TC, and LDL in the HF group increased markedlycompared with those in the Control group, which decreased substantially after saturated hydrogentreatment (Figure 1C, D, and E). However, high-density lipoprotein (HDL) in the HF group decreasedremarkably compared with the Control group, and it increased dramatically in the HF+H2 group comparedwith the HF group (Figure 1F), suggesting that saturated hydrogen reduces TC, TG, and LDL levels andincreases the content of HDL in the peripheral blood of obese mice.
In the high-fat diet group, the in�ltration of in�ammatory cells in the lung tissues increased and EMTincreased.
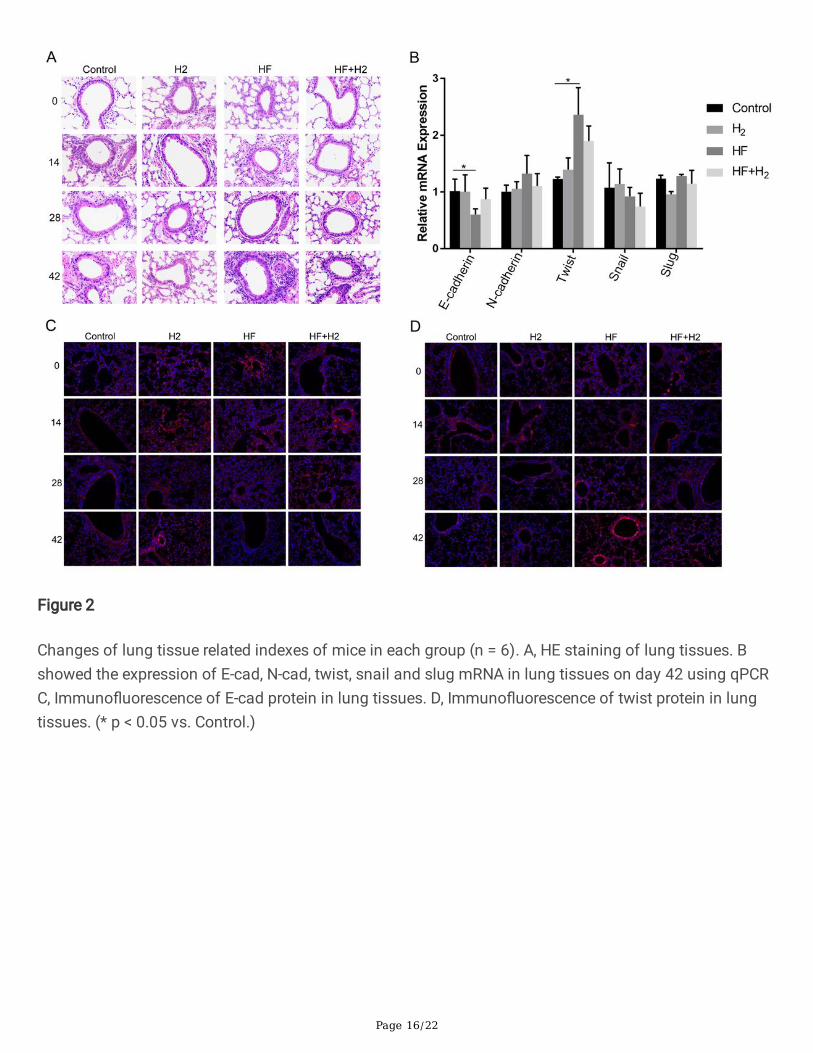
It can be seen from the HE staining results of the lung histopathological sections (Figure 2A) that afterday 42 on high-fat diet, the in�ltration degree of in�ammatory cells around the bronchus in HF groupincreased compared with that of the Control group, with a small amount of in�ammatory cells in�ltratingin the lumens and a little shedding of bronchial cilia. Compared with the HF group, the pathologicalchanges were decreased in the HF+H2 group. The results of qPCR showed that the expression of E-cadherin was signi�cantly decreased and twist was signi�cantly increased in the HF group comparedwith the Control group. Compared with the HF group, the expression of E-cadherin gene in the HF+H2
group increased, and twist decreased, but there was no signi�cant statistical difference (Figure 2B). Theresults of immuno�uorescence showed that the expression of E-cadherin protein decreased signi�cantlyat day 42, while the expression of twist protein increased signi�cantly in the HF group compared with theControl group, which was in consistent with the results of qPCR (Figure 2 C, D). These results have shownthat high-fat diet can lead to in�ammation of lung tissue and accelerate the process of EMT ofrespiratory tract.

Page 5/22
The normal diet group and the high-fat diet group show signi�cant differences in the number andcomposition of microbes in the lungs.
After the question sequence is eliminated, the total sequencing quantity is 559453. The lengthdistribution of the sequence contained in all samples was statistically analyzed in R software, and thesequence length was mainly distributed between 250-450bp (Supplementary �gure 1). Operationaltaxonomic unit (OTU) whose abundance value was less than 0.001% (1/100,000) of the total sequencingamount of all samples was removed, and the distribution of the remaining OTU in each group is shownas (Figure 3A, Supplementary �gure 2). The results showed that the number of OTU on the HF group wassigni�cantly higher than that of the Control group at the level of phylum, class, order, genus and species.The analysis of the same OTU between the groups showed that the number of unique OTU in the HFgroup increased signi�cantly compared with that of the Control group, and the number of unique OTU inthe Control and HF groups all decreased after hydrogen administration (Figure 3B). According to the OTUclassi�cation and classi�cation status, the speci�c composition of each sample at the level of phylum,class, order, family, genus and species classi�cation was obtained. The results showed that the numberof bacteria in the lung of mice in the HF group was signi�cantly higher than those in the Control group,and there was no signi�cant difference between the hydrogen group and the non-hydrogen group (Figure3C, D).
The diversity and difference of micro�ora in the lung of each group.
The rarefaction sparse curve (Chao1), speccaccum species accumulation curve and abundance levelcurve in alpha diversity analysis tend to be gentle, indicating that the sequencing depth is enough tore�ect the diversity and richness of the microbial community contained in the community sample, and thetotal number of OTUs in the community will no longer increase by signi�cant. With the addition of newsamples, and the abundance difference among OTUs in the community, the difference is small and thecommunity composition is high (Figure 4A). According to the alpha diversity index (Chao1, ACE, Shannon,Simpson) (Figure 4B), the diversity of bacteria in the lung of mice in the high fat diet group wassigni�cantly higher than that of the normal diet group, and the diversity of mice in the normal hydrogenfeeding group was lower than that of the normal control group.
Discriminant analysis by PLS-DA partial least squares and beta diversity based on weighted UniFracNMDS UPGMA cluster analysis chart of UniFrac distance matrix (Figure 4C) shows that there are obviousdifferences in the structure of microbial community in the lung of the HF group compared with theControl group, and also some differences in the hydrogen feeding group compared with the non-hydrogenfeeding group, and the difference of each mouse within the same group is small. The results show thatthe animal classi�cation model is effective.
Identi�cation of key microbes with signi�cant difference in pulmonary micro�ora of mice in each group.
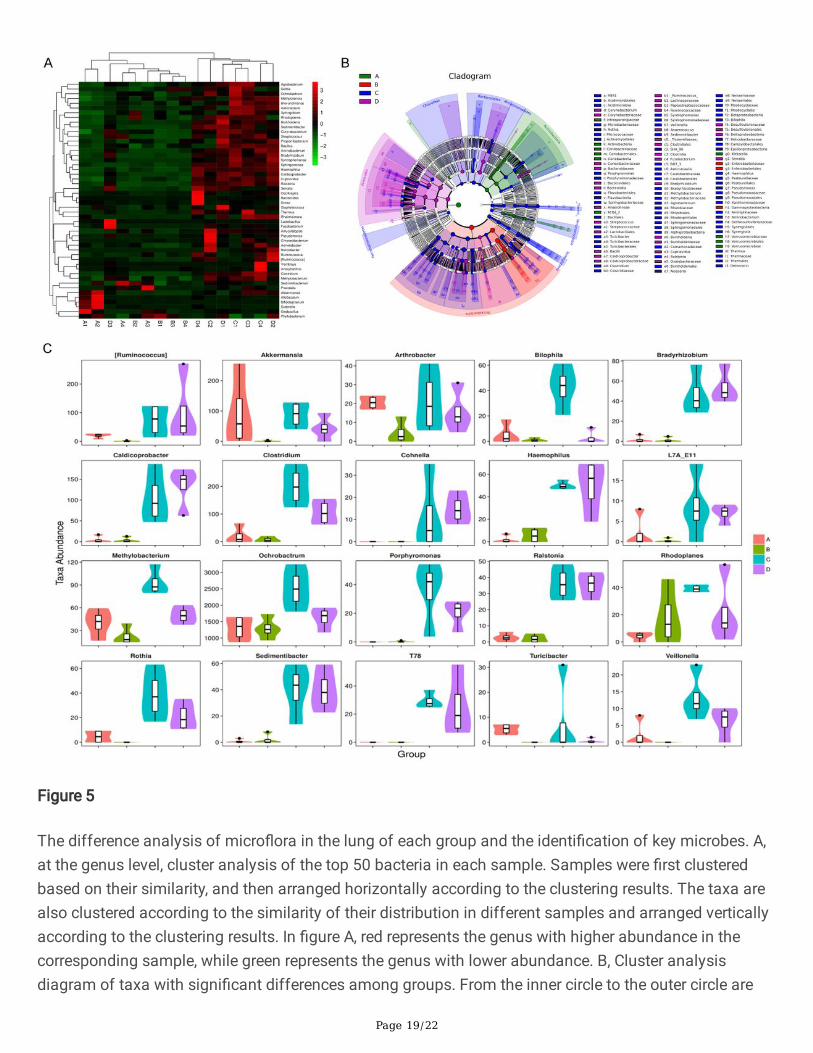
Using R software, cluster analysis and heat map (Figure 5A) were made for the �rst 50 genera ofabundance, which showed that there were signi�cant differences between the high-fat diet group and the

Page 6/22
normal diet group, and there were also some differences between the hydrogen group and the non-hydrogen group.
Compared with the Control group, the abundance of the common opportunistic pathogens Acinetobacter,Pseudomonas, Corynebacterium, Strepcoccus, Clostridium, Haemophilus and Porphyromonas increasedsigni�cantly in the HF group. After hydrogen administration, the abundance of Acinetobacter, Clostridiumand Porphyromonas decreased signi�cantly. There was a signi�cant decrease in Bi�dobacterium in theHF group compared with that of the Control group (Figure 5B, C). These results showed that high-fat dietsigni�cantly alters the diversity of microbes in the lung of mice, opportunistic pathogens increased whileprobiotic microbes decreased, thus increased susceptibility of respiratory in�ammation.
Functional prediction of bacterial metabolism
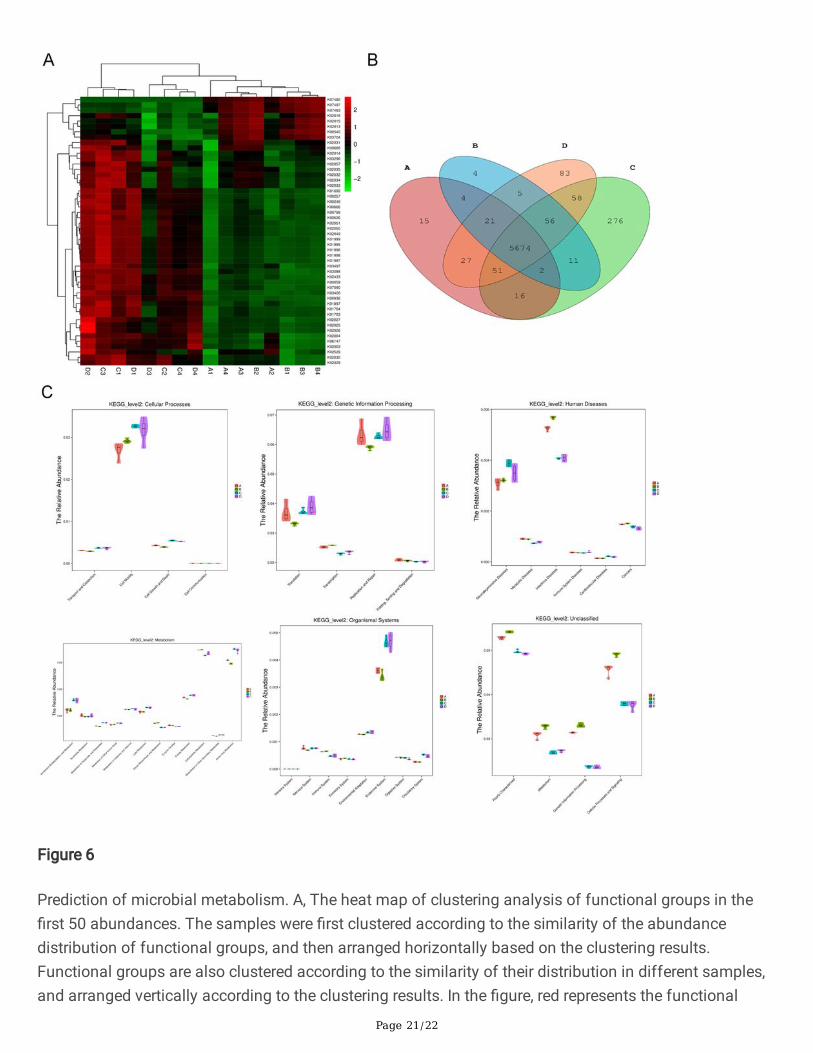
The 16S rRNA gene sequence was predicted in KEGG, COG and rfam3 functional spectrum databases byPICRUSt functional prediction analysis. The predicted functional spectrum data are clustered accordingto the abundance distribution of functional groups or the similarity between samples, and the functionalgroups and samples are sorted according to the clustering results. Using R software, the functionalgroups in the top 50 of the abundance were clustered and analyzed, and a heat map (Figure 6A) wasdrawn, showing that there were signi�cant differences between the high-fat diet group and the normaldiet group. R software was used to calculate the number of common functional groups of each sample,and the proportion of common and unique functional groups of each sample was visualized throughVenn diagram. The results showed that the number of functional groups in the HF group wassigni�cantly increased compared with the Control group, and that in the hydrogen group was decreasedcompared with the non-hydrogen group (Figure 6B).
Violin diagram was drawn to show the abundance distribution of the predicted functional groups in eachsample (Figure 6C). The results showed that the �ora abundance of the HF group involved in lipidmetabolism, energy metabolism and amino acid metabolism was signi�cantly increased compared withthe Control group, while the �ora abundance of the HF group involved in glycan biosynthesis, metabolismand glucose metabolism was decreased. The abundance of bacteria involved in cell communication, cellmigration, cell growth and death increased signi�cantly. The number of bacteria involved in thetranscription of genetic information increased and the abundance of bacteria involved in translationdecreased signi�cantly. The abundance of bacteria involved in neurodegenerative diseases andcardiovascular diseases increased signi�cantly. The abundance of bacteria involved in the body'simmune system decreased signi�cantly and the abundance of bacteria involved in the endocrine systemand circulatory system increased signi�cantly.
The expression of ICL gene in P. aeruginosa, S. aureus, A. baumannii, K.pneumoniae, C. albicans and X.maltophilia
To investigate whether changes in microbes in the lungs of mice on a high-fat diet were due to changes inglyoxylic acid circulation in bacteria caused by a high-fat environment. We designed primers using the

Page 7/22
ICL sequence, a key enzyme in the glyoxylic acid cycle, to detect the expression of ICL genes in severalclinical pathogens signi�cantly associated with the development of asthma. qPCR results (Figure 7)showed that the ICL gene expression in P. aeruginosa, S. aureus and A. baumandii in the HF group wassigni�cantly increased compared with that of the Control group, and P. aeruginosa was signi�cantlydecreased after hydrogen supplementation. However, K. pneumoniae, C. albicans and X. maltophiliashowed no signi�cant changes.
DiscussionThe diversity of microbes found in the lung is imperative to maintaining the normal airway function. Ourresults show that high-fat diet can change the number and microbial species in the lung, someopportunistic pathogens that are signi�cantly associated with the occurrence of respiratory diseases areincreasingly abundant, while the abundance of Bi�dobacterium is reduced. These increased opportunisticpathogens are believed to mediate the occurrence of chronic airway in�ammation, airwayhyperresponsiveness and other pathological changes. The results obtain from qPCR andimmuno�uorescence also showed a signi�cant reduction in the expression of E-cad, a gene related to theepithelial stromal transformation, while the expression of twist was signi�cantly increased in the HFgroup when compared with the Control group. This indicates that high-fat diet accelerated the process ofthe epithelial stromal transformation of the respiratory tract, which may affect the occurrence of airwayremodeling.
Although we could not establish a correlating result from a similar study, there are couple of studies onobesity related high-fat diet and one such concluded that TH2 immune response and immunopathologiccharacteristics in murine model of eosinophilic oesophagitis was worsen severely due to high-fat diet[21]. Furthermore, maternal diet enriched with high-fat is studied to be associated with impaired fetal lungdevelopment [22].
Both bacteria and fungi can use glyoxylic acid cycle to synthesize their own pathogenic substances,which can survive in macrophages for a long period of time and expand in the host. It has been shownthat many pathogenic and opportunistic microbes express isocitrate lyase and start glyoxylate cycle. Inthe process of infection, P. aeruginosa can activate glyoxylate cycle as an energy metabolism pathway,make it survive in macrophages and spread in large quantities [23]. Glyoxylate cycle is also the mainpathway of material and energy metabolism of A. baumannii in macrophages. A. baumannii enters thehost via respiratory tract, connects laminin and �bronectin via sialic acid, and enters macrophages viamultiple auxiliary receptors on the surface of the host cell [24, 25]. In macrophages, A. baumannii canstart the glyoxylate cycle as an energy metabolism pathway to synthesize its own pathogenic substances[26]. C. albicans, a human opportunistic pathogenic fungus, is engulfed by macrophages to formphagocytes at the early stage of infection. Through glyoxylic acid cycle, it uses fatty acids as energysource, and synthesizes its own virulent factor to split macrophages from the inside, and expand in thehost [27].

Page 8/22
Therefore, in order to investigate whether the changes of microbes in the lung during high-fat diet arerelated to glyoxylate cycle, we detected the expression of ICL gene of several conditional pathogensintensively related to respiratory diseases. The results showed that the ICL gene of P. aeruginosa, S.aureus and A. baumannii in the lungs of mice fed with high-fat diet had abnormal high expression. Thehigh-fat diet changed the glyoxylate cycle of these pathogenic bacteria in the lung, and the speed inutilizing fatty acids to synthesize the substances needed for self-metabolism and pathogenic substanceswas accelerated, resulting in the increase abundance of these opportunistic pathogens. However, we didnot �nd any signi�cant changes in ICL of fungi, and we speculated that this may be associated with theantagonistic effect of bacteria on fungi.
Our results also showed that saturated hydrogen treatment could inhibit the growth and expansion ofopportunistic pathogens in the lung and the increase ICL gene expression in S. aureus. Therefore, wespeculate that saturated hydrogen can regulate the bacterial �ora in the lung by acting on the glyoxylatecycle of the microbes and improve the epithelial stromal transformation caused by high-fat diet. However,we recommend further in vitro and in vivo studies to validate our �ndings.
ConclusionThis study found that the high-fat airway microenvironment caused by high-fat diet can change theabundance of respiratory tract microbes via glyoxylic acid cycle, thus affecting the process of epithelialstromal transformation and the occurrence of respiratory diseases. Saturated hydrogen is highlyrecommended based on our study as a new substance for improving respiratory diseases. In the annalsof prevention and treatment of respiratory infections and diseases, this study provides new ideas andresearch basis as a new therapeutic approach.
MethodsAnimal grouping
A litter of �ve-week-old C57BL6/J male mice weighing 16-20 g (purchased from Hunan Tianqin BiologicalTechnology Co., Ltd.) were acclimatized for a week during 12hrs of a light/dark cycle at a constanttemperature of 25°C and supplied with sterile water (once a day). The mice were randomized into normalcontrol (Control or A), saturated hydrogen (H2 or B), high-fat (HF or C), and saturated hydrogen + high-fat(HF+H2 or D) groups (n = 20 each). Control and H2 group mice were fed with sterile water and low-fatcontrol feed, while HF and H2+HF group animals were given sterile water and 60% high-fat model feed(purchased from Nantong Trophy Feed Technology Co., Ltd.). Additionally, mice in the Control and HFgroups were given 0.5 ml of saline intragastrically once a day, and those in the H2 and HF+H2 groupswere given 0.5 ml of saturated hydrogen saline once a day. Saturated hydrogen saline was prepared atthe Center of Modern Analysis and Detection of Central South University by dissolving molecularhydrogen into normal saline at high pressure (13.5 Mpa). The formulated saturated hydrogen solutionwas freshly prepared once every week and stored in aluminum packaging to ensure the hydrogen

Page 9/22
concentration remained > 0.6 mmol/L. The weights of the mice were taken once in a week. Six mice fromeach group were sacri�ced in the 2nd, 4th, and 6th weeks from the onset of the experiment. Blood, andlung tissues were collected for subsequent analyses. This study was conducted according to theDeclaration of Helsinki and approved by the Medical Ethical Committee of the Xiangya School ofMedicine. The same experiments were repeated 3 times.
Monitoring body weight and TC, TG, LDL, and HDL concentrations in peripheral blood
Mice were weighed on days 0, 7, 14, 21, 28, 35, and 42, and the �gures in kilogram were recordedappropriately. Blood samples were collected from veins using the eyeball extraction method; 35µl ofblood was collected from each mouse for blood lipid tests according to the speci�c operation steps ofblood lipid tester and blood lipid test card (Aikang Biotechnology Co., Ltd., Hangzhou, China).
Hematoxylin-eosin (HE) staining
After anesthetizing mice with ether, lung tissues were excised and rinsed with a 0.9% sodium chloridesolution. The resected lung tissues were �xed in a 10% formaldehyde solution for 48hrs, embedded inpara�n, and cut into 4µm-thick sections. The tissue sections were then heated to 60°C for 2hrs, dewaxedwith xylene (twice, 15 min each), and dehydrated using an increasing alcohol gradient (75%, 95%, and100%) for 5 min each. HE staining was performed, and the specimens were observed for pathologicalmorphology under an optical microscope.
Determining the expression of E-cad, N-cad, Slug, Snail, Twist and the ICL gene of S. aureus, P.aeruginosa, K. pneumoniae, A. baumannii, X. maltophilia, C. albicans in the lung tissues using real-timequantitative PCR (qPCR)
Primers were designed using the Primer Premier 5.0 program (Supplementary table 1) and synthesized byDingguochangsheng Biotechnology Co., Ltd., Beijing, China. Lung tissues were collected from each groupof mice, and total RNA was extracted with TRizol. RNA purity was analyzed using a nucleic acid analyzer.cDNA was synthesized by reverse transcription and ampli�ed using a qPCR kit (TansGen BiotechTechnology Co., Ltd., Beijing, China) according to the manufacturer’s instructions. The reaction mixtureconsist of 1.5µl cDNA, 12.5µl SYBR Green qPCR Master Mix, 1.5µl each of the forward and reverseprimers, and diethylpyrocarbonate (DEPC) water, making a total volume of 25µl. qPCR cycling conditionswere: 94°C for 3 min, and 35 cycles of [94°C for 45s, 51°C for 45s, and 72°C for 45s], and the relativemRNA expression was calculated using the 2 △△Ct method [20].
Immuno�uorescence
Excised lung tissue sections were processed as described above and boiled with 0.01M citrate buffer forantigen retrieval. The tissues were then washed twice with PBS (3 min each), �xed with 4%paraformaldehyde for 5 min, washed with phosphate buffered solution (PBS) again (same condition asthe �rst wash), blocked with normal goat serum for 20 min, and incubated overnight with 5 µl of E-cad

Page 10/22
(bs-10009R, BEIJING Bioss Biological Technology Co., Ltd.) or Twist (bs-2441R, BEIJING Bioss BiologicalTechnology Co., Ltd.) rabbit anti-mouse primary antibody in a wet box at 4°C. On the following day, thetissue sections were washed thrice with PBS, incubated with a CY3-conjugated goat anti-rabbit secondaryantibody (GB21303, Wuhan Seville Biotechnology Co., Ltd.) at room temperature for 1 h, washed threetimes with PBS, and counterstained with 4'6-diamidino-2-phenylindole (DAPI) (100 ng/ml) for 10 min.After removing moisture from the tissues, the slides were sealed with an anti-�uorescence quenchingagent.
Changes in lung microbiota were detected by 16SrRNA gene sequencing Technology
DNA was extracted from lung tissues of four groups of mice. The extraction quality of DNA was detectedby 0.8% agarose gel electrophoresis, and the DNA was quanti�ed by ultraviolet spectrophotometer.Primers were designed with microbial ribosomal RNA as the target and according to the conserved regionin the sequence. Sample speci�c Barcode sequences were added to further PCR ampli�cation of rRNAgene variable regions (single or consecutive multiple) or speci�c gene fragments. PCR ampli�cation wasperformed by NEB's Q5 high-�delity DNA polymerase, and the number of cycles was strictly controlled tokeep the number of cycles as low as possible while ensuring the same ampli�cation conditions for thesame batch of samples. PCR ampli�cation products were detected by 2% agarose gel electrophoresis,and the target fragments were gelled and recovered using AXYGEN gel recovery kit. Based on thepreliminary quantitative results of electrophoresis, �uorescence quanti�cation was performed for the PCRampli�cation of the recovered products. The �uorescent reagent was the quantit PicoGreen dsDNA AssayKit and the quantitative instrument was the Microplate reader (BioTek, FLx800). According to the�uorescence quantitative results and the sequencing quantity demand of each sample, the samples weremixed according to the corresponding proportion. Illumina MiSeq sequencing was used as an example toprepare a sequencing Library using Illumina's TruSeq Nano DNA LT Library Prep Kit, and then high-throughput sequencing was performed on the machine. (Detected in Shanghai paisenno BiotechnologyCo., Ltd)
Statistical analysis
The SPSS21.0 software was used for statistical analysis, and the data were expressed as mean ±standard deviation. The t-test was used for comparisons between two groups, variance analysis wasused for comparisons among multiple groups, and the least signi�cant difference (LSD) was used forcomparisons between intra-group differences. P-value < 0.05 was considered statistically signi�cant.
AbbreviationsE-cadE-cadherinN-cadN-cadherinICL

Page 11/22
Isocitrate lyaseT2DMType 2 diabetesEMTEpithelial mesenchymal transitionCOPDChronic obstructive pulmonary diseasesOHHydroxyl radicalsONOO−
Peroxynitrite anionsTGTotal glycerideTCTotal cholesterolLDLLow-density lipoproteinHDLHigh-density lipoproteinOUTOperational taxonomic unitDEPCDiethylpyrocarbonatePBSPhosphate buffered solutionDAPI4'6-diamidino-2-phenylindoleLSDLeast signi�cant difference
DeclarationsEthics approval and consent to participate
The study was approved by the Institutional Ethic Committee of Xiangya School of Medicine, CentralSouth University.
Consent for publication
Not applicable

Page 12/22
Availability of data and materials
The datasets generated during and/or analysed during the current study are available from thecorresponding author on reasonable request.
Competing interests
The authors declare that they have no competing interests.
Funding
This work was supported by Grant 31670121 and 31771277 from National Natural Science Foundationof China.
Authors' contributions
QX carried out the study. QX and OB performed the statistical analysis. TY, WG and WL participated in thedesign of the study. All authors read and approved the submission.
Acknowledgements
Not applicable
References1. Lin YP, Kao YC, Pan WH, Yang YH, Chen YC, Lee YL. Associations between Respiratory Diseases and
Dietary Patterns Derived by Factor Analysis and Reduced Rank Regression. Ann Nutr Metab.2016;68(4):306-14
2. Patel S, Custovic A, Smith JA, Simpson A, Kerry G, Murray CS. Cross-sectional association of dietarypatterns with asthma and atopic sensitization in childhood in a cohort study. Pediatr AllergyImmunol. 2014 Oct;25(6):565-71
3. Silva RA, Almeida FM, Olivo CR, Saraiva-Romanholo BM, Martins MA, Carvalho CR. Airwayremodeling is reversed by aerobic training in a murine model of chronic asthma. Scand J Med SciSports. 2015 Jun;25(3):e258-66
4. Han L, Wang L, Tang S, Yuan L, Wu S, Du X, Xiang Y, Qu X, Liu H, Luo H, Qin X, Liu C. ITGB4de�ciency in bronchial epithelial cells directs airway in�ammation and bipolar disorder-relatedbehavior. J Neuroin�ammation. 2018 Aug 31;15(1):246
5. Sachdeva K, Do DC, Zhang Y, Hu X, Chen J, Gao P. Environmental Exposures and AsthmaDevelopment: Autophagy, Mitophagy, and Cellular Senescence. Front Immunol. 2019 Nov 29;10:2787
�. Qin Q, Chen X, Feng J, Qin L, Hu C. Low-intensity aerobic exercise training attenuates airwayin�ammation and remodeling in a rat model of steroid-resistant asthma. Chin Med J (Engl).2014;127(17):3058-64

Page 13/22
7. Tan M, Liu C, Huang W, Deng L, Qin X, Xiang Y. CTNNAL1 inhibits ozone-induced epithelial-mesenchymal transition in human bronchial epithelial cells. Exp Physiol. 2018 Aug;103(8):1157-1169
�. Giannella M, Valerio M, Franco JA, Marin M, Bouza E, Muñoz P. Pacemaker infection due toMycobacterium fortuitum: the role of universal 16S rRNA gene PCR and sequencing. Diagn MicrobiolInfect Dis. 2007 Mar;57(3):337-9
9. Erb-Downward JR, Thompson DL, Han MK, Freeman CM, McCloskey L, Schmidt LA, Young VB, ToewsGB, Curtis JL, Sundaram B, Martinez FJ, Huffnagle GB. Analysis of the lung microbiome in the"healthy" smoker and in COPD. PLoS One. 2011 Feb 22;6(2):e16384
10. O'Dwyer DN, Ashley SL, Gurczynski SJ, Xia M, Wilke C, Falkowski NR, Norman KC, Arnold KB,Huffnagle GB, Salisbury ML, Han MK, Flaherty KR, White ES, Martinez FJ, Erb-Downward JR, MurrayS, Moore BB, Dickson RP. Lung Microbiota Contribute to Pulmonary In�ammation and DiseaseProgression in Pulmonary Fibrosis. Am J Respir Crit Care Med. 2019 May 1;199(9):1127-1138
11. Huang YJ, Erb-Downward JR, Dickson RP, Curtis JL, Huffnagle GB, Han MK. Understanding the role ofthe microbiome in chronic obstructive pulmonary disease: principles, challenges, and futuredirections. Transl Res. 2017 Jan;179:71-83
12. Garcia-Nuñez M, Millares L, Pomares X, Ferrari R, Pérez-Brocal V, Gallego M, Espasa M, Moya A,Monsó E. Severity-related changes of bronchial microbiome in chronic obstructive pulmonarydisease. J Clin Microbiol. 2014;52(12):4217-23.
13. Huang YJ, Sethi S, Murphy T, Nariya S, Boushey HA, Lynch SV. Airway microbiome dynamics inexacerbations of chronic obstructive pulmonary disease. J Clin Microbiol. 2014;52(8):2813-23.
14. Timm J, Post FA, Bekker LG, Walther GB, Wainwright HC, Manganelli R, Chan WT, Tsenova L, Gold B,Smith I, Kaplan G, McKinney JD. Differential expression of iron-, carbon-, and oxygen-responsivemycobacterial genes in the lungs of chronically infected mice and tuberculosis patients. Proc NatlAcad Sci USA. 2003;100:14321-6
15. Qiu X, Ye Q, Sun M, Wang L, Tan Y, Wu G. Saturated hydrogen improves lipid metabolism disordersand dysbacteriosis induced by a high-fat diet. Exp Biol Med (Maywood). 2020 Jan7:1535370219898407
1�. Ohno K, Ito M, Ichihara M. Molecular hydrogen as an emerging therapeutic medical gas forneurodegenerative and other diseases. Oxid Med Cell Longev. 2012;2012:3531-52
17. Ohsawa I, Ishikawa M, Takahashi K, Watanabe M, Nishimaki K, Yamagata K, Katsura K, Katayama Y,Asoh S, Ohta S. Hydrogen acts as a therapeutic antioxidant by selectively reducing cytotoxic oxygenradicals. Nat Med. 2007;13:688-94
1�. Kamimura N, Nishimaki K, Ohsawa I, Ohta S. Molecular hydrogen improves obesity and diabetes byinducing hepatic FGF21 and stimulating energy metabolism in db/db mice. Obesity (Silver Spring).2011;19:1396-403
19. Song G, Lin Q, Zhao H, Liu M, Ye F, Sun Y, Yu Y, Guo S, Jiao P, Wu Y, Ding G, Xiao Q, Qin S. Hydrogenactivates ATP-binding cassette transporter A1-dependent e�ux ex vivo and improves high-density

Page 14/22
lipoprotein function in patients with hypercholesterolemia: a double-blinded, randomized, andplacebo-controlled ttrial. J Clin Endocrinol Metab. 2015;100:2724-33
20. Li L, Liu M, Kang L, Li Y, Dai Z, Wang B, Liu S, Chen L, Tan Y, Wu G. HHEX: A crosstalker betweenHCMV infection and proliferation of VSMCs. Front Cell Infect Microbiol. 2016;6:169
21. Silva FMCE et al. High-fat diet-induced obesity worsens TH2 immune response andimmunopathologic charactersitics in murine model of eosinophilic oesophagitis. Clin Exp Allergy.2020
22. Mayor RS, et al. Maternal high-fat-diet is associated with impaired fetal lung development. Am JPhysiol Lung Cell Mol Physiol. 2015
23. Ha S1, Shin B1, Park W. Lack of glyoxylate shunt dysregulates iron homeostasis in Pseudomonasaeruginosa. Microbiology. 2018 Apr;164(4):587-599
24. Lorenz MC, Bender JA, Fink GR. Transcriptional response of Candida albicans upon internalizationby macrophages. Eukaryot Cell. 2004; 3: 1076-1087
25. McKinney JD, Honer zu Bentrup K, Munoz-Elias EJ, et al. Persistence of Mycobacterium tuberculosisin macrophages and mice requires the glyxylate shunt enzyme isocitrate lyase. Nature. 2000; 406:735-738
2�. Honer Zu Bentrup K, Miczak A, Swenson DL, et al. Characterization of activity and expression ofisocitrate lyase in Mycobacterium avium and Mycobacterium tuberculosis. J Bacteriol. 1999; 18:7161-7167
27. Hamilton AJ, Jeavons L, Youngchim S, et al. Sialic acid-dependent recognition of laminin byPenicillium marneffei codidia. Infect Immun. 1998; 66: 6024-6026
Figures
Page 15/22
Figure 1
Saturated hydrogen inhibits the increase in body weights and improves dyslipidemia induced by a high-fat diet (n = 6). A, Changes of weight with time. B, Weight of mice on day 42. C- F represented the changesof TC, TG, LDL and HDL in peripheral blood of mice with time. (* p < 0.05, ** p < 0.01 and *** p < 0.001 vs.Control; + p < 0.05, ++ p < 0.01 and +++ p < 0.001 vs. Control; # p < 0.05 and ## p < 0.01 vs. HF.)
Page 16/22
Figure 2
Changes of lung tissue related indexes of mice in each group (n = 6). A, HE staining of lung tissues. Bshowed the expression of E-cad, N-cad, twist, snail and slug mRNA in lung tissues on day 42 using qPCRC, Immuno�uorescence of E-cad protein in lung tissues. D, Immuno�uorescence of twist protein in lungtissues. (* p < 0.05 vs. Control.)

Page 17/22
Figure 3
OTU partition and distribution in each group. A: Statistical chart of OTU classi�cation and classi�cationstatus identi�cation results. The abscissa is arranged according to the sample name, and the ordinate isthe number of OTU in each sample that can be classi�ed to each classi�cation level of phylum, class,order, family, genus and species. B: Venn diagram. Each ellipse represents a group of samples. Theoverlapping area between ellipses indicates the shared OTUs between groups. The number of each blockindicates the number of shared or unique OTUs contained in the block. C: Statistical chart of microbialgroups at each classi�cation level. The abscissa is arranged according to the sample name, and theordinate is the number of microbial groups of each sample at the classi�cation level of phylum, class,order, family, genus and species. D: The statistical chart of the microbial groups in each group at theclassi�cation level of phylum, class, order, family, genus and species. (** p < 0.01 and *** p < 0.001 vs.Control.)

Page 18/22
Figure 4
Sequencing quality and microecological diversity analysis of lung in each group. A Rarefaction sparsecurve, Specaccum species accumulation curve and abundance rank curve for Alpha diversity analysis arepresented. B, There are Alpha diversity index (microbial diversity index) Chao1, ACE, Shannon andSimpson statistical charts in order. C, It is the principal component analysis graph (PCA),multidimensional scale analysis graph (MDS) and sample clustering analysis graph (UPGMA) of Betadiversity analysis. (** p < 0.01 and **** p < 0.0001 vs. Control; ++ p < 0.01 and ++++ p < 0.0001 vs.Control.)
Page 19/22
Figure 5
The difference analysis of micro�ora in the lung of each group and the identi�cation of key microbes. A,at the genus level, cluster analysis of the top 50 bacteria in each sample. Samples were �rst clusteredbased on their similarity, and then arranged horizontally according to the clustering results. The taxa arealso clustered according to the similarity of their distribution in different samples and arranged verticallyaccording to the clustering results. In �gure A, red represents the genus with higher abundance in thecorresponding sample, while green represents the genus with lower abundance. B, Cluster analysisdiagram of taxa with signi�cant differences among groups. From the inner circle to the outer circle are

Page 20/22
phylum, class, order, family, and genus. The fan area represents the abundance of bacteria. C, Theabundance of the �rst 20 taxa with the most signi�cant differences in each group. In the �gure, theabscissa is the �rst 20 taxon with the most signi�cant difference, and the ordinate is the sequencequantity of each taxon in various groups. The "fat and thin" of "violin" re�ects the density of sample datadistribution, and the wider the width, the more samples corresponding to this sequence quantity. Theborder of the boxplot represents the Interquartile range (IQR), the horizontal line represents the medianvalue, the upper and lower tentacles represent the IQR range of 1.5 times beyond the upper and lowerquartile, and the symbol "•" represents the extreme value beyond the range.
Page 21/22
Figure 6
Prediction of microbial metabolism. A, The heat map of clustering analysis of functional groups in the�rst 50 abundances. The samples were �rst clustered according to the similarity of the abundancedistribution of functional groups, and then arranged horizontally based on the clustering results.Functional groups are also clustered according to the similarity of their distribution in different samples,and arranged vertically according to the clustering results. In the �gure, red represents the functional

Page 22/22
group with higher abundance in the corresponding sample, while green represents the functional groupwith lower abundance. B, Venn diagram. Each ellipse represents a set of samples. The overlappingregions between the ellipses indicate the common functional groups among each group, and the numberof each block indicates the number of common or unique functional groups contained in the block. C,Analysis diagram of KEGG database for prediction of microbial metabolism function. In the �gure, theabscissa is the second functional group of KEGG, and the ordinate is the relative abundance of eachfunctional group in each group. The "fat and thin" of the "violin" re�ects the density of the distribution ofsample data. The wider the width, the more samples there are under this abundance. The border of theboxplot represents the Interquartile range (IQR), the horizontal line represents the median value, the upperand lower tentacles represent the IQR range of 1.5 times beyond the upper and lower quartile, and thesymbol "•" represents the extreme value beyond the range.
Figure 7
Changes in the expression of ICL genes in several bacteria or fungi signi�cantly associated withrespiratory disease (n = 6). A-F was the ICL expression level of P. aeruginosa, S. aureus, A. baumannii, K.pneumoniae, C. albicans and X. maltophilia in the lung tissues of each group detected by qPCR. (* p <0.05 and ** p < 0.01 vs. Control; # p < 0.05 vs. HF.)
Supplementary Files
This is a list of supplementary �les associated with this preprint. Click to download.
Supplementarymaterials.docx